Fijian vs Menominee No Schooling Completed
COMPARE
Fijian
Menominee
No Schooling Completed
No Schooling Completed Comparison
Fijians
Menominee
2.5%
NO SCHOOLING COMPLETED
0.4/ 100
METRIC RATING
266th/ 347
METRIC RANK
1.9%
NO SCHOOLING COMPLETED
89.6/ 100
METRIC RATING
134th/ 347
METRIC RANK
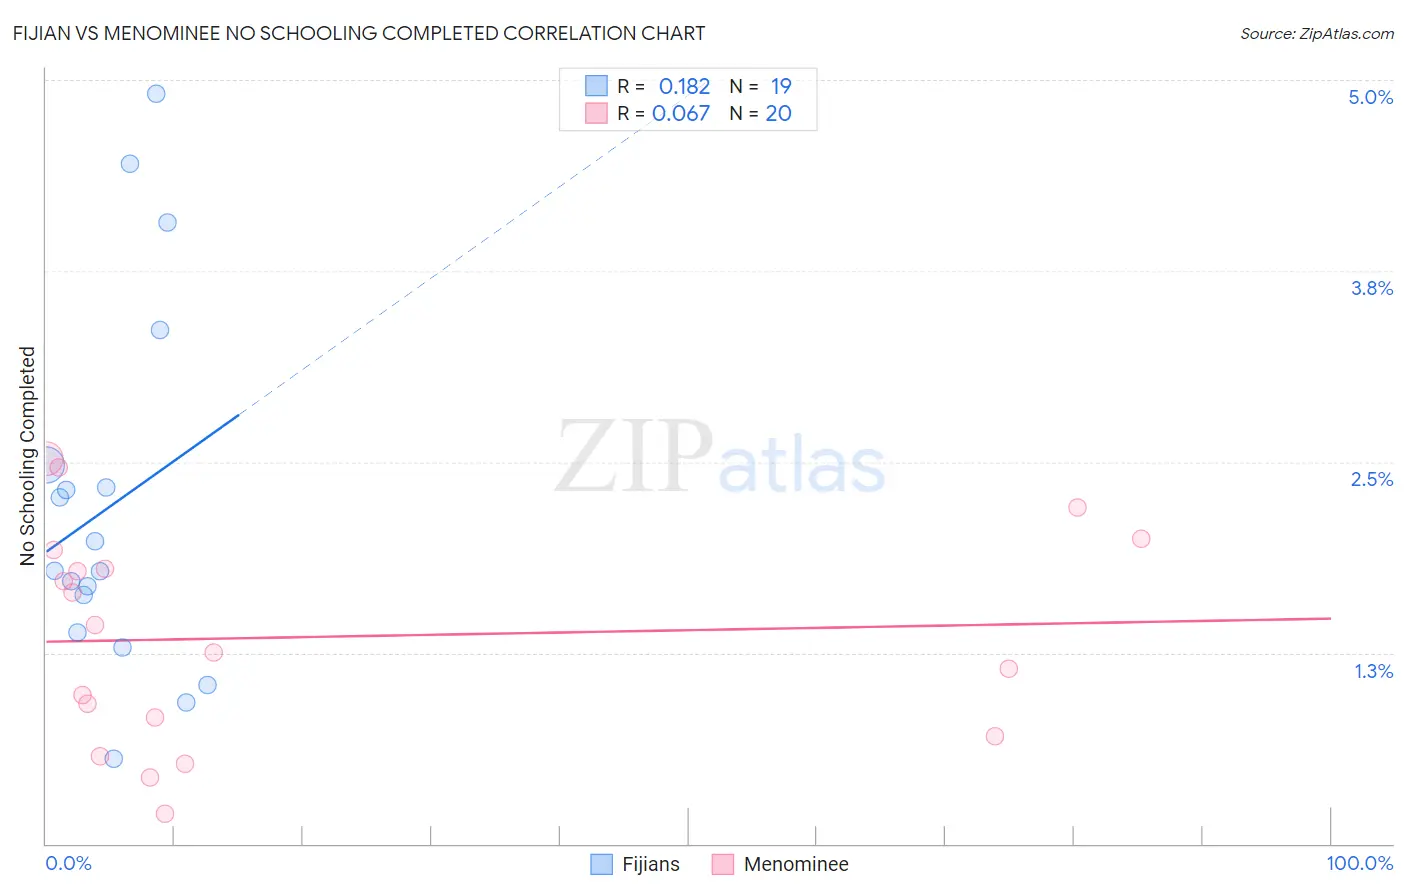
Fijian vs Menominee No Schooling Completed Correlation Chart
The statistical analysis conducted on geographies consisting of 55,808,441 people shows a poor positive correlation between the proportion of Fijians and percentage of population with no schooling in the United States with a correlation coefficient (R) of 0.182 and weighted average of 2.5%. Similarly, the statistical analysis conducted on geographies consisting of 45,688,108 people shows a slight positive correlation between the proportion of Menominee and percentage of population with no schooling in the United States with a correlation coefficient (R) of 0.067 and weighted average of 1.9%, a difference of 27.9%.
No Schooling Completed Correlation Summary
| Measurement | Fijian | Menominee |
| Minimum | 0.56% | 0.20% |
| Maximum | 4.9% | 2.5% |
| Range | 4.4% | 2.3% |
| Mean | 2.2% | 1.4% |
| Median | 1.8% | 1.3% |
| Interquartile 25% (IQ1) | 1.4% | 0.77% |
| Interquartile 75% (IQ3) | 2.5% | 1.9% |
| Interquartile Range (IQR) | 1.1% | 1.1% |
| Standard Deviation (Sample) | 1.2% | 0.70% |
| Standard Deviation (Population) | 1.2% | 0.68% |
Similar Demographics by No Schooling Completed
Demographics Similar to Fijians by No Schooling Completed
In terms of no schooling completed, the demographic groups most similar to Fijians are West Indian (2.5%, a difference of 0.080%), Yuman (2.5%, a difference of 0.17%), Indian (Asian) (2.5%, a difference of 0.26%), Immigrants from Liberia (2.5%, a difference of 0.39%), and Taiwanese (2.5%, a difference of 0.44%).
| Demographics | Rating | Rank | No Schooling Completed |
| Immigrants | Jamaica | 0.6 /100 | #259 | Tragic 2.5% |
| Immigrants | Ethiopia | 0.6 /100 | #260 | Tragic 2.5% |
| Armenians | 0.5 /100 | #261 | Tragic 2.5% |
| Immigrants | Sierra Leone | 0.5 /100 | #262 | Tragic 2.5% |
| Immigrants | Liberia | 0.4 /100 | #263 | Tragic 2.5% |
| Indians (Asian) | 0.4 /100 | #264 | Tragic 2.5% |
| West Indians | 0.4 /100 | #265 | Tragic 2.5% |
| Fijians | 0.4 /100 | #266 | Tragic 2.5% |
| Yuman | 0.4 /100 | #267 | Tragic 2.5% |
| Taiwanese | 0.3 /100 | #268 | Tragic 2.5% |
| Immigrants | Nigeria | 0.2 /100 | #269 | Tragic 2.5% |
| Immigrants | Peru | 0.2 /100 | #270 | Tragic 2.5% |
| Cubans | 0.2 /100 | #271 | Tragic 2.5% |
| Immigrants | Bolivia | 0.2 /100 | #272 | Tragic 2.5% |
| Immigrants | Cameroon | 0.1 /100 | #273 | Tragic 2.5% |
Demographics Similar to Menominee by No Schooling Completed
In terms of no schooling completed, the demographic groups most similar to Menominee are Immigrants from Turkey (1.9%, a difference of 0.25%), Colville (1.9%, a difference of 0.35%), Hmong (1.9%, a difference of 0.40%), Burmese (1.9%, a difference of 0.49%), and Immigrants from Hungary (1.9%, a difference of 0.85%).
| Demographics | Rating | Rank | No Schooling Completed |
| Israelis | 92.4 /100 | #127 | Exceptional 1.9% |
| Spaniards | 92.3 /100 | #128 | Exceptional 1.9% |
| Seminole | 92.0 /100 | #129 | Exceptional 1.9% |
| Palestinians | 91.8 /100 | #130 | Exceptional 1.9% |
| Immigrants | Hungary | 91.6 /100 | #131 | Exceptional 1.9% |
| Colville | 90.4 /100 | #132 | Exceptional 1.9% |
| Immigrants | Turkey | 90.2 /100 | #133 | Exceptional 1.9% |
| Menominee | 89.6 /100 | #134 | Excellent 1.9% |
| Hmong | 88.5 /100 | #135 | Excellent 1.9% |
| Burmese | 88.2 /100 | #136 | Excellent 1.9% |
| Filipinos | 85.5 /100 | #137 | Excellent 2.0% |
| Immigrants | Israel | 85.4 /100 | #138 | Excellent 2.0% |
| Jordanians | 84.5 /100 | #139 | Excellent 2.0% |
| Marshallese | 83.5 /100 | #140 | Excellent 2.0% |
| Immigrants | Greece | 83.5 /100 | #141 | Excellent 2.0% |