Ecuadorian vs Immigrants from Ghana Male Unemployment
COMPARE
Ecuadorian
Immigrants from Ghana
Male Unemployment
Male Unemployment Comparison
Ecuadorians
Immigrants from Ghana
6.2%
MALE UNEMPLOYMENT
0.0/ 100
METRIC RATING
282nd/ 347
METRIC RANK
6.2%
MALE UNEMPLOYMENT
0.0/ 100
METRIC RATING
280th/ 347
METRIC RANK
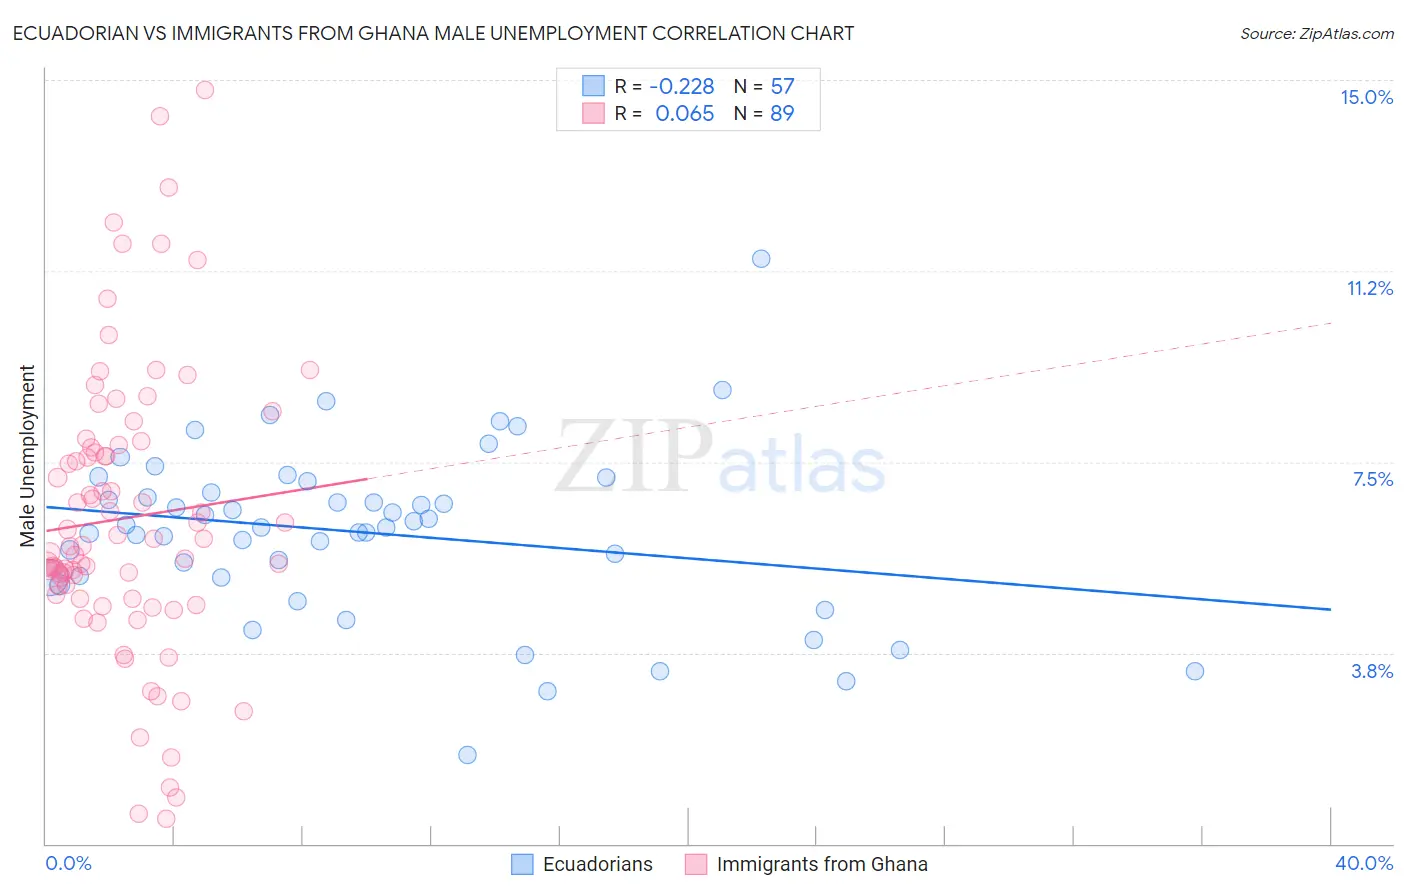
Ecuadorian vs Immigrants from Ghana Male Unemployment Correlation Chart
The statistical analysis conducted on geographies consisting of 317,005,514 people shows a weak negative correlation between the proportion of Ecuadorians and unemployment rate among males in the United States with a correlation coefficient (R) of -0.228 and weighted average of 6.2%. Similarly, the statistical analysis conducted on geographies consisting of 199,472,146 people shows a slight positive correlation between the proportion of Immigrants from Ghana and unemployment rate among males in the United States with a correlation coefficient (R) of 0.065 and weighted average of 6.2%, a difference of 0.50%.
Male Unemployment Correlation Summary
| Measurement | Ecuadorian | Immigrants from Ghana |
| Minimum | 1.7% | 0.50% |
| Maximum | 11.5% | 14.8% |
| Range | 9.8% | 14.3% |
| Mean | 6.1% | 6.4% |
| Median | 6.2% | 5.9% |
| Interquartile 25% (IQ1) | 5.2% | 4.9% |
| Interquartile 75% (IQ3) | 7.0% | 7.8% |
| Interquartile Range (IQR) | 1.8% | 3.0% |
| Standard Deviation (Sample) | 1.7% | 2.8% |
| Standard Deviation (Population) | 1.7% | 2.8% |
Demographics Similar to Ecuadorians and Immigrants from Ghana by Male Unemployment
In terms of male unemployment, the demographic groups most similar to Ecuadorians are Immigrants from Western Africa (6.2%, a difference of 0.030%), Sierra Leonean (6.2%, a difference of 0.43%), Spanish American Indian (6.2%, a difference of 0.68%), Immigrants from Ecuador (6.2%, a difference of 0.70%), and African (6.3%, a difference of 1.1%). Similarly, the demographic groups most similar to Immigrants from Ghana are Sierra Leonean (6.2%, a difference of 0.070%), Immigrants from Western Africa (6.2%, a difference of 0.53%), Ghanaian (6.1%, a difference of 0.99%), Spanish American Indian (6.2%, a difference of 1.2%), and Immigrants from Ecuador (6.2%, a difference of 1.2%).
| Demographics | Rating | Rank | Male Unemployment |
| Blackfeet | 0.0 /100 | #271 | Tragic 6.0% |
| Immigrants | Uzbekistan | 0.0 /100 | #272 | Tragic 6.0% |
| Armenians | 0.0 /100 | #273 | Tragic 6.0% |
| Immigrants | Sierra Leone | 0.0 /100 | #274 | Tragic 6.0% |
| Menominee | 0.0 /100 | #275 | Tragic 6.0% |
| Tlingit-Haida | 0.0 /100 | #276 | Tragic 6.0% |
| Immigrants | Liberia | 0.0 /100 | #277 | Tragic 6.1% |
| Immigrants | Fiji | 0.0 /100 | #278 | Tragic 6.1% |
| Ghanaians | 0.0 /100 | #279 | Tragic 6.1% |
| Immigrants | Ghana | 0.0 /100 | #280 | Tragic 6.2% |
| Sierra Leoneans | 0.0 /100 | #281 | Tragic 6.2% |
| Ecuadorians | 0.0 /100 | #282 | Tragic 6.2% |
| Immigrants | Western Africa | 0.0 /100 | #283 | Tragic 6.2% |
| Spanish American Indians | 0.0 /100 | #284 | Tragic 6.2% |
| Immigrants | Ecuador | 0.0 /100 | #285 | Tragic 6.2% |
| Africans | 0.0 /100 | #286 | Tragic 6.3% |
| Central American Indians | 0.0 /100 | #287 | Tragic 6.3% |
| Immigrants | Senegal | 0.0 /100 | #288 | Tragic 6.3% |
| Immigrants | Caribbean | 0.0 /100 | #289 | Tragic 6.3% |
| U.S. Virgin Islanders | 0.0 /100 | #290 | Tragic 6.4% |
| Immigrants | Azores | 0.0 /100 | #291 | Tragic 6.4% |