Ecuadorian vs Laotian Male Unemployment
COMPARE
Ecuadorian
Laotian
Male Unemployment
Male Unemployment Comparison
Ecuadorians
Laotians
6.2%
MALE UNEMPLOYMENT
0.0/ 100
METRIC RATING
282nd/ 347
METRIC RANK
5.2%
MALE UNEMPLOYMENT
73.8/ 100
METRIC RATING
154th/ 347
METRIC RANK
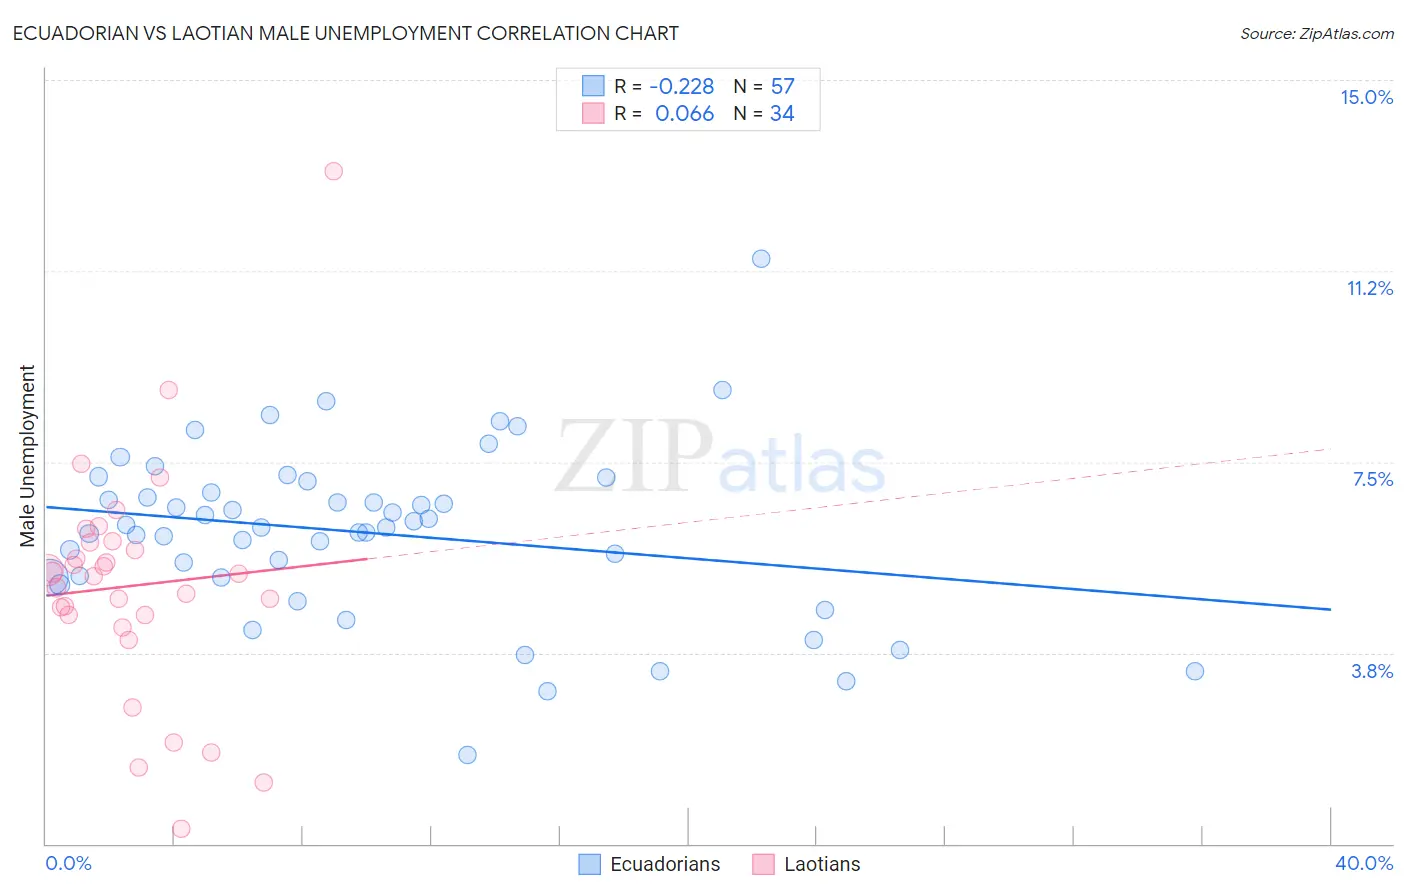
Ecuadorian vs Laotian Male Unemployment Correlation Chart
The statistical analysis conducted on geographies consisting of 317,005,514 people shows a weak negative correlation between the proportion of Ecuadorians and unemployment rate among males in the United States with a correlation coefficient (R) of -0.228 and weighted average of 6.2%. Similarly, the statistical analysis conducted on geographies consisting of 224,510,892 people shows a slight positive correlation between the proportion of Laotians and unemployment rate among males in the United States with a correlation coefficient (R) of 0.066 and weighted average of 5.2%, a difference of 18.6%.
Male Unemployment Correlation Summary
| Measurement | Ecuadorian | Laotian |
| Minimum | 1.7% | 0.30% |
| Maximum | 11.5% | 13.2% |
| Range | 9.8% | 12.9% |
| Mean | 6.1% | 5.1% |
| Median | 6.2% | 5.3% |
| Interquartile 25% (IQ1) | 5.2% | 4.5% |
| Interquartile 75% (IQ3) | 7.0% | 5.9% |
| Interquartile Range (IQR) | 1.8% | 1.4% |
| Standard Deviation (Sample) | 1.7% | 2.3% |
| Standard Deviation (Population) | 1.7% | 2.3% |
Similar Demographics by Male Unemployment
Demographics Similar to Ecuadorians by Male Unemployment
In terms of male unemployment, the demographic groups most similar to Ecuadorians are Immigrants from Western Africa (6.2%, a difference of 0.030%), Sierra Leonean (6.2%, a difference of 0.43%), Immigrants from Ghana (6.2%, a difference of 0.50%), Spanish American Indian (6.2%, a difference of 0.68%), and Immigrants from Ecuador (6.2%, a difference of 0.70%).
| Demographics | Rating | Rank | Male Unemployment |
| Menominee | 0.0 /100 | #275 | Tragic 6.0% |
| Tlingit-Haida | 0.0 /100 | #276 | Tragic 6.0% |
| Immigrants | Liberia | 0.0 /100 | #277 | Tragic 6.1% |
| Immigrants | Fiji | 0.0 /100 | #278 | Tragic 6.1% |
| Ghanaians | 0.0 /100 | #279 | Tragic 6.1% |
| Immigrants | Ghana | 0.0 /100 | #280 | Tragic 6.2% |
| Sierra Leoneans | 0.0 /100 | #281 | Tragic 6.2% |
| Ecuadorians | 0.0 /100 | #282 | Tragic 6.2% |
| Immigrants | Western Africa | 0.0 /100 | #283 | Tragic 6.2% |
| Spanish American Indians | 0.0 /100 | #284 | Tragic 6.2% |
| Immigrants | Ecuador | 0.0 /100 | #285 | Tragic 6.2% |
| Africans | 0.0 /100 | #286 | Tragic 6.3% |
| Central American Indians | 0.0 /100 | #287 | Tragic 6.3% |
| Immigrants | Senegal | 0.0 /100 | #288 | Tragic 6.3% |
| Immigrants | Caribbean | 0.0 /100 | #289 | Tragic 6.3% |
Demographics Similar to Laotians by Male Unemployment
In terms of male unemployment, the demographic groups most similar to Laotians are Immigrants from Uruguay (5.2%, a difference of 0.010%), Immigrants from Hungary (5.2%, a difference of 0.030%), Egyptian (5.2%, a difference of 0.080%), American (5.2%, a difference of 0.090%), and Immigrants from Northern Africa (5.2%, a difference of 0.12%).
| Demographics | Rating | Rank | Male Unemployment |
| Immigrants | Burma/Myanmar | 77.5 /100 | #147 | Good 5.2% |
| Immigrants | Italy | 76.3 /100 | #148 | Good 5.2% |
| Immigrants | Europe | 76.2 /100 | #149 | Good 5.2% |
| Indians (Asian) | 76.0 /100 | #150 | Good 5.2% |
| Slovaks | 75.5 /100 | #151 | Good 5.2% |
| Egyptians | 74.8 /100 | #152 | Good 5.2% |
| Immigrants | Uruguay | 73.9 /100 | #153 | Good 5.2% |
| Laotians | 73.8 /100 | #154 | Good 5.2% |
| Immigrants | Hungary | 73.4 /100 | #155 | Good 5.2% |
| Americans | 72.7 /100 | #156 | Good 5.2% |
| Immigrants | Northern Africa | 72.3 /100 | #157 | Good 5.2% |
| Immigrants | Indonesia | 71.5 /100 | #158 | Good 5.2% |
| Indonesians | 71.2 /100 | #159 | Good 5.2% |
| Immigrants | Norway | 71.0 /100 | #160 | Good 5.2% |
| Immigrants | China | 70.6 /100 | #161 | Good 5.2% |