Native/Alaskan vs Immigrants from Ghana Male Unemployment
COMPARE
Native/Alaskan
Immigrants from Ghana
Male Unemployment
Male Unemployment Comparison
Natives/Alaskans
Immigrants from Ghana
7.7%
MALE UNEMPLOYMENT
0.0/ 100
METRIC RATING
328th/ 347
METRIC RANK
6.2%
MALE UNEMPLOYMENT
0.0/ 100
METRIC RATING
280th/ 347
METRIC RANK
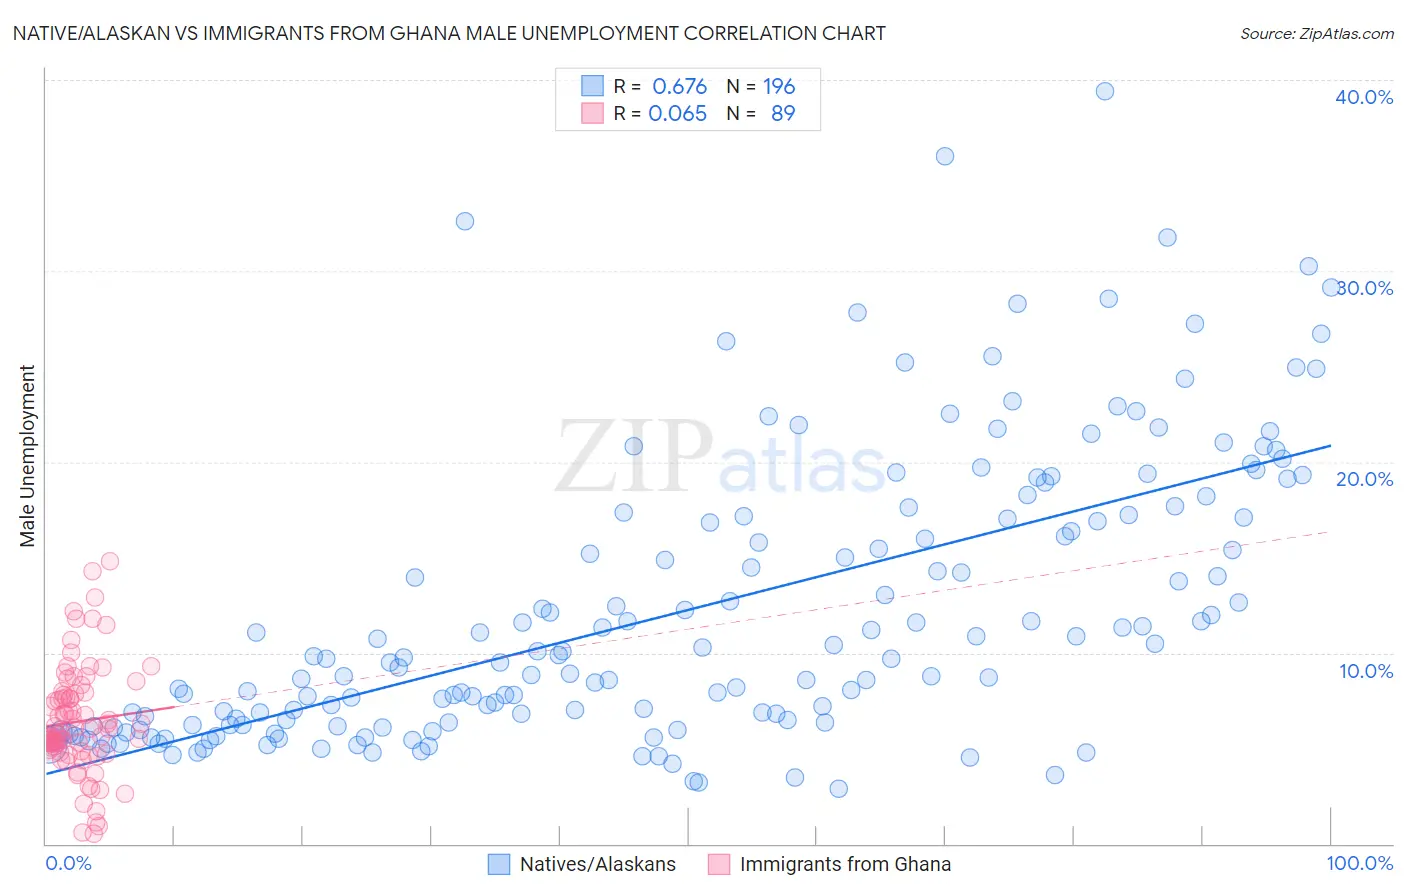
Native/Alaskan vs Immigrants from Ghana Male Unemployment Correlation Chart
The statistical analysis conducted on geographies consisting of 507,569,897 people shows a significant positive correlation between the proportion of Natives/Alaskans and unemployment rate among males in the United States with a correlation coefficient (R) of 0.676 and weighted average of 7.7%. Similarly, the statistical analysis conducted on geographies consisting of 199,472,146 people shows a slight positive correlation between the proportion of Immigrants from Ghana and unemployment rate among males in the United States with a correlation coefficient (R) of 0.065 and weighted average of 6.2%, a difference of 25.4%.
Male Unemployment Correlation Summary
| Measurement | Native/Alaskan | Immigrants from Ghana |
| Minimum | 2.9% | 0.50% |
| Maximum | 39.4% | 14.8% |
| Range | 36.5% | 14.3% |
| Mean | 12.2% | 6.4% |
| Median | 9.7% | 5.9% |
| Interquartile 25% (IQ1) | 6.2% | 4.9% |
| Interquartile 75% (IQ3) | 17.1% | 7.8% |
| Interquartile Range (IQR) | 10.9% | 3.0% |
| Standard Deviation (Sample) | 7.4% | 2.8% |
| Standard Deviation (Population) | 7.4% | 2.8% |
Similar Demographics by Male Unemployment
Demographics Similar to Natives/Alaskans by Male Unemployment
In terms of male unemployment, the demographic groups most similar to Natives/Alaskans are Paiute (7.7%, a difference of 0.38%), Immigrants from Yemen (7.8%, a difference of 0.90%), Immigrants from Dominican Republic (7.6%, a difference of 1.5%), Shoshone (7.6%, a difference of 1.6%), and Dominican (7.6%, a difference of 2.0%).
| Demographics | Rating | Rank | Male Unemployment |
| Immigrants | St. Vincent and the Grenadines | 0.0 /100 | #321 | Tragic 7.5% |
| Immigrants | Cabo Verde | 0.0 /100 | #322 | Tragic 7.5% |
| Immigrants | Grenada | 0.0 /100 | #323 | Tragic 7.6% |
| Dominicans | 0.0 /100 | #324 | Tragic 7.6% |
| Shoshone | 0.0 /100 | #325 | Tragic 7.6% |
| Immigrants | Dominican Republic | 0.0 /100 | #326 | Tragic 7.6% |
| Paiute | 0.0 /100 | #327 | Tragic 7.7% |
| Natives/Alaskans | 0.0 /100 | #328 | Tragic 7.7% |
| Immigrants | Yemen | 0.0 /100 | #329 | Tragic 7.8% |
| Yakama | 0.0 /100 | #330 | Tragic 7.9% |
| Alaska Natives | 0.0 /100 | #331 | Tragic 8.1% |
| Pima | 0.0 /100 | #332 | Tragic 8.3% |
| Sioux | 0.0 /100 | #333 | Tragic 8.4% |
| Tsimshian | 0.0 /100 | #334 | Tragic 8.5% |
| Pueblo | 0.0 /100 | #335 | Tragic 8.5% |
Demographics Similar to Immigrants from Ghana by Male Unemployment
In terms of male unemployment, the demographic groups most similar to Immigrants from Ghana are Sierra Leonean (6.2%, a difference of 0.070%), Ecuadorian (6.2%, a difference of 0.50%), Immigrants from Western Africa (6.2%, a difference of 0.53%), Ghanaian (6.1%, a difference of 0.99%), and Spanish American Indian (6.2%, a difference of 1.2%).
| Demographics | Rating | Rank | Male Unemployment |
| Armenians | 0.0 /100 | #273 | Tragic 6.0% |
| Immigrants | Sierra Leone | 0.0 /100 | #274 | Tragic 6.0% |
| Menominee | 0.0 /100 | #275 | Tragic 6.0% |
| Tlingit-Haida | 0.0 /100 | #276 | Tragic 6.0% |
| Immigrants | Liberia | 0.0 /100 | #277 | Tragic 6.1% |
| Immigrants | Fiji | 0.0 /100 | #278 | Tragic 6.1% |
| Ghanaians | 0.0 /100 | #279 | Tragic 6.1% |
| Immigrants | Ghana | 0.0 /100 | #280 | Tragic 6.2% |
| Sierra Leoneans | 0.0 /100 | #281 | Tragic 6.2% |
| Ecuadorians | 0.0 /100 | #282 | Tragic 6.2% |
| Immigrants | Western Africa | 0.0 /100 | #283 | Tragic 6.2% |
| Spanish American Indians | 0.0 /100 | #284 | Tragic 6.2% |
| Immigrants | Ecuador | 0.0 /100 | #285 | Tragic 6.2% |
| Africans | 0.0 /100 | #286 | Tragic 6.3% |
| Central American Indians | 0.0 /100 | #287 | Tragic 6.3% |