Czech vs Guamanian/Chamorro Single Mother Poverty
COMPARE
Czech
Guamanian/Chamorro
Single Mother Poverty
Single Mother Poverty Comparison
Czechs
Guamanians/Chamorros
28.9%
SINGLE MOTHER POVERTY
68.4/ 100
METRIC RATING
159th/ 347
METRIC RANK
29.4%
SINGLE MOTHER POVERTY
31.8/ 100
METRIC RATING
188th/ 347
METRIC RANK
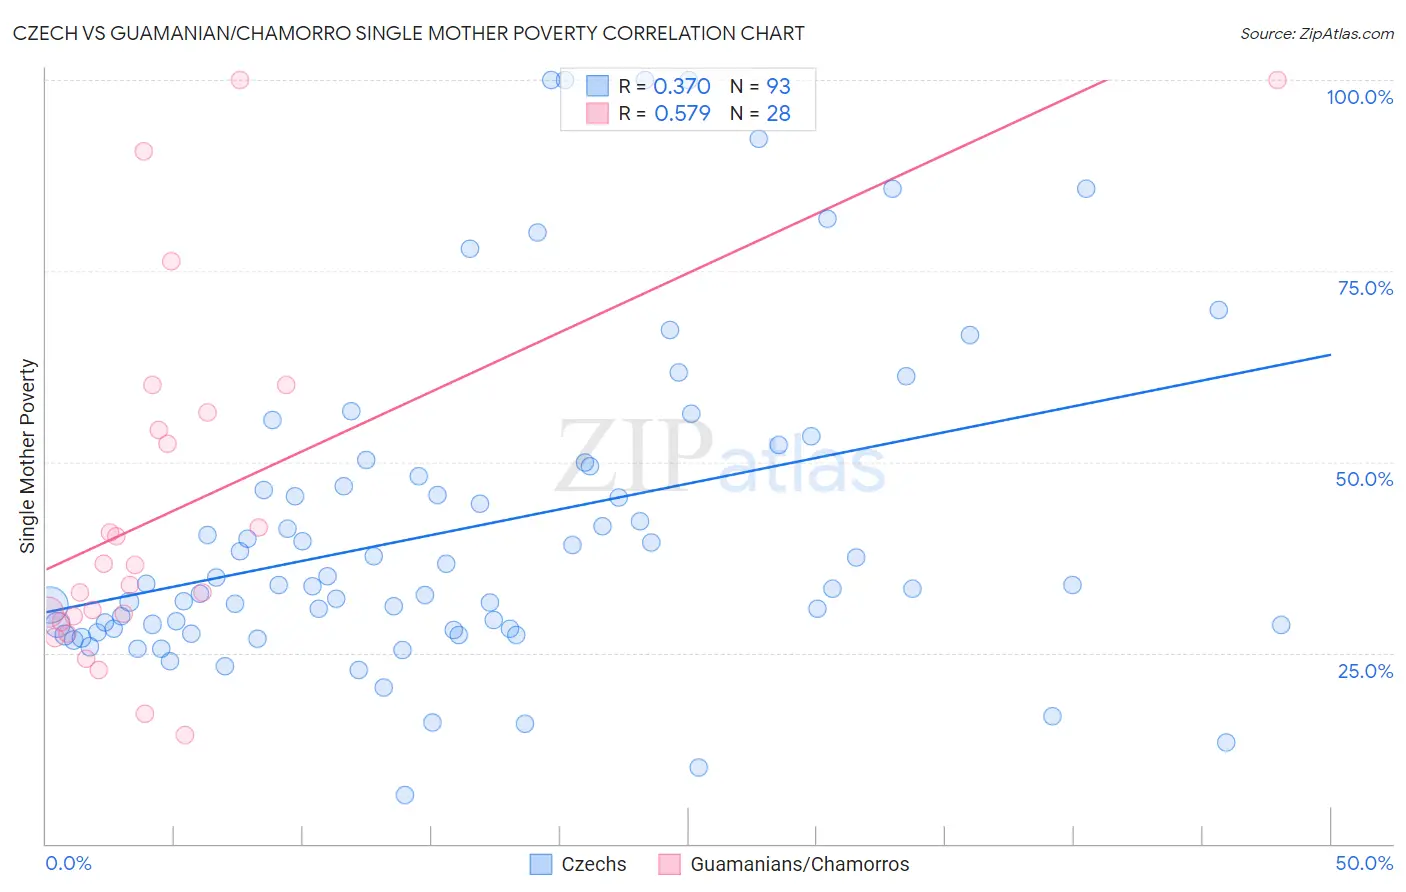
Czech vs Guamanian/Chamorro Single Mother Poverty Correlation Chart
The statistical analysis conducted on geographies consisting of 466,588,307 people shows a mild positive correlation between the proportion of Czechs and poverty level among single mothers in the United States with a correlation coefficient (R) of 0.370 and weighted average of 28.9%. Similarly, the statistical analysis conducted on geographies consisting of 219,675,506 people shows a substantial positive correlation between the proportion of Guamanians/Chamorros and poverty level among single mothers in the United States with a correlation coefficient (R) of 0.579 and weighted average of 29.4%, a difference of 1.9%.
Single Mother Poverty Correlation Summary
| Measurement | Czech | Guamanian/Chamorro |
| Minimum | 6.4% | 14.3% |
| Maximum | 100.0% | 100.0% |
| Range | 93.6% | 85.7% |
| Mean | 41.3% | 43.9% |
| Median | 33.8% | 35.2% |
| Interquartile 25% (IQ1) | 28.1% | 29.4% |
| Interquartile 75% (IQ3) | 48.7% | 55.3% |
| Interquartile Range (IQR) | 20.7% | 25.8% |
| Standard Deviation (Sample) | 21.1% | 23.4% |
| Standard Deviation (Population) | 21.0% | 23.0% |
Similar Demographics by Single Mother Poverty
Demographics Similar to Czechs by Single Mother Poverty
In terms of single mother poverty, the demographic groups most similar to Czechs are Japanese (28.9%, a difference of 0.020%), Immigrants from Cambodia (28.9%, a difference of 0.10%), Immigrants from Hungary (28.9%, a difference of 0.12%), Scandinavian (28.9%, a difference of 0.12%), and Immigrants from Nigeria (28.9%, a difference of 0.14%).
| Demographics | Rating | Rank | Single Mother Poverty |
| Austrians | 79.0 /100 | #152 | Good 28.7% |
| Slovenes | 76.4 /100 | #153 | Good 28.8% |
| Portuguese | 73.2 /100 | #154 | Good 28.8% |
| Ugandans | 71.7 /100 | #155 | Good 28.8% |
| Iraqis | 71.5 /100 | #156 | Good 28.8% |
| Immigrants | Western Europe | 71.1 /100 | #157 | Good 28.9% |
| Immigrants | Hungary | 70.6 /100 | #158 | Good 28.9% |
| Czechs | 68.4 /100 | #159 | Good 28.9% |
| Japanese | 68.0 /100 | #160 | Good 28.9% |
| Immigrants | Cambodia | 66.6 /100 | #161 | Good 28.9% |
| Scandinavians | 66.2 /100 | #162 | Good 28.9% |
| Immigrants | Nigeria | 65.9 /100 | #163 | Good 28.9% |
| Immigrants | Kenya | 65.9 /100 | #164 | Good 28.9% |
| Arabs | 60.7 /100 | #165 | Good 29.0% |
| Inupiat | 60.4 /100 | #166 | Good 29.0% |
Demographics Similar to Guamanians/Chamorros by Single Mother Poverty
In terms of single mother poverty, the demographic groups most similar to Guamanians/Chamorros are Immigrants from Africa (29.4%, a difference of 0.010%), Lebanese (29.4%, a difference of 0.040%), Immigrants from Germany (29.5%, a difference of 0.070%), Immigrants from Trinidad and Tobago (29.5%, a difference of 0.14%), and Moroccan (29.5%, a difference of 0.18%).
| Demographics | Rating | Rank | Single Mother Poverty |
| Canadians | 40.4 /100 | #181 | Average 29.3% |
| Immigrants | Eastern Africa | 38.5 /100 | #182 | Fair 29.3% |
| Nepalese | 38.3 /100 | #183 | Fair 29.3% |
| Nigerians | 38.0 /100 | #184 | Fair 29.3% |
| Ghanaians | 36.8 /100 | #185 | Fair 29.4% |
| Yugoslavians | 36.0 /100 | #186 | Fair 29.4% |
| Lebanese | 32.5 /100 | #187 | Fair 29.4% |
| Guamanians/Chamorros | 31.8 /100 | #188 | Fair 29.4% |
| Immigrants | Africa | 31.6 /100 | #189 | Fair 29.4% |
| Immigrants | Germany | 30.4 /100 | #190 | Fair 29.5% |
| Immigrants | Trinidad and Tobago | 29.2 /100 | #191 | Fair 29.5% |
| Moroccans | 28.6 /100 | #192 | Fair 29.5% |
| Basques | 28.3 /100 | #193 | Fair 29.5% |
| Icelanders | 26.1 /100 | #194 | Fair 29.5% |
| Slavs | 24.5 /100 | #195 | Fair 29.6% |