Choctaw vs Immigrants from Zaire Unemployment Among Ages 20 to 24 years

COMPARE

Choctaw
Race
Ancestry
AfghanAfricanAlaska NativeAlaskan AthabascanAlbanianAleutAlsatianAmericanApacheArabArapahoArgentineanArmenianAssyrian/Chaldean/SyriacAustralianAustrianBahamianBangladeshiBarbadianBasqueBelgianBelizeanBermudanBhutaneseBlackfeetBolivianBrazilianBritishBritish West IndianBulgarianBurmeseCajunCambodianCanadianCape VerdeanCarpatho RusynCelticCentral AmericanCentral American IndianCherokeeCheyenneChickasawChileanChineseChippewaChoctawColombianColvilleComancheCosta RicanCreeCreekCroatianCrowCubanCypriotCzechCzechoslovakianDanishDelawareDominicanDutchDutch West IndianEastern EuropeanEcuadorianEgyptianEnglishEstonianEthiopianEuropeanFijianFilipinoFinnishFrenchFrench American IndianFrench CanadianGermanGerman RussianGhanaianGreekGuamanian/ChamorroGuatemalanGuyaneseHaitianHmongHonduranHopiHoumaHungarianIcelanderIndian (Asian)IndonesianInupiatIranianIraqiIrishIroquoisIsraeliItalianJamaicanJapaneseJordanianKenyanKiowaKoreanLaotianLatvianLebaneseLiberianLithuanianLumbeeLuxembourgerMacedonianMalaysianMalteseMarshalleseMenomineeMexicanMexican American IndianMongolianMoroccanNative HawaiianNavajoNepaleseNew ZealanderNicaraguanNigerianNorthern EuropeanNorwegianOkinawanOsageOttawaPaiutePakistaniPalestinianPanamanianParaguayanPennsylvania GermanPeruvianPimaPolishPortuguesePotawatomiPuebloPuerto RicanPuget Sound SalishRomanianRussianSalvadoranSamoanScandinavianScotch-IrishScottishSeminoleSenegaleseSerbianShoshoneSierra LeoneanSiouxSlavicSlovakSloveneSomaliSouth AfricanSouth AmericanSouth American IndianSoviet UnionSpaniardSpanishSpanish AmericanSpanish American IndianSri LankanSubsaharan AfricanSudaneseSwedishSwissSyrianTaiwaneseThaiTlingit-HaidaTohono O'OdhamTonganTrinidadian and TobagonianTsimshianTurkishU.S. Virgin IslanderUgandanUkrainianUruguayanUteVenezuelanVietnameseWelshWest IndianYakamaYaquiYugoslavianYumanYup'ikZimbabwean
Immigration
NonimmigrantsImmigrantsAfghanistanAfricaAlbaniaArgentinaArmeniaAsiaAustraliaAustriaBahamasBangladeshBarbadosBelarusBelgiumBelizeBoliviaBosnia and HerzegovinaBrazilBulgariaBurma/MyanmarCabo VerdeCambodiaCameroonCanadaCaribbeanCentral AmericaChileChinaColombiaCongoCosta RicaCroatiaCubaCzechoslovakiaDenmarkDominicaDominican RepublicEastern AfricaEastern AsiaEastern EuropeEcuadorEgyptEl SalvadorEnglandEritreaEthiopiaEuropeFijiFranceGermanyGhanaGreeceGrenadaGuatemalaGuyanaHaitiHondurasHong KongHungaryIndiaIndonesiaIranIraqIrelandIsraelItalyJamaicaJapanJordanKazakhstanKenyaKoreaKuwaitLaosLatin AmericaLatviaLebanonLiberiaLithuaniaMalaysiaMexicoMicronesiaMiddle AfricaMoldovaMoroccoNepalNetherlandsNicaraguaNigeriaNorth AmericaNorth MacedoniaNorthern AfricaNorthern EuropeNorwayOceaniaPakistanPanamaPeruPhilippinesPolandPortugalRomaniaRussiaSaudi ArabiaScotlandSenegalSerbiaSierra LeoneSingaporeSomaliaSouth AfricaSouth AmericaSouth Central AsiaSouth Eastern AsiaSouthern EuropeSpainSri LankaSt. Vincent and the GrenadinesSudanSwedenSwitzerlandSyriaTaiwanThailandTrinidad and TobagoTurkeyUgandaUkraineUruguayUzbekistanVenezuelaVietnamWest IndiesWestern AfricaWestern AsiaWestern EuropeYemenZimbabweAzores
Immigrants from Zaire
Race
Ancestry
AfghanAfricanAlaska NativeAlaskan AthabascanAlbanianAleutAlsatianAmericanApacheArabArapahoArgentineanArmenianAssyrian/Chaldean/SyriacAustralianAustrianBahamianBangladeshiBarbadianBasqueBelgianBelizeanBermudanBhutaneseBlackfeetBolivianBrazilianBritishBritish West IndianBulgarianBurmeseCajunCambodianCanadianCape VerdeanCarpatho RusynCelticCentral AmericanCentral American IndianCherokeeCheyenneChickasawChileanChineseChippewaColombianColvilleComancheCosta RicanCreeCreekCroatianCrowCubanCypriotCzechCzechoslovakianDanishDelawareDominicanDutchDutch West IndianEastern EuropeanEcuadorianEgyptianEnglishEstonianEthiopianEuropeanFijianFilipinoFinnishFrenchFrench American IndianFrench CanadianGermanGerman RussianGhanaianGreekGuamanian/ChamorroGuatemalanGuyaneseHaitianHmongHonduranHopiHoumaHungarianIcelanderIndian (Asian)IndonesianInupiatIranianIraqiIrishIroquoisIsraeliItalianJamaicanJapaneseJordanianKenyanKiowaKoreanLaotianLatvianLebaneseLiberianLithuanianLumbeeLuxembourgerMacedonianMalaysianMalteseMarshalleseMenomineeMexicanMexican American IndianMongolianMoroccanNative HawaiianNavajoNepaleseNew ZealanderNicaraguanNigerianNorthern EuropeanNorwegianOkinawanOsageOttawaPaiutePakistaniPalestinianPanamanianParaguayanPennsylvania GermanPeruvianPimaPolishPortuguesePotawatomiPuebloPuerto RicanPuget Sound SalishRomanianRussianSalvadoranSamoanScandinavianScotch-IrishScottishSeminoleSenegaleseSerbianShoshoneSierra LeoneanSiouxSlavicSlovakSloveneSomaliSouth AfricanSouth AmericanSouth American IndianSoviet UnionSpaniardSpanishSpanish AmericanSpanish American IndianSri LankanSubsaharan AfricanSudaneseSwedishSwissSyrianTaiwaneseThaiTlingit-HaidaTohono O'OdhamTonganTrinidadian and TobagonianTsimshianTurkishU.S. Virgin IslanderUgandanUkrainianUruguayanUteVenezuelanVietnameseWelshWest IndianYakamaYaquiYugoslavianYumanYup'ikZimbabwean
Immigration
NonimmigrantsImmigrantsAfghanistanAfricaAlbaniaArgentinaArmeniaAsiaAustraliaAustriaBahamasBangladeshBarbadosBelarusBelgiumBelizeBoliviaBosnia and HerzegovinaBrazilBulgariaBurma/MyanmarCabo VerdeCambodiaCameroonCanadaCaribbeanCentral AmericaChileChinaColombiaCongoCosta RicaCroatiaCubaCzechoslovakiaDenmarkDominicaDominican RepublicEastern AfricaEastern AsiaEastern EuropeEcuadorEgyptEl SalvadorEnglandEritreaEthiopiaEuropeFijiFranceGermanyGhanaGreeceGrenadaGuatemalaGuyanaHaitiHondurasHong KongHungaryIndiaIndonesiaIranIraqIrelandIsraelItalyJamaicaJapanJordanKazakhstanKenyaKoreaKuwaitLaosLatin AmericaLatviaLebanonLiberiaLithuaniaMalaysiaMexicoMicronesiaMiddle AfricaMoldovaMoroccoNepalNetherlandsNicaraguaNigeriaNorth AmericaNorth MacedoniaNorthern AfricaNorthern EuropeNorwayOceaniaPakistanPanamaPeruPhilippinesPolandPortugalRomaniaRussiaSaudi ArabiaScotlandSenegalSerbiaSierra LeoneSingaporeSomaliaSouth AfricaSouth AmericaSouth Central AsiaSouth Eastern AsiaSouthern EuropeSpainSri LankaSt. Vincent and the GrenadinesSudanSwedenSwitzerlandSyriaTaiwanThailandTrinidad and TobagoTurkeyUgandaUkraineUruguayUzbekistanVenezuelaVietnamWest IndiesWestern AfricaWestern AsiaWestern EuropeYemenZaireZimbabweAzores
Unemployment Among Ages 20 to 24 years
Income
Poverty
Unemployment
Labor Participation
Family Structure
Vehicle Availability
Education Level
Disability

Unemployment Among Ages 20 to 24 years Comparison

Choctaw

Immigrants from Zaire

Tragic
Exceptional
10.6%
UNEMPLOYMENT AMONG AGES 20 TO 24 YEARS
3.6/ 100
METRIC RATING
233rd/ 347
METRIC RANK
9.6%
UNEMPLOYMENT AMONG AGES 20 TO 24 YEARS
100.0/ 100
METRIC RATING
37th/ 347
METRIC RANK

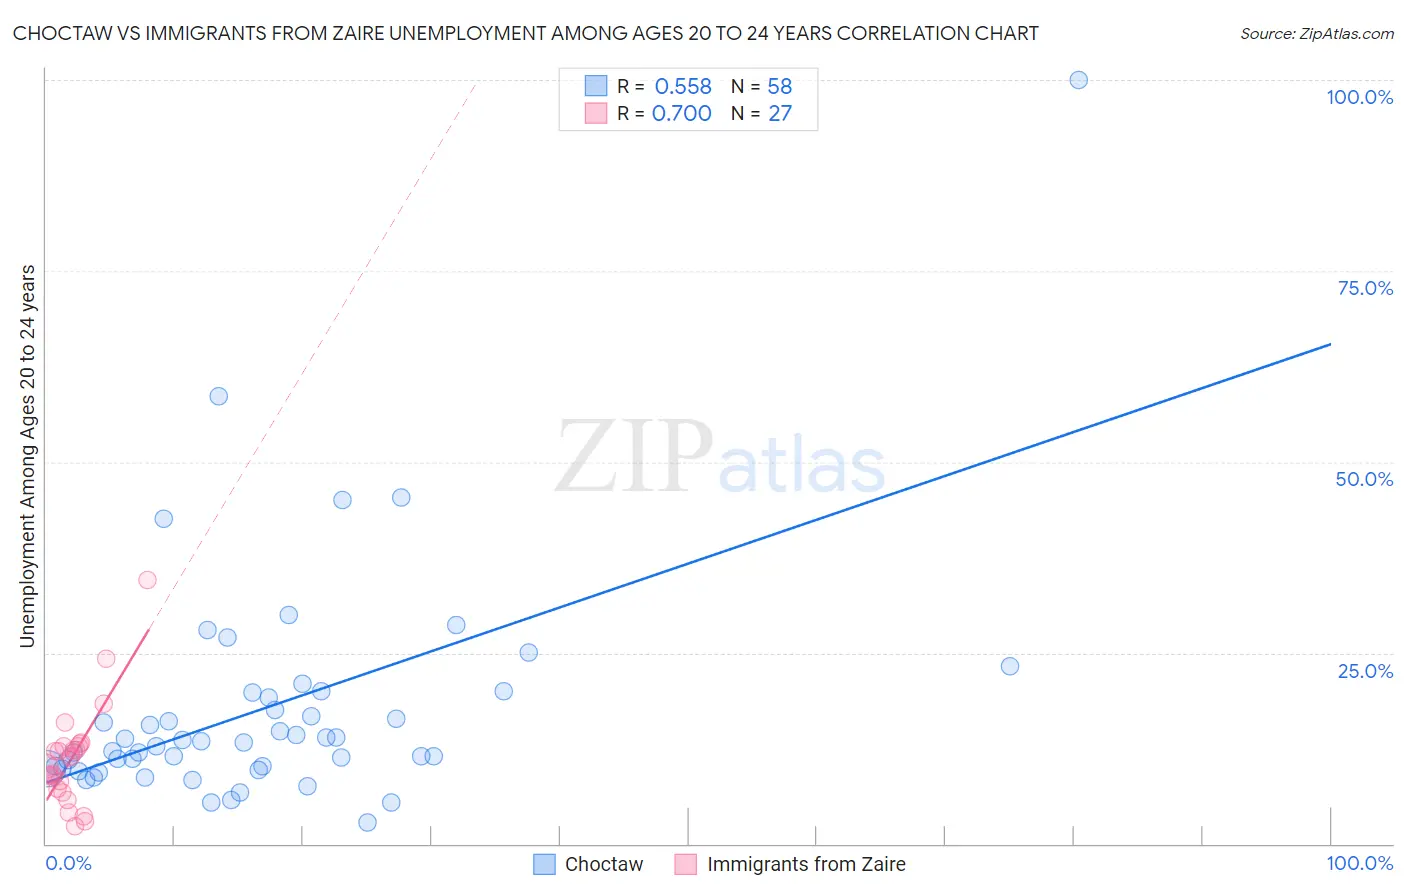
Choctaw vs Immigrants from Zaire Unemployment Among Ages 20 to 24 years Correlation Chart

The statistical analysis conducted on geographies consisting of 261,469,293 people shows a substantial positive correlation between the proportion of Choctaw and unemployment rate among population between the ages 20 and 24 in the United States with a correlation coefficient (R) of 0.558 and weighted average of 10.6%. Similarly, the statistical analysis conducted on geographies consisting of 106,574,951 people shows a significant positive correlation between the proportion of Immigrants from Zaire and unemployment rate among population between the ages 20 and 24 in the United States with a correlation coefficient (R) of 0.700 and weighted average of 9.6%, a difference of 10.7%.
Choctaw vs Immigrants from Zaire Unemployment Among Ages 20 to 24 years

Unemployment Among Ages 20 to 24 years Correlation Summary

MeasurementChoctawImmigrants from Zaire
Minimum2.8%2.3%
Maximum100.0%34.6%
Range97.2%32.3%
Mean17.7%11.2%
Median13.3%11.3%
Interquartile 25% (IQ1)9.9%7.2%
Interquartile 75% (IQ3)19.8%12.7%
Interquartile Range (IQR)9.9%5.6%
Standard Deviation (Sample)15.3%6.7%
Standard Deviation (Population)15.2%6.6%

Similar Demographics by Unemployment Among Ages 20 to 24 years

Demographics Similar to Choctaw by Unemployment Among Ages 20 to 24 years

In terms of unemployment among ages 20 to 24 years, the demographic groups most similar to Choctaw are Immigrants from Africa (10.6%, a difference of 0.010%), Israeli (10.6%, a difference of 0.020%), Immigrants from Ukraine (10.6%, a difference of 0.060%), Native Hawaiian (10.6%, a difference of 0.080%), and Mexican (10.6%, a difference of 0.11%).
DemographicsRating | RankUnemployment Among Ages 20 to 24 years
Immigrants | Costa Rica
4.9
/100
|
#226
Tragic
10.6%
Palestinians
4.9
/100
|
#227
Tragic
10.6%
Mexican American Indians
4.6
/100
|
#228
Tragic
10.6%
Americans
4.4
/100
|
#229
Tragic
10.6%
French American Indians
4.1
/100
|
#230
Tragic
10.6%
Native Hawaiians
3.9
/100
|
#231
Tragic
10.6%
Israelis
3.7
/100
|
#232
Tragic
10.6%
Choctaw
3.6
/100
|
#233
Tragic
10.6%
Immigrants | Africa
3.5
/100
|
#234
Tragic
10.6%
Immigrants | Ukraine
3.3
/100
|
#235
Tragic
10.6%
Mexicans
3.2
/100
|
#236
Tragic
10.6%
Immigrants | Immigrants
2.7
/100
|
#237
Tragic
10.6%
Immigrants | Pakistan
2.6
/100
|
#238
Tragic
10.6%
Salvadorans
2.4
/100
|
#239
Tragic
10.7%
Immigrants | Central America
2.0
/100
|
#240
Tragic
10.7%

Demographics Similar to Immigrants from Zaire by Unemployment Among Ages 20 to 24 years

In terms of unemployment among ages 20 to 24 years, the demographic groups most similar to Immigrants from Zaire are Afghan (9.6%, a difference of 0.070%), Belgian (9.6%, a difference of 0.080%), German (9.6%, a difference of 0.11%), Yugoslavian (9.6%, a difference of 0.19%), and Dutch (9.6%, a difference of 0.29%).
DemographicsRating | RankUnemployment Among Ages 20 to 24 years
Scandinavians
100.0
/100
|
#30
Exceptional
9.5%
Immigrants | Eastern Africa
100.0
/100
|
#31
Exceptional
9.5%
Cambodians
100.0
/100
|
#32
Exceptional
9.5%
Australians
100.0
/100
|
#33
Exceptional
9.6%
Yugoslavians
100.0
/100
|
#34
Exceptional
9.6%
Germans
100.0
/100
|
#35
Exceptional
9.6%
Belgians
100.0
/100
|
#36
Exceptional
9.6%
Immigrants | Zaire
100.0
/100
|
#37
Exceptional
9.6%
Afghans
99.9
/100
|
#38
Exceptional
9.6%
Dutch
99.9
/100
|
#39
Exceptional
9.6%
Immigrants | Ethiopia
99.9
/100
|
#40
Exceptional
9.6%
Swiss
99.9
/100
|
#41
Exceptional
9.7%
Immigrants | Saudi Arabia
99.9
/100
|
#42
Exceptional
9.7%
Menominee
99.8
/100
|
#43
Exceptional
9.7%
Europeans
99.8
/100
|
#44
Exceptional
9.7%