Chinese vs Tongan Male Unemployment
COMPARE
Chinese
Tongan
Male Unemployment
Male Unemployment Comparison
Chinese
Tongans
4.9%
MALE UNEMPLOYMENT
99.3/ 100
METRIC RATING
41st/ 347
METRIC RANK
4.8%
MALE UNEMPLOYMENT
99.9/ 100
METRIC RATING
23rd/ 347
METRIC RANK
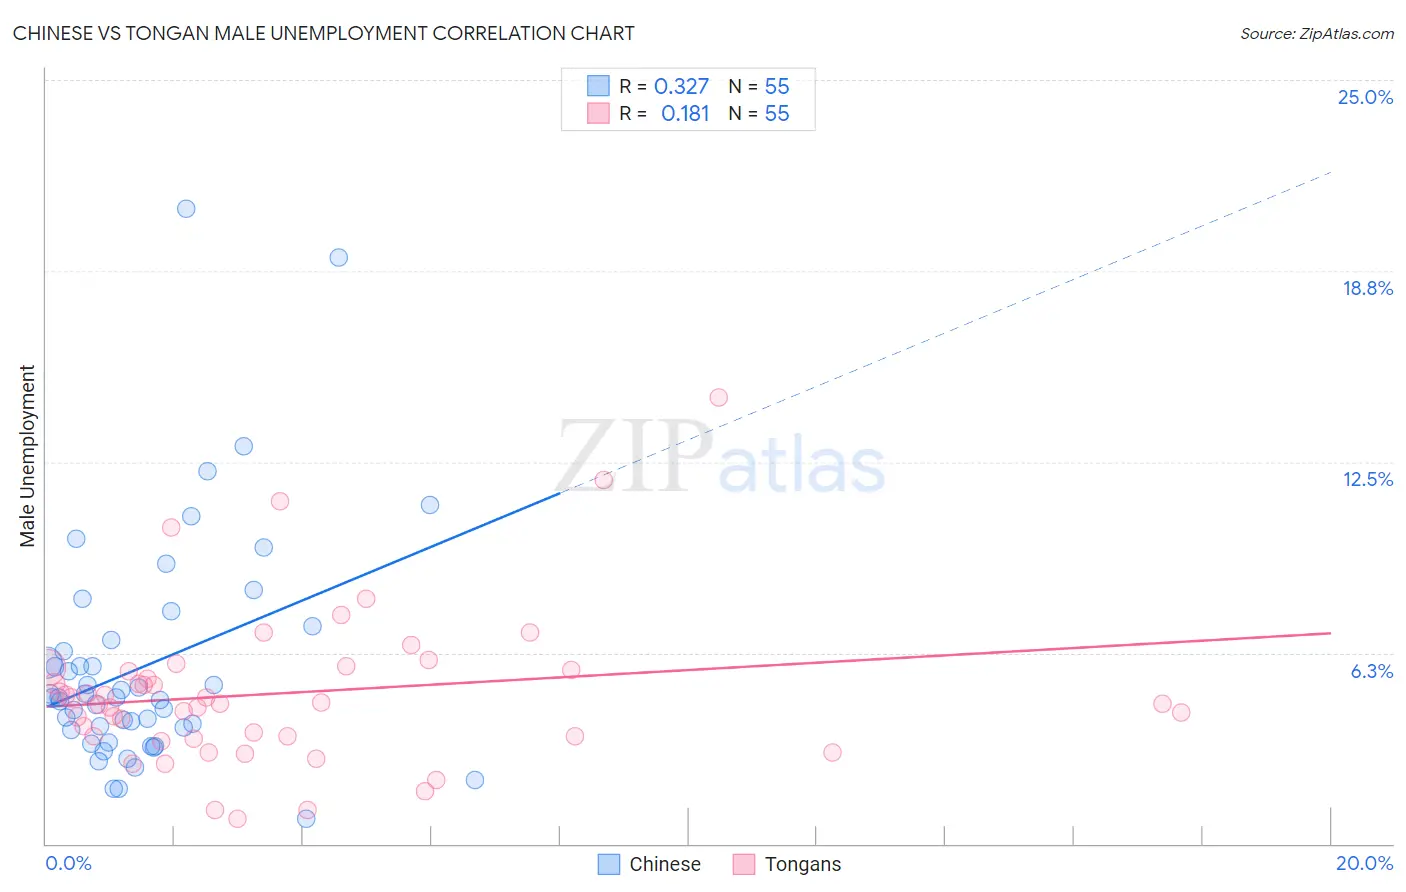
Chinese vs Tongan Male Unemployment Correlation Chart
The statistical analysis conducted on geographies consisting of 64,756,701 people shows a mild positive correlation between the proportion of Chinese and unemployment rate among males in the United States with a correlation coefficient (R) of 0.327 and weighted average of 4.9%. Similarly, the statistical analysis conducted on geographies consisting of 102,801,849 people shows a poor positive correlation between the proportion of Tongans and unemployment rate among males in the United States with a correlation coefficient (R) of 0.181 and weighted average of 4.8%, a difference of 3.0%.
Male Unemployment Correlation Summary
| Measurement | Chinese | Tongan |
| Minimum | 0.80% | 0.80% |
| Maximum | 20.8% | 14.6% |
| Range | 20.0% | 13.8% |
| Mean | 5.8% | 4.9% |
| Median | 4.8% | 4.6% |
| Interquartile 25% (IQ1) | 3.7% | 3.5% |
| Interquartile 75% (IQ3) | 6.7% | 5.7% |
| Interquartile Range (IQR) | 2.9% | 2.2% |
| Standard Deviation (Sample) | 3.8% | 2.5% |
| Standard Deviation (Population) | 3.8% | 2.5% |
Demographics Similar to Chinese and Tongans by Male Unemployment
In terms of male unemployment, the demographic groups most similar to Chinese are Immigrants from Belgium (4.9%, a difference of 0.020%), Northern European (4.9%, a difference of 0.080%), Burmese (4.9%, a difference of 0.17%), Immigrants from Bosnia and Herzegovina (4.9%, a difference of 0.24%), and Scotch-Irish (4.9%, a difference of 0.26%). Similarly, the demographic groups most similar to Tongans are Immigrants from South Central Asia (4.8%, a difference of 0.030%), Carpatho Rusyn (4.8%, a difference of 0.040%), Zimbabwean (4.8%, a difference of 0.13%), Dutch (4.8%, a difference of 0.15%), and Belgian (4.8%, a difference of 0.35%).
| Demographics | Rating | Rank | Male Unemployment |
| Carpatho Rusyns | 99.9 /100 | #22 | Exceptional 4.8% |
| Tongans | 99.9 /100 | #23 | Exceptional 4.8% |
| Immigrants | South Central Asia | 99.9 /100 | #24 | Exceptional 4.8% |
| Zimbabweans | 99.9 /100 | #25 | Exceptional 4.8% |
| Dutch | 99.9 /100 | #26 | Exceptional 4.8% |
| Belgians | 99.9 /100 | #27 | Exceptional 4.8% |
| Bulgarians | 99.8 /100 | #28 | Exceptional 4.8% |
| Scottish | 99.8 /100 | #29 | Exceptional 4.8% |
| British | 99.8 /100 | #30 | Exceptional 4.8% |
| Sudanese | 99.8 /100 | #31 | Exceptional 4.8% |
| Immigrants | Nepal | 99.8 /100 | #32 | Exceptional 4.8% |
| Latvians | 99.7 /100 | #33 | Exceptional 4.8% |
| Welsh | 99.7 /100 | #34 | Exceptional 4.8% |
| Paraguayans | 99.5 /100 | #35 | Exceptional 4.9% |
| Immigrants | Singapore | 99.4 /100 | #36 | Exceptional 4.9% |
| Scotch-Irish | 99.4 /100 | #37 | Exceptional 4.9% |
| Immigrants | Bosnia and Herzegovina | 99.4 /100 | #38 | Exceptional 4.9% |
| Burmese | 99.3 /100 | #39 | Exceptional 4.9% |
| Northern Europeans | 99.3 /100 | #40 | Exceptional 4.9% |
| Chinese | 99.3 /100 | #41 | Exceptional 4.9% |
| Immigrants | Belgium | 99.2 /100 | #42 | Exceptional 4.9% |