Chinese vs Immigrants from Afghanistan Male Unemployment
COMPARE
Chinese
Immigrants from Afghanistan
Male Unemployment
Male Unemployment Comparison
Chinese
Immigrants from Afghanistan
4.9%
MALE UNEMPLOYMENT
99.3/ 100
METRIC RATING
41st/ 347
METRIC RANK
5.3%
MALE UNEMPLOYMENT
37.9/ 100
METRIC RATING
181st/ 347
METRIC RANK
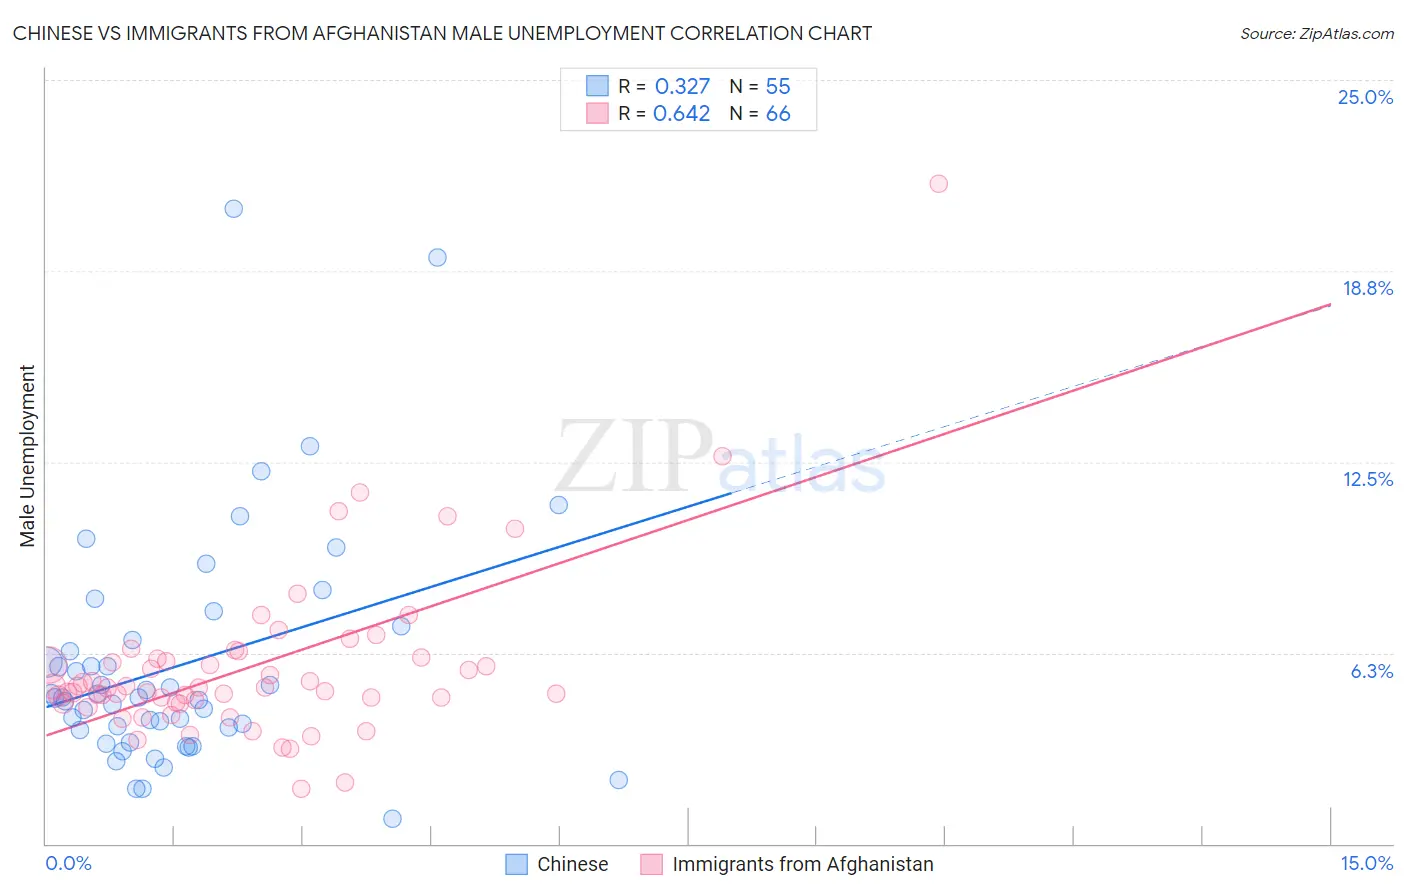
Chinese vs Immigrants from Afghanistan Male Unemployment Correlation Chart
The statistical analysis conducted on geographies consisting of 64,756,701 people shows a mild positive correlation between the proportion of Chinese and unemployment rate among males in the United States with a correlation coefficient (R) of 0.327 and weighted average of 4.9%. Similarly, the statistical analysis conducted on geographies consisting of 147,586,191 people shows a significant positive correlation between the proportion of Immigrants from Afghanistan and unemployment rate among males in the United States with a correlation coefficient (R) of 0.642 and weighted average of 5.3%, a difference of 8.5%.
Male Unemployment Correlation Summary
| Measurement | Chinese | Immigrants from Afghanistan |
| Minimum | 0.80% | 1.8% |
| Maximum | 20.8% | 21.6% |
| Range | 20.0% | 19.8% |
| Mean | 5.8% | 5.8% |
| Median | 4.8% | 5.1% |
| Interquartile 25% (IQ1) | 3.7% | 4.6% |
| Interquartile 75% (IQ3) | 6.7% | 6.0% |
| Interquartile Range (IQR) | 2.9% | 1.4% |
| Standard Deviation (Sample) | 3.8% | 2.8% |
| Standard Deviation (Population) | 3.8% | 2.8% |
Similar Demographics by Male Unemployment
Demographics Similar to Chinese by Male Unemployment
In terms of male unemployment, the demographic groups most similar to Chinese are Immigrants from Belgium (4.9%, a difference of 0.020%), Northern European (4.9%, a difference of 0.080%), Immigrants from Japan (4.9%, a difference of 0.13%), Burmese (4.9%, a difference of 0.17%), and Immigrants from Bosnia and Herzegovina (4.9%, a difference of 0.24%).
| Demographics | Rating | Rank | Male Unemployment |
| Welsh | 99.7 /100 | #34 | Exceptional 4.8% |
| Paraguayans | 99.5 /100 | #35 | Exceptional 4.9% |
| Immigrants | Singapore | 99.4 /100 | #36 | Exceptional 4.9% |
| Scotch-Irish | 99.4 /100 | #37 | Exceptional 4.9% |
| Immigrants | Bosnia and Herzegovina | 99.4 /100 | #38 | Exceptional 4.9% |
| Burmese | 99.3 /100 | #39 | Exceptional 4.9% |
| Northern Europeans | 99.3 /100 | #40 | Exceptional 4.9% |
| Chinese | 99.3 /100 | #41 | Exceptional 4.9% |
| Immigrants | Belgium | 99.2 /100 | #42 | Exceptional 4.9% |
| Immigrants | Japan | 99.2 /100 | #43 | Exceptional 4.9% |
| Immigrants | Korea | 99.1 /100 | #44 | Exceptional 4.9% |
| Immigrants | Zimbabwe | 99.0 /100 | #45 | Exceptional 4.9% |
| Bhutanese | 98.9 /100 | #46 | Exceptional 4.9% |
| Austrians | 98.9 /100 | #47 | Exceptional 4.9% |
| Immigrants | Scotland | 98.9 /100 | #48 | Exceptional 4.9% |
Demographics Similar to Immigrants from Afghanistan by Male Unemployment
In terms of male unemployment, the demographic groups most similar to Immigrants from Afghanistan are Potawatomi (5.3%, a difference of 0.010%), Taiwanese (5.3%, a difference of 0.020%), Malaysian (5.3%, a difference of 0.10%), Immigrants from Oceania (5.3%, a difference of 0.18%), and Spaniard (5.3%, a difference of 0.18%).
| Demographics | Rating | Rank | Male Unemployment |
| Immigrants | Iran | 50.0 /100 | #174 | Average 5.3% |
| Immigrants | Iraq | 48.1 /100 | #175 | Average 5.3% |
| Immigrants | Poland | 46.0 /100 | #176 | Average 5.3% |
| Immigrants | Peru | 44.6 /100 | #177 | Average 5.3% |
| Osage | 42.5 /100 | #178 | Average 5.3% |
| Immigrants | Oceania | 40.8 /100 | #179 | Average 5.3% |
| Malaysians | 39.6 /100 | #180 | Fair 5.3% |
| Immigrants | Afghanistan | 37.9 /100 | #181 | Fair 5.3% |
| Potawatomi | 37.8 /100 | #182 | Fair 5.3% |
| Taiwanese | 37.6 /100 | #183 | Fair 5.3% |
| Spaniards | 35.1 /100 | #184 | Fair 5.3% |
| Koreans | 34.9 /100 | #185 | Fair 5.3% |
| Iraqis | 31.6 /100 | #186 | Fair 5.4% |
| Costa Ricans | 31.3 /100 | #187 | Fair 5.4% |
| Arabs | 30.2 /100 | #188 | Fair 5.4% |