Chinese vs Immigrants from Uganda Male Unemployment
COMPARE
Chinese
Immigrants from Uganda
Male Unemployment
Male Unemployment Comparison
Chinese
Immigrants from Uganda
4.9%
MALE UNEMPLOYMENT
99.3/ 100
METRIC RATING
41st/ 347
METRIC RANK
5.4%
MALE UNEMPLOYMENT
28.8/ 100
METRIC RATING
190th/ 347
METRIC RANK
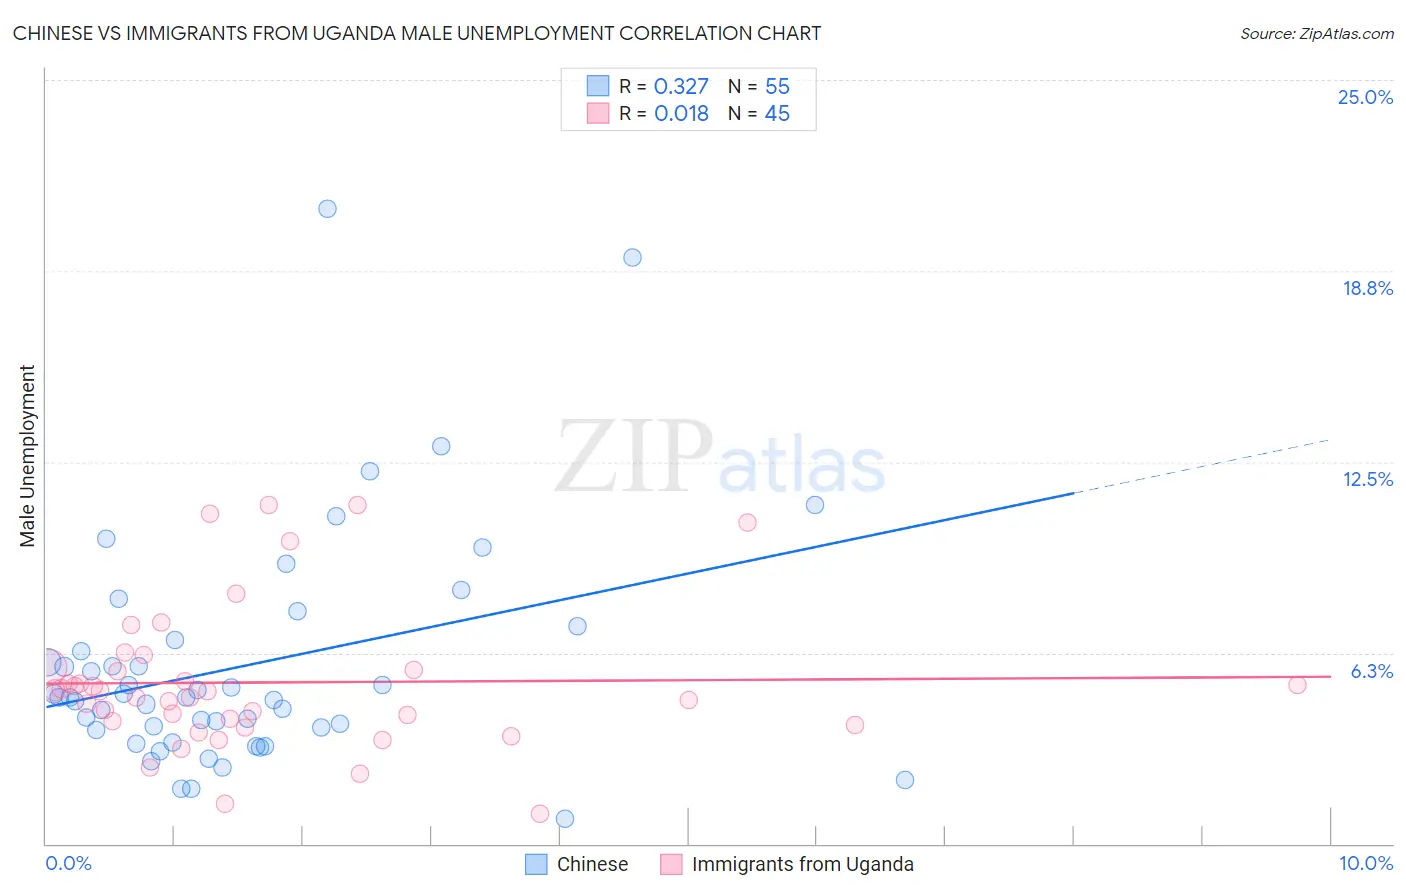
Chinese vs Immigrants from Uganda Male Unemployment Correlation Chart
The statistical analysis conducted on geographies consisting of 64,756,701 people shows a mild positive correlation between the proportion of Chinese and unemployment rate among males in the United States with a correlation coefficient (R) of 0.327 and weighted average of 4.9%. Similarly, the statistical analysis conducted on geographies consisting of 125,897,340 people shows no correlation between the proportion of Immigrants from Uganda and unemployment rate among males in the United States with a correlation coefficient (R) of 0.018 and weighted average of 5.4%, a difference of 9.1%.
Male Unemployment Correlation Summary
| Measurement | Chinese | Immigrants from Uganda |
| Minimum | 0.80% | 1.0% |
| Maximum | 20.8% | 11.1% |
| Range | 20.0% | 10.1% |
| Mean | 5.8% | 5.3% |
| Median | 4.8% | 5.0% |
| Interquartile 25% (IQ1) | 3.7% | 4.0% |
| Interquartile 75% (IQ3) | 6.7% | 5.7% |
| Interquartile Range (IQR) | 2.9% | 1.8% |
| Standard Deviation (Sample) | 3.8% | 2.4% |
| Standard Deviation (Population) | 3.8% | 2.3% |
Similar Demographics by Male Unemployment
Demographics Similar to Chinese by Male Unemployment
In terms of male unemployment, the demographic groups most similar to Chinese are Immigrants from Belgium (4.9%, a difference of 0.020%), Northern European (4.9%, a difference of 0.080%), Immigrants from Japan (4.9%, a difference of 0.13%), Burmese (4.9%, a difference of 0.17%), and Immigrants from Bosnia and Herzegovina (4.9%, a difference of 0.24%).
| Demographics | Rating | Rank | Male Unemployment |
| Welsh | 99.7 /100 | #34 | Exceptional 4.8% |
| Paraguayans | 99.5 /100 | #35 | Exceptional 4.9% |
| Immigrants | Singapore | 99.4 /100 | #36 | Exceptional 4.9% |
| Scotch-Irish | 99.4 /100 | #37 | Exceptional 4.9% |
| Immigrants | Bosnia and Herzegovina | 99.4 /100 | #38 | Exceptional 4.9% |
| Burmese | 99.3 /100 | #39 | Exceptional 4.9% |
| Northern Europeans | 99.3 /100 | #40 | Exceptional 4.9% |
| Chinese | 99.3 /100 | #41 | Exceptional 4.9% |
| Immigrants | Belgium | 99.2 /100 | #42 | Exceptional 4.9% |
| Immigrants | Japan | 99.2 /100 | #43 | Exceptional 4.9% |
| Immigrants | Korea | 99.1 /100 | #44 | Exceptional 4.9% |
| Immigrants | Zimbabwe | 99.0 /100 | #45 | Exceptional 4.9% |
| Bhutanese | 98.9 /100 | #46 | Exceptional 4.9% |
| Austrians | 98.9 /100 | #47 | Exceptional 4.9% |
| Immigrants | Scotland | 98.9 /100 | #48 | Exceptional 4.9% |
Demographics Similar to Immigrants from Uganda by Male Unemployment
In terms of male unemployment, the demographic groups most similar to Immigrants from Uganda are Immigrants from South America (5.4%, a difference of 0.040%), Immigrants from South Eastern Asia (5.4%, a difference of 0.040%), Arab (5.4%, a difference of 0.10%), Costa Rican (5.4%, a difference of 0.18%), and Iraqi (5.4%, a difference of 0.19%).
| Demographics | Rating | Rank | Male Unemployment |
| Taiwanese | 37.6 /100 | #183 | Fair 5.3% |
| Spaniards | 35.1 /100 | #184 | Fair 5.3% |
| Koreans | 34.9 /100 | #185 | Fair 5.3% |
| Iraqis | 31.6 /100 | #186 | Fair 5.4% |
| Costa Ricans | 31.3 /100 | #187 | Fair 5.4% |
| Arabs | 30.2 /100 | #188 | Fair 5.4% |
| Immigrants | South America | 29.4 /100 | #189 | Fair 5.4% |
| Immigrants | Uganda | 28.8 /100 | #190 | Fair 5.4% |
| Immigrants | South Eastern Asia | 28.2 /100 | #191 | Fair 5.4% |
| Immigrants | Belarus | 26.0 /100 | #192 | Fair 5.4% |
| Immigrants | Israel | 25.2 /100 | #193 | Fair 5.4% |
| Spanish | 19.7 /100 | #194 | Poor 5.4% |
| Immigrants | Southern Europe | 17.7 /100 | #195 | Poor 5.4% |
| Albanians | 17.3 /100 | #196 | Poor 5.4% |
| Alsatians | 16.7 /100 | #197 | Poor 5.4% |