Burmese vs Immigrants from Romania Male Unemployment
COMPARE
Burmese
Immigrants from Romania
Male Unemployment
Male Unemployment Comparison
Burmese
Immigrants from Romania
4.9%
MALE UNEMPLOYMENT
99.3/ 100
METRIC RATING
39th/ 347
METRIC RANK
5.1%
MALE UNEMPLOYMENT
95.4/ 100
METRIC RATING
87th/ 347
METRIC RANK
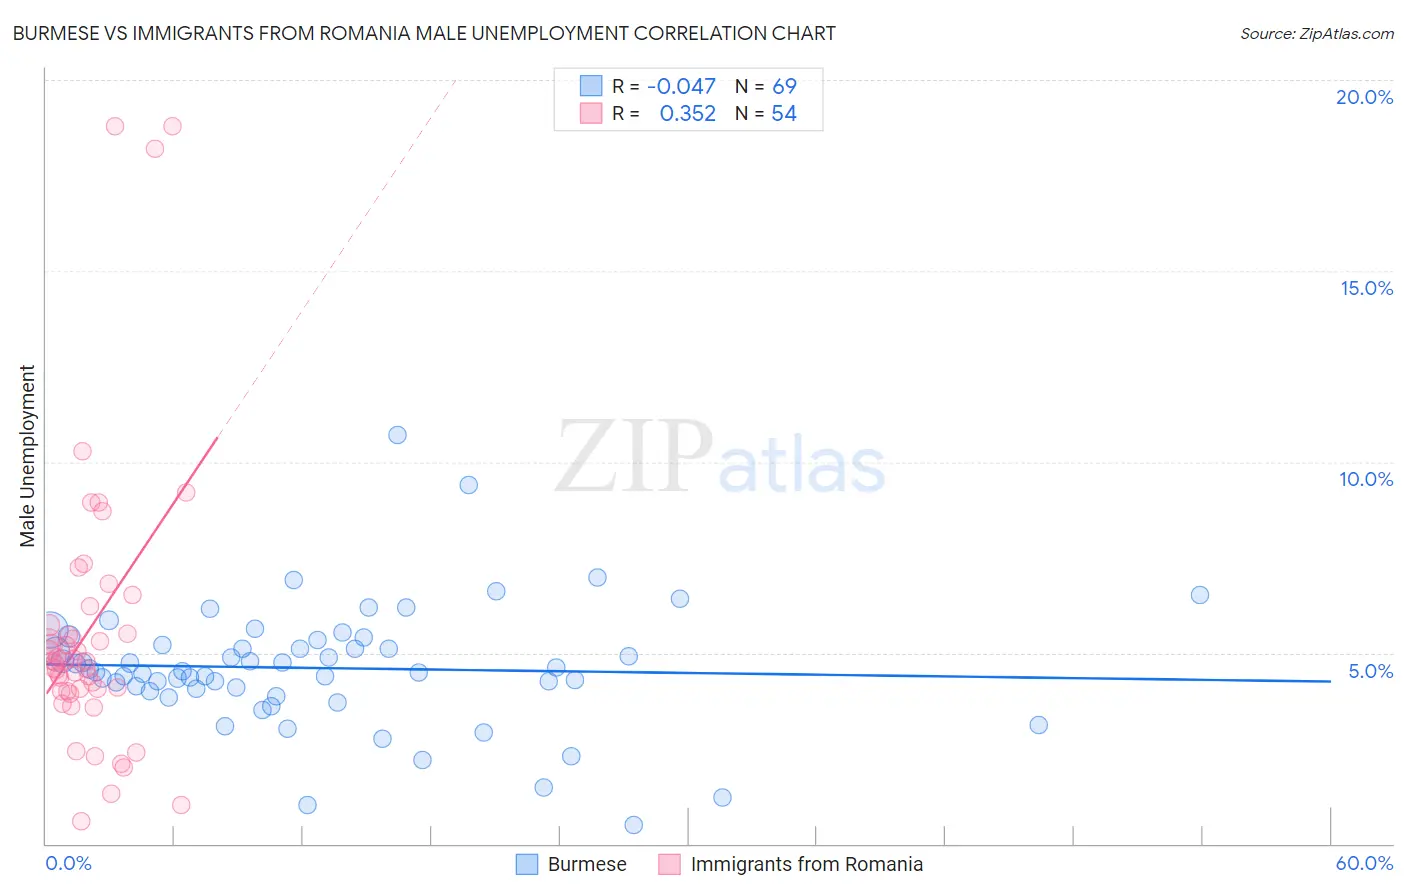
Burmese vs Immigrants from Romania Male Unemployment Correlation Chart
The statistical analysis conducted on geographies consisting of 462,600,368 people shows no correlation between the proportion of Burmese and unemployment rate among males in the United States with a correlation coefficient (R) of -0.047 and weighted average of 4.9%. Similarly, the statistical analysis conducted on geographies consisting of 256,547,728 people shows a mild positive correlation between the proportion of Immigrants from Romania and unemployment rate among males in the United States with a correlation coefficient (R) of 0.352 and weighted average of 5.1%, a difference of 3.1%.
Male Unemployment Correlation Summary
| Measurement | Burmese | Immigrants from Romania |
| Minimum | 0.50% | 0.60% |
| Maximum | 10.7% | 18.8% |
| Range | 10.2% | 18.2% |
| Mean | 4.6% | 5.6% |
| Median | 4.5% | 4.8% |
| Interquartile 25% (IQ1) | 4.0% | 4.0% |
| Interquartile 75% (IQ3) | 5.3% | 5.7% |
| Interquartile Range (IQR) | 1.2% | 1.7% |
| Standard Deviation (Sample) | 1.6% | 3.8% |
| Standard Deviation (Population) | 1.6% | 3.7% |
Similar Demographics by Male Unemployment
Demographics Similar to Burmese by Male Unemployment
In terms of male unemployment, the demographic groups most similar to Burmese are Immigrants from Bosnia and Herzegovina (4.9%, a difference of 0.070%), Northern European (4.9%, a difference of 0.080%), Scotch-Irish (4.9%, a difference of 0.090%), Chinese (4.9%, a difference of 0.17%), and Immigrants from Belgium (4.9%, a difference of 0.19%).
| Demographics | Rating | Rank | Male Unemployment |
| Immigrants | Nepal | 99.8 /100 | #32 | Exceptional 4.8% |
| Latvians | 99.7 /100 | #33 | Exceptional 4.8% |
| Welsh | 99.7 /100 | #34 | Exceptional 4.8% |
| Paraguayans | 99.5 /100 | #35 | Exceptional 4.9% |
| Immigrants | Singapore | 99.4 /100 | #36 | Exceptional 4.9% |
| Scotch-Irish | 99.4 /100 | #37 | Exceptional 4.9% |
| Immigrants | Bosnia and Herzegovina | 99.4 /100 | #38 | Exceptional 4.9% |
| Burmese | 99.3 /100 | #39 | Exceptional 4.9% |
| Northern Europeans | 99.3 /100 | #40 | Exceptional 4.9% |
| Chinese | 99.3 /100 | #41 | Exceptional 4.9% |
| Immigrants | Belgium | 99.2 /100 | #42 | Exceptional 4.9% |
| Immigrants | Japan | 99.2 /100 | #43 | Exceptional 4.9% |
| Immigrants | Korea | 99.1 /100 | #44 | Exceptional 4.9% |
| Immigrants | Zimbabwe | 99.0 /100 | #45 | Exceptional 4.9% |
| Bhutanese | 98.9 /100 | #46 | Exceptional 4.9% |
Demographics Similar to Immigrants from Romania by Male Unemployment
In terms of male unemployment, the demographic groups most similar to Immigrants from Romania are Maltese (5.1%, a difference of 0.020%), Immigrants from North Macedonia (5.1%, a difference of 0.060%), Serbian (5.1%, a difference of 0.11%), Immigrants from Sri Lanka (5.1%, a difference of 0.19%), and Immigrants from Eritrea (5.0%, a difference of 0.22%).
| Demographics | Rating | Rank | Male Unemployment |
| Argentineans | 96.2 /100 | #80 | Exceptional 5.0% |
| French | 96.2 /100 | #81 | Exceptional 5.0% |
| Chileans | 96.2 /100 | #82 | Exceptional 5.0% |
| Immigrants | Eritrea | 96.0 /100 | #83 | Exceptional 5.0% |
| Serbians | 95.7 /100 | #84 | Exceptional 5.1% |
| Immigrants | North Macedonia | 95.6 /100 | #85 | Exceptional 5.1% |
| Maltese | 95.5 /100 | #86 | Exceptional 5.1% |
| Immigrants | Romania | 95.4 /100 | #87 | Exceptional 5.1% |
| Immigrants | Sri Lanka | 94.9 /100 | #88 | Exceptional 5.1% |
| Immigrants | Australia | 94.7 /100 | #89 | Exceptional 5.1% |
| Okinawans | 94.7 /100 | #90 | Exceptional 5.1% |
| Immigrants | Turkey | 94.4 /100 | #91 | Exceptional 5.1% |
| Slavs | 94.2 /100 | #92 | Exceptional 5.1% |
| Immigrants | Serbia | 94.2 /100 | #93 | Exceptional 5.1% |
| Canadians | 94.1 /100 | #94 | Exceptional 5.1% |