Black/African American vs Immigrants Unemployment Among Ages 55 to 59 years
COMPARE
Black/African American
Immigrants
Unemployment Among Ages 55 to 59 years
Unemployment Among Ages 55 to 59 years Comparison
Blacks/African Americans
Immigrants
5.5%
UNEMPLOYMENT AMONG AGES 55 TO 59 YEARS
0.0/ 100
METRIC RATING
304th/ 347
METRIC RANK
5.0%
UNEMPLOYMENT AMONG AGES 55 TO 59 YEARS
2.3/ 100
METRIC RATING
233rd/ 347
METRIC RANK
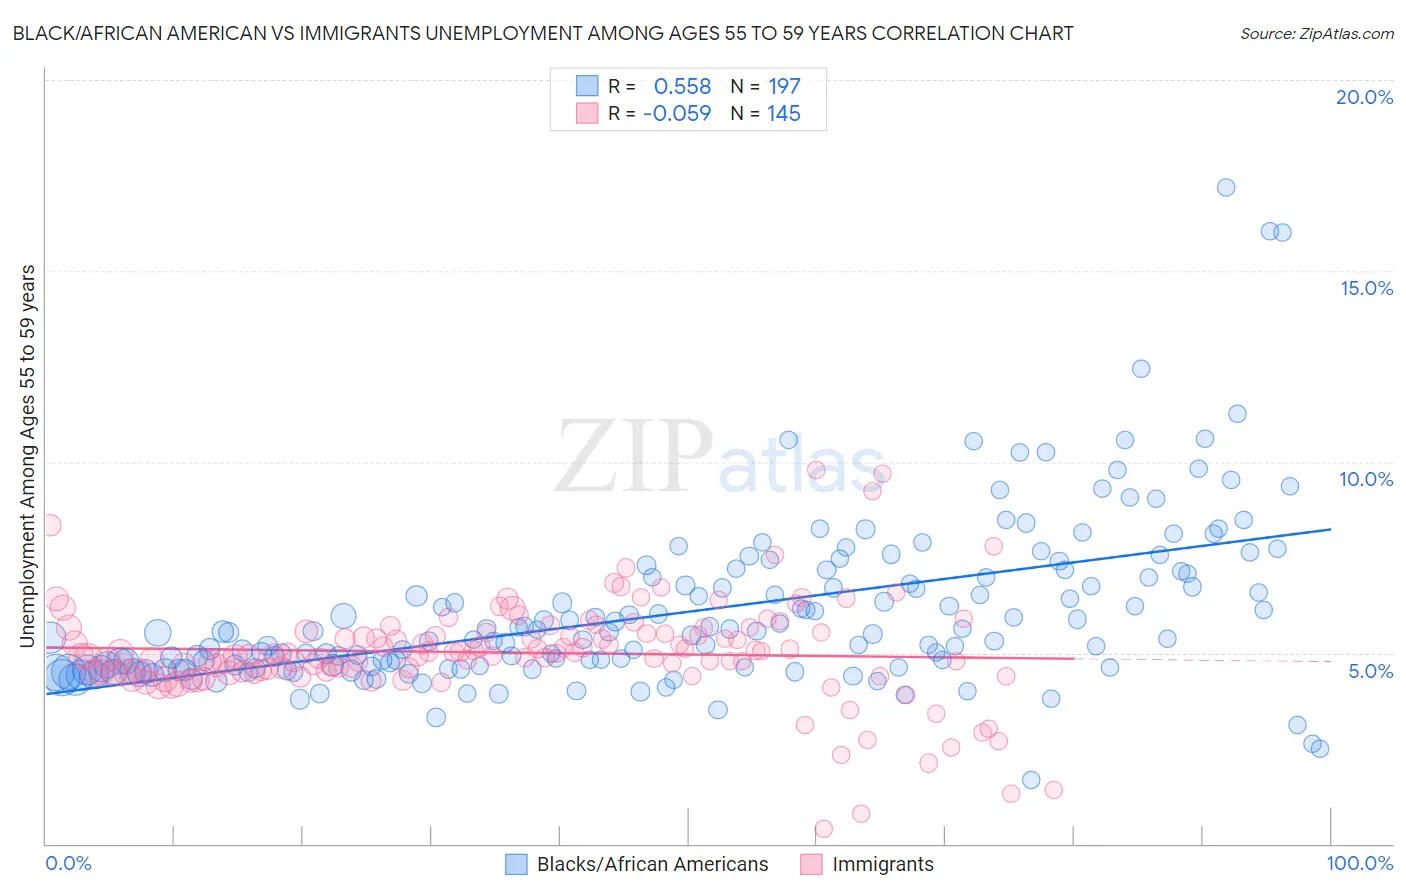
Black/African American vs Immigrants Unemployment Among Ages 55 to 59 years Correlation Chart
The statistical analysis conducted on geographies consisting of 486,654,676 people shows a substantial positive correlation between the proportion of Blacks/African Americans and unemployment rate among population between the ages 55 and 59 in the United States with a correlation coefficient (R) of 0.558 and weighted average of 5.5%. Similarly, the statistical analysis conducted on geographies consisting of 491,076,456 people shows a slight negative correlation between the proportion of Immigrants and unemployment rate among population between the ages 55 and 59 in the United States with a correlation coefficient (R) of -0.059 and weighted average of 5.0%, a difference of 10.0%.
Unemployment Among Ages 55 to 59 years Correlation Summary
| Measurement | Black/African American | Immigrants |
| Minimum | 1.7% | 0.40% |
| Maximum | 17.2% | 9.8% |
| Range | 15.5% | 9.4% |
| Mean | 6.0% | 5.0% |
| Median | 5.4% | 4.9% |
| Interquartile 25% (IQ1) | 4.6% | 4.5% |
| Interquartile 75% (IQ3) | 7.0% | 5.5% |
| Interquartile Range (IQR) | 2.4% | 1.1% |
| Standard Deviation (Sample) | 2.2% | 1.4% |
| Standard Deviation (Population) | 2.2% | 1.3% |
Similar Demographics by Unemployment Among Ages 55 to 59 years
Demographics Similar to Blacks/African Americans by Unemployment Among Ages 55 to 59 years
In terms of unemployment among ages 55 to 59 years, the demographic groups most similar to Blacks/African Americans are Immigrants from Portugal (5.5%, a difference of 0.17%), Immigrants from Cabo Verde (5.5%, a difference of 0.29%), Immigrants from Belize (5.5%, a difference of 0.51%), Marshallese (5.5%, a difference of 0.52%), and Sierra Leonean (5.5%, a difference of 0.53%).
| Demographics | Rating | Rank | Unemployment Among Ages 55 to 59 years |
| Immigrants | Mexico | 0.0 /100 | #297 | Tragic 5.3% |
| Hispanics or Latinos | 0.0 /100 | #298 | Tragic 5.4% |
| Cape Verdeans | 0.0 /100 | #299 | Tragic 5.4% |
| Immigrants | St. Vincent and the Grenadines | 0.0 /100 | #300 | Tragic 5.4% |
| Immigrants | Dominica | 0.0 /100 | #301 | Tragic 5.5% |
| Sierra Leoneans | 0.0 /100 | #302 | Tragic 5.5% |
| Marshallese | 0.0 /100 | #303 | Tragic 5.5% |
| Blacks/African Americans | 0.0 /100 | #304 | Tragic 5.5% |
| Immigrants | Portugal | 0.0 /100 | #305 | Tragic 5.5% |
| Immigrants | Cabo Verde | 0.0 /100 | #306 | Tragic 5.5% |
| Immigrants | Belize | 0.0 /100 | #307 | Tragic 5.5% |
| Spanish American Indians | 0.0 /100 | #308 | Tragic 5.6% |
| Nepalese | 0.0 /100 | #309 | Tragic 5.6% |
| Belizeans | 0.0 /100 | #310 | Tragic 5.6% |
| Houma | 0.0 /100 | #311 | Tragic 5.6% |
Demographics Similar to Immigrants by Unemployment Among Ages 55 to 59 years
In terms of unemployment among ages 55 to 59 years, the demographic groups most similar to Immigrants are Albanian (5.0%, a difference of 0.080%), Cherokee (5.0%, a difference of 0.14%), Immigrants from Syria (5.0%, a difference of 0.17%), Immigrants from Southern Europe (5.0%, a difference of 0.24%), and Immigrants from Western Asia (5.0%, a difference of 0.27%).
| Demographics | Rating | Rank | Unemployment Among Ages 55 to 59 years |
| Immigrants | China | 4.2 /100 | #226 | Tragic 5.0% |
| Immigrants | Iran | 3.7 /100 | #227 | Tragic 5.0% |
| Immigrants | Liberia | 3.2 /100 | #228 | Tragic 5.0% |
| Immigrants | Western Asia | 3.0 /100 | #229 | Tragic 5.0% |
| Immigrants | Syria | 2.7 /100 | #230 | Tragic 5.0% |
| Cherokee | 2.6 /100 | #231 | Tragic 5.0% |
| Albanians | 2.5 /100 | #232 | Tragic 5.0% |
| Immigrants | Immigrants | 2.3 /100 | #233 | Tragic 5.0% |
| Immigrants | Southern Europe | 1.8 /100 | #234 | Tragic 5.0% |
| Immigrants | Hong Kong | 1.4 /100 | #235 | Tragic 5.0% |
| Immigrants | Albania | 1.3 /100 | #236 | Tragic 5.0% |
| Choctaw | 1.3 /100 | #237 | Tragic 5.0% |
| Moroccans | 1.3 /100 | #238 | Tragic 5.0% |
| French American Indians | 1.2 /100 | #239 | Tragic 5.0% |
| Immigrants | Costa Rica | 1.1 /100 | #240 | Tragic 5.0% |