Bermudan vs Immigrants from Lithuania Female Unemployment
COMPARE
Bermudan
Immigrants from Lithuania
Female Unemployment
Female Unemployment Comparison
Bermudans
Immigrants from Lithuania
5.4%
FEMALE UNEMPLOYMENT
9.0/ 100
METRIC RATING
218th/ 347
METRIC RANK
4.9%
FEMALE UNEMPLOYMENT
98.8/ 100
METRIC RATING
58th/ 347
METRIC RANK
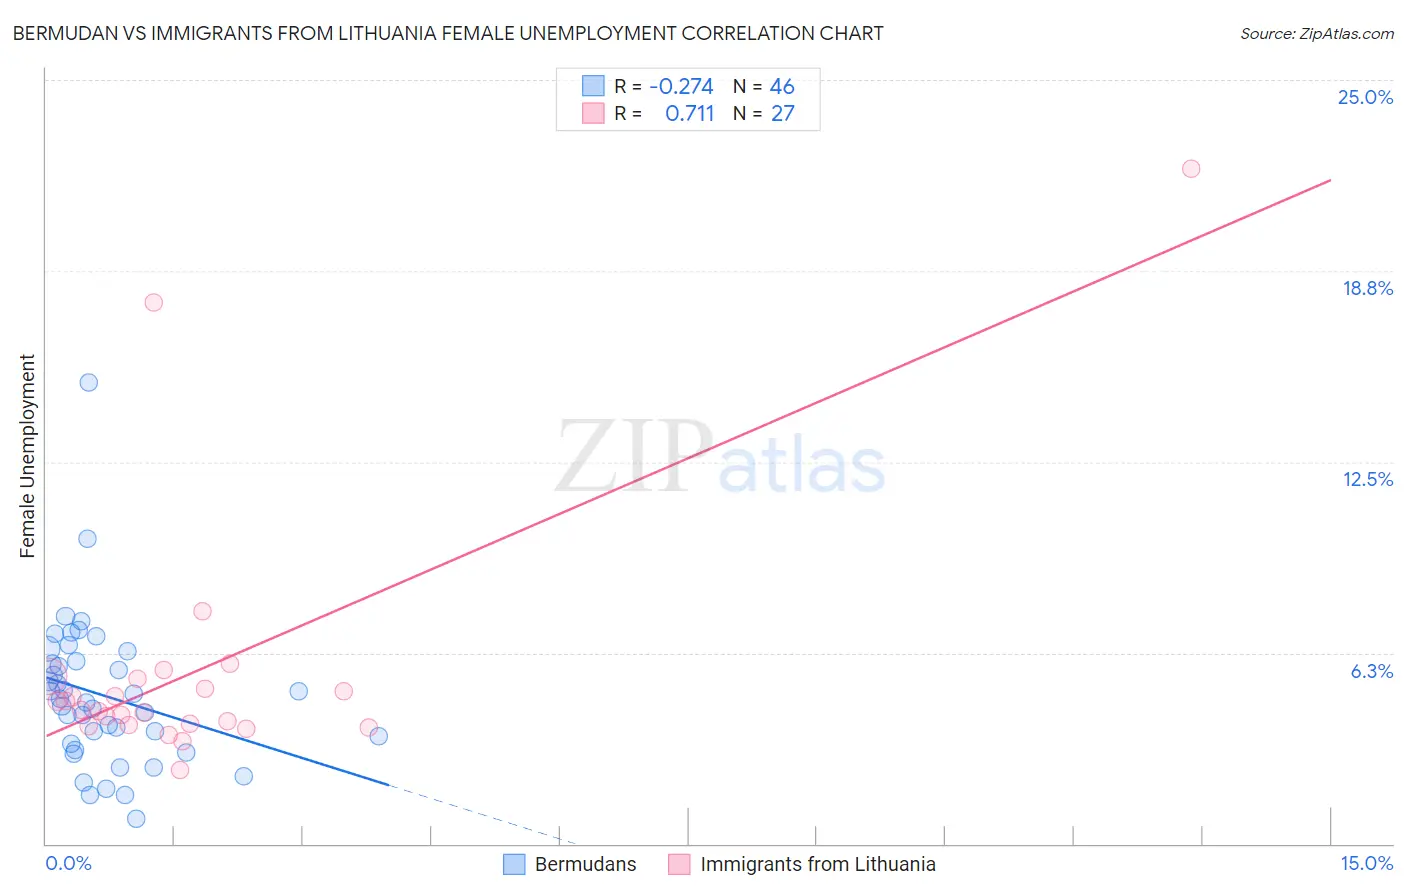
Bermudan vs Immigrants from Lithuania Female Unemployment Correlation Chart
The statistical analysis conducted on geographies consisting of 55,695,435 people shows a weak negative correlation between the proportion of Bermudans and unemploymnet rate among females in the United States with a correlation coefficient (R) of -0.274 and weighted average of 5.4%. Similarly, the statistical analysis conducted on geographies consisting of 117,604,968 people shows a strong positive correlation between the proportion of Immigrants from Lithuania and unemploymnet rate among females in the United States with a correlation coefficient (R) of 0.711 and weighted average of 4.9%, a difference of 10.7%.
Female Unemployment Correlation Summary
| Measurement | Bermudan | Immigrants from Lithuania |
| Minimum | 0.80% | 2.4% |
| Maximum | 15.1% | 22.1% |
| Range | 14.3% | 19.7% |
| Mean | 4.8% | 5.7% |
| Median | 4.7% | 4.4% |
| Interquartile 25% (IQ1) | 3.3% | 3.9% |
| Interquartile 75% (IQ3) | 6.0% | 5.4% |
| Interquartile Range (IQR) | 2.7% | 1.5% |
| Standard Deviation (Sample) | 2.4% | 4.3% |
| Standard Deviation (Population) | 2.4% | 4.2% |
Similar Demographics by Female Unemployment
Demographics Similar to Bermudans by Female Unemployment
In terms of female unemployment, the demographic groups most similar to Bermudans are South American (5.4%, a difference of 0.070%), Immigrants from Africa (5.4%, a difference of 0.090%), Peruvian (5.4%, a difference of 0.10%), Comanche (5.4%, a difference of 0.17%), and Immigrants from Nicaragua (5.4%, a difference of 0.19%).
| Demographics | Rating | Rank | Female Unemployment |
| Ottawa | 11.6 /100 | #211 | Poor 5.4% |
| Uruguayans | 11.4 /100 | #212 | Poor 5.4% |
| Samoans | 10.6 /100 | #213 | Poor 5.4% |
| Seminole | 10.3 /100 | #214 | Poor 5.4% |
| Immigrants | Nicaragua | 10.2 /100 | #215 | Poor 5.4% |
| Comanche | 10.0 /100 | #216 | Poor 5.4% |
| Peruvians | 9.6 /100 | #217 | Tragic 5.4% |
| Bermudans | 9.0 /100 | #218 | Tragic 5.4% |
| South Americans | 8.6 /100 | #219 | Tragic 5.4% |
| Immigrants | Africa | 8.5 /100 | #220 | Tragic 5.4% |
| Brazilians | 7.3 /100 | #221 | Tragic 5.5% |
| Nicaraguans | 7.2 /100 | #222 | Tragic 5.5% |
| Delaware | 7.2 /100 | #223 | Tragic 5.5% |
| Iraqis | 7.1 /100 | #224 | Tragic 5.5% |
| French American Indians | 6.1 /100 | #225 | Tragic 5.5% |
Demographics Similar to Immigrants from Lithuania by Female Unemployment
In terms of female unemployment, the demographic groups most similar to Immigrants from Lithuania are Icelander (4.9%, a difference of 0.090%), Bhutanese (4.9%, a difference of 0.12%), Immigrants from Scotland (4.9%, a difference of 0.20%), Immigrants from Canada (4.9%, a difference of 0.20%), and Immigrants from Nepal (4.9%, a difference of 0.21%).
| Demographics | Rating | Rank | Female Unemployment |
| Cambodians | 99.1 /100 | #51 | Exceptional 4.9% |
| Slavs | 99.1 /100 | #52 | Exceptional 4.9% |
| Whites/Caucasians | 99.0 /100 | #53 | Exceptional 4.9% |
| Immigrants | Zimbabwe | 99.0 /100 | #54 | Exceptional 4.9% |
| Immigrants | Moldova | 99.0 /100 | #55 | Exceptional 4.9% |
| Serbians | 99.0 /100 | #56 | Exceptional 4.9% |
| Icelanders | 98.8 /100 | #57 | Exceptional 4.9% |
| Immigrants | Lithuania | 98.8 /100 | #58 | Exceptional 4.9% |
| Bhutanese | 98.7 /100 | #59 | Exceptional 4.9% |
| Immigrants | Scotland | 98.6 /100 | #60 | Exceptional 4.9% |
| Immigrants | Canada | 98.6 /100 | #61 | Exceptional 4.9% |
| Immigrants | Nepal | 98.6 /100 | #62 | Exceptional 4.9% |
| Immigrants | Belgium | 98.5 /100 | #63 | Exceptional 4.9% |
| Celtics | 98.5 /100 | #64 | Exceptional 4.9% |
| Immigrants | North America | 98.3 /100 | #65 | Exceptional 4.9% |