Immigrants from Uganda vs Immigrants from Lithuania Female Unemployment
COMPARE
Immigrants from Uganda
Immigrants from Lithuania
Female Unemployment
Female Unemployment Comparison
Immigrants from Uganda
Immigrants from Lithuania
5.3%
FEMALE UNEMPLOYMENT
50.7/ 100
METRIC RATING
172nd/ 347
METRIC RANK
4.9%
FEMALE UNEMPLOYMENT
98.8/ 100
METRIC RATING
58th/ 347
METRIC RANK
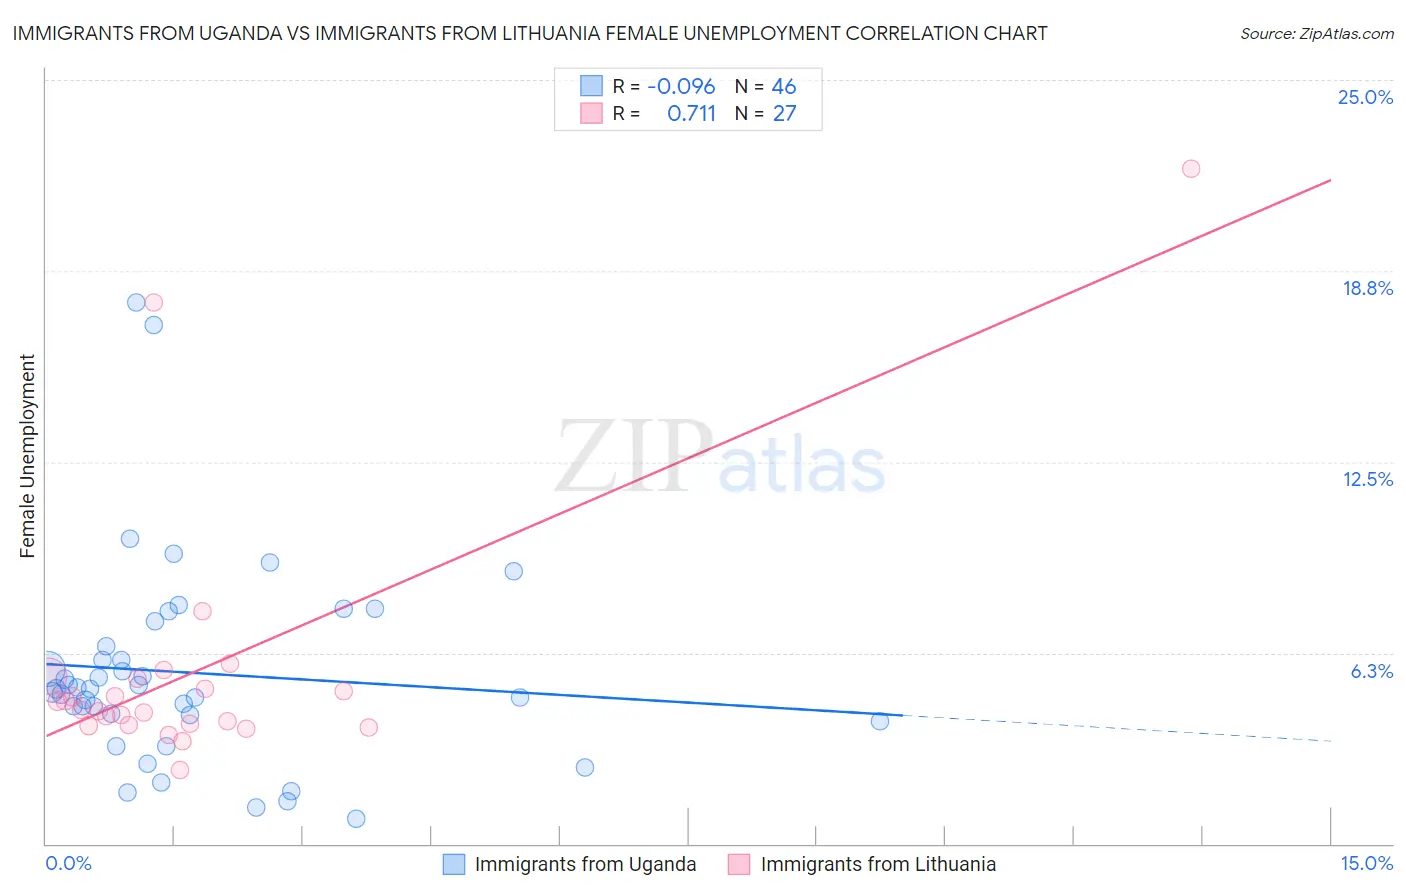
Immigrants from Uganda vs Immigrants from Lithuania Female Unemployment Correlation Chart
The statistical analysis conducted on geographies consisting of 125,901,956 people shows a slight negative correlation between the proportion of Immigrants from Uganda and unemploymnet rate among females in the United States with a correlation coefficient (R) of -0.096 and weighted average of 5.3%. Similarly, the statistical analysis conducted on geographies consisting of 117,604,968 people shows a strong positive correlation between the proportion of Immigrants from Lithuania and unemploymnet rate among females in the United States with a correlation coefficient (R) of 0.711 and weighted average of 4.9%, a difference of 7.0%.
Female Unemployment Correlation Summary
| Measurement | Immigrants from Uganda | Immigrants from Lithuania |
| Minimum | 0.80% | 2.4% |
| Maximum | 17.7% | 22.1% |
| Range | 16.9% | 19.7% |
| Mean | 5.6% | 5.7% |
| Median | 5.1% | 4.4% |
| Interquartile 25% (IQ1) | 4.2% | 3.9% |
| Interquartile 75% (IQ3) | 6.5% | 5.4% |
| Interquartile Range (IQR) | 2.3% | 1.5% |
| Standard Deviation (Sample) | 3.4% | 4.3% |
| Standard Deviation (Population) | 3.3% | 4.2% |
Similar Demographics by Female Unemployment
Demographics Similar to Immigrants from Uganda by Female Unemployment
In terms of female unemployment, the demographic groups most similar to Immigrants from Uganda are Iranian (5.3%, a difference of 0.020%), Immigrants from Poland (5.3%, a difference of 0.040%), Immigrants from Laos (5.3%, a difference of 0.19%), Immigrants from Vietnam (5.3%, a difference of 0.19%), and Immigrants from Morocco (5.3%, a difference of 0.20%).
| Demographics | Rating | Rank | Female Unemployment |
| Syrians | 62.8 /100 | #165 | Good 5.2% |
| Native Hawaiians | 62.7 /100 | #166 | Good 5.2% |
| Immigrants | Thailand | 62.1 /100 | #167 | Good 5.2% |
| Sri Lankans | 59.4 /100 | #168 | Average 5.2% |
| Immigrants | Chile | 59.0 /100 | #169 | Average 5.2% |
| Spanish | 55.9 /100 | #170 | Average 5.2% |
| Immigrants | Denmark | 55.0 /100 | #171 | Average 5.2% |
| Immigrants | Uganda | 50.7 /100 | #172 | Average 5.3% |
| Iranians | 50.4 /100 | #173 | Average 5.3% |
| Immigrants | Poland | 50.0 /100 | #174 | Average 5.3% |
| Immigrants | Laos | 47.5 /100 | #175 | Average 5.3% |
| Immigrants | Vietnam | 47.5 /100 | #176 | Average 5.3% |
| Immigrants | Morocco | 47.4 /100 | #177 | Average 5.3% |
| Immigrants | Southern Europe | 46.2 /100 | #178 | Average 5.3% |
| Laotians | 45.1 /100 | #179 | Average 5.3% |
Demographics Similar to Immigrants from Lithuania by Female Unemployment
In terms of female unemployment, the demographic groups most similar to Immigrants from Lithuania are Icelander (4.9%, a difference of 0.090%), Bhutanese (4.9%, a difference of 0.12%), Immigrants from Scotland (4.9%, a difference of 0.20%), Immigrants from Canada (4.9%, a difference of 0.20%), and Immigrants from Nepal (4.9%, a difference of 0.21%).
| Demographics | Rating | Rank | Female Unemployment |
| Cambodians | 99.1 /100 | #51 | Exceptional 4.9% |
| Slavs | 99.1 /100 | #52 | Exceptional 4.9% |
| Whites/Caucasians | 99.0 /100 | #53 | Exceptional 4.9% |
| Immigrants | Zimbabwe | 99.0 /100 | #54 | Exceptional 4.9% |
| Immigrants | Moldova | 99.0 /100 | #55 | Exceptional 4.9% |
| Serbians | 99.0 /100 | #56 | Exceptional 4.9% |
| Icelanders | 98.8 /100 | #57 | Exceptional 4.9% |
| Immigrants | Lithuania | 98.8 /100 | #58 | Exceptional 4.9% |
| Bhutanese | 98.7 /100 | #59 | Exceptional 4.9% |
| Immigrants | Scotland | 98.6 /100 | #60 | Exceptional 4.9% |
| Immigrants | Canada | 98.6 /100 | #61 | Exceptional 4.9% |
| Immigrants | Nepal | 98.6 /100 | #62 | Exceptional 4.9% |
| Immigrants | Belgium | 98.5 /100 | #63 | Exceptional 4.9% |
| Celtics | 98.5 /100 | #64 | Exceptional 4.9% |
| Immigrants | North America | 98.3 /100 | #65 | Exceptional 4.9% |