Bermudan vs Immigrants from Cabo Verde Female Unemployment
COMPARE
Bermudan
Immigrants from Cabo Verde
Female Unemployment
Female Unemployment Comparison
Bermudans
Immigrants from Cabo Verde
5.4%
FEMALE UNEMPLOYMENT
9.0/ 100
METRIC RATING
218th/ 347
METRIC RANK
6.1%
FEMALE UNEMPLOYMENT
0.0/ 100
METRIC RATING
285th/ 347
METRIC RANK
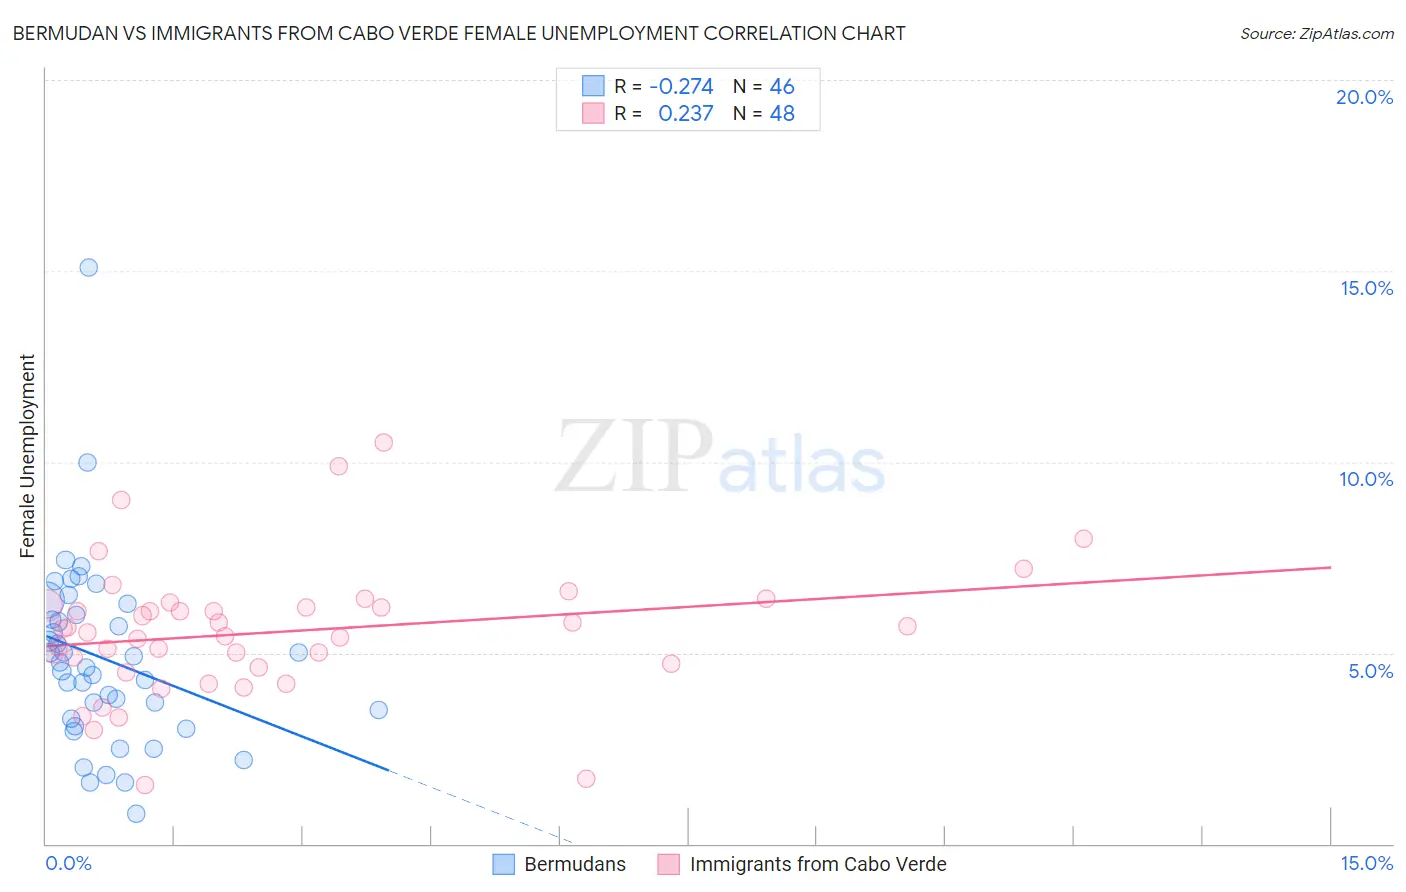
Bermudan vs Immigrants from Cabo Verde Female Unemployment Correlation Chart
The statistical analysis conducted on geographies consisting of 55,695,435 people shows a weak negative correlation between the proportion of Bermudans and unemploymnet rate among females in the United States with a correlation coefficient (R) of -0.274 and weighted average of 5.4%. Similarly, the statistical analysis conducted on geographies consisting of 38,081,993 people shows a weak positive correlation between the proportion of Immigrants from Cabo Verde and unemploymnet rate among females in the United States with a correlation coefficient (R) of 0.237 and weighted average of 6.1%, a difference of 11.8%.
Female Unemployment Correlation Summary
| Measurement | Bermudan | Immigrants from Cabo Verde |
| Minimum | 0.80% | 1.5% |
| Maximum | 15.1% | 10.5% |
| Range | 14.3% | 9.0% |
| Mean | 4.8% | 5.5% |
| Median | 4.7% | 5.6% |
| Interquartile 25% (IQ1) | 3.3% | 4.7% |
| Interquartile 75% (IQ3) | 6.0% | 6.2% |
| Interquartile Range (IQR) | 2.7% | 1.6% |
| Standard Deviation (Sample) | 2.4% | 1.7% |
| Standard Deviation (Population) | 2.4% | 1.7% |
Similar Demographics by Female Unemployment
Demographics Similar to Bermudans by Female Unemployment
In terms of female unemployment, the demographic groups most similar to Bermudans are South American (5.4%, a difference of 0.070%), Immigrants from Africa (5.4%, a difference of 0.090%), Peruvian (5.4%, a difference of 0.10%), Comanche (5.4%, a difference of 0.17%), and Immigrants from Nicaragua (5.4%, a difference of 0.19%).
| Demographics | Rating | Rank | Female Unemployment |
| Ottawa | 11.6 /100 | #211 | Poor 5.4% |
| Uruguayans | 11.4 /100 | #212 | Poor 5.4% |
| Samoans | 10.6 /100 | #213 | Poor 5.4% |
| Seminole | 10.3 /100 | #214 | Poor 5.4% |
| Immigrants | Nicaragua | 10.2 /100 | #215 | Poor 5.4% |
| Comanche | 10.0 /100 | #216 | Poor 5.4% |
| Peruvians | 9.6 /100 | #217 | Tragic 5.4% |
| Bermudans | 9.0 /100 | #218 | Tragic 5.4% |
| South Americans | 8.6 /100 | #219 | Tragic 5.4% |
| Immigrants | Africa | 8.5 /100 | #220 | Tragic 5.4% |
| Brazilians | 7.3 /100 | #221 | Tragic 5.5% |
| Nicaraguans | 7.2 /100 | #222 | Tragic 5.5% |
| Delaware | 7.2 /100 | #223 | Tragic 5.5% |
| Iraqis | 7.1 /100 | #224 | Tragic 5.5% |
| French American Indians | 6.1 /100 | #225 | Tragic 5.5% |
Demographics Similar to Immigrants from Cabo Verde by Female Unemployment
In terms of female unemployment, the demographic groups most similar to Immigrants from Cabo Verde are Chippewa (6.1%, a difference of 0.030%), Immigrants from Guatemala (6.1%, a difference of 0.050%), Haitian (6.1%, a difference of 0.10%), Trinidadian and Tobagonian (6.1%, a difference of 0.11%), and Immigrants from Caribbean (6.1%, a difference of 0.17%).
| Demographics | Rating | Rank | Female Unemployment |
| Yaqui | 0.0 /100 | #278 | Tragic 6.0% |
| Armenians | 0.0 /100 | #279 | Tragic 6.0% |
| Mexican American Indians | 0.0 /100 | #280 | Tragic 6.0% |
| Guatemalans | 0.0 /100 | #281 | Tragic 6.0% |
| Colville | 0.0 /100 | #282 | Tragic 6.0% |
| Salvadorans | 0.0 /100 | #283 | Tragic 6.0% |
| Immigrants | Senegal | 0.0 /100 | #284 | Tragic 6.1% |
| Immigrants | Cabo Verde | 0.0 /100 | #285 | Tragic 6.1% |
| Chippewa | 0.0 /100 | #286 | Tragic 6.1% |
| Immigrants | Guatemala | 0.0 /100 | #287 | Tragic 6.1% |
| Haitians | 0.0 /100 | #288 | Tragic 6.1% |
| Trinidadians and Tobagonians | 0.0 /100 | #289 | Tragic 6.1% |
| Immigrants | Caribbean | 0.0 /100 | #290 | Tragic 6.1% |
| Immigrants | West Indies | 0.0 /100 | #291 | Tragic 6.1% |
| Immigrants | Trinidad and Tobago | 0.0 /100 | #292 | Tragic 6.1% |