Afghan vs Immigrants from Fiji Male Unemployment
COMPARE
Afghan
Immigrants from Fiji
Male Unemployment
Male Unemployment Comparison
Afghans
Immigrants from Fiji
5.3%
MALE UNEMPLOYMENT
62.0/ 100
METRIC RATING
164th/ 347
METRIC RANK
6.1%
MALE UNEMPLOYMENT
0.0/ 100
METRIC RATING
278th/ 347
METRIC RANK
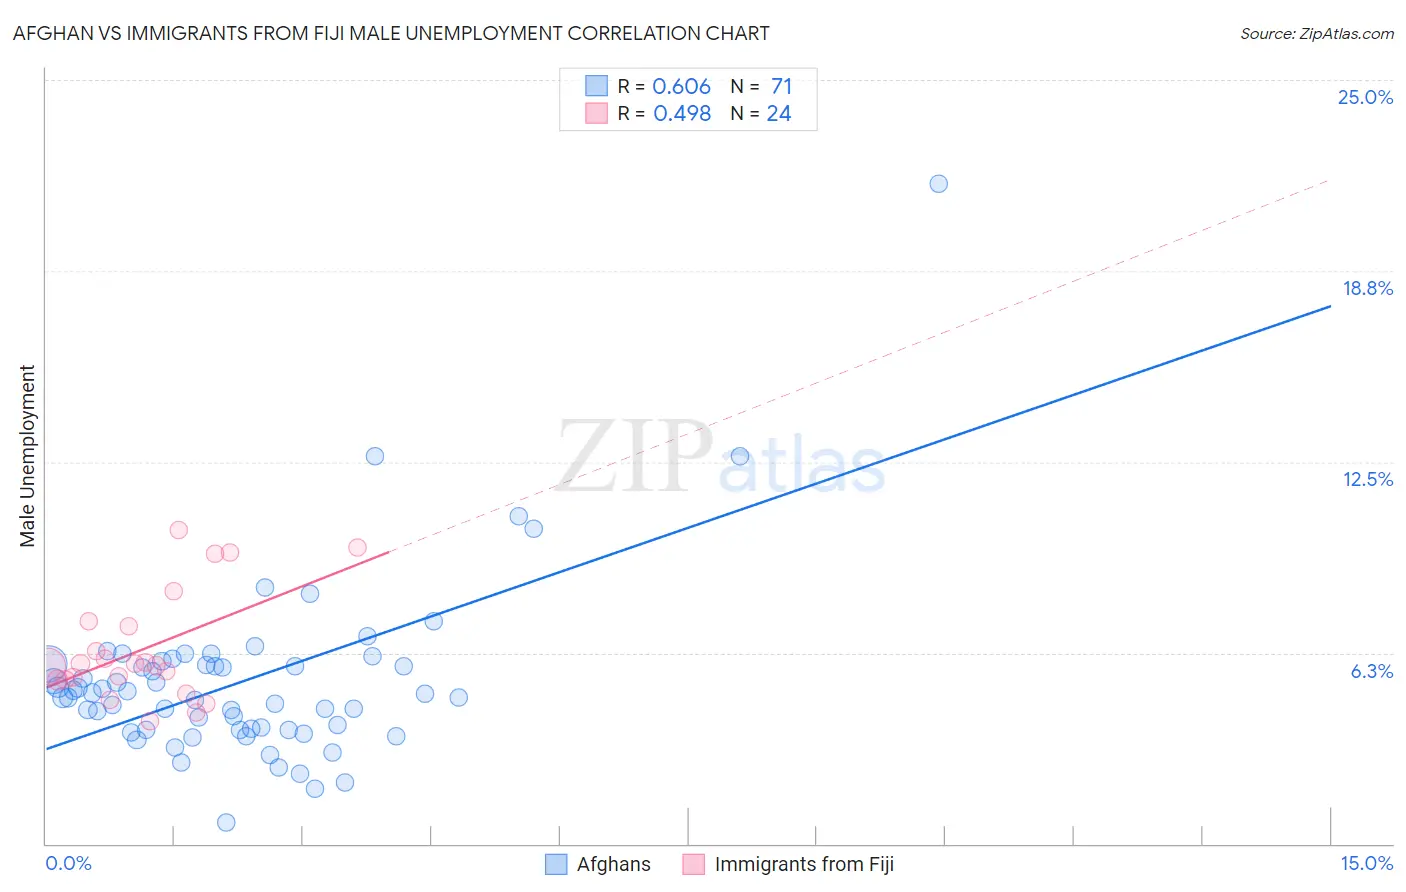
Afghan vs Immigrants from Fiji Male Unemployment Correlation Chart
The statistical analysis conducted on geographies consisting of 148,819,810 people shows a significant positive correlation between the proportion of Afghans and unemployment rate among males in the United States with a correlation coefficient (R) of 0.606 and weighted average of 5.3%. Similarly, the statistical analysis conducted on geographies consisting of 93,715,426 people shows a moderate positive correlation between the proportion of Immigrants from Fiji and unemployment rate among males in the United States with a correlation coefficient (R) of 0.498 and weighted average of 6.1%, a difference of 15.3%.
Male Unemployment Correlation Summary
| Measurement | Afghan | Immigrants from Fiji |
| Minimum | 0.70% | 4.0% |
| Maximum | 21.6% | 10.3% |
| Range | 20.9% | 6.3% |
| Mean | 5.3% | 6.4% |
| Median | 4.9% | 5.9% |
| Interquartile 25% (IQ1) | 3.7% | 5.4% |
| Interquartile 75% (IQ3) | 5.9% | 7.2% |
| Interquartile Range (IQR) | 2.1% | 1.8% |
| Standard Deviation (Sample) | 2.9% | 1.8% |
| Standard Deviation (Population) | 2.9% | 1.8% |
Similar Demographics by Male Unemployment
Demographics Similar to Afghans by Male Unemployment
In terms of male unemployment, the demographic groups most similar to Afghans are South American (5.3%, a difference of 0.080%), Immigrants from Morocco (5.3%, a difference of 0.11%), Immigrants from Vietnam (5.3%, a difference of 0.23%), Immigrants from Hong Kong (5.2%, a difference of 0.24%), and Immigrants from Egypt (5.2%, a difference of 0.25%).
| Demographics | Rating | Rank | Male Unemployment |
| Immigrants | Northern Africa | 72.3 /100 | #157 | Good 5.2% |
| Immigrants | Indonesia | 71.5 /100 | #158 | Good 5.2% |
| Indonesians | 71.2 /100 | #159 | Good 5.2% |
| Immigrants | Norway | 71.0 /100 | #160 | Good 5.2% |
| Immigrants | China | 70.6 /100 | #161 | Good 5.2% |
| Immigrants | Egypt | 65.9 /100 | #162 | Good 5.2% |
| Immigrants | Hong Kong | 65.7 /100 | #163 | Good 5.2% |
| Afghans | 62.0 /100 | #164 | Good 5.3% |
| South Americans | 60.6 /100 | #165 | Good 5.3% |
| Immigrants | Morocco | 60.2 /100 | #166 | Good 5.3% |
| Immigrants | Vietnam | 58.1 /100 | #167 | Average 5.3% |
| Immigrants | Ireland | 57.7 /100 | #168 | Average 5.3% |
| Immigrants | Congo | 57.4 /100 | #169 | Average 5.3% |
| Immigrants | Eastern Europe | 54.1 /100 | #170 | Average 5.3% |
| Peruvians | 51.9 /100 | #171 | Average 5.3% |
Demographics Similar to Immigrants from Fiji by Male Unemployment
In terms of male unemployment, the demographic groups most similar to Immigrants from Fiji are Immigrants from Liberia (6.1%, a difference of 0.12%), Ghanaian (6.1%, a difference of 0.50%), Tlingit-Haida (6.0%, a difference of 0.55%), Menominee (6.0%, a difference of 0.64%), and Immigrants from Sierra Leone (6.0%, a difference of 0.80%).
| Demographics | Rating | Rank | Male Unemployment |
| Blackfeet | 0.0 /100 | #271 | Tragic 6.0% |
| Immigrants | Uzbekistan | 0.0 /100 | #272 | Tragic 6.0% |
| Armenians | 0.0 /100 | #273 | Tragic 6.0% |
| Immigrants | Sierra Leone | 0.0 /100 | #274 | Tragic 6.0% |
| Menominee | 0.0 /100 | #275 | Tragic 6.0% |
| Tlingit-Haida | 0.0 /100 | #276 | Tragic 6.0% |
| Immigrants | Liberia | 0.0 /100 | #277 | Tragic 6.1% |
| Immigrants | Fiji | 0.0 /100 | #278 | Tragic 6.1% |
| Ghanaians | 0.0 /100 | #279 | Tragic 6.1% |
| Immigrants | Ghana | 0.0 /100 | #280 | Tragic 6.2% |
| Sierra Leoneans | 0.0 /100 | #281 | Tragic 6.2% |
| Ecuadorians | 0.0 /100 | #282 | Tragic 6.2% |
| Immigrants | Western Africa | 0.0 /100 | #283 | Tragic 6.2% |
| Spanish American Indians | 0.0 /100 | #284 | Tragic 6.2% |
| Immigrants | Ecuador | 0.0 /100 | #285 | Tragic 6.2% |