Afghan vs Canadian Male Unemployment
COMPARE
Afghan
Canadian
Male Unemployment
Male Unemployment Comparison
Afghans
Canadians
5.3%
MALE UNEMPLOYMENT
62.0/ 100
METRIC RATING
164th/ 347
METRIC RANK
5.1%
MALE UNEMPLOYMENT
94.1/ 100
METRIC RATING
94th/ 347
METRIC RANK
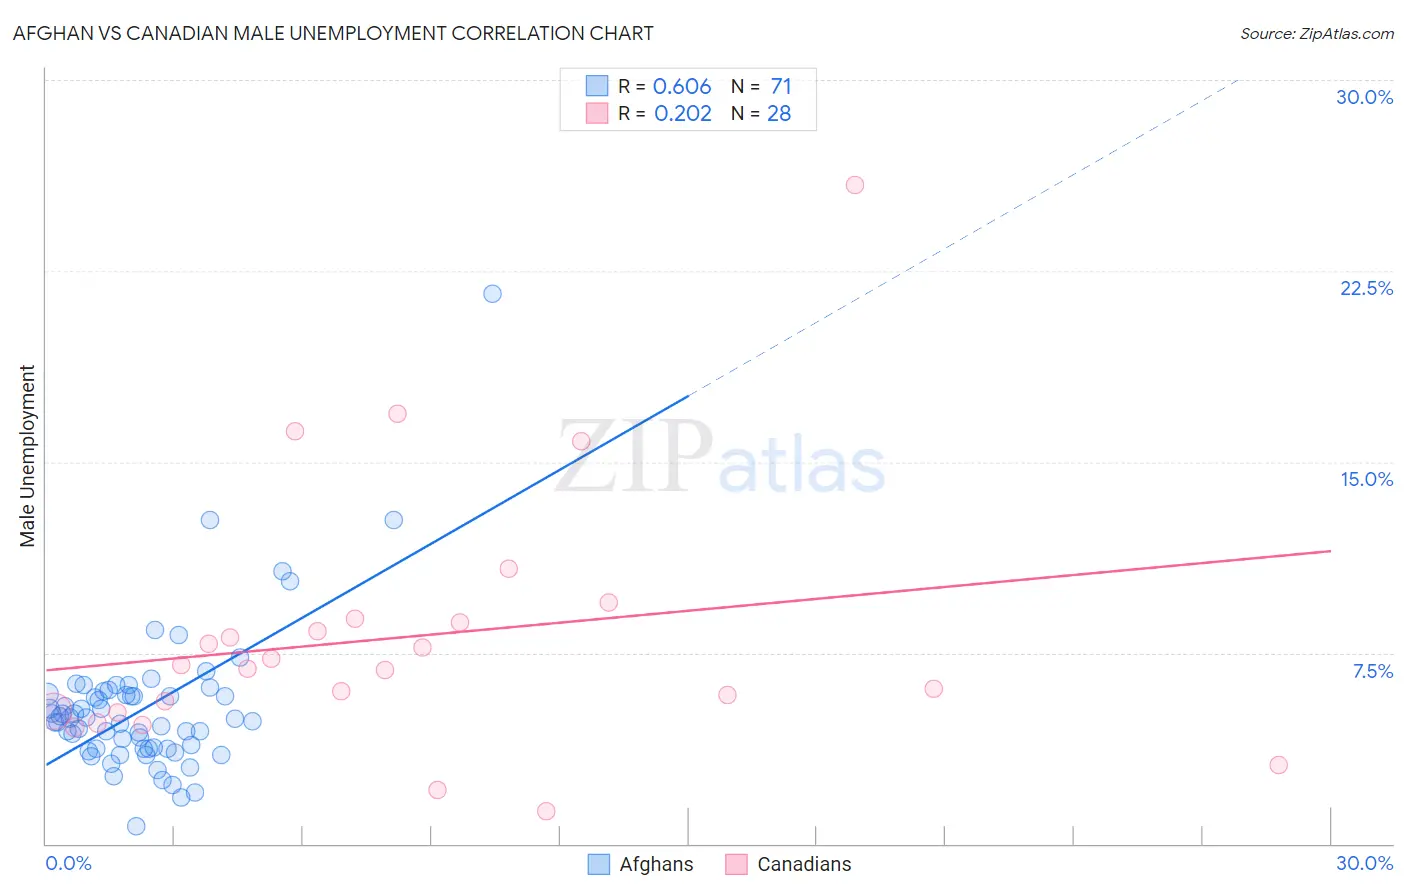
Afghan vs Canadian Male Unemployment Correlation Chart
The statistical analysis conducted on geographies consisting of 148,819,810 people shows a significant positive correlation between the proportion of Afghans and unemployment rate among males in the United States with a correlation coefficient (R) of 0.606 and weighted average of 5.3%. Similarly, the statistical analysis conducted on geographies consisting of 434,702,857 people shows a weak positive correlation between the proportion of Canadians and unemployment rate among males in the United States with a correlation coefficient (R) of 0.202 and weighted average of 5.1%, a difference of 3.5%.
Male Unemployment Correlation Summary
| Measurement | Afghan | Canadian |
| Minimum | 0.70% | 1.3% |
| Maximum | 21.6% | 25.9% |
| Range | 20.9% | 24.6% |
| Mean | 5.3% | 8.1% |
| Median | 4.9% | 7.0% |
| Interquartile 25% (IQ1) | 3.7% | 5.2% |
| Interquartile 75% (IQ3) | 5.9% | 8.8% |
| Interquartile Range (IQR) | 2.1% | 3.6% |
| Standard Deviation (Sample) | 2.9% | 5.1% |
| Standard Deviation (Population) | 2.9% | 5.1% |
Similar Demographics by Male Unemployment
Demographics Similar to Afghans by Male Unemployment
In terms of male unemployment, the demographic groups most similar to Afghans are South American (5.3%, a difference of 0.080%), Immigrants from Morocco (5.3%, a difference of 0.11%), Immigrants from Vietnam (5.3%, a difference of 0.23%), Immigrants from Hong Kong (5.2%, a difference of 0.24%), and Immigrants from Egypt (5.2%, a difference of 0.25%).
| Demographics | Rating | Rank | Male Unemployment |
| Immigrants | Northern Africa | 72.3 /100 | #157 | Good 5.2% |
| Immigrants | Indonesia | 71.5 /100 | #158 | Good 5.2% |
| Indonesians | 71.2 /100 | #159 | Good 5.2% |
| Immigrants | Norway | 71.0 /100 | #160 | Good 5.2% |
| Immigrants | China | 70.6 /100 | #161 | Good 5.2% |
| Immigrants | Egypt | 65.9 /100 | #162 | Good 5.2% |
| Immigrants | Hong Kong | 65.7 /100 | #163 | Good 5.2% |
| Afghans | 62.0 /100 | #164 | Good 5.3% |
| South Americans | 60.6 /100 | #165 | Good 5.3% |
| Immigrants | Morocco | 60.2 /100 | #166 | Good 5.3% |
| Immigrants | Vietnam | 58.1 /100 | #167 | Average 5.3% |
| Immigrants | Ireland | 57.7 /100 | #168 | Average 5.3% |
| Immigrants | Congo | 57.4 /100 | #169 | Average 5.3% |
| Immigrants | Eastern Europe | 54.1 /100 | #170 | Average 5.3% |
| Peruvians | 51.9 /100 | #171 | Average 5.3% |
Demographics Similar to Canadians by Male Unemployment
In terms of male unemployment, the demographic groups most similar to Canadians are Slavic (5.1%, a difference of 0.050%), Immigrants from Serbia (5.1%, a difference of 0.050%), Italian (5.1%, a difference of 0.080%), Immigrants from Turkey (5.1%, a difference of 0.10%), and Asian (5.1%, a difference of 0.10%).
| Demographics | Rating | Rank | Male Unemployment |
| Immigrants | Romania | 95.4 /100 | #87 | Exceptional 5.1% |
| Immigrants | Sri Lanka | 94.9 /100 | #88 | Exceptional 5.1% |
| Immigrants | Australia | 94.7 /100 | #89 | Exceptional 5.1% |
| Okinawans | 94.7 /100 | #90 | Exceptional 5.1% |
| Immigrants | Turkey | 94.4 /100 | #91 | Exceptional 5.1% |
| Slavs | 94.2 /100 | #92 | Exceptional 5.1% |
| Immigrants | Serbia | 94.2 /100 | #93 | Exceptional 5.1% |
| Canadians | 94.1 /100 | #94 | Exceptional 5.1% |
| Italians | 93.8 /100 | #95 | Exceptional 5.1% |
| Asians | 93.7 /100 | #96 | Exceptional 5.1% |
| Immigrants | Spain | 93.4 /100 | #97 | Exceptional 5.1% |
| Immigrants | Kuwait | 93.3 /100 | #98 | Exceptional 5.1% |
| Uruguayans | 93.0 /100 | #99 | Exceptional 5.1% |
| Russians | 92.9 /100 | #100 | Exceptional 5.1% |
| German Russians | 92.7 /100 | #101 | Exceptional 5.1% |