Crow vs Immigrants from Fiji Male Unemployment
COMPARE
Crow
Immigrants from Fiji
Male Unemployment
Male Unemployment Comparison
Crow
Immigrants from Fiji
10.6%
MALE UNEMPLOYMENT
0.0/ 100
METRIC RATING
343rd/ 347
METRIC RANK
6.1%
MALE UNEMPLOYMENT
0.0/ 100
METRIC RATING
278th/ 347
METRIC RANK
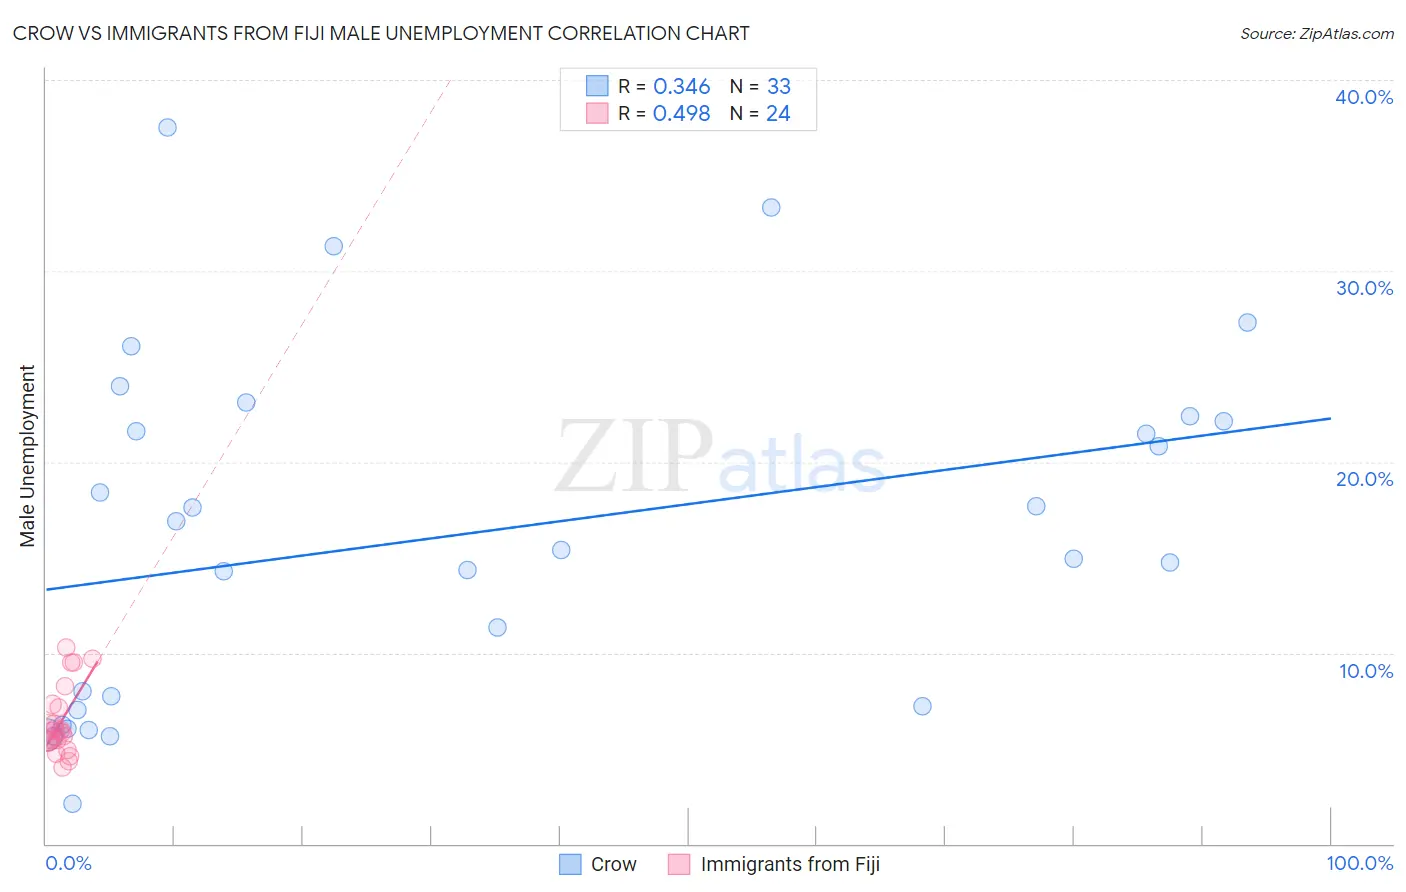
Crow vs Immigrants from Fiji Male Unemployment Correlation Chart
The statistical analysis conducted on geographies consisting of 59,099,043 people shows a mild positive correlation between the proportion of Crow and unemployment rate among males in the United States with a correlation coefficient (R) of 0.346 and weighted average of 10.6%. Similarly, the statistical analysis conducted on geographies consisting of 93,715,426 people shows a moderate positive correlation between the proportion of Immigrants from Fiji and unemployment rate among males in the United States with a correlation coefficient (R) of 0.498 and weighted average of 6.1%, a difference of 75.0%.
Male Unemployment Correlation Summary
| Measurement | Crow | Immigrants from Fiji |
| Minimum | 2.1% | 4.0% |
| Maximum | 37.5% | 10.3% |
| Range | 35.4% | 6.3% |
| Mean | 16.2% | 6.4% |
| Median | 15.4% | 5.9% |
| Interquartile 25% (IQ1) | 7.1% | 5.4% |
| Interquartile 75% (IQ3) | 22.3% | 7.2% |
| Interquartile Range (IQR) | 15.1% | 1.8% |
| Standard Deviation (Sample) | 9.1% | 1.8% |
| Standard Deviation (Population) | 9.0% | 1.8% |
Similar Demographics by Male Unemployment
Demographics Similar to Crow by Male Unemployment
In terms of male unemployment, the demographic groups most similar to Crow are Hopi (10.8%, a difference of 1.7%), Arapaho (11.0%, a difference of 3.7%), Tohono O'odham (10.2%, a difference of 4.4%), Navajo (9.8%, a difference of 7.9%), and Alaskan Athabascan (9.8%, a difference of 8.2%).
| Demographics | Rating | Rank | Male Unemployment |
| Sioux | 0.0 /100 | #333 | Tragic 8.4% |
| Tsimshian | 0.0 /100 | #334 | Tragic 8.5% |
| Pueblo | 0.0 /100 | #335 | Tragic 8.5% |
| Yuman | 0.0 /100 | #336 | Tragic 8.6% |
| Puerto Ricans | 0.0 /100 | #337 | Tragic 8.6% |
| Apache | 0.0 /100 | #338 | Tragic 8.6% |
| Cheyenne | 0.0 /100 | #339 | Tragic 9.8% |
| Alaskan Athabascans | 0.0 /100 | #340 | Tragic 9.8% |
| Navajo | 0.0 /100 | #341 | Tragic 9.8% |
| Tohono O'odham | 0.0 /100 | #342 | Tragic 10.2% |
| Crow | 0.0 /100 | #343 | Tragic 10.6% |
| Hopi | 0.0 /100 | #344 | Tragic 10.8% |
| Arapaho | 0.0 /100 | #345 | Tragic 11.0% |
| Inupiat | 0.0 /100 | #346 | Tragic 12.1% |
| Yup'ik | 0.0 /100 | #347 | Tragic 16.4% |
Demographics Similar to Immigrants from Fiji by Male Unemployment
In terms of male unemployment, the demographic groups most similar to Immigrants from Fiji are Immigrants from Liberia (6.1%, a difference of 0.12%), Ghanaian (6.1%, a difference of 0.50%), Tlingit-Haida (6.0%, a difference of 0.55%), Menominee (6.0%, a difference of 0.64%), and Immigrants from Sierra Leone (6.0%, a difference of 0.80%).
| Demographics | Rating | Rank | Male Unemployment |
| Blackfeet | 0.0 /100 | #271 | Tragic 6.0% |
| Immigrants | Uzbekistan | 0.0 /100 | #272 | Tragic 6.0% |
| Armenians | 0.0 /100 | #273 | Tragic 6.0% |
| Immigrants | Sierra Leone | 0.0 /100 | #274 | Tragic 6.0% |
| Menominee | 0.0 /100 | #275 | Tragic 6.0% |
| Tlingit-Haida | 0.0 /100 | #276 | Tragic 6.0% |
| Immigrants | Liberia | 0.0 /100 | #277 | Tragic 6.1% |
| Immigrants | Fiji | 0.0 /100 | #278 | Tragic 6.1% |
| Ghanaians | 0.0 /100 | #279 | Tragic 6.1% |
| Immigrants | Ghana | 0.0 /100 | #280 | Tragic 6.2% |
| Sierra Leoneans | 0.0 /100 | #281 | Tragic 6.2% |
| Ecuadorians | 0.0 /100 | #282 | Tragic 6.2% |
| Immigrants | Western Africa | 0.0 /100 | #283 | Tragic 6.2% |
| Spanish American Indians | 0.0 /100 | #284 | Tragic 6.2% |
| Immigrants | Ecuador | 0.0 /100 | #285 | Tragic 6.2% |