Zapata, TX Map & Demographics
Zapata Map
Zapata Overview
$21,739
PER CAPITA INCOME
$43,468
AVG FAMILY INCOME
$34,818
AVG HOUSEHOLD INCOME
6.2%
WAGE / INCOME GAP [ % ]
93.8¢/ $1
WAGE / INCOME GAP [ $ ]
0.53
INEQUALITY / GINI INDEX
5,110
TOTAL POPULATION
2,616
MALE POPULATION
2,494
FEMALE POPULATION
104.89
MALES / 100 FEMALES
95.34
FEMALES / 100 MALES
35.1
MEDIAN AGE
3.8
AVG FAMILY SIZE
2.7
AVG HOUSEHOLD SIZE
1,976
LABOR FORCE [ PEOPLE ]
51.3%
PERCENT IN LABOR FORCE
2.1%
UNEMPLOYMENT RATE
Zapata Zip Codes
Zapata Area Codes
Income in Zapata
Income Overview in Zapata
Per Capita Income in Zapata is $21,739, while median incomes of families and households are $43,468 and $34,818 respectively.
| Characteristic | Number | Measure |
| Per Capita Income | 5,110 | $21,739 |
| Median Family Income | 1,050 | $43,468 |
| Mean Family Income | 1,050 | $71,305 |
| Median Household Income | 1,889 | $34,818 |
| Mean Household Income | 1,889 | $55,576 |
| Income Deficit | 1,050 | $0 |
| Wage / Income Gap (%) | 5,110 | 6.19% |
| Wage / Income Gap ($) | 5,110 | 93.81¢ per $1 |
| Gini / Inequality Index | 5,110 | 0.53 |
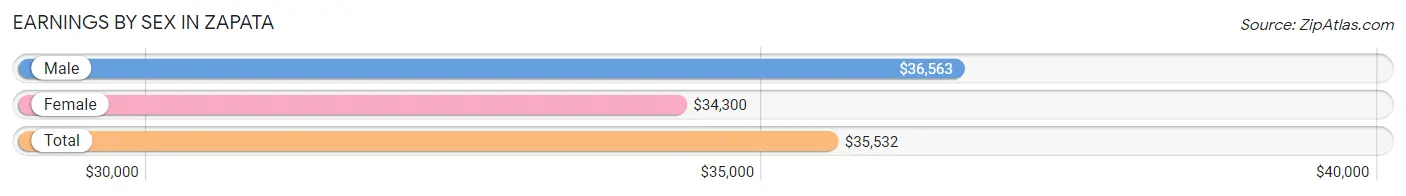
Earnings by Sex in Zapata
Average Earnings in Zapata are $35,532, $36,563 for men and $34,300 for women, a difference of 6.2%.
| Sex | Number | Average Earnings |
| Male | 1,179 (57.8%) | $36,563 |
| Female | 862 (42.2%) | $34,300 |
| Total | 2,041 (100.0%) | $35,532 |
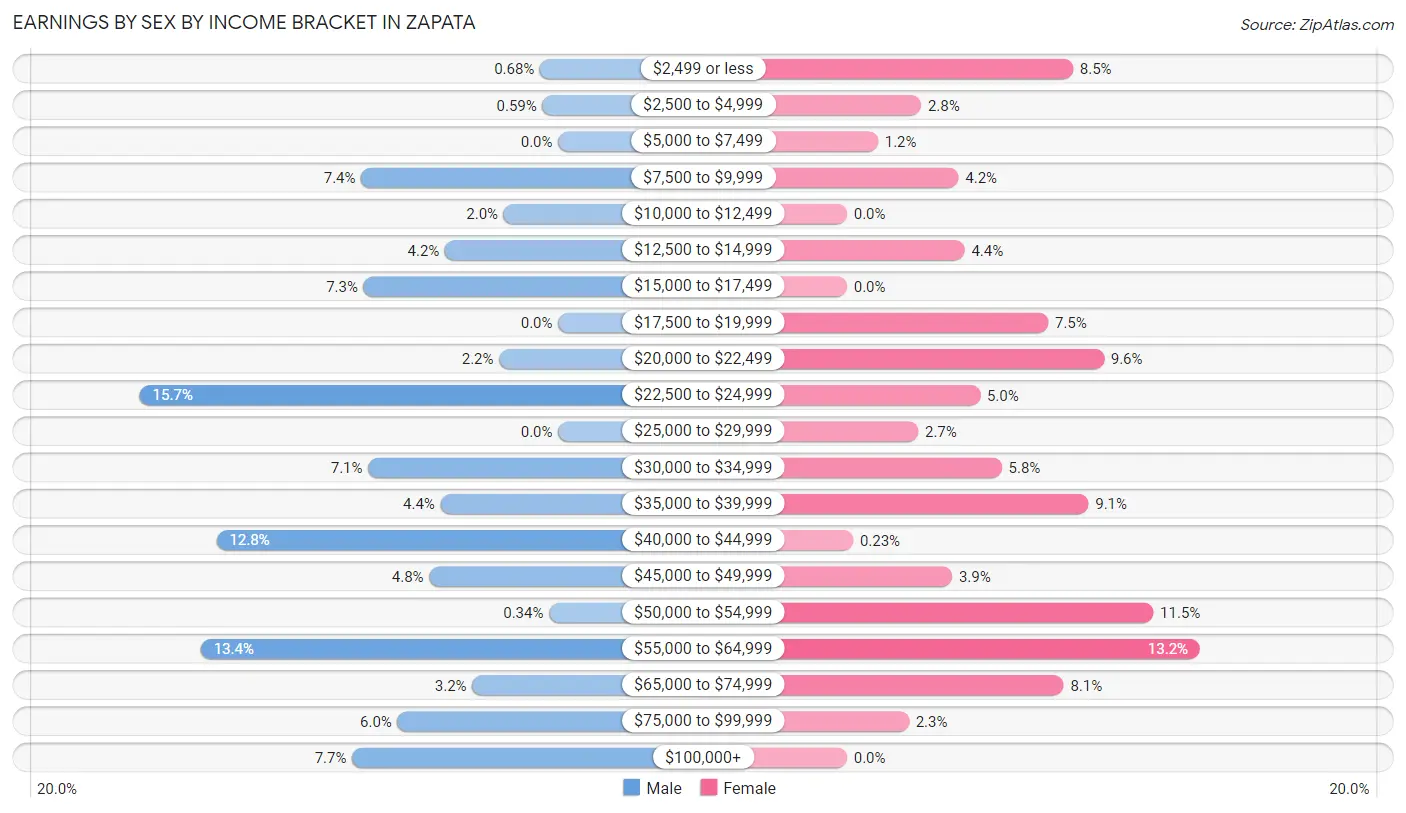
Earnings by Sex by Income Bracket in Zapata
The most common earnings brackets in Zapata are $22,500 to $24,999 for men (185 | 15.7%) and $55,000 to $64,999 for women (114 | 13.2%).
| Income | Male | Female |
| $2,499 or less | 8 (0.7%) | 73 (8.5%) |
| $2,500 to $4,999 | 7 (0.6%) | 24 (2.8%) |
| $5,000 to $7,499 | 0 (0.0%) | 10 (1.2%) |
| $7,500 to $9,999 | 87 (7.4%) | 36 (4.2%) |
| $10,000 to $12,499 | 24 (2.0%) | 0 (0.0%) |
| $12,500 to $14,999 | 50 (4.2%) | 38 (4.4%) |
| $15,000 to $17,499 | 86 (7.3%) | 0 (0.0%) |
| $17,500 to $19,999 | 0 (0.0%) | 65 (7.5%) |
| $20,000 to $22,499 | 26 (2.2%) | 83 (9.6%) |
| $22,500 to $24,999 | 185 (15.7%) | 43 (5.0%) |
| $25,000 to $29,999 | 0 (0.0%) | 23 (2.7%) |
| $30,000 to $34,999 | 84 (7.1%) | 50 (5.8%) |
| $35,000 to $39,999 | 52 (4.4%) | 78 (9.0%) |
| $40,000 to $44,999 | 151 (12.8%) | 2 (0.2%) |
| $45,000 to $49,999 | 57 (4.8%) | 34 (3.9%) |
| $50,000 to $54,999 | 4 (0.3%) | 99 (11.5%) |
| $55,000 to $64,999 | 158 (13.4%) | 114 (13.2%) |
| $65,000 to $74,999 | 38 (3.2%) | 70 (8.1%) |
| $75,000 to $99,999 | 71 (6.0%) | 20 (2.3%) |
| $100,000+ | 91 (7.7%) | 0 (0.0%) |
| Total | 1,179 (100.0%) | 862 (100.0%) |
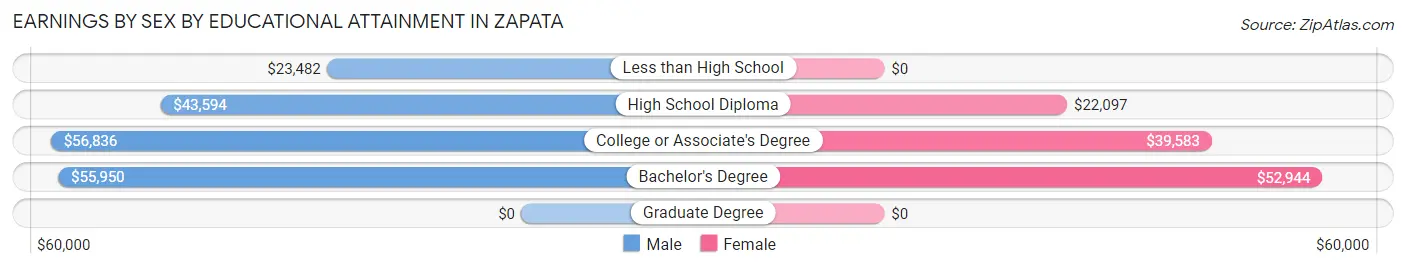
Earnings by Sex by Educational Attainment in Zapata
Average earnings in Zapata are $37,115 for men and $34,900 for women, a difference of 6.0%. Men with an educational attainment of college or associate's degree enjoy the highest average annual earnings of $56,836, while those with less than high school education earn the least with $23,482. Women with an educational attainment of bachelor's degree earn the most with the average annual earnings of $52,944, while those with high school diploma education have the smallest earnings of $22,097.
| Educational Attainment | Male Income | Female Income |
| Less than High School | $23,482 | $0 |
| High School Diploma | $43,594 | $22,097 |
| College or Associate's Degree | $56,836 | $39,583 |
| Bachelor's Degree | $55,950 | $52,944 |
| Graduate Degree | - | - |
| Total | $37,115 | $34,900 |
Family Income in Zapata
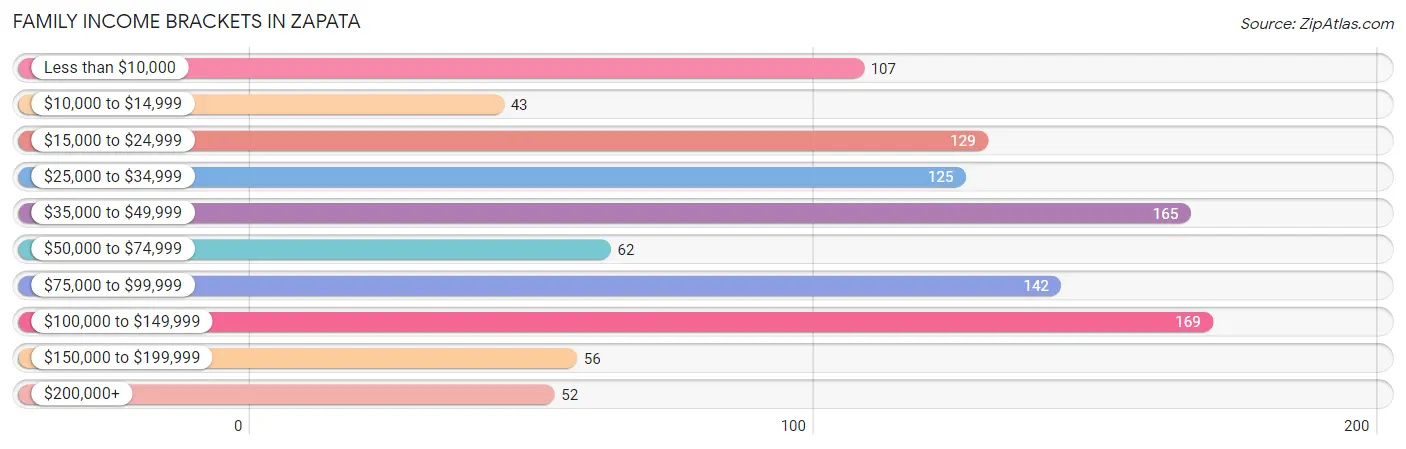
Family Income Brackets in Zapata
According to the Zapata family income data, there are 169 families falling into the $100,000 to $149,999 income range, which is the most common income bracket and makes up 16.1% of all families. Conversely, the $10,000 to $14,999 income bracket is the least frequent group with only 43 families (4.1%) belonging to this category.
| Income Bracket | # Families | % Families |
| Less than $10,000 | 107 | 10.2% |
| $10,000 to $14,999 | 43 | 4.1% |
| $15,000 to $24,999 | 129 | 12.3% |
| $25,000 to $34,999 | 125 | 11.9% |
| $35,000 to $49,999 | 165 | 15.7% |
| $50,000 to $74,999 | 62 | 5.9% |
| $75,000 to $99,999 | 142 | 13.5% |
| $100,000 to $149,999 | 169 | 16.1% |
| $150,000 to $199,999 | 56 | 5.3% |
| $200,000+ | 52 | 5.0% |
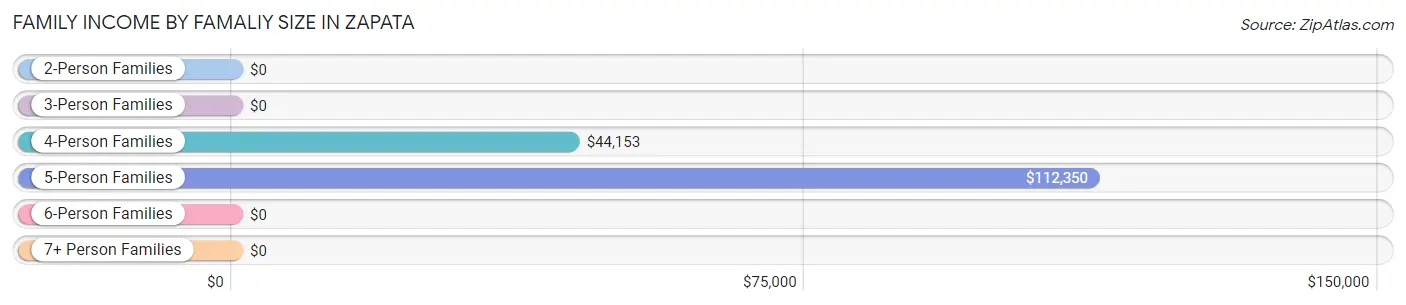
Family Income by Famaliy Size in Zapata
5-person families (129 | 12.3%) account for the highest median family income in Zapata with $112,350 per family, while 5-person families (129 | 12.3%) have the highest median income of $22,470 per family member.
| Income Bracket | # Families | Median Income |
| 2-Person Families | 420 (40.0%) | $0 |
| 3-Person Families | 235 (22.4%) | $0 |
| 4-Person Families | 189 (18.0%) | $44,153 |
| 5-Person Families | 129 (12.3%) | $112,350 |
| 6-Person Families | 13 (1.2%) | $0 |
| 7+ Person Families | 64 (6.1%) | $0 |
| Total | 1,050 (100.0%) | $43,468 |
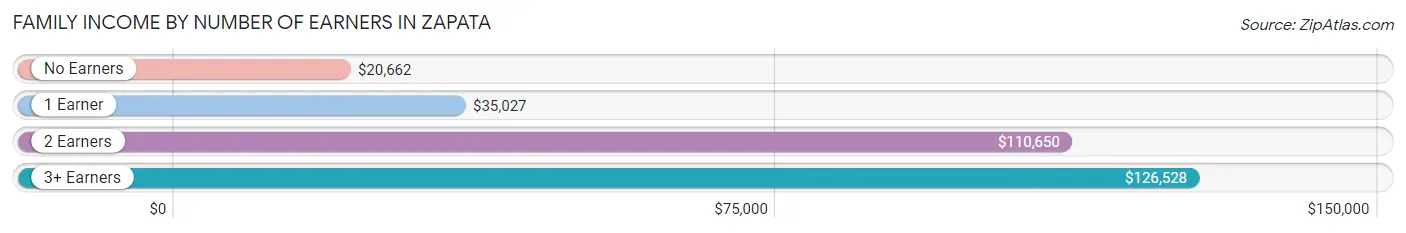
Family Income by Number of Earners in Zapata
The median family income in Zapata is $43,468, with families comprising 3+ earners (47) having the highest median family income of $126,528, while families with no earners (197) have the lowest median family income of $20,662, accounting for 4.5% and 18.8% of families, respectively.
| Number of Earners | # Families | Median Income |
| No Earners | 197 (18.8%) | $20,662 |
| 1 Earner | 385 (36.7%) | $35,027 |
| 2 Earners | 421 (40.1%) | $110,650 |
| 3+ Earners | 47 (4.5%) | $126,528 |
| Total | 1,050 (100.0%) | $43,468 |
Household Income in Zapata
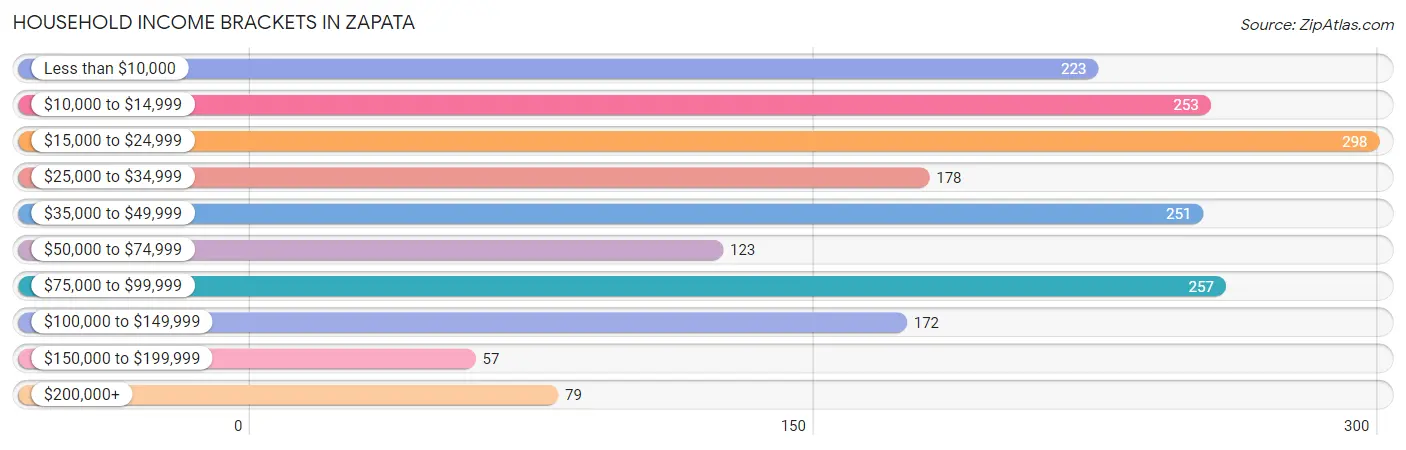
Household Income Brackets in Zapata
With 298 households falling in the category, the $15,000 to $24,999 income range is the most frequent in Zapata, accounting for 15.8% of all households. In contrast, only 57 households (3.0%) fall into the $150,000 to $199,999 income bracket, making it the least populous group.
| Income Bracket | # Households | % Households |
| Less than $10,000 | 223 | 11.8% |
| $10,000 to $14,999 | 253 | 13.4% |
| $15,000 to $24,999 | 298 | 15.8% |
| $25,000 to $34,999 | 178 | 9.4% |
| $35,000 to $49,999 | 251 | 13.3% |
| $50,000 to $74,999 | 123 | 6.5% |
| $75,000 to $99,999 | 257 | 13.6% |
| $100,000 to $149,999 | 172 | 9.1% |
| $150,000 to $199,999 | 57 | 3.0% |
| $200,000+ | 79 | 4.2% |
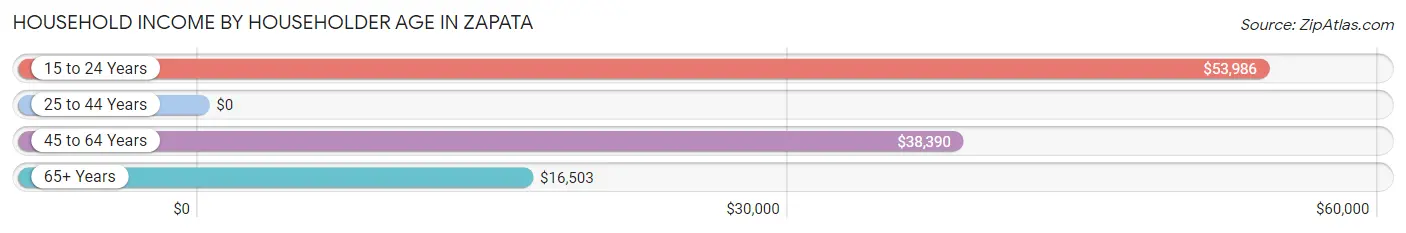
Household Income by Householder Age in Zapata
The median household income in Zapata is $34,818, with the highest median household income of $53,986 found in the 15 to 24 years age bracket for the primary householder. A total of 154 households (8.2%) fall into this category. Meanwhile, the 25 to 44 years age bracket for the primary householder has the lowest median household income of $0, with 396 households (21.0%) in this group.
| Income Bracket | # Households | Median Income |
| 15 to 24 Years | 154 (8.2%) | $53,986 |
| 25 to 44 Years | 396 (21.0%) | $0 |
| 45 to 64 Years | 620 (32.8%) | $38,390 |
| 65+ Years | 719 (38.1%) | $16,503 |
| Total | 1,889 (100.0%) | $34,818 |
Poverty in Zapata
Income Below Poverty by Sex and Age in Zapata
With 26.2% poverty level for males and 26.6% for females among the residents of Zapata, 75 year old and over males and 5 year old females are the most vulnerable to poverty, with 132 males (65.3%) and 43 females (62.3%) in their respective age groups living below the poverty level.
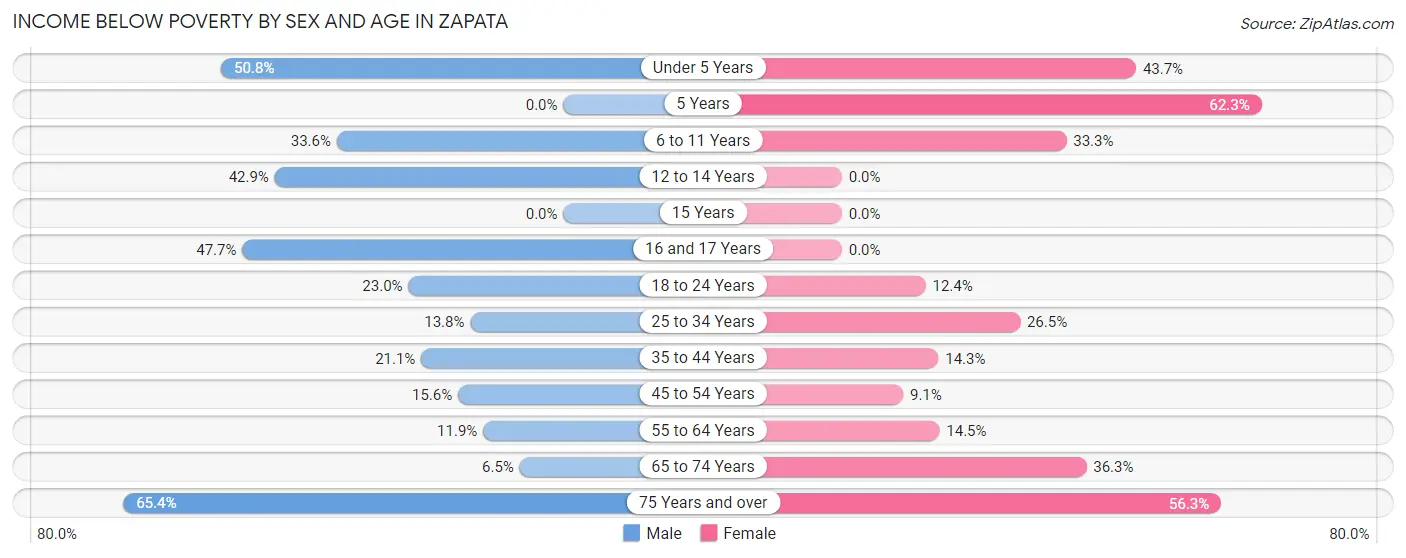
| Age Bracket | Male | Female |
| Under 5 Years | 124 (50.8%) | 83 (43.7%) |
| 5 Years | 0 (0.0%) | 43 (62.3%) |
| 6 to 11 Years | 73 (33.6%) | 119 (33.3%) |
| 12 to 14 Years | 42 (42.9%) | 0 (0.0%) |
| 15 Years | 0 (0.0%) | 0 (0.0%) |
| 16 and 17 Years | 41 (47.7%) | 0 (0.0%) |
| 18 to 24 Years | 75 (23.0%) | 24 (12.4%) |
| 25 to 34 Years | 47 (13.8%) | 77 (26.5%) |
| 35 to 44 Years | 61 (21.1%) | 44 (14.3%) |
| 45 to 54 Years | 33 (15.6%) | 25 (9.1%) |
| 55 to 64 Years | 33 (11.9%) | 31 (14.5%) |
| 65 to 74 Years | 20 (6.5%) | 65 (36.3%) |
| 75 Years and over | 132 (65.3%) | 147 (56.3%) |
| Total | 681 (26.2%) | 658 (26.6%) |
Income Above Poverty by Sex and Age in Zapata
According to the poverty statistics in Zapata, males aged 65 to 74 years and females aged 12 to 14 years are the age groups that are most secure financially, with 93.5% of males and 100.0% of females in these age groups living above the poverty line.
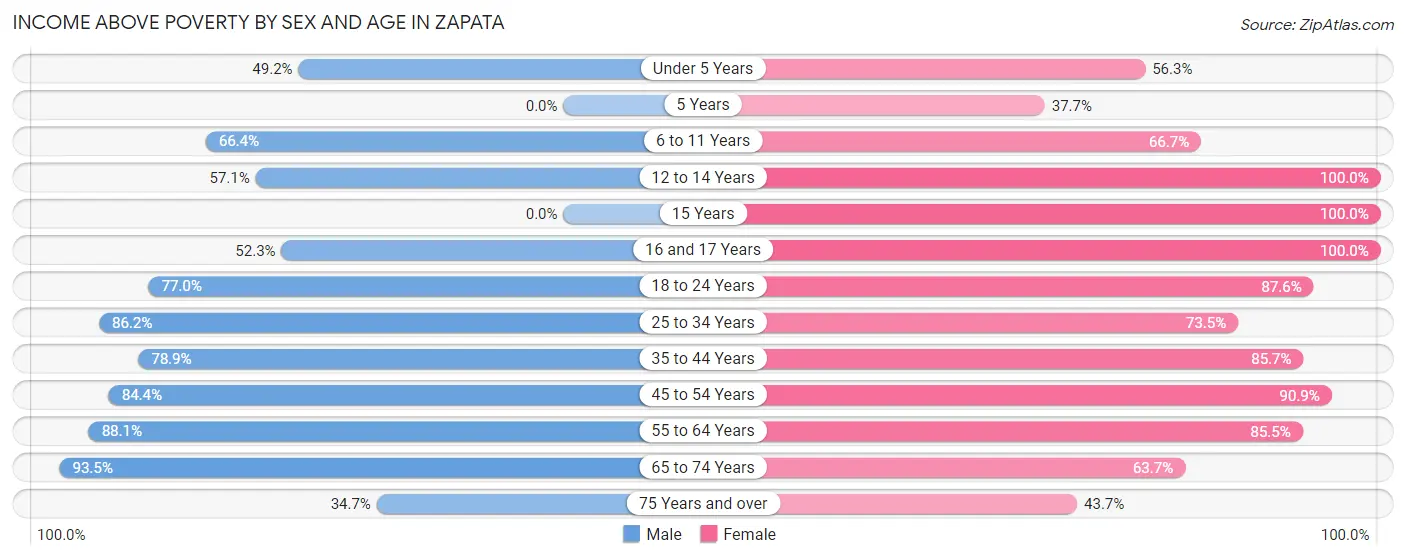
| Age Bracket | Male | Female |
| Under 5 Years | 120 (49.2%) | 107 (56.3%) |
| 5 Years | 0 (0.0%) | 26 (37.7%) |
| 6 to 11 Years | 144 (66.4%) | 238 (66.7%) |
| 12 to 14 Years | 56 (57.1%) | 31 (100.0%) |
| 15 Years | 0 (0.0%) | 52 (100.0%) |
| 16 and 17 Years | 45 (52.3%) | 52 (100.0%) |
| 18 to 24 Years | 251 (77.0%) | 169 (87.6%) |
| 25 to 34 Years | 293 (86.2%) | 214 (73.5%) |
| 35 to 44 Years | 228 (78.9%) | 263 (85.7%) |
| 45 to 54 Years | 178 (84.4%) | 250 (90.9%) |
| 55 to 64 Years | 244 (88.1%) | 183 (85.5%) |
| 65 to 74 Years | 288 (93.5%) | 114 (63.7%) |
| 75 Years and over | 70 (34.6%) | 114 (43.7%) |
| Total | 1,917 (73.8%) | 1,813 (73.4%) |
Income Below Poverty Among Married-Couple Families in Zapata
The poverty statistics for married-couple families in Zapata show that 10.6% or 56 of the total 527 families live below the poverty line. Families with no children have the highest poverty rate of 17.5%, comprising of 40 families. On the other hand, families with 1 or 2 children have the lowest poverty rate of 2.5%, which includes 4 families.
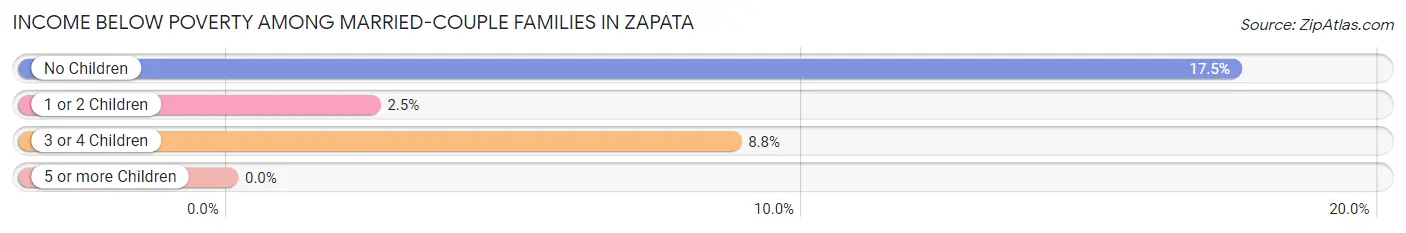
| Children | Above Poverty | Below Poverty |
| No Children | 189 (82.5%) | 40 (17.5%) |
| 1 or 2 Children | 157 (97.5%) | 4 (2.5%) |
| 3 or 4 Children | 125 (91.2%) | 12 (8.8%) |
| 5 or more Children | 0 (0.0%) | 0 (0.0%) |
| Total | 471 (89.4%) | 56 (10.6%) |
Income Below Poverty Among Single-Parent Households in Zapata
According to the poverty data in Zapata, 30.0% or 69 single-father households and 35.1% or 103 single-mother households are living below the poverty line. Among single-father households, those with 1 or 2 children have the highest poverty rate, with 69 households (45.4%) experiencing poverty. Likewise, among single-mother households, those with 3 or 4 children have the highest poverty rate, with 36 households (73.5%) falling below the poverty line.
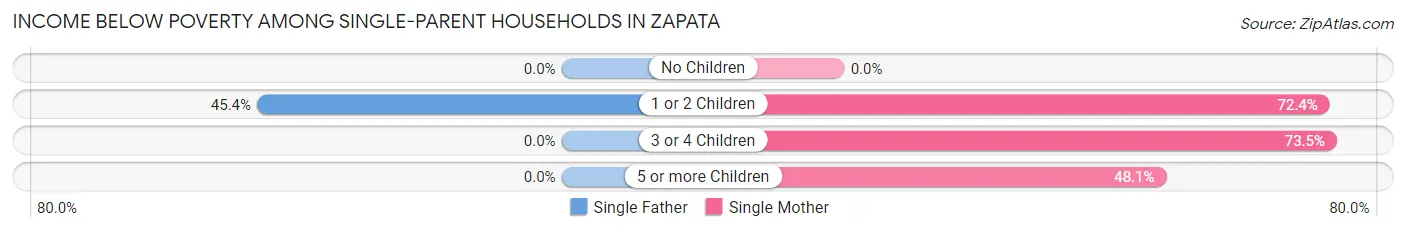
| Children | Single Father | Single Mother |
| No Children | 0 (0.0%) | 0 (0.0%) |
| 1 or 2 Children | 69 (45.4%) | 42 (72.4%) |
| 3 or 4 Children | 0 (0.0%) | 36 (73.5%) |
| 5 or more Children | 0 (0.0%) | 25 (48.1%) |
| Total | 69 (30.0%) | 103 (35.1%) |
Income Below Poverty Among Married-Couple vs Single-Parent Households in Zapata
The poverty data for Zapata shows that 56 of the married-couple family households (10.6%) and 172 of the single-parent households (32.9%) are living below the poverty level. Within the married-couple family households, those with no children have the highest poverty rate, with 40 households (17.5%) falling below the poverty line. Among the single-parent households, those with 3 or 4 children have the highest poverty rate, with 36 household (73.5%) living below poverty.
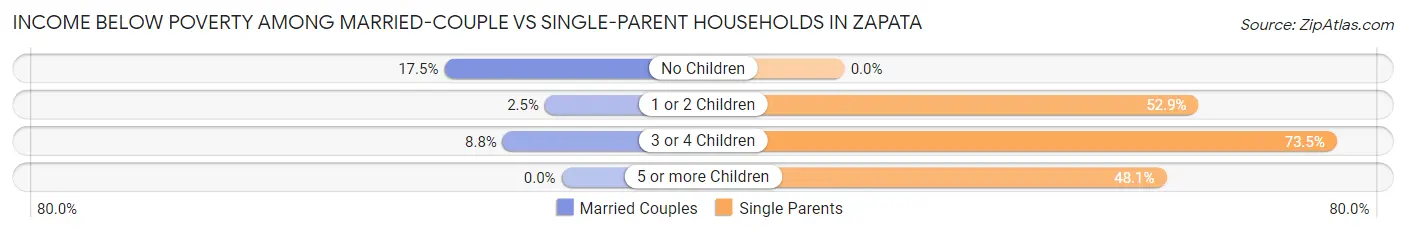
| Children | Married-Couple Families | Single-Parent Households |
| No Children | 40 (17.5%) | 0 (0.0%) |
| 1 or 2 Children | 4 (2.5%) | 111 (52.9%) |
| 3 or 4 Children | 12 (8.8%) | 36 (73.5%) |
| 5 or more Children | 0 (0.0%) | 25 (48.1%) |
| Total | 56 (10.6%) | 172 (32.9%) |
Race in Zapata
The most populous races in Zapata are Hispanic or Latino (4,736 | 92.7%), White / Caucasian (3,062 | 59.9%), and Two or more Races (1,689 | 33.1%).
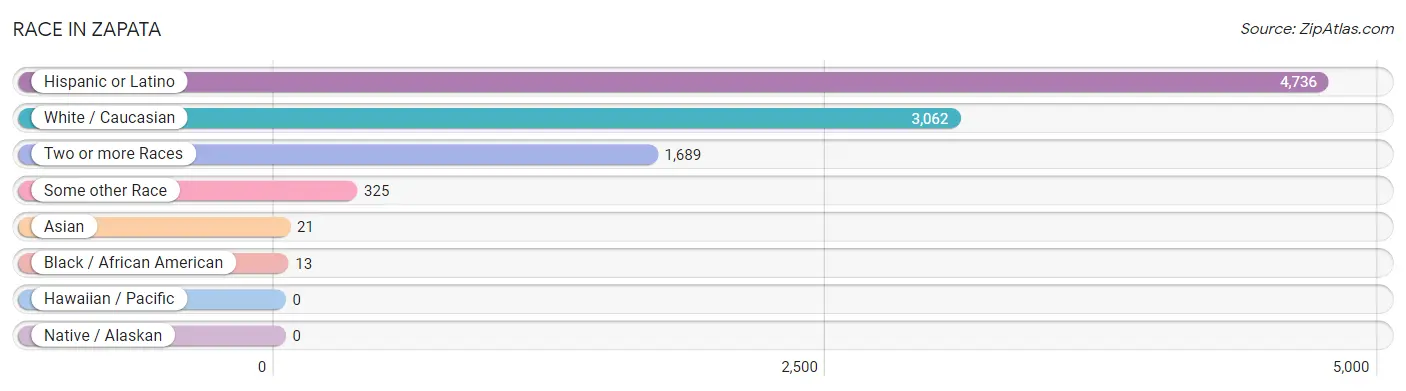
| Race | # Population | % Population |
| Asian | 21 | 0.4% |
| Black / African American | 13 | 0.3% |
| Hawaiian / Pacific | 0 | 0.0% |
| Hispanic or Latino | 4,736 | 92.7% |
| Native / Alaskan | 0 | 0.0% |
| White / Caucasian | 3,062 | 59.9% |
| Two or more Races | 1,689 | 33.1% |
| Some other Race | 325 | 6.4% |
| Total | 5,110 | 100.0% |
Ancestry in Zapata
The most populous ancestries reported in Zapata are Mexican (3,980 | 77.9%), German (222 | 4.3%), English (157 | 3.1%), American (142 | 2.8%), and Polish (139 | 2.7%), together accounting for 90.8% of all Zapata residents.
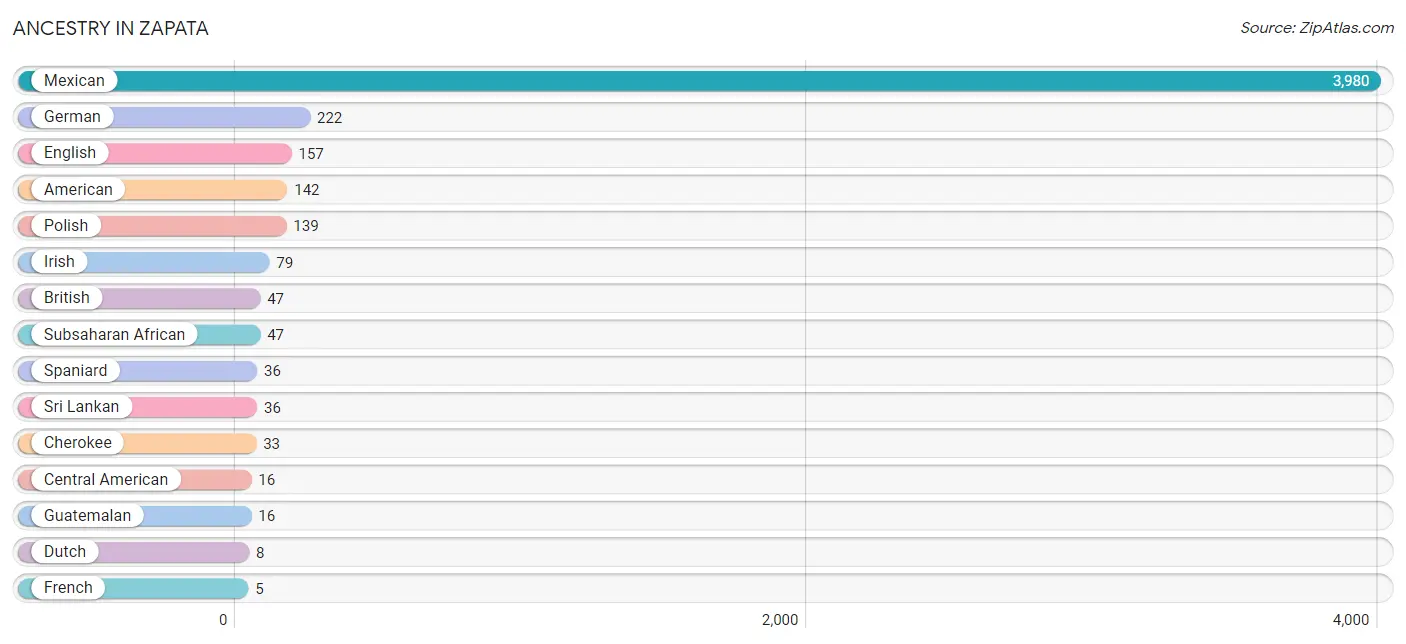
| Ancestry | # Population | % Population |
| American | 142 | 2.8% |
| Apache | 2 | 0.0% |
| British | 47 | 0.9% |
| Central American | 16 | 0.3% |
| Cherokee | 33 | 0.6% |
| Dutch | 8 | 0.2% |
| English | 157 | 3.1% |
| French | 5 | 0.1% |
| German | 222 | 4.3% |
| Guatemalan | 16 | 0.3% |
| Irish | 79 | 1.5% |
| Italian | 3 | 0.1% |
| Mexican | 3,980 | 77.9% |
| Polish | 139 | 2.7% |
| Puerto Rican | 3 | 0.1% |
| Spaniard | 36 | 0.7% |
| Sri Lankan | 36 | 0.7% |
| Subsaharan African | 47 | 0.9% | View All 18 Rows |
Immigrants in Zapata
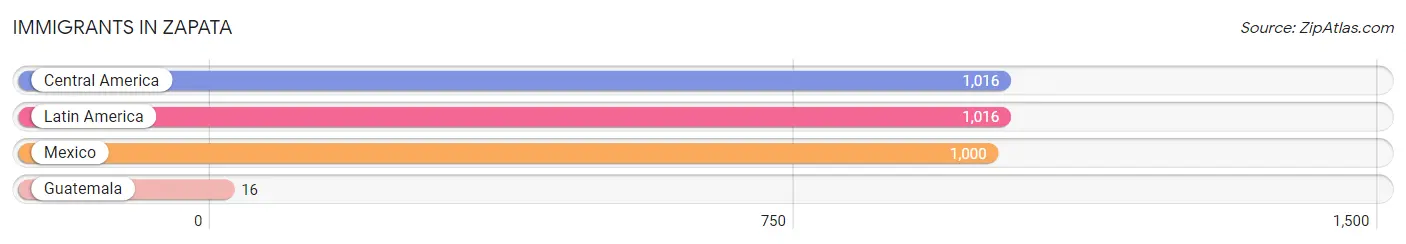
The most numerous immigrant groups reported in Zapata came from Central America (1,016 | 19.9%), Latin America (1,016 | 19.9%), Mexico (1,000 | 19.6%), and Guatemala (16 | 0.3%), together accounting for 59.6% of all Zapata residents.
| Immigration Origin | # Population | % Population |
| Central America | 1,016 | 19.9% |
| Guatemala | 16 | 0.3% |
| Latin America | 1,016 | 19.9% |
| Mexico | 1,000 | 19.6% | View All 4 Rows |
Sex and Age in Zapata
Sex and Age in Zapata
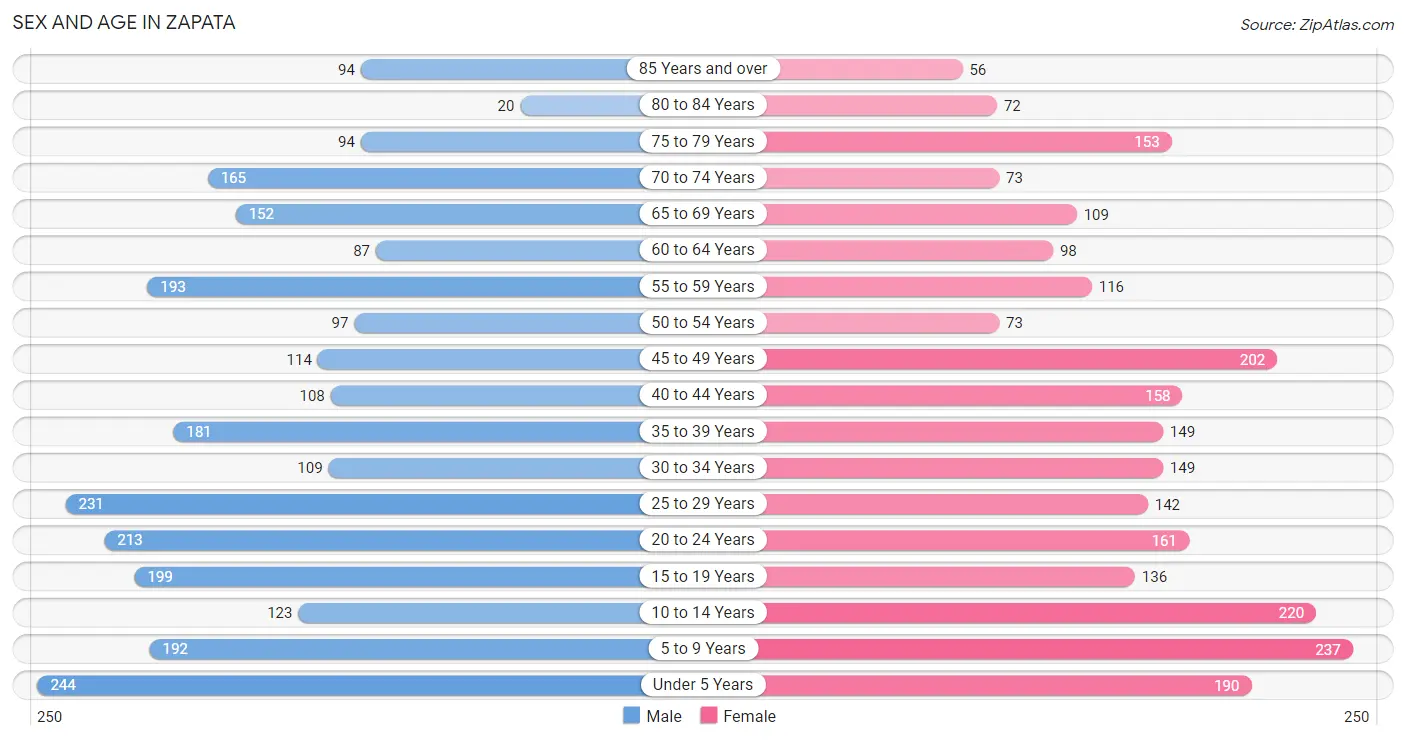
The most populous age groups in Zapata are Under 5 Years (244 | 9.3%) for men and 5 to 9 Years (237 | 9.5%) for women.
| Age Bracket | Male | Female |
| Under 5 Years | 244 (9.3%) | 190 (7.6%) |
| 5 to 9 Years | 192 (7.3%) | 237 (9.5%) |
| 10 to 14 Years | 123 (4.7%) | 220 (8.8%) |
| 15 to 19 Years | 199 (7.6%) | 136 (5.4%) |
| 20 to 24 Years | 213 (8.1%) | 161 (6.5%) |
| 25 to 29 Years | 231 (8.8%) | 142 (5.7%) |
| 30 to 34 Years | 109 (4.2%) | 149 (6.0%) |
| 35 to 39 Years | 181 (6.9%) | 149 (6.0%) |
| 40 to 44 Years | 108 (4.1%) | 158 (6.3%) |
| 45 to 49 Years | 114 (4.4%) | 202 (8.1%) |
| 50 to 54 Years | 97 (3.7%) | 73 (2.9%) |
| 55 to 59 Years | 193 (7.4%) | 116 (4.6%) |
| 60 to 64 Years | 87 (3.3%) | 98 (3.9%) |
| 65 to 69 Years | 152 (5.8%) | 109 (4.4%) |
| 70 to 74 Years | 165 (6.3%) | 73 (2.9%) |
| 75 to 79 Years | 94 (3.6%) | 153 (6.1%) |
| 80 to 84 Years | 20 (0.8%) | 72 (2.9%) |
| 85 Years and over | 94 (3.6%) | 56 (2.2%) |
| Total | 2,616 (100.0%) | 2,494 (100.0%) |
Families and Households in Zapata
Median Family Size in Zapata
The median family size in Zapata is 3.78 persons per family, with single female/mother families (293 | 27.9%) accounting for the largest median family size of 4.56 persons per family. On the other hand, single male/father families (230 | 21.9%) represent the smallest median family size with 2.70 persons per family.
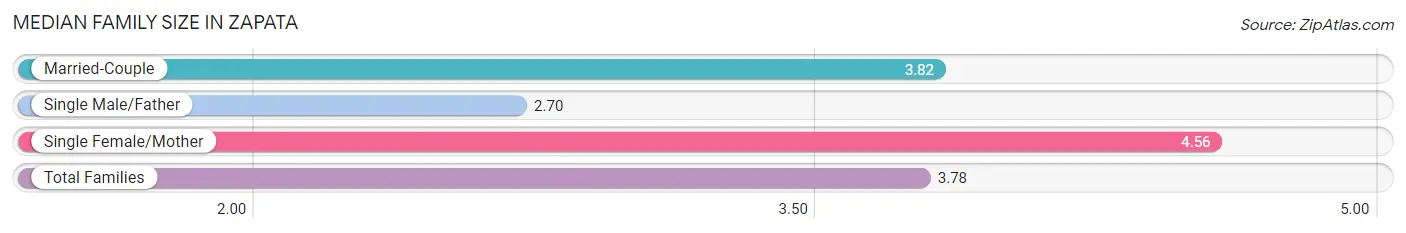
| Family Type | # Families | Family Size |
| Married-Couple | 527 (50.2%) | 3.82 |
| Single Male/Father | 230 (21.9%) | 2.70 |
| Single Female/Mother | 293 (27.9%) | 4.56 |
| Total Families | 1,050 (100.0%) | 3.78 |
Median Household Size in Zapata
The median household size in Zapata is 2.68 persons per household, with single female/mother households (293 | 15.5%) accounting for the largest median household size of 5.13 persons per household. non-family households (839 | 44.4%) represent the smallest median household size with 1.03 persons per household.
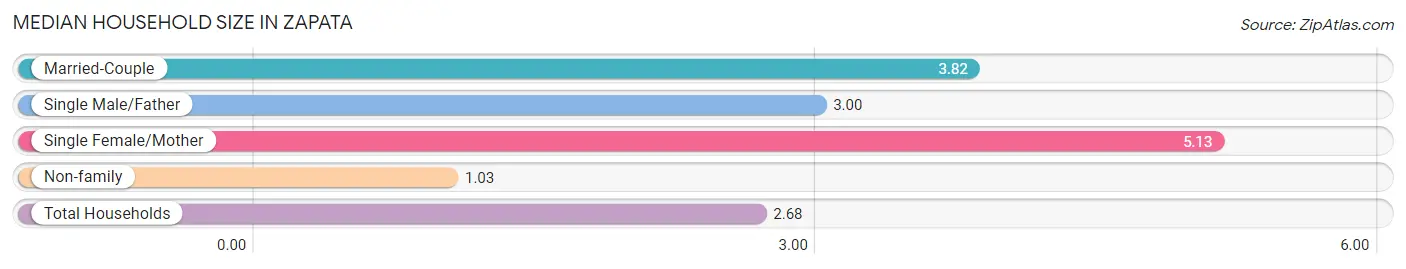
| Household Type | # Households | Household Size |
| Married-Couple | 527 (27.9%) | 3.82 |
| Single Male/Father | 230 (12.2%) | 3.00 |
| Single Female/Mother | 293 (15.5%) | 5.13 |
| Non-family | 839 (44.4%) | 1.03 |
| Total Households | 1,889 (100.0%) | 2.68 |
Household Size by Marriage Status in Zapata
Out of a total of 1,889 households in Zapata, 1,050 (55.6%) are family households, while 839 (44.4%) are nonfamily households. The most numerous type of family households are 2-person households, comprising 411, and the most common type of nonfamily households are 1-person households, comprising 794.
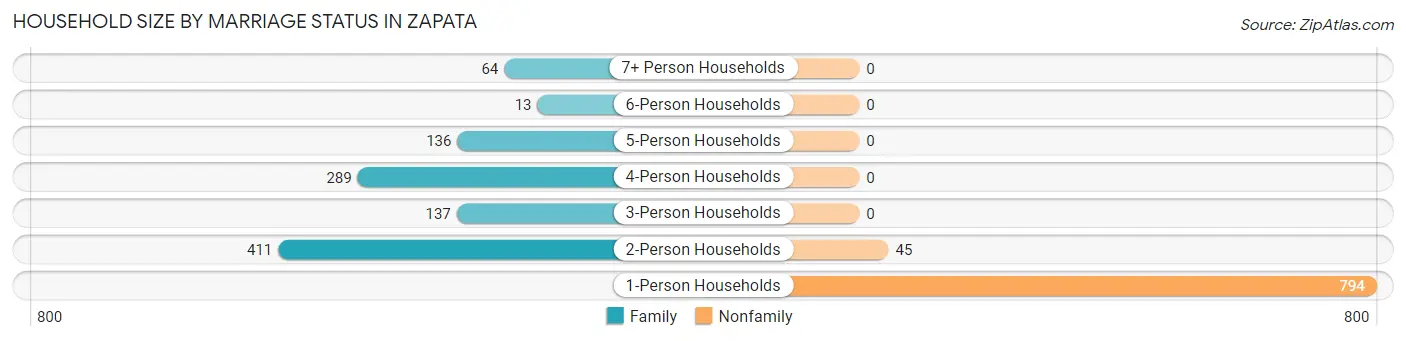
| Household Size | Family Households | Nonfamily Households |
| 1-Person Households | - | 794 (42.0%) |
| 2-Person Households | 411 (21.8%) | 45 (2.4%) |
| 3-Person Households | 137 (7.2%) | 0 (0.0%) |
| 4-Person Households | 289 (15.3%) | 0 (0.0%) |
| 5-Person Households | 136 (7.2%) | 0 (0.0%) |
| 6-Person Households | 13 (0.7%) | 0 (0.0%) |
| 7+ Person Households | 64 (3.4%) | 0 (0.0%) |
| Total | 1,050 (55.6%) | 839 (44.4%) |
Female Fertility in Zapata
Fertility by Age in Zapata
Average fertility rate in Zapata is 80.0 births per 1,000 women. Women in the age bracket of 20 to 34 years have the highest fertility rate with 197.0 births per 1,000 women. Women in the age bracket of 20 to 34 years acount for 100.0% of all women with births.
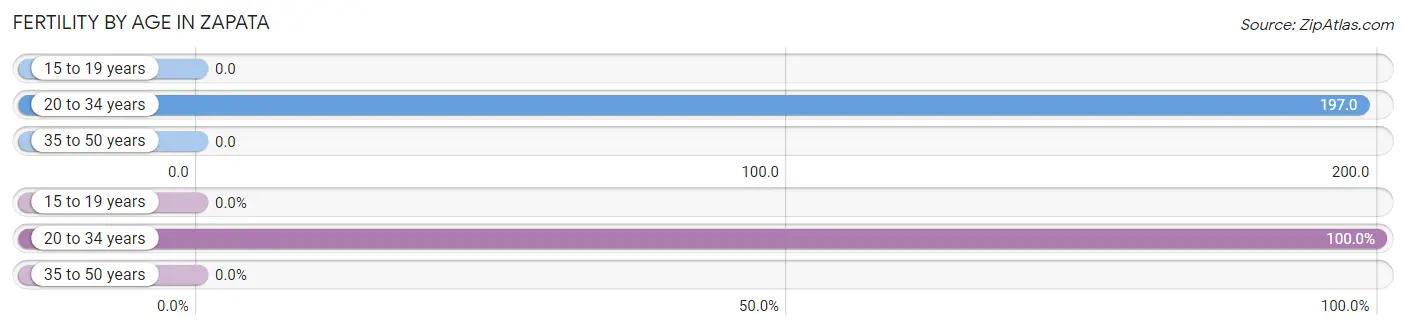
| Age Bracket | Women with Births | Births / 1,000 Women |
| 15 to 19 years | 0 (0.0%) | 0.0 |
| 20 to 34 years | 89 (100.0%) | 197.0 |
| 35 to 50 years | 0 (0.0%) | 0.0 |
| Total | 89 (100.0%) | 80.0 |
Fertility by Age by Marriage Status in Zapata
41.6% of women with births (89) in Zapata are married. The highest percentage of unmarried women with births falls into 20 to 34 years age bracket with 58.4% of them unmarried at the time of birth, while the lowest percentage of unmarried women with births belong to 20 to 34 years age bracket with 58.4% of them unmarried.
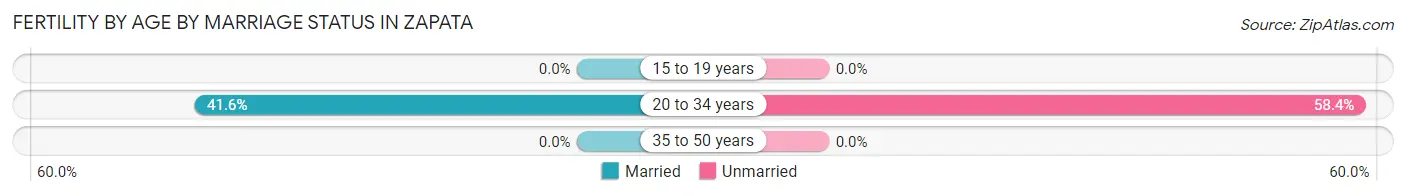
| Age Bracket | Married | Unmarried |
| 15 to 19 years | 0 (0.0%) | 0 (0.0%) |
| 20 to 34 years | 37 (41.6%) | 52 (58.4%) |
| 35 to 50 years | 0 (0.0%) | 0 (0.0%) |
| Total | 37 (41.6%) | 52 (58.4%) |
Fertility by Education in Zapata
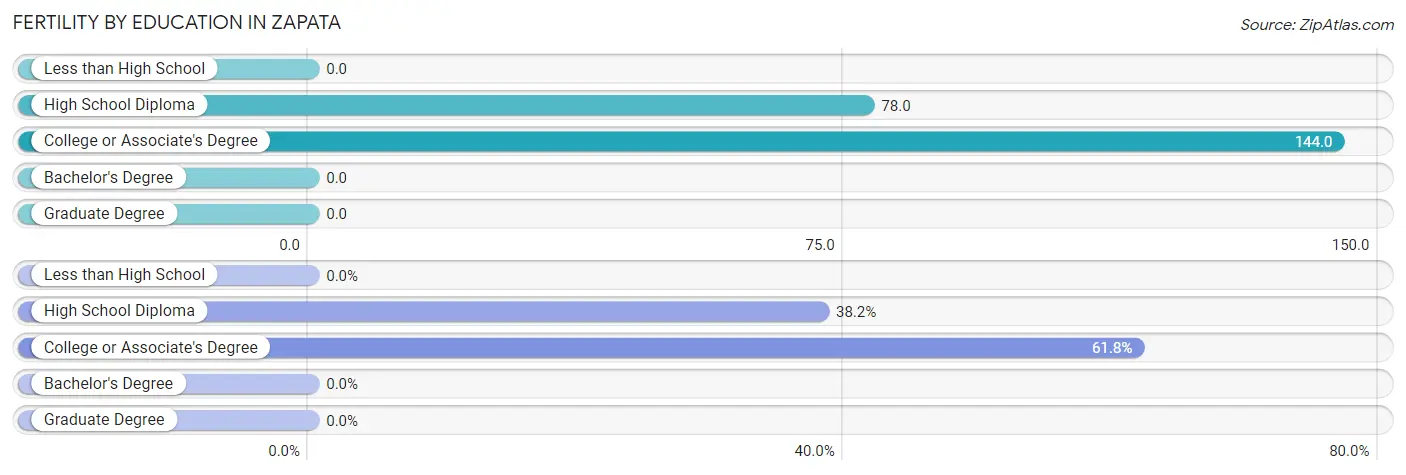
| Educational Attainment | Women with Births | Births / 1,000 Women |
| Less than High School | 0 (0.0%) | 0.0 |
| High School Diploma | 34 (38.2%) | 78.0 |
| College or Associate's Degree | 55 (61.8%) | 144.0 |
| Bachelor's Degree | 0 (0.0%) | 0.0 |
| Graduate Degree | 0 (0.0%) | 0.0 |
| Total | 89 (100.0%) | 80.0 |
Fertility by Education by Marriage Status in Zapata
58.4% of women with births in Zapata are unmarried. Women with the educational attainment of college or associate's degree are most likely to be married with 67.3% of them married at childbirth, while women with the educational attainment of high school diploma are least likely to be married with 100.0% of them unmarried at childbirth.
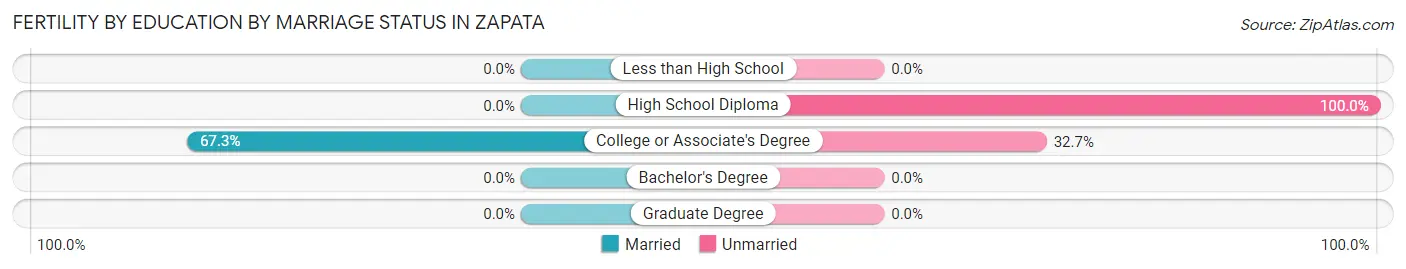
| Educational Attainment | Married | Unmarried |
| Less than High School | 0 (0.0%) | 0 (0.0%) |
| High School Diploma | 0 (0.0%) | 34 (100.0%) |
| College or Associate's Degree | 37 (67.3%) | 18 (32.7%) |
| Bachelor's Degree | 0 (0.0%) | 0 (0.0%) |
| Graduate Degree | 0 (0.0%) | 0 (0.0%) |
| Total | 37 (41.6%) | 52 (58.4%) |
Employment Characteristics in Zapata
Employment by Class of Employer in Zapata
Among the 1,860 employed individuals in Zapata, private company employees (1,117 | 60.1%), local government employees (265 | 14.2%), and self-employed (not incorporated) (140 | 7.5%) make up the most common classes of employment.
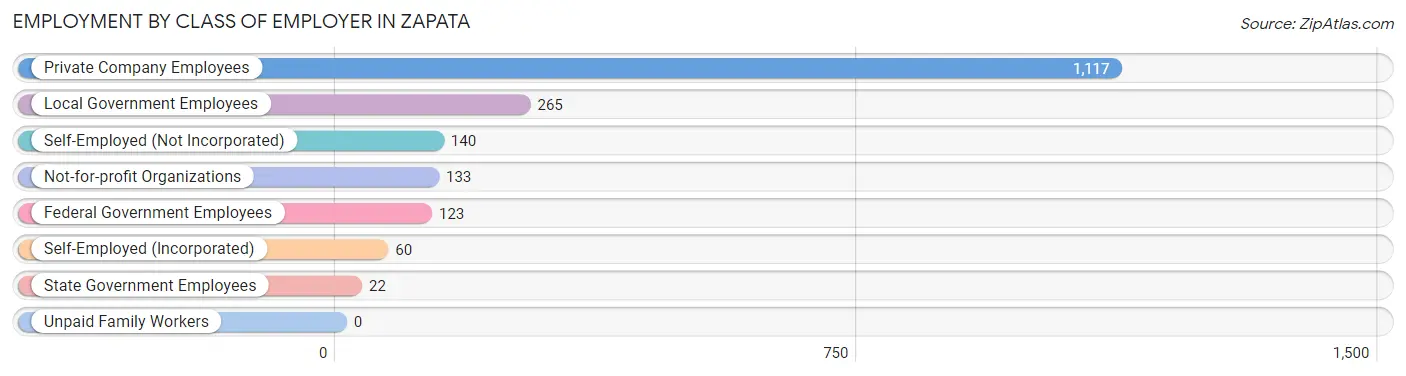
| Employer Class | # Employees | % Employees |
| Private Company Employees | 1,117 | 60.1% |
| Self-Employed (Incorporated) | 60 | 3.2% |
| Self-Employed (Not Incorporated) | 140 | 7.5% |
| Not-for-profit Organizations | 133 | 7.1% |
| Local Government Employees | 265 | 14.2% |
| State Government Employees | 22 | 1.2% |
| Federal Government Employees | 123 | 6.6% |
| Unpaid Family Workers | 0 | 0.0% |
| Total | 1,860 | 100.0% |
Employment Status by Age in Zapata
According to the labor force statistics for Zapata, out of the total population over 16 years of age (3,852), 51.3% or 1,976 individuals are in the labor force, with 2.1% or 41 of them unemployed. The age group with the highest labor force participation rate is 25 to 29 years, with 86.1% or 321 individuals in the labor force. Within the labor force, the 35 to 44 years age range has the highest percentage of unemployed individuals, with 7.3% or 33 of them being unemployed.
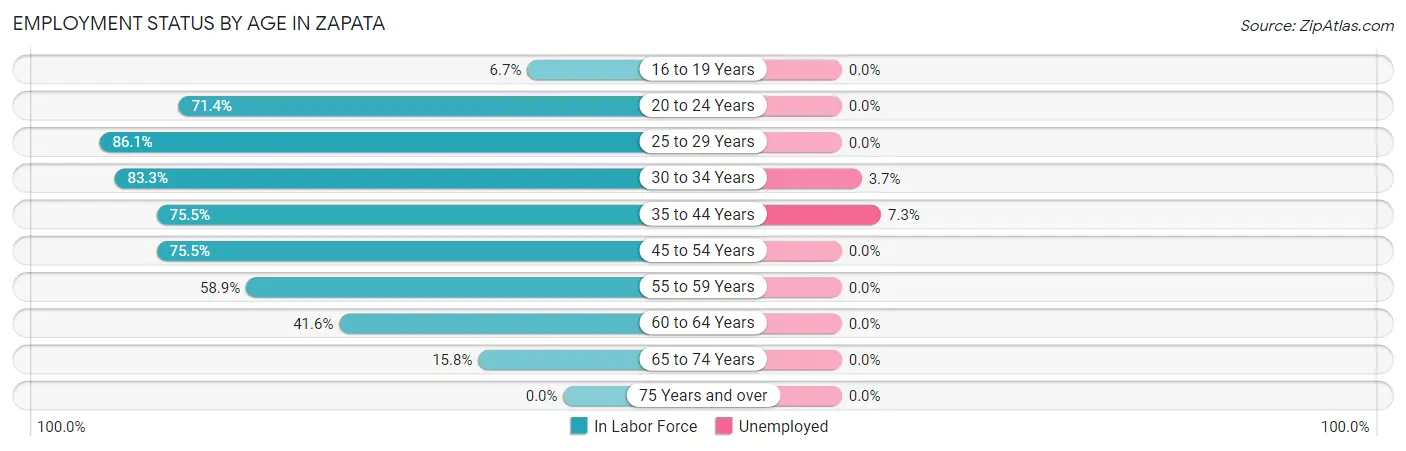
| Age Bracket | In Labor Force | Unemployed |
| 16 to 19 Years | 19 (6.7%) | 0 (0.0%) |
| 20 to 24 Years | 267 (71.4%) | 0 (0.0%) |
| 25 to 29 Years | 321 (86.1%) | 0 (0.0%) |
| 30 to 34 Years | 215 (83.3%) | 8 (3.7%) |
| 35 to 44 Years | 450 (75.5%) | 33 (7.3%) |
| 45 to 54 Years | 367 (75.5%) | 0 (0.0%) |
| 55 to 59 Years | 182 (58.9%) | 0 (0.0%) |
| 60 to 64 Years | 77 (41.6%) | 0 (0.0%) |
| 65 to 74 Years | 79 (15.8%) | 0 (0.0%) |
| 75 Years and over | 0 (0.0%) | 0 (0.0%) |
| Total | 1,976 (51.3%) | 41 (2.1%) |
Employment Status by Educational Attainment in Zapata
According to labor force statistics for Zapata, 73.0% of individuals (1,611) out of the total population between 25 and 64 years of age (2,207) are in the labor force, with 2.5% or 40 of them being unemployed. The group with the highest labor force participation rate are those with the educational attainment of college / associate degree, with 89.1% or 700 individuals in the labor force. Within the labor force, individuals with high school diploma education have the highest percentage of unemployment, with 7.0% or 33 of them being unemployed.
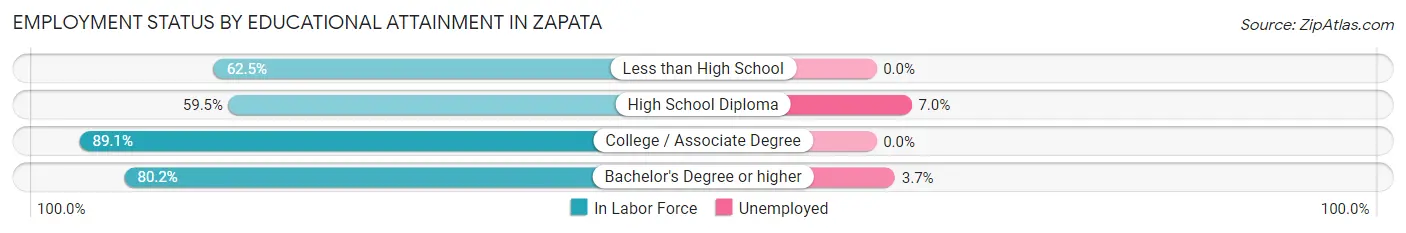
| Educational Attainment | In Labor Force | Unemployed |
| Less than High School | 225 (62.5%) | 0 (0.0%) |
| High School Diploma | 472 (59.5%) | 56 (7.0%) |
| College / Associate Degree | 700 (89.1%) | 0 (0.0%) |
| Bachelor's Degree or higher | 215 (80.2%) | 10 (3.7%) |
| Total | 1,611 (73.0%) | 55 (2.5%) |
Employment Occupations by Sex in Zapata
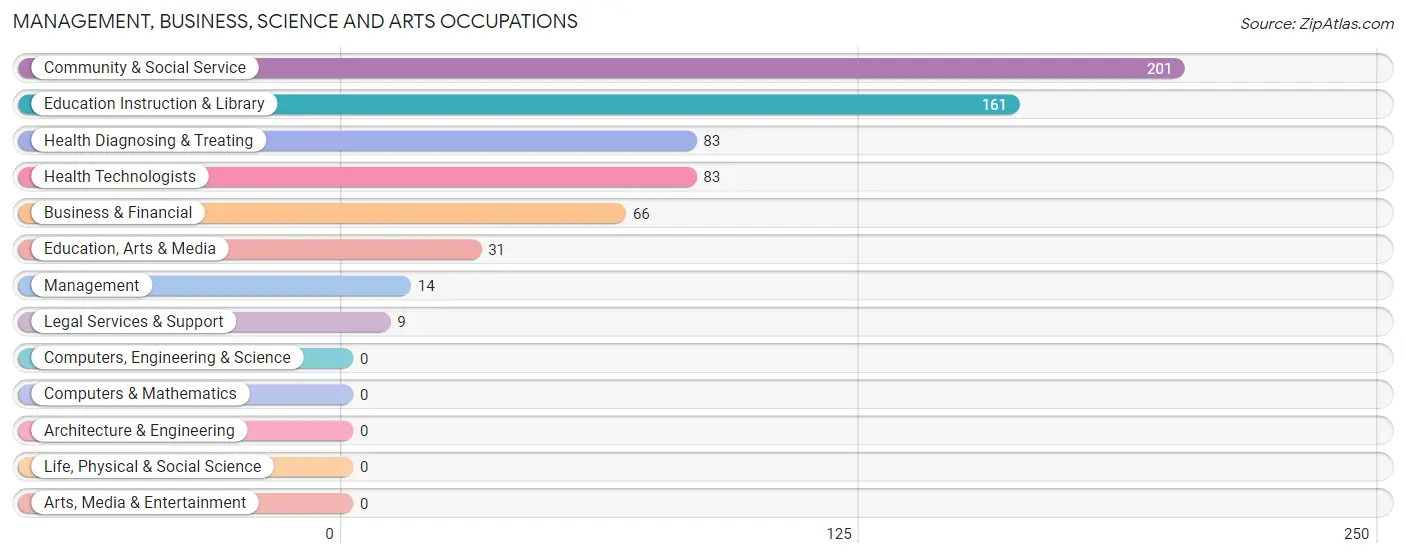
Management, Business, Science and Arts Occupations
The most common Management, Business, Science and Arts occupations in Zapata are Community & Social Service (201 | 10.4%), Education Instruction & Library (161 | 8.3%), Health Diagnosing & Treating (83 | 4.3%), Health Technologists (83 | 4.3%), and Business & Financial (66 | 3.4%).
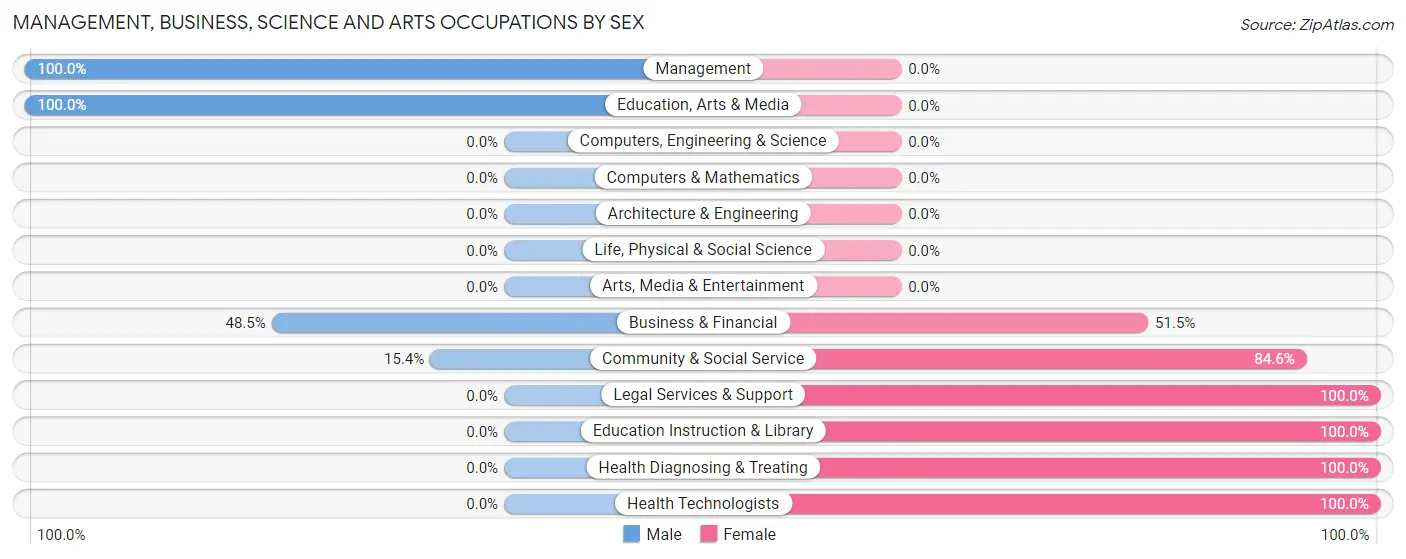
Management, Business, Science and Arts Occupations by Sex
Within the Management, Business, Science and Arts occupations in Zapata, the most male-oriented occupations are Management (100.0%), Education, Arts & Media (100.0%), and Business & Financial (48.5%), while the most female-oriented occupations are Legal Services & Support (100.0%), Education Instruction & Library (100.0%), and Health Diagnosing & Treating (100.0%).
| Occupation | Male | Female |
| Management | 14 (100.0%) | 0 (0.0%) |
| Business & Financial | 32 (48.5%) | 34 (51.5%) |
| Computers, Engineering & Science | 0 (0.0%) | 0 (0.0%) |
| Computers & Mathematics | 0 (0.0%) | 0 (0.0%) |
| Architecture & Engineering | 0 (0.0%) | 0 (0.0%) |
| Life, Physical & Social Science | 0 (0.0%) | 0 (0.0%) |
| Community & Social Service | 31 (15.4%) | 170 (84.6%) |
| Education, Arts & Media | 31 (100.0%) | 0 (0.0%) |
| Legal Services & Support | 0 (0.0%) | 9 (100.0%) |
| Education Instruction & Library | 0 (0.0%) | 161 (100.0%) |
| Arts, Media & Entertainment | 0 (0.0%) | 0 (0.0%) |
| Health Diagnosing & Treating | 0 (0.0%) | 83 (100.0%) |
| Health Technologists | 0 (0.0%) | 83 (100.0%) |
| Total (Category) | 77 (21.1%) | 287 (78.8%) |
| Total (Overall) | 1,107 (57.2%) | 829 (42.8%) |
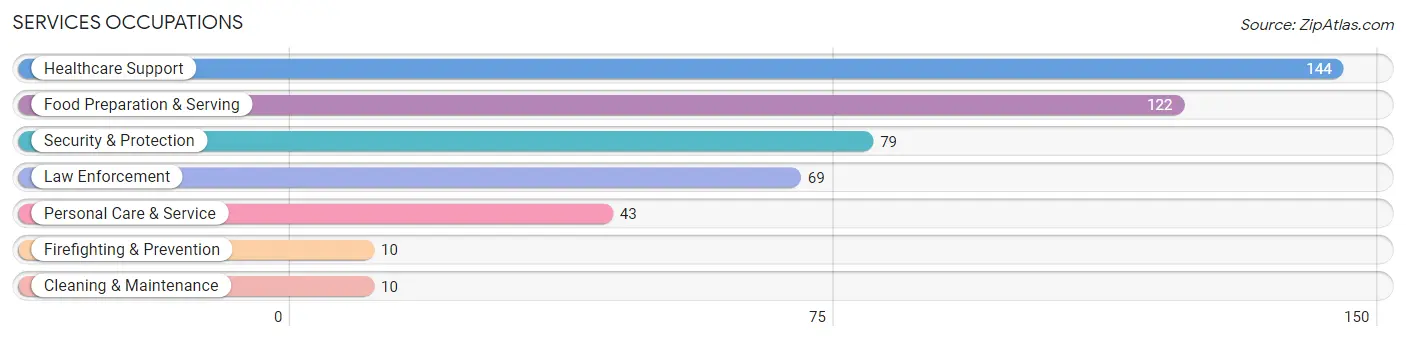
Services Occupations
The most common Services occupations in Zapata are Healthcare Support (144 | 7.4%), Food Preparation & Serving (122 | 6.3%), Security & Protection (79 | 4.1%), Law Enforcement (69 | 3.6%), and Personal Care & Service (43 | 2.2%).
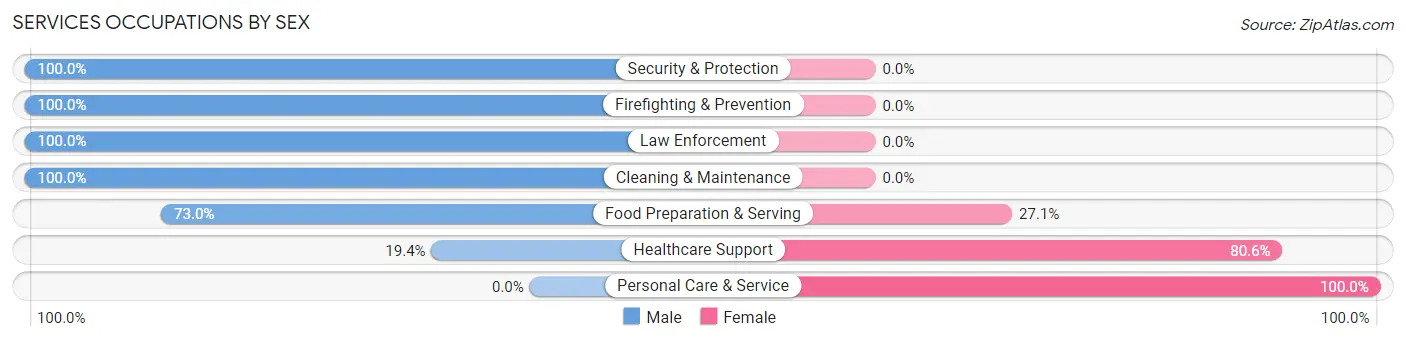
Services Occupations by Sex
Within the Services occupations in Zapata, the most male-oriented occupations are Security & Protection (100.0%), Firefighting & Prevention (100.0%), and Law Enforcement (100.0%), while the most female-oriented occupations are Personal Care & Service (100.0%), Healthcare Support (80.6%), and Food Preparation & Serving (27.1%).
| Occupation | Male | Female |
| Healthcare Support | 28 (19.4%) | 116 (80.6%) |
| Security & Protection | 79 (100.0%) | 0 (0.0%) |
| Firefighting & Prevention | 10 (100.0%) | 0 (0.0%) |
| Law Enforcement | 69 (100.0%) | 0 (0.0%) |
| Food Preparation & Serving | 89 (73.0%) | 33 (27.1%) |
| Cleaning & Maintenance | 10 (100.0%) | 0 (0.0%) |
| Personal Care & Service | 0 (0.0%) | 43 (100.0%) |
| Total (Category) | 206 (51.8%) | 192 (48.2%) |
| Total (Overall) | 1,107 (57.2%) | 829 (42.8%) |
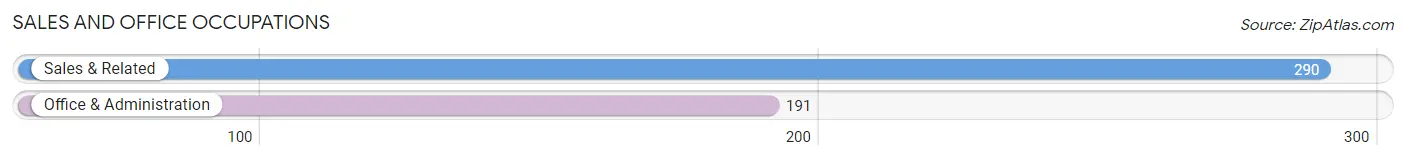
Sales and Office Occupations
The most common Sales and Office occupations in Zapata are Sales & Related (290 | 15.0%), and Office & Administration (191 | 9.9%).
Sales and Office Occupations by Sex
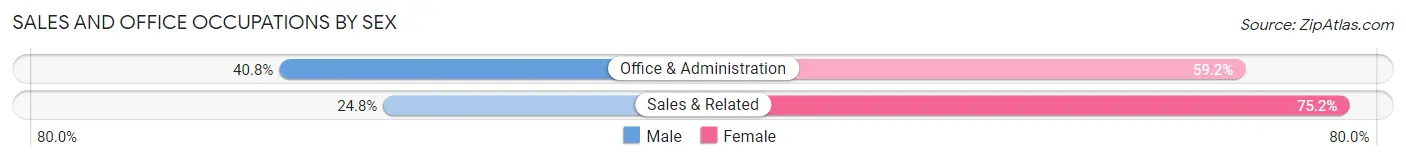
| Occupation | Male | Female |
| Sales & Related | 72 (24.8%) | 218 (75.2%) |
| Office & Administration | 78 (40.8%) | 113 (59.2%) |
| Total (Category) | 150 (31.2%) | 331 (68.8%) |
| Total (Overall) | 1,107 (57.2%) | 829 (42.8%) |
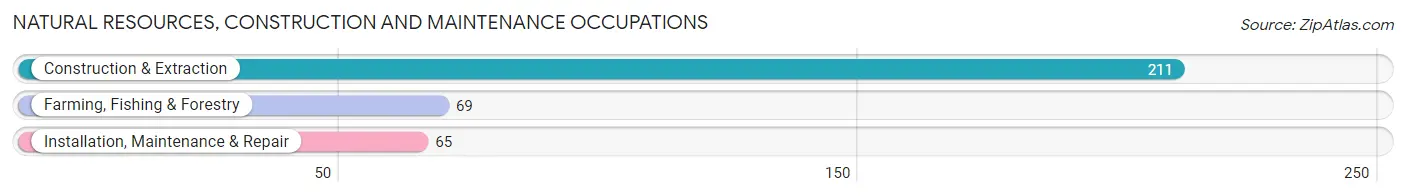
Natural Resources, Construction and Maintenance Occupations
The most common Natural Resources, Construction and Maintenance occupations in Zapata are Construction & Extraction (211 | 10.9%), Farming, Fishing & Forestry (69 | 3.6%), and Installation, Maintenance & Repair (65 | 3.4%).
Natural Resources, Construction and Maintenance Occupations by Sex
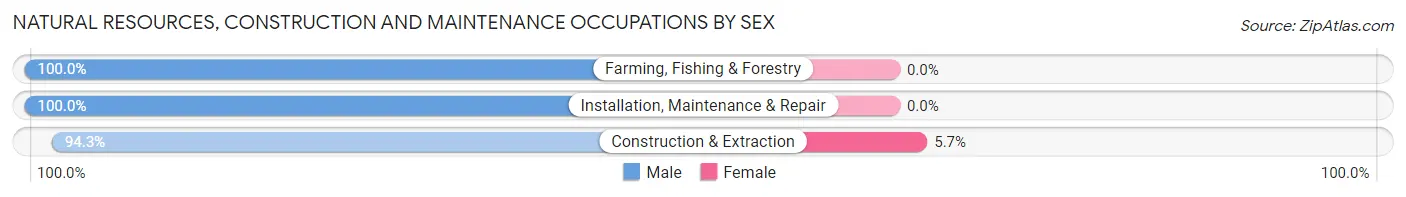
| Occupation | Male | Female |
| Farming, Fishing & Forestry | 69 (100.0%) | 0 (0.0%) |
| Construction & Extraction | 199 (94.3%) | 12 (5.7%) |
| Installation, Maintenance & Repair | 65 (100.0%) | 0 (0.0%) |
| Total (Category) | 333 (96.5%) | 12 (3.5%) |
| Total (Overall) | 1,107 (57.2%) | 829 (42.8%) |
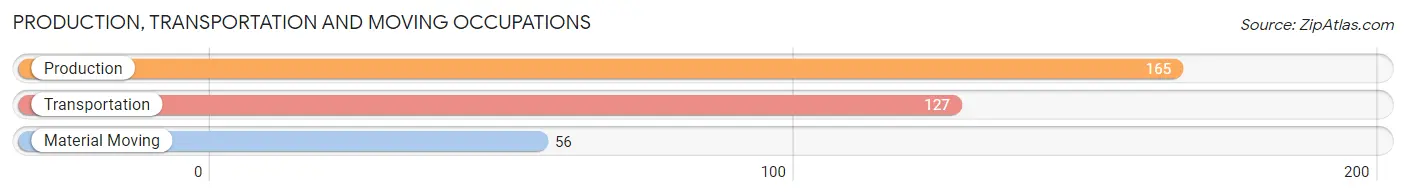
Production, Transportation and Moving Occupations
The most common Production, Transportation and Moving occupations in Zapata are Production (165 | 8.5%), Transportation (127 | 6.6%), and Material Moving (56 | 2.9%).
Production, Transportation and Moving Occupations by Sex
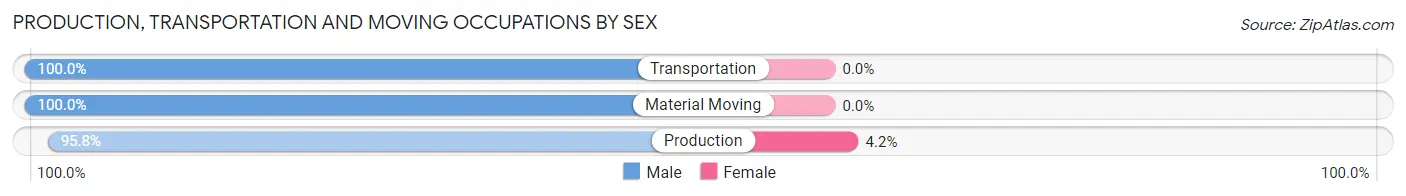
| Occupation | Male | Female |
| Production | 158 (95.8%) | 7 (4.2%) |
| Transportation | 127 (100.0%) | 0 (0.0%) |
| Material Moving | 56 (100.0%) | 0 (0.0%) |
| Total (Category) | 341 (98.0%) | 7 (2.0%) |
| Total (Overall) | 1,107 (57.2%) | 829 (42.8%) |
Employment Industries by Sex in Zapata
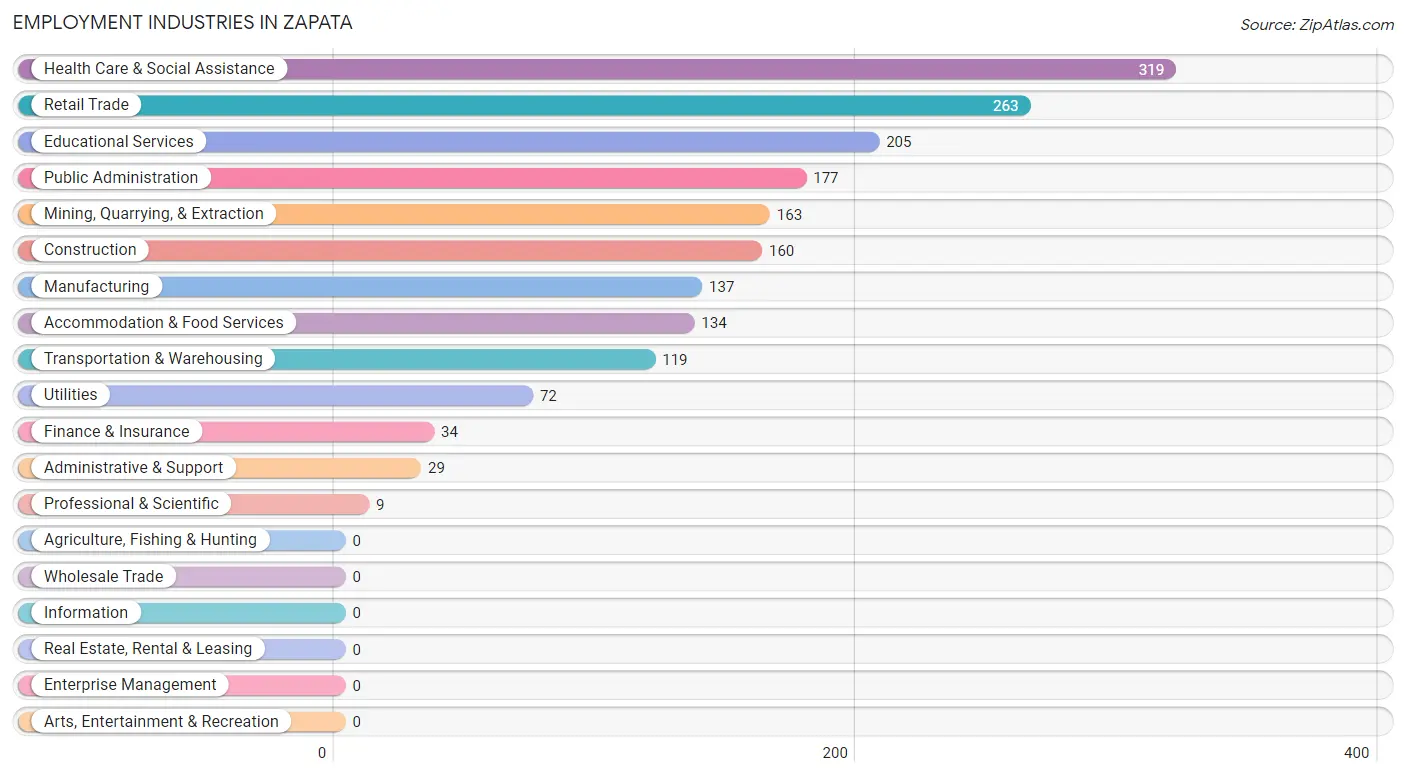
Employment Industries in Zapata
The major employment industries in Zapata include Health Care & Social Assistance (319 | 16.5%), Retail Trade (263 | 13.6%), Educational Services (205 | 10.6%), Public Administration (177 | 9.1%), and Mining, Quarrying, & Extraction (163 | 8.4%).
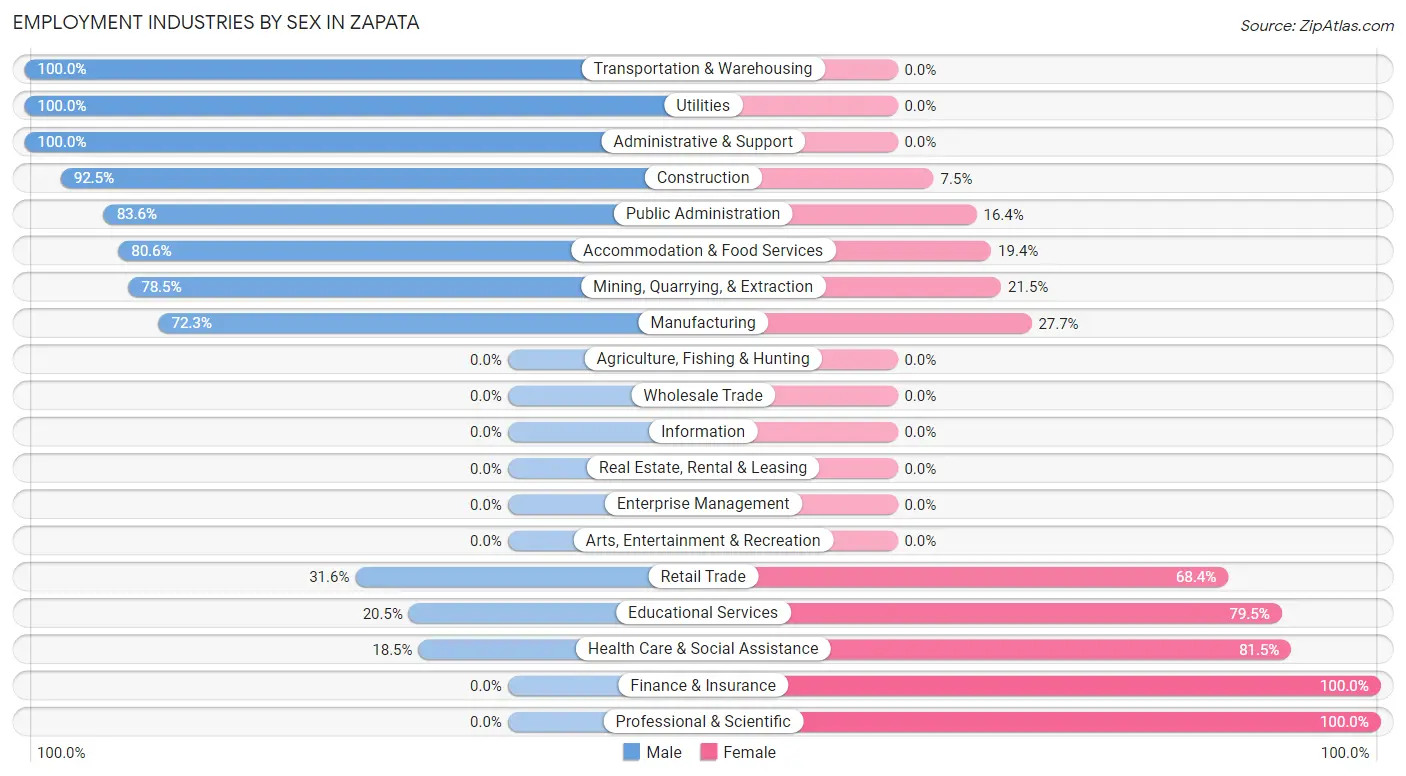
Employment Industries by Sex in Zapata
The Zapata industries that see more men than women are Transportation & Warehousing (100.0%), Utilities (100.0%), and Administrative & Support (100.0%), whereas the industries that tend to have a higher number of women are Finance & Insurance (100.0%), Professional & Scientific (100.0%), and Health Care & Social Assistance (81.5%).
| Industry | Male | Female |
| Agriculture, Fishing & Hunting | 0 (0.0%) | 0 (0.0%) |
| Mining, Quarrying, & Extraction | 128 (78.5%) | 35 (21.5%) |
| Construction | 148 (92.5%) | 12 (7.5%) |
| Manufacturing | 99 (72.3%) | 38 (27.7%) |
| Wholesale Trade | 0 (0.0%) | 0 (0.0%) |
| Retail Trade | 83 (31.6%) | 180 (68.4%) |
| Transportation & Warehousing | 119 (100.0%) | 0 (0.0%) |
| Utilities | 72 (100.0%) | 0 (0.0%) |
| Information | 0 (0.0%) | 0 (0.0%) |
| Finance & Insurance | 0 (0.0%) | 34 (100.0%) |
| Real Estate, Rental & Leasing | 0 (0.0%) | 0 (0.0%) |
| Professional & Scientific | 0 (0.0%) | 9 (100.0%) |
| Enterprise Management | 0 (0.0%) | 0 (0.0%) |
| Administrative & Support | 29 (100.0%) | 0 (0.0%) |
| Educational Services | 42 (20.5%) | 163 (79.5%) |
| Health Care & Social Assistance | 59 (18.5%) | 260 (81.5%) |
| Arts, Entertainment & Recreation | 0 (0.0%) | 0 (0.0%) |
| Accommodation & Food Services | 108 (80.6%) | 26 (19.4%) |
| Public Administration | 148 (83.6%) | 29 (16.4%) |
| Total | 1,107 (57.2%) | 829 (42.8%) |
Education in Zapata
School Enrollment in Zapata
The most common levels of schooling among the 1,367 students in Zapata are high school (348 | 25.5%), middle school (309 | 22.6%), and elementary school (290 | 21.2%).
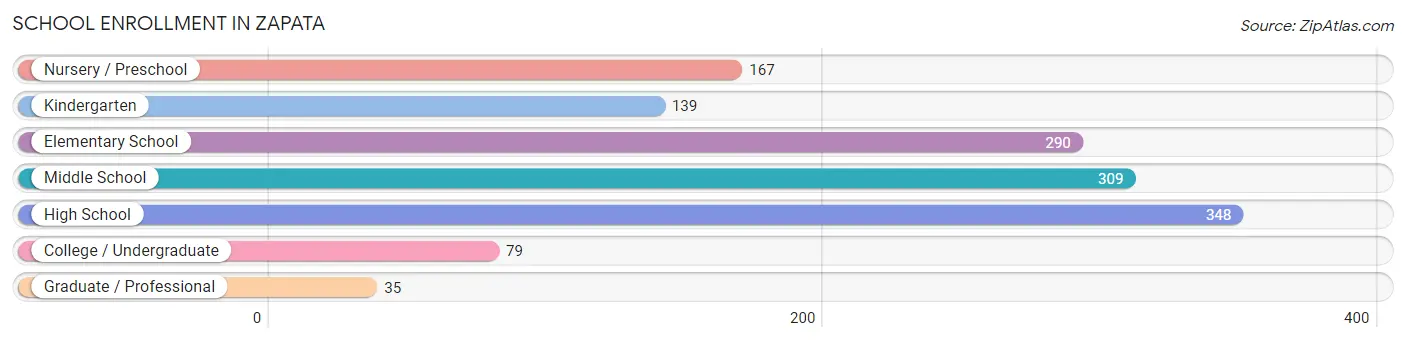
| School Level | # Students | % Students |
| Nursery / Preschool | 167 | 12.2% |
| Kindergarten | 139 | 10.2% |
| Elementary School | 290 | 21.2% |
| Middle School | 309 | 22.6% |
| High School | 348 | 25.5% |
| College / Undergraduate | 79 | 5.8% |
| Graduate / Professional | 35 | 2.6% |
| Total | 1,367 | 100.0% |
School Enrollment by Age by Funding Source in Zapata
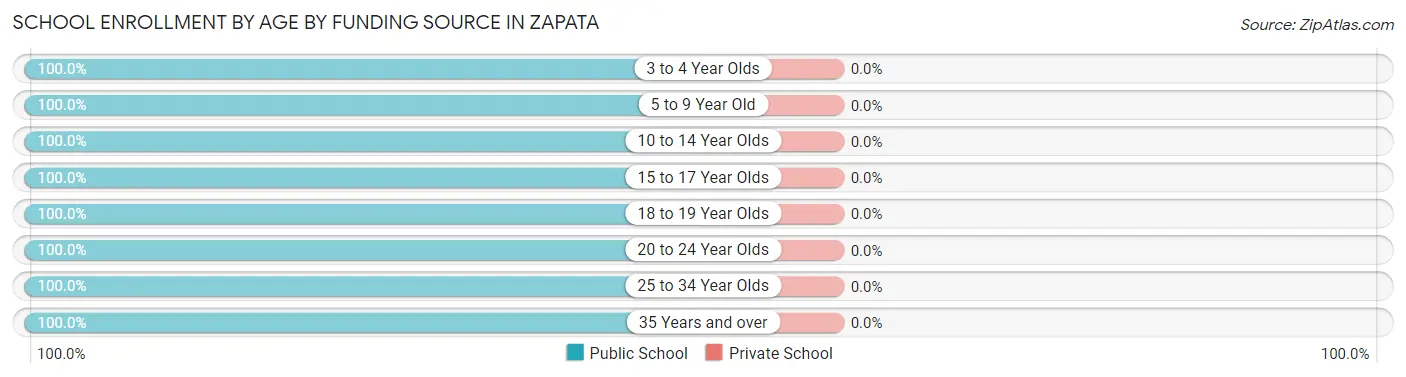
| Age Bracket | Public School | Private School |
| 3 to 4 Year Olds | 167 (100.0%) | 0 (0.0%) |
| 5 to 9 Year Old | 429 (100.0%) | 0 (0.0%) |
| 10 to 14 Year Olds | 343 (100.0%) | 0 (0.0%) |
| 15 to 17 Year Olds | 190 (100.0%) | 0 (0.0%) |
| 18 to 19 Year Olds | 145 (100.0%) | 0 (0.0%) |
| 20 to 24 Year Olds | 13 (100.0%) | 0 (0.0%) |
| 25 to 34 Year Olds | 53 (100.0%) | 0 (0.0%) |
| 35 Years and over | 27 (100.0%) | 0 (0.0%) |
| Total | 1,367 (100.0%) | 0 (0.0%) |
Educational Attainment by Field of Study in Zapata
Education (134 | 29.3%), science & technology (100 | 21.8%), business (88 | 19.2%), bio, nature & agricultural (43 | 9.4%), and physical & health sciences (37 | 8.1%) are the most common fields of study among 458 individuals in Zapata who have obtained a bachelor's degree or higher.
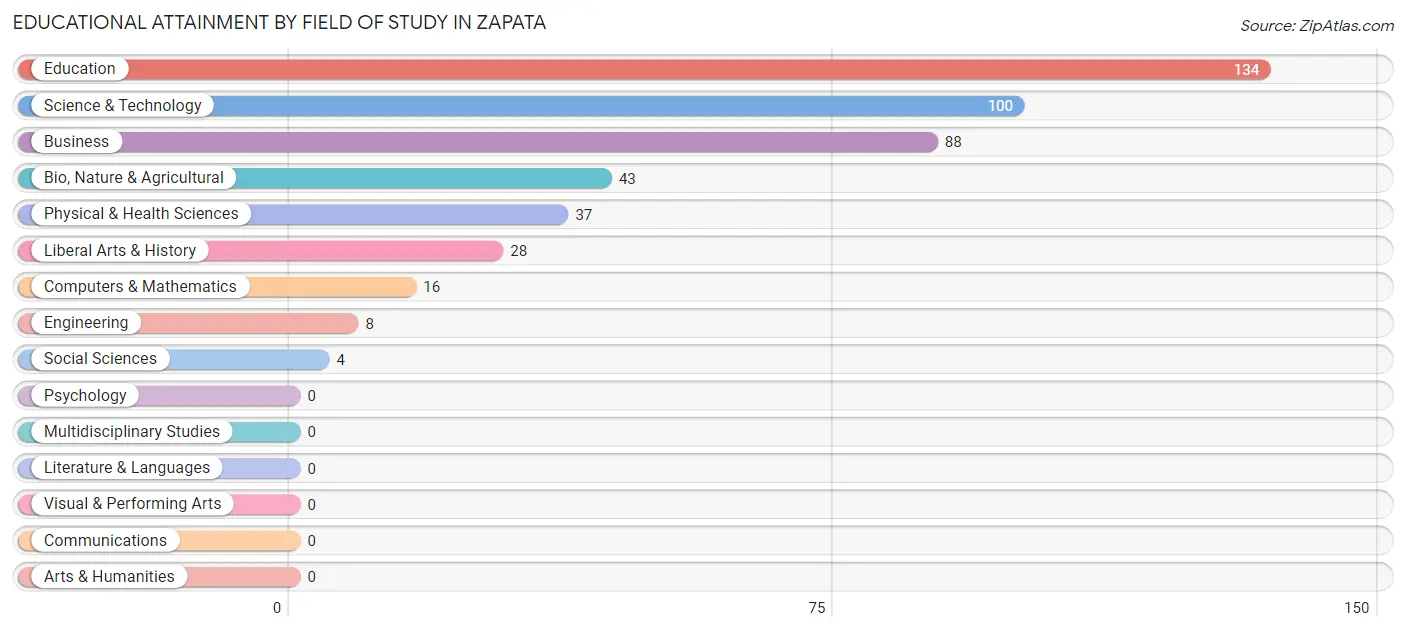
| Field of Study | # Graduates | % Graduates |
| Computers & Mathematics | 16 | 3.5% |
| Bio, Nature & Agricultural | 43 | 9.4% |
| Physical & Health Sciences | 37 | 8.1% |
| Psychology | 0 | 0.0% |
| Social Sciences | 4 | 0.9% |
| Engineering | 8 | 1.8% |
| Multidisciplinary Studies | 0 | 0.0% |
| Science & Technology | 100 | 21.8% |
| Business | 88 | 19.2% |
| Education | 134 | 29.3% |
| Literature & Languages | 0 | 0.0% |
| Liberal Arts & History | 28 | 6.1% |
| Visual & Performing Arts | 0 | 0.0% |
| Communications | 0 | 0.0% |
| Arts & Humanities | 0 | 0.0% |
| Total | 458 | 100.0% |
Transportation & Commute in Zapata
Vehicle Availability by Sex in Zapata
The most prevalent vehicle ownership categories in Zapata are males with 2 vehicles (445, accounting for 42.8%) and females with 2 vehicles (385, making up 54.3%).
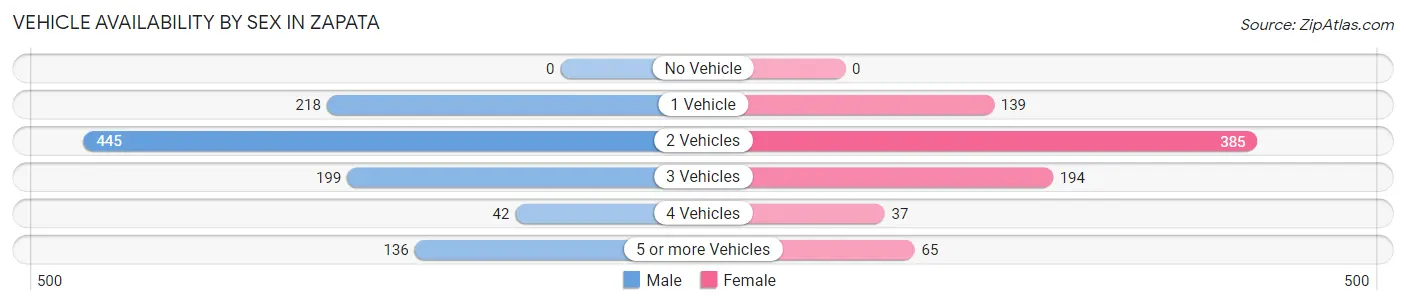
| Vehicles Available | Male | Female |
| No Vehicle | 0 (0.0%) | 0 (0.0%) |
| 1 Vehicle | 218 (21.0%) | 139 (17.0%) |
| 2 Vehicles | 445 (42.8%) | 385 (46.9%) |
| 3 Vehicles | 199 (19.1%) | 194 (23.7%) |
| 4 Vehicles | 42 (4.0%) | 37 (4.5%) |
| 5 or more Vehicles | 136 (13.1%) | 65 (7.9%) |
| Total | 1,040 (100.0%) | 820 (100.0%) |
Commute Time in Zapata
The most frequently occuring commute durations in Zapata are 10 to 14 minutes (564 commuters, 31.5%), 5 to 9 minutes (501 commuters, 28.0%), and 15 to 19 minutes (164 commuters, 9.2%).
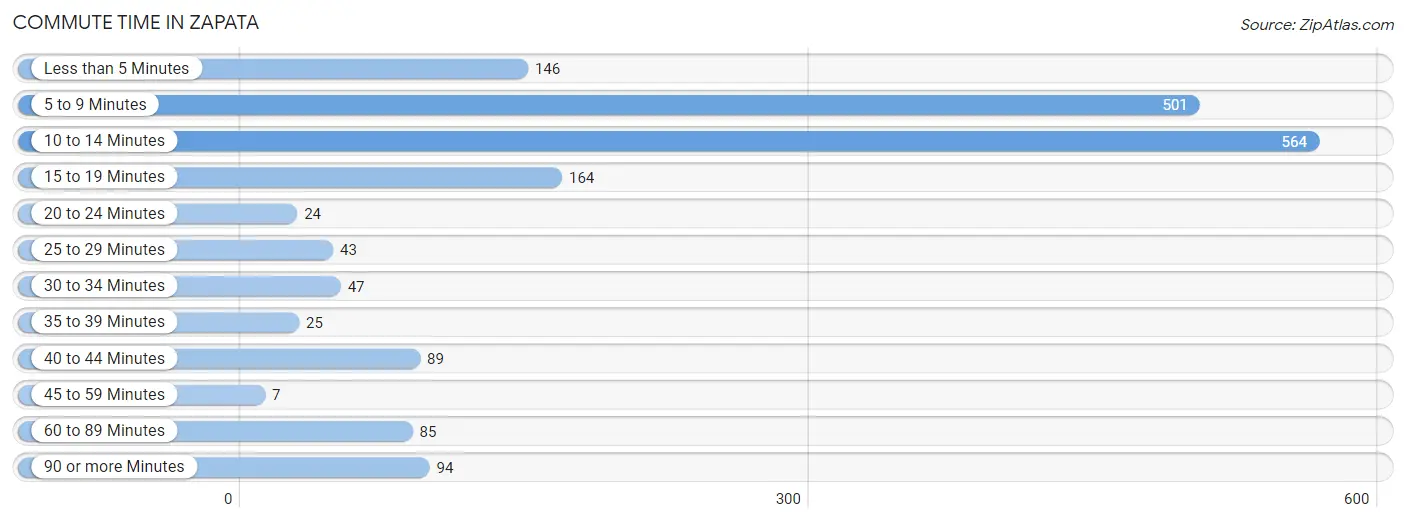
| Commute Time | # Commuters | % Commuters |
| Less than 5 Minutes | 146 | 8.2% |
| 5 to 9 Minutes | 501 | 28.0% |
| 10 to 14 Minutes | 564 | 31.5% |
| 15 to 19 Minutes | 164 | 9.2% |
| 20 to 24 Minutes | 24 | 1.3% |
| 25 to 29 Minutes | 43 | 2.4% |
| 30 to 34 Minutes | 47 | 2.6% |
| 35 to 39 Minutes | 25 | 1.4% |
| 40 to 44 Minutes | 89 | 5.0% |
| 45 to 59 Minutes | 7 | 0.4% |
| 60 to 89 Minutes | 85 | 4.8% |
| 90 or more Minutes | 94 | 5.2% |
Commute Time by Sex in Zapata
The most common commute times in Zapata are 10 to 14 minutes (268 commuters, 27.4%) for males and 10 to 14 minutes (296 commuters, 36.5%) for females.
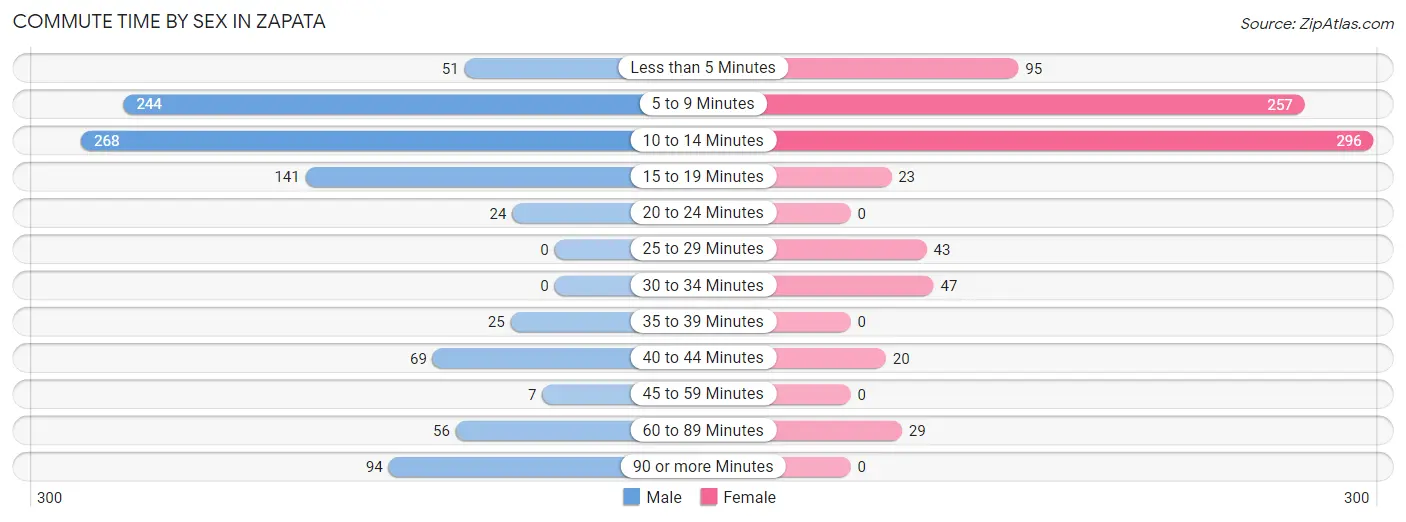
| Commute Time | Male | Female |
| Less than 5 Minutes | 51 (5.2%) | 95 (11.7%) |
| 5 to 9 Minutes | 244 (24.9%) | 257 (31.7%) |
| 10 to 14 Minutes | 268 (27.4%) | 296 (36.5%) |
| 15 to 19 Minutes | 141 (14.4%) | 23 (2.8%) |
| 20 to 24 Minutes | 24 (2.5%) | 0 (0.0%) |
| 25 to 29 Minutes | 0 (0.0%) | 43 (5.3%) |
| 30 to 34 Minutes | 0 (0.0%) | 47 (5.8%) |
| 35 to 39 Minutes | 25 (2.5%) | 0 (0.0%) |
| 40 to 44 Minutes | 69 (7.0%) | 20 (2.5%) |
| 45 to 59 Minutes | 7 (0.7%) | 0 (0.0%) |
| 60 to 89 Minutes | 56 (5.7%) | 29 (3.6%) |
| 90 or more Minutes | 94 (9.6%) | 0 (0.0%) |
Time of Departure to Work by Sex in Zapata
The most frequent times of departure to work in Zapata are 6:30 AM to 6:59 AM (154, 15.7%) for males and 7:30 AM to 7:59 AM (262, 32.4%) for females.
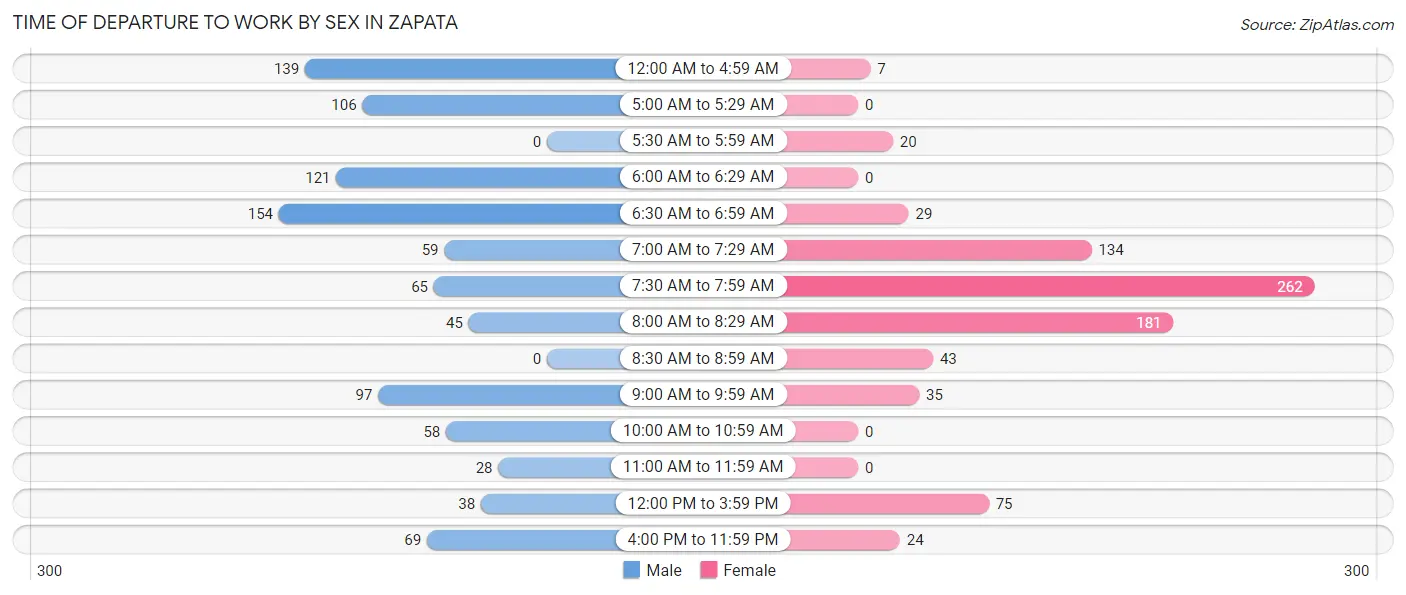
| Time of Departure | Male | Female |
| 12:00 AM to 4:59 AM | 139 (14.2%) | 7 (0.9%) |
| 5:00 AM to 5:29 AM | 106 (10.8%) | 0 (0.0%) |
| 5:30 AM to 5:59 AM | 0 (0.0%) | 20 (2.5%) |
| 6:00 AM to 6:29 AM | 121 (12.4%) | 0 (0.0%) |
| 6:30 AM to 6:59 AM | 154 (15.7%) | 29 (3.6%) |
| 7:00 AM to 7:29 AM | 59 (6.0%) | 134 (16.5%) |
| 7:30 AM to 7:59 AM | 65 (6.6%) | 262 (32.4%) |
| 8:00 AM to 8:29 AM | 45 (4.6%) | 181 (22.4%) |
| 8:30 AM to 8:59 AM | 0 (0.0%) | 43 (5.3%) |
| 9:00 AM to 9:59 AM | 97 (9.9%) | 35 (4.3%) |
| 10:00 AM to 10:59 AM | 58 (5.9%) | 0 (0.0%) |
| 11:00 AM to 11:59 AM | 28 (2.9%) | 0 (0.0%) |
| 12:00 PM to 3:59 PM | 38 (3.9%) | 75 (9.3%) |
| 4:00 PM to 11:59 PM | 69 (7.0%) | 24 (3.0%) |
| Total | 979 (100.0%) | 810 (100.0%) |
Housing Occupancy in Zapata
Occupancy by Ownership in Zapata
Of the total 1,889 dwellings in Zapata, owner-occupied units account for 1,273 (67.4%), while renter-occupied units make up 616 (32.6%).
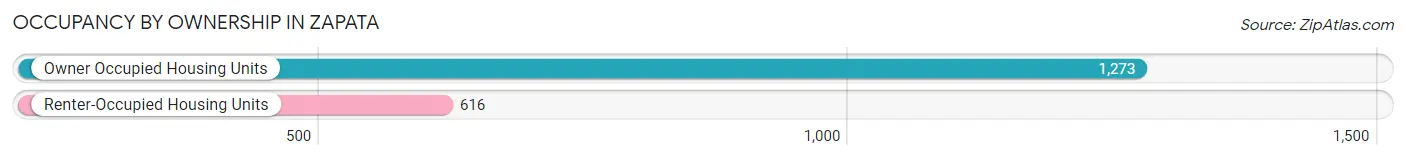
| Occupancy | # Housing Units | % Housing Units |
| Owner Occupied Housing Units | 1,273 | 67.4% |
| Renter-Occupied Housing Units | 616 | 32.6% |
| Total Occupied Housing Units | 1,889 | 100.0% |
Occupancy by Household Size in Zapata
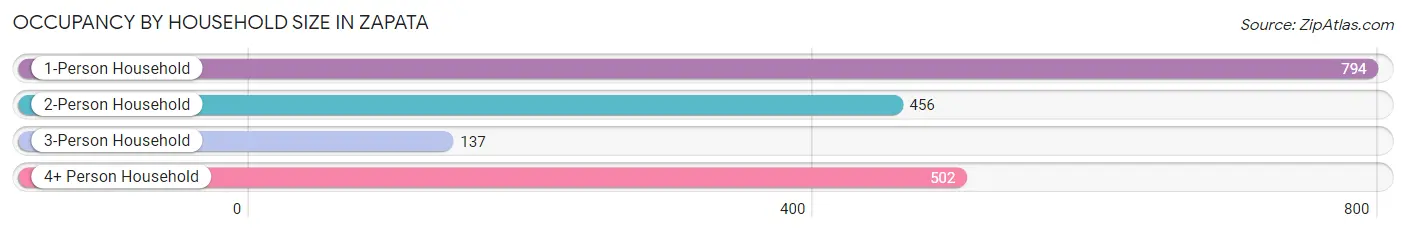
| Household Size | # Housing Units | % Housing Units |
| 1-Person Household | 794 | 42.0% |
| 2-Person Household | 456 | 24.1% |
| 3-Person Household | 137 | 7.2% |
| 4+ Person Household | 502 | 26.6% |
| Total Housing Units | 1,889 | 100.0% |
Occupancy by Ownership by Household Size in Zapata
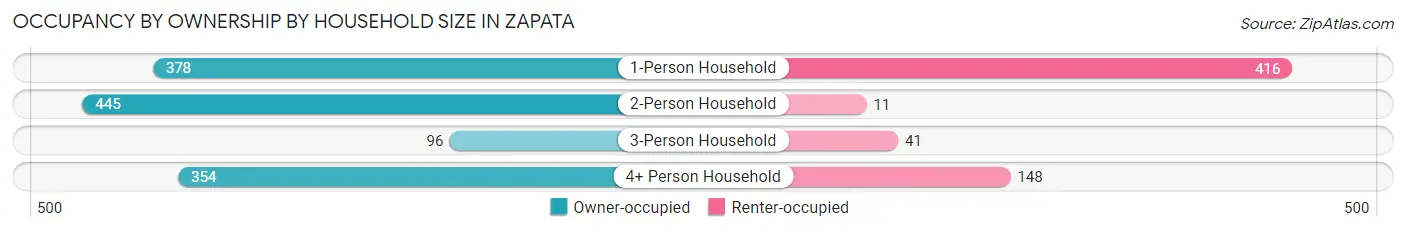
| Household Size | Owner-occupied | Renter-occupied |
| 1-Person Household | 378 (47.6%) | 416 (52.4%) |
| 2-Person Household | 445 (97.6%) | 11 (2.4%) |
| 3-Person Household | 96 (70.1%) | 41 (29.9%) |
| 4+ Person Household | 354 (70.5%) | 148 (29.5%) |
| Total Housing Units | 1,273 (67.4%) | 616 (32.6%) |
Occupancy by Educational Attainment in Zapata
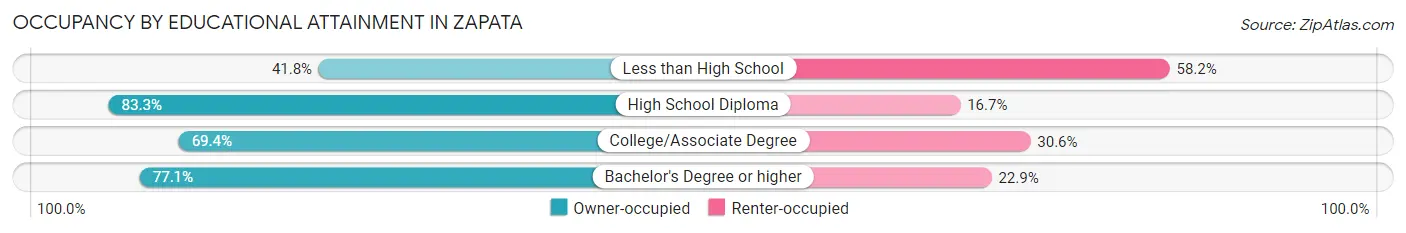
| Household Size | Owner-occupied | Renter-occupied |
| Less than High School | 223 (41.8%) | 310 (58.2%) |
| High School Diploma | 505 (83.3%) | 101 (16.7%) |
| College/Associate Degree | 302 (69.4%) | 133 (30.6%) |
| Bachelor's Degree or higher | 243 (77.1%) | 72 (22.9%) |
Occupancy by Age of Householder in Zapata
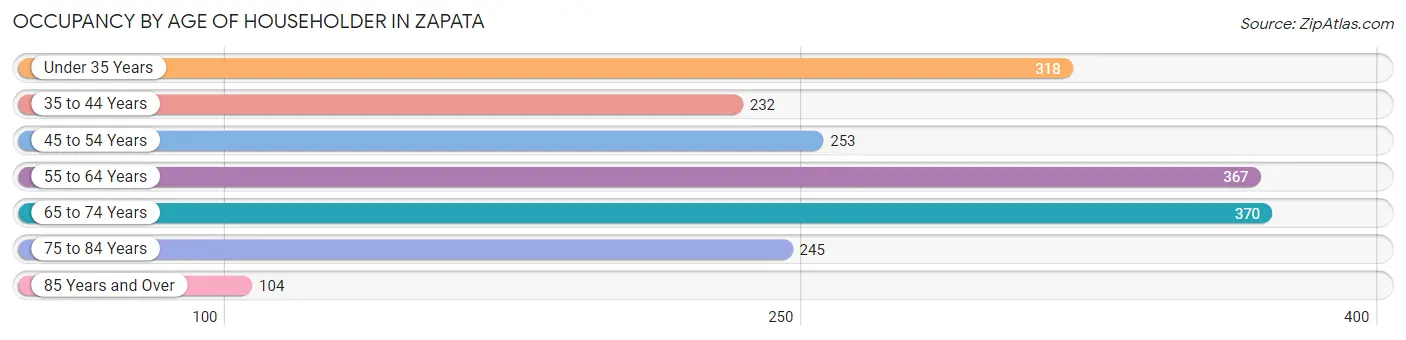
| Age Bracket | # Households | % Households |
| Under 35 Years | 318 | 16.8% |
| 35 to 44 Years | 232 | 12.3% |
| 45 to 54 Years | 253 | 13.4% |
| 55 to 64 Years | 367 | 19.4% |
| 65 to 74 Years | 370 | 19.6% |
| 75 to 84 Years | 245 | 13.0% |
| 85 Years and Over | 104 | 5.5% |
| Total | 1,889 | 100.0% |
Housing Finances in Zapata
Median Income by Occupancy in Zapata
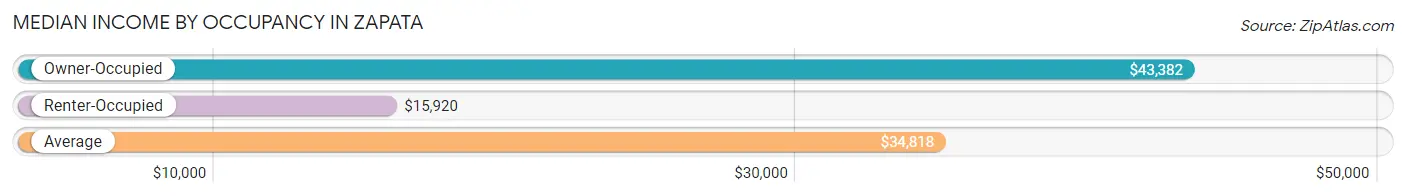
| Occupancy Type | # Households | Median Income |
| Owner-Occupied | 1,273 (67.4%) | $43,382 |
| Renter-Occupied | 616 (32.6%) | $15,920 |
| Average | 1,889 (100.0%) | $34,818 |
Occupancy by Householder Income Bracket in Zapata
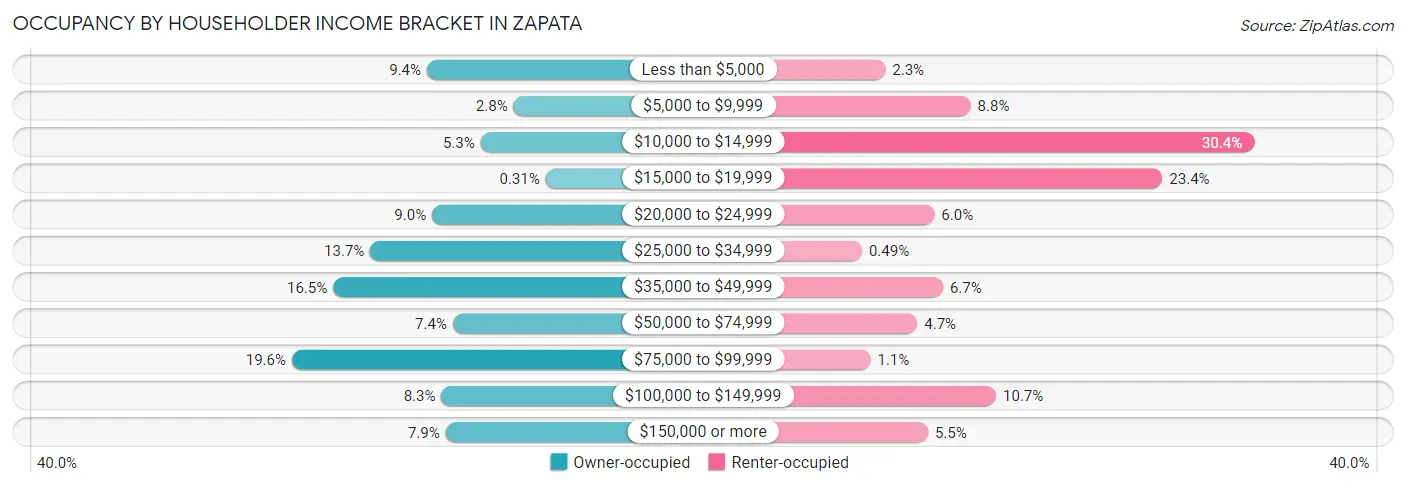
| Income Bracket | Owner-occupied | Renter-occupied |
| Less than $5,000 | 119 (9.3%) | 14 (2.3%) |
| $5,000 to $9,999 | 35 (2.8%) | 54 (8.8%) |
| $10,000 to $14,999 | 67 (5.3%) | 187 (30.4%) |
| $15,000 to $19,999 | 4 (0.3%) | 144 (23.4%) |
| $20,000 to $24,999 | 114 (9.0%) | 37 (6.0%) |
| $25,000 to $34,999 | 174 (13.7%) | 3 (0.5%) |
| $35,000 to $49,999 | 210 (16.5%) | 41 (6.7%) |
| $50,000 to $74,999 | 94 (7.4%) | 29 (4.7%) |
| $75,000 to $99,999 | 250 (19.6%) | 7 (1.1%) |
| $100,000 to $149,999 | 105 (8.3%) | 66 (10.7%) |
| $150,000 or more | 101 (7.9%) | 34 (5.5%) |
| Total | 1,273 (100.0%) | 616 (100.0%) |
Monthly Housing Cost Tiers in Zapata
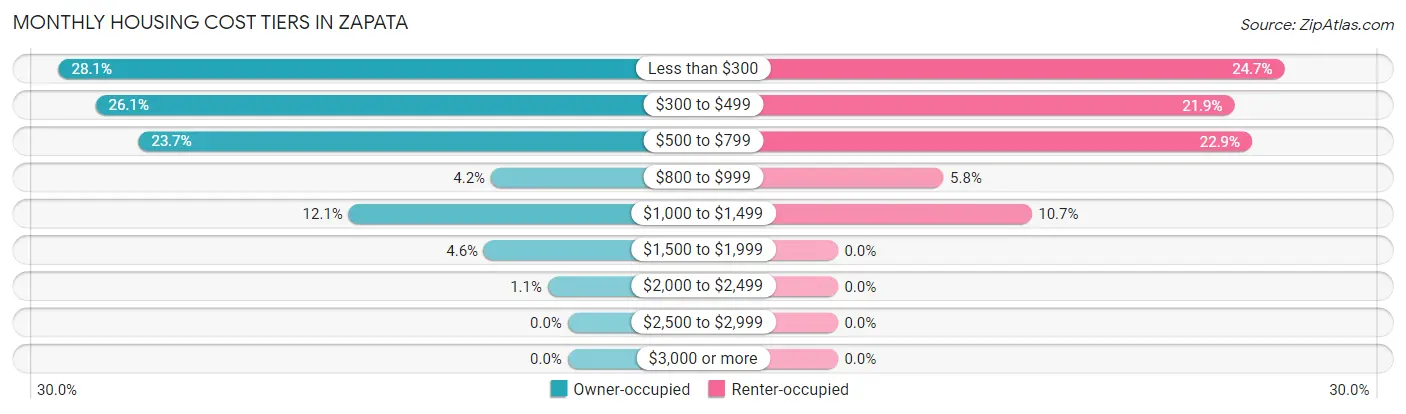
| Monthly Cost | Owner-occupied | Renter-occupied |
| Less than $300 | 358 (28.1%) | 152 (24.7%) |
| $300 to $499 | 332 (26.1%) | 135 (21.9%) |
| $500 to $799 | 302 (23.7%) | 141 (22.9%) |
| $800 to $999 | 54 (4.2%) | 36 (5.8%) |
| $1,000 to $1,499 | 154 (12.1%) | 66 (10.7%) |
| $1,500 to $1,999 | 59 (4.6%) | 0 (0.0%) |
| $2,000 to $2,499 | 14 (1.1%) | 0 (0.0%) |
| $2,500 to $2,999 | 0 (0.0%) | 0 (0.0%) |
| $3,000 or more | 0 (0.0%) | 0 (0.0%) |
| Total | 1,273 (100.0%) | 616 (100.0%) |
Physical Housing Characteristics in Zapata
Housing Structures in Zapata
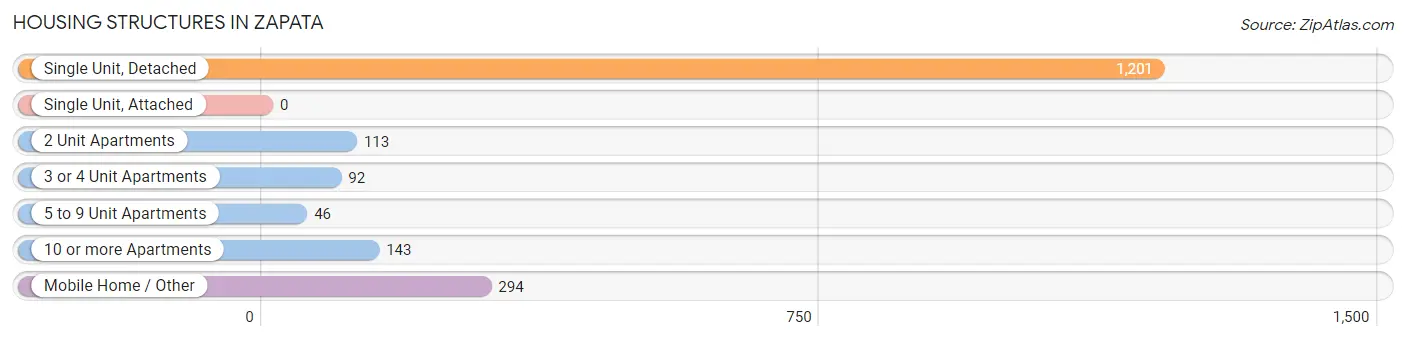
| Structure Type | # Housing Units | % Housing Units |
| Single Unit, Detached | 1,201 | 63.6% |
| Single Unit, Attached | 0 | 0.0% |
| 2 Unit Apartments | 113 | 6.0% |
| 3 or 4 Unit Apartments | 92 | 4.9% |
| 5 to 9 Unit Apartments | 46 | 2.4% |
| 10 or more Apartments | 143 | 7.6% |
| Mobile Home / Other | 294 | 15.6% |
| Total | 1,889 | 100.0% |
Housing Structures by Occupancy in Zapata
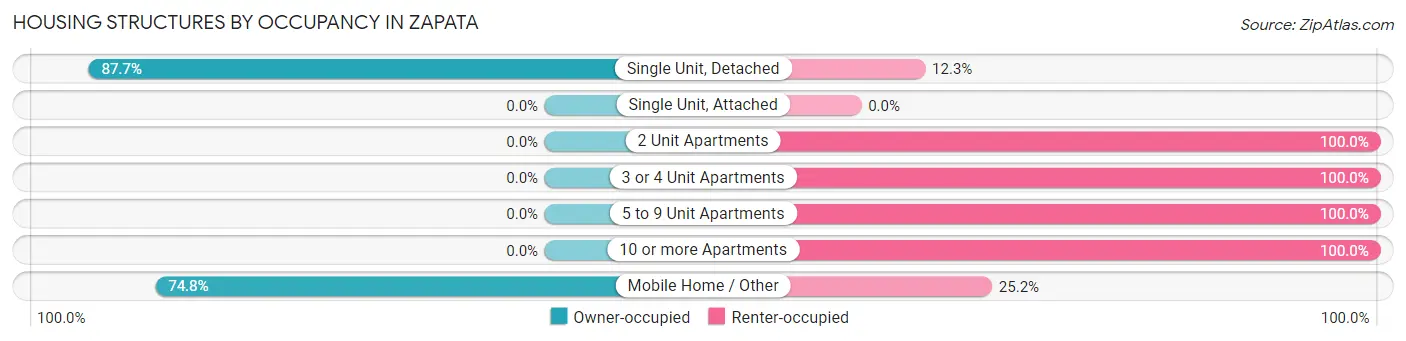
| Structure Type | Owner-occupied | Renter-occupied |
| Single Unit, Detached | 1,053 (87.7%) | 148 (12.3%) |
| Single Unit, Attached | 0 (0.0%) | 0 (0.0%) |
| 2 Unit Apartments | 0 (0.0%) | 113 (100.0%) |
| 3 or 4 Unit Apartments | 0 (0.0%) | 92 (100.0%) |
| 5 to 9 Unit Apartments | 0 (0.0%) | 46 (100.0%) |
| 10 or more Apartments | 0 (0.0%) | 143 (100.0%) |
| Mobile Home / Other | 220 (74.8%) | 74 (25.2%) |
| Total | 1,273 (67.4%) | 616 (32.6%) |
Housing Structures by Number of Rooms in Zapata
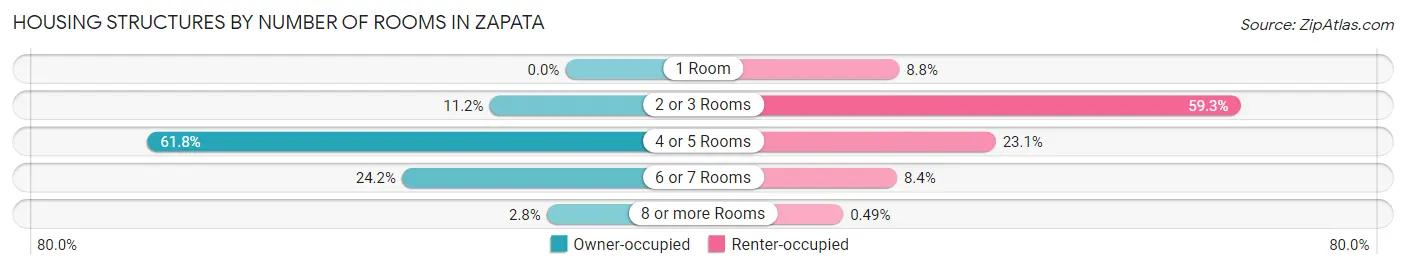
| Number of Rooms | Owner-occupied | Renter-occupied |
| 1 Room | 0 (0.0%) | 54 (8.8%) |
| 2 or 3 Rooms | 143 (11.2%) | 365 (59.3%) |
| 4 or 5 Rooms | 787 (61.8%) | 142 (23.1%) |
| 6 or 7 Rooms | 308 (24.2%) | 52 (8.4%) |
| 8 or more Rooms | 35 (2.8%) | 3 (0.5%) |
| Total | 1,273 (100.0%) | 616 (100.0%) |
Housing Structure by Heating Type in Zapata
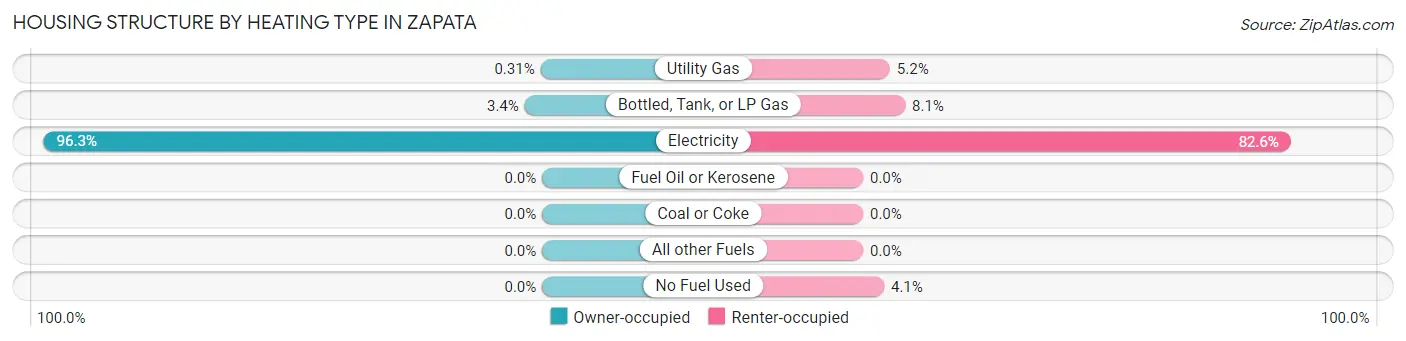
| Heating Type | Owner-occupied | Renter-occupied |
| Utility Gas | 4 (0.3%) | 32 (5.2%) |
| Bottled, Tank, or LP Gas | 43 (3.4%) | 50 (8.1%) |
| Electricity | 1,226 (96.3%) | 509 (82.6%) |
| Fuel Oil or Kerosene | 0 (0.0%) | 0 (0.0%) |
| Coal or Coke | 0 (0.0%) | 0 (0.0%) |
| All other Fuels | 0 (0.0%) | 0 (0.0%) |
| No Fuel Used | 0 (0.0%) | 25 (4.1%) |
| Total | 1,273 (100.0%) | 616 (100.0%) |
Household Vehicle Usage in Zapata
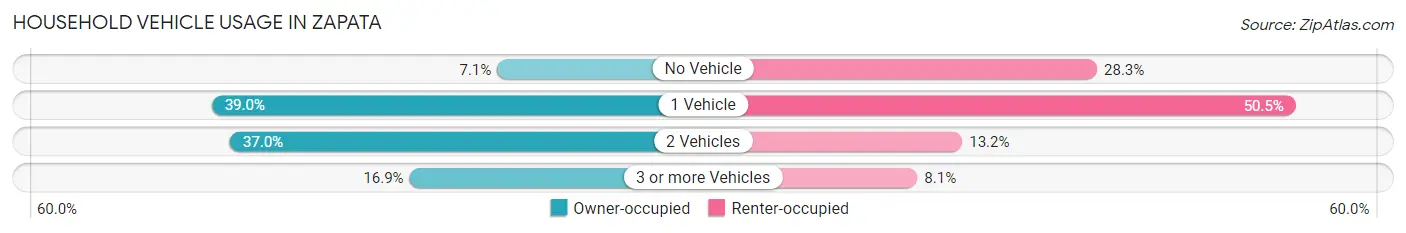
| Vehicles per Household | Owner-occupied | Renter-occupied |
| No Vehicle | 90 (7.1%) | 174 (28.2%) |
| 1 Vehicle | 497 (39.0%) | 311 (50.5%) |
| 2 Vehicles | 471 (37.0%) | 81 (13.2%) |
| 3 or more Vehicles | 215 (16.9%) | 50 (8.1%) |
| Total | 1,273 (100.0%) | 616 (100.0%) |
Real Estate & Mortgages in Zapata
Real Estate and Mortgage Overview in Zapata
| Characteristic | Without Mortgage | With Mortgage |
| Housing Units | 915 | 358 |
| Median Property Value | $92,300 | $136,700 |
| Median Household Income | $39,375 | $43 |
| Monthly Housing Costs | $374 | $0 |
| Real Estate Taxes | $815 | $0 |
Property Value by Mortgage Status in Zapata
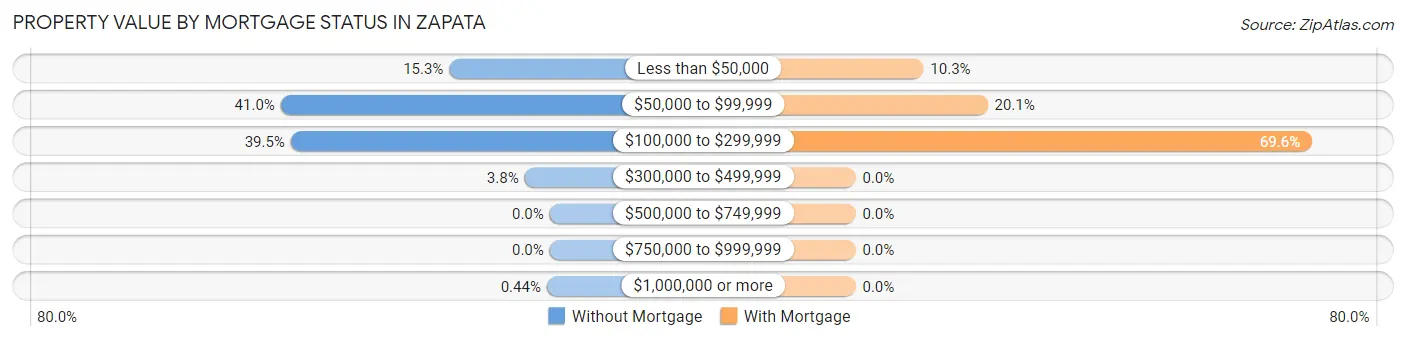
| Property Value | Without Mortgage | With Mortgage |
| Less than $50,000 | 140 (15.3%) | 37 (10.3%) |
| $50,000 to $99,999 | 375 (41.0%) | 72 (20.1%) |
| $100,000 to $299,999 | 361 (39.5%) | 249 (69.6%) |
| $300,000 to $499,999 | 35 (3.8%) | 0 (0.0%) |
| $500,000 to $749,999 | 0 (0.0%) | 0 (0.0%) |
| $750,000 to $999,999 | 0 (0.0%) | 0 (0.0%) |
| $1,000,000 or more | 4 (0.4%) | 0 (0.0%) |
| Total | 915 (100.0%) | 358 (100.0%) |
Household Income by Mortgage Status in Zapata
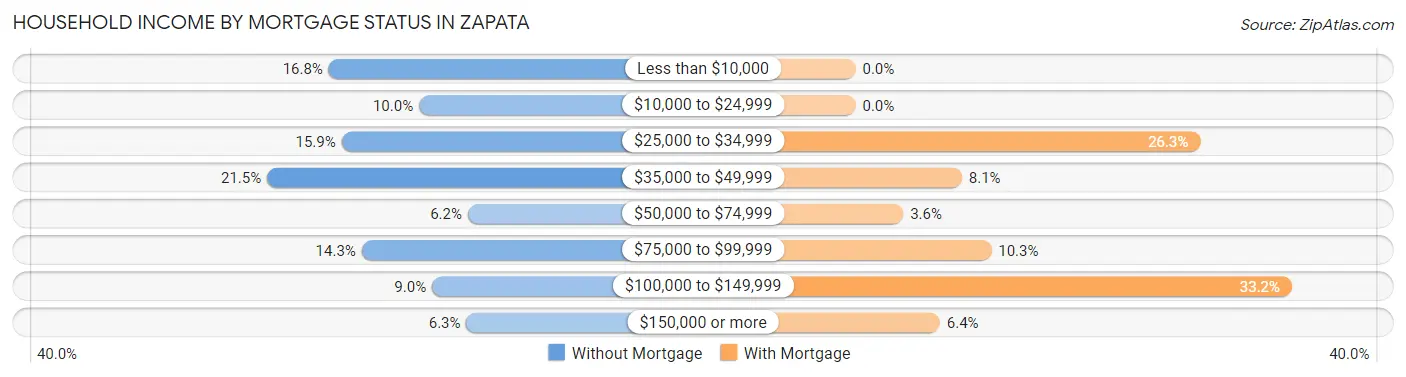
| Household Income | Without Mortgage | With Mortgage |
| Less than $10,000 | 154 (16.8%) | 0 (0.0%) |
| $10,000 to $24,999 | 91 (10.0%) | 0 (0.0%) |
| $25,000 to $34,999 | 145 (15.9%) | 94 (26.3%) |
| $35,000 to $49,999 | 197 (21.5%) | 29 (8.1%) |
| $50,000 to $74,999 | 57 (6.2%) | 13 (3.6%) |
| $75,000 to $99,999 | 131 (14.3%) | 37 (10.3%) |
| $100,000 to $149,999 | 82 (9.0%) | 119 (33.2%) |
| $150,000 or more | 58 (6.3%) | 23 (6.4%) |
| Total | 915 (100.0%) | 358 (100.0%) |
Property Value to Household Income Ratio in Zapata
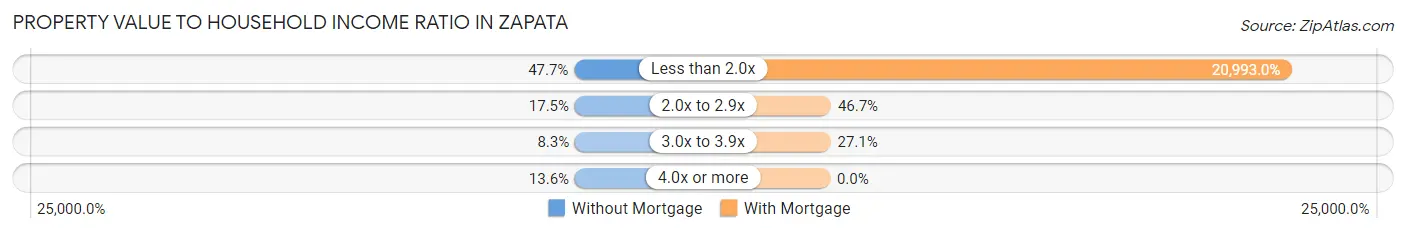
| Value-to-Income Ratio | Without Mortgage | With Mortgage |
| Less than 2.0x | 436 (47.6%) | 75,155 (20,993.0%) |
| 2.0x to 2.9x | 160 (17.5%) | 167 (46.7%) |
| 3.0x to 3.9x | 76 (8.3%) | 97 (27.1%) |
| 4.0x or more | 124 (13.6%) | 0 (0.0%) |
| Total | 915 (100.0%) | 358 (100.0%) |
Real Estate Taxes by Mortgage Status in Zapata
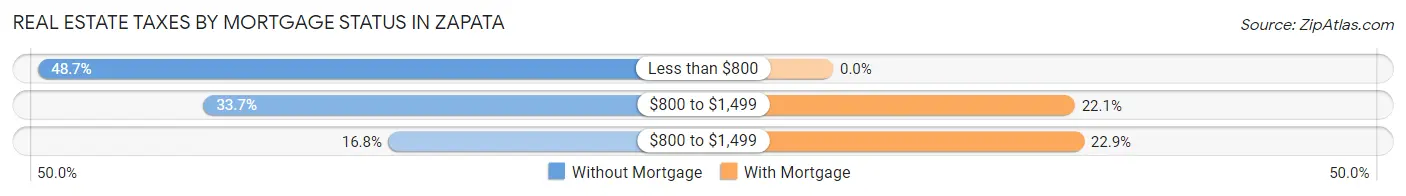
| Property Taxes | Without Mortgage | With Mortgage |
| Less than $800 | 446 (48.7%) | 0 (0.0%) |
| $800 to $1,499 | 308 (33.7%) | 79 (22.1%) |
| $800 to $1,499 | 154 (16.8%) | 82 (22.9%) |
| Total | 915 (100.0%) | 358 (100.0%) |
Health & Disability in Zapata
Health Insurance Coverage by Age in Zapata
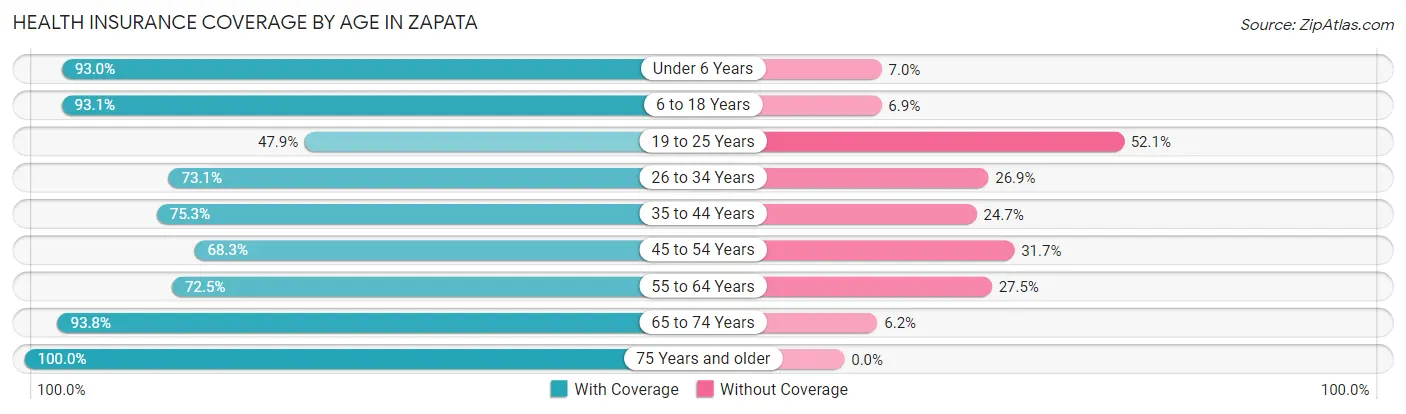
| Age Bracket | With Coverage | Without Coverage |
| Under 6 Years | 468 (93.0%) | 35 (7.0%) |
| 6 to 18 Years | 955 (93.1%) | 71 (6.9%) |
| 19 to 25 Years | 307 (47.9%) | 334 (52.1%) |
| 26 to 34 Years | 275 (73.1%) | 101 (26.9%) |
| 35 to 44 Years | 449 (75.3%) | 147 (24.7%) |
| 45 to 54 Years | 332 (68.3%) | 154 (31.7%) |
| 55 to 64 Years | 356 (72.5%) | 135 (27.5%) |
| 65 to 74 Years | 457 (93.8%) | 30 (6.2%) |
| 75 Years and older | 463 (100.0%) | 0 (0.0%) |
| Total | 4,062 (80.1%) | 1,007 (19.9%) |
Health Insurance Coverage by Citizenship Status in Zapata
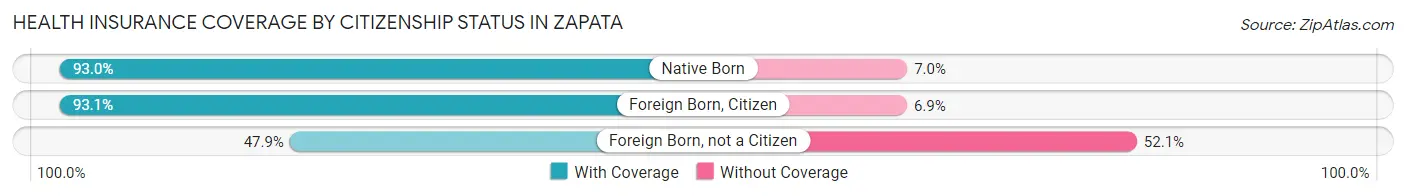
| Citizenship Status | With Coverage | Without Coverage |
| Native Born | 468 (93.0%) | 35 (7.0%) |
| Foreign Born, Citizen | 955 (93.1%) | 71 (6.9%) |
| Foreign Born, not a Citizen | 307 (47.9%) | 334 (52.1%) |
Health Insurance Coverage by Household Income in Zapata
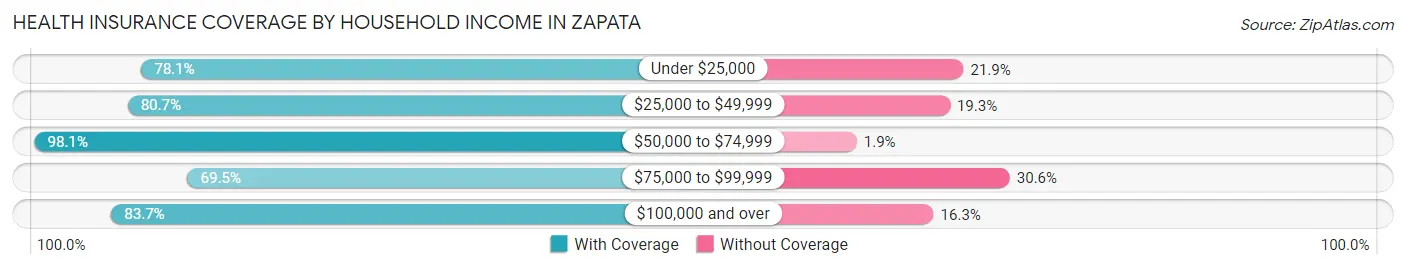
| Household Income | With Coverage | Without Coverage |
| Under $25,000 | 1,154 (78.1%) | 323 (21.9%) |
| $25,000 to $49,999 | 889 (80.7%) | 213 (19.3%) |
| $50,000 to $74,999 | 261 (98.1%) | 5 (1.9%) |
| $75,000 to $99,999 | 507 (69.5%) | 223 (30.5%) |
| $100,000 and over | 1,251 (83.7%) | 243 (16.3%) |
Public vs Private Health Insurance Coverage by Age in Zapata
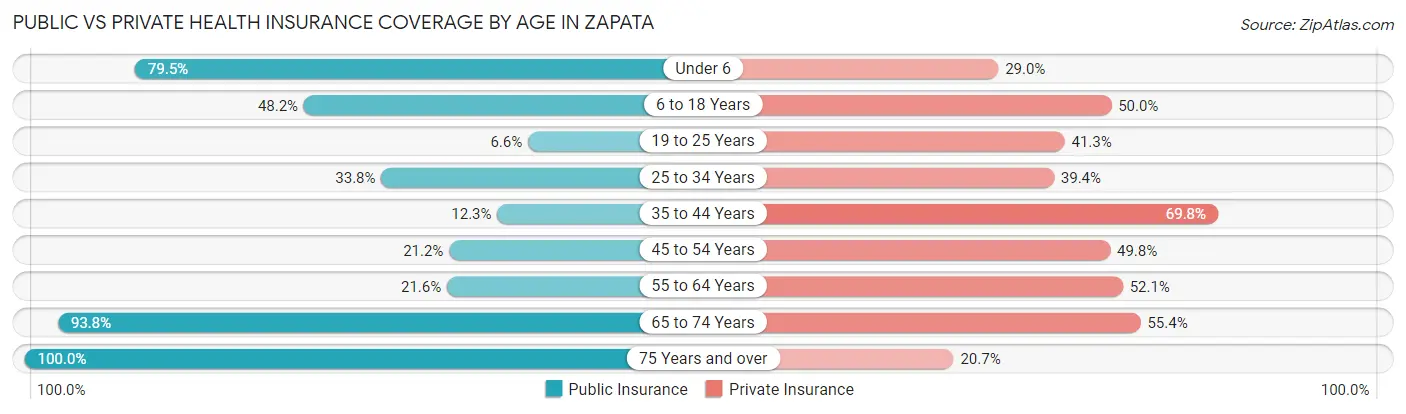
| Age Bracket | Public Insurance | Private Insurance |
| Under 6 | 400 (79.5%) | 146 (29.0%) |
| 6 to 18 Years | 494 (48.1%) | 513 (50.0%) |
| 19 to 25 Years | 42 (6.6%) | 265 (41.3%) |
| 25 to 34 Years | 127 (33.8%) | 148 (39.4%) |
| 35 to 44 Years | 73 (12.2%) | 416 (69.8%) |
| 45 to 54 Years | 103 (21.2%) | 242 (49.8%) |
| 55 to 64 Years | 106 (21.6%) | 256 (52.1%) |
| 65 to 74 Years | 457 (93.8%) | 270 (55.4%) |
| 75 Years and over | 463 (100.0%) | 96 (20.7%) |
| Total | 2,265 (44.7%) | 2,352 (46.4%) |
Disability Status by Sex by Age in Zapata
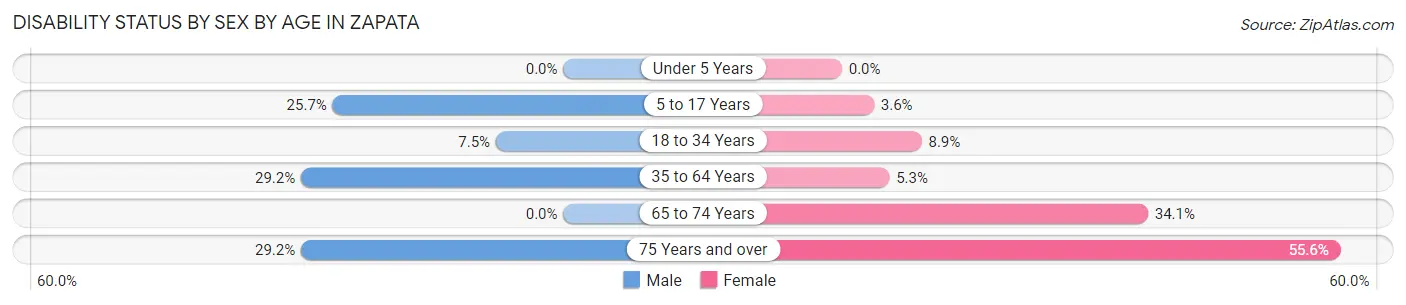
| Age Bracket | Male | Female |
| Under 5 Years | 0 (0.0%) | 0 (0.0%) |
| 5 to 17 Years | 103 (25.7%) | 20 (3.6%) |
| 18 to 34 Years | 50 (7.5%) | 43 (8.9%) |
| 35 to 64 Years | 227 (29.2%) | 42 (5.3%) |
| 65 to 74 Years | 0 (0.0%) | 61 (34.1%) |
| 75 Years and over | 59 (29.2%) | 145 (55.6%) |
Disability Class by Sex by Age in Zapata
Disability Class: Hearing Difficulty
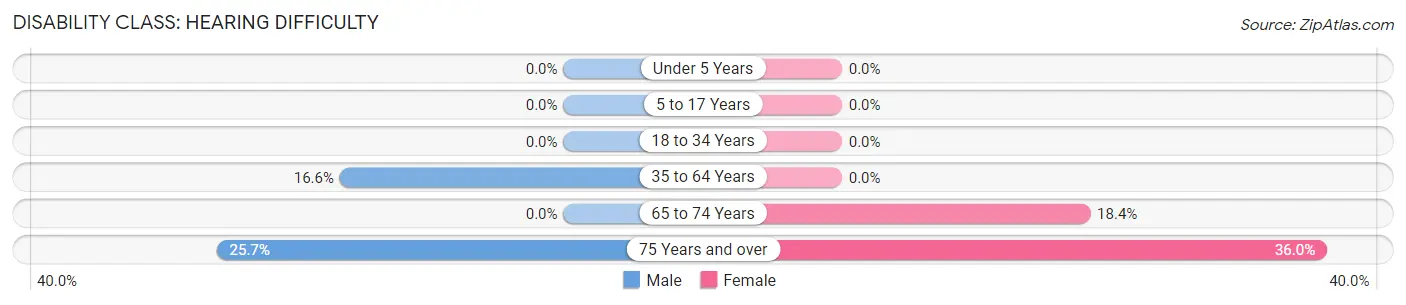
| Age Bracket | Male | Female |
| Under 5 Years | 0 (0.0%) | 0 (0.0%) |
| 5 to 17 Years | 0 (0.0%) | 0 (0.0%) |
| 18 to 34 Years | 0 (0.0%) | 0 (0.0%) |
| 35 to 64 Years | 129 (16.6%) | 0 (0.0%) |
| 65 to 74 Years | 0 (0.0%) | 33 (18.4%) |
| 75 Years and over | 52 (25.7%) | 94 (36.0%) |
Disability Class: Vision Difficulty
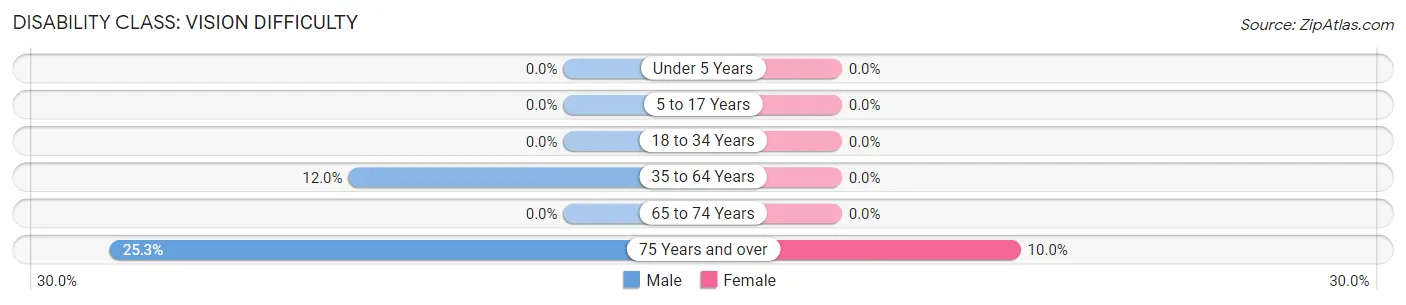
| Age Bracket | Male | Female |
| Under 5 Years | 0 (0.0%) | 0 (0.0%) |
| 5 to 17 Years | 0 (0.0%) | 0 (0.0%) |
| 18 to 34 Years | 0 (0.0%) | 0 (0.0%) |
| 35 to 64 Years | 93 (12.0%) | 0 (0.0%) |
| 65 to 74 Years | 0 (0.0%) | 0 (0.0%) |
| 75 Years and over | 51 (25.3%) | 26 (10.0%) |
Disability Class: Cognitive Difficulty
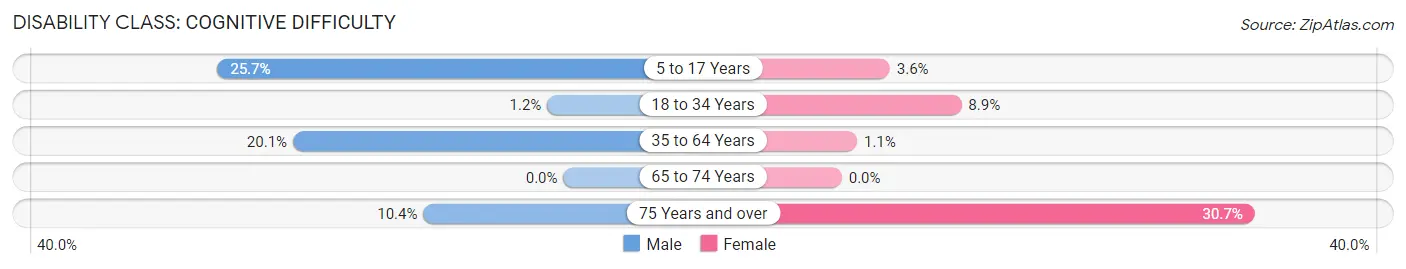
| Age Bracket | Male | Female |
| 5 to 17 Years | 103 (25.7%) | 20 (3.6%) |
| 18 to 34 Years | 8 (1.2%) | 43 (8.9%) |
| 35 to 64 Years | 156 (20.1%) | 9 (1.1%) |
| 65 to 74 Years | 0 (0.0%) | 0 (0.0%) |
| 75 Years and over | 21 (10.4%) | 80 (30.6%) |
Disability Class: Ambulatory Difficulty
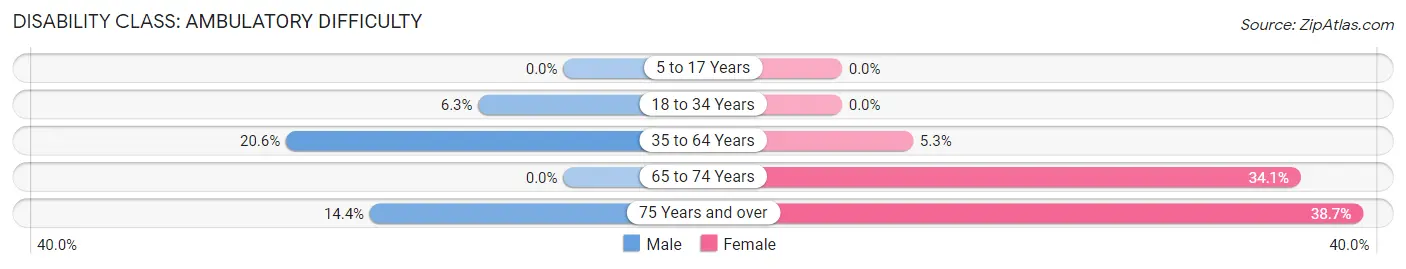
| Age Bracket | Male | Female |
| 5 to 17 Years | 0 (0.0%) | 0 (0.0%) |
| 18 to 34 Years | 42 (6.3%) | 0 (0.0%) |
| 35 to 64 Years | 160 (20.6%) | 42 (5.3%) |
| 65 to 74 Years | 0 (0.0%) | 61 (34.1%) |
| 75 Years and over | 29 (14.4%) | 101 (38.7%) |
Disability Class: Self-Care Difficulty
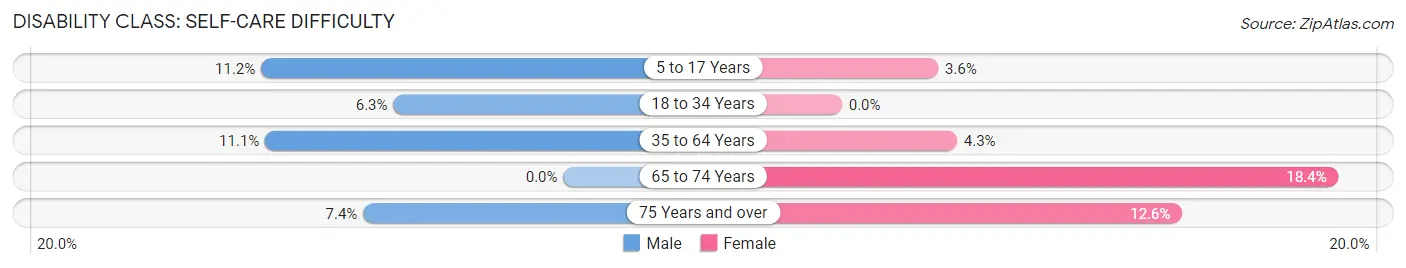
| Age Bracket | Male | Female |
| 5 to 17 Years | 45 (11.2%) | 20 (3.6%) |
| 18 to 34 Years | 42 (6.3%) | 0 (0.0%) |
| 35 to 64 Years | 86 (11.1%) | 34 (4.3%) |
| 65 to 74 Years | 0 (0.0%) | 33 (18.4%) |
| 75 Years and over | 15 (7.4%) | 33 (12.6%) |
Technology Access in Zapata
Computing Device Access in Zapata
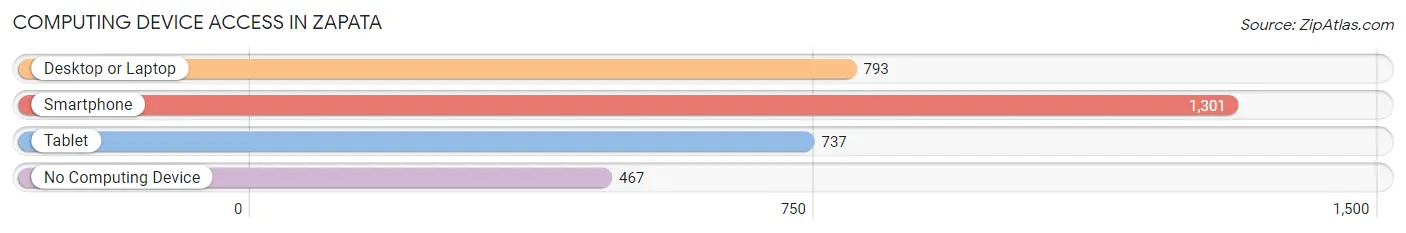
| Device Type | # Households | % Households |
| Desktop or Laptop | 793 | 42.0% |
| Smartphone | 1,301 | 68.9% |
| Tablet | 737 | 39.0% |
| No Computing Device | 467 | 24.7% |
| Total | 1,889 | 100.0% |
Internet Access in Zapata
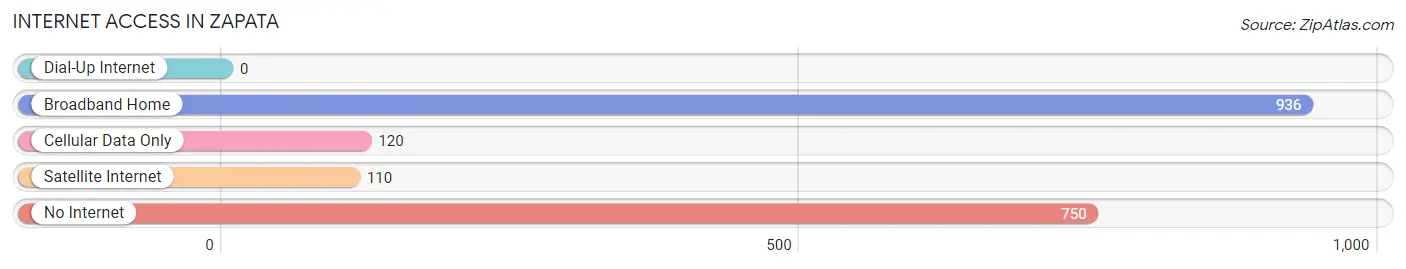
| Internet Type | # Households | % Households |
| Dial-Up Internet | 0 | 0.0% |
| Broadband Home | 936 | 49.5% |
| Cellular Data Only | 120 | 6.4% |
| Satellite Internet | 110 | 5.8% |
| No Internet | 750 | 39.7% |
| Total | 1,889 | 100.0% |
Zapata Summary
Zapata, Texas is a small town located in the southern part of the state, in the Rio Grande Valley. It is situated on the banks of the Rio Grande River, and is the county seat of Zapata County. The town was founded in 1858, and is named after the Mexican revolutionary leader Emiliano Zapata.
Geography
Zapata is located in the Rio Grande Valley, in the southern part of Texas. It is situated on the banks of the Rio Grande River, and is the county seat of Zapata County. The town is located at the intersection of U.S. Highway 83 and State Highway 16. The terrain is mostly flat, with some rolling hills in the area. The climate is subtropical, with hot summers and mild winters.
Economy
The economy of Zapata is largely based on agriculture and tourism. The town is home to several large farms, which produce a variety of crops, including cotton, corn, sorghum, and wheat. The town is also home to several tourist attractions, including the Zapata County Historical Museum, the Zapata County Courthouse, and the Zapata County Park.
Demographics
As of the 2010 census, the population of Zapata was 5,089. The racial makeup of the town was 79.3% Hispanic or Latino, 19.2% White, 0.3% African American, 0.2% Native American, 0.1% Asian, and 0.9% from other races. The median household income was $25,945, and the median family income was $30,917.
History
Zapata was founded in 1858, and is named after the Mexican revolutionary leader Emiliano Zapata. The town was originally a small farming community, and was home to several large farms. In the early 1900s, the town began to grow, and by the 1950s, it had become a popular tourist destination. The town was also home to several large ranches, which were used for cattle and sheep grazing.
In the late 1960s, the town began to experience a decline in population, as many of the farms and ranches closed down. In the 1980s, the town began to experience a resurgence, as new businesses and industries moved into the area. Today, Zapata is a thriving community, with a strong economy and a vibrant culture.
Common Questions
What is Per Capita Income in Zapata?
Per Capita income in Zapata is $21,739.
What is the Median Family Income in Zapata?
Median Family Income in Zapata is $43,468.
What is the Median Household income in Zapata?
Median Household Income in Zapata is $34,818.
What is Income or Wage Gap in Zapata?
Income or Wage Gap in Zapata is 6.2%.
Women in Zapata earn 93.8 cents for every dollar earned by a man.
What is Inequality or Gini Index in Zapata?
Inequality or Gini Index in Zapata is 0.53.
What is the Total Population of Zapata?
Total Population of Zapata is 5,110.
What is the Total Male Population of Zapata?
Total Male Population of Zapata is 2,616.
What is the Total Female Population of Zapata?
Total Female Population of Zapata is 2,494.
What is the Ratio of Males per 100 Females in Zapata?
There are 104.89 Males per 100 Females in Zapata.
What is the Ratio of Females per 100 Males in Zapata?
There are 95.34 Females per 100 Males in Zapata.
What is the Median Population Age in Zapata?
Median Population Age in Zapata is 35.1 Years.
What is the Average Family Size in Zapata
Average Family Size in Zapata is 3.8 People.
What is the Average Household Size in Zapata
Average Household Size in Zapata is 2.7 People.
How Large is the Labor Force in Zapata?
There are 1,976 People in the Labor Forcein in Zapata.
What is the Percentage of People in the Labor Force in Zapata?
51.3% of People are in the Labor Force in Zapata.
What is the Unemployment Rate in Zapata?
Unemployment Rate in Zapata is 2.1%.