Woodsboro, TX Map & Demographics
Woodsboro Map
Woodsboro Overview
$27,315
PER CAPITA INCOME
$67,833
AVG FAMILY INCOME
$57,143
AVG HOUSEHOLD INCOME
4.0%
WAGE / INCOME GAP [ % ]
96.0¢/ $1
WAGE / INCOME GAP [ $ ]
0.38
INEQUALITY / GINI INDEX
1,227
TOTAL POPULATION
603
MALE POPULATION
624
FEMALE POPULATION
96.63
MALES / 100 FEMALES
103.48
FEMALES / 100 MALES
31.1
MEDIAN AGE
5.5
AVG FAMILY SIZE
4.0
AVG HOUSEHOLD SIZE
601
LABOR FORCE [ PEOPLE ]
59.3%
PERCENT IN LABOR FORCE
4.2%
UNEMPLOYMENT RATE
Woodsboro Zip Codes
Woodsboro Area Codes
Income in Woodsboro
Income Overview in Woodsboro
Per Capita Income in Woodsboro is $27,315, while median incomes of families and households are $67,833 and $57,143 respectively.
| Characteristic | Number | Measure |
| Per Capita Income | 1,227 | $27,315 |
| Median Family Income | 202 | $67,833 |
| Mean Family Income | 202 | $88,810 |
| Median Household Income | 308 | $57,143 |
| Mean Household Income | 308 | $73,881 |
| Income Deficit | 202 | $0 |
| Wage / Income Gap (%) | 1,227 | 4.02% |
| Wage / Income Gap ($) | 1,227 | 95.98¢ per $1 |
| Gini / Inequality Index | 1,227 | 0.38 |
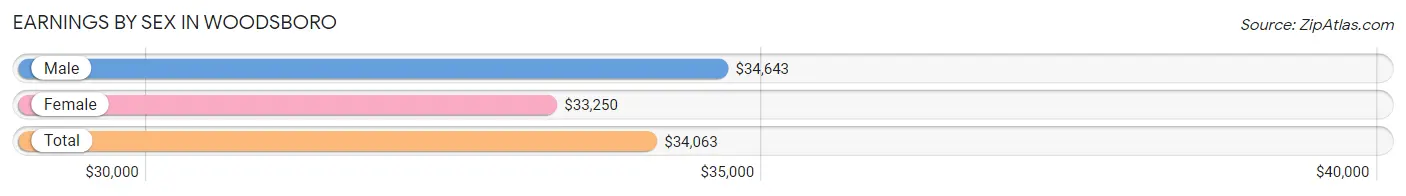
Earnings by Sex in Woodsboro
Average Earnings in Woodsboro are $34,063, $34,643 for men and $33,250 for women, a difference of 4.0%.
| Sex | Number | Average Earnings |
| Male | 372 (57.5%) | $34,643 |
| Female | 275 (42.5%) | $33,250 |
| Total | 647 (100.0%) | $34,063 |
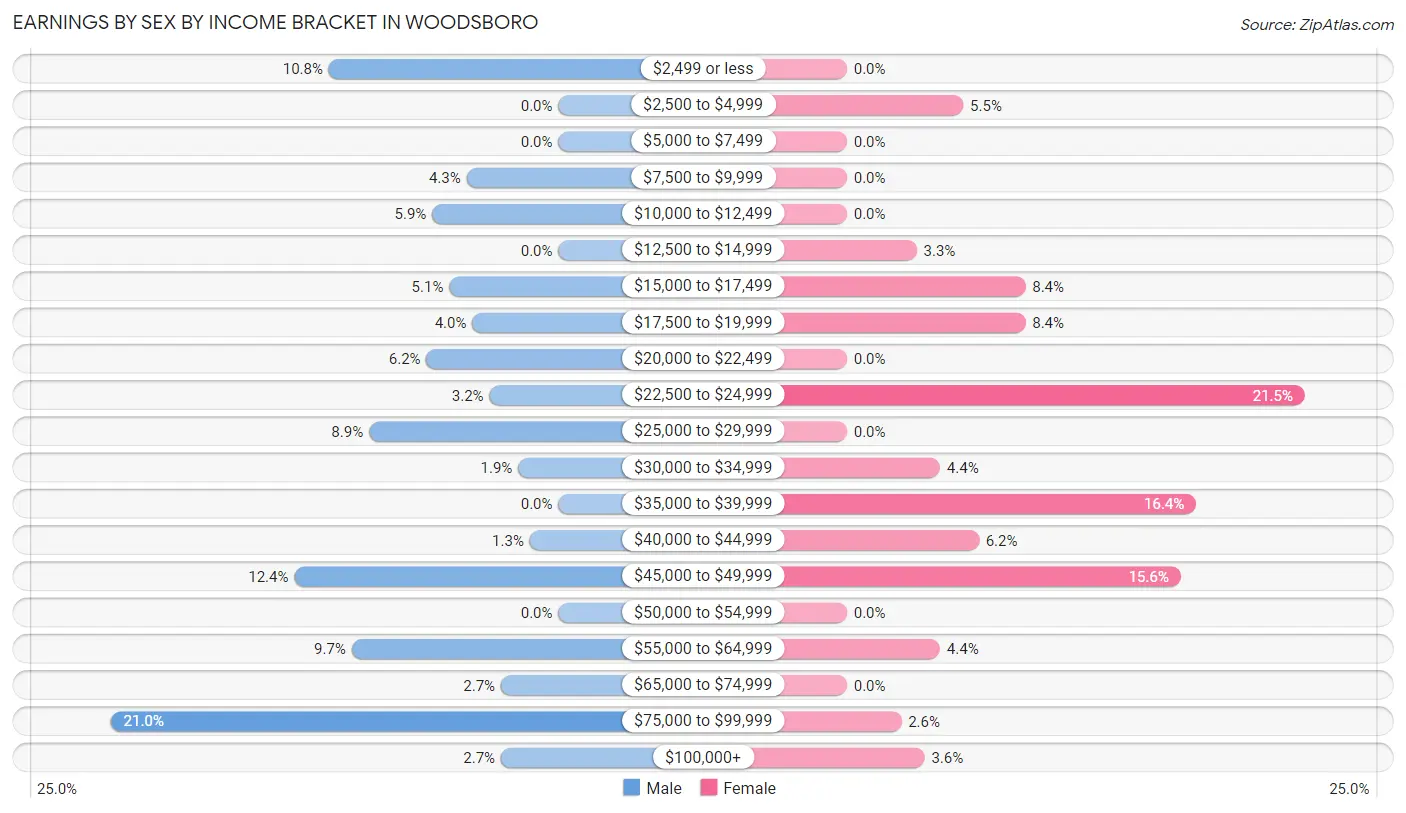
Earnings by Sex by Income Bracket in Woodsboro
The most common earnings brackets in Woodsboro are $75,000 to $99,999 for men (78 | 21.0%) and $22,500 to $24,999 for women (59 | 21.4%).
| Income | Male | Female |
| $2,499 or less | 40 (10.7%) | 0 (0.0%) |
| $2,500 to $4,999 | 0 (0.0%) | 15 (5.4%) |
| $5,000 to $7,499 | 0 (0.0%) | 0 (0.0%) |
| $7,500 to $9,999 | 16 (4.3%) | 0 (0.0%) |
| $10,000 to $12,499 | 22 (5.9%) | 0 (0.0%) |
| $12,500 to $14,999 | 0 (0.0%) | 9 (3.3%) |
| $15,000 to $17,499 | 19 (5.1%) | 23 (8.4%) |
| $17,500 to $19,999 | 15 (4.0%) | 23 (8.4%) |
| $20,000 to $22,499 | 23 (6.2%) | 0 (0.0%) |
| $22,500 to $24,999 | 12 (3.2%) | 59 (21.4%) |
| $25,000 to $29,999 | 33 (8.9%) | 0 (0.0%) |
| $30,000 to $34,999 | 7 (1.9%) | 12 (4.4%) |
| $35,000 to $39,999 | 0 (0.0%) | 45 (16.4%) |
| $40,000 to $44,999 | 5 (1.3%) | 17 (6.2%) |
| $45,000 to $49,999 | 46 (12.4%) | 43 (15.6%) |
| $50,000 to $54,999 | 0 (0.0%) | 0 (0.0%) |
| $55,000 to $64,999 | 36 (9.7%) | 12 (4.4%) |
| $65,000 to $74,999 | 10 (2.7%) | 0 (0.0%) |
| $75,000 to $99,999 | 78 (21.0%) | 7 (2.5%) |
| $100,000+ | 10 (2.7%) | 10 (3.6%) |
| Total | 372 (100.0%) | 275 (100.0%) |
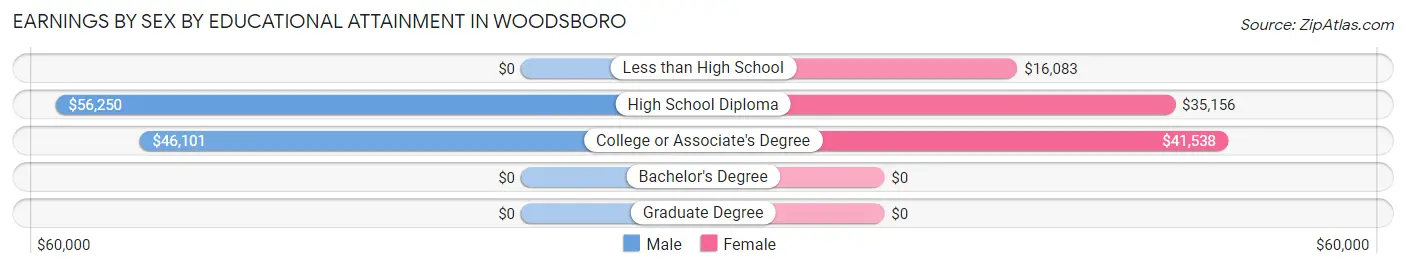
Earnings by Sex by Educational Attainment in Woodsboro
Average earnings in Woodsboro are $46,196 for men and $36,992 for women, a difference of 19.9%. Men with an educational attainment of high school diploma enjoy the highest average annual earnings of $56,250, while those with college or associate's degree education earn the least with $46,101. Women with an educational attainment of college or associate's degree earn the most with the average annual earnings of $41,538, while those with less than high school education have the smallest earnings of $16,083.
| Educational Attainment | Male Income | Female Income |
| Less than High School | - | - |
| High School Diploma | $56,250 | $35,156 |
| College or Associate's Degree | $46,101 | $41,538 |
| Bachelor's Degree | - | - |
| Graduate Degree | - | - |
| Total | $46,196 | $36,992 |
Family Income in Woodsboro
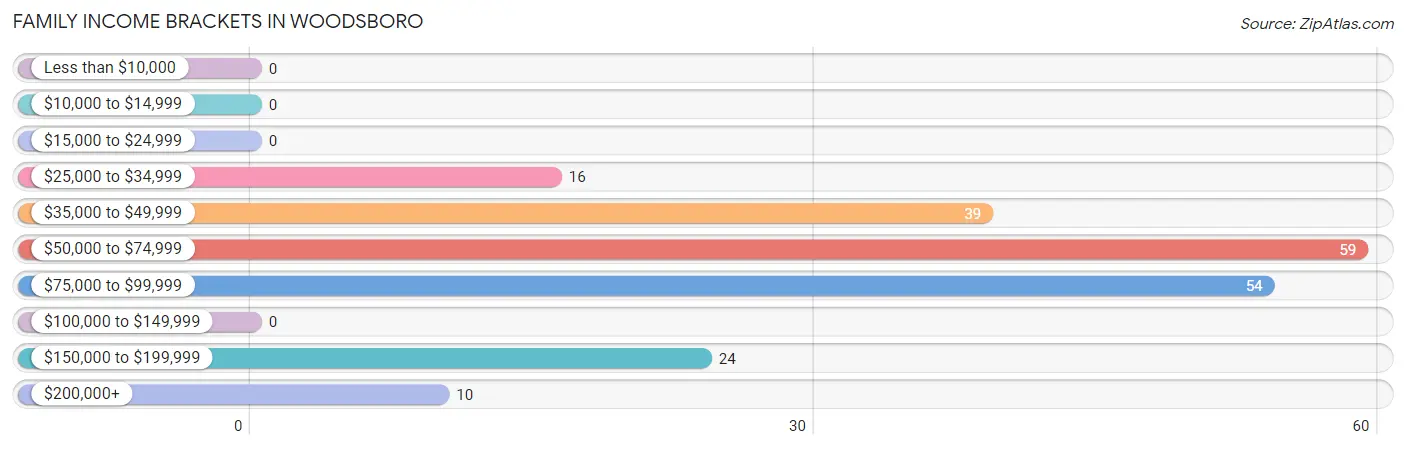
Family Income Brackets in Woodsboro
According to the Woodsboro family income data, there are 59 families falling into the $50,000 to $74,999 income range, which is the most common income bracket and makes up 29.2% of all families.
| Income Bracket | # Families | % Families |
| Less than $10,000 | 0 | 0.0% |
| $10,000 to $14,999 | 0 | 0.0% |
| $15,000 to $24,999 | 0 | 0.0% |
| $25,000 to $34,999 | 16 | 7.9% |
| $35,000 to $49,999 | 39 | 19.3% |
| $50,000 to $74,999 | 59 | 29.2% |
| $75,000 to $99,999 | 54 | 26.7% |
| $100,000 to $149,999 | 0 | 0.0% |
| $150,000 to $199,999 | 24 | 11.9% |
| $200,000+ | 10 | 5.0% |
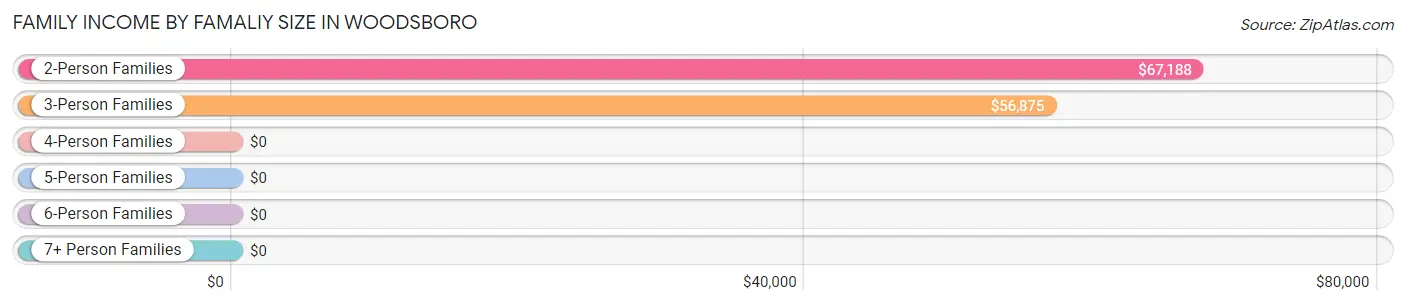
Family Income by Famaliy Size in Woodsboro
2-person families (57 | 28.2%) account for the highest median family income in Woodsboro with $67,188 per family, while 2-person families (57 | 28.2%) have the highest median income of $33,594 per family member.
| Income Bracket | # Families | Median Income |
| 2-Person Families | 57 (28.2%) | $67,188 |
| 3-Person Families | 66 (32.7%) | $56,875 |
| 4-Person Families | 47 (23.3%) | $0 |
| 5-Person Families | 17 (8.4%) | $0 |
| 6-Person Families | 0 (0.0%) | $0 |
| 7+ Person Families | 15 (7.4%) | $0 |
| Total | 202 (100.0%) | $67,833 |
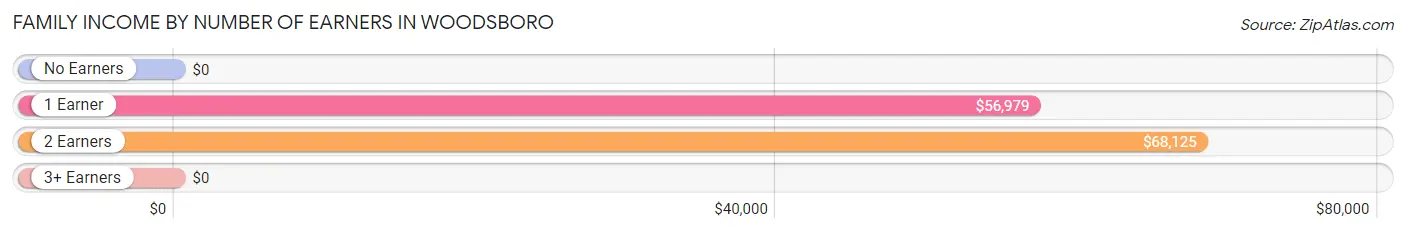
Family Income by Number of Earners in Woodsboro
| Number of Earners | # Families | Median Income |
| No Earners | 33 (16.3%) | $0 |
| 1 Earner | 27 (13.4%) | $56,979 |
| 2 Earners | 81 (40.1%) | $68,125 |
| 3+ Earners | 61 (30.2%) | $0 |
| Total | 202 (100.0%) | $67,833 |
Household Income in Woodsboro
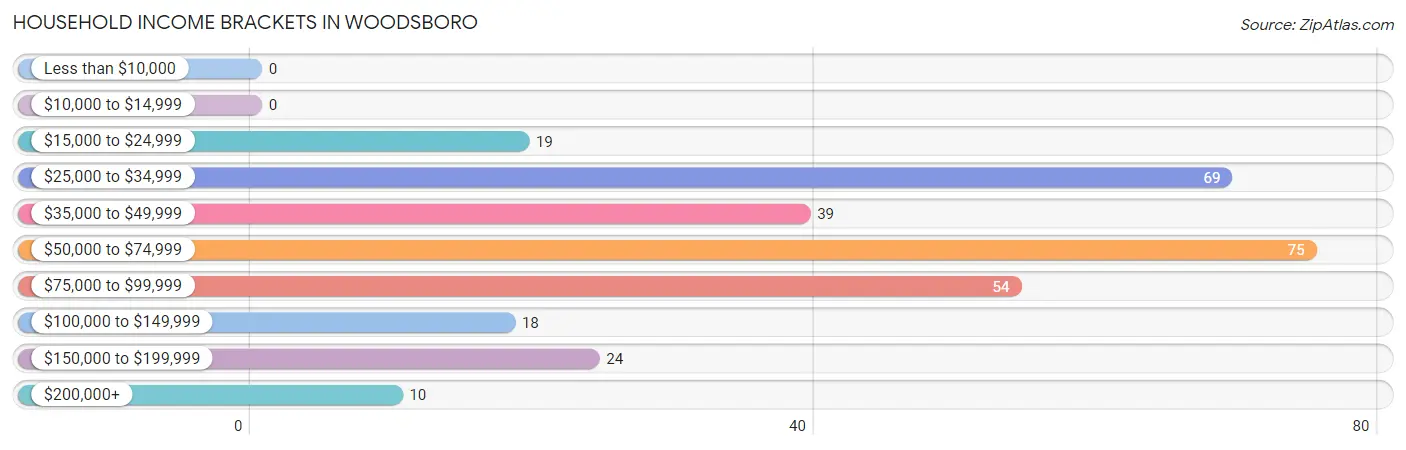
Household Income Brackets in Woodsboro
With 75 households falling in the category, the $50,000 to $74,999 income range is the most frequent in Woodsboro, accounting for 24.3% of all households.
| Income Bracket | # Households | % Households |
| Less than $10,000 | 0 | 0.0% |
| $10,000 to $14,999 | 0 | 0.0% |
| $15,000 to $24,999 | 19 | 6.2% |
| $25,000 to $34,999 | 69 | 22.4% |
| $35,000 to $49,999 | 39 | 12.7% |
| $50,000 to $74,999 | 75 | 24.4% |
| $75,000 to $99,999 | 54 | 17.5% |
| $100,000 to $149,999 | 18 | 5.8% |
| $150,000 to $199,999 | 24 | 7.8% |
| $200,000+ | 10 | 3.2% |
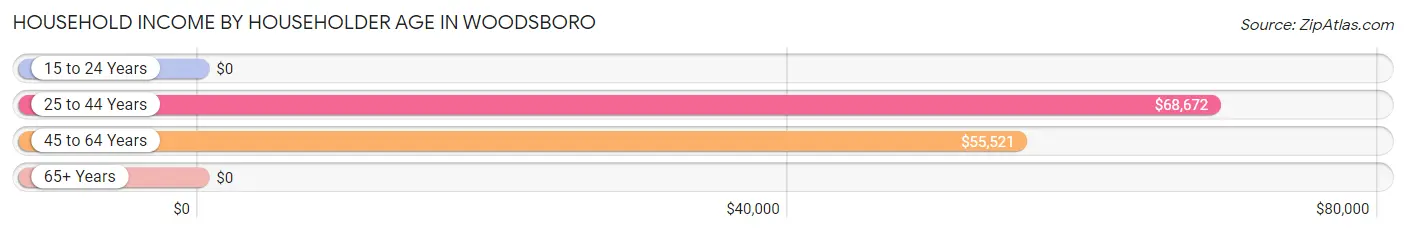
Household Income by Householder Age in Woodsboro
The median household income in Woodsboro is $57,143, with the highest median household income of $68,672 found in the 25 to 44 years age bracket for the primary householder. A total of 51 households (16.6%) fall into this category.
| Income Bracket | # Households | Median Income |
| 15 to 24 Years | 0 (0.0%) | $0 |
| 25 to 44 Years | 51 (16.6%) | $68,672 |
| 45 to 64 Years | 121 (39.3%) | $55,521 |
| 65+ Years | 136 (44.2%) | $0 |
| Total | 308 (100.0%) | $57,143 |
Poverty in Woodsboro
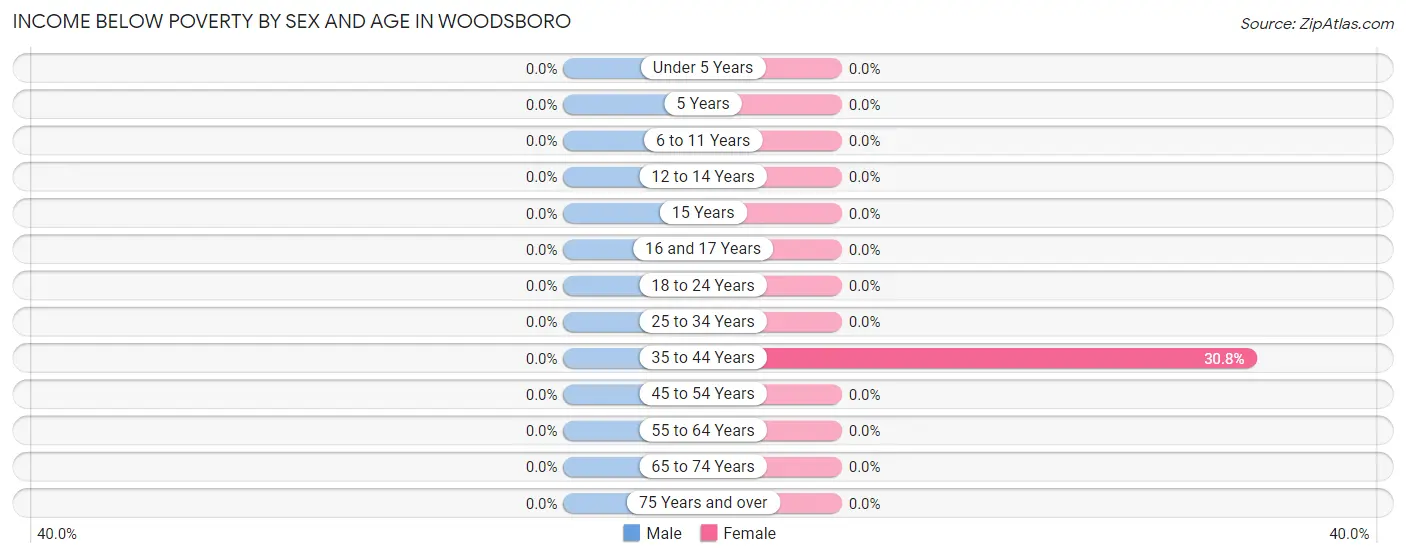
Income Below Poverty by Sex and Age in Woodsboro
| Age Bracket | Male | Female |
| Under 5 Years | 0 (0.0%) | 0 (0.0%) |
| 5 Years | 0 (0.0%) | 0 (0.0%) |
| 6 to 11 Years | 0 (0.0%) | 0 (0.0%) |
| 12 to 14 Years | 0 (0.0%) | 0 (0.0%) |
| 15 Years | 0 (0.0%) | 0 (0.0%) |
| 16 and 17 Years | 0 (0.0%) | 0 (0.0%) |
| 18 to 24 Years | 0 (0.0%) | 0 (0.0%) |
| 25 to 34 Years | 0 (0.0%) | 0 (0.0%) |
| 35 to 44 Years | 0 (0.0%) | 16 (30.8%) |
| 45 to 54 Years | 0 (0.0%) | 0 (0.0%) |
| 55 to 64 Years | 0 (0.0%) | 0 (0.0%) |
| 65 to 74 Years | 0 (0.0%) | 0 (0.0%) |
| 75 Years and over | 0 (0.0%) | 0 (0.0%) |
| Total | 0 (0.0%) | 16 (2.6%) |
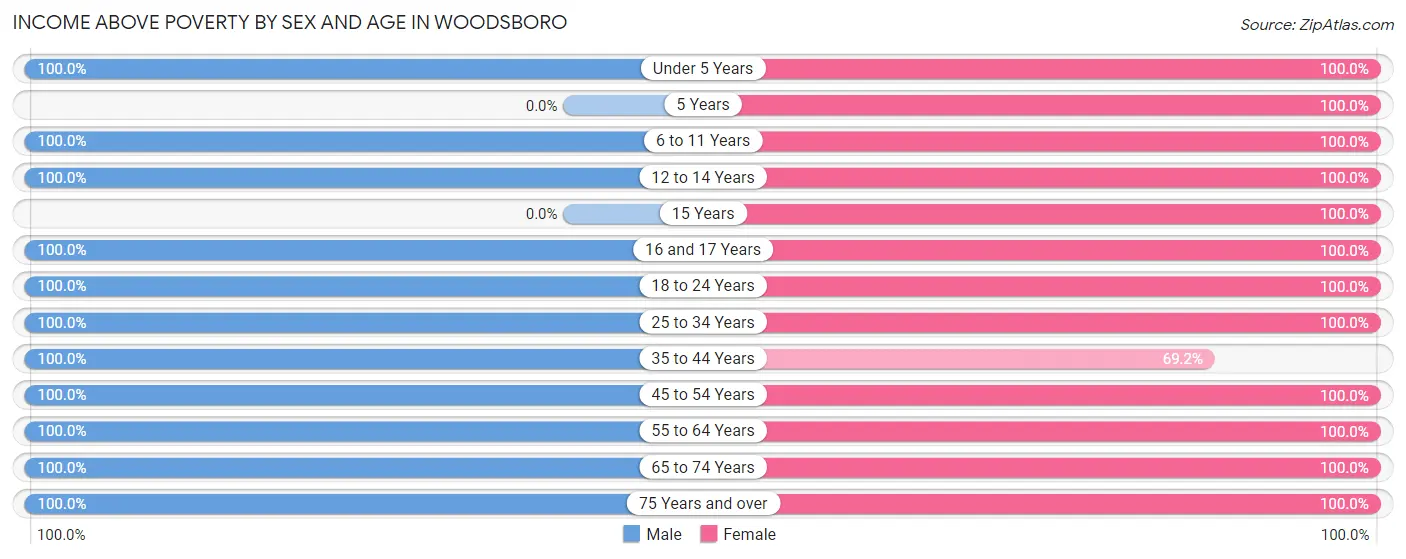
Income Above Poverty by Sex and Age in Woodsboro
According to the poverty statistics in Woodsboro, males aged under 5 years and females aged under 5 years are the age groups that are most secure financially, with 100.0% of males and 100.0% of females in these age groups living above the poverty line.
| Age Bracket | Male | Female |
| Under 5 Years | 2 (100.0%) | 34 (100.0%) |
| 5 Years | 0 (0.0%) | 3 (100.0%) |
| 6 to 11 Years | 47 (100.0%) | 84 (100.0%) |
| 12 to 14 Years | 6 (100.0%) | 13 (100.0%) |
| 15 Years | 0 (0.0%) | 25 (100.0%) |
| 16 and 17 Years | 17 (100.0%) | 15 (100.0%) |
| 18 to 24 Years | 96 (100.0%) | 58 (100.0%) |
| 25 to 34 Years | 155 (100.0%) | 86 (100.0%) |
| 35 to 44 Years | 89 (100.0%) | 36 (69.2%) |
| 45 to 54 Years | 16 (100.0%) | 112 (100.0%) |
| 55 to 64 Years | 69 (100.0%) | 49 (100.0%) |
| 65 to 74 Years | 54 (100.0%) | 47 (100.0%) |
| 75 Years and over | 52 (100.0%) | 46 (100.0%) |
| Total | 603 (100.0%) | 608 (97.4%) |
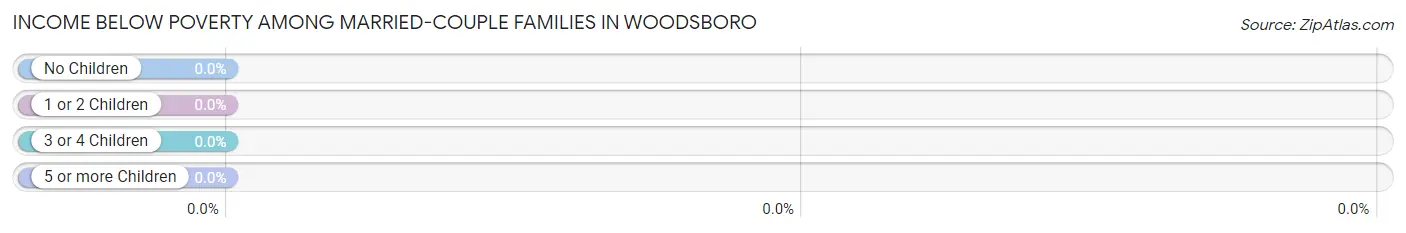
Income Below Poverty Among Married-Couple Families in Woodsboro
| Children | Above Poverty | Below Poverty |
| No Children | 62 (100.0%) | 0 (0.0%) |
| 1 or 2 Children | 26 (100.0%) | 0 (0.0%) |
| 3 or 4 Children | 11 (100.0%) | 0 (0.0%) |
| 5 or more Children | 0 (0.0%) | 0 (0.0%) |
| Total | 99 (100.0%) | 0 (0.0%) |
Income Below Poverty Among Single-Parent Households in Woodsboro
| Children | Single Father | Single Mother |
| No Children | 0 (0.0%) | 0 (0.0%) |
| 1 or 2 Children | 0 (0.0%) | 0 (0.0%) |
| 3 or 4 Children | 0 (0.0%) | 0 (0.0%) |
| 5 or more Children | 0 (0.0%) | 0 (0.0%) |
| Total | 0 (0.0%) | 0 (0.0%) |
Income Below Poverty Among Married-Couple vs Single-Parent Households in Woodsboro
| Children | Married-Couple Families | Single-Parent Households |
| No Children | 0 (0.0%) | 0 (0.0%) |
| 1 or 2 Children | 0 (0.0%) | 0 (0.0%) |
| 3 or 4 Children | 0 (0.0%) | 0 (0.0%) |
| 5 or more Children | 0 (0.0%) | 0 (0.0%) |
| Total | 0 (0.0%) | 0 (0.0%) |
Race in Woodsboro
The most populous races in Woodsboro are White / Caucasian (884 | 72.1%), Hispanic or Latino (832 | 67.8%), and Two or more Races (332 | 27.1%).
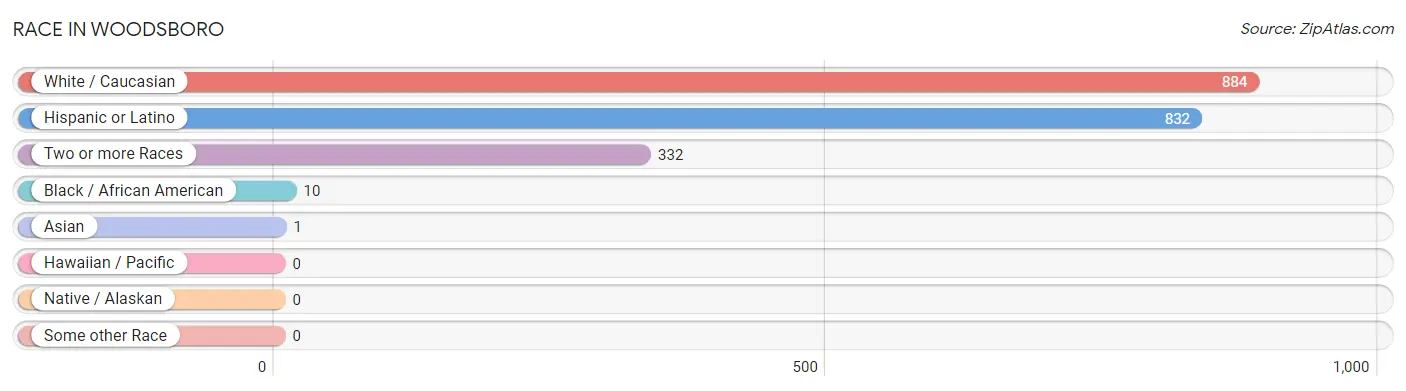
| Race | # Population | % Population |
| Asian | 1 | 0.1% |
| Black / African American | 10 | 0.8% |
| Hawaiian / Pacific | 0 | 0.0% |
| Hispanic or Latino | 832 | 67.8% |
| Native / Alaskan | 0 | 0.0% |
| White / Caucasian | 884 | 72.1% |
| Two or more Races | 332 | 27.1% |
| Some other Race | 0 | 0.0% |
| Total | 1,227 | 100.0% |
Ancestry in Woodsboro
The most populous ancestries reported in Woodsboro are Mexican (817 | 66.6%), German (143 | 11.7%), English (67 | 5.5%), Irish (55 | 4.5%), and American (16 | 1.3%), together accounting for 89.5% of all Woodsboro residents.
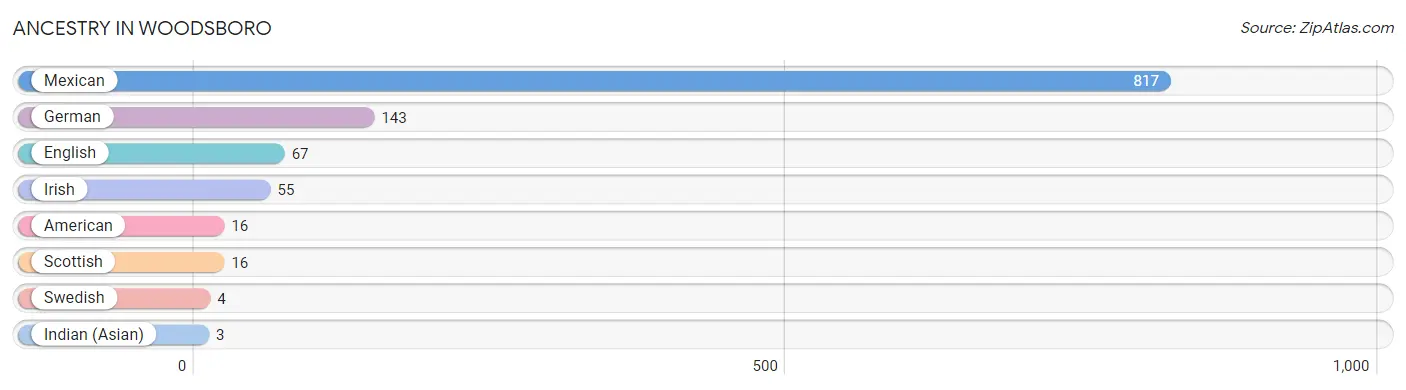
| Ancestry | # Population | % Population |
| American | 16 | 1.3% |
| English | 67 | 5.5% |
| German | 143 | 11.7% |
| Indian (Asian) | 3 | 0.2% |
| Irish | 55 | 4.5% |
| Mexican | 817 | 66.6% |
| Scottish | 16 | 1.3% |
| Swedish | 4 | 0.3% | View All 8 Rows |
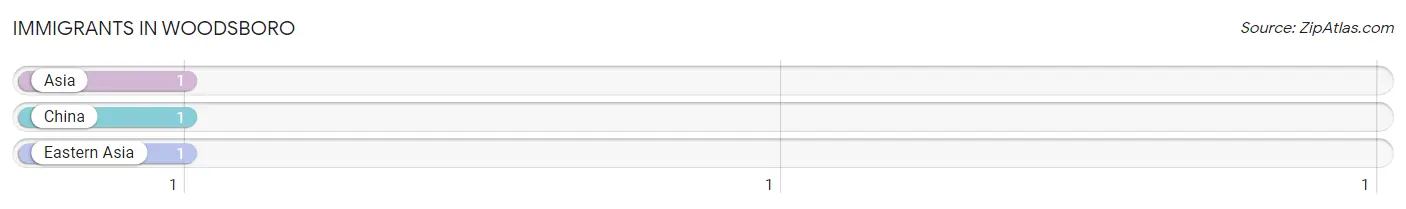
Immigrants in Woodsboro
The most numerous immigrant groups reported in Woodsboro came from Asia (1 | 0.1%), China (1 | 0.1%), and Eastern Asia (1 | 0.1%), together accounting for 0.2% of all Woodsboro residents.
| Immigration Origin | # Population | % Population |
| Asia | 1 | 0.1% |
| China | 1 | 0.1% |
| Eastern Asia | 1 | 0.1% | View All 3 Rows |
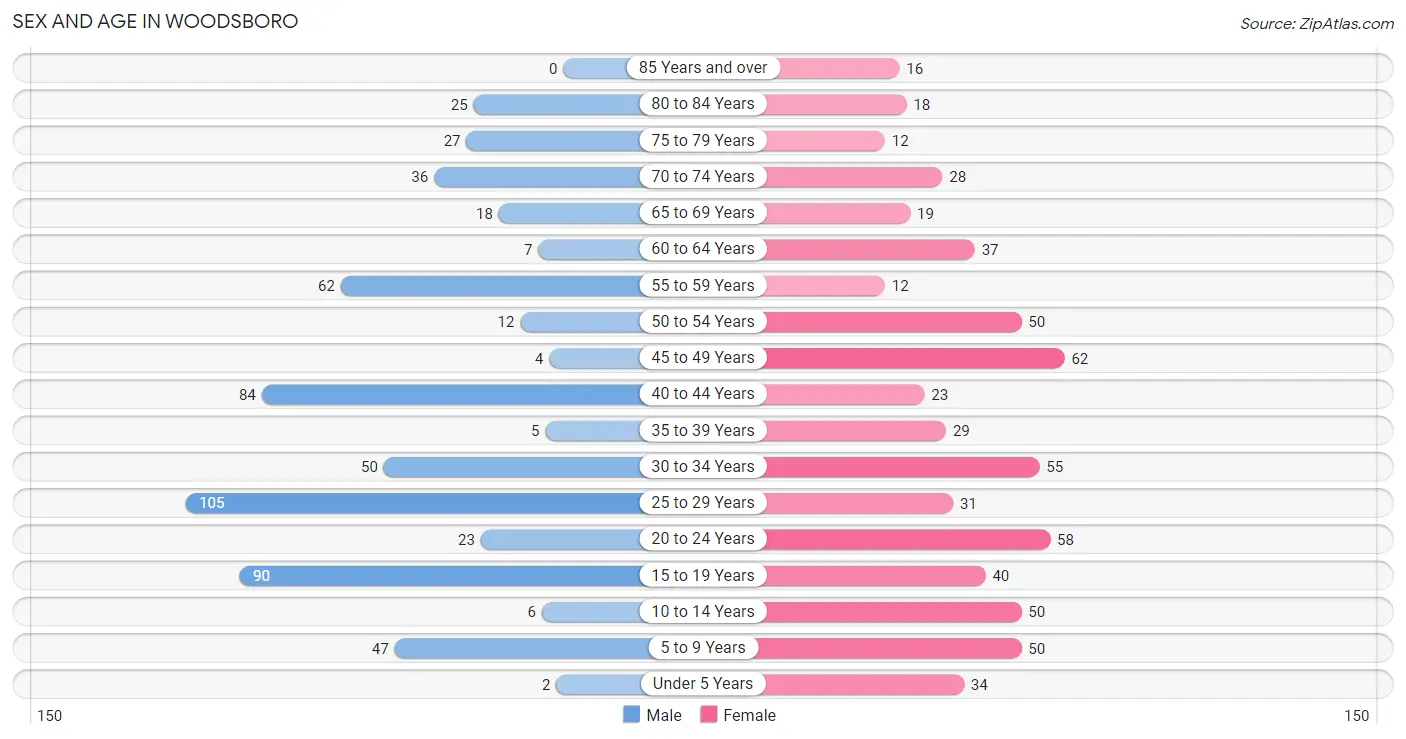
Sex and Age in Woodsboro
Sex and Age in Woodsboro
The most populous age groups in Woodsboro are 25 to 29 Years (105 | 17.4%) for men and 45 to 49 Years (62 | 9.9%) for women.
| Age Bracket | Male | Female |
| Under 5 Years | 2 (0.3%) | 34 (5.4%) |
| 5 to 9 Years | 47 (7.8%) | 50 (8.0%) |
| 10 to 14 Years | 6 (1.0%) | 50 (8.0%) |
| 15 to 19 Years | 90 (14.9%) | 40 (6.4%) |
| 20 to 24 Years | 23 (3.8%) | 58 (9.3%) |
| 25 to 29 Years | 105 (17.4%) | 31 (5.0%) |
| 30 to 34 Years | 50 (8.3%) | 55 (8.8%) |
| 35 to 39 Years | 5 (0.8%) | 29 (4.6%) |
| 40 to 44 Years | 84 (13.9%) | 23 (3.7%) |
| 45 to 49 Years | 4 (0.7%) | 62 (9.9%) |
| 50 to 54 Years | 12 (2.0%) | 50 (8.0%) |
| 55 to 59 Years | 62 (10.3%) | 12 (1.9%) |
| 60 to 64 Years | 7 (1.2%) | 37 (5.9%) |
| 65 to 69 Years | 18 (3.0%) | 19 (3.0%) |
| 70 to 74 Years | 36 (6.0%) | 28 (4.5%) |
| 75 to 79 Years | 27 (4.5%) | 12 (1.9%) |
| 80 to 84 Years | 25 (4.2%) | 18 (2.9%) |
| 85 Years and over | 0 (0.0%) | 16 (2.6%) |
| Total | 603 (100.0%) | 624 (100.0%) |
Families and Households in Woodsboro
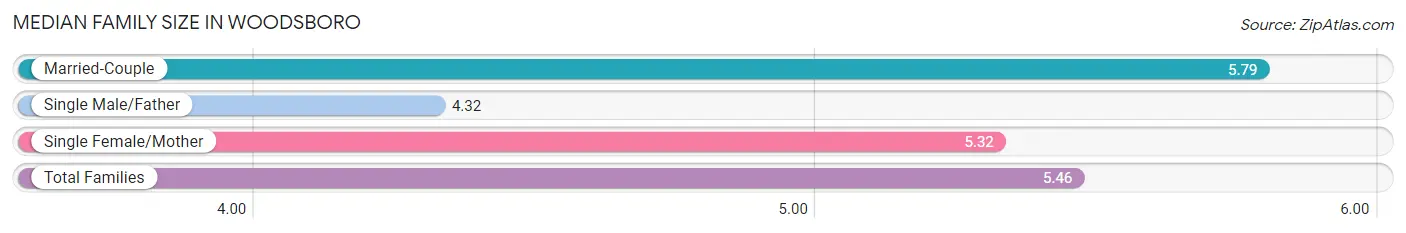
Median Family Size in Woodsboro
The median family size in Woodsboro is 5.46 persons per family, with married-couple families (99 | 49.0%) accounting for the largest median family size of 5.79 persons per family. On the other hand, single male/father families (19 | 9.4%) represent the smallest median family size with 4.32 persons per family.
| Family Type | # Families | Family Size |
| Married-Couple | 99 (49.0%) | 5.79 |
| Single Male/Father | 19 (9.4%) | 4.32 |
| Single Female/Mother | 84 (41.6%) | 5.32 |
| Total Families | 202 (100.0%) | 5.46 |
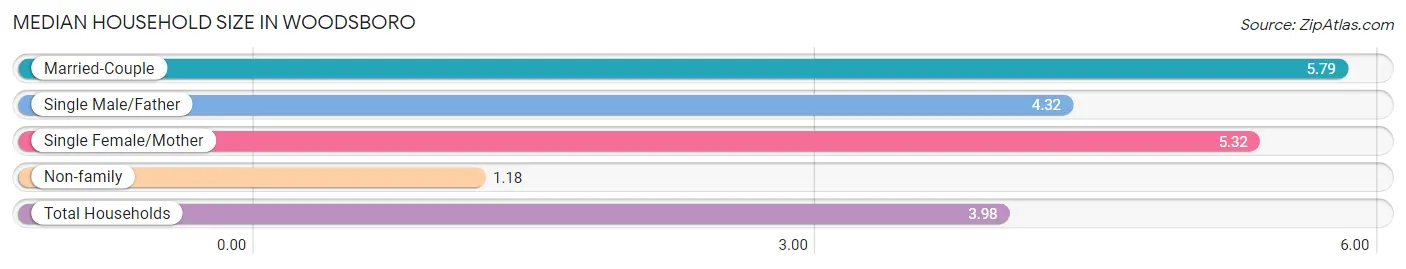
Median Household Size in Woodsboro
The median household size in Woodsboro is 3.98 persons per household, with married-couple households (99 | 32.1%) accounting for the largest median household size of 5.79 persons per household. non-family households (106 | 34.4%) represent the smallest median household size with 1.18 persons per household.
| Household Type | # Households | Household Size |
| Married-Couple | 99 (32.1%) | 5.79 |
| Single Male/Father | 19 (6.2%) | 4.32 |
| Single Female/Mother | 84 (27.3%) | 5.32 |
| Non-family | 106 (34.4%) | 1.18 |
| Total Households | 308 (100.0%) | 3.98 |
Household Size by Marriage Status in Woodsboro
Out of a total of 308 households in Woodsboro, 202 (65.6%) are family households, while 106 (34.4%) are nonfamily households. The most numerous type of family households are 3-person households, comprising 66, and the most common type of nonfamily households are 1-person households, comprising 79.
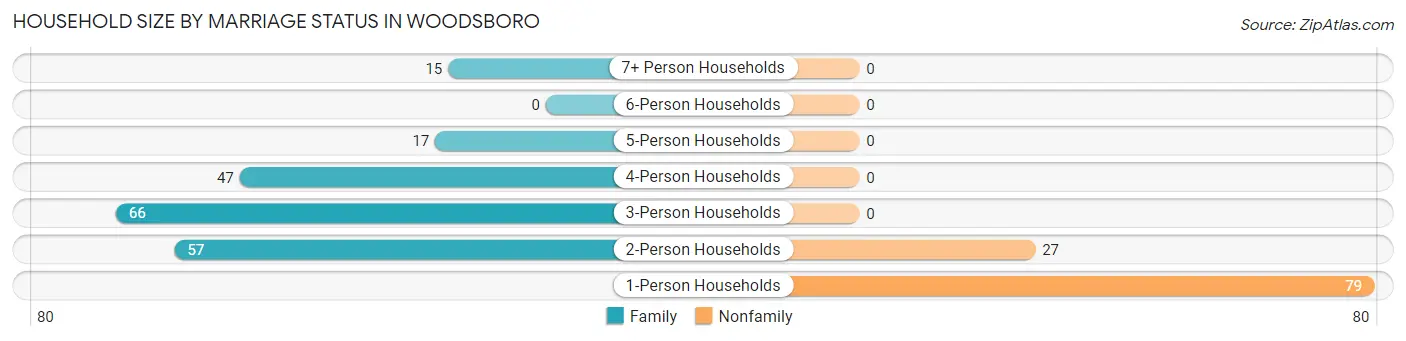
| Household Size | Family Households | Nonfamily Households |
| 1-Person Households | - | 79 (25.7%) |
| 2-Person Households | 57 (18.5%) | 27 (8.8%) |
| 3-Person Households | 66 (21.4%) | 0 (0.0%) |
| 4-Person Households | 47 (15.3%) | 0 (0.0%) |
| 5-Person Households | 17 (5.5%) | 0 (0.0%) |
| 6-Person Households | 0 (0.0%) | 0 (0.0%) |
| 7+ Person Households | 15 (4.9%) | 0 (0.0%) |
| Total | 202 (65.6%) | 106 (34.4%) |
Female Fertility in Woodsboro
Fertility by Age in Woodsboro
| Age Bracket | Women with Births | Births / 1,000 Women |
| 15 to 19 years | 0 (0.0%) | 0.0 |
| 20 to 34 years | 0 (0.0%) | 0.0 |
| 35 to 50 years | 0 (0.0%) | 0.0 |
| Total | 0 (0.0%) | 0.0 |
Fertility by Age by Marriage Status in Woodsboro
| Age Bracket | Married | Unmarried |
| 15 to 19 years | 0 (0.0%) | 0 (0.0%) |
| 20 to 34 years | 0 (0.0%) | 0 (0.0%) |
| 35 to 50 years | 0 (0.0%) | 0 (0.0%) |
| Total | 0 (0.0%) | 0 (0.0%) |
Fertility by Education in Woodsboro
| Educational Attainment | Women with Births | Births / 1,000 Women |
| Less than High School | 0 (0.0%) | 0.0 |
| High School Diploma | 0 (0.0%) | 0.0 |
| College or Associate's Degree | 0 (0.0%) | 0.0 |
| Bachelor's Degree | 0 (0.0%) | 0.0 |
| Graduate Degree | 0 (0.0%) | 0.0 |
| Total | 0 (0.0%) | 0.0 |
Fertility by Education by Marriage Status in Woodsboro
| Educational Attainment | Married | Unmarried |
| Less than High School | 0 (0.0%) | 0 (0.0%) |
| High School Diploma | 0 (0.0%) | 0 (0.0%) |
| College or Associate's Degree | 0 (0.0%) | 0 (0.0%) |
| Bachelor's Degree | 0 (0.0%) | 0 (0.0%) |
| Graduate Degree | 0 (0.0%) | 0 (0.0%) |
| Total | 0 (0.0%) | 0 (0.0%) |
Employment Characteristics in Woodsboro
Employment by Class of Employer in Woodsboro
Among the 576 employed individuals in Woodsboro, private company employees (402 | 69.8%), local government employees (128 | 22.2%), and state government employees (27 | 4.7%) make up the most common classes of employment.
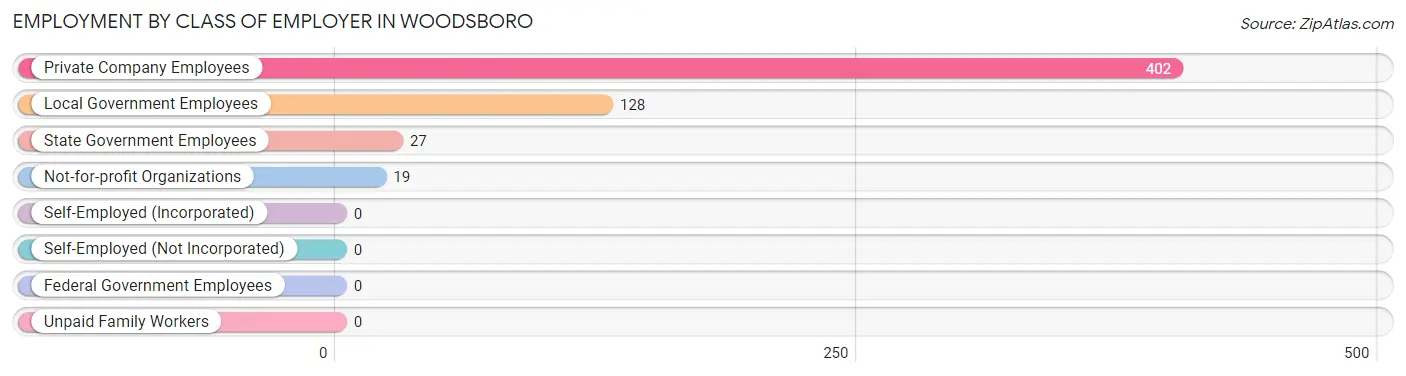
| Employer Class | # Employees | % Employees |
| Private Company Employees | 402 | 69.8% |
| Self-Employed (Incorporated) | 0 | 0.0% |
| Self-Employed (Not Incorporated) | 0 | 0.0% |
| Not-for-profit Organizations | 19 | 3.3% |
| Local Government Employees | 128 | 22.2% |
| State Government Employees | 27 | 4.7% |
| Federal Government Employees | 0 | 0.0% |
| Unpaid Family Workers | 0 | 0.0% |
| Total | 576 | 100.0% |
Employment Status by Age in Woodsboro
According to the labor force statistics for Woodsboro, out of the total population over 16 years of age (1,013), 59.3% or 601 individuals are in the labor force, with 4.2% or 25 of them unemployed. The age group with the highest labor force participation rate is 55 to 59 years, with 100.0% or 74 individuals in the labor force. Within the labor force, the 35 to 44 years age range has the highest percentage of unemployed individuals, with 26.9% or 25 of them being unemployed.
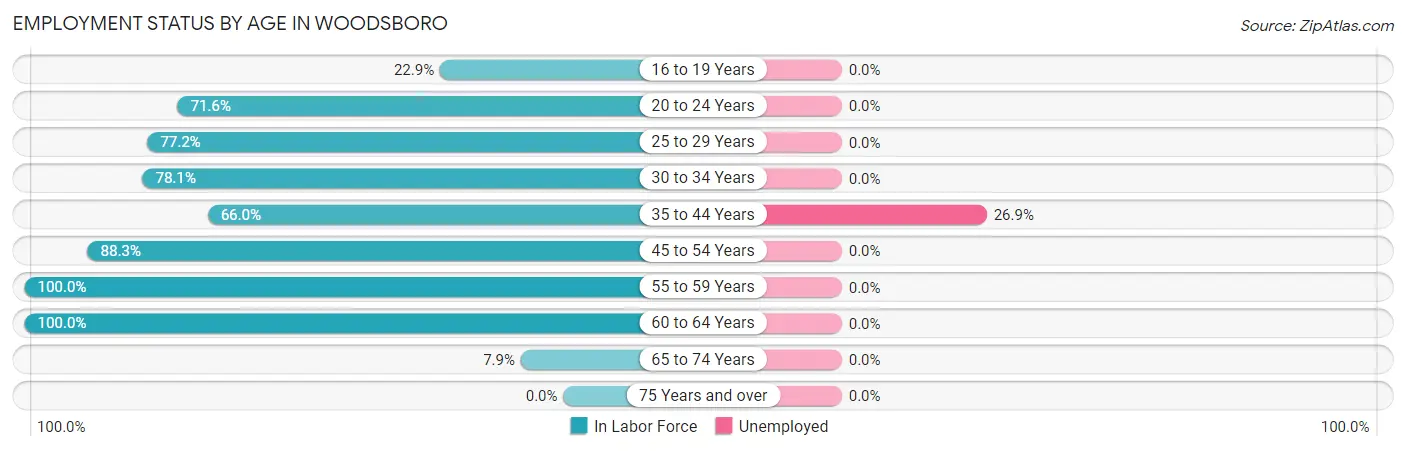
| Age Bracket | In Labor Force | Unemployed |
| 16 to 19 Years | 24 (22.9%) | 0 (0.0%) |
| 20 to 24 Years | 58 (71.6%) | 0 (0.0%) |
| 25 to 29 Years | 105 (77.2%) | 0 (0.0%) |
| 30 to 34 Years | 82 (78.1%) | 0 (0.0%) |
| 35 to 44 Years | 93 (66.0%) | 25 (26.9%) |
| 45 to 54 Years | 113 (88.3%) | 0 (0.0%) |
| 55 to 59 Years | 74 (100.0%) | 0 (0.0%) |
| 60 to 64 Years | 44 (100.0%) | 0 (0.0%) |
| 65 to 74 Years | 8 (7.9%) | 0 (0.0%) |
| 75 Years and over | 0 (0.0%) | 0 (0.0%) |
| Total | 601 (59.3%) | 25 (4.2%) |
Employment Status by Educational Attainment in Woodsboro
According to labor force statistics for Woodsboro, 81.4% of individuals (511) out of the total population between 25 and 64 years of age (628) are in the labor force, with 4.9% or 25 of them being unemployed. The group with the highest labor force participation rate are those with the educational attainment of college / associate degree, with 100.0% or 219 individuals in the labor force. Within the labor force, individuals with college / associate degree education have the highest percentage of unemployment, with 11.4% or 25 of them being unemployed.
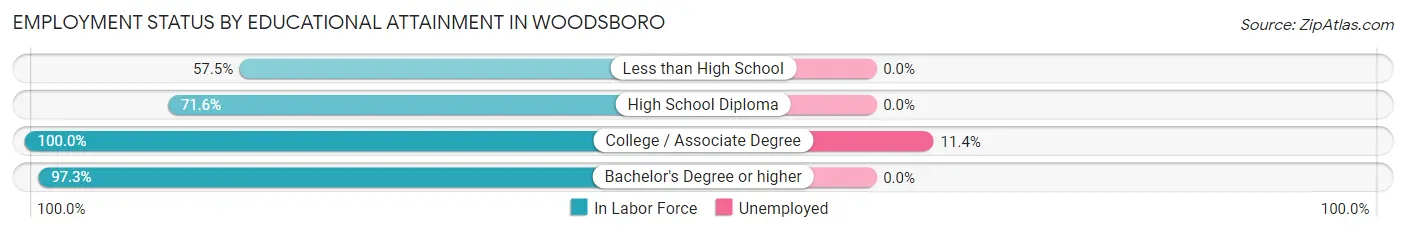
| Educational Attainment | In Labor Force | Unemployed |
| Less than High School | 42 (57.5%) | 0 (0.0%) |
| High School Diploma | 214 (71.6%) | 0 (0.0%) |
| College / Associate Degree | 219 (100.0%) | 25 (11.4%) |
| Bachelor's Degree or higher | 36 (97.3%) | 0 (0.0%) |
| Total | 511 (81.4%) | 31 (4.9%) |
Employment Occupations by Sex in Woodsboro
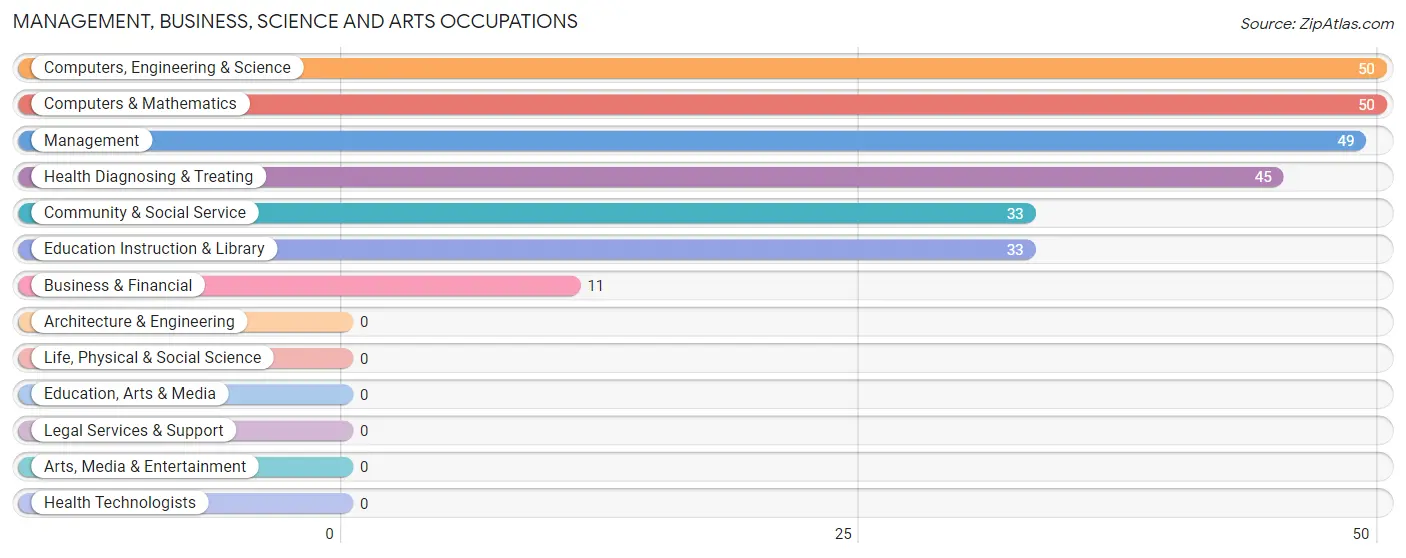
Management, Business, Science and Arts Occupations
The most common Management, Business, Science and Arts occupations in Woodsboro are Computers, Engineering & Science (50 | 8.7%), Computers & Mathematics (50 | 8.7%), Management (49 | 8.5%), Health Diagnosing & Treating (45 | 7.8%), and Community & Social Service (33 | 5.7%).
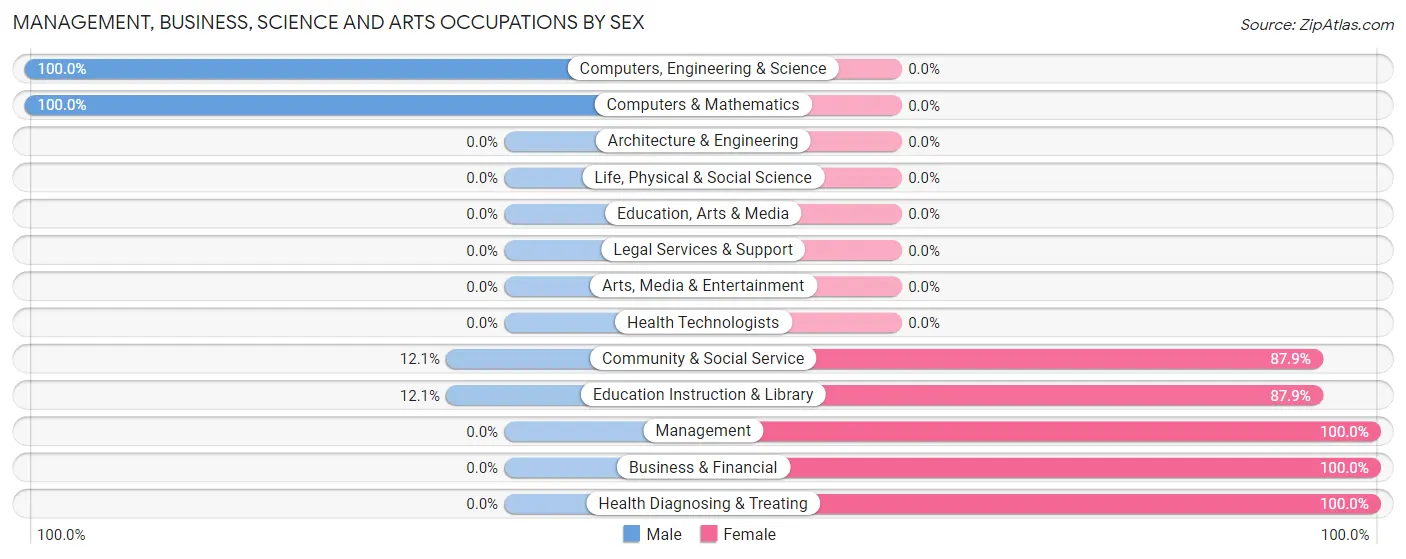
Management, Business, Science and Arts Occupations by Sex
Within the Management, Business, Science and Arts occupations in Woodsboro, the most male-oriented occupations are Computers, Engineering & Science (100.0%), Computers & Mathematics (100.0%), and Community & Social Service (12.1%), while the most female-oriented occupations are Management (100.0%), Business & Financial (100.0%), and Health Diagnosing & Treating (100.0%).
| Occupation | Male | Female |
| Management | 0 (0.0%) | 49 (100.0%) |
| Business & Financial | 0 (0.0%) | 11 (100.0%) |
| Computers, Engineering & Science | 50 (100.0%) | 0 (0.0%) |
| Computers & Mathematics | 50 (100.0%) | 0 (0.0%) |
| Architecture & Engineering | 0 (0.0%) | 0 (0.0%) |
| Life, Physical & Social Science | 0 (0.0%) | 0 (0.0%) |
| Community & Social Service | 4 (12.1%) | 29 (87.9%) |
| Education, Arts & Media | 0 (0.0%) | 0 (0.0%) |
| Legal Services & Support | 0 (0.0%) | 0 (0.0%) |
| Education Instruction & Library | 4 (12.1%) | 29 (87.9%) |
| Arts, Media & Entertainment | 0 (0.0%) | 0 (0.0%) |
| Health Diagnosing & Treating | 0 (0.0%) | 45 (100.0%) |
| Health Technologists | 0 (0.0%) | 0 (0.0%) |
| Total (Category) | 54 (28.7%) | 134 (71.3%) |
| Total (Overall) | 301 (52.3%) | 275 (47.7%) |
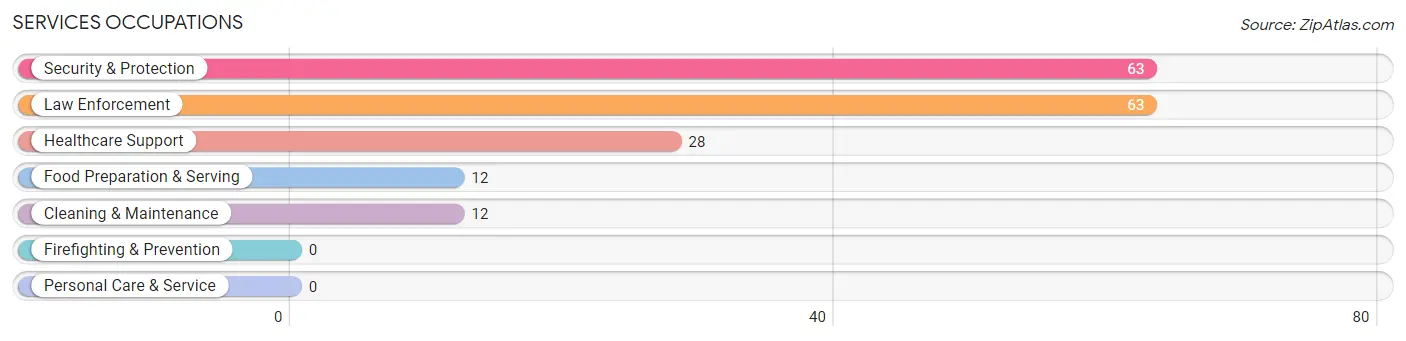
Services Occupations
The most common Services occupations in Woodsboro are Security & Protection (63 | 10.9%), Law Enforcement (63 | 10.9%), Healthcare Support (28 | 4.9%), Food Preparation & Serving (12 | 2.1%), and Cleaning & Maintenance (12 | 2.1%).
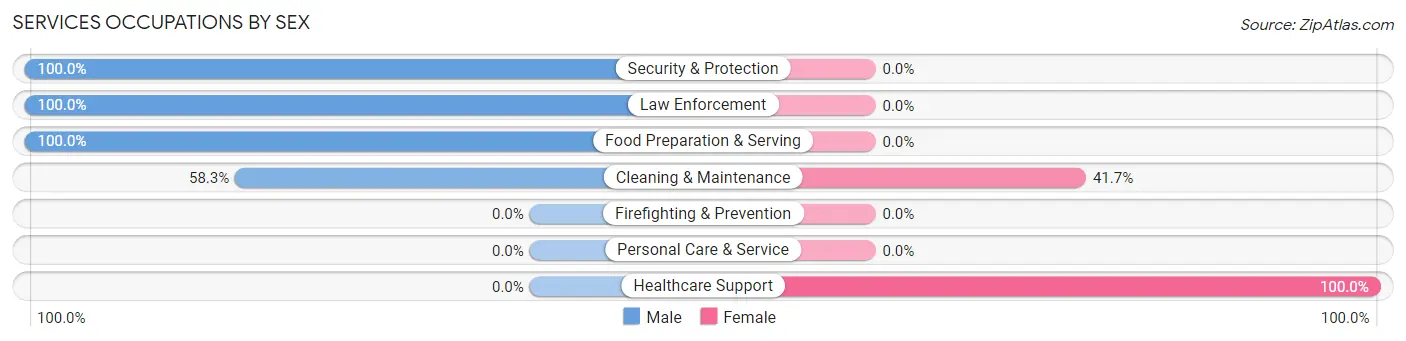
Services Occupations by Sex
Within the Services occupations in Woodsboro, the most male-oriented occupations are Security & Protection (100.0%), Law Enforcement (100.0%), and Food Preparation & Serving (100.0%), while the most female-oriented occupations are Healthcare Support (100.0%), and Cleaning & Maintenance (41.7%).
| Occupation | Male | Female |
| Healthcare Support | 0 (0.0%) | 28 (100.0%) |
| Security & Protection | 63 (100.0%) | 0 (0.0%) |
| Firefighting & Prevention | 0 (0.0%) | 0 (0.0%) |
| Law Enforcement | 63 (100.0%) | 0 (0.0%) |
| Food Preparation & Serving | 12 (100.0%) | 0 (0.0%) |
| Cleaning & Maintenance | 7 (58.3%) | 5 (41.7%) |
| Personal Care & Service | 0 (0.0%) | 0 (0.0%) |
| Total (Category) | 82 (71.3%) | 33 (28.7%) |
| Total (Overall) | 301 (52.3%) | 275 (47.7%) |
Sales and Office Occupations
The most common Sales and Office occupations in Woodsboro are Sales & Related (87 | 15.1%), and Office & Administration (36 | 6.2%).
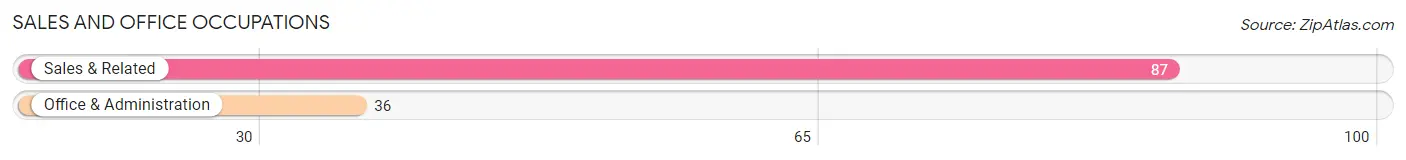
Sales and Office Occupations by Sex

| Occupation | Male | Female |
| Sales & Related | 30 (34.5%) | 57 (65.5%) |
| Office & Administration | 0 (0.0%) | 36 (100.0%) |
| Total (Category) | 30 (24.4%) | 93 (75.6%) |
| Total (Overall) | 301 (52.3%) | 275 (47.7%) |
Natural Resources, Construction and Maintenance Occupations
The most common Natural Resources, Construction and Maintenance occupations in Woodsboro are Construction & Extraction (53 | 9.2%), and Installation, Maintenance & Repair (19 | 3.3%).
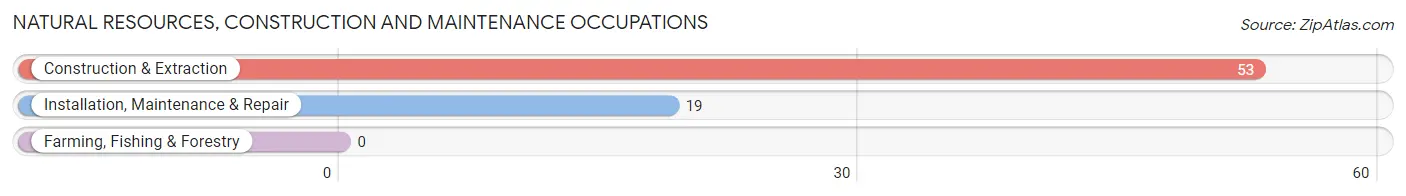
Natural Resources, Construction and Maintenance Occupations by Sex

| Occupation | Male | Female |
| Farming, Fishing & Forestry | 0 (0.0%) | 0 (0.0%) |
| Construction & Extraction | 53 (100.0%) | 0 (0.0%) |
| Installation, Maintenance & Repair | 19 (100.0%) | 0 (0.0%) |
| Total (Category) | 72 (100.0%) | 0 (0.0%) |
| Total (Overall) | 301 (52.3%) | 275 (47.7%) |
Production, Transportation and Moving Occupations
The most common Production, Transportation and Moving occupations in Woodsboro are Transportation (40 | 6.9%), Material Moving (23 | 4.0%), and Production (15 | 2.6%).
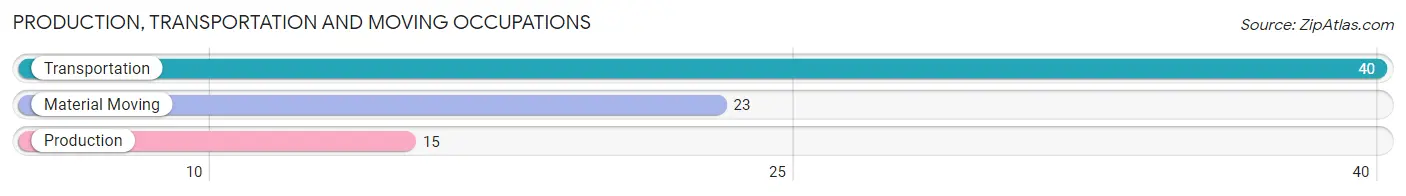
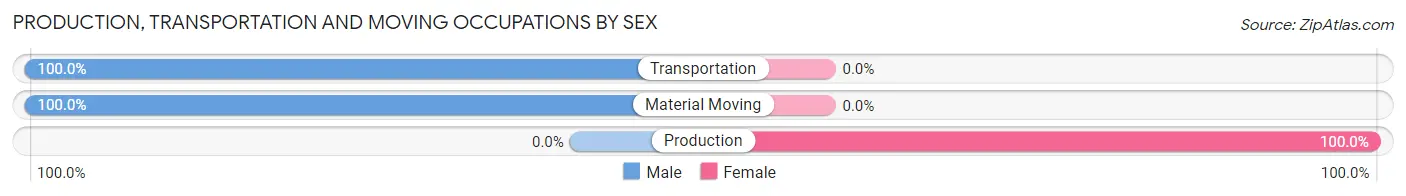
Production, Transportation and Moving Occupations by Sex
| Occupation | Male | Female |
| Production | 0 (0.0%) | 15 (100.0%) |
| Transportation | 40 (100.0%) | 0 (0.0%) |
| Material Moving | 23 (100.0%) | 0 (0.0%) |
| Total (Category) | 63 (80.8%) | 15 (19.2%) |
| Total (Overall) | 301 (52.3%) | 275 (47.7%) |
Employment Industries by Sex in Woodsboro
Employment Industries in Woodsboro
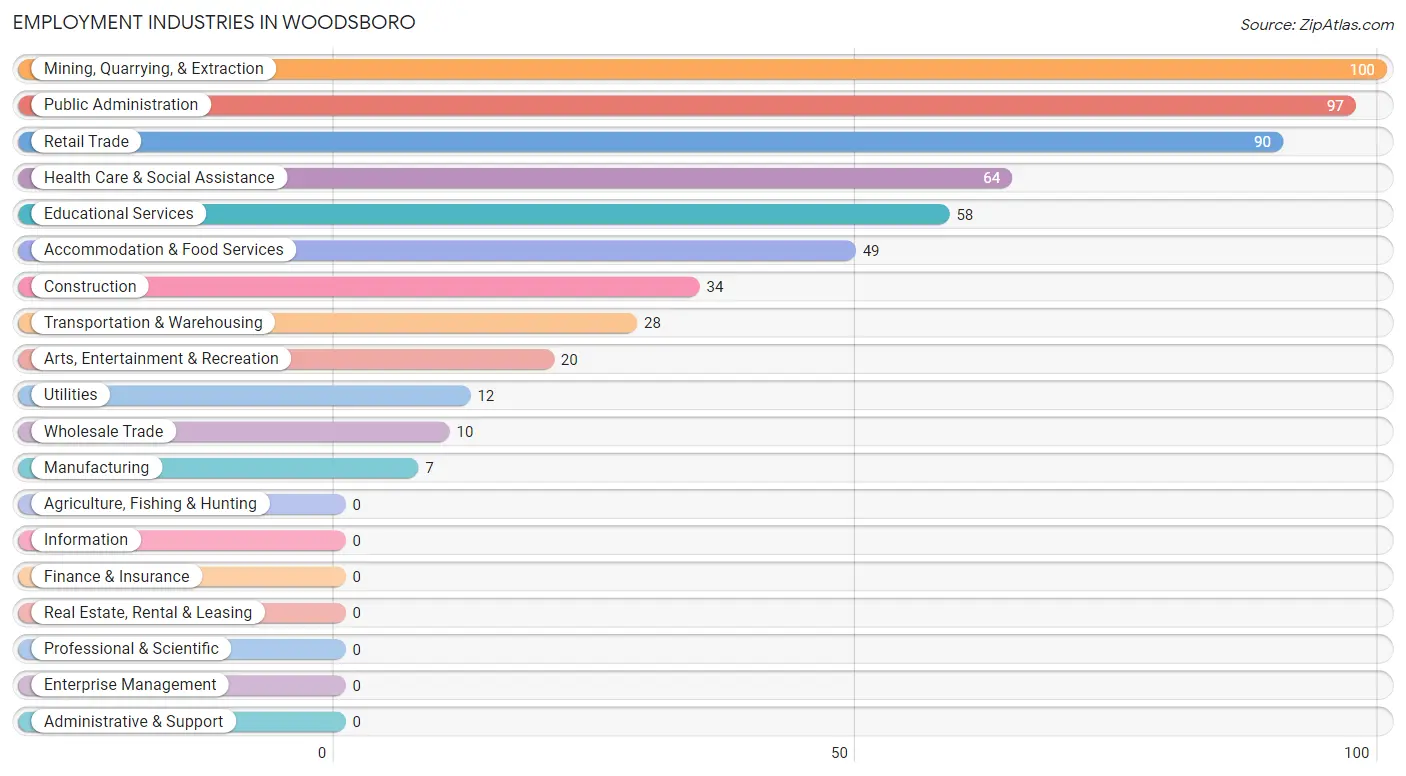
The major employment industries in Woodsboro include Mining, Quarrying, & Extraction (100 | 17.4%), Public Administration (97 | 16.8%), Retail Trade (90 | 15.6%), Health Care & Social Assistance (64 | 11.1%), and Educational Services (58 | 10.1%).
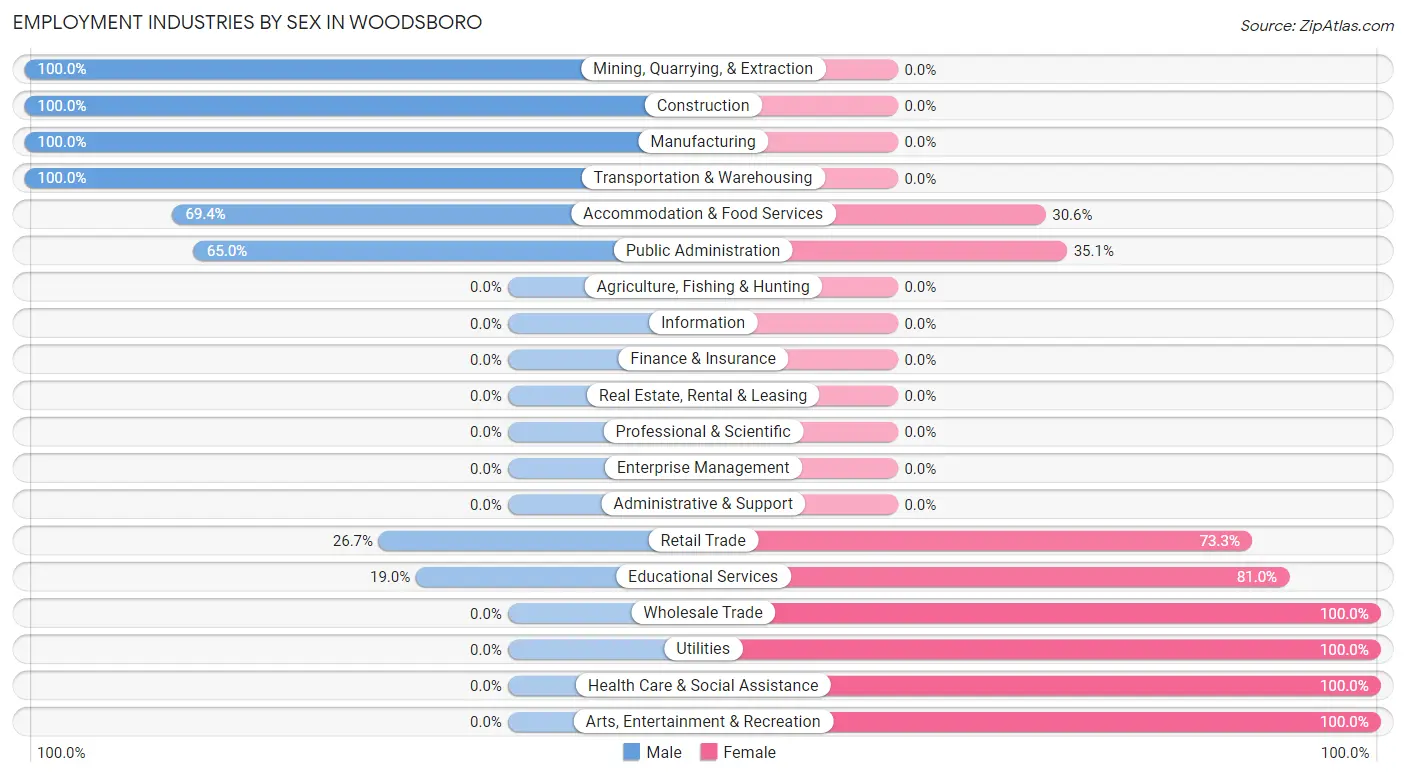
Employment Industries by Sex in Woodsboro
The Woodsboro industries that see more men than women are Mining, Quarrying, & Extraction (100.0%), Construction (100.0%), and Manufacturing (100.0%), whereas the industries that tend to have a higher number of women are Wholesale Trade (100.0%), Utilities (100.0%), and Health Care & Social Assistance (100.0%).
| Industry | Male | Female |
| Agriculture, Fishing & Hunting | 0 (0.0%) | 0 (0.0%) |
| Mining, Quarrying, & Extraction | 100 (100.0%) | 0 (0.0%) |
| Construction | 34 (100.0%) | 0 (0.0%) |
| Manufacturing | 7 (100.0%) | 0 (0.0%) |
| Wholesale Trade | 0 (0.0%) | 10 (100.0%) |
| Retail Trade | 24 (26.7%) | 66 (73.3%) |
| Transportation & Warehousing | 28 (100.0%) | 0 (0.0%) |
| Utilities | 0 (0.0%) | 12 (100.0%) |
| Information | 0 (0.0%) | 0 (0.0%) |
| Finance & Insurance | 0 (0.0%) | 0 (0.0%) |
| Real Estate, Rental & Leasing | 0 (0.0%) | 0 (0.0%) |
| Professional & Scientific | 0 (0.0%) | 0 (0.0%) |
| Enterprise Management | 0 (0.0%) | 0 (0.0%) |
| Administrative & Support | 0 (0.0%) | 0 (0.0%) |
| Educational Services | 11 (19.0%) | 47 (81.0%) |
| Health Care & Social Assistance | 0 (0.0%) | 64 (100.0%) |
| Arts, Entertainment & Recreation | 0 (0.0%) | 20 (100.0%) |
| Accommodation & Food Services | 34 (69.4%) | 15 (30.6%) |
| Public Administration | 63 (64.9%) | 34 (35.0%) |
| Total | 301 (52.3%) | 275 (47.7%) |
Education in Woodsboro
School Enrollment in Woodsboro
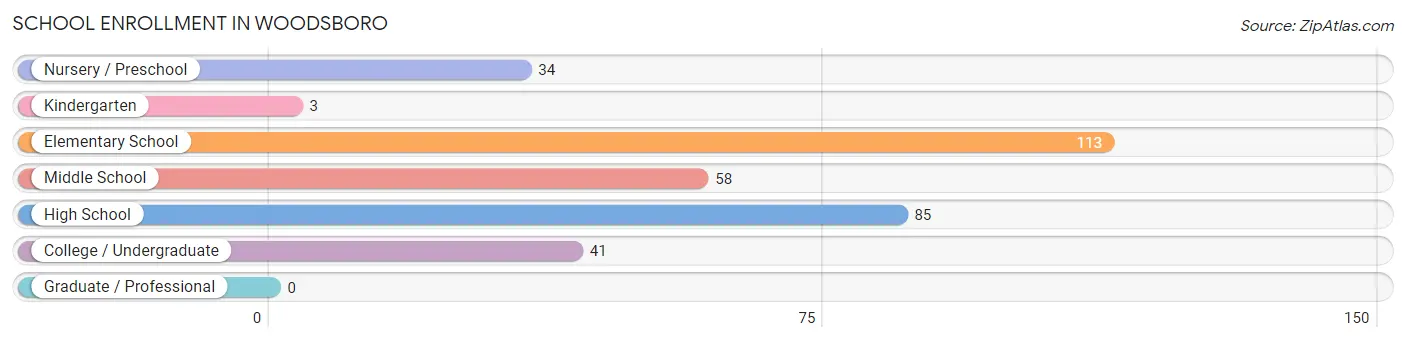
The most common levels of schooling among the 334 students in Woodsboro are elementary school (113 | 33.8%), high school (85 | 25.5%), and middle school (58 | 17.4%).
| School Level | # Students | % Students |
| Nursery / Preschool | 34 | 10.2% |
| Kindergarten | 3 | 0.9% |
| Elementary School | 113 | 33.8% |
| Middle School | 58 | 17.4% |
| High School | 85 | 25.5% |
| College / Undergraduate | 41 | 12.3% |
| Graduate / Professional | 0 | 0.0% |
| Total | 334 | 100.0% |
School Enrollment by Age by Funding Source in Woodsboro
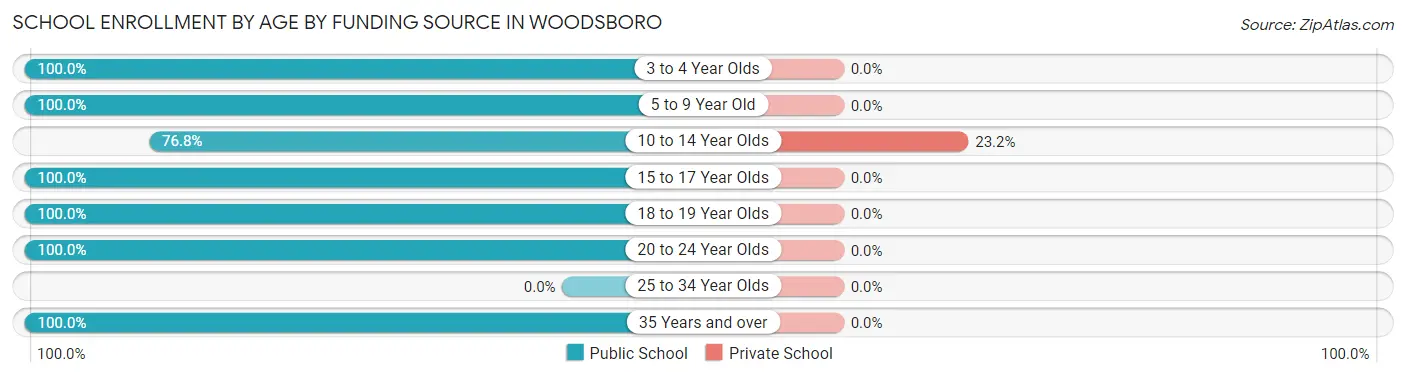
Out of a total of 334 students who are enrolled in schools in Woodsboro, 13 (3.9%) attend a private institution, while the remaining 321 (96.1%) are enrolled in public schools. The age group of 10 to 14 year olds has the highest likelihood of being enrolled in private schools, with 13 (23.2% in the age bracket) enrolled. Conversely, the age group of 3 to 4 year olds has the lowest likelihood of being enrolled in a private school, with 34 (100.0% in the age bracket) attending a public institution.
| Age Bracket | Public School | Private School |
| 3 to 4 Year Olds | 34 (100.0%) | 0 (0.0%) |
| 5 to 9 Year Old | 97 (100.0%) | 0 (0.0%) |
| 10 to 14 Year Olds | 43 (76.8%) | 13 (23.2%) |
| 15 to 17 Year Olds | 57 (100.0%) | 0 (0.0%) |
| 18 to 19 Year Olds | 73 (100.0%) | 0 (0.0%) |
| 20 to 24 Year Olds | 8 (100.0%) | 0 (0.0%) |
| 25 to 34 Year Olds | 0 (0.0%) | 0 (0.0%) |
| 35 Years and over | 9 (100.0%) | 0 (0.0%) |
| Total | 321 (96.1%) | 13 (3.9%) |
Educational Attainment by Field of Study in Woodsboro
Science & technology (20 | 35.1%), communications (20 | 35.1%), education (13 | 22.8%), and bio, nature & agricultural (4 | 7.0%) are the most common fields of study among 57 individuals in Woodsboro who have obtained a bachelor's degree or higher.
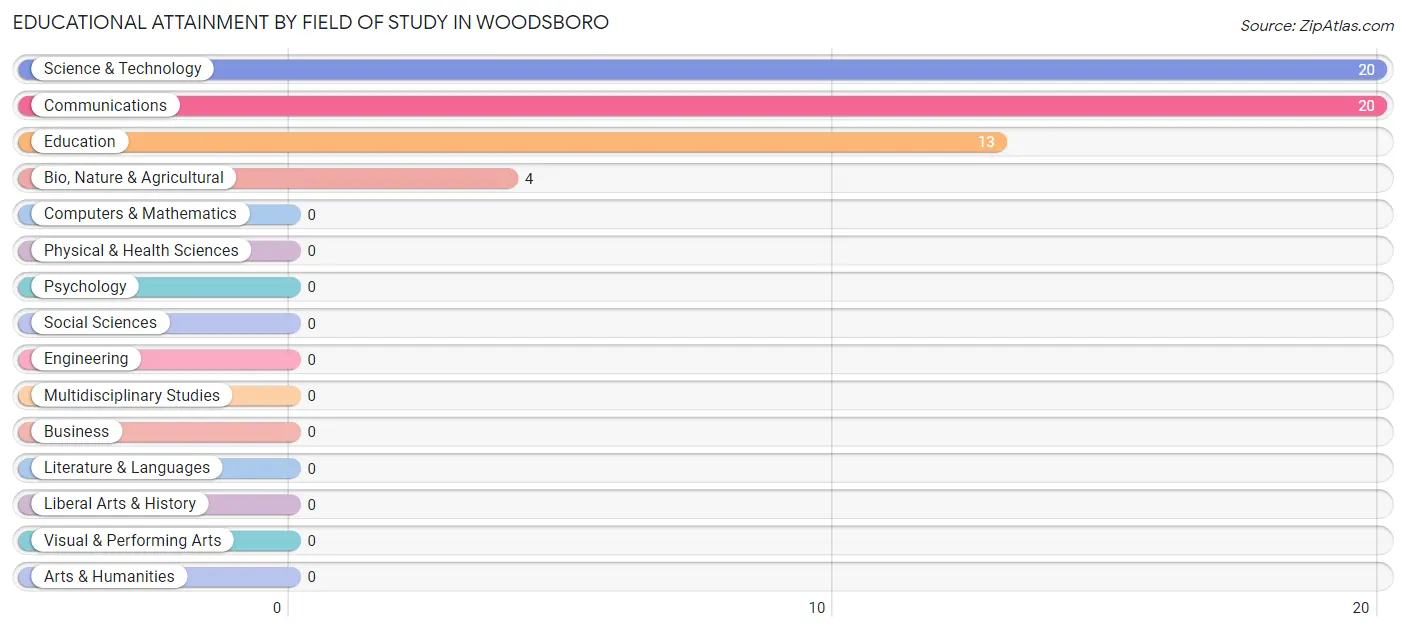
| Field of Study | # Graduates | % Graduates |
| Computers & Mathematics | 0 | 0.0% |
| Bio, Nature & Agricultural | 4 | 7.0% |
| Physical & Health Sciences | 0 | 0.0% |
| Psychology | 0 | 0.0% |
| Social Sciences | 0 | 0.0% |
| Engineering | 0 | 0.0% |
| Multidisciplinary Studies | 0 | 0.0% |
| Science & Technology | 20 | 35.1% |
| Business | 0 | 0.0% |
| Education | 13 | 22.8% |
| Literature & Languages | 0 | 0.0% |
| Liberal Arts & History | 0 | 0.0% |
| Visual & Performing Arts | 0 | 0.0% |
| Communications | 20 | 35.1% |
| Arts & Humanities | 0 | 0.0% |
| Total | 57 | 100.0% |
Transportation & Commute in Woodsboro
Vehicle Availability by Sex in Woodsboro
The most prevalent vehicle ownership categories in Woodsboro are males with 5 or more vehicles (112, accounting for 37.2%) and females with 5 or more vehicles (17, making up 40.7%).
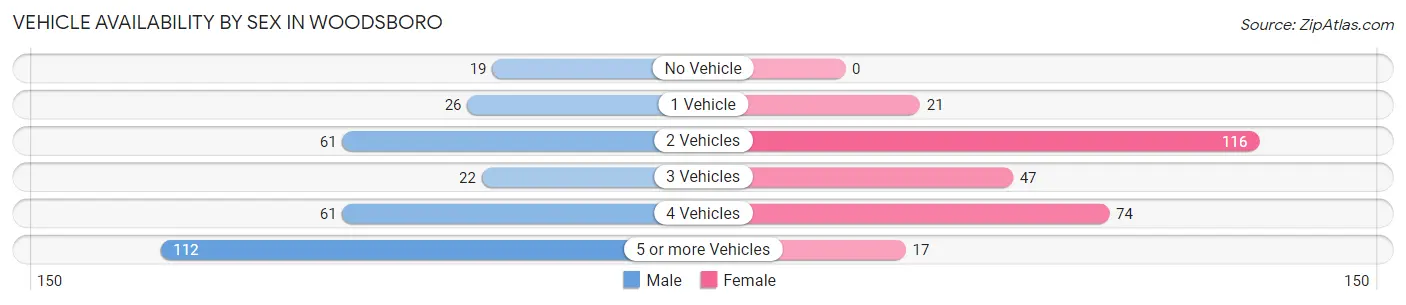
| Vehicles Available | Male | Female |
| No Vehicle | 19 (6.3%) | 0 (0.0%) |
| 1 Vehicle | 26 (8.6%) | 21 (7.6%) |
| 2 Vehicles | 61 (20.3%) | 116 (42.2%) |
| 3 Vehicles | 22 (7.3%) | 47 (17.1%) |
| 4 Vehicles | 61 (20.3%) | 74 (26.9%) |
| 5 or more Vehicles | 112 (37.2%) | 17 (6.2%) |
| Total | 301 (100.0%) | 275 (100.0%) |
Commute Time in Woodsboro
The most frequently occuring commute durations in Woodsboro are 10 to 14 minutes (256 commuters, 45.1%), 45 to 59 minutes (101 commuters, 17.8%), and 5 to 9 minutes (44 commuters, 7.7%).
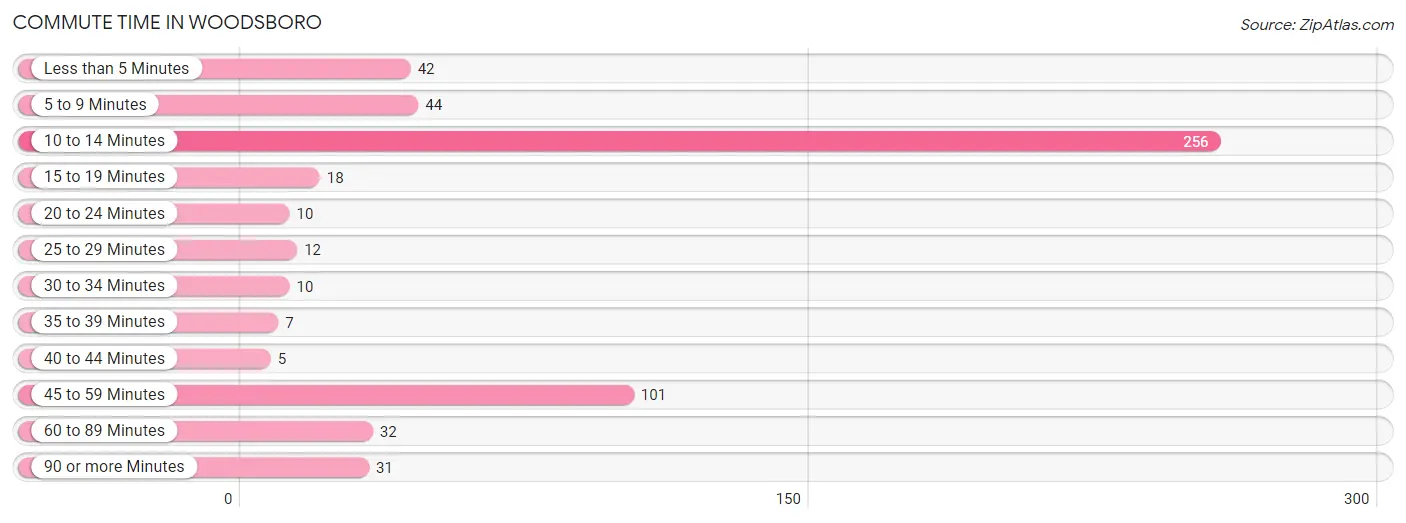
| Commute Time | # Commuters | % Commuters |
| Less than 5 Minutes | 42 | 7.4% |
| 5 to 9 Minutes | 44 | 7.7% |
| 10 to 14 Minutes | 256 | 45.1% |
| 15 to 19 Minutes | 18 | 3.2% |
| 20 to 24 Minutes | 10 | 1.8% |
| 25 to 29 Minutes | 12 | 2.1% |
| 30 to 34 Minutes | 10 | 1.8% |
| 35 to 39 Minutes | 7 | 1.2% |
| 40 to 44 Minutes | 5 | 0.9% |
| 45 to 59 Minutes | 101 | 17.8% |
| 60 to 89 Minutes | 32 | 5.6% |
| 90 or more Minutes | 31 | 5.5% |
Commute Time by Sex in Woodsboro
The most common commute times in Woodsboro are 10 to 14 minutes (119 commuters, 39.5%) for males and 10 to 14 minutes (137 commuters, 51.3%) for females.
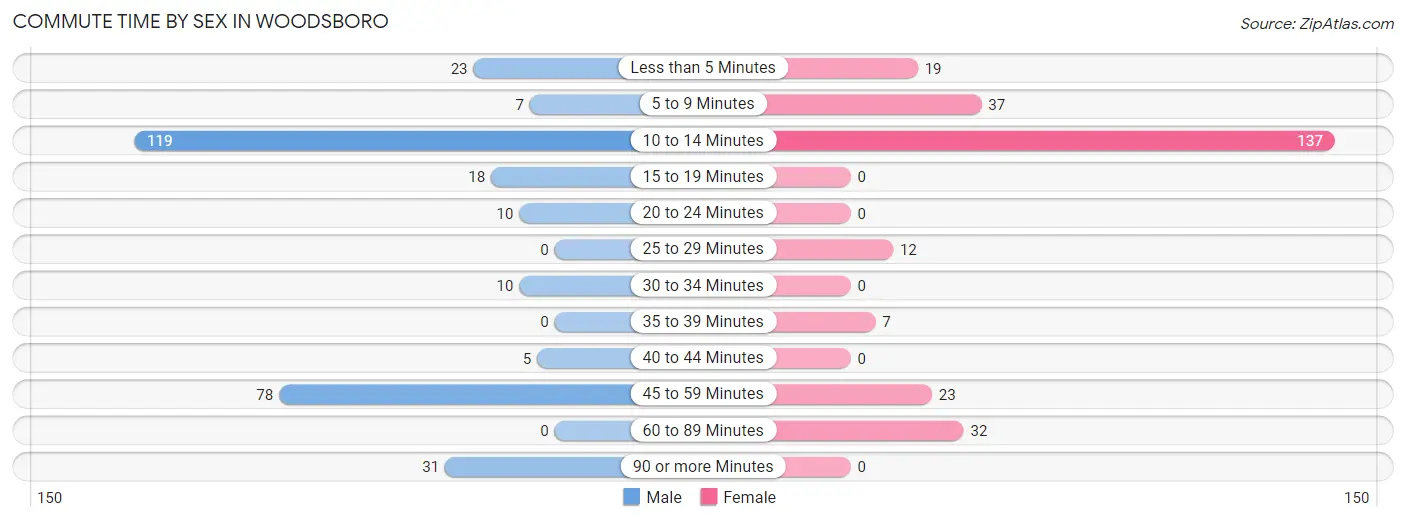
| Commute Time | Male | Female |
| Less than 5 Minutes | 23 (7.6%) | 19 (7.1%) |
| 5 to 9 Minutes | 7 (2.3%) | 37 (13.9%) |
| 10 to 14 Minutes | 119 (39.5%) | 137 (51.3%) |
| 15 to 19 Minutes | 18 (6.0%) | 0 (0.0%) |
| 20 to 24 Minutes | 10 (3.3%) | 0 (0.0%) |
| 25 to 29 Minutes | 0 (0.0%) | 12 (4.5%) |
| 30 to 34 Minutes | 10 (3.3%) | 0 (0.0%) |
| 35 to 39 Minutes | 0 (0.0%) | 7 (2.6%) |
| 40 to 44 Minutes | 5 (1.7%) | 0 (0.0%) |
| 45 to 59 Minutes | 78 (25.9%) | 23 (8.6%) |
| 60 to 89 Minutes | 0 (0.0%) | 32 (12.0%) |
| 90 or more Minutes | 31 (10.3%) | 0 (0.0%) |
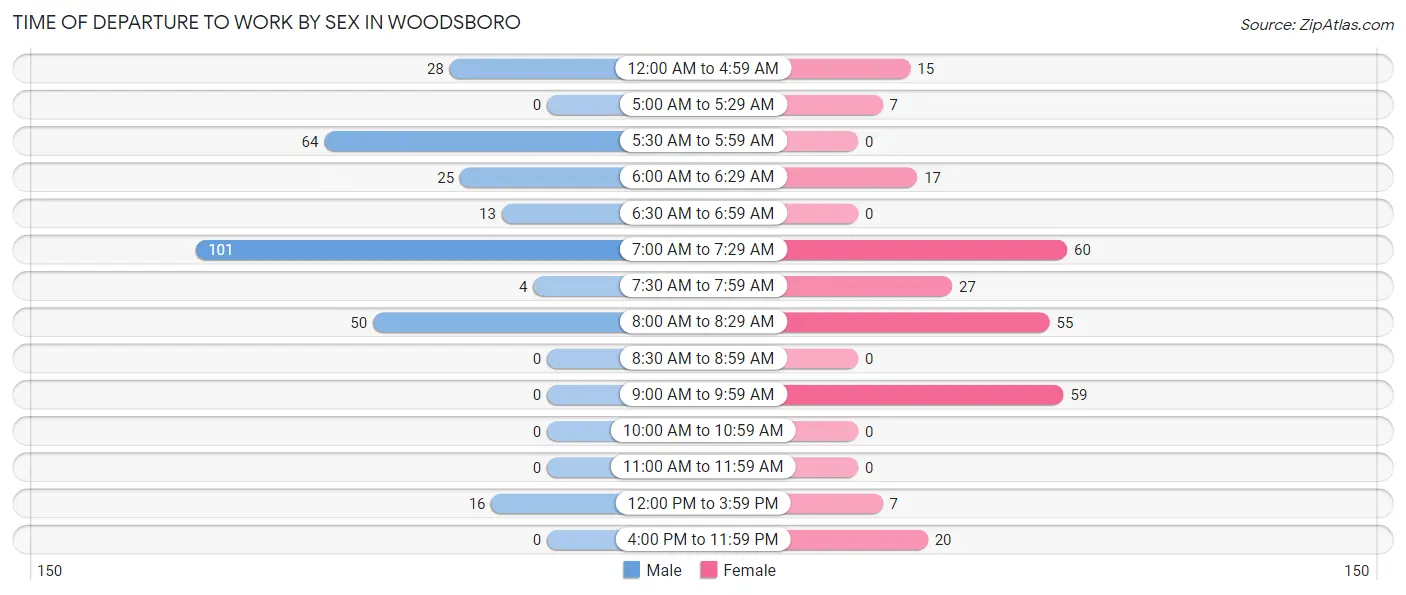
Time of Departure to Work by Sex in Woodsboro
The most frequent times of departure to work in Woodsboro are 7:00 AM to 7:29 AM (101, 33.6%) for males and 7:00 AM to 7:29 AM (60, 22.5%) for females.
| Time of Departure | Male | Female |
| 12:00 AM to 4:59 AM | 28 (9.3%) | 15 (5.6%) |
| 5:00 AM to 5:29 AM | 0 (0.0%) | 7 (2.6%) |
| 5:30 AM to 5:59 AM | 64 (21.3%) | 0 (0.0%) |
| 6:00 AM to 6:29 AM | 25 (8.3%) | 17 (6.4%) |
| 6:30 AM to 6:59 AM | 13 (4.3%) | 0 (0.0%) |
| 7:00 AM to 7:29 AM | 101 (33.6%) | 60 (22.5%) |
| 7:30 AM to 7:59 AM | 4 (1.3%) | 27 (10.1%) |
| 8:00 AM to 8:29 AM | 50 (16.6%) | 55 (20.6%) |
| 8:30 AM to 8:59 AM | 0 (0.0%) | 0 (0.0%) |
| 9:00 AM to 9:59 AM | 0 (0.0%) | 59 (22.1%) |
| 10:00 AM to 10:59 AM | 0 (0.0%) | 0 (0.0%) |
| 11:00 AM to 11:59 AM | 0 (0.0%) | 0 (0.0%) |
| 12:00 PM to 3:59 PM | 16 (5.3%) | 7 (2.6%) |
| 4:00 PM to 11:59 PM | 0 (0.0%) | 20 (7.5%) |
| Total | 301 (100.0%) | 267 (100.0%) |
Housing Occupancy in Woodsboro
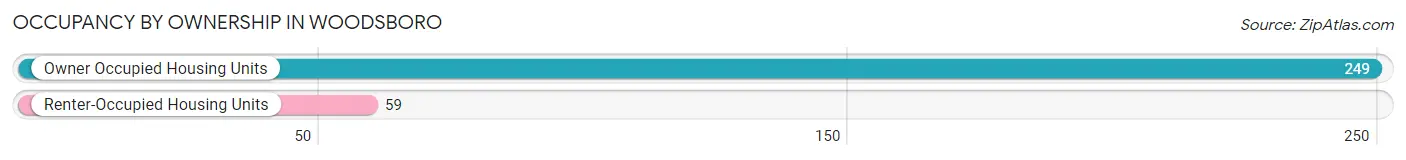
Occupancy by Ownership in Woodsboro
Of the total 308 dwellings in Woodsboro, owner-occupied units account for 249 (80.8%), while renter-occupied units make up 59 (19.2%).
| Occupancy | # Housing Units | % Housing Units |
| Owner Occupied Housing Units | 249 | 80.8% |
| Renter-Occupied Housing Units | 59 | 19.2% |
| Total Occupied Housing Units | 308 | 100.0% |
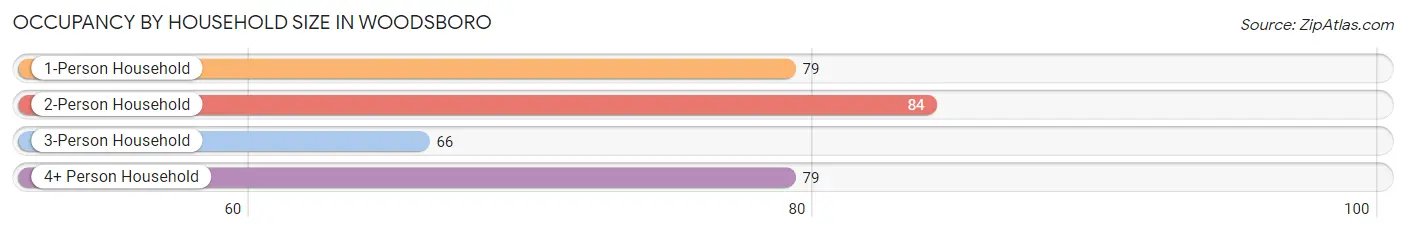
Occupancy by Household Size in Woodsboro
| Household Size | # Housing Units | % Housing Units |
| 1-Person Household | 79 | 25.7% |
| 2-Person Household | 84 | 27.3% |
| 3-Person Household | 66 | 21.4% |
| 4+ Person Household | 79 | 25.7% |
| Total Housing Units | 308 | 100.0% |
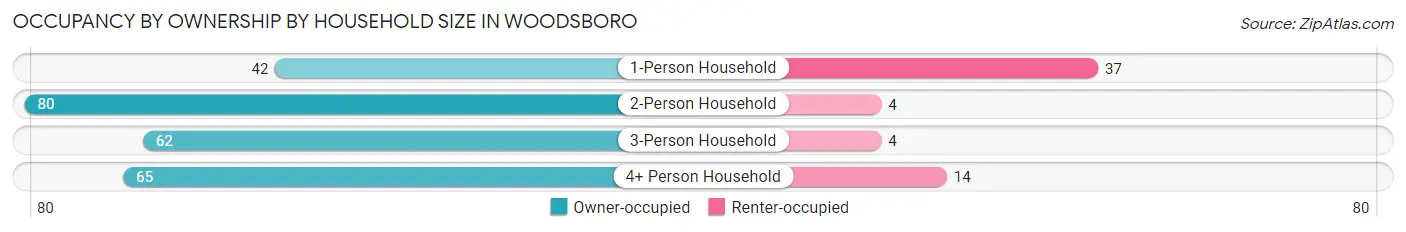
Occupancy by Ownership by Household Size in Woodsboro
| Household Size | Owner-occupied | Renter-occupied |
| 1-Person Household | 42 (53.2%) | 37 (46.8%) |
| 2-Person Household | 80 (95.2%) | 4 (4.8%) |
| 3-Person Household | 62 (93.9%) | 4 (6.1%) |
| 4+ Person Household | 65 (82.3%) | 14 (17.7%) |
| Total Housing Units | 249 (80.8%) | 59 (19.2%) |
Occupancy by Educational Attainment in Woodsboro
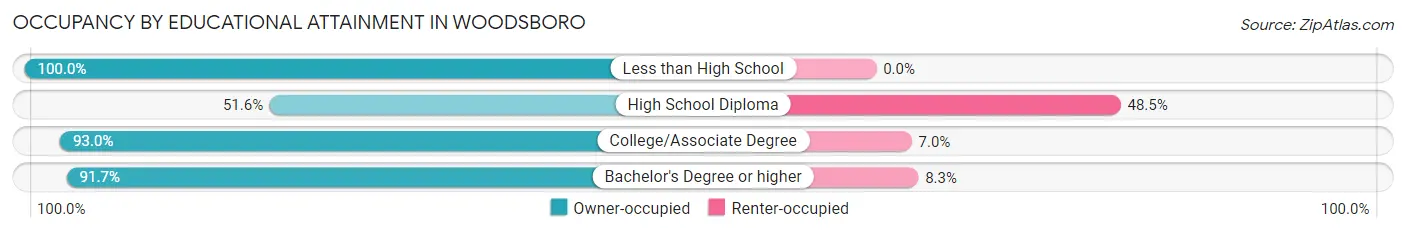
| Household Size | Owner-occupied | Renter-occupied |
| Less than High School | 49 (100.0%) | 0 (0.0%) |
| High School Diploma | 50 (51.5%) | 47 (48.4%) |
| College/Associate Degree | 106 (93.0%) | 8 (7.0%) |
| Bachelor's Degree or higher | 44 (91.7%) | 4 (8.3%) |
Occupancy by Age of Householder in Woodsboro
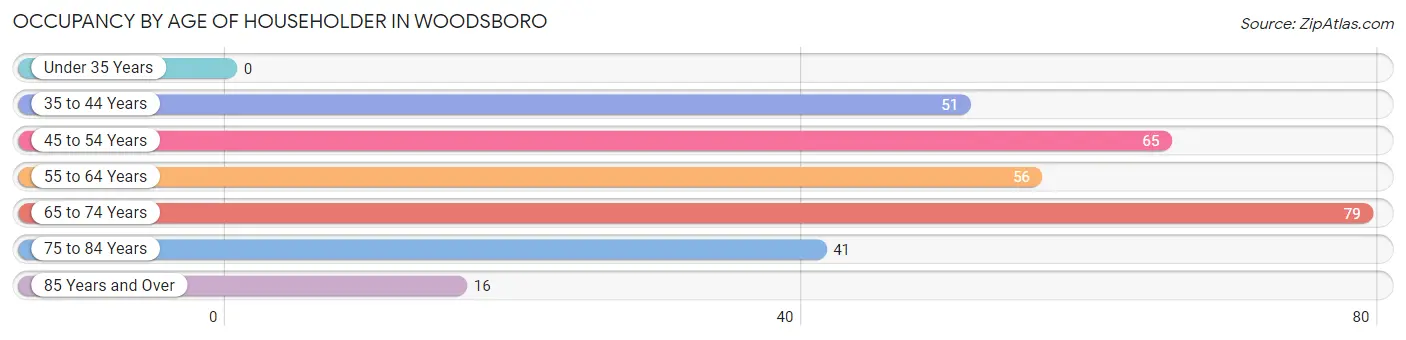
| Age Bracket | # Households | % Households |
| Under 35 Years | 0 | 0.0% |
| 35 to 44 Years | 51 | 16.6% |
| 45 to 54 Years | 65 | 21.1% |
| 55 to 64 Years | 56 | 18.2% |
| 65 to 74 Years | 79 | 25.7% |
| 75 to 84 Years | 41 | 13.3% |
| 85 Years and Over | 16 | 5.2% |
| Total | 308 | 100.0% |
Housing Finances in Woodsboro
Median Income by Occupancy in Woodsboro
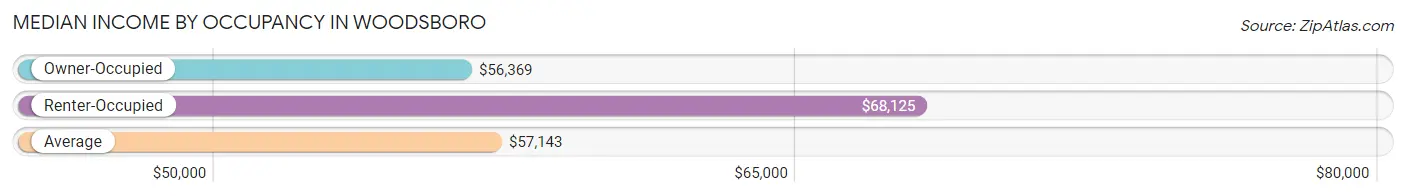
| Occupancy Type | # Households | Median Income |
| Owner-Occupied | 249 (80.8%) | $56,369 |
| Renter-Occupied | 59 (19.2%) | $68,125 |
| Average | 308 (100.0%) | $57,143 |
Occupancy by Householder Income Bracket in Woodsboro
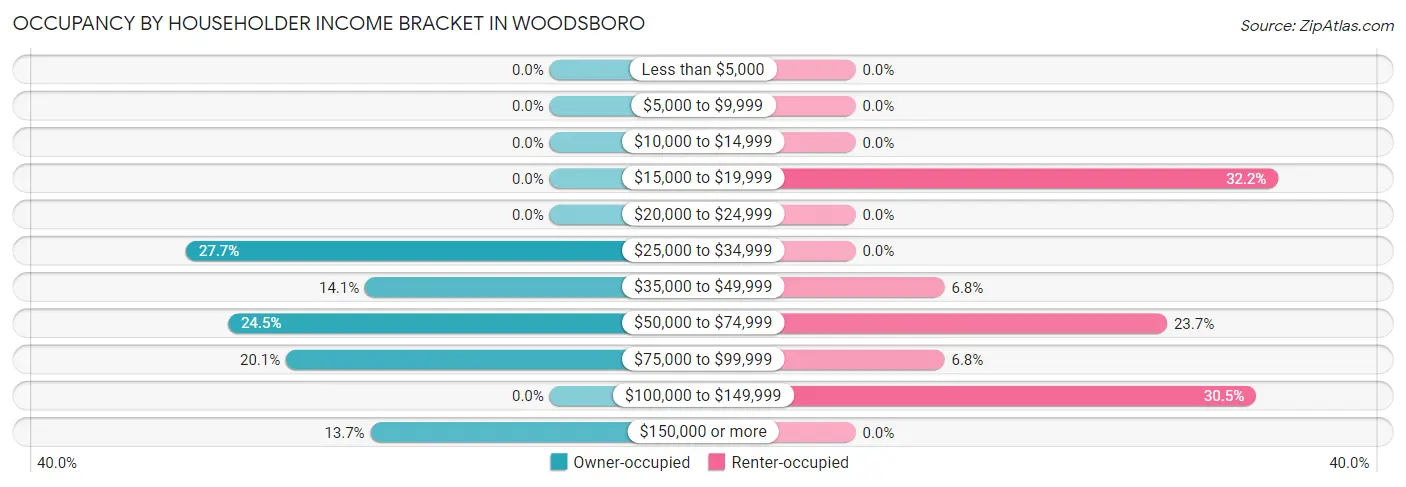
| Income Bracket | Owner-occupied | Renter-occupied |
| Less than $5,000 | 0 (0.0%) | 0 (0.0%) |
| $5,000 to $9,999 | 0 (0.0%) | 0 (0.0%) |
| $10,000 to $14,999 | 0 (0.0%) | 0 (0.0%) |
| $15,000 to $19,999 | 0 (0.0%) | 19 (32.2%) |
| $20,000 to $24,999 | 0 (0.0%) | 0 (0.0%) |
| $25,000 to $34,999 | 69 (27.7%) | 0 (0.0%) |
| $35,000 to $49,999 | 35 (14.1%) | 4 (6.8%) |
| $50,000 to $74,999 | 61 (24.5%) | 14 (23.7%) |
| $75,000 to $99,999 | 50 (20.1%) | 4 (6.8%) |
| $100,000 to $149,999 | 0 (0.0%) | 18 (30.5%) |
| $150,000 or more | 34 (13.7%) | 0 (0.0%) |
| Total | 249 (100.0%) | 59 (100.0%) |
Monthly Housing Cost Tiers in Woodsboro
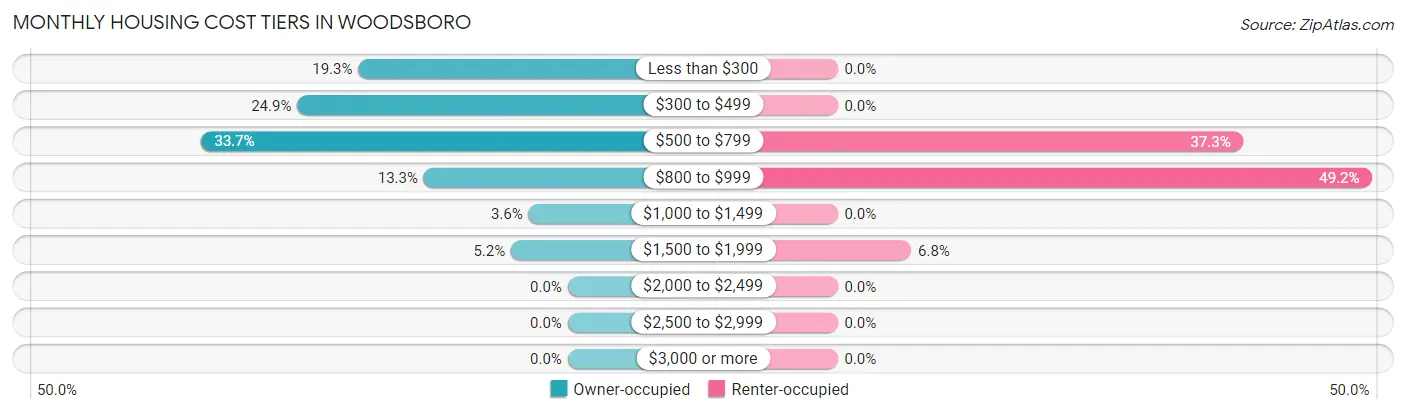
| Monthly Cost | Owner-occupied | Renter-occupied |
| Less than $300 | 48 (19.3%) | 0 (0.0%) |
| $300 to $499 | 62 (24.9%) | 0 (0.0%) |
| $500 to $799 | 84 (33.7%) | 22 (37.3%) |
| $800 to $999 | 33 (13.3%) | 29 (49.1%) |
| $1,000 to $1,499 | 9 (3.6%) | 0 (0.0%) |
| $1,500 to $1,999 | 13 (5.2%) | 4 (6.8%) |
| $2,000 to $2,499 | 0 (0.0%) | 0 (0.0%) |
| $2,500 to $2,999 | 0 (0.0%) | 0 (0.0%) |
| $3,000 or more | 0 (0.0%) | 0 (0.0%) |
| Total | 249 (100.0%) | 59 (100.0%) |
Physical Housing Characteristics in Woodsboro
Housing Structures in Woodsboro
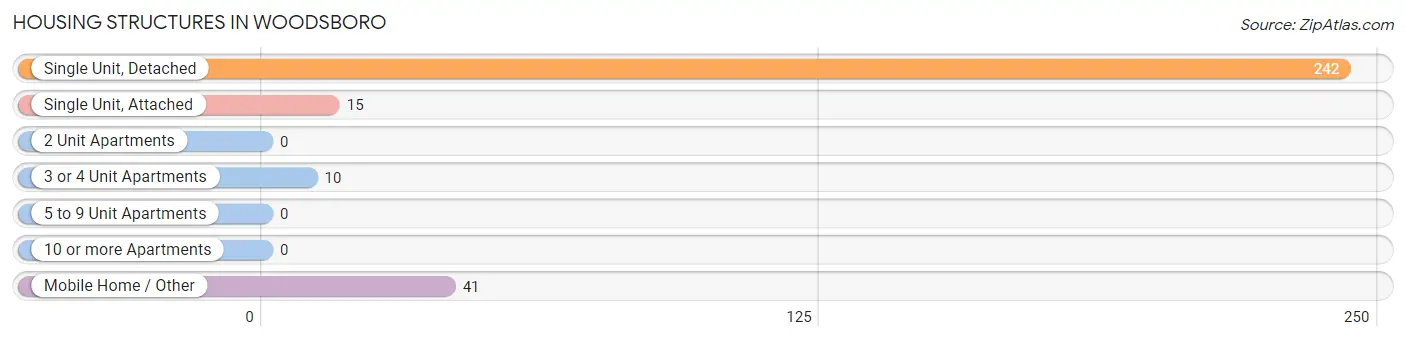
| Structure Type | # Housing Units | % Housing Units |
| Single Unit, Detached | 242 | 78.6% |
| Single Unit, Attached | 15 | 4.9% |
| 2 Unit Apartments | 0 | 0.0% |
| 3 or 4 Unit Apartments | 10 | 3.3% |
| 5 to 9 Unit Apartments | 0 | 0.0% |
| 10 or more Apartments | 0 | 0.0% |
| Mobile Home / Other | 41 | 13.3% |
| Total | 308 | 100.0% |
Housing Structures by Occupancy in Woodsboro
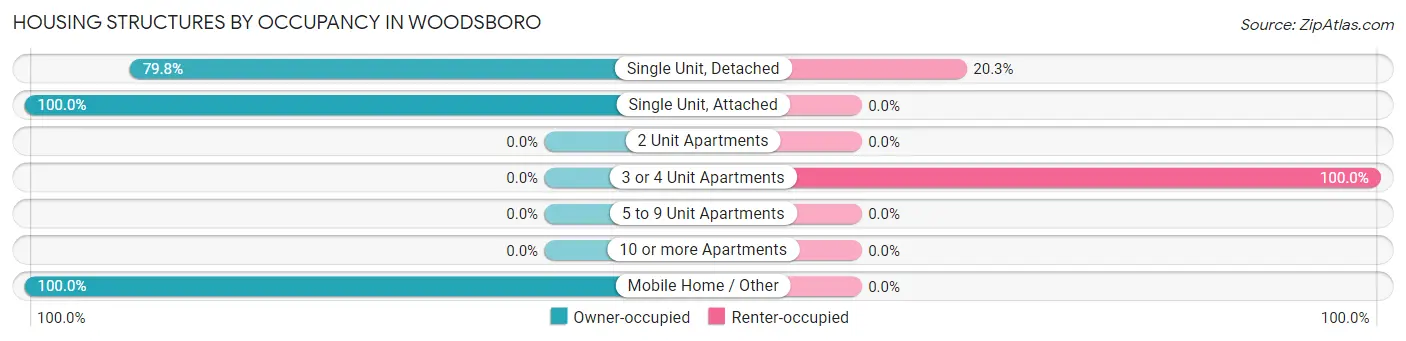
| Structure Type | Owner-occupied | Renter-occupied |
| Single Unit, Detached | 193 (79.7%) | 49 (20.3%) |
| Single Unit, Attached | 15 (100.0%) | 0 (0.0%) |
| 2 Unit Apartments | 0 (0.0%) | 0 (0.0%) |
| 3 or 4 Unit Apartments | 0 (0.0%) | 10 (100.0%) |
| 5 to 9 Unit Apartments | 0 (0.0%) | 0 (0.0%) |
| 10 or more Apartments | 0 (0.0%) | 0 (0.0%) |
| Mobile Home / Other | 41 (100.0%) | 0 (0.0%) |
| Total | 249 (80.8%) | 59 (19.2%) |
Housing Structures by Number of Rooms in Woodsboro
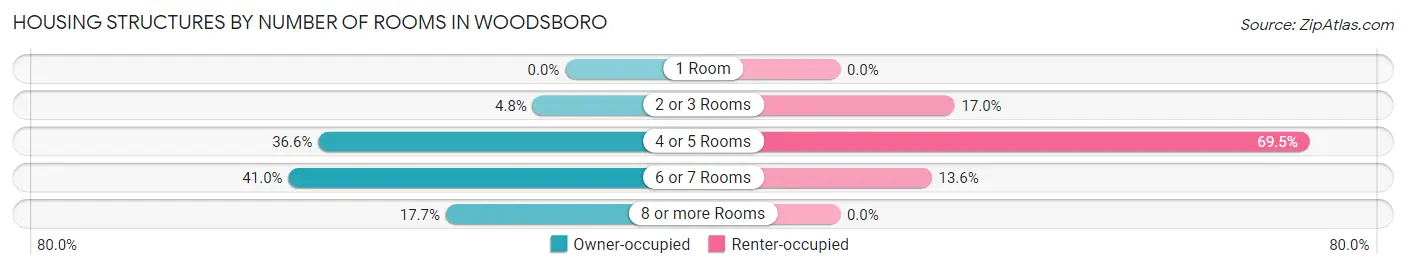
| Number of Rooms | Owner-occupied | Renter-occupied |
| 1 Room | 0 (0.0%) | 0 (0.0%) |
| 2 or 3 Rooms | 12 (4.8%) | 10 (17.0%) |
| 4 or 5 Rooms | 91 (36.5%) | 41 (69.5%) |
| 6 or 7 Rooms | 102 (41.0%) | 8 (13.6%) |
| 8 or more Rooms | 44 (17.7%) | 0 (0.0%) |
| Total | 249 (100.0%) | 59 (100.0%) |
Housing Structure by Heating Type in Woodsboro
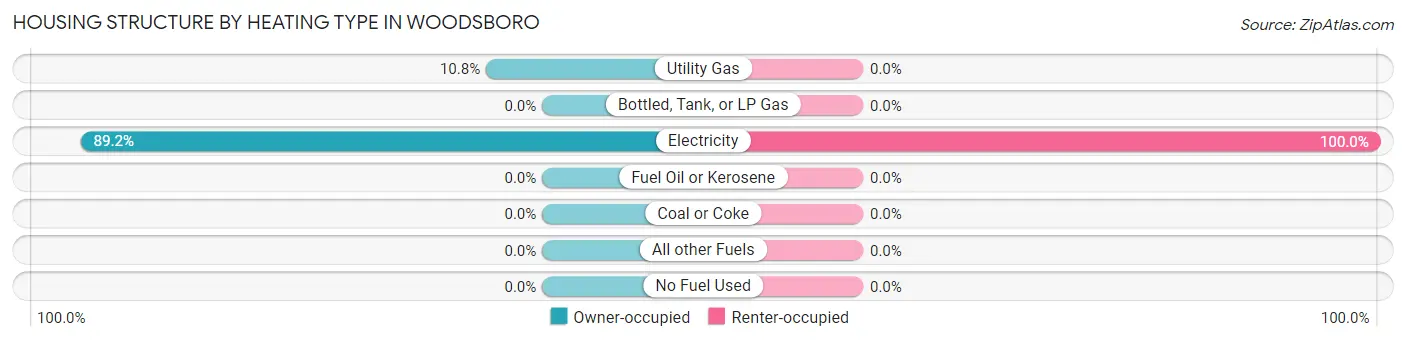
| Heating Type | Owner-occupied | Renter-occupied |
| Utility Gas | 27 (10.8%) | 0 (0.0%) |
| Bottled, Tank, or LP Gas | 0 (0.0%) | 0 (0.0%) |
| Electricity | 222 (89.2%) | 59 (100.0%) |
| Fuel Oil or Kerosene | 0 (0.0%) | 0 (0.0%) |
| Coal or Coke | 0 (0.0%) | 0 (0.0%) |
| All other Fuels | 0 (0.0%) | 0 (0.0%) |
| No Fuel Used | 0 (0.0%) | 0 (0.0%) |
| Total | 249 (100.0%) | 59 (100.0%) |
Household Vehicle Usage in Woodsboro
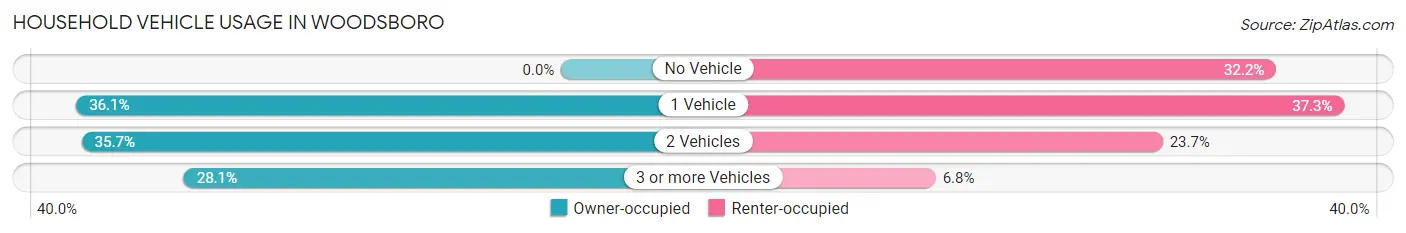
| Vehicles per Household | Owner-occupied | Renter-occupied |
| No Vehicle | 0 (0.0%) | 19 (32.2%) |
| 1 Vehicle | 90 (36.1%) | 22 (37.3%) |
| 2 Vehicles | 89 (35.7%) | 14 (23.7%) |
| 3 or more Vehicles | 70 (28.1%) | 4 (6.8%) |
| Total | 249 (100.0%) | 59 (100.0%) |
Real Estate & Mortgages in Woodsboro
Real Estate and Mortgage Overview in Woodsboro
| Characteristic | Without Mortgage | With Mortgage |
| Housing Units | 204 | 45 |
| Median Property Value | $80,600 | $0 |
| Median Household Income | $49,750 | $13 |
| Monthly Housing Costs | $479 | $0 |
| Real Estate Taxes | $897 | $0 |
Property Value by Mortgage Status in Woodsboro
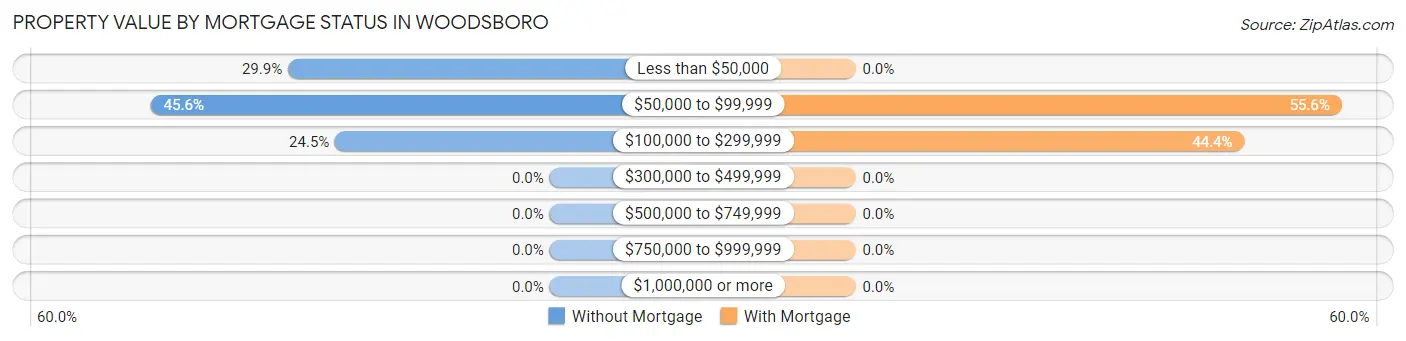
| Property Value | Without Mortgage | With Mortgage |
| Less than $50,000 | 61 (29.9%) | 0 (0.0%) |
| $50,000 to $99,999 | 93 (45.6%) | 25 (55.6%) |
| $100,000 to $299,999 | 50 (24.5%) | 20 (44.4%) |
| $300,000 to $499,999 | 0 (0.0%) | 0 (0.0%) |
| $500,000 to $749,999 | 0 (0.0%) | 0 (0.0%) |
| $750,000 to $999,999 | 0 (0.0%) | 0 (0.0%) |
| $1,000,000 or more | 0 (0.0%) | 0 (0.0%) |
| Total | 204 (100.0%) | 45 (100.0%) |
Household Income by Mortgage Status in Woodsboro
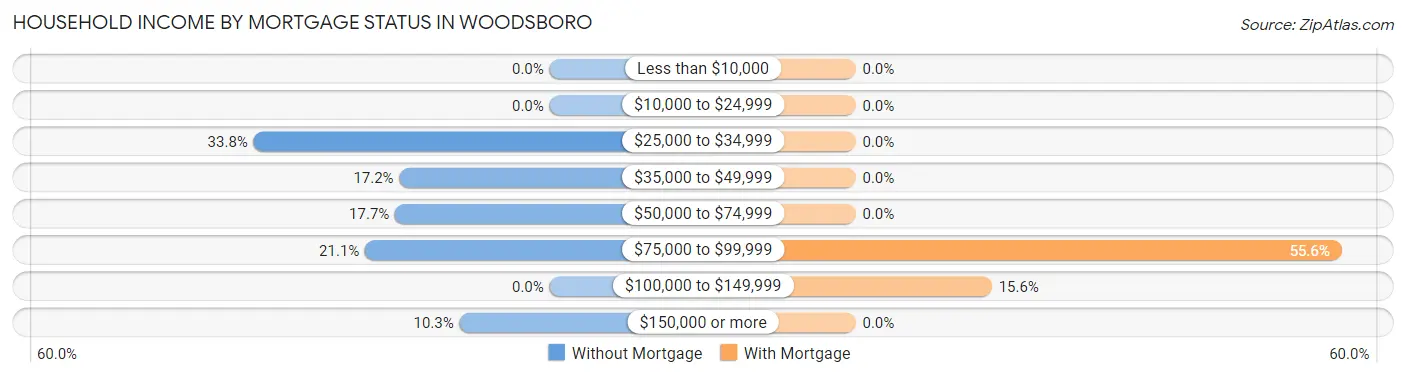
| Household Income | Without Mortgage | With Mortgage |
| Less than $10,000 | 0 (0.0%) | 0 (0.0%) |
| $10,000 to $24,999 | 0 (0.0%) | 0 (0.0%) |
| $25,000 to $34,999 | 69 (33.8%) | 0 (0.0%) |
| $35,000 to $49,999 | 35 (17.2%) | 0 (0.0%) |
| $50,000 to $74,999 | 36 (17.6%) | 0 (0.0%) |
| $75,000 to $99,999 | 43 (21.1%) | 25 (55.6%) |
| $100,000 to $149,999 | 0 (0.0%) | 7 (15.6%) |
| $150,000 or more | 21 (10.3%) | 0 (0.0%) |
| Total | 204 (100.0%) | 45 (100.0%) |
Property Value to Household Income Ratio in Woodsboro
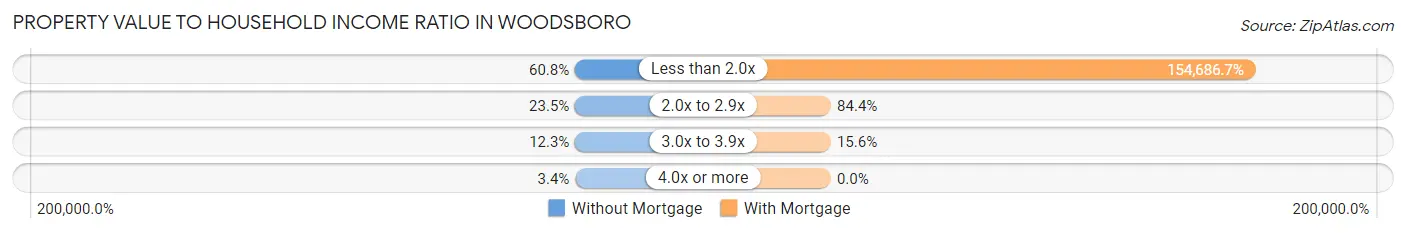
| Value-to-Income Ratio | Without Mortgage | With Mortgage |
| Less than 2.0x | 124 (60.8%) | 69,609 (154,686.7%) |
| 2.0x to 2.9x | 48 (23.5%) | 38 (84.4%) |
| 3.0x to 3.9x | 25 (12.2%) | 7 (15.6%) |
| 4.0x or more | 7 (3.4%) | 0 (0.0%) |
| Total | 204 (100.0%) | 45 (100.0%) |
Real Estate Taxes by Mortgage Status in Woodsboro
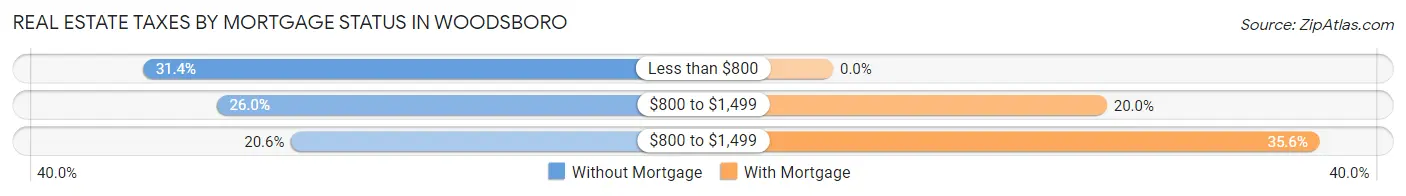
| Property Taxes | Without Mortgage | With Mortgage |
| Less than $800 | 64 (31.4%) | 0 (0.0%) |
| $800 to $1,499 | 53 (26.0%) | 9 (20.0%) |
| $800 to $1,499 | 42 (20.6%) | 16 (35.6%) |
| Total | 204 (100.0%) | 45 (100.0%) |
Health & Disability in Woodsboro
Health Insurance Coverage by Age in Woodsboro
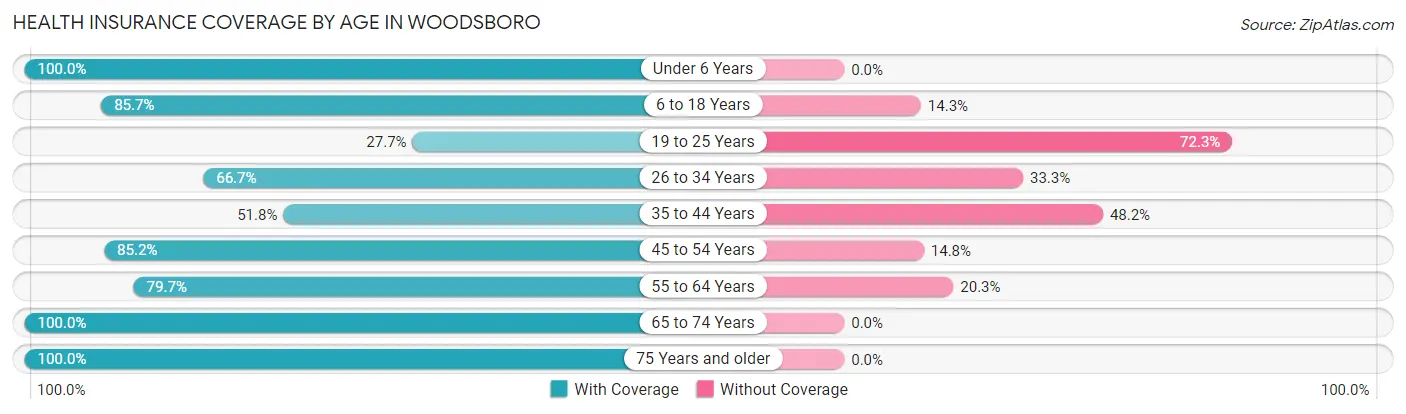
| Age Bracket | With Coverage | Without Coverage |
| Under 6 Years | 39 (100.0%) | 0 (0.0%) |
| 6 to 18 Years | 240 (85.7%) | 40 (14.3%) |
| 19 to 25 Years | 31 (27.7%) | 81 (72.3%) |
| 26 to 34 Years | 140 (66.7%) | 70 (33.3%) |
| 35 to 44 Years | 73 (51.8%) | 68 (48.2%) |
| 45 to 54 Years | 109 (85.2%) | 19 (14.8%) |
| 55 to 64 Years | 94 (79.7%) | 24 (20.3%) |
| 65 to 74 Years | 101 (100.0%) | 0 (0.0%) |
| 75 Years and older | 98 (100.0%) | 0 (0.0%) |
| Total | 925 (75.4%) | 302 (24.6%) |
Health Insurance Coverage by Citizenship Status in Woodsboro
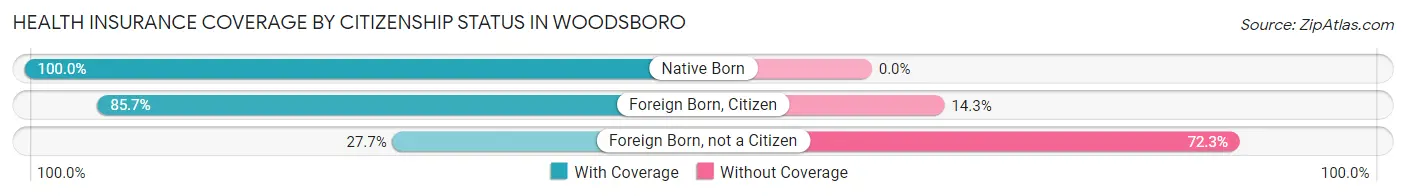
| Citizenship Status | With Coverage | Without Coverage |
| Native Born | 39 (100.0%) | 0 (0.0%) |
| Foreign Born, Citizen | 240 (85.7%) | 40 (14.3%) |
| Foreign Born, not a Citizen | 31 (27.7%) | 81 (72.3%) |
Health Insurance Coverage by Household Income in Woodsboro
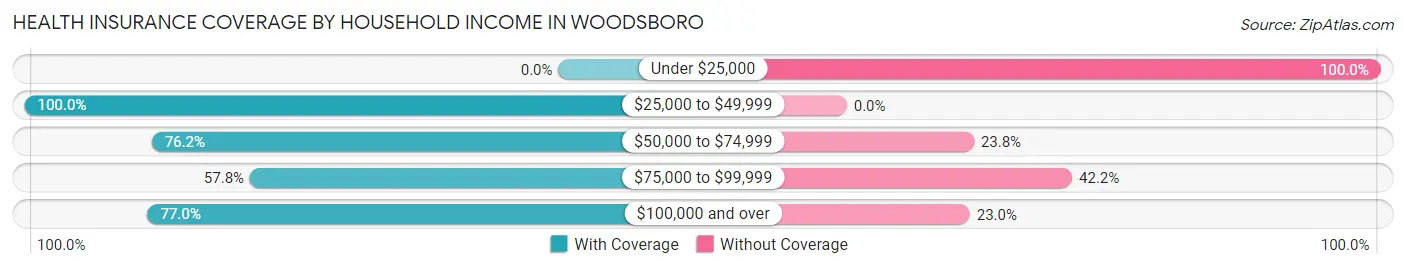
| Household Income | With Coverage | Without Coverage |
| Under $25,000 | 0 (0.0%) | 19 (100.0%) |
| $25,000 to $49,999 | 231 (100.0%) | 0 (0.0%) |
| $50,000 to $74,999 | 243 (76.2%) | 76 (23.8%) |
| $75,000 to $99,999 | 167 (57.8%) | 122 (42.2%) |
| $100,000 and over | 284 (77.0%) | 85 (23.0%) |
Public vs Private Health Insurance Coverage by Age in Woodsboro
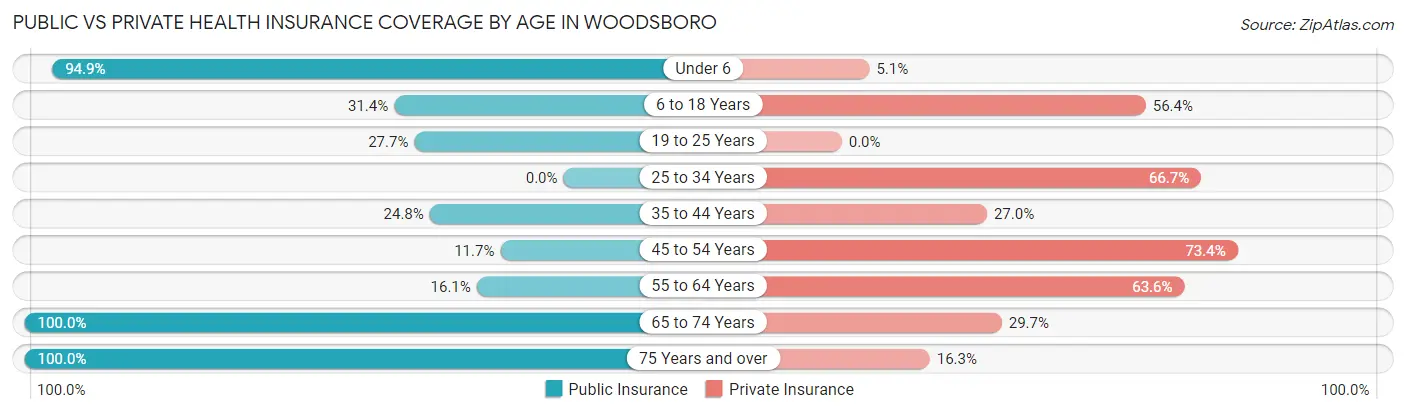
| Age Bracket | Public Insurance | Private Insurance |
| Under 6 | 37 (94.9%) | 2 (5.1%) |
| 6 to 18 Years | 88 (31.4%) | 158 (56.4%) |
| 19 to 25 Years | 31 (27.7%) | 0 (0.0%) |
| 25 to 34 Years | 0 (0.0%) | 140 (66.7%) |
| 35 to 44 Years | 35 (24.8%) | 38 (27.0%) |
| 45 to 54 Years | 15 (11.7%) | 94 (73.4%) |
| 55 to 64 Years | 19 (16.1%) | 75 (63.6%) |
| 65 to 74 Years | 101 (100.0%) | 30 (29.7%) |
| 75 Years and over | 98 (100.0%) | 16 (16.3%) |
| Total | 424 (34.6%) | 553 (45.1%) |
Disability Status by Sex by Age in Woodsboro
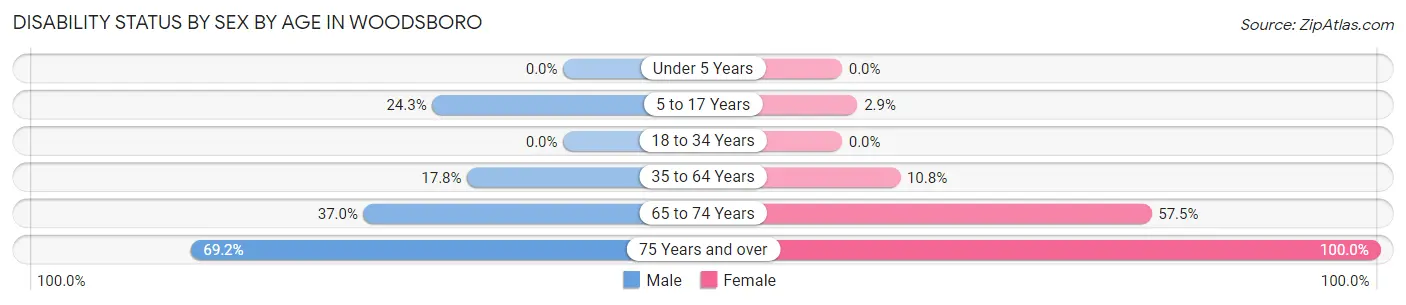
| Age Bracket | Male | Female |
| Under 5 Years | 0 (0.0%) | 0 (0.0%) |
| 5 to 17 Years | 17 (24.3%) | 4 (2.9%) |
| 18 to 34 Years | 0 (0.0%) | 0 (0.0%) |
| 35 to 64 Years | 31 (17.8%) | 23 (10.8%) |
| 65 to 74 Years | 20 (37.0%) | 27 (57.5%) |
| 75 Years and over | 36 (69.2%) | 46 (100.0%) |
Disability Class by Sex by Age in Woodsboro
Disability Class: Hearing Difficulty
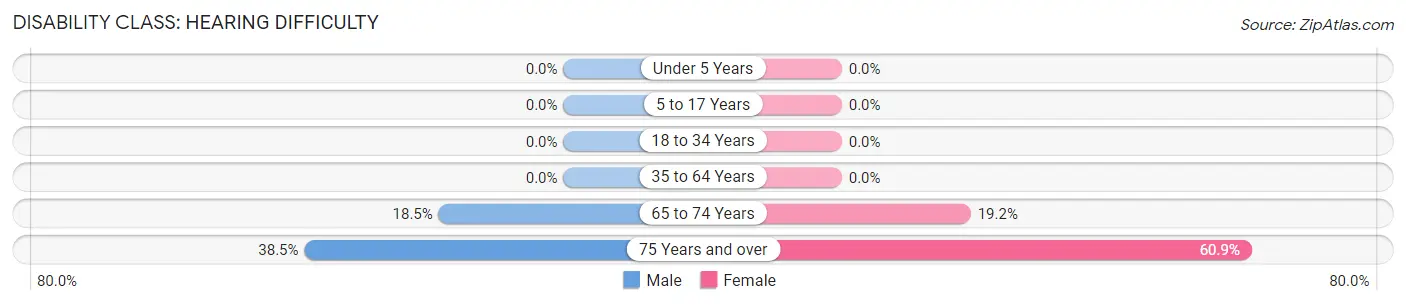
| Age Bracket | Male | Female |
| Under 5 Years | 0 (0.0%) | 0 (0.0%) |
| 5 to 17 Years | 0 (0.0%) | 0 (0.0%) |
| 18 to 34 Years | 0 (0.0%) | 0 (0.0%) |
| 35 to 64 Years | 0 (0.0%) | 0 (0.0%) |
| 65 to 74 Years | 10 (18.5%) | 9 (19.2%) |
| 75 Years and over | 20 (38.5%) | 28 (60.9%) |
Disability Class: Vision Difficulty
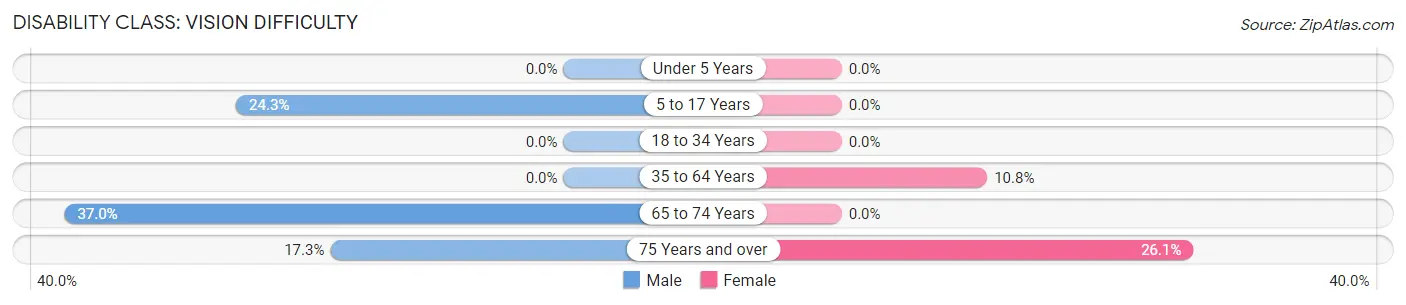
| Age Bracket | Male | Female |
| Under 5 Years | 0 (0.0%) | 0 (0.0%) |
| 5 to 17 Years | 17 (24.3%) | 0 (0.0%) |
| 18 to 34 Years | 0 (0.0%) | 0 (0.0%) |
| 35 to 64 Years | 0 (0.0%) | 23 (10.8%) |
| 65 to 74 Years | 20 (37.0%) | 0 (0.0%) |
| 75 Years and over | 9 (17.3%) | 12 (26.1%) |
Disability Class: Cognitive Difficulty
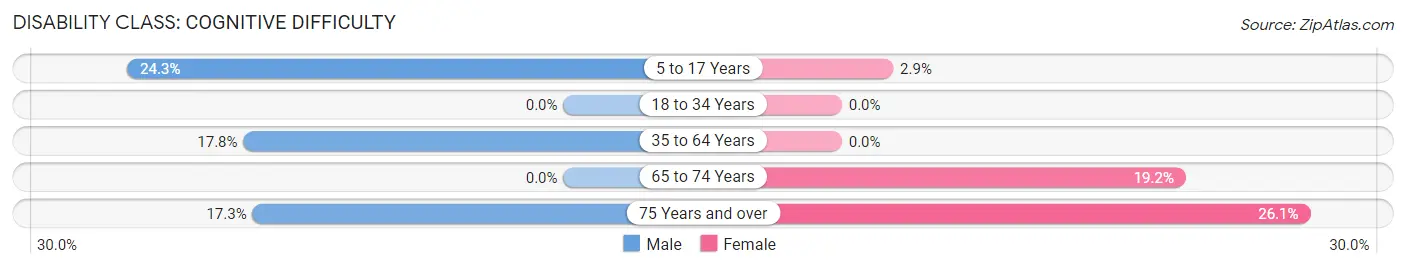
| Age Bracket | Male | Female |
| 5 to 17 Years | 17 (24.3%) | 4 (2.9%) |
| 18 to 34 Years | 0 (0.0%) | 0 (0.0%) |
| 35 to 64 Years | 31 (17.8%) | 0 (0.0%) |
| 65 to 74 Years | 0 (0.0%) | 9 (19.2%) |
| 75 Years and over | 9 (17.3%) | 12 (26.1%) |
Disability Class: Ambulatory Difficulty
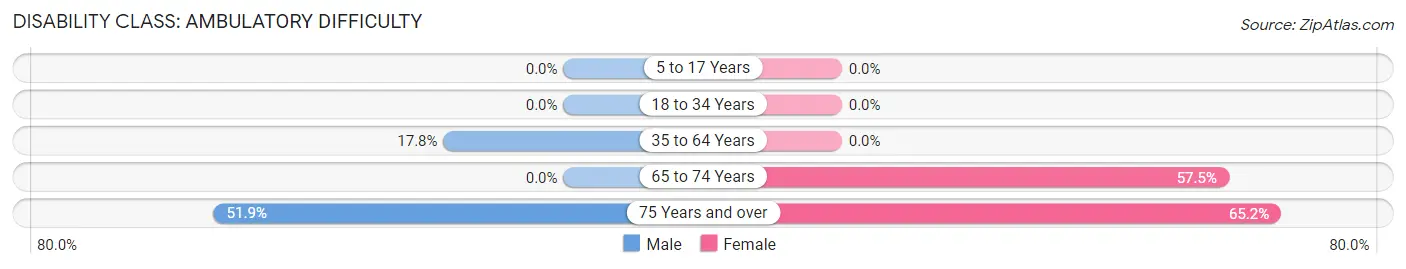
| Age Bracket | Male | Female |
| 5 to 17 Years | 0 (0.0%) | 0 (0.0%) |
| 18 to 34 Years | 0 (0.0%) | 0 (0.0%) |
| 35 to 64 Years | 31 (17.8%) | 0 (0.0%) |
| 65 to 74 Years | 0 (0.0%) | 27 (57.5%) |
| 75 Years and over | 27 (51.9%) | 30 (65.2%) |
Disability Class: Self-Care Difficulty
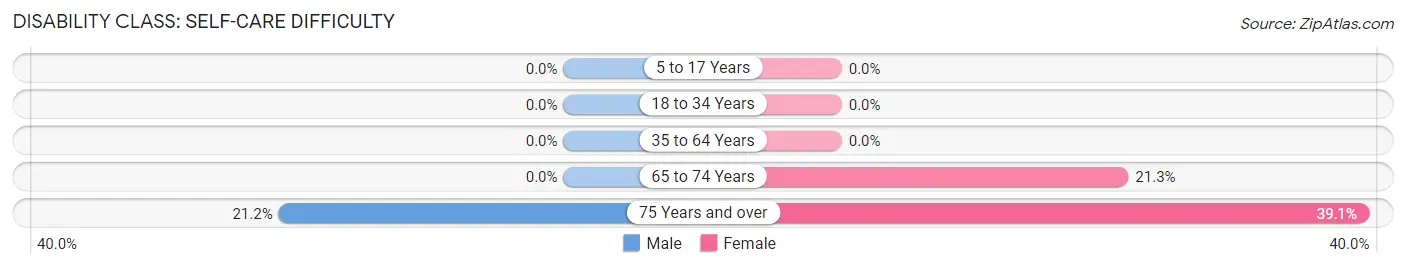
| Age Bracket | Male | Female |
| 5 to 17 Years | 0 (0.0%) | 0 (0.0%) |
| 18 to 34 Years | 0 (0.0%) | 0 (0.0%) |
| 35 to 64 Years | 0 (0.0%) | 0 (0.0%) |
| 65 to 74 Years | 0 (0.0%) | 10 (21.3%) |
| 75 Years and over | 11 (21.1%) | 18 (39.1%) |
Technology Access in Woodsboro
Computing Device Access in Woodsboro
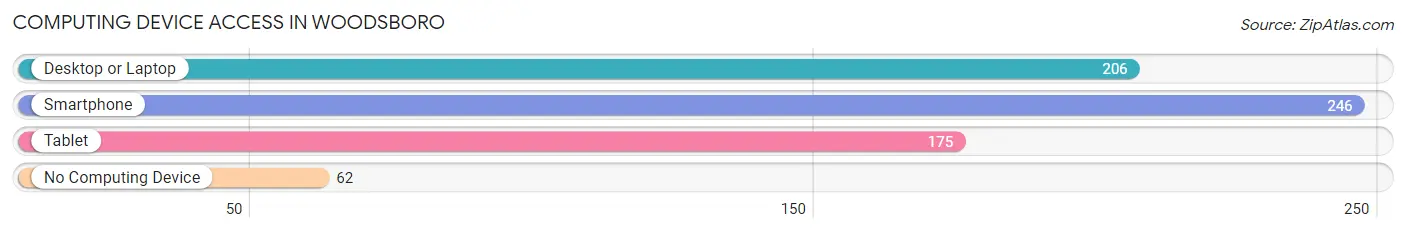
| Device Type | # Households | % Households |
| Desktop or Laptop | 206 | 66.9% |
| Smartphone | 246 | 79.9% |
| Tablet | 175 | 56.8% |
| No Computing Device | 62 | 20.1% |
| Total | 308 | 100.0% |
Internet Access in Woodsboro
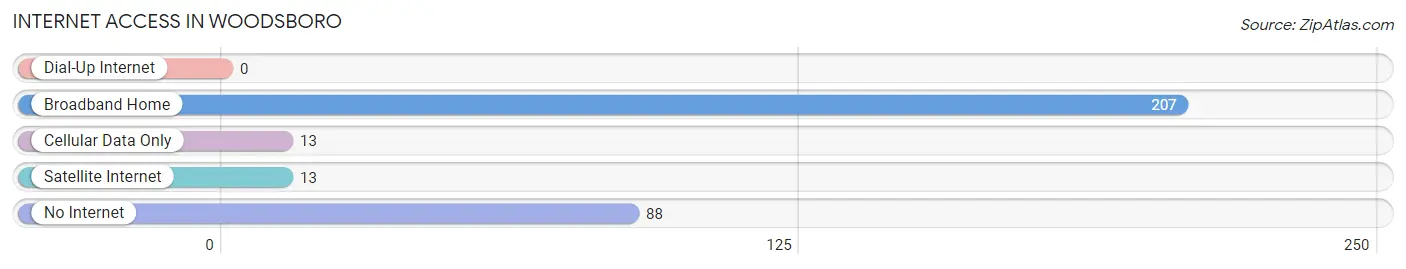
| Internet Type | # Households | % Households |
| Dial-Up Internet | 0 | 0.0% |
| Broadband Home | 207 | 67.2% |
| Cellular Data Only | 13 | 4.2% |
| Satellite Internet | 13 | 4.2% |
| No Internet | 88 | 28.6% |
| Total | 308 | 100.0% |
Woodsboro Summary
Woodsboro is a small town located in Refugio County, Texas, United States. It is situated on the Gulf Coast, approximately 50 miles northeast of Corpus Christi. The population was 1,093 at the 2010 census.
History
Woodsboro was founded in 1883 by a group of settlers from Woodsboro, Maryland. The town was named after the Maryland town, and the settlers brought with them the same name. The town was originally a farming community, and the settlers grew cotton, corn, and other crops.
In the early 1900s, the town began to grow and develop. The first school was built in 1906, and the first bank opened in 1907. The town also had a post office, a hotel, and a general store.
In the 1920s, the town began to experience a boom in oil production. The first oil well was drilled in 1923, and by the end of the decade, Woodsboro had become a major oil-producing center. The town also had a number of other businesses, including a cotton gin, a lumber yard, and a movie theater.
In the 1950s, the town began to decline as the oil industry moved away. The population dropped from 1,500 in 1950 to just over 1,000 in 1960. The town also lost its post office and its bank.
Geography
Woodsboro is located at 28°17'25" North, 97°17'45" West (28.290278, -97.295833). It is situated on the Gulf Coast, approximately 50 miles northeast of Corpus Christi. The town is located in Refugio County, and is bordered by the cities of Refugio, Austwell, and Bayside.
The town has a total area of 1.2 square miles, all of which is land. The terrain is mostly flat, with some rolling hills. The climate is subtropical, with hot summers and mild winters.
Economy
The economy of Woodsboro is largely based on agriculture and oil production. The town is home to several farms, which produce cotton, corn, and other crops. The town also has a number of oil wells, which produce crude oil and natural gas.
The town also has a number of small businesses, including a grocery store, a hardware store, and a few restaurants.
Demographics
As of the 2010 census, there were 1,093 people, 431 households, and 294 families residing in the town. The population density was 908.3 people per square mile. The racial makeup of the town was 81.2% White, 0.7% African American, 0.2% Native American, 0.2% Asian, 0.1% Pacific Islander, 15.7% from other races, and 2.0% from two or more races. Hispanic or Latino of any race were 33.2% of the population.
The median income for a household in the town was $30,000, and the median income for a family was $35,000. The per capita income for the town was $14,000. About 20.3% of families and 24.2% of the population were below the poverty line, including 33.3% of those under age 18 and 16.7% of those age 65 or over.
Common Questions
What is Per Capita Income in Woodsboro?
Per Capita income in Woodsboro is $27,315.
What is the Median Family Income in Woodsboro?
Median Family Income in Woodsboro is $67,833.
What is the Median Household income in Woodsboro?
Median Household Income in Woodsboro is $57,143.
What is Income or Wage Gap in Woodsboro?
Income or Wage Gap in Woodsboro is 4.0%.
Women in Woodsboro earn 96.0 cents for every dollar earned by a man.
What is Inequality or Gini Index in Woodsboro?
Inequality or Gini Index in Woodsboro is 0.38.
What is the Total Population of Woodsboro?
Total Population of Woodsboro is 1,227.
What is the Total Male Population of Woodsboro?
Total Male Population of Woodsboro is 603.
What is the Total Female Population of Woodsboro?
Total Female Population of Woodsboro is 624.
What is the Ratio of Males per 100 Females in Woodsboro?
There are 96.63 Males per 100 Females in Woodsboro.
What is the Ratio of Females per 100 Males in Woodsboro?
There are 103.48 Females per 100 Males in Woodsboro.
What is the Median Population Age in Woodsboro?
Median Population Age in Woodsboro is 31.1 Years.
What is the Average Family Size in Woodsboro
Average Family Size in Woodsboro is 5.5 People.
What is the Average Household Size in Woodsboro
Average Household Size in Woodsboro is 4.0 People.
How Large is the Labor Force in Woodsboro?
There are 601 People in the Labor Forcein in Woodsboro.
What is the Percentage of People in the Labor Force in Woodsboro?
59.3% of People are in the Labor Force in Woodsboro.
What is the Unemployment Rate in Woodsboro?
Unemployment Rate in Woodsboro is 4.2%.