Wheeler, TX Map & Demographics
Wheeler Map
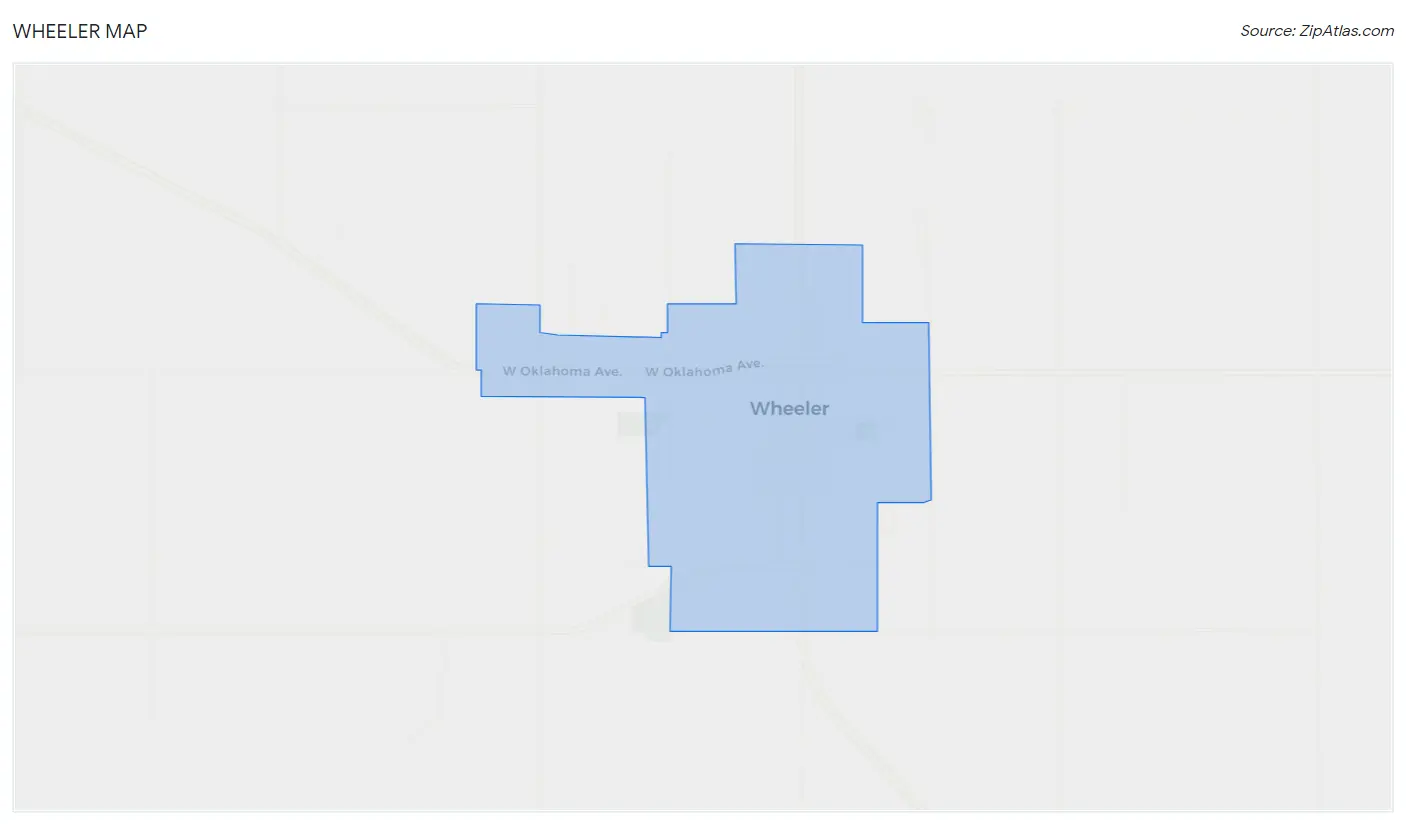
Wheeler Overview
$25,878
PER CAPITA INCOME
$65,724
AVG FAMILY INCOME
$56,250
AVG HOUSEHOLD INCOME
68.2%
WAGE / INCOME GAP [ % ]
31.8¢/ $1
WAGE / INCOME GAP [ $ ]
0.39
INEQUALITY / GINI INDEX
1,454
TOTAL POPULATION
705
MALE POPULATION
749
FEMALE POPULATION
94.13
MALES / 100 FEMALES
106.24
FEMALES / 100 MALES
39.4
MEDIAN AGE
3.1
AVG FAMILY SIZE
2.9
AVG HOUSEHOLD SIZE
685
LABOR FORCE [ PEOPLE ]
62.6%
PERCENT IN LABOR FORCE
5.7%
UNEMPLOYMENT RATE
Wheeler Zip Codes
Wheeler Area Codes
Income in Wheeler
Income Overview in Wheeler
Per Capita Income in Wheeler is $25,878, while median incomes of families and households are $65,724 and $56,250 respectively.
| Characteristic | Number | Measure |
| Per Capita Income | 1,454 | $25,878 |
| Median Family Income | 413 | $65,724 |
| Mean Family Income | 413 | $77,529 |
| Median Household Income | 481 | $56,250 |
| Mean Household Income | 481 | $70,055 |
| Income Deficit | 413 | $0 |
| Wage / Income Gap (%) | 1,454 | 68.17% |
| Wage / Income Gap ($) | 1,454 | 31.83¢ per $1 |
| Gini / Inequality Index | 1,454 | 0.39 |
Earnings by Sex in Wheeler
Average Earnings in Wheeler are $31,051, $52,228 for men and $16,622 for women, a difference of 68.2%.
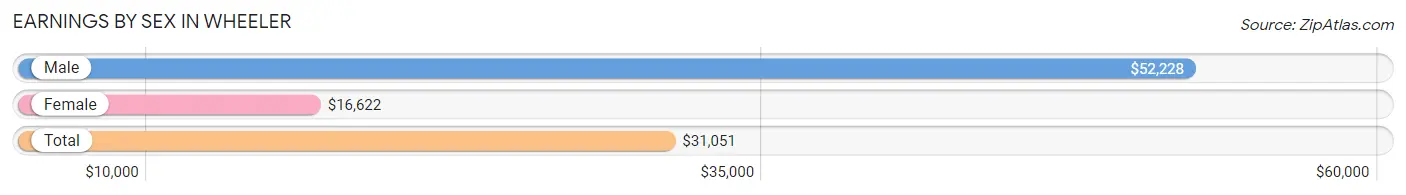
| Sex | Number | Average Earnings |
| Male | 315 (45.1%) | $52,228 |
| Female | 384 (54.9%) | $16,622 |
| Total | 699 (100.0%) | $31,051 |
Earnings by Sex by Income Bracket in Wheeler
The most common earnings brackets in Wheeler are $100,000+ for men (66 | 20.9%) and $2,500 to $4,999 for women (81 | 21.1%).
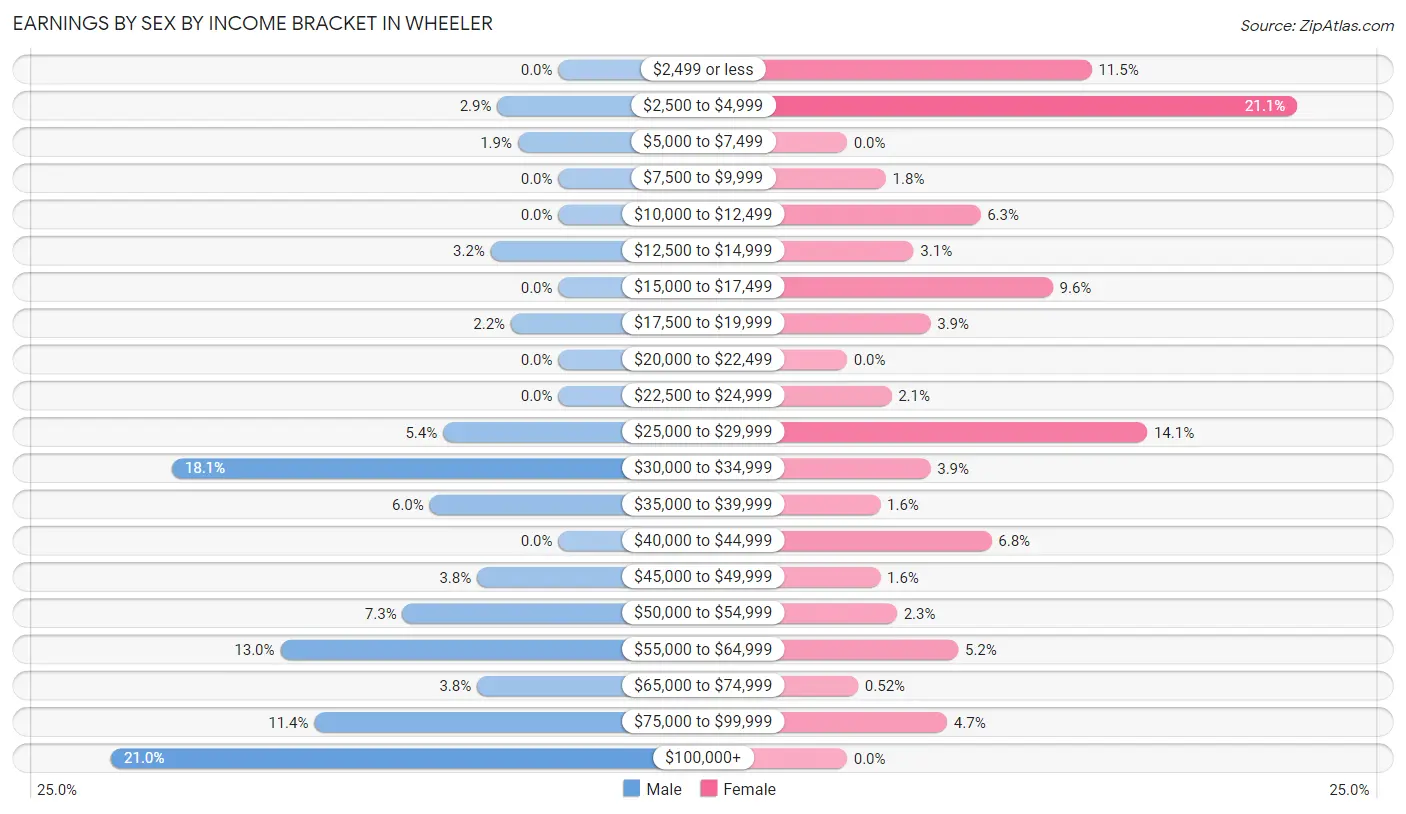
| Income | Male | Female |
| $2,499 or less | 0 (0.0%) | 44 (11.5%) |
| $2,500 to $4,999 | 9 (2.9%) | 81 (21.1%) |
| $5,000 to $7,499 | 6 (1.9%) | 0 (0.0%) |
| $7,500 to $9,999 | 0 (0.0%) | 7 (1.8%) |
| $10,000 to $12,499 | 0 (0.0%) | 24 (6.2%) |
| $12,500 to $14,999 | 10 (3.2%) | 12 (3.1%) |
| $15,000 to $17,499 | 0 (0.0%) | 37 (9.6%) |
| $17,500 to $19,999 | 7 (2.2%) | 15 (3.9%) |
| $20,000 to $22,499 | 0 (0.0%) | 0 (0.0%) |
| $22,500 to $24,999 | 0 (0.0%) | 8 (2.1%) |
| $25,000 to $29,999 | 17 (5.4%) | 54 (14.1%) |
| $30,000 to $34,999 | 57 (18.1%) | 15 (3.9%) |
| $35,000 to $39,999 | 19 (6.0%) | 6 (1.6%) |
| $40,000 to $44,999 | 0 (0.0%) | 26 (6.8%) |
| $45,000 to $49,999 | 12 (3.8%) | 6 (1.6%) |
| $50,000 to $54,999 | 23 (7.3%) | 9 (2.3%) |
| $55,000 to $64,999 | 41 (13.0%) | 20 (5.2%) |
| $65,000 to $74,999 | 12 (3.8%) | 2 (0.5%) |
| $75,000 to $99,999 | 36 (11.4%) | 18 (4.7%) |
| $100,000+ | 66 (20.9%) | 0 (0.0%) |
| Total | 315 (100.0%) | 384 (100.0%) |
Earnings by Sex by Educational Attainment in Wheeler
Average earnings in Wheeler are $52,228 for men and $24,375 for women, a difference of 53.3%. Men with an educational attainment of less than high school enjoy the highest average annual earnings of $62,697, while those with college or associate's degree education earn the least with $35,526. Women with an educational attainment of bachelor's degree earn the most with the average annual earnings of $59,000, while those with less than high school education have the smallest earnings of $12,381.
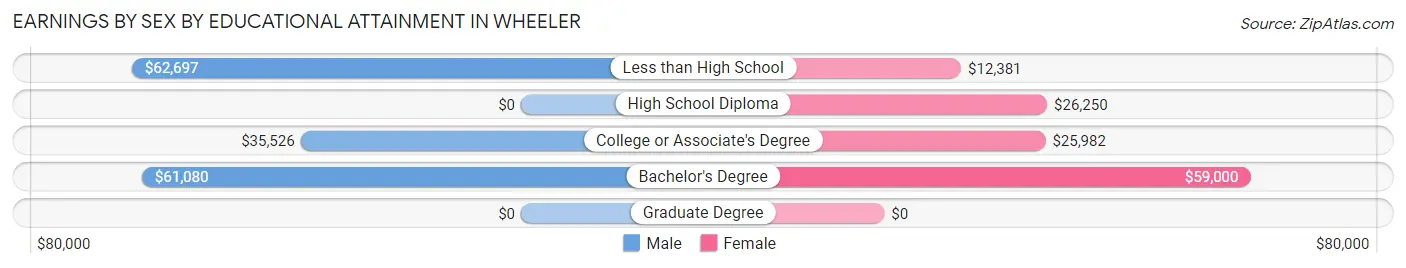
| Educational Attainment | Male Income | Female Income |
| Less than High School | $62,697 | $12,381 |
| High School Diploma | - | - |
| College or Associate's Degree | $35,526 | $25,982 |
| Bachelor's Degree | $61,080 | $59,000 |
| Graduate Degree | - | - |
| Total | $52,228 | $24,375 |
Family Income in Wheeler
Family Income Brackets in Wheeler
According to the Wheeler family income data, there are 81 families falling into the $100,000 to $149,999 income range, which is the most common income bracket and makes up 19.6% of all families. Conversely, the less than $10,000 income bracket is the least frequent group with only 8 families (1.9%) belonging to this category.
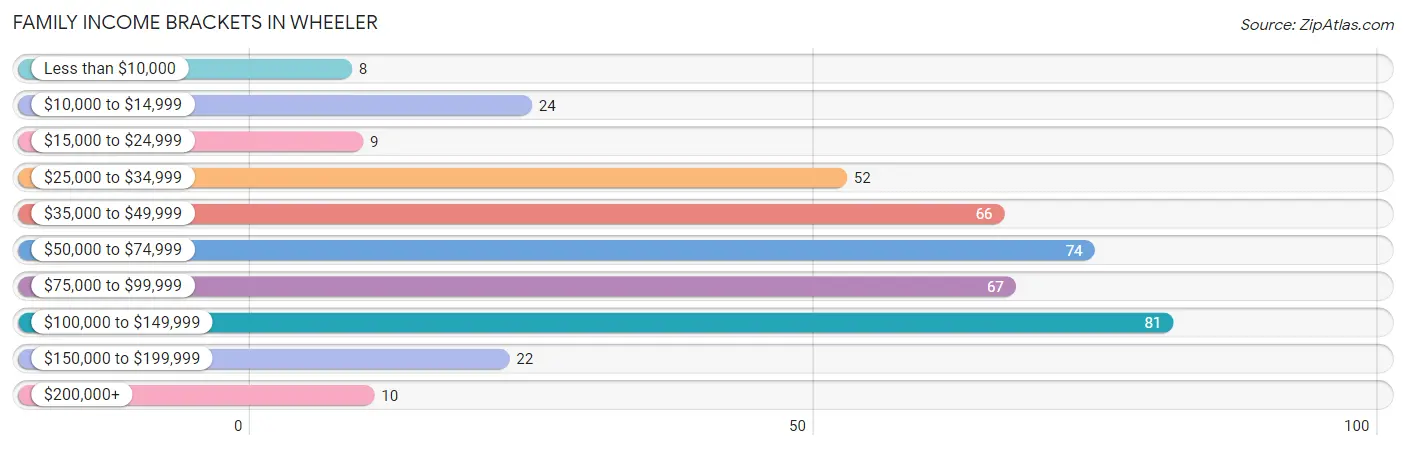
| Income Bracket | # Families | % Families |
| Less than $10,000 | 8 | 1.9% |
| $10,000 to $14,999 | 24 | 5.8% |
| $15,000 to $24,999 | 9 | 2.2% |
| $25,000 to $34,999 | 52 | 12.6% |
| $35,000 to $49,999 | 66 | 16.0% |
| $50,000 to $74,999 | 74 | 17.9% |
| $75,000 to $99,999 | 67 | 16.2% |
| $100,000 to $149,999 | 81 | 19.6% |
| $150,000 to $199,999 | 22 | 5.3% |
| $200,000+ | 10 | 2.4% |
Family Income by Famaliy Size in Wheeler
5-person families (31 | 7.5%) account for the highest median family income in Wheeler with $130,417 per family, while 4-person families (78 | 18.9%) have the highest median income of $30,039 per family member.
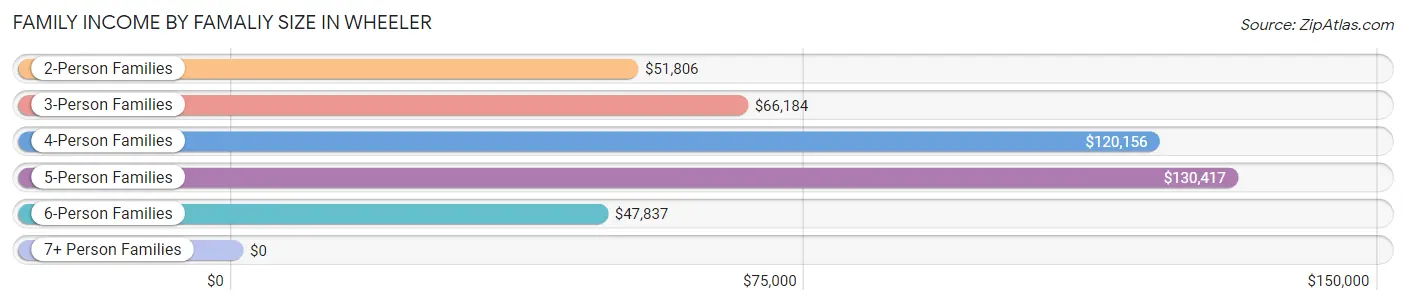
| Income Bracket | # Families | Median Income |
| 2-Person Families | 215 (52.1%) | $51,806 |
| 3-Person Families | 44 (10.6%) | $66,184 |
| 4-Person Families | 78 (18.9%) | $120,156 |
| 5-Person Families | 31 (7.5%) | $130,417 |
| 6-Person Families | 45 (10.9%) | $47,837 |
| 7+ Person Families | 0 (0.0%) | $0 |
| Total | 413 (100.0%) | $65,724 |
Family Income by Number of Earners in Wheeler
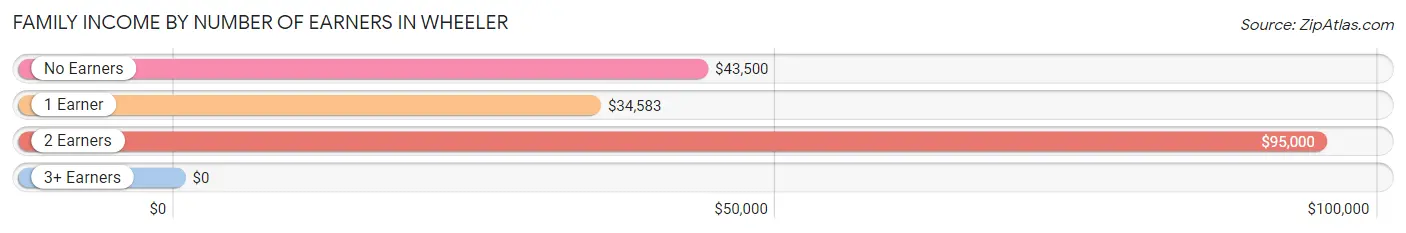
| Number of Earners | # Families | Median Income |
| No Earners | 84 (20.3%) | $43,500 |
| 1 Earner | 107 (25.9%) | $34,583 |
| 2 Earners | 198 (47.9%) | $95,000 |
| 3+ Earners | 24 (5.8%) | $0 |
| Total | 413 (100.0%) | $65,724 |
Household Income in Wheeler
Household Income Brackets in Wheeler
With 81 households falling in the category, the $25,000 to $34,999 income range is the most frequent in Wheeler, accounting for 16.8% of all households. In contrast, only 8 households (1.7%) fall into the less than $10,000 income bracket, making it the least populous group.
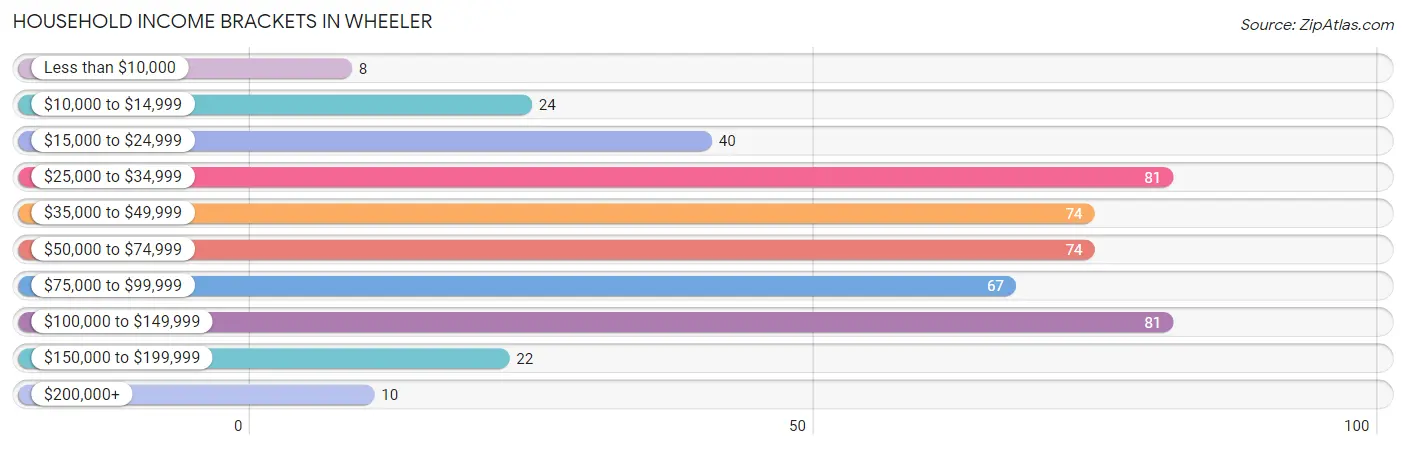
| Income Bracket | # Households | % Households |
| Less than $10,000 | 8 | 1.7% |
| $10,000 to $14,999 | 24 | 5.0% |
| $15,000 to $24,999 | 40 | 8.3% |
| $25,000 to $34,999 | 81 | 16.8% |
| $35,000 to $49,999 | 74 | 15.4% |
| $50,000 to $74,999 | 74 | 15.4% |
| $75,000 to $99,999 | 67 | 13.9% |
| $100,000 to $149,999 | 81 | 16.8% |
| $150,000 to $199,999 | 22 | 4.6% |
| $200,000+ | 10 | 2.1% |
Household Income by Householder Age in Wheeler
The median household income in Wheeler is $56,250, with the highest median household income of $86,071 found in the 25 to 44 years age bracket for the primary householder. A total of 180 households (37.4%) fall into this category.
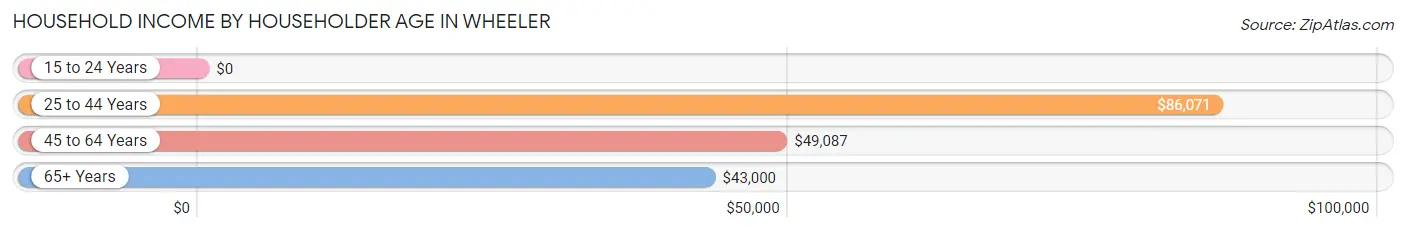
| Income Bracket | # Households | Median Income |
| 15 to 24 Years | 0 (0.0%) | $0 |
| 25 to 44 Years | 180 (37.4%) | $86,071 |
| 45 to 64 Years | 147 (30.6%) | $49,087 |
| 65+ Years | 154 (32.0%) | $43,000 |
| Total | 481 (100.0%) | $56,250 |
Poverty in Wheeler
Income Below Poverty by Sex and Age in Wheeler
With 16.2% poverty level for males and 20.7% for females among the residents of Wheeler, 75 year old and over males and 18 to 24 year old females are the most vulnerable to poverty, with 28 males (40.6%) and 50 females (84.8%) in their respective age groups living below the poverty level.
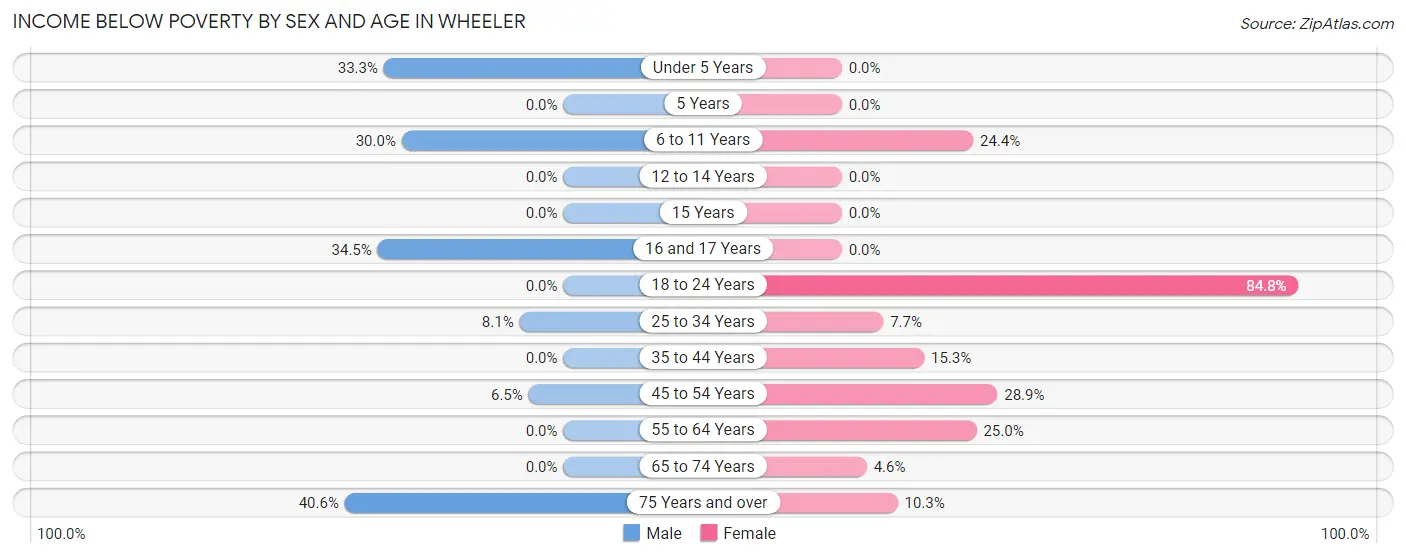
| Age Bracket | Male | Female |
| Under 5 Years | 32 (33.3%) | 0 (0.0%) |
| 5 Years | 0 (0.0%) | 0 (0.0%) |
| 6 to 11 Years | 27 (30.0%) | 19 (24.4%) |
| 12 to 14 Years | 0 (0.0%) | 0 (0.0%) |
| 15 Years | 0 (0.0%) | 0 (0.0%) |
| 16 and 17 Years | 10 (34.5%) | 0 (0.0%) |
| 18 to 24 Years | 0 (0.0%) | 50 (84.8%) |
| 25 to 34 Years | 7 (8.1%) | 5 (7.7%) |
| 35 to 44 Years | 0 (0.0%) | 20 (15.3%) |
| 45 to 54 Years | 4 (6.5%) | 28 (28.9%) |
| 55 to 64 Years | 0 (0.0%) | 16 (25.0%) |
| 65 to 74 Years | 0 (0.0%) | 3 (4.6%) |
| 75 Years and over | 28 (40.6%) | 9 (10.3%) |
| Total | 108 (16.2%) | 150 (20.7%) |
Income Above Poverty by Sex and Age in Wheeler
According to the poverty statistics in Wheeler, males aged 5 years and females aged under 5 years are the age groups that are most secure financially, with 100.0% of males and 100.0% of females in these age groups living above the poverty line.
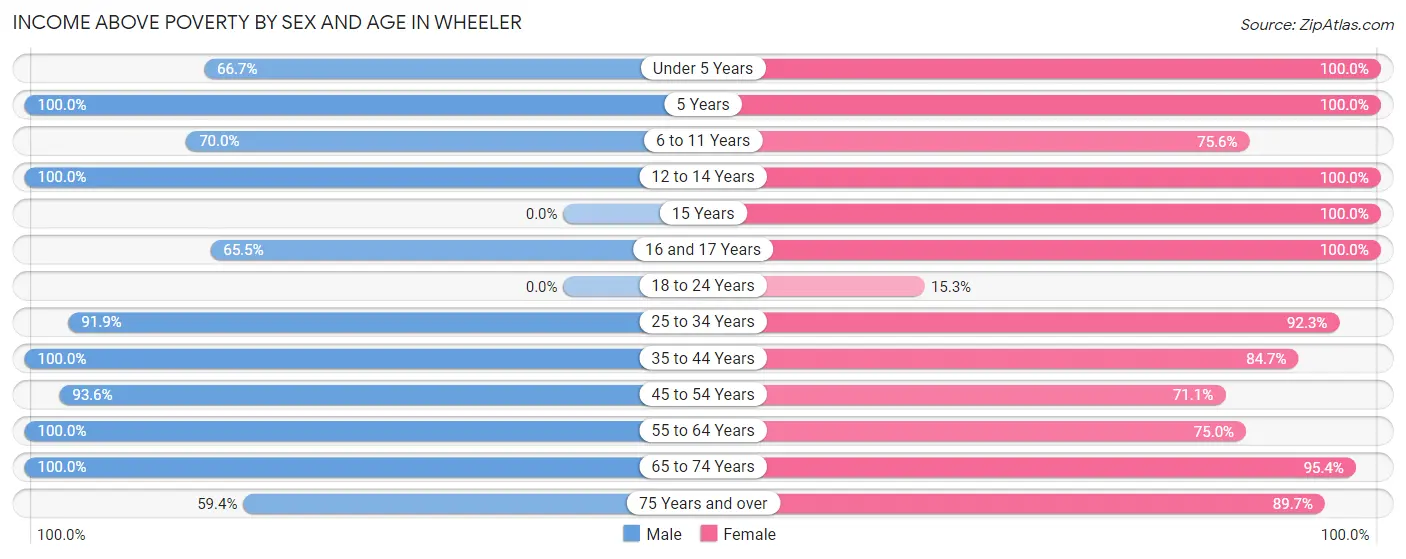
| Age Bracket | Male | Female |
| Under 5 Years | 64 (66.7%) | 15 (100.0%) |
| 5 Years | 24 (100.0%) | 9 (100.0%) |
| 6 to 11 Years | 63 (70.0%) | 59 (75.6%) |
| 12 to 14 Years | 24 (100.0%) | 16 (100.0%) |
| 15 Years | 0 (0.0%) | 8 (100.0%) |
| 16 and 17 Years | 19 (65.5%) | 29 (100.0%) |
| 18 to 24 Years | 0 (0.0%) | 9 (15.2%) |
| 25 to 34 Years | 79 (91.9%) | 60 (92.3%) |
| 35 to 44 Years | 105 (100.0%) | 111 (84.7%) |
| 45 to 54 Years | 58 (93.5%) | 69 (71.1%) |
| 55 to 64 Years | 49 (100.0%) | 48 (75.0%) |
| 65 to 74 Years | 34 (100.0%) | 62 (95.4%) |
| 75 Years and over | 41 (59.4%) | 78 (89.7%) |
| Total | 560 (83.8%) | 573 (79.2%) |
Income Below Poverty Among Married-Couple Families in Wheeler
The poverty statistics for married-couple families in Wheeler show that 6.6% or 19 of the total 288 families live below the poverty line. Families with 3 or 4 children have the highest poverty rate of 24.1%, comprising of 7 families. On the other hand, families with 1 or 2 children have the lowest poverty rate of 0.0%, which includes 0 families.
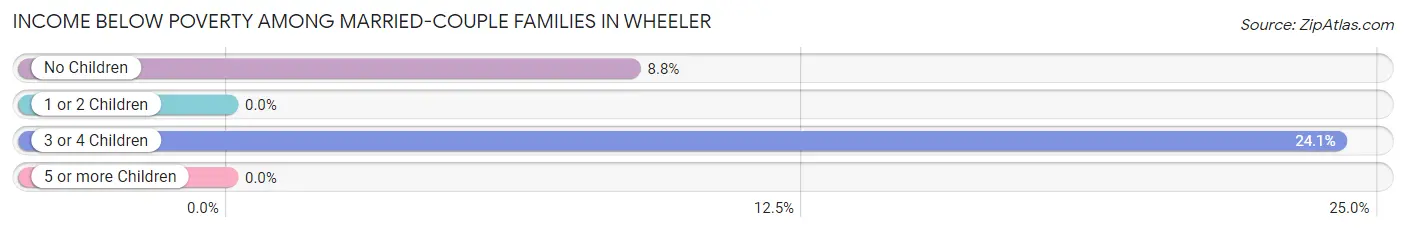
| Children | Above Poverty | Below Poverty |
| No Children | 125 (91.2%) | 12 (8.8%) |
| 1 or 2 Children | 122 (100.0%) | 0 (0.0%) |
| 3 or 4 Children | 22 (75.9%) | 7 (24.1%) |
| 5 or more Children | 0 (0.0%) | 0 (0.0%) |
| Total | 269 (93.4%) | 19 (6.6%) |
Income Below Poverty Among Single-Parent Households in Wheeler
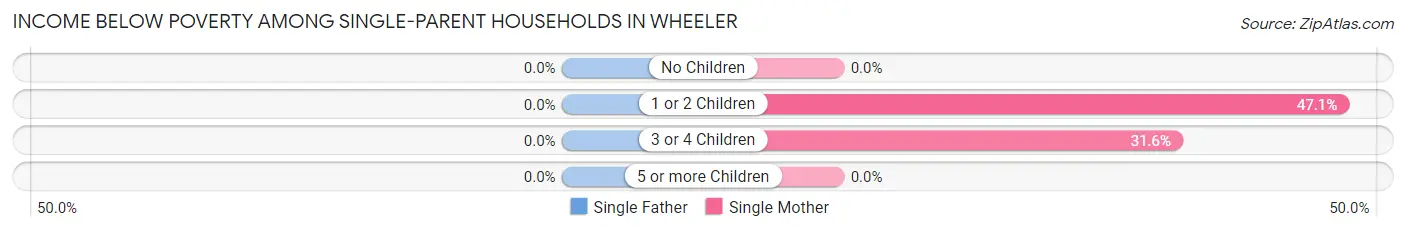
| Children | Single Father | Single Mother |
| No Children | 0 (0.0%) | 0 (0.0%) |
| 1 or 2 Children | 0 (0.0%) | 8 (47.1%) |
| 3 or 4 Children | 0 (0.0%) | 12 (31.6%) |
| 5 or more Children | 0 (0.0%) | 0 (0.0%) |
| Total | 0 (0.0%) | 20 (17.7%) |
Income Below Poverty Among Married-Couple vs Single-Parent Households in Wheeler
The poverty data for Wheeler shows that 19 of the married-couple family households (6.6%) and 20 of the single-parent households (16.0%) are living below the poverty level. Within the married-couple family households, those with 3 or 4 children have the highest poverty rate, with 7 households (24.1%) falling below the poverty line. Among the single-parent households, those with 3 or 4 children have the highest poverty rate, with 12 household (31.6%) living below poverty.
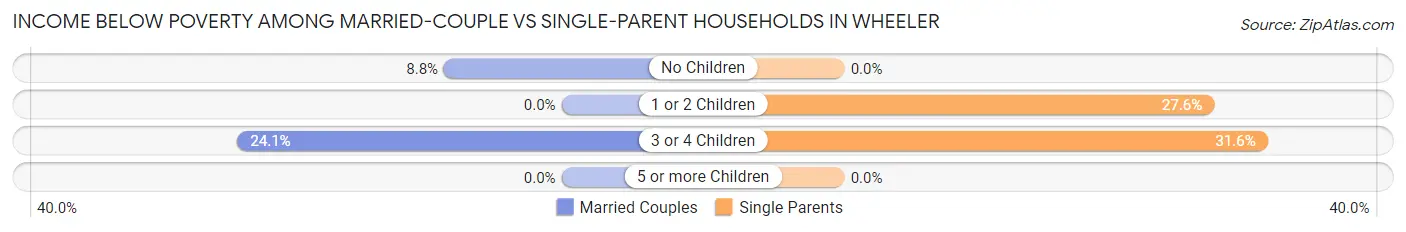
| Children | Married-Couple Families | Single-Parent Households |
| No Children | 12 (8.8%) | 0 (0.0%) |
| 1 or 2 Children | 0 (0.0%) | 8 (27.6%) |
| 3 or 4 Children | 7 (24.1%) | 12 (31.6%) |
| 5 or more Children | 0 (0.0%) | 0 (0.0%) |
| Total | 19 (6.6%) | 20 (16.0%) |
Race in Wheeler
The most populous races in Wheeler are White / Caucasian (1,306 | 89.8%), Hispanic or Latino (367 | 25.2%), and Some other Race (93 | 6.4%).
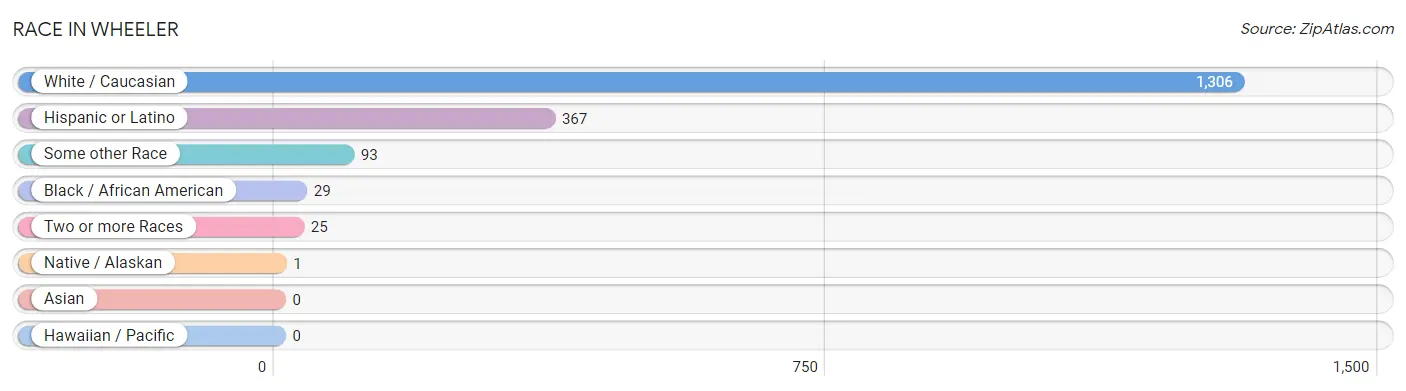
| Race | # Population | % Population |
| Asian | 0 | 0.0% |
| Black / African American | 29 | 2.0% |
| Hawaiian / Pacific | 0 | 0.0% |
| Hispanic or Latino | 367 | 25.2% |
| Native / Alaskan | 1 | 0.1% |
| White / Caucasian | 1,306 | 89.8% |
| Two or more Races | 25 | 1.7% |
| Some other Race | 93 | 6.4% |
| Total | 1,454 | 100.0% |
Ancestry in Wheeler
The most populous ancestries reported in Wheeler are Mexican (332 | 22.8%), Dutch (134 | 9.2%), Irish (132 | 9.1%), English (122 | 8.4%), and German (80 | 5.5%), together accounting for 55.0% of all Wheeler residents.
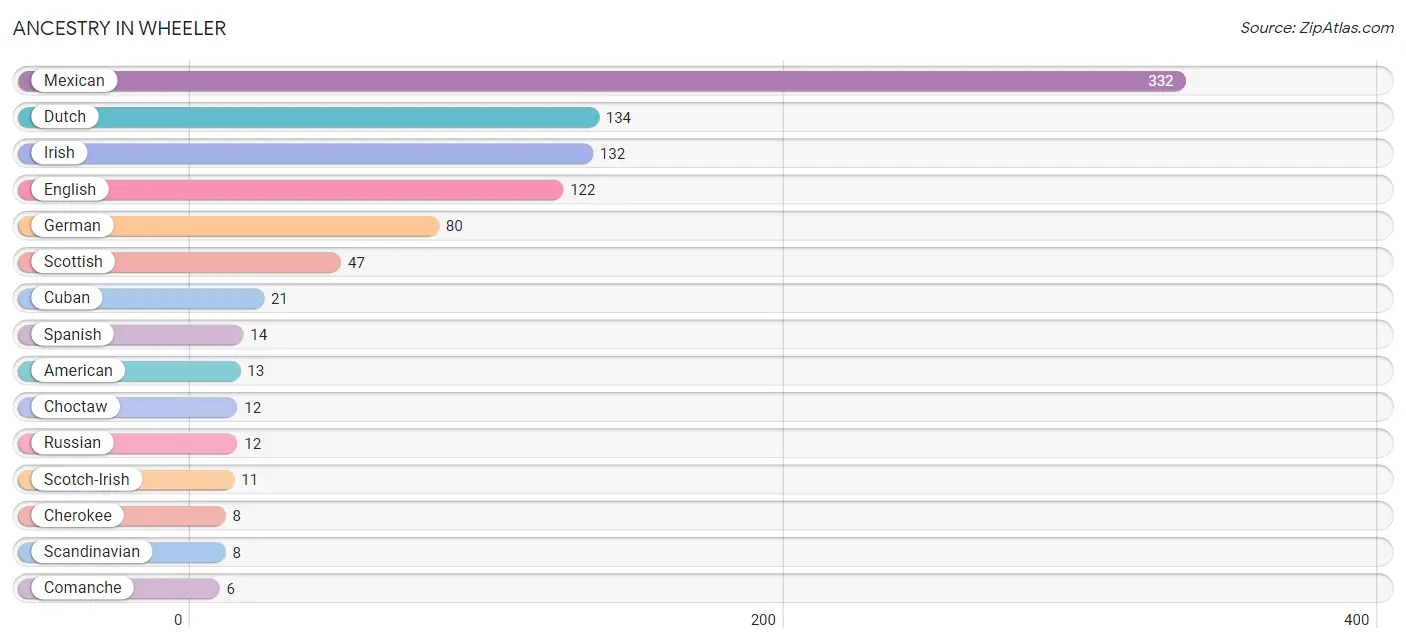
| Ancestry | # Population | % Population |
| American | 13 | 0.9% |
| Cherokee | 8 | 0.5% |
| Choctaw | 12 | 0.8% |
| Comanche | 6 | 0.4% |
| Cuban | 21 | 1.4% |
| Dutch | 134 | 9.2% |
| English | 122 | 8.4% |
| German | 80 | 5.5% |
| Irish | 132 | 9.1% |
| Italian | 4 | 0.3% |
| Mexican | 332 | 22.8% |
| Russian | 12 | 0.8% |
| Scandinavian | 8 | 0.5% |
| Scotch-Irish | 11 | 0.8% |
| Scottish | 47 | 3.2% |
| Spanish | 14 | 1.0% |
| Swiss | 4 | 0.3% | View All 17 Rows |
Immigrants in Wheeler
The most numerous immigrant groups reported in Wheeler came from Central America (160 | 11.0%), Latin America (160 | 11.0%), and Mexico (160 | 11.0%), together accounting for 33.0% of all Wheeler residents.
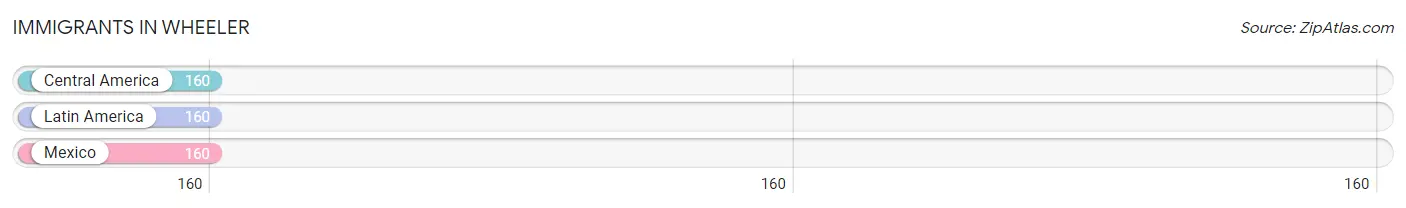
| Immigration Origin | # Population | % Population |
| Central America | 160 | 11.0% |
| Latin America | 160 | 11.0% |
| Mexico | 160 | 11.0% | View All 3 Rows |
Sex and Age in Wheeler
Sex and Age in Wheeler
The most populous age groups in Wheeler are 5 to 9 Years (99 | 14.0%) for men and 15 to 19 Years (96 | 12.8%) for women.
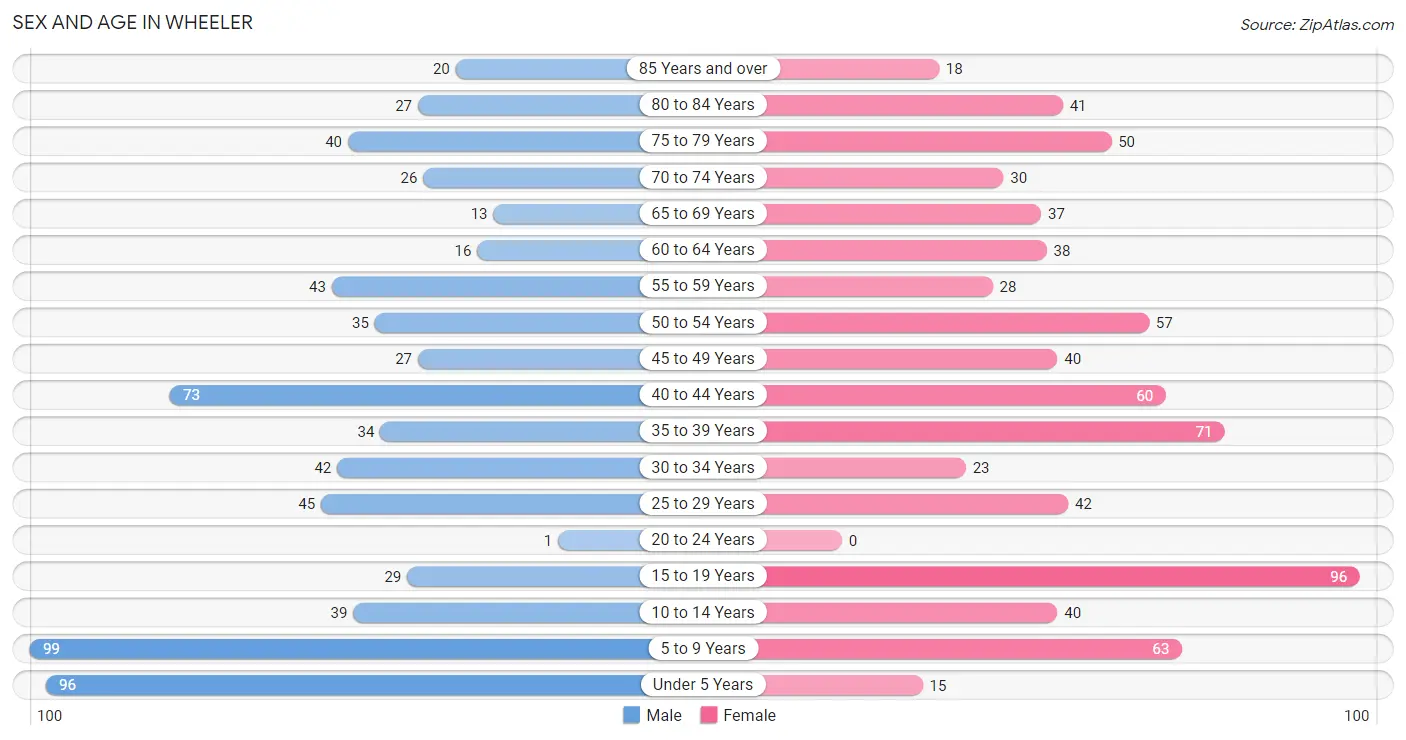
| Age Bracket | Male | Female |
| Under 5 Years | 96 (13.6%) | 15 (2.0%) |
| 5 to 9 Years | 99 (14.0%) | 63 (8.4%) |
| 10 to 14 Years | 39 (5.5%) | 40 (5.3%) |
| 15 to 19 Years | 29 (4.1%) | 96 (12.8%) |
| 20 to 24 Years | 1 (0.1%) | 0 (0.0%) |
| 25 to 29 Years | 45 (6.4%) | 42 (5.6%) |
| 30 to 34 Years | 42 (6.0%) | 23 (3.1%) |
| 35 to 39 Years | 34 (4.8%) | 71 (9.5%) |
| 40 to 44 Years | 73 (10.3%) | 60 (8.0%) |
| 45 to 49 Years | 27 (3.8%) | 40 (5.3%) |
| 50 to 54 Years | 35 (5.0%) | 57 (7.6%) |
| 55 to 59 Years | 43 (6.1%) | 28 (3.7%) |
| 60 to 64 Years | 16 (2.3%) | 38 (5.1%) |
| 65 to 69 Years | 13 (1.8%) | 37 (4.9%) |
| 70 to 74 Years | 26 (3.7%) | 30 (4.0%) |
| 75 to 79 Years | 40 (5.7%) | 50 (6.7%) |
| 80 to 84 Years | 27 (3.8%) | 41 (5.5%) |
| 85 Years and over | 20 (2.8%) | 18 (2.4%) |
| Total | 705 (100.0%) | 749 (100.0%) |
Families and Households in Wheeler
Median Family Size in Wheeler
The median family size in Wheeler is 3.07 persons per family, with married-couple families (288 | 69.7%) accounting for the largest median family size of 3.12 persons per family. On the other hand, single male/father families (12 | 2.9%) represent the smallest median family size with 2.00 persons per family.
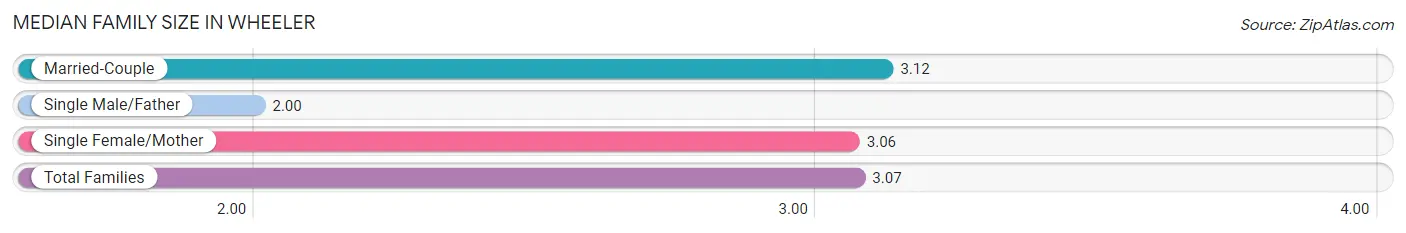
| Family Type | # Families | Family Size |
| Married-Couple | 288 (69.7%) | 3.12 |
| Single Male/Father | 12 (2.9%) | 2.00 |
| Single Female/Mother | 113 (27.4%) | 3.06 |
| Total Families | 413 (100.0%) | 3.07 |
Median Household Size in Wheeler
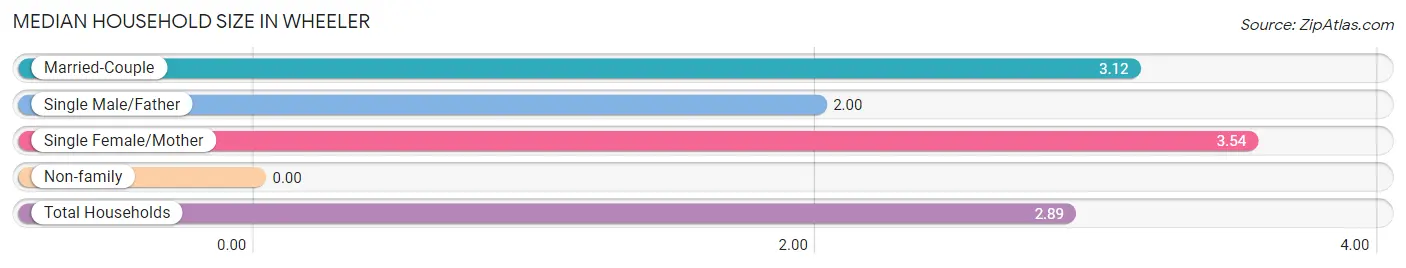
| Household Type | # Households | Household Size |
| Married-Couple | 288 (59.9%) | 3.12 |
| Single Male/Father | 12 (2.5%) | 2.00 |
| Single Female/Mother | 113 (23.5%) | 3.54 |
| Non-family | 68 (14.1%) | - |
| Total Households | 481 (100.0%) | 2.89 |
Household Size by Marriage Status in Wheeler
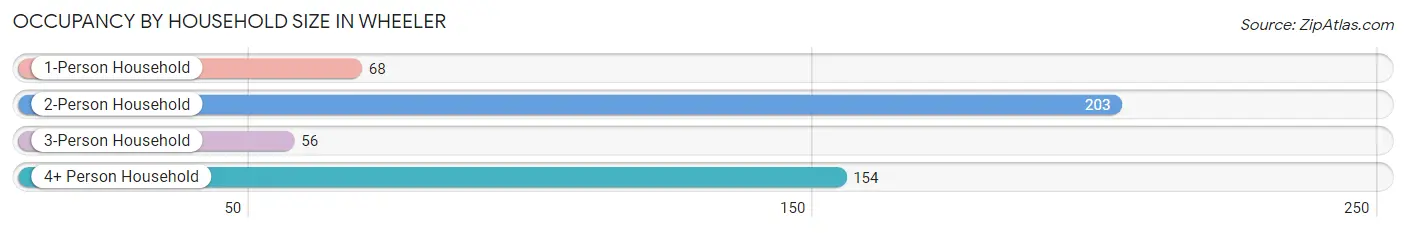
Out of a total of 481 households in Wheeler, 413 (85.9%) are family households, while 68 (14.1%) are nonfamily households. The most numerous type of family households are 2-person households, comprising 203, and the most common type of nonfamily households are 1-person households, comprising 68.
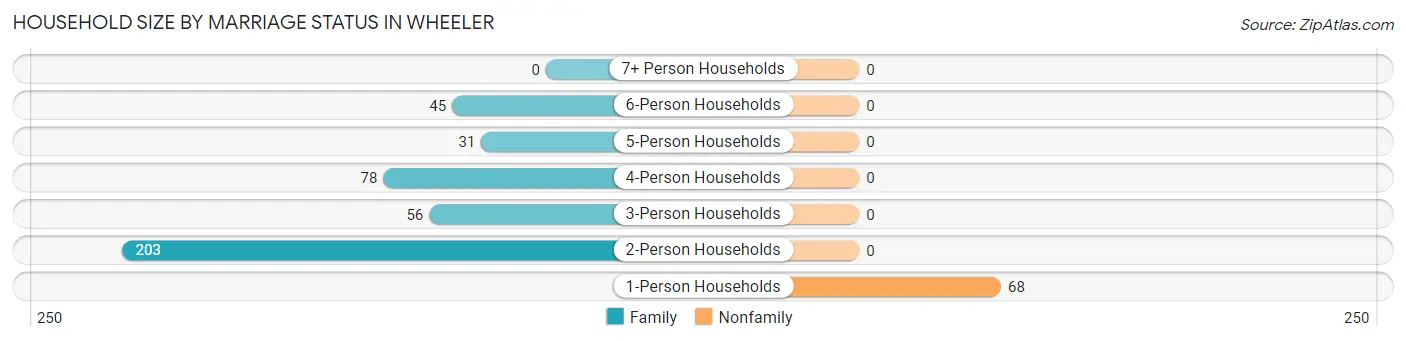
| Household Size | Family Households | Nonfamily Households |
| 1-Person Households | - | 68 (14.1%) |
| 2-Person Households | 203 (42.2%) | 0 (0.0%) |
| 3-Person Households | 56 (11.6%) | 0 (0.0%) |
| 4-Person Households | 78 (16.2%) | 0 (0.0%) |
| 5-Person Households | 31 (6.4%) | 0 (0.0%) |
| 6-Person Households | 45 (9.4%) | 0 (0.0%) |
| 7+ Person Households | 0 (0.0%) | 0 (0.0%) |
| Total | 413 (85.9%) | 68 (14.1%) |
Female Fertility in Wheeler
Fertility by Age in Wheeler
Average fertility rate in Wheeler is 40.0 births per 1,000 women. Women in the age bracket of 20 to 34 years have the highest fertility rate with 231.0 births per 1,000 women. Women in the age bracket of 20 to 34 years acount for 100.0% of all women with births.
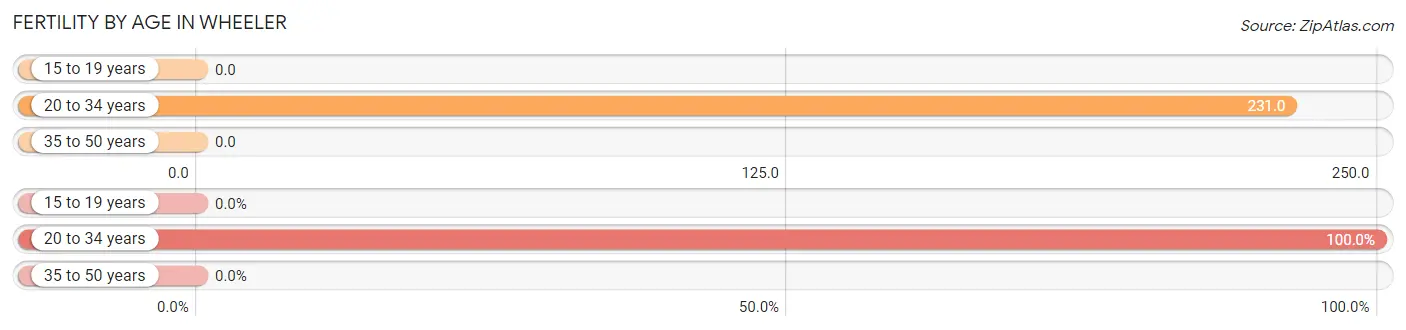
| Age Bracket | Women with Births | Births / 1,000 Women |
| 15 to 19 years | 0 (0.0%) | 0.0 |
| 20 to 34 years | 15 (100.0%) | 231.0 |
| 35 to 50 years | 0 (0.0%) | 0.0 |
| Total | 15 (100.0%) | 40.0 |
Fertility by Age by Marriage Status in Wheeler
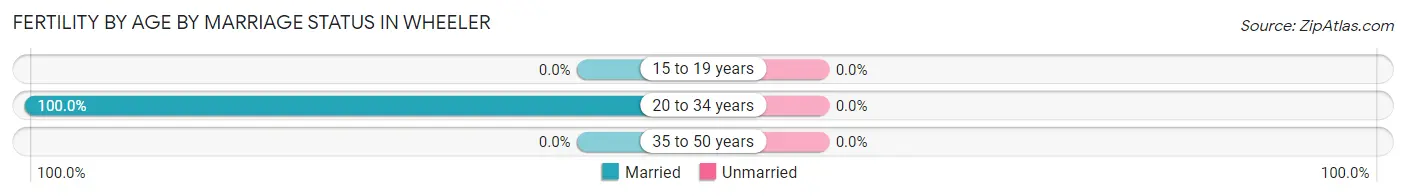
| Age Bracket | Married | Unmarried |
| 15 to 19 years | 0 (0.0%) | 0 (0.0%) |
| 20 to 34 years | 15 (100.0%) | 0 (0.0%) |
| 35 to 50 years | 0 (0.0%) | 0 (0.0%) |
| Total | 15 (100.0%) | 0 (0.0%) |
Fertility by Education in Wheeler
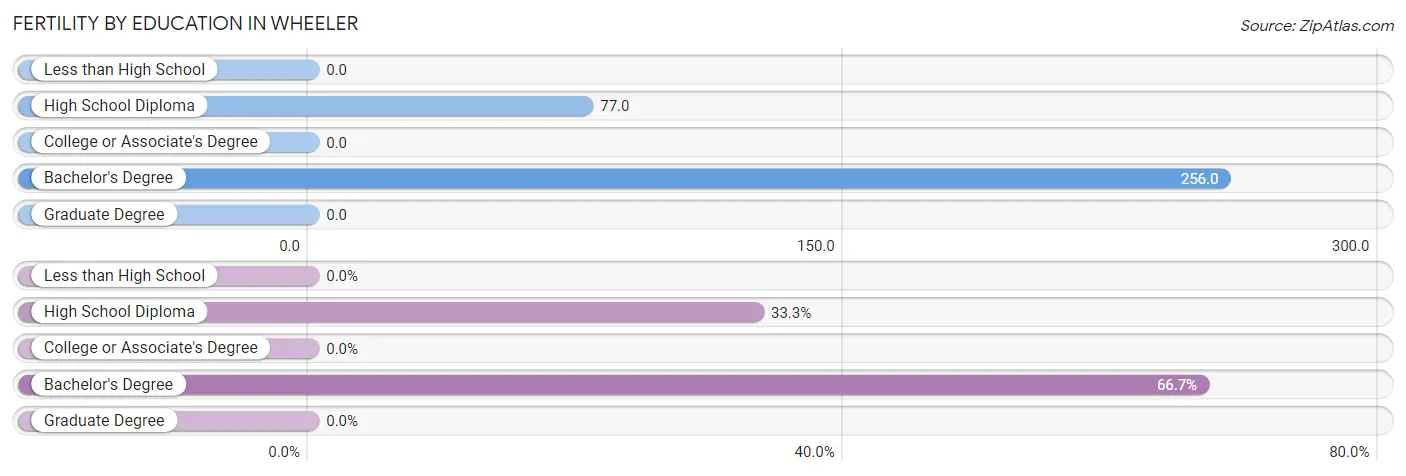
| Educational Attainment | Women with Births | Births / 1,000 Women |
| Less than High School | 0 (0.0%) | 0.0 |
| High School Diploma | 5 (33.3%) | 77.0 |
| College or Associate's Degree | 0 (0.0%) | 0.0 |
| Bachelor's Degree | 10 (66.7%) | 256.0 |
| Graduate Degree | 0 (0.0%) | 0.0 |
| Total | 15 (100.0%) | 40.0 |
Fertility by Education by Marriage Status in Wheeler
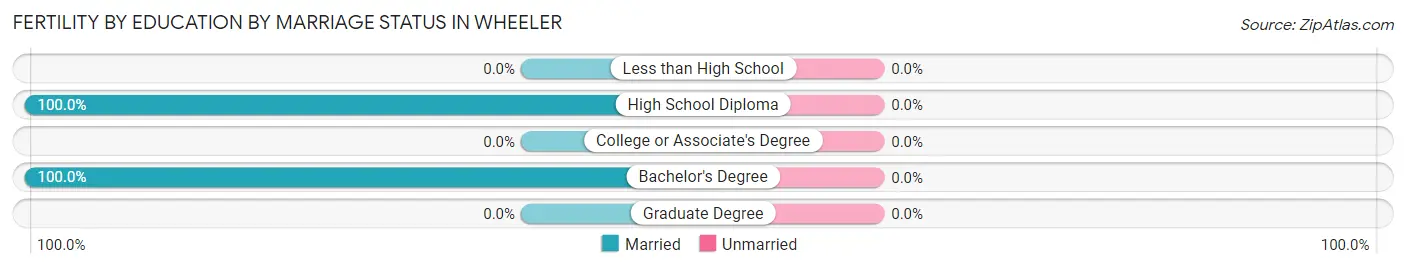
| Educational Attainment | Married | Unmarried |
| Less than High School | 0 (0.0%) | 0 (0.0%) |
| High School Diploma | 5 (100.0%) | 0 (0.0%) |
| College or Associate's Degree | 0 (0.0%) | 0 (0.0%) |
| Bachelor's Degree | 10 (100.0%) | 0 (0.0%) |
| Graduate Degree | 0 (0.0%) | 0 (0.0%) |
| Total | 15 (100.0%) | 0 (0.0%) |
Employment Characteristics in Wheeler
Employment by Class of Employer in Wheeler
Among the 646 employed individuals in Wheeler, private company employees (415 | 64.2%), local government employees (102 | 15.8%), and self-employed (not incorporated) (81 | 12.5%) make up the most common classes of employment.
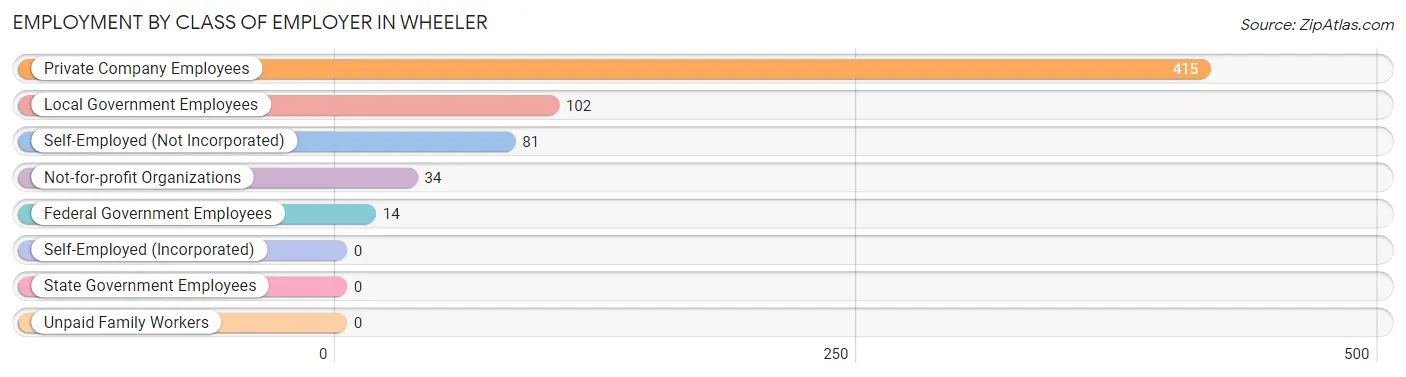
| Employer Class | # Employees | % Employees |
| Private Company Employees | 415 | 64.2% |
| Self-Employed (Incorporated) | 0 | 0.0% |
| Self-Employed (Not Incorporated) | 81 | 12.5% |
| Not-for-profit Organizations | 34 | 5.3% |
| Local Government Employees | 102 | 15.8% |
| State Government Employees | 0 | 0.0% |
| Federal Government Employees | 14 | 2.2% |
| Unpaid Family Workers | 0 | 0.0% |
| Total | 646 | 100.0% |
Employment Status by Age in Wheeler
According to the labor force statistics for Wheeler, out of the total population over 16 years of age (1,094), 62.6% or 685 individuals are in the labor force, with 5.7% or 39 of them unemployed. The age group with the highest labor force participation rate is 25 to 29 years, with 94.3% or 82 individuals in the labor force. Within the labor force, the 16 to 19 years age range has the highest percentage of unemployed individuals, with 11.7% or 9 of them being unemployed.
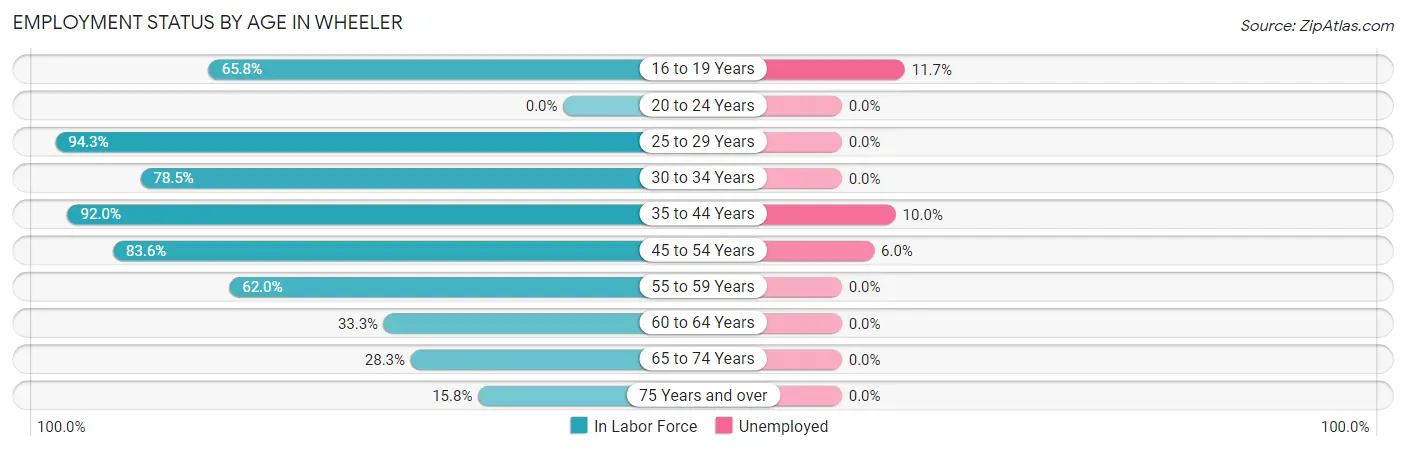
| Age Bracket | In Labor Force | Unemployed |
| 16 to 19 Years | 77 (65.8%) | 9 (11.7%) |
| 20 to 24 Years | 0 (0.0%) | 0 (0.0%) |
| 25 to 29 Years | 82 (94.3%) | 0 (0.0%) |
| 30 to 34 Years | 51 (78.5%) | 0 (0.0%) |
| 35 to 44 Years | 219 (92.0%) | 22 (10.0%) |
| 45 to 54 Years | 133 (83.6%) | 8 (6.0%) |
| 55 to 59 Years | 44 (62.0%) | 0 (0.0%) |
| 60 to 64 Years | 18 (33.3%) | 0 (0.0%) |
| 65 to 74 Years | 30 (28.3%) | 0 (0.0%) |
| 75 Years and over | 31 (15.8%) | 0 (0.0%) |
| Total | 685 (62.6%) | 39 (5.7%) |
Employment Status by Educational Attainment in Wheeler
According to labor force statistics for Wheeler, 81.2% of individuals (547) out of the total population between 25 and 64 years of age (674) are in the labor force, with 5.5% or 30 of them being unemployed. The group with the highest labor force participation rate are those with the educational attainment of less than high school, with 83.6% or 92 individuals in the labor force. Within the labor force, individuals with less than high school education have the highest percentage of unemployment, with 23.9% or 22 of them being unemployed.
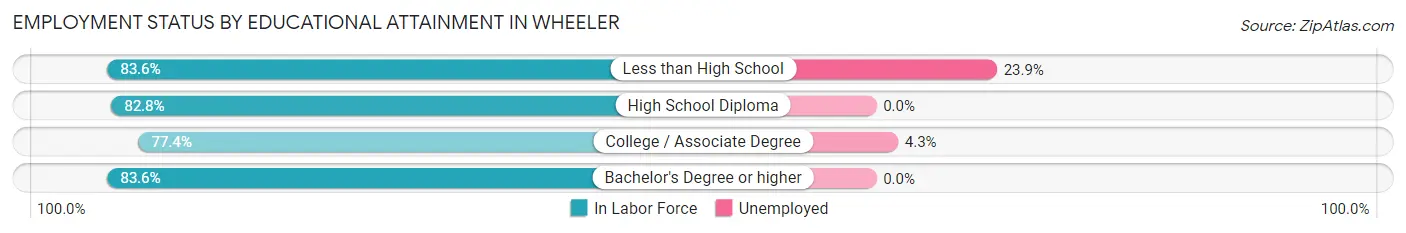
| Educational Attainment | In Labor Force | Unemployed |
| Less than High School | 92 (83.6%) | 26 (23.9%) |
| High School Diploma | 168 (82.8%) | 0 (0.0%) |
| College / Associate Degree | 185 (77.4%) | 10 (4.3%) |
| Bachelor's Degree or higher | 102 (83.6%) | 0 (0.0%) |
| Total | 547 (81.2%) | 37 (5.5%) |
Employment Occupations by Sex in Wheeler
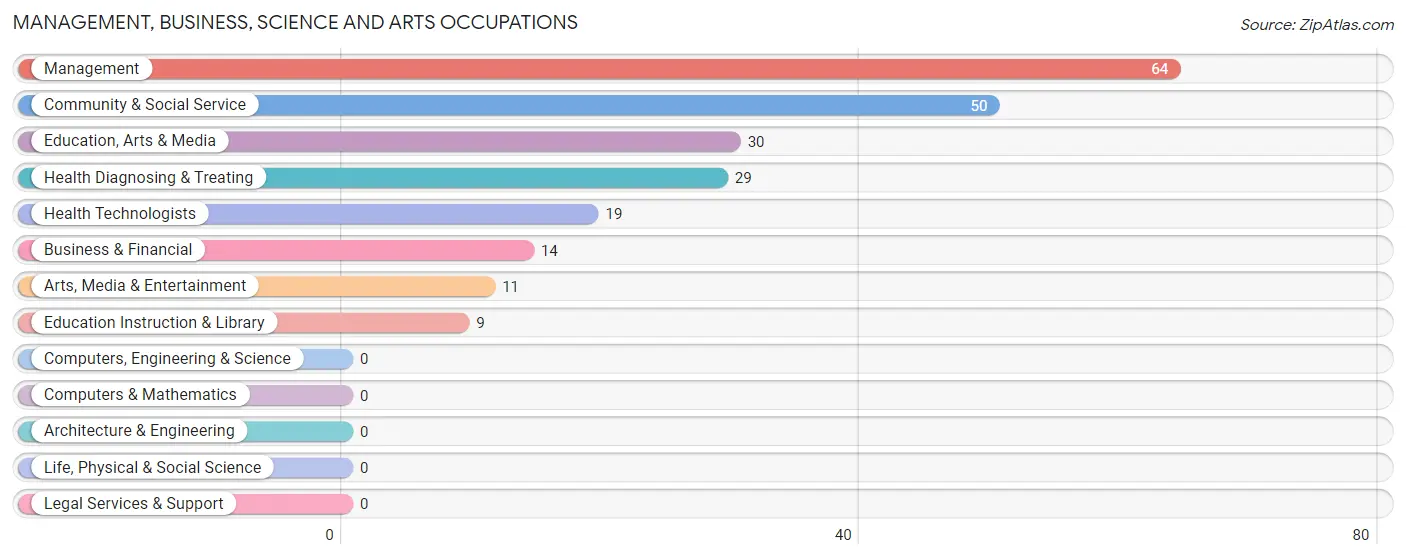
Management, Business, Science and Arts Occupations
The most common Management, Business, Science and Arts occupations in Wheeler are Management (64 | 9.9%), Community & Social Service (50 | 7.7%), Education, Arts & Media (30 | 4.6%), Health Diagnosing & Treating (29 | 4.5%), and Health Technologists (19 | 2.9%).
Management, Business, Science and Arts Occupations by Sex
Within the Management, Business, Science and Arts occupations in Wheeler, the most male-oriented occupations are Education, Arts & Media (100.0%), Management (96.9%), and Community & Social Service (60.0%), while the most female-oriented occupations are Business & Financial (100.0%), Education Instruction & Library (100.0%), and Arts, Media & Entertainment (100.0%).
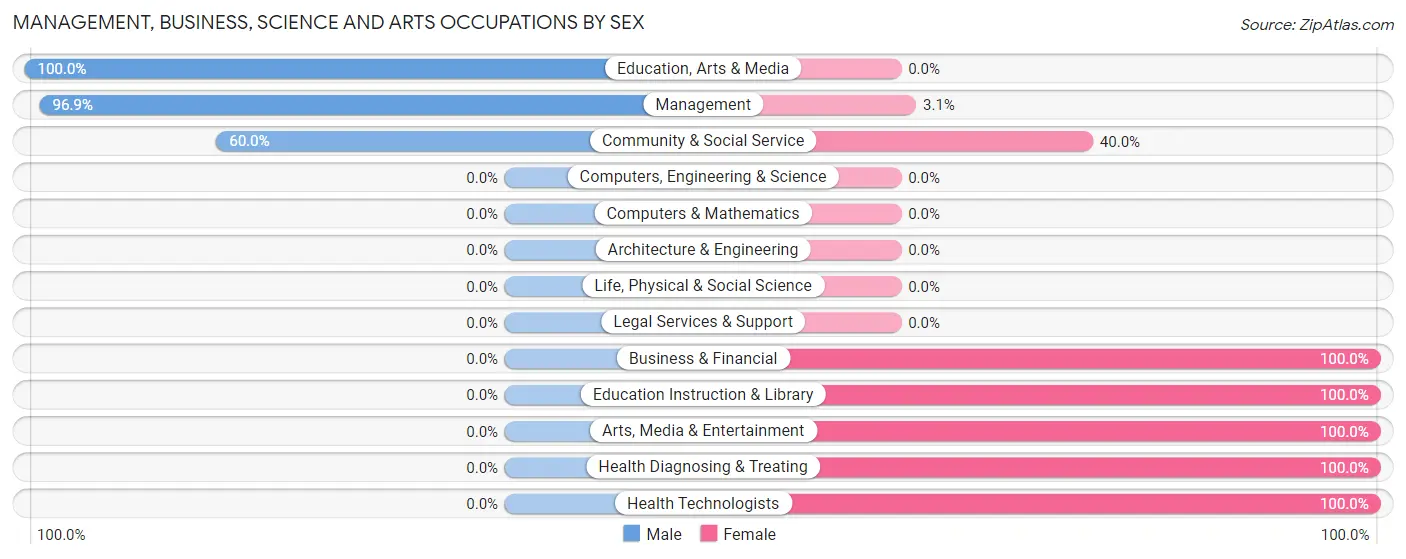
| Occupation | Male | Female |
| Management | 62 (96.9%) | 2 (3.1%) |
| Business & Financial | 0 (0.0%) | 14 (100.0%) |
| Computers, Engineering & Science | 0 (0.0%) | 0 (0.0%) |
| Computers & Mathematics | 0 (0.0%) | 0 (0.0%) |
| Architecture & Engineering | 0 (0.0%) | 0 (0.0%) |
| Life, Physical & Social Science | 0 (0.0%) | 0 (0.0%) |
| Community & Social Service | 30 (60.0%) | 20 (40.0%) |
| Education, Arts & Media | 30 (100.0%) | 0 (0.0%) |
| Legal Services & Support | 0 (0.0%) | 0 (0.0%) |
| Education Instruction & Library | 0 (0.0%) | 9 (100.0%) |
| Arts, Media & Entertainment | 0 (0.0%) | 11 (100.0%) |
| Health Diagnosing & Treating | 0 (0.0%) | 29 (100.0%) |
| Health Technologists | 0 (0.0%) | 19 (100.0%) |
| Total (Category) | 92 (58.6%) | 65 (41.4%) |
| Total (Overall) | 313 (48.4%) | 333 (51.5%) |
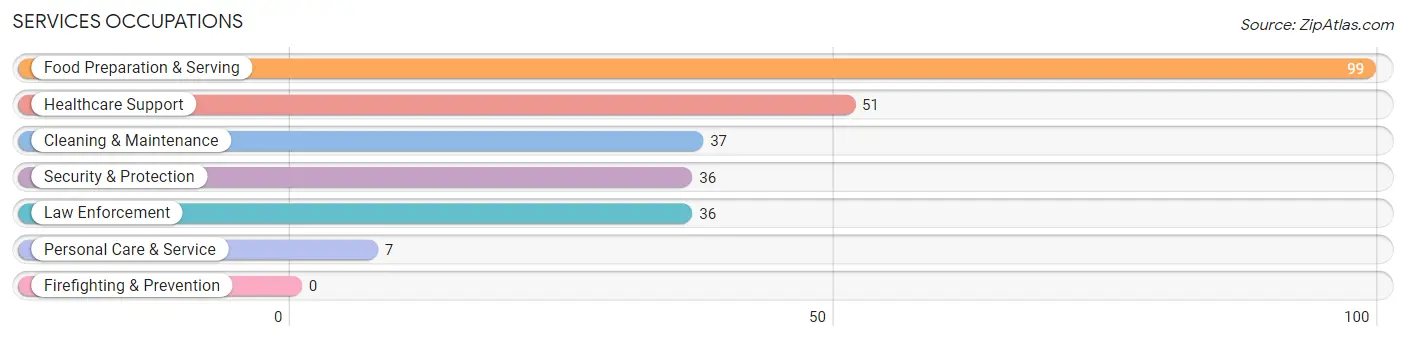
Services Occupations
The most common Services occupations in Wheeler are Food Preparation & Serving (99 | 15.3%), Healthcare Support (51 | 7.9%), Cleaning & Maintenance (37 | 5.7%), Security & Protection (36 | 5.6%), and Law Enforcement (36 | 5.6%).
Services Occupations by Sex
Within the Services occupations in Wheeler, the most male-oriented occupations are Security & Protection (61.1%), Law Enforcement (61.1%), and Cleaning & Maintenance (37.8%), while the most female-oriented occupations are Healthcare Support (100.0%), Food Preparation & Serving (100.0%), and Personal Care & Service (100.0%).
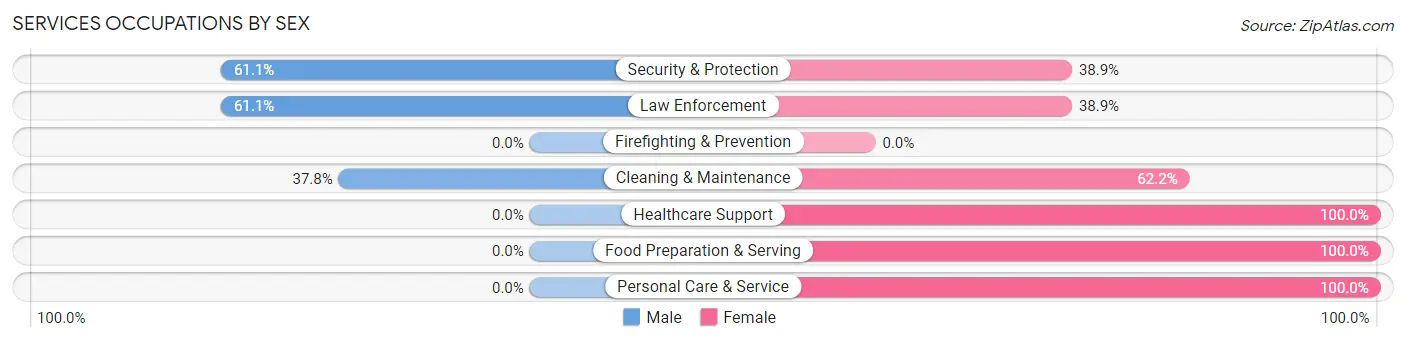
| Occupation | Male | Female |
| Healthcare Support | 0 (0.0%) | 51 (100.0%) |
| Security & Protection | 22 (61.1%) | 14 (38.9%) |
| Firefighting & Prevention | 0 (0.0%) | 0 (0.0%) |
| Law Enforcement | 22 (61.1%) | 14 (38.9%) |
| Food Preparation & Serving | 0 (0.0%) | 99 (100.0%) |
| Cleaning & Maintenance | 14 (37.8%) | 23 (62.2%) |
| Personal Care & Service | 0 (0.0%) | 7 (100.0%) |
| Total (Category) | 36 (15.7%) | 194 (84.4%) |
| Total (Overall) | 313 (48.4%) | 333 (51.5%) |
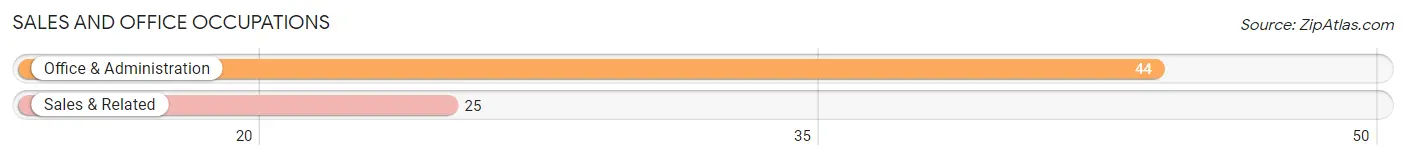
Sales and Office Occupations
The most common Sales and Office occupations in Wheeler are Office & Administration (44 | 6.8%), and Sales & Related (25 | 3.9%).
Sales and Office Occupations by Sex
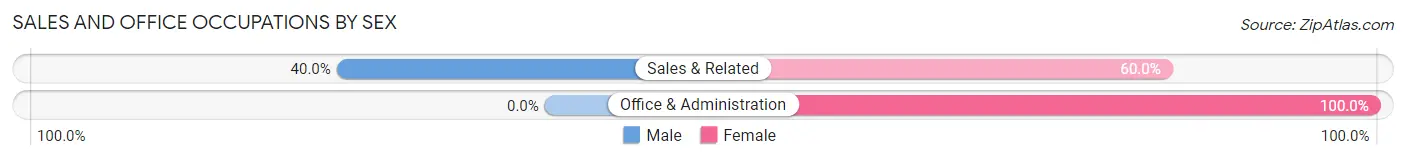
| Occupation | Male | Female |
| Sales & Related | 10 (40.0%) | 15 (60.0%) |
| Office & Administration | 0 (0.0%) | 44 (100.0%) |
| Total (Category) | 10 (14.5%) | 59 (85.5%) |
| Total (Overall) | 313 (48.4%) | 333 (51.5%) |
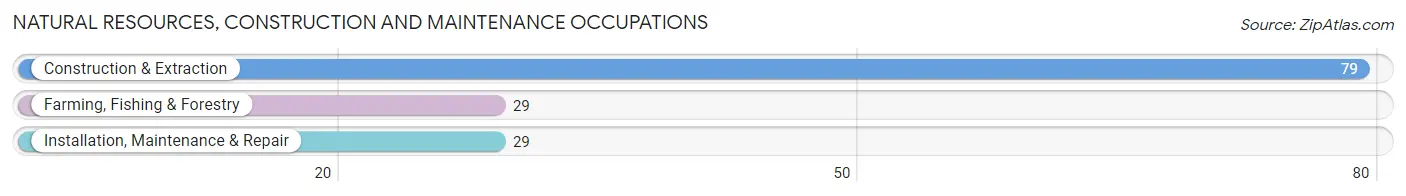
Natural Resources, Construction and Maintenance Occupations
The most common Natural Resources, Construction and Maintenance occupations in Wheeler are Construction & Extraction (79 | 12.2%), Farming, Fishing & Forestry (29 | 4.5%), and Installation, Maintenance & Repair (29 | 4.5%).
Natural Resources, Construction and Maintenance Occupations by Sex
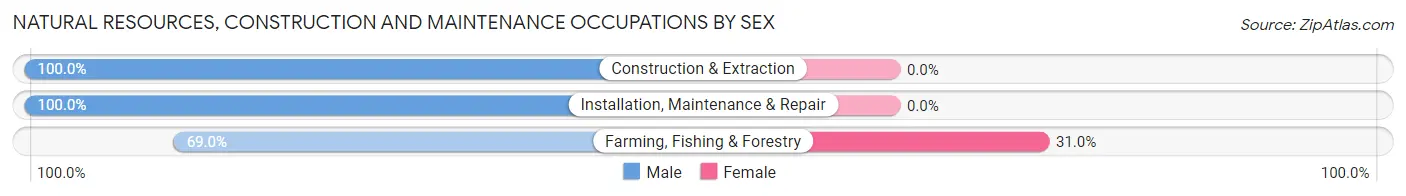
| Occupation | Male | Female |
| Farming, Fishing & Forestry | 20 (69.0%) | 9 (31.0%) |
| Construction & Extraction | 79 (100.0%) | 0 (0.0%) |
| Installation, Maintenance & Repair | 29 (100.0%) | 0 (0.0%) |
| Total (Category) | 128 (93.4%) | 9 (6.6%) |
| Total (Overall) | 313 (48.4%) | 333 (51.5%) |
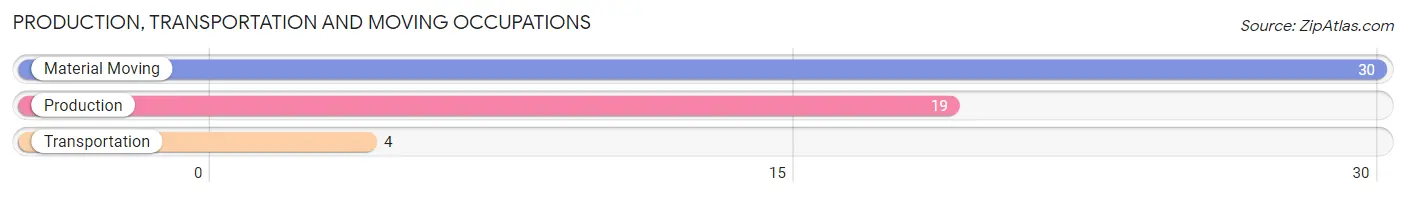
Production, Transportation and Moving Occupations
The most common Production, Transportation and Moving occupations in Wheeler are Material Moving (30 | 4.6%), Production (19 | 2.9%), and Transportation (4 | 0.6%).
Production, Transportation and Moving Occupations by Sex
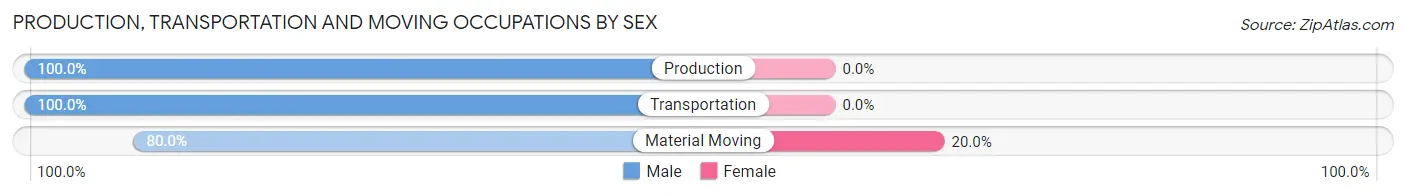
| Occupation | Male | Female |
| Production | 19 (100.0%) | 0 (0.0%) |
| Transportation | 4 (100.0%) | 0 (0.0%) |
| Material Moving | 24 (80.0%) | 6 (20.0%) |
| Total (Category) | 47 (88.7%) | 6 (11.3%) |
| Total (Overall) | 313 (48.4%) | 333 (51.5%) |
Employment Industries by Sex in Wheeler
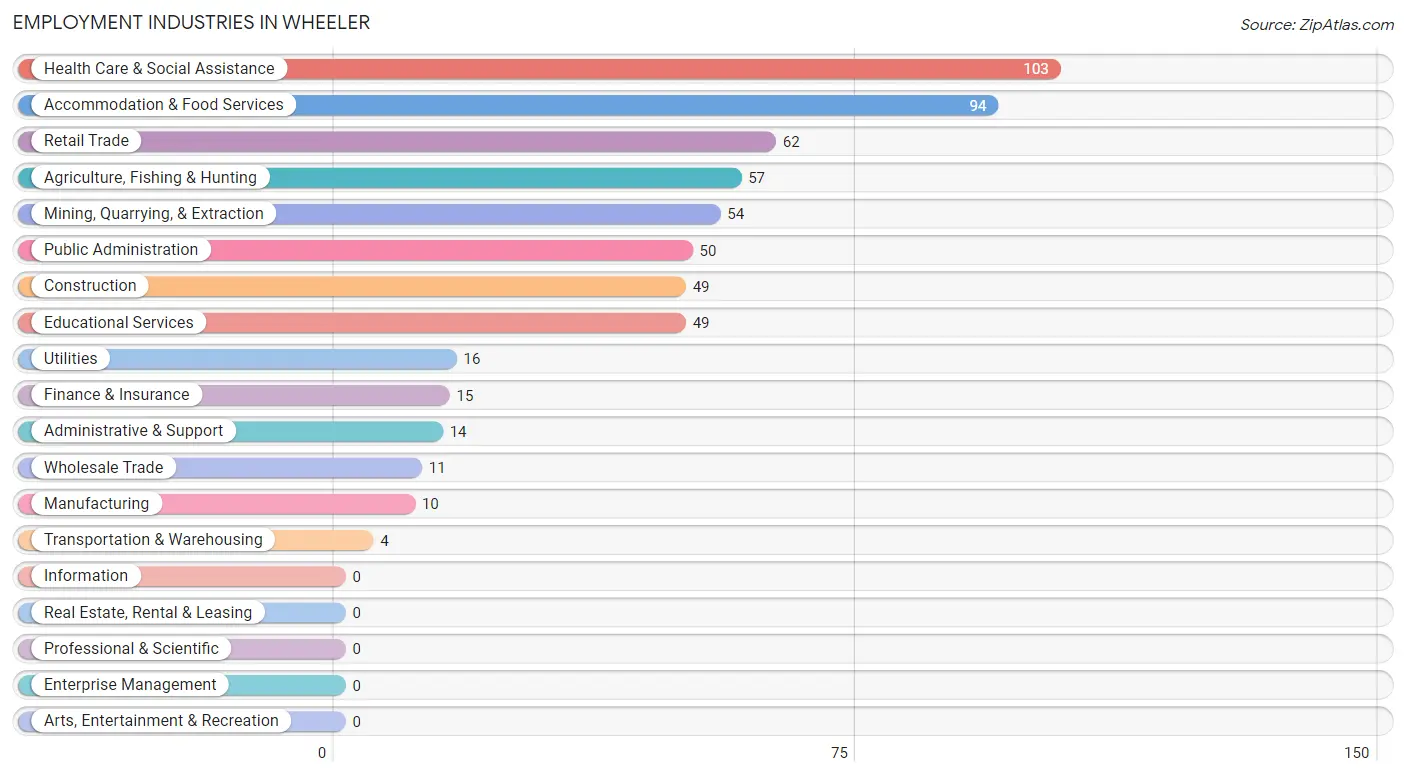
Employment Industries in Wheeler
The major employment industries in Wheeler include Health Care & Social Assistance (103 | 15.9%), Accommodation & Food Services (94 | 14.5%), Retail Trade (62 | 9.6%), Agriculture, Fishing & Hunting (57 | 8.8%), and Mining, Quarrying, & Extraction (54 | 8.4%).
Employment Industries by Sex in Wheeler
The Wheeler industries that see more men than women are Mining, Quarrying, & Extraction (100.0%), Construction (100.0%), and Manufacturing (100.0%), whereas the industries that tend to have a higher number of women are Wholesale Trade (100.0%), Administrative & Support (100.0%), and Accommodation & Food Services (95.7%).
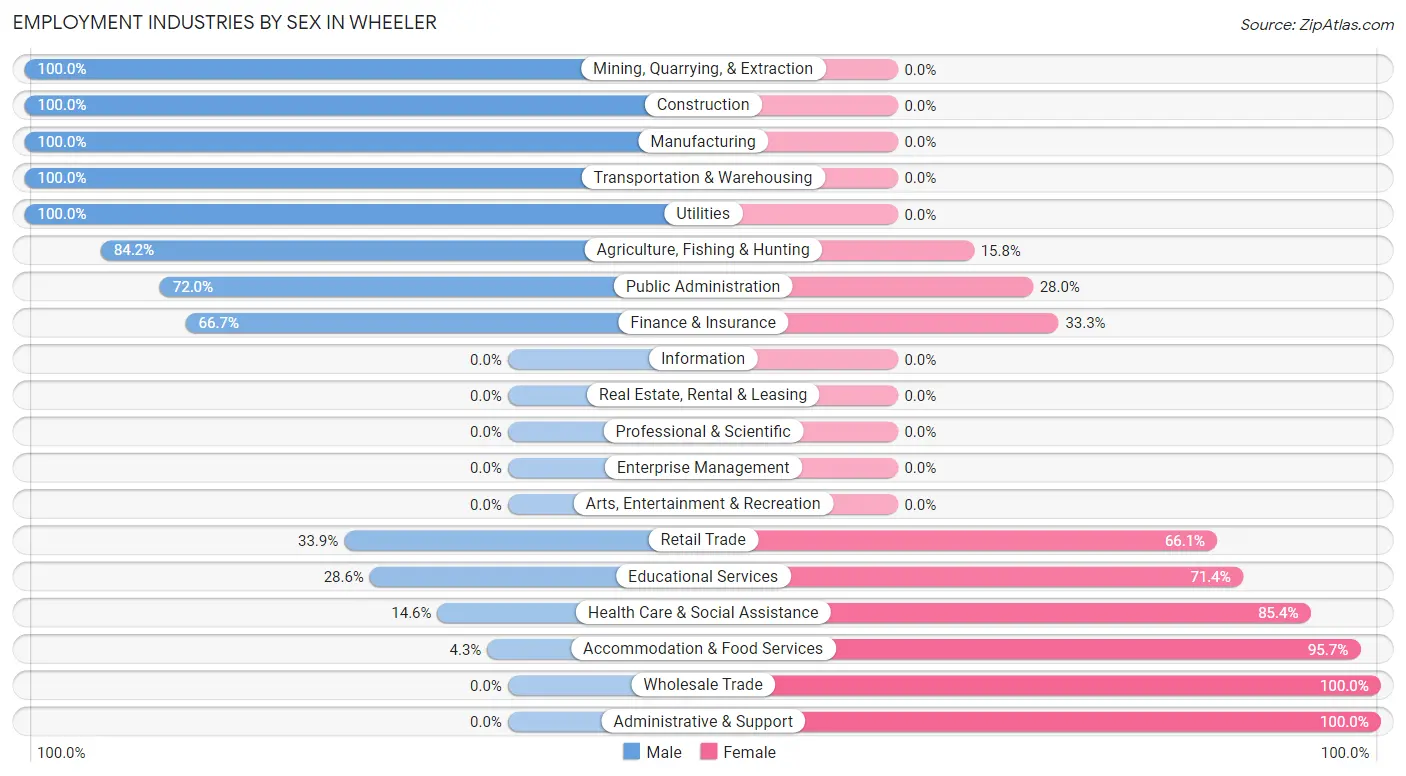
| Industry | Male | Female |
| Agriculture, Fishing & Hunting | 48 (84.2%) | 9 (15.8%) |
| Mining, Quarrying, & Extraction | 54 (100.0%) | 0 (0.0%) |
| Construction | 49 (100.0%) | 0 (0.0%) |
| Manufacturing | 10 (100.0%) | 0 (0.0%) |
| Wholesale Trade | 0 (0.0%) | 11 (100.0%) |
| Retail Trade | 21 (33.9%) | 41 (66.1%) |
| Transportation & Warehousing | 4 (100.0%) | 0 (0.0%) |
| Utilities | 16 (100.0%) | 0 (0.0%) |
| Information | 0 (0.0%) | 0 (0.0%) |
| Finance & Insurance | 10 (66.7%) | 5 (33.3%) |
| Real Estate, Rental & Leasing | 0 (0.0%) | 0 (0.0%) |
| Professional & Scientific | 0 (0.0%) | 0 (0.0%) |
| Enterprise Management | 0 (0.0%) | 0 (0.0%) |
| Administrative & Support | 0 (0.0%) | 14 (100.0%) |
| Educational Services | 14 (28.6%) | 35 (71.4%) |
| Health Care & Social Assistance | 15 (14.6%) | 88 (85.4%) |
| Arts, Entertainment & Recreation | 0 (0.0%) | 0 (0.0%) |
| Accommodation & Food Services | 4 (4.3%) | 90 (95.7%) |
| Public Administration | 36 (72.0%) | 14 (28.0%) |
| Total | 313 (48.4%) | 333 (51.5%) |
Education in Wheeler
School Enrollment in Wheeler
The most common levels of schooling among the 392 students in Wheeler are high school (125 | 31.9%), elementary school (106 | 27.0%), and middle school (79 | 20.2%).
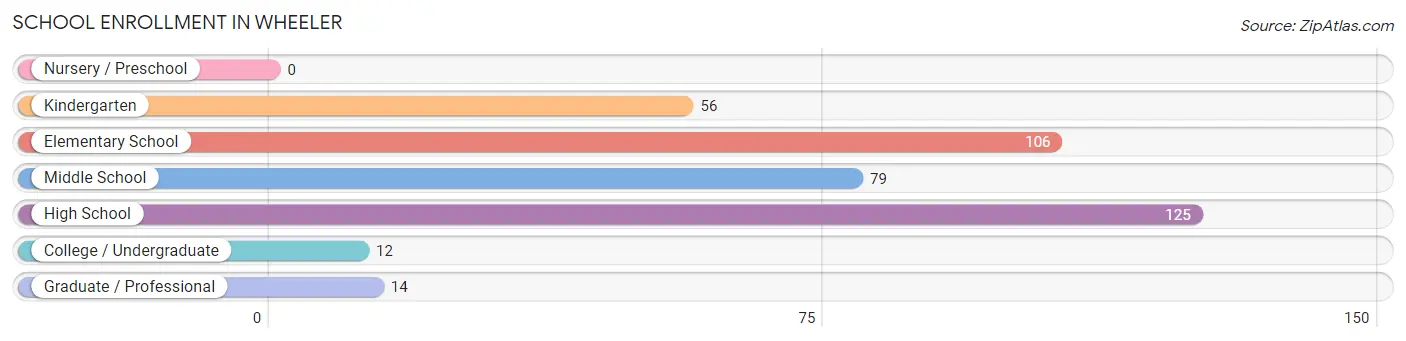
| School Level | # Students | % Students |
| Nursery / Preschool | 0 | 0.0% |
| Kindergarten | 56 | 14.3% |
| Elementary School | 106 | 27.0% |
| Middle School | 79 | 20.2% |
| High School | 125 | 31.9% |
| College / Undergraduate | 12 | 3.1% |
| Graduate / Professional | 14 | 3.6% |
| Total | 392 | 100.0% |
School Enrollment by Age by Funding Source in Wheeler
Out of a total of 392 students who are enrolled in schools in Wheeler, 2 (0.5%) attend a private institution, while the remaining 390 (99.5%) are enrolled in public schools. The age group of 5 to 9 year old has the highest likelihood of being enrolled in private schools, with 2 (1.2% in the age bracket) enrolled. Conversely, the age group of 10 to 14 year olds has the lowest likelihood of being enrolled in a private school, with 79 (100.0% in the age bracket) attending a public institution.
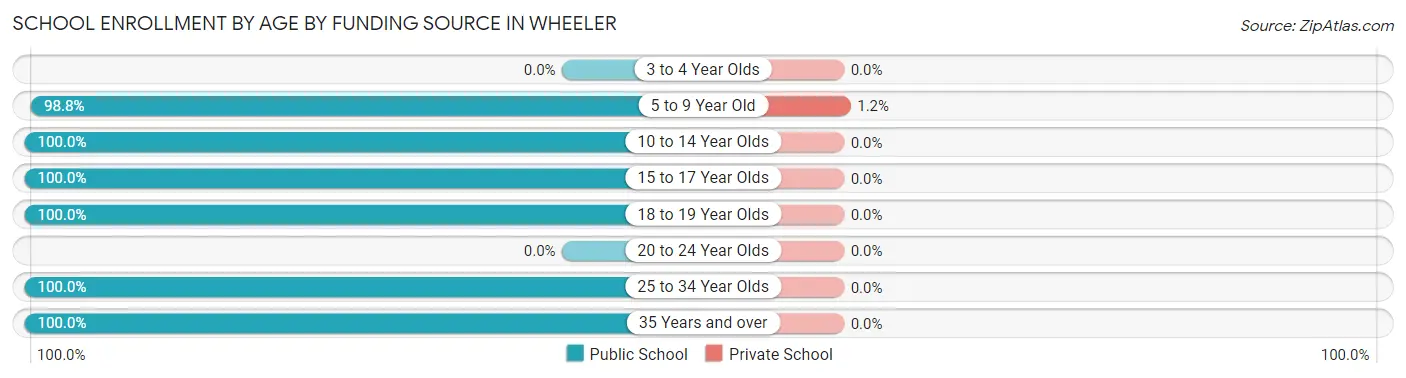
| Age Bracket | Public School | Private School |
| 3 to 4 Year Olds | 0 (0.0%) | 0 (0.0%) |
| 5 to 9 Year Old | 160 (98.8%) | 2 (1.2%) |
| 10 to 14 Year Olds | 79 (100.0%) | 0 (0.0%) |
| 15 to 17 Year Olds | 66 (100.0%) | 0 (0.0%) |
| 18 to 19 Year Olds | 59 (100.0%) | 0 (0.0%) |
| 20 to 24 Year Olds | 0 (0.0%) | 0 (0.0%) |
| 25 to 34 Year Olds | 3 (100.0%) | 0 (0.0%) |
| 35 Years and over | 23 (100.0%) | 0 (0.0%) |
| Total | 390 (99.5%) | 2 (0.5%) |
Educational Attainment by Field of Study in Wheeler
Education (43 | 24.7%), science & technology (25 | 14.4%), liberal arts & history (24 | 13.8%), business (19 | 10.9%), and computers & mathematics (17 | 9.8%) are the most common fields of study among 174 individuals in Wheeler who have obtained a bachelor's degree or higher.
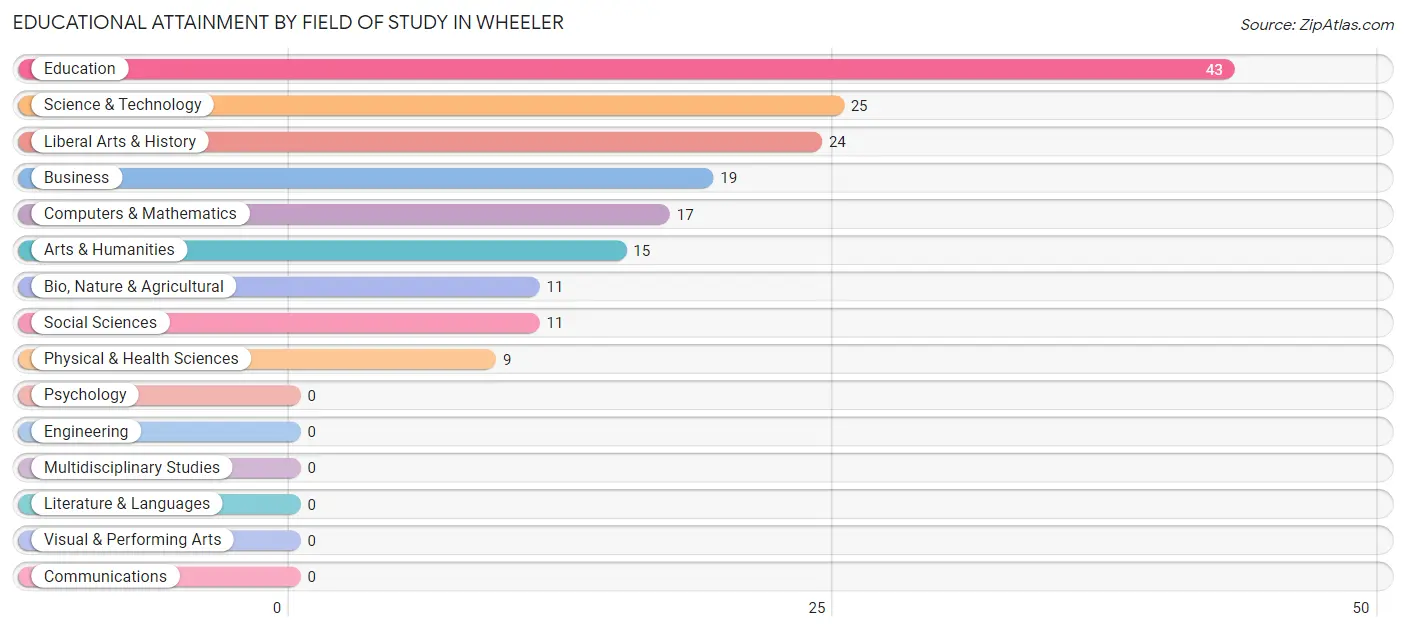
| Field of Study | # Graduates | % Graduates |
| Computers & Mathematics | 17 | 9.8% |
| Bio, Nature & Agricultural | 11 | 6.3% |
| Physical & Health Sciences | 9 | 5.2% |
| Psychology | 0 | 0.0% |
| Social Sciences | 11 | 6.3% |
| Engineering | 0 | 0.0% |
| Multidisciplinary Studies | 0 | 0.0% |
| Science & Technology | 25 | 14.4% |
| Business | 19 | 10.9% |
| Education | 43 | 24.7% |
| Literature & Languages | 0 | 0.0% |
| Liberal Arts & History | 24 | 13.8% |
| Visual & Performing Arts | 0 | 0.0% |
| Communications | 0 | 0.0% |
| Arts & Humanities | 15 | 8.6% |
| Total | 174 | 100.0% |
Transportation & Commute in Wheeler
Vehicle Availability by Sex in Wheeler
The most prevalent vehicle ownership categories in Wheeler are males with 2 vehicles (192, accounting for 61.3%) and females with 2 vehicles (228, making up 57.7%).
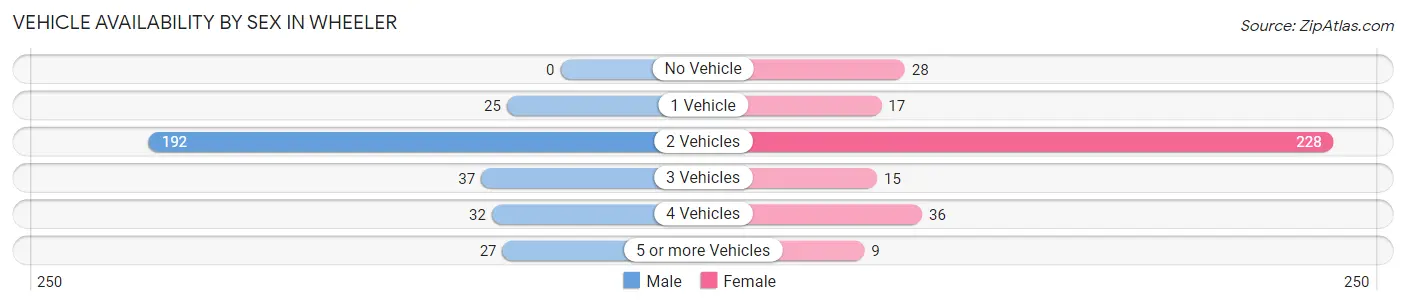
| Vehicles Available | Male | Female |
| No Vehicle | 0 (0.0%) | 28 (8.4%) |
| 1 Vehicle | 25 (8.0%) | 17 (5.1%) |
| 2 Vehicles | 192 (61.3%) | 228 (68.5%) |
| 3 Vehicles | 37 (11.8%) | 15 (4.5%) |
| 4 Vehicles | 32 (10.2%) | 36 (10.8%) |
| 5 or more Vehicles | 27 (8.6%) | 9 (2.7%) |
| Total | 313 (100.0%) | 333 (100.0%) |
Commute Time in Wheeler
The most frequently occuring commute durations in Wheeler are less than 5 minutes (211 commuters, 33.1%), 30 to 34 minutes (136 commuters, 21.3%), and 5 to 9 minutes (85 commuters, 13.3%).
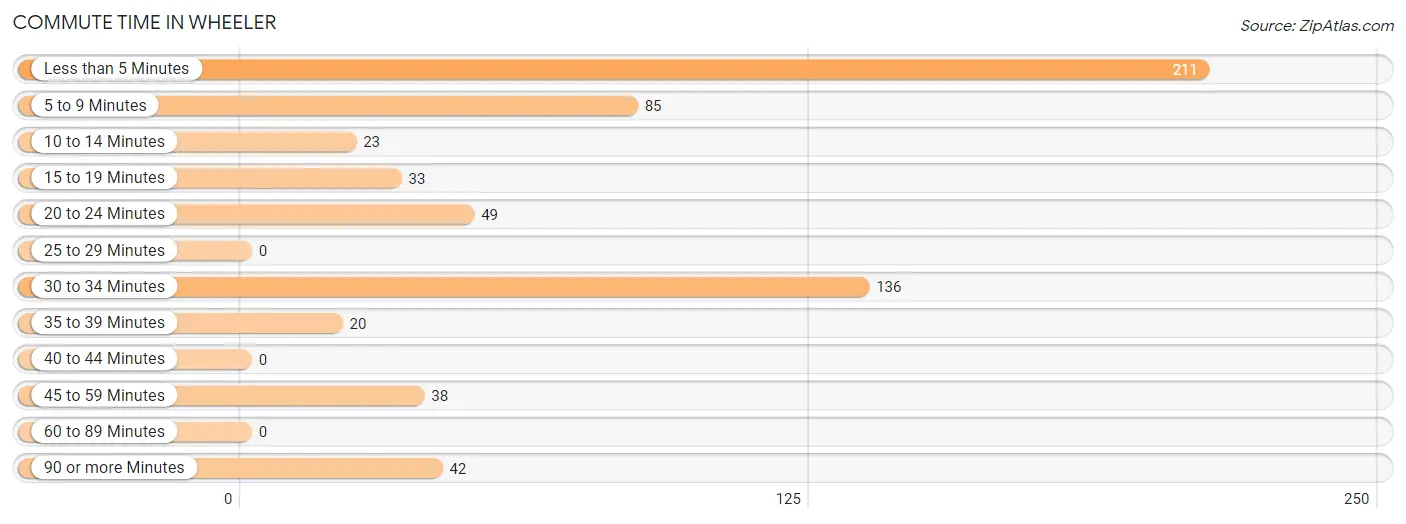
| Commute Time | # Commuters | % Commuters |
| Less than 5 Minutes | 211 | 33.1% |
| 5 to 9 Minutes | 85 | 13.3% |
| 10 to 14 Minutes | 23 | 3.6% |
| 15 to 19 Minutes | 33 | 5.2% |
| 20 to 24 Minutes | 49 | 7.7% |
| 25 to 29 Minutes | 0 | 0.0% |
| 30 to 34 Minutes | 136 | 21.3% |
| 35 to 39 Minutes | 20 | 3.1% |
| 40 to 44 Minutes | 0 | 0.0% |
| 45 to 59 Minutes | 38 | 6.0% |
| 60 to 89 Minutes | 0 | 0.0% |
| 90 or more Minutes | 42 | 6.6% |
Commute Time by Sex in Wheeler
The most common commute times in Wheeler are 30 to 34 minutes (89 commuters, 28.4%) for males and less than 5 minutes (157 commuters, 48.5%) for females.
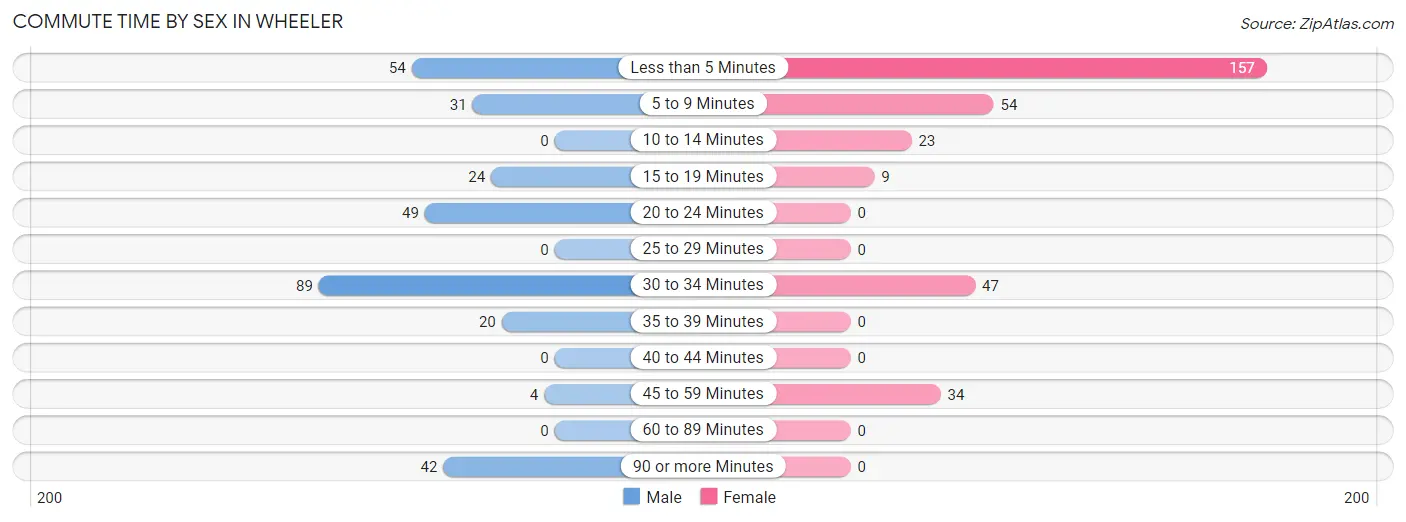
| Commute Time | Male | Female |
| Less than 5 Minutes | 54 (17.2%) | 157 (48.5%) |
| 5 to 9 Minutes | 31 (9.9%) | 54 (16.7%) |
| 10 to 14 Minutes | 0 (0.0%) | 23 (7.1%) |
| 15 to 19 Minutes | 24 (7.7%) | 9 (2.8%) |
| 20 to 24 Minutes | 49 (15.7%) | 0 (0.0%) |
| 25 to 29 Minutes | 0 (0.0%) | 0 (0.0%) |
| 30 to 34 Minutes | 89 (28.4%) | 47 (14.5%) |
| 35 to 39 Minutes | 20 (6.4%) | 0 (0.0%) |
| 40 to 44 Minutes | 0 (0.0%) | 0 (0.0%) |
| 45 to 59 Minutes | 4 (1.3%) | 34 (10.5%) |
| 60 to 89 Minutes | 0 (0.0%) | 0 (0.0%) |
| 90 or more Minutes | 42 (13.4%) | 0 (0.0%) |
Time of Departure to Work by Sex in Wheeler
The most frequent times of departure to work in Wheeler are 7:00 AM to 7:29 AM (114, 36.4%) for males and 4:00 PM to 11:59 PM (65, 20.1%) for females.
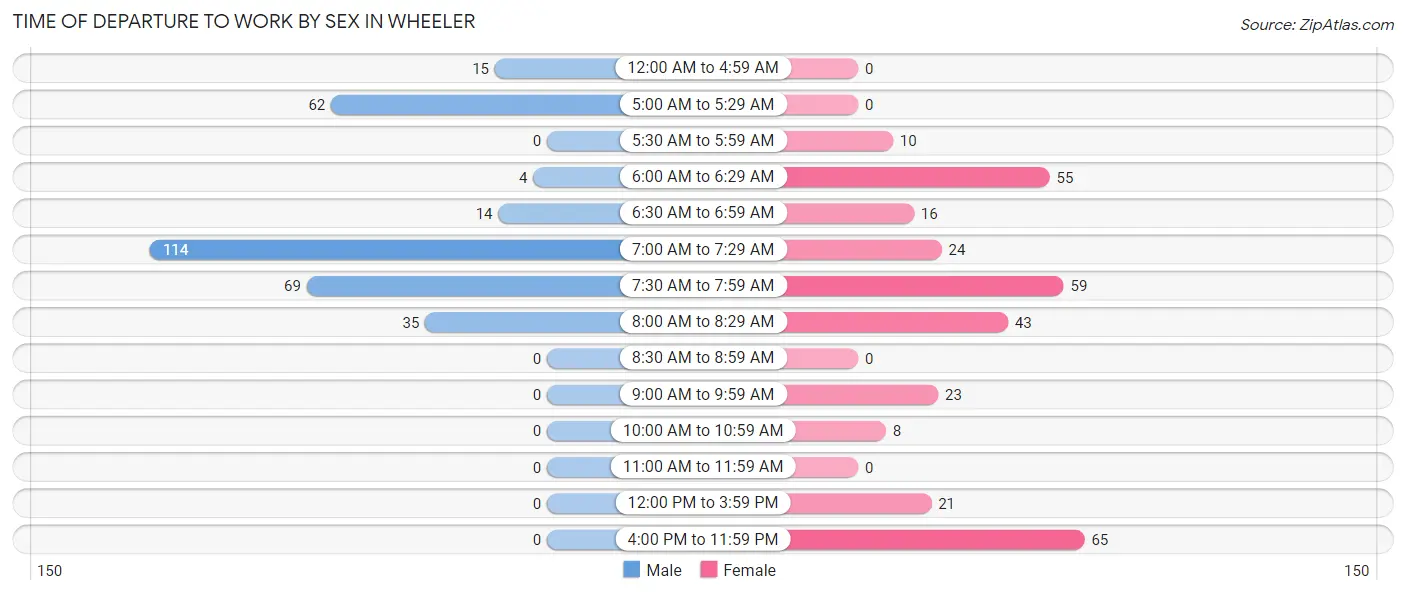
| Time of Departure | Male | Female |
| 12:00 AM to 4:59 AM | 15 (4.8%) | 0 (0.0%) |
| 5:00 AM to 5:29 AM | 62 (19.8%) | 0 (0.0%) |
| 5:30 AM to 5:59 AM | 0 (0.0%) | 10 (3.1%) |
| 6:00 AM to 6:29 AM | 4 (1.3%) | 55 (17.0%) |
| 6:30 AM to 6:59 AM | 14 (4.5%) | 16 (4.9%) |
| 7:00 AM to 7:29 AM | 114 (36.4%) | 24 (7.4%) |
| 7:30 AM to 7:59 AM | 69 (22.0%) | 59 (18.2%) |
| 8:00 AM to 8:29 AM | 35 (11.2%) | 43 (13.3%) |
| 8:30 AM to 8:59 AM | 0 (0.0%) | 0 (0.0%) |
| 9:00 AM to 9:59 AM | 0 (0.0%) | 23 (7.1%) |
| 10:00 AM to 10:59 AM | 0 (0.0%) | 8 (2.5%) |
| 11:00 AM to 11:59 AM | 0 (0.0%) | 0 (0.0%) |
| 12:00 PM to 3:59 PM | 0 (0.0%) | 21 (6.5%) |
| 4:00 PM to 11:59 PM | 0 (0.0%) | 65 (20.1%) |
| Total | 313 (100.0%) | 324 (100.0%) |
Housing Occupancy in Wheeler
Occupancy by Ownership in Wheeler
Of the total 481 dwellings in Wheeler, owner-occupied units account for 337 (70.1%), while renter-occupied units make up 144 (29.9%).
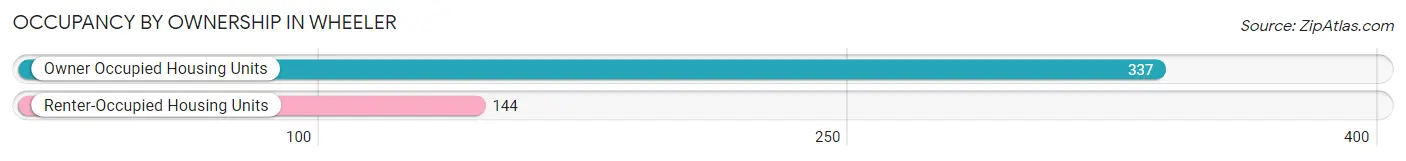
| Occupancy | # Housing Units | % Housing Units |
| Owner Occupied Housing Units | 337 | 70.1% |
| Renter-Occupied Housing Units | 144 | 29.9% |
| Total Occupied Housing Units | 481 | 100.0% |
Occupancy by Household Size in Wheeler
| Household Size | # Housing Units | % Housing Units |
| 1-Person Household | 68 | 14.1% |
| 2-Person Household | 203 | 42.2% |
| 3-Person Household | 56 | 11.6% |
| 4+ Person Household | 154 | 32.0% |
| Total Housing Units | 481 | 100.0% |
Occupancy by Ownership by Household Size in Wheeler
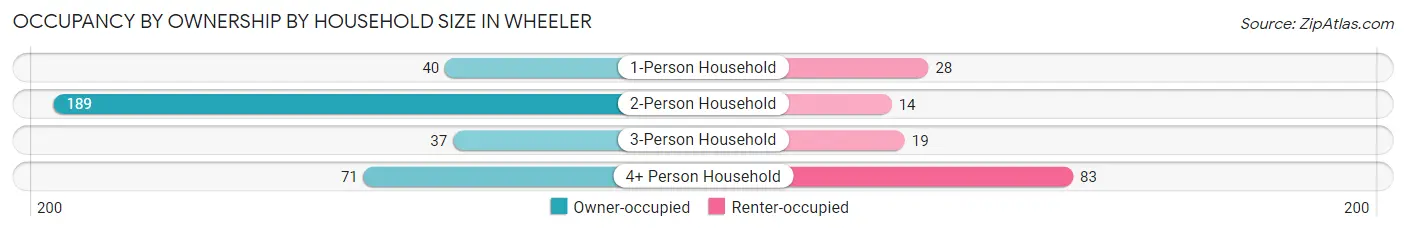
| Household Size | Owner-occupied | Renter-occupied |
| 1-Person Household | 40 (58.8%) | 28 (41.2%) |
| 2-Person Household | 189 (93.1%) | 14 (6.9%) |
| 3-Person Household | 37 (66.1%) | 19 (33.9%) |
| 4+ Person Household | 71 (46.1%) | 83 (53.9%) |
| Total Housing Units | 337 (70.1%) | 144 (29.9%) |
Occupancy by Educational Attainment in Wheeler
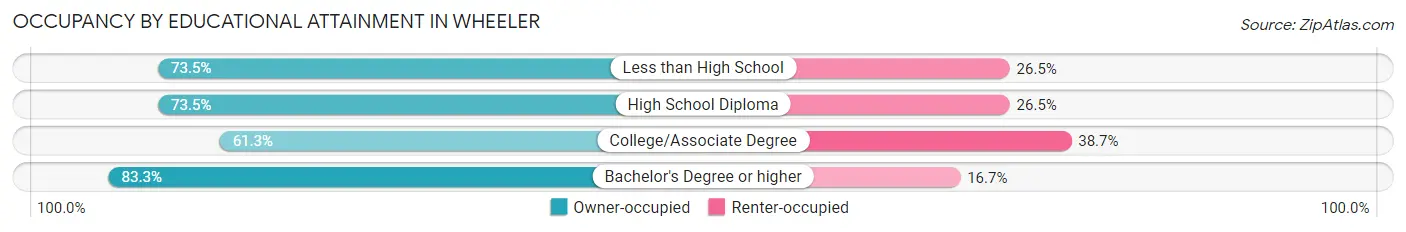
| Household Size | Owner-occupied | Renter-occupied |
| Less than High School | 50 (73.5%) | 18 (26.5%) |
| High School Diploma | 100 (73.5%) | 36 (26.5%) |
| College/Associate Degree | 122 (61.3%) | 77 (38.7%) |
| Bachelor's Degree or higher | 65 (83.3%) | 13 (16.7%) |
Occupancy by Age of Householder in Wheeler
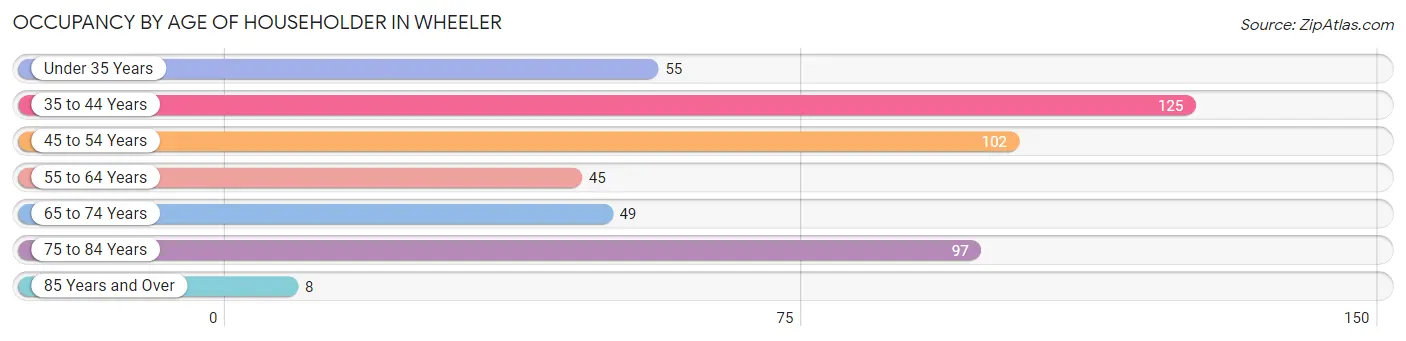
| Age Bracket | # Households | % Households |
| Under 35 Years | 55 | 11.4% |
| 35 to 44 Years | 125 | 26.0% |
| 45 to 54 Years | 102 | 21.2% |
| 55 to 64 Years | 45 | 9.4% |
| 65 to 74 Years | 49 | 10.2% |
| 75 to 84 Years | 97 | 20.2% |
| 85 Years and Over | 8 | 1.7% |
| Total | 481 | 100.0% |
Housing Finances in Wheeler
Median Income by Occupancy in Wheeler
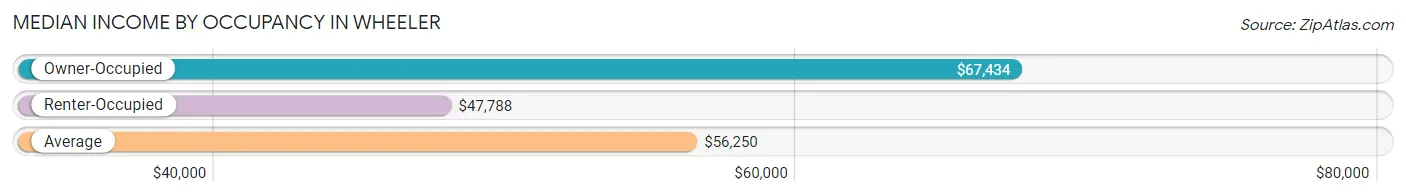
| Occupancy Type | # Households | Median Income |
| Owner-Occupied | 337 (70.1%) | $67,434 |
| Renter-Occupied | 144 (29.9%) | $47,788 |
| Average | 481 (100.0%) | $56,250 |
Occupancy by Householder Income Bracket in Wheeler
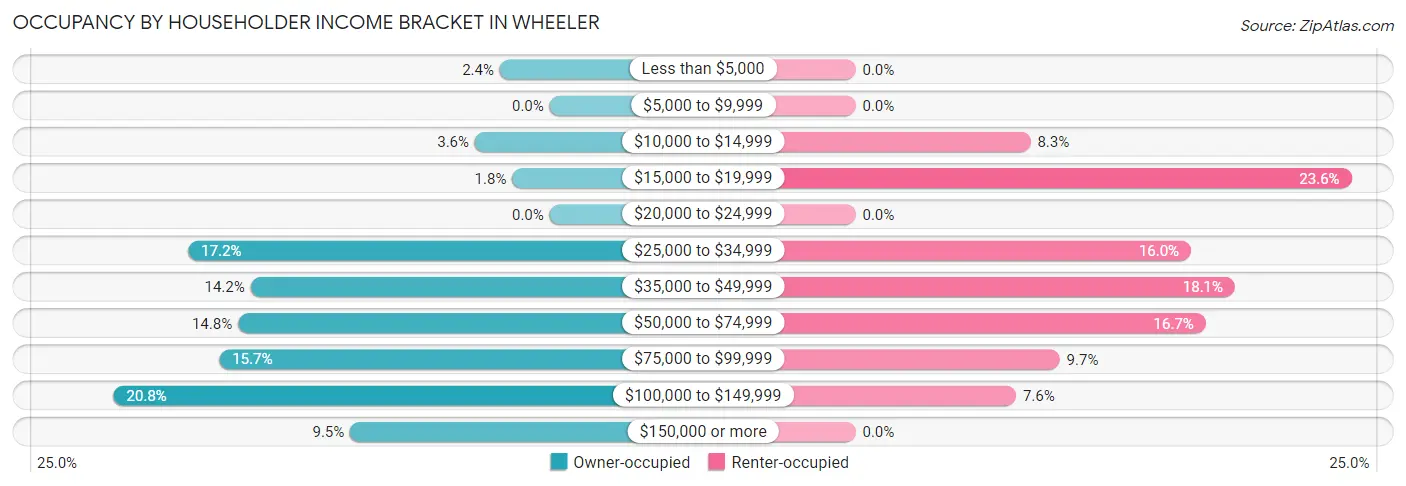
| Income Bracket | Owner-occupied | Renter-occupied |
| Less than $5,000 | 8 (2.4%) | 0 (0.0%) |
| $5,000 to $9,999 | 0 (0.0%) | 0 (0.0%) |
| $10,000 to $14,999 | 12 (3.6%) | 12 (8.3%) |
| $15,000 to $19,999 | 6 (1.8%) | 34 (23.6%) |
| $20,000 to $24,999 | 0 (0.0%) | 0 (0.0%) |
| $25,000 to $34,999 | 58 (17.2%) | 23 (16.0%) |
| $35,000 to $49,999 | 48 (14.2%) | 26 (18.1%) |
| $50,000 to $74,999 | 50 (14.8%) | 24 (16.7%) |
| $75,000 to $99,999 | 53 (15.7%) | 14 (9.7%) |
| $100,000 to $149,999 | 70 (20.8%) | 11 (7.6%) |
| $150,000 or more | 32 (9.5%) | 0 (0.0%) |
| Total | 337 (100.0%) | 144 (100.0%) |
Monthly Housing Cost Tiers in Wheeler
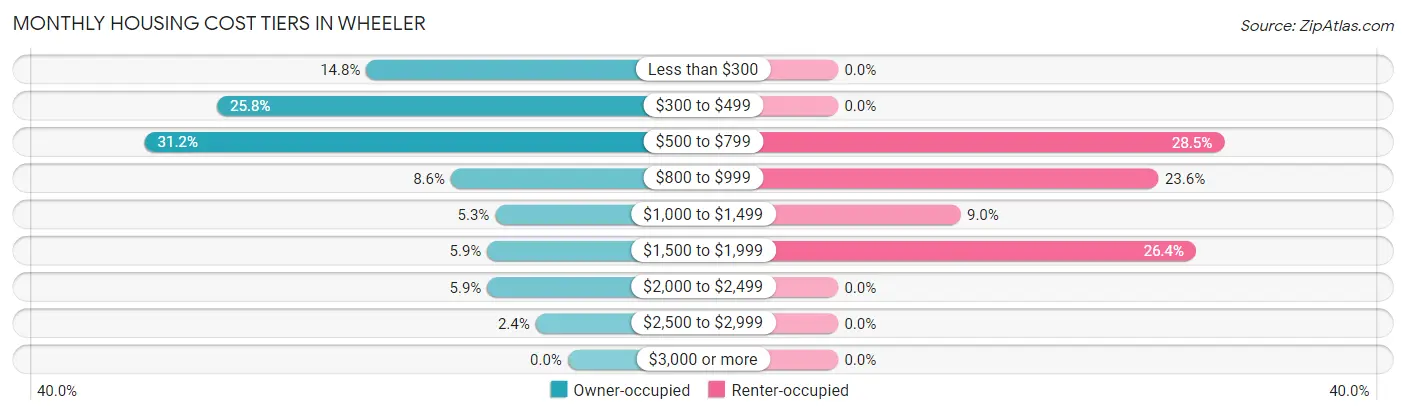
| Monthly Cost | Owner-occupied | Renter-occupied |
| Less than $300 | 50 (14.8%) | 0 (0.0%) |
| $300 to $499 | 87 (25.8%) | 0 (0.0%) |
| $500 to $799 | 105 (31.2%) | 41 (28.5%) |
| $800 to $999 | 29 (8.6%) | 34 (23.6%) |
| $1,000 to $1,499 | 18 (5.3%) | 13 (9.0%) |
| $1,500 to $1,999 | 20 (5.9%) | 38 (26.4%) |
| $2,000 to $2,499 | 20 (5.9%) | 0 (0.0%) |
| $2,500 to $2,999 | 8 (2.4%) | 0 (0.0%) |
| $3,000 or more | 0 (0.0%) | 0 (0.0%) |
| Total | 337 (100.0%) | 144 (100.0%) |
Physical Housing Characteristics in Wheeler
Housing Structures in Wheeler
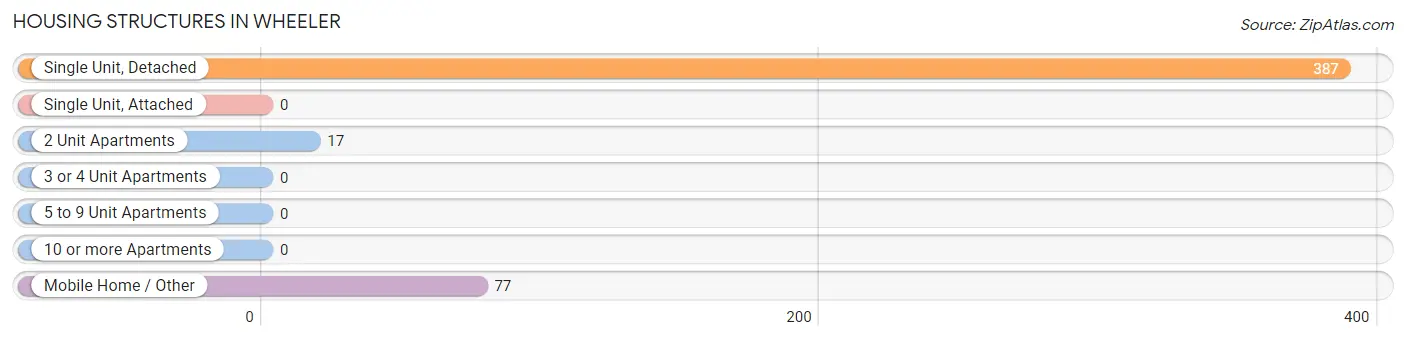
| Structure Type | # Housing Units | % Housing Units |
| Single Unit, Detached | 387 | 80.5% |
| Single Unit, Attached | 0 | 0.0% |
| 2 Unit Apartments | 17 | 3.5% |
| 3 or 4 Unit Apartments | 0 | 0.0% |
| 5 to 9 Unit Apartments | 0 | 0.0% |
| 10 or more Apartments | 0 | 0.0% |
| Mobile Home / Other | 77 | 16.0% |
| Total | 481 | 100.0% |
Housing Structures by Occupancy in Wheeler
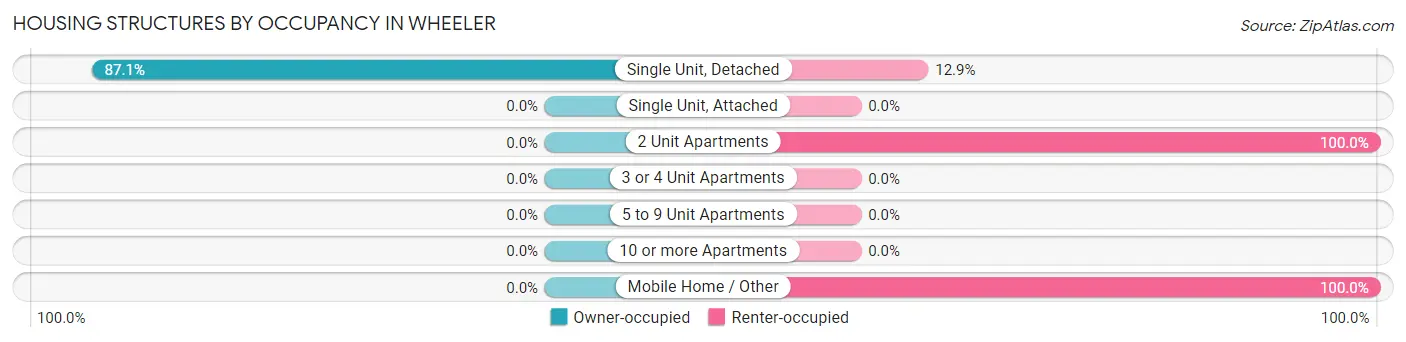
| Structure Type | Owner-occupied | Renter-occupied |
| Single Unit, Detached | 337 (87.1%) | 50 (12.9%) |
| Single Unit, Attached | 0 (0.0%) | 0 (0.0%) |
| 2 Unit Apartments | 0 (0.0%) | 17 (100.0%) |
| 3 or 4 Unit Apartments | 0 (0.0%) | 0 (0.0%) |
| 5 to 9 Unit Apartments | 0 (0.0%) | 0 (0.0%) |
| 10 or more Apartments | 0 (0.0%) | 0 (0.0%) |
| Mobile Home / Other | 0 (0.0%) | 77 (100.0%) |
| Total | 337 (70.1%) | 144 (29.9%) |
Housing Structures by Number of Rooms in Wheeler
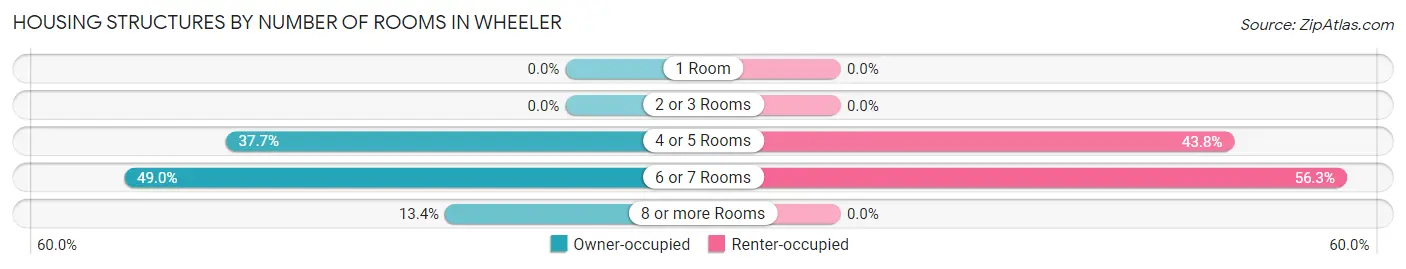
| Number of Rooms | Owner-occupied | Renter-occupied |
| 1 Room | 0 (0.0%) | 0 (0.0%) |
| 2 or 3 Rooms | 0 (0.0%) | 0 (0.0%) |
| 4 or 5 Rooms | 127 (37.7%) | 63 (43.8%) |
| 6 or 7 Rooms | 165 (49.0%) | 81 (56.2%) |
| 8 or more Rooms | 45 (13.4%) | 0 (0.0%) |
| Total | 337 (100.0%) | 144 (100.0%) |
Housing Structure by Heating Type in Wheeler
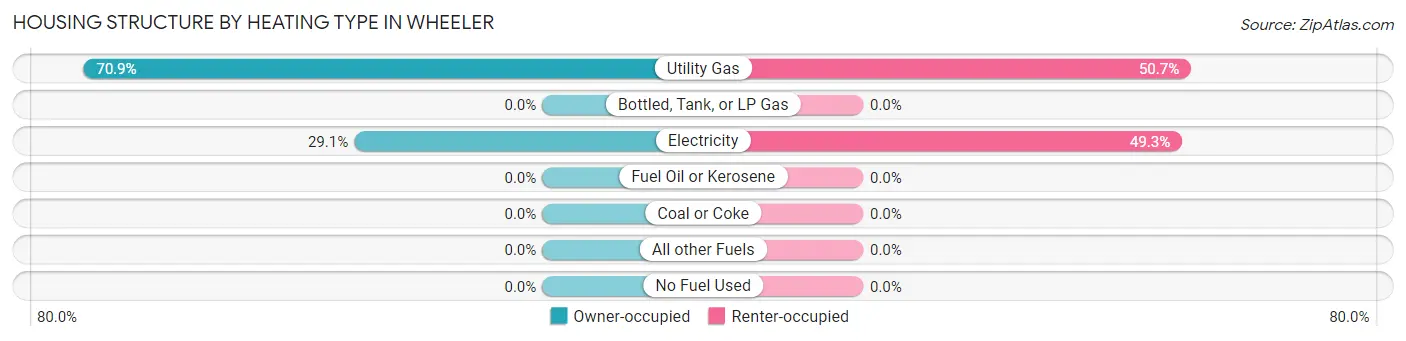
| Heating Type | Owner-occupied | Renter-occupied |
| Utility Gas | 239 (70.9%) | 73 (50.7%) |
| Bottled, Tank, or LP Gas | 0 (0.0%) | 0 (0.0%) |
| Electricity | 98 (29.1%) | 71 (49.3%) |
| Fuel Oil or Kerosene | 0 (0.0%) | 0 (0.0%) |
| Coal or Coke | 0 (0.0%) | 0 (0.0%) |
| All other Fuels | 0 (0.0%) | 0 (0.0%) |
| No Fuel Used | 0 (0.0%) | 0 (0.0%) |
| Total | 337 (100.0%) | 144 (100.0%) |
Household Vehicle Usage in Wheeler
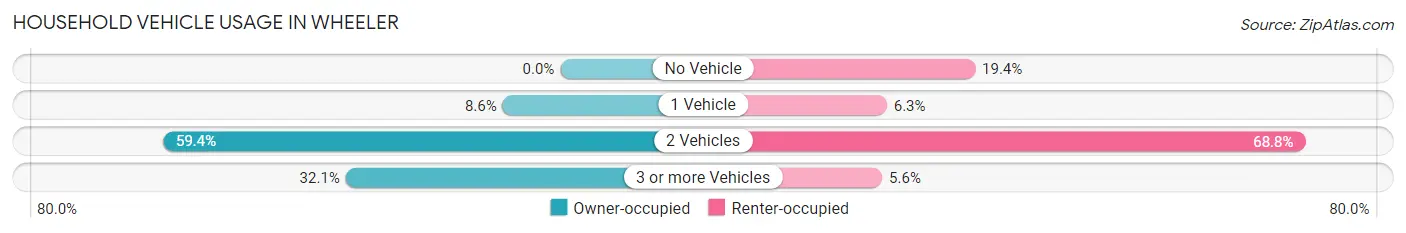
| Vehicles per Household | Owner-occupied | Renter-occupied |
| No Vehicle | 0 (0.0%) | 28 (19.4%) |
| 1 Vehicle | 29 (8.6%) | 9 (6.2%) |
| 2 Vehicles | 200 (59.4%) | 99 (68.8%) |
| 3 or more Vehicles | 108 (32.1%) | 8 (5.6%) |
| Total | 337 (100.0%) | 144 (100.0%) |
Real Estate & Mortgages in Wheeler
Real Estate and Mortgage Overview in Wheeler
| Characteristic | Without Mortgage | With Mortgage |
| Housing Units | 270 | 67 |
| Median Property Value | $131,500 | $201,100 |
| Median Household Income | $61,250 | $14 |
| Monthly Housing Costs | $494 | $0 |
| Real Estate Taxes | $1,833 | $0 |
Property Value by Mortgage Status in Wheeler
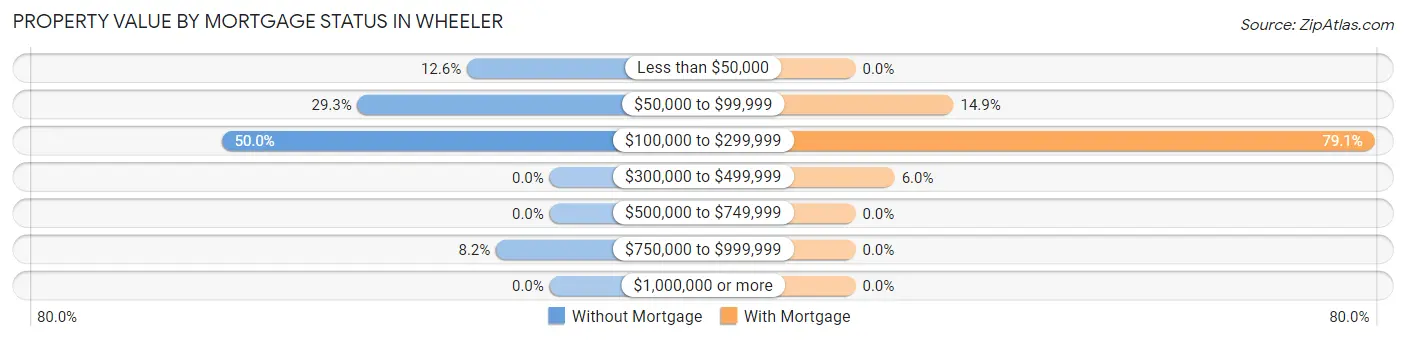
| Property Value | Without Mortgage | With Mortgage |
| Less than $50,000 | 34 (12.6%) | 0 (0.0%) |
| $50,000 to $99,999 | 79 (29.3%) | 10 (14.9%) |
| $100,000 to $299,999 | 135 (50.0%) | 53 (79.1%) |
| $300,000 to $499,999 | 0 (0.0%) | 4 (6.0%) |
| $500,000 to $749,999 | 0 (0.0%) | 0 (0.0%) |
| $750,000 to $999,999 | 22 (8.2%) | 0 (0.0%) |
| $1,000,000 or more | 0 (0.0%) | 0 (0.0%) |
| Total | 270 (100.0%) | 67 (100.0%) |
Household Income by Mortgage Status in Wheeler
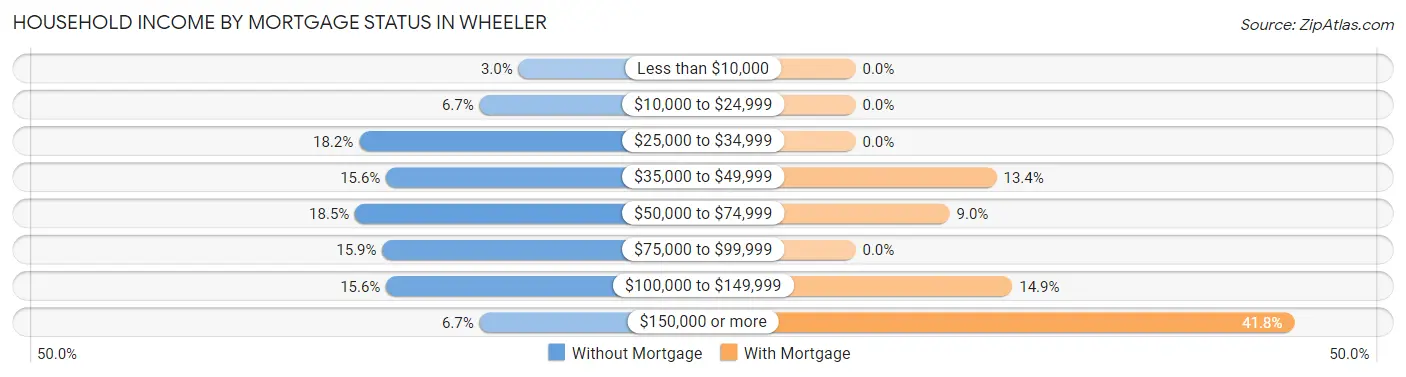
| Household Income | Without Mortgage | With Mortgage |
| Less than $10,000 | 8 (3.0%) | 0 (0.0%) |
| $10,000 to $24,999 | 18 (6.7%) | 0 (0.0%) |
| $25,000 to $34,999 | 49 (18.1%) | 0 (0.0%) |
| $35,000 to $49,999 | 42 (15.6%) | 9 (13.4%) |
| $50,000 to $74,999 | 50 (18.5%) | 6 (9.0%) |
| $75,000 to $99,999 | 43 (15.9%) | 0 (0.0%) |
| $100,000 to $149,999 | 42 (15.6%) | 10 (14.9%) |
| $150,000 or more | 18 (6.7%) | 28 (41.8%) |
| Total | 270 (100.0%) | 67 (100.0%) |
Property Value to Household Income Ratio in Wheeler
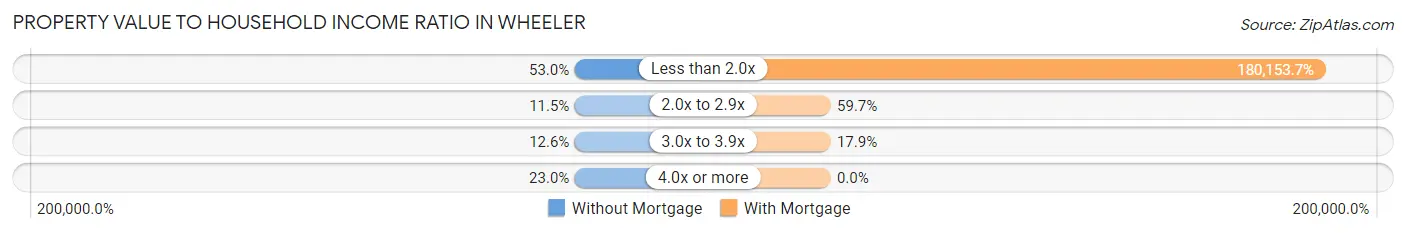
| Value-to-Income Ratio | Without Mortgage | With Mortgage |
| Less than 2.0x | 143 (53.0%) | 120,703 (180,153.7%) |
| 2.0x to 2.9x | 31 (11.5%) | 40 (59.7%) |
| 3.0x to 3.9x | 34 (12.6%) | 12 (17.9%) |
| 4.0x or more | 62 (23.0%) | 0 (0.0%) |
| Total | 270 (100.0%) | 67 (100.0%) |
Real Estate Taxes by Mortgage Status in Wheeler
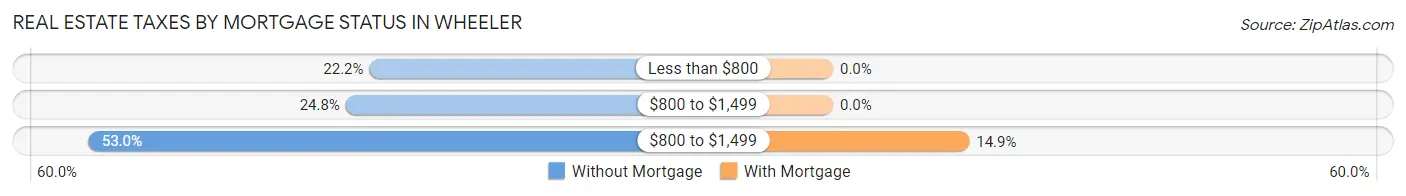
| Property Taxes | Without Mortgage | With Mortgage |
| Less than $800 | 60 (22.2%) | 0 (0.0%) |
| $800 to $1,499 | 67 (24.8%) | 0 (0.0%) |
| $800 to $1,499 | 143 (53.0%) | 10 (14.9%) |
| Total | 270 (100.0%) | 67 (100.0%) |
Health & Disability in Wheeler
Health Insurance Coverage by Age in Wheeler
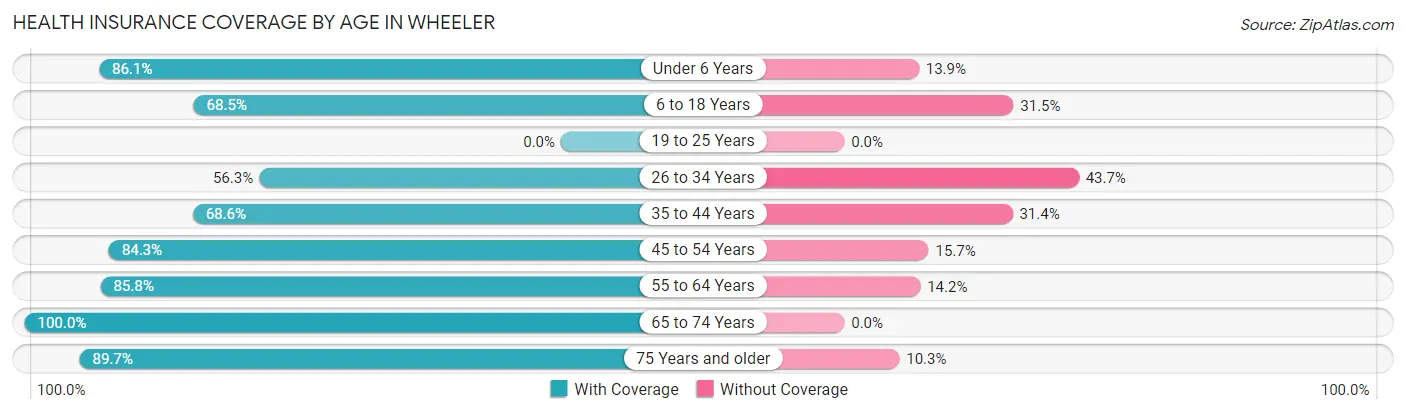
| Age Bracket | With Coverage | Without Coverage |
| Under 6 Years | 124 (86.1%) | 20 (13.9%) |
| 6 to 18 Years | 228 (68.5%) | 105 (31.5%) |
| 19 to 25 Years | 0 (0.0%) | 0 (0.0%) |
| 26 to 34 Years | 85 (56.3%) | 66 (43.7%) |
| 35 to 44 Years | 162 (68.6%) | 74 (31.4%) |
| 45 to 54 Years | 134 (84.3%) | 25 (15.7%) |
| 55 to 64 Years | 97 (85.8%) | 16 (14.2%) |
| 65 to 74 Years | 99 (100.0%) | 0 (0.0%) |
| 75 Years and older | 140 (89.7%) | 16 (10.3%) |
| Total | 1,069 (76.8%) | 322 (23.2%) |
Health Insurance Coverage by Citizenship Status in Wheeler
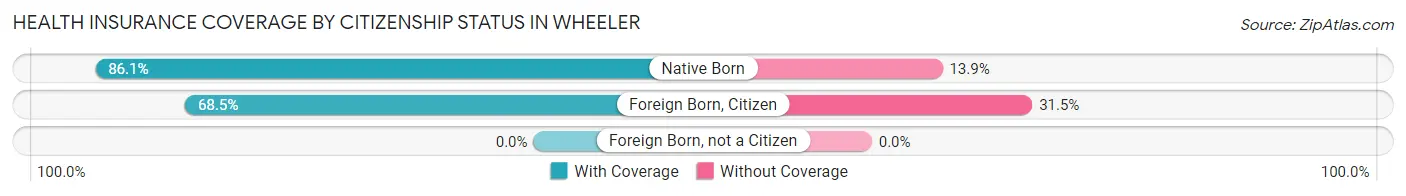
| Citizenship Status | With Coverage | Without Coverage |
| Native Born | 124 (86.1%) | 20 (13.9%) |
| Foreign Born, Citizen | 228 (68.5%) | 105 (31.5%) |
| Foreign Born, not a Citizen | 0 (0.0%) | 0 (0.0%) |
Health Insurance Coverage by Household Income in Wheeler
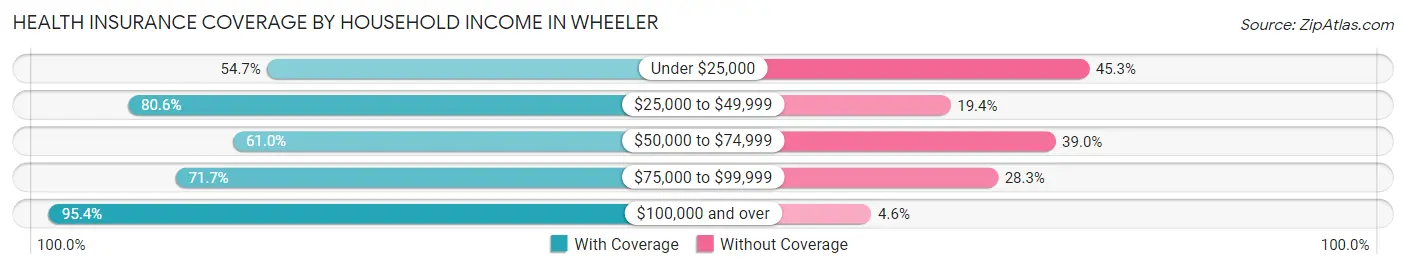
| Household Income | With Coverage | Without Coverage |
| Under $25,000 | 88 (54.7%) | 73 (45.3%) |
| $25,000 to $49,999 | 316 (80.6%) | 76 (19.4%) |
| $50,000 to $74,999 | 139 (61.0%) | 89 (39.0%) |
| $75,000 to $99,999 | 170 (71.7%) | 67 (28.3%) |
| $100,000 and over | 356 (95.4%) | 17 (4.6%) |
Public vs Private Health Insurance Coverage by Age in Wheeler
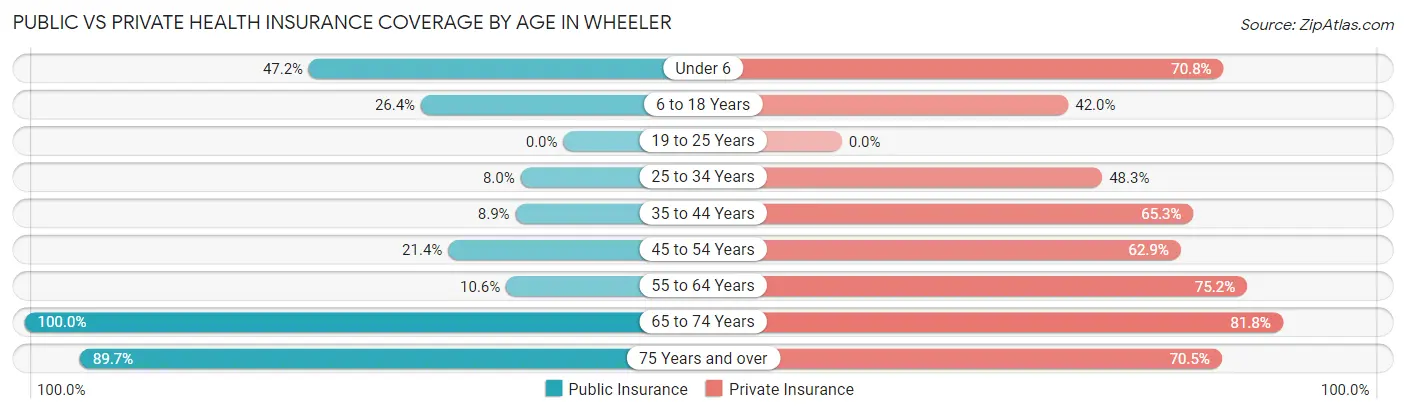
| Age Bracket | Public Insurance | Private Insurance |
| Under 6 | 68 (47.2%) | 102 (70.8%) |
| 6 to 18 Years | 88 (26.4%) | 140 (42.0%) |
| 19 to 25 Years | 0 (0.0%) | 0 (0.0%) |
| 25 to 34 Years | 12 (8.0%) | 73 (48.3%) |
| 35 to 44 Years | 21 (8.9%) | 154 (65.2%) |
| 45 to 54 Years | 34 (21.4%) | 100 (62.9%) |
| 55 to 64 Years | 12 (10.6%) | 85 (75.2%) |
| 65 to 74 Years | 99 (100.0%) | 81 (81.8%) |
| 75 Years and over | 140 (89.7%) | 110 (70.5%) |
| Total | 474 (34.1%) | 845 (60.8%) |
Disability Status by Sex by Age in Wheeler
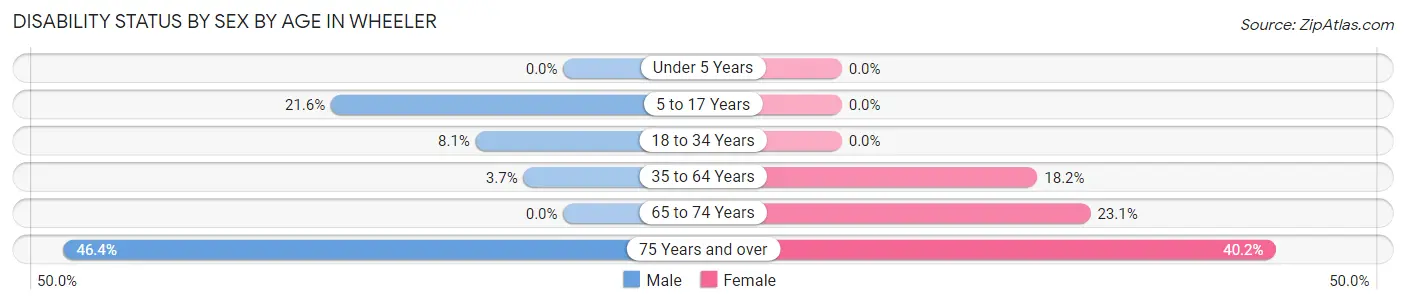
| Age Bracket | Male | Female |
| Under 5 Years | 0 (0.0%) | 0 (0.0%) |
| 5 to 17 Years | 36 (21.6%) | 0 (0.0%) |
| 18 to 34 Years | 7 (8.1%) | 0 (0.0%) |
| 35 to 64 Years | 8 (3.7%) | 53 (18.1%) |
| 65 to 74 Years | 0 (0.0%) | 15 (23.1%) |
| 75 Years and over | 32 (46.4%) | 35 (40.2%) |
Disability Class by Sex by Age in Wheeler
Disability Class: Hearing Difficulty
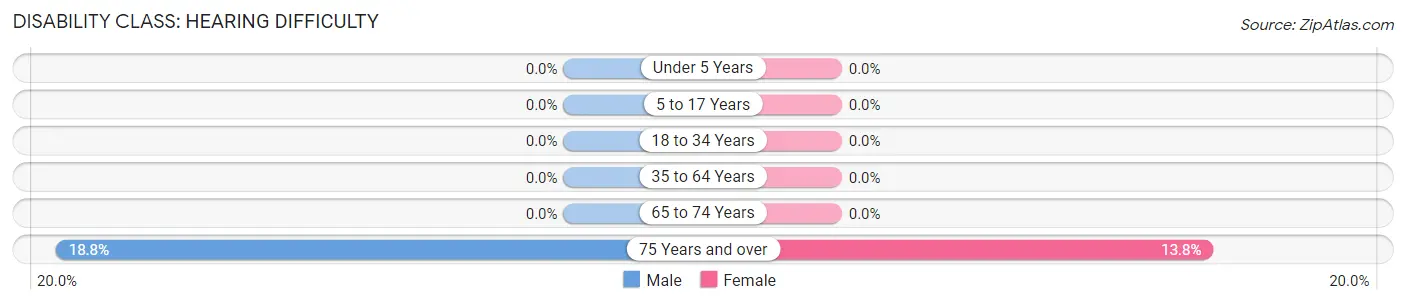
| Age Bracket | Male | Female |
| Under 5 Years | 0 (0.0%) | 0 (0.0%) |
| 5 to 17 Years | 0 (0.0%) | 0 (0.0%) |
| 18 to 34 Years | 0 (0.0%) | 0 (0.0%) |
| 35 to 64 Years | 0 (0.0%) | 0 (0.0%) |
| 65 to 74 Years | 0 (0.0%) | 0 (0.0%) |
| 75 Years and over | 13 (18.8%) | 12 (13.8%) |
Disability Class: Vision Difficulty
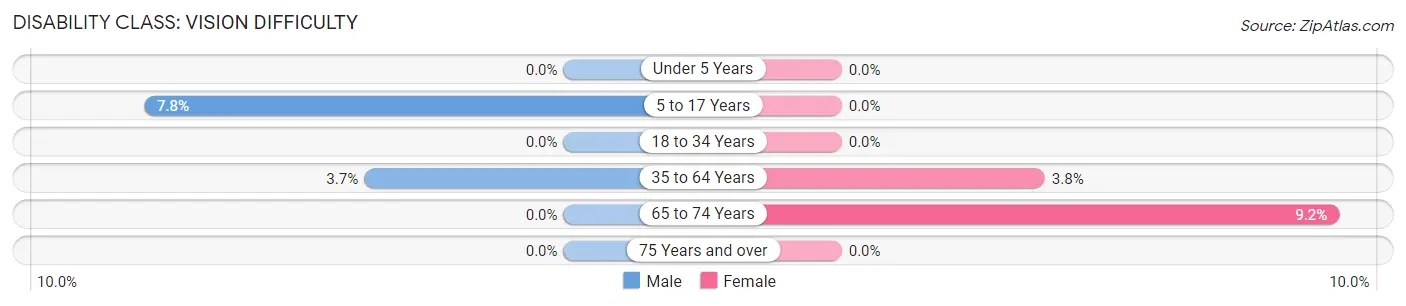
| Age Bracket | Male | Female |
| Under 5 Years | 0 (0.0%) | 0 (0.0%) |
| 5 to 17 Years | 13 (7.8%) | 0 (0.0%) |
| 18 to 34 Years | 0 (0.0%) | 0 (0.0%) |
| 35 to 64 Years | 8 (3.7%) | 11 (3.8%) |
| 65 to 74 Years | 0 (0.0%) | 6 (9.2%) |
| 75 Years and over | 0 (0.0%) | 0 (0.0%) |
Disability Class: Cognitive Difficulty
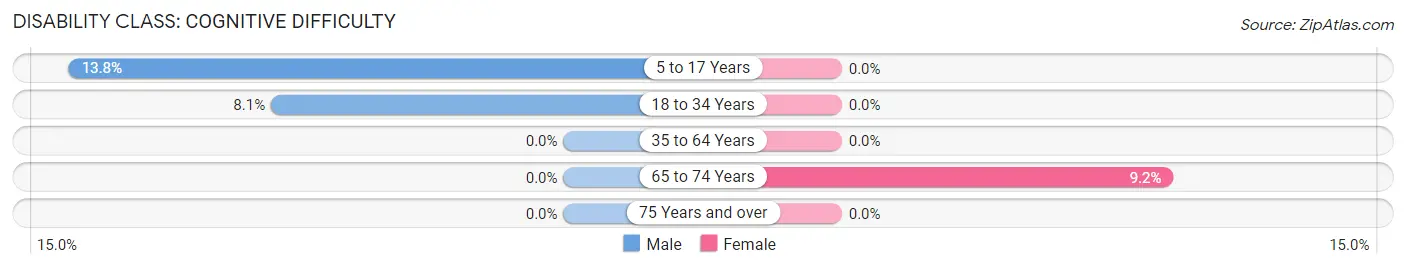
| Age Bracket | Male | Female |
| 5 to 17 Years | 23 (13.8%) | 0 (0.0%) |
| 18 to 34 Years | 7 (8.1%) | 0 (0.0%) |
| 35 to 64 Years | 0 (0.0%) | 0 (0.0%) |
| 65 to 74 Years | 0 (0.0%) | 6 (9.2%) |
| 75 Years and over | 0 (0.0%) | 0 (0.0%) |
Disability Class: Ambulatory Difficulty
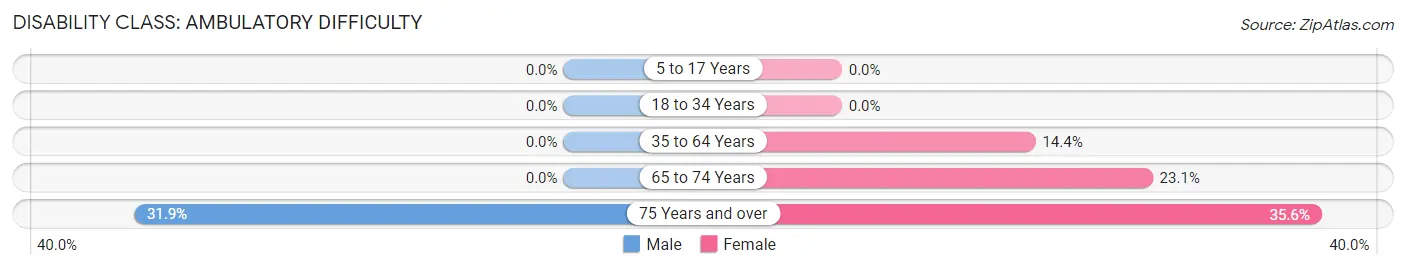
| Age Bracket | Male | Female |
| 5 to 17 Years | 0 (0.0%) | 0 (0.0%) |
| 18 to 34 Years | 0 (0.0%) | 0 (0.0%) |
| 35 to 64 Years | 0 (0.0%) | 42 (14.4%) |
| 65 to 74 Years | 0 (0.0%) | 15 (23.1%) |
| 75 Years and over | 22 (31.9%) | 31 (35.6%) |
Disability Class: Self-Care Difficulty
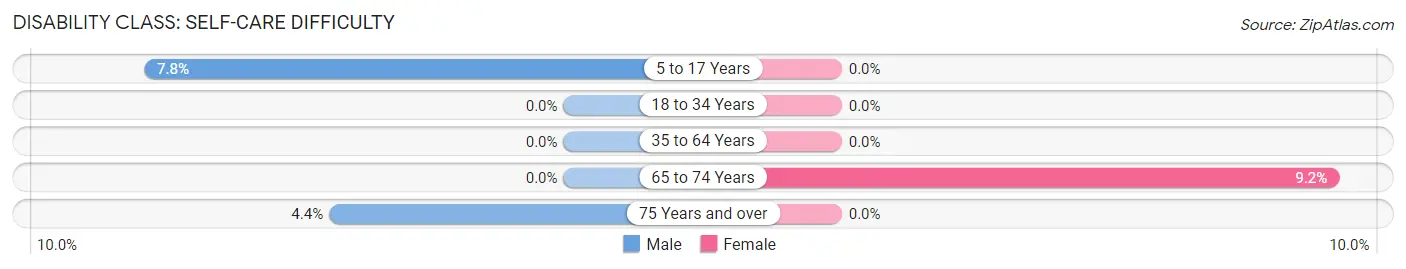
| Age Bracket | Male | Female |
| 5 to 17 Years | 13 (7.8%) | 0 (0.0%) |
| 18 to 34 Years | 0 (0.0%) | 0 (0.0%) |
| 35 to 64 Years | 0 (0.0%) | 0 (0.0%) |
| 65 to 74 Years | 0 (0.0%) | 6 (9.2%) |
| 75 Years and over | 3 (4.3%) | 0 (0.0%) |
Technology Access in Wheeler
Computing Device Access in Wheeler
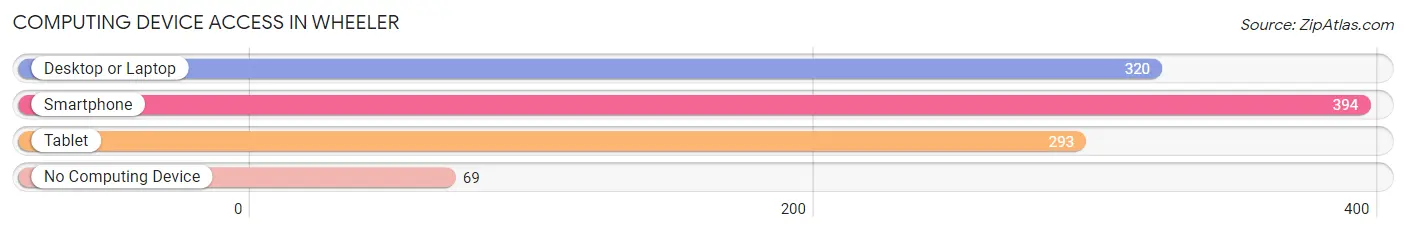
| Device Type | # Households | % Households |
| Desktop or Laptop | 320 | 66.5% |
| Smartphone | 394 | 81.9% |
| Tablet | 293 | 60.9% |
| No Computing Device | 69 | 14.3% |
| Total | 481 | 100.0% |
Internet Access in Wheeler
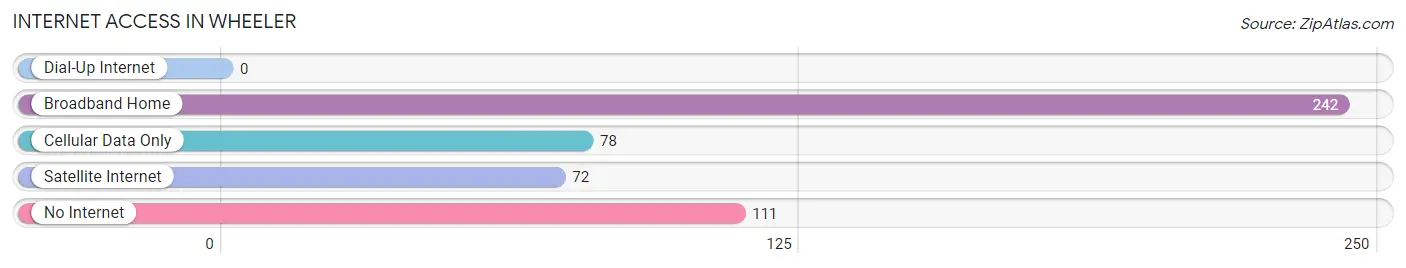
| Internet Type | # Households | % Households |
| Dial-Up Internet | 0 | 0.0% |
| Broadband Home | 242 | 50.3% |
| Cellular Data Only | 78 | 16.2% |
| Satellite Internet | 72 | 15.0% |
| No Internet | 111 | 23.1% |
| Total | 481 | 100.0% |
Wheeler Summary
Wheeler, Texas is a small town located in the northern part of the state, in the Panhandle region. It is the county seat of Wheeler County, and is situated on the banks of the Canadian River. The town was founded in 1879, and was named after Royal T. Wheeler, a former Texas Ranger and surveyor.
Geography
Wheeler is located in the northern part of the Texas Panhandle, in Wheeler County. It is situated on the banks of the Canadian River, and is surrounded by rolling hills and prairies. The town is located at an elevation of 2,717 feet, and has a total area of 1.3 square miles. The climate is semi-arid, with hot summers and cold winters.
Economy
The economy of Wheeler is largely based on agriculture and ranching. The town is home to several large ranches, and is a major producer of wheat, cotton, and other crops. The town also has a small manufacturing sector, with several small businesses producing a variety of goods.
Demographics
As of the 2010 census, Wheeler had a population of 1,441. The racial makeup of the town was 94.3% White, 0.2% African American, 0.7% Native American, 0.2% Asian, 0.1% Pacific Islander, 2.7% from other races, and 1.7% from two or more races. Hispanic or Latino of any race were 5.2% of the population.
The median income for a household in Wheeler was $30,938, and the median income for a family was $35,625. The per capita income for the town was $15,945. About 16.2% of families and 19.2% of the population were below the poverty line, including 25.2% of those under age 18 and 11.2% of those age 65 or over.
History
Wheeler was founded in 1879, and was named after Royal T. Wheeler, a former Texas Ranger and surveyor. The town was originally a stop on the Texas and Pacific Railway, and was a major shipping point for cattle and other goods. In the early 1900s, the town was a major center for the oil and gas industry, and was home to several large oil companies.
In the late 20th century, Wheeler began to experience a decline in population, as many of the town's residents moved away in search of better economic opportunities. However, the town has seen a resurgence in recent years, as new businesses have opened and the population has begun to grow again.
Today, Wheeler is a small but vibrant town, with a strong sense of community and a commitment to preserving its history and culture. The town is home to several historic sites, including the Wheeler County Courthouse, the Wheeler County Museum, and the Wheeler County Historical Society. The town also hosts a variety of festivals and events throughout the year, including the annual Wheeler County Fair and the Wheeler County Rodeo.
Common Questions
What is Per Capita Income in Wheeler?
Per Capita income in Wheeler is $25,878.
What is the Median Family Income in Wheeler?
Median Family Income in Wheeler is $65,724.
What is the Median Household income in Wheeler?
Median Household Income in Wheeler is $56,250.
What is Income or Wage Gap in Wheeler?
Income or Wage Gap in Wheeler is 68.2%.
Women in Wheeler earn 31.8 cents for every dollar earned by a man.
What is Inequality or Gini Index in Wheeler?
Inequality or Gini Index in Wheeler is 0.39.
What is the Total Population of Wheeler?
Total Population of Wheeler is 1,454.
What is the Total Male Population of Wheeler?
Total Male Population of Wheeler is 705.
What is the Total Female Population of Wheeler?
Total Female Population of Wheeler is 749.
What is the Ratio of Males per 100 Females in Wheeler?
There are 94.13 Males per 100 Females in Wheeler.
What is the Ratio of Females per 100 Males in Wheeler?
There are 106.24 Females per 100 Males in Wheeler.
What is the Median Population Age in Wheeler?
Median Population Age in Wheeler is 39.4 Years.
What is the Average Family Size in Wheeler
Average Family Size in Wheeler is 3.1 People.
What is the Average Household Size in Wheeler
Average Household Size in Wheeler is 2.9 People.
How Large is the Labor Force in Wheeler?
There are 685 People in the Labor Forcein in Wheeler.
What is the Percentage of People in the Labor Force in Wheeler?
62.6% of People are in the Labor Force in Wheeler.
What is the Unemployment Rate in Wheeler?
Unemployment Rate in Wheeler is 5.7%.