Wellington, TX Map & Demographics
Wellington Map
Wellington Overview
$27,050
PER CAPITA INCOME
$51,802
AVG FAMILY INCOME
$46,439
AVG HOUSEHOLD INCOME
35.4%
WAGE / INCOME GAP [ % ]
64.6¢/ $1
WAGE / INCOME GAP [ $ ]
0.52
INEQUALITY / GINI INDEX
2,201
TOTAL POPULATION
1,085
MALE POPULATION
1,116
FEMALE POPULATION
97.22
MALES / 100 FEMALES
102.86
FEMALES / 100 MALES
36.5
MEDIAN AGE
3.2
AVG FAMILY SIZE
2.7
AVG HOUSEHOLD SIZE
1,002
LABOR FORCE [ PEOPLE ]
65.9%
PERCENT IN LABOR FORCE
2.7%
UNEMPLOYMENT RATE
Wellington Zip Codes
Wellington Area Codes
Income in Wellington
Income Overview in Wellington
Per Capita Income in Wellington is $27,050, while median incomes of families and households are $51,802 and $46,439 respectively.
| Characteristic | Number | Measure |
| Per Capita Income | 2,201 | $27,050 |
| Median Family Income | 556 | $51,802 |
| Mean Family Income | 556 | $84,914 |
| Median Household Income | 790 | $46,439 |
| Mean Household Income | 790 | $71,632 |
| Income Deficit | 556 | $0 |
| Wage / Income Gap (%) | 2,201 | 35.45% |
| Wage / Income Gap ($) | 2,201 | 64.55¢ per $1 |
| Gini / Inequality Index | 2,201 | 0.52 |
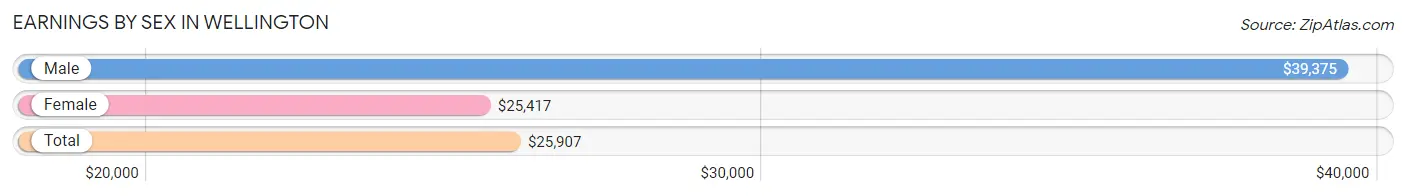
Earnings by Sex in Wellington
Average Earnings in Wellington are $25,907, $39,375 for men and $25,417 for women, a difference of 35.4%.
| Sex | Number | Average Earnings |
| Male | 494 (46.0%) | $39,375 |
| Female | 579 (54.0%) | $25,417 |
| Total | 1,073 (100.0%) | $25,907 |
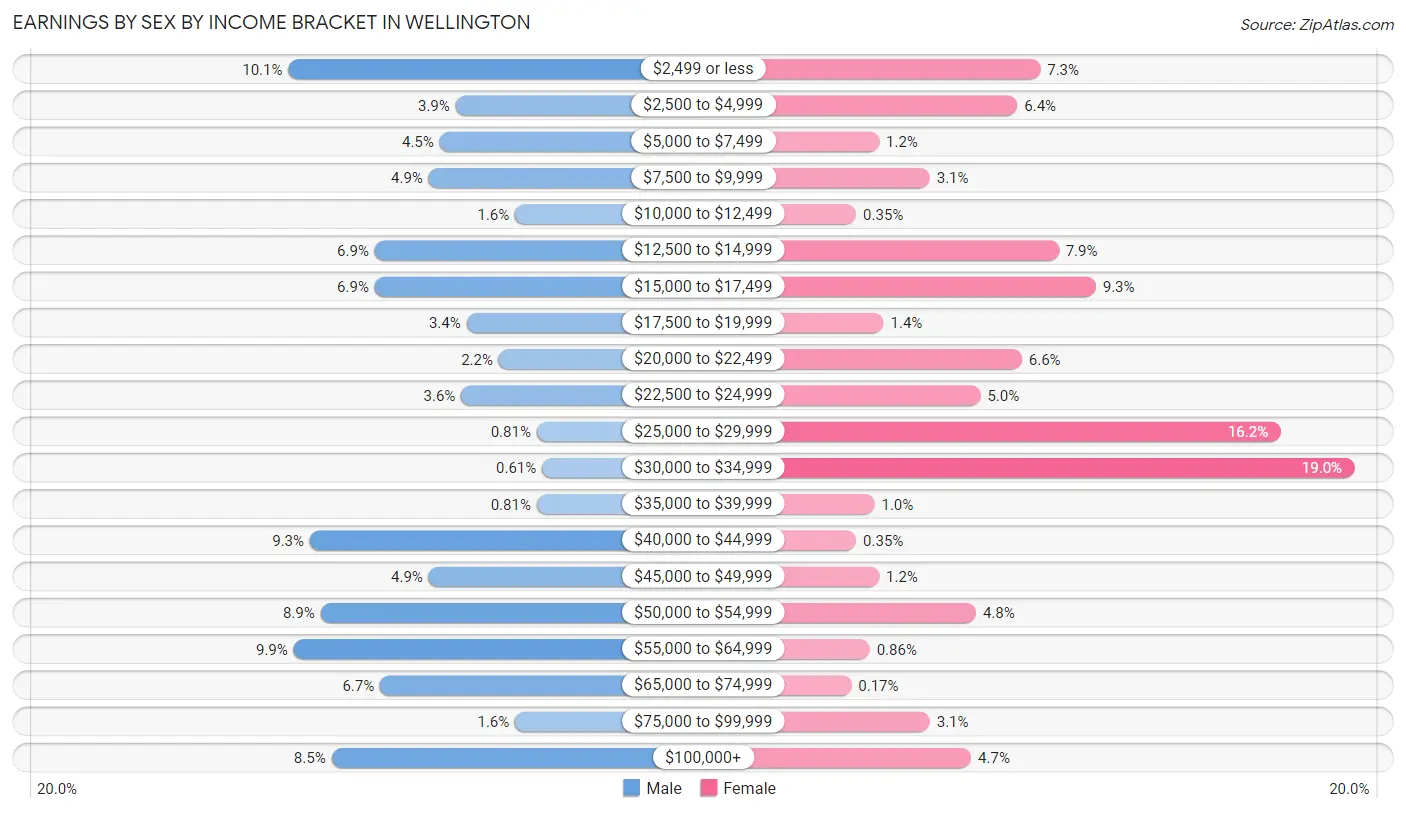
Earnings by Sex by Income Bracket in Wellington
The most common earnings brackets in Wellington are $2,499 or less for men (50 | 10.1%) and $30,000 to $34,999 for women (110 | 19.0%).
| Income | Male | Female |
| $2,499 or less | 50 (10.1%) | 42 (7.2%) |
| $2,500 to $4,999 | 19 (3.8%) | 37 (6.4%) |
| $5,000 to $7,499 | 22 (4.4%) | 7 (1.2%) |
| $7,500 to $9,999 | 24 (4.9%) | 18 (3.1%) |
| $10,000 to $12,499 | 8 (1.6%) | 2 (0.4%) |
| $12,500 to $14,999 | 34 (6.9%) | 46 (7.9%) |
| $15,000 to $17,499 | 34 (6.9%) | 54 (9.3%) |
| $17,500 to $19,999 | 17 (3.4%) | 8 (1.4%) |
| $20,000 to $22,499 | 11 (2.2%) | 38 (6.6%) |
| $22,500 to $24,999 | 18 (3.6%) | 29 (5.0%) |
| $25,000 to $29,999 | 4 (0.8%) | 94 (16.2%) |
| $30,000 to $34,999 | 3 (0.6%) | 110 (19.0%) |
| $35,000 to $39,999 | 4 (0.8%) | 6 (1.0%) |
| $40,000 to $44,999 | 46 (9.3%) | 2 (0.4%) |
| $45,000 to $49,999 | 24 (4.9%) | 7 (1.2%) |
| $50,000 to $54,999 | 44 (8.9%) | 28 (4.8%) |
| $55,000 to $64,999 | 49 (9.9%) | 5 (0.9%) |
| $65,000 to $74,999 | 33 (6.7%) | 1 (0.2%) |
| $75,000 to $99,999 | 8 (1.6%) | 18 (3.1%) |
| $100,000+ | 42 (8.5%) | 27 (4.7%) |
| Total | 494 (100.0%) | 579 (100.0%) |
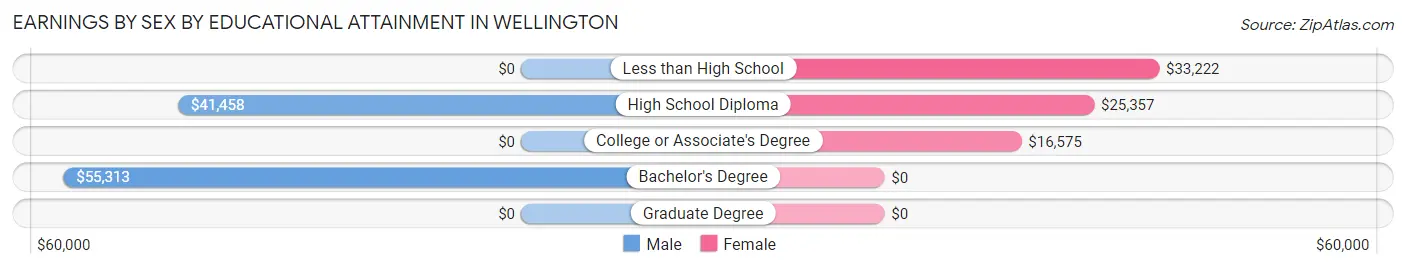
Earnings by Sex by Educational Attainment in Wellington
Average earnings in Wellington are $42,391 for men and $28,125 for women, a difference of 33.7%. Men with an educational attainment of bachelor's degree enjoy the highest average annual earnings of $55,313, while those with high school diploma education earn the least with $41,458. Women with an educational attainment of less than high school earn the most with the average annual earnings of $33,222, while those with college or associate's degree education have the smallest earnings of $16,575.
| Educational Attainment | Male Income | Female Income |
| Less than High School | - | - |
| High School Diploma | $41,458 | $25,357 |
| College or Associate's Degree | - | - |
| Bachelor's Degree | $55,313 | $0 |
| Graduate Degree | - | - |
| Total | $42,391 | $28,125 |
Family Income in Wellington
Family Income Brackets in Wellington
According to the Wellington family income data, there are 133 families falling into the $50,000 to $74,999 income range, which is the most common income bracket and makes up 23.9% of all families. Conversely, the $150,000 to $199,999 income bracket is the least frequent group with only 10 families (1.8%) belonging to this category.
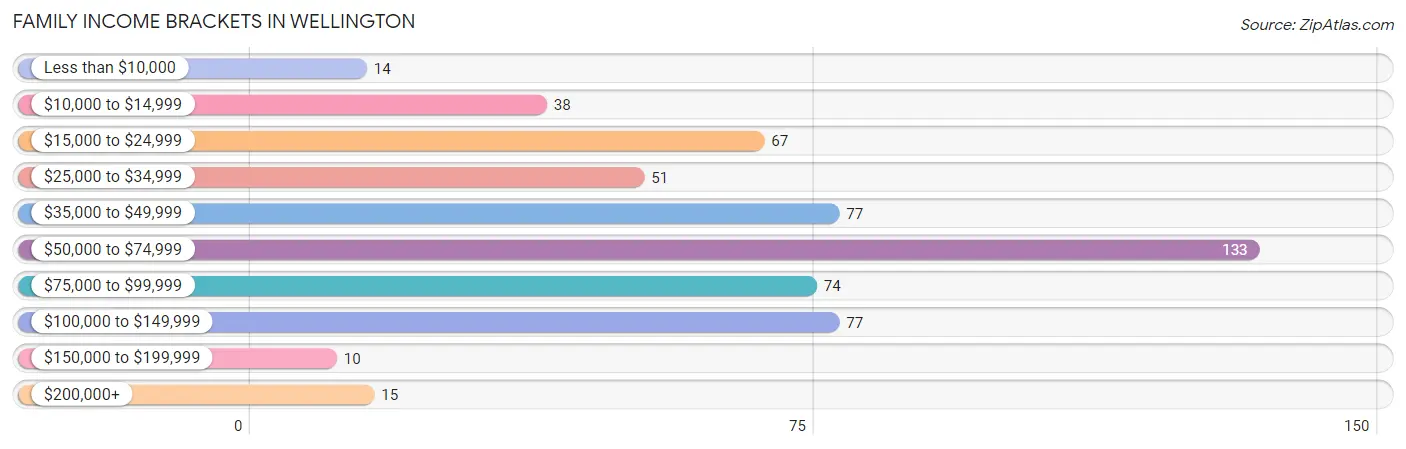
| Income Bracket | # Families | % Families |
| Less than $10,000 | 14 | 2.5% |
| $10,000 to $14,999 | 38 | 6.8% |
| $15,000 to $24,999 | 67 | 12.1% |
| $25,000 to $34,999 | 51 | 9.2% |
| $35,000 to $49,999 | 77 | 13.8% |
| $50,000 to $74,999 | 133 | 23.9% |
| $75,000 to $99,999 | 74 | 13.3% |
| $100,000 to $149,999 | 77 | 13.8% |
| $150,000 to $199,999 | 10 | 1.8% |
| $200,000+ | 15 | 2.7% |
Family Income by Famaliy Size in Wellington
6-person families (34 | 6.1%) account for the highest median family income in Wellington with $81,771 per family, while 3-person families (108 | 19.4%) have the highest median income of $26,458 per family member.
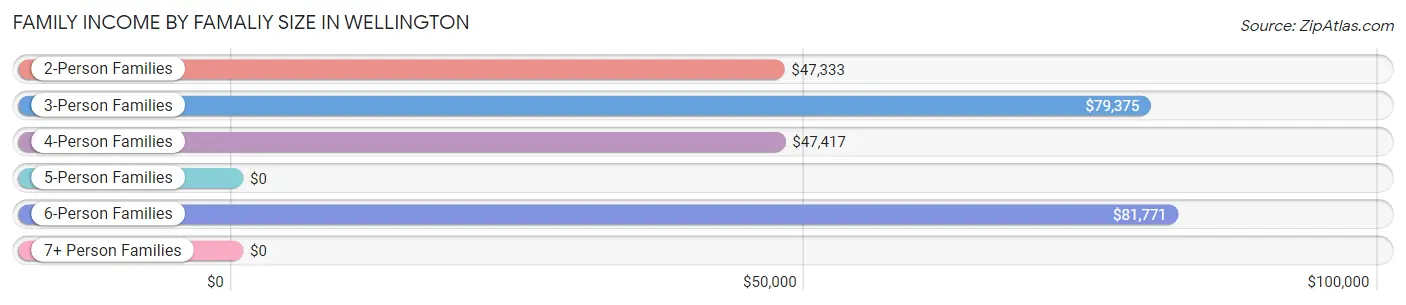
| Income Bracket | # Families | Median Income |
| 2-Person Families | 194 (34.9%) | $47,333 |
| 3-Person Families | 108 (19.4%) | $79,375 |
| 4-Person Families | 115 (20.7%) | $47,417 |
| 5-Person Families | 85 (15.3%) | $0 |
| 6-Person Families | 34 (6.1%) | $81,771 |
| 7+ Person Families | 20 (3.6%) | $0 |
| Total | 556 (100.0%) | $51,802 |
Family Income by Number of Earners in Wellington
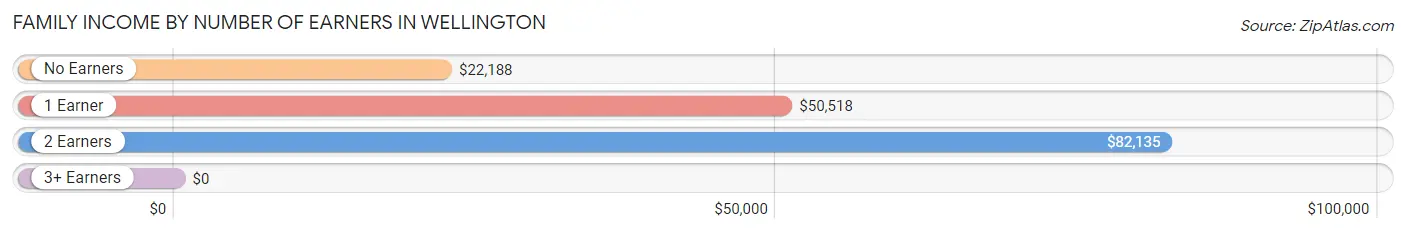
| Number of Earners | # Families | Median Income |
| No Earners | 51 (9.2%) | $22,188 |
| 1 Earner | 317 (57.0%) | $50,518 |
| 2 Earners | 153 (27.5%) | $82,135 |
| 3+ Earners | 35 (6.3%) | $0 |
| Total | 556 (100.0%) | $51,802 |
Household Income in Wellington
Household Income Brackets in Wellington
With 190 households falling in the category, the $50,000 to $74,999 income range is the most frequent in Wellington, accounting for 24.0% of all households. In contrast, only 15 households (1.9%) fall into the $150,000 to $199,999 income bracket, making it the least populous group.
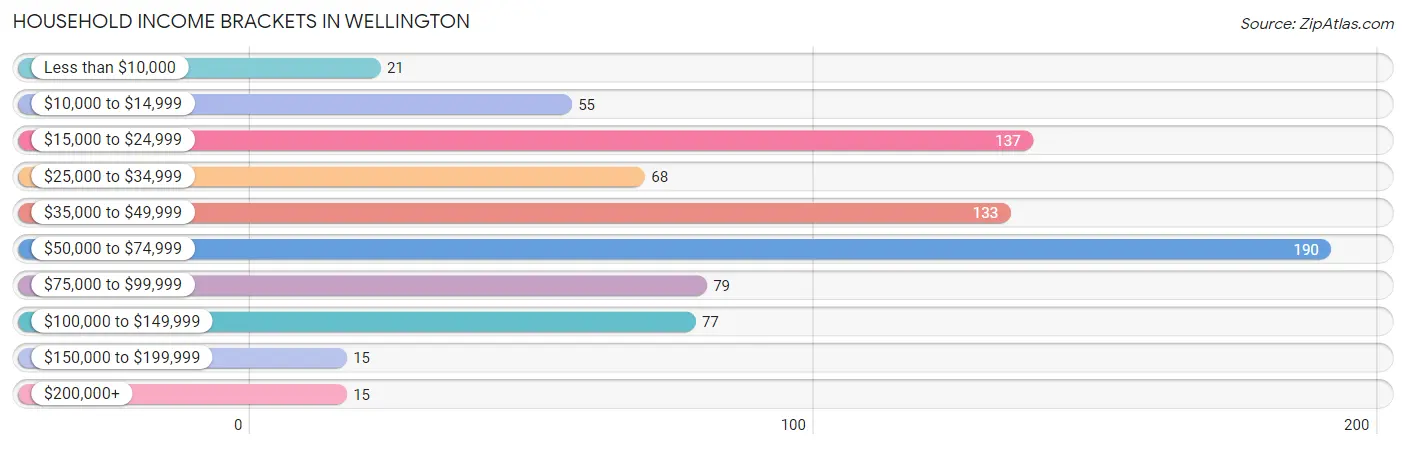
| Income Bracket | # Households | % Households |
| Less than $10,000 | 21 | 2.7% |
| $10,000 to $14,999 | 55 | 7.0% |
| $15,000 to $24,999 | 137 | 17.3% |
| $25,000 to $34,999 | 68 | 8.6% |
| $35,000 to $49,999 | 133 | 16.8% |
| $50,000 to $74,999 | 190 | 24.1% |
| $75,000 to $99,999 | 79 | 10.0% |
| $100,000 to $149,999 | 77 | 9.7% |
| $150,000 to $199,999 | 15 | 1.9% |
| $200,000+ | 15 | 1.9% |
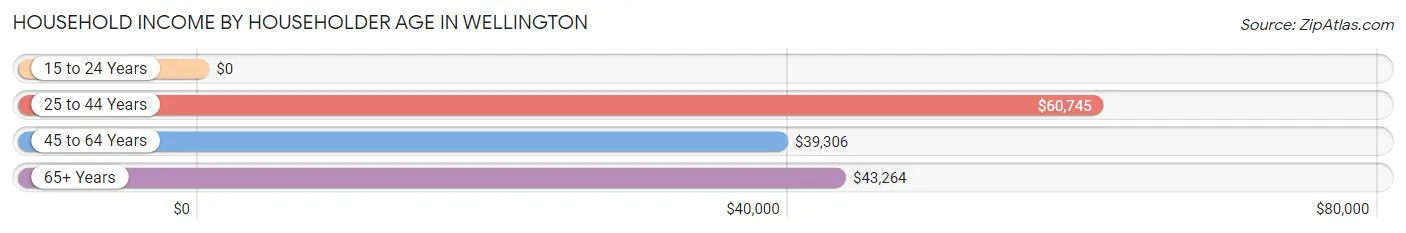
Household Income by Householder Age in Wellington
The median household income in Wellington is $46,439, with the highest median household income of $60,745 found in the 25 to 44 years age bracket for the primary householder. A total of 302 households (38.2%) fall into this category. Meanwhile, the 15 to 24 years age bracket for the primary householder has the lowest median household income of $0, with 42 households (5.3%) in this group.
| Income Bracket | # Households | Median Income |
| 15 to 24 Years | 42 (5.3%) | $0 |
| 25 to 44 Years | 302 (38.2%) | $60,745 |
| 45 to 64 Years | 221 (28.0%) | $39,306 |
| 65+ Years | 225 (28.5%) | $43,264 |
| Total | 790 (100.0%) | $46,439 |
Poverty in Wellington
Income Below Poverty by Sex and Age in Wellington
With 26.6% poverty level for males and 30.2% for females among the residents of Wellington, 45 to 54 year old males and 18 to 24 year old females are the most vulnerable to poverty, with 59 males (41.0%) and 114 females (85.1%) in their respective age groups living below the poverty level.
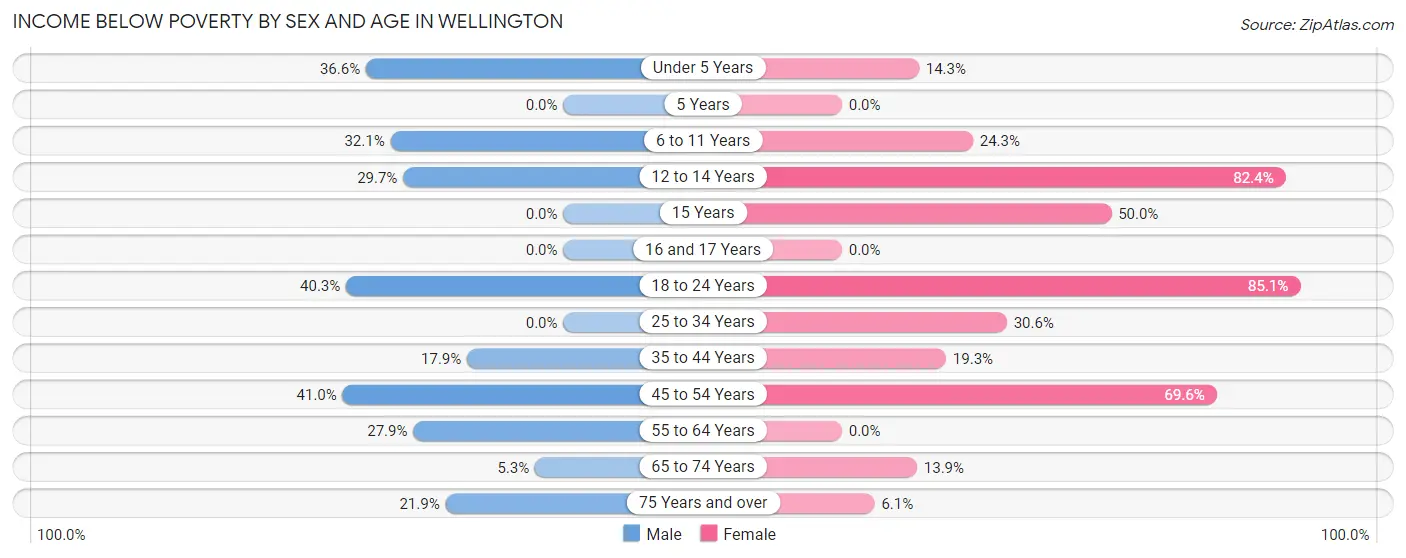
| Age Bracket | Male | Female |
| Under 5 Years | 37 (36.6%) | 10 (14.3%) |
| 5 Years | 0 (0.0%) | 0 (0.0%) |
| 6 to 11 Years | 69 (32.1%) | 36 (24.3%) |
| 12 to 14 Years | 22 (29.7%) | 14 (82.4%) |
| 15 Years | 0 (0.0%) | 6 (50.0%) |
| 16 and 17 Years | 0 (0.0%) | 0 (0.0%) |
| 18 to 24 Years | 25 (40.3%) | 114 (85.1%) |
| 25 to 34 Years | 0 (0.0%) | 30 (30.6%) |
| 35 to 44 Years | 30 (17.9%) | 34 (19.3%) |
| 45 to 54 Years | 59 (41.0%) | 64 (69.6%) |
| 55 to 64 Years | 22 (27.9%) | 0 (0.0%) |
| 65 to 74 Years | 4 (5.3%) | 17 (13.9%) |
| 75 Years and over | 7 (21.9%) | 4 (6.1%) |
| Total | 275 (26.6%) | 329 (30.2%) |
Income Above Poverty by Sex and Age in Wellington
According to the poverty statistics in Wellington, males aged 5 years and females aged 5 years are the age groups that are most secure financially, with 100.0% of males and 100.0% of females in these age groups living above the poverty line.
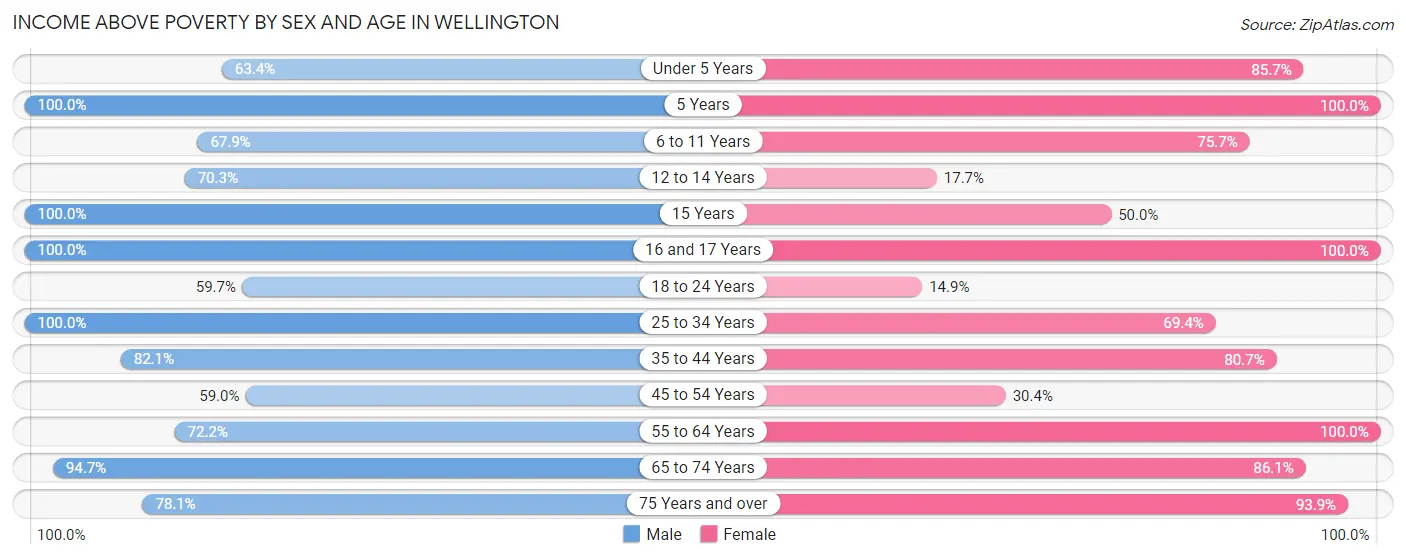
| Age Bracket | Male | Female |
| Under 5 Years | 64 (63.4%) | 60 (85.7%) |
| 5 Years | 5 (100.0%) | 17 (100.0%) |
| 6 to 11 Years | 146 (67.9%) | 112 (75.7%) |
| 12 to 14 Years | 52 (70.3%) | 3 (17.6%) |
| 15 Years | 15 (100.0%) | 6 (50.0%) |
| 16 and 17 Years | 23 (100.0%) | 7 (100.0%) |
| 18 to 24 Years | 37 (59.7%) | 20 (14.9%) |
| 25 to 34 Years | 39 (100.0%) | 68 (69.4%) |
| 35 to 44 Years | 138 (82.1%) | 142 (80.7%) |
| 45 to 54 Years | 85 (59.0%) | 28 (30.4%) |
| 55 to 64 Years | 57 (72.2%) | 132 (100.0%) |
| 65 to 74 Years | 72 (94.7%) | 105 (86.1%) |
| 75 Years and over | 25 (78.1%) | 62 (93.9%) |
| Total | 758 (73.4%) | 762 (69.8%) |
Income Below Poverty Among Married-Couple Families in Wellington
The poverty statistics for married-couple families in Wellington show that 24.2% or 80 of the total 331 families live below the poverty line. Families with no children have the highest poverty rate of 28.8%, comprising of 44 families. On the other hand, families with 3 or 4 children have the lowest poverty rate of 13.8%, which includes 11 families.
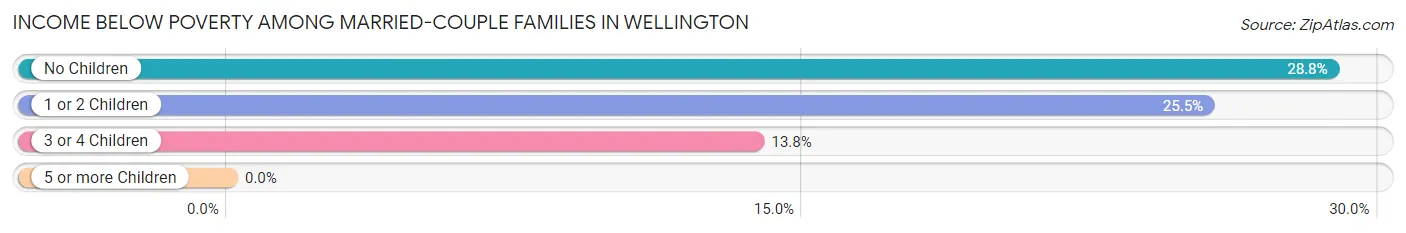
| Children | Above Poverty | Below Poverty |
| No Children | 109 (71.2%) | 44 (28.8%) |
| 1 or 2 Children | 73 (74.5%) | 25 (25.5%) |
| 3 or 4 Children | 69 (86.3%) | 11 (13.8%) |
| 5 or more Children | 0 (0.0%) | 0 (0.0%) |
| Total | 251 (75.8%) | 80 (24.2%) |
Income Below Poverty Among Single-Parent Households in Wellington
According to the poverty data in Wellington, 16.3% or 14 single-father households and 38.9% or 54 single-mother households are living below the poverty line. Among single-father households, those with 1 or 2 children have the highest poverty rate, with 14 households (35.9%) experiencing poverty. Likewise, among single-mother households, those with 3 or 4 children have the highest poverty rate, with 38 households (100.0%) falling below the poverty line.
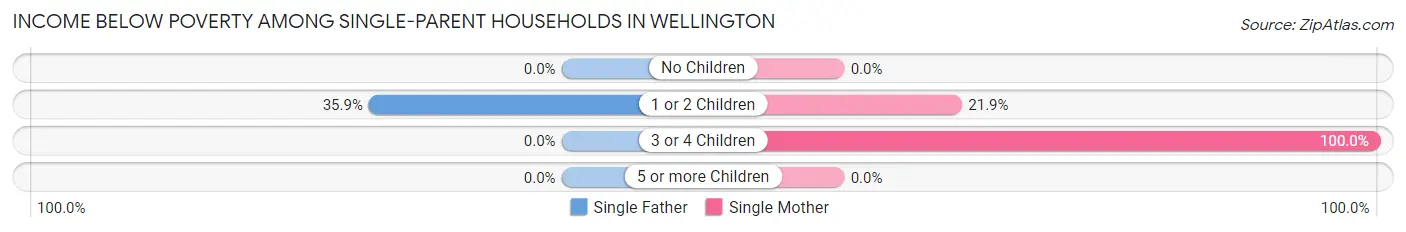
| Children | Single Father | Single Mother |
| No Children | 0 (0.0%) | 0 (0.0%) |
| 1 or 2 Children | 14 (35.9%) | 16 (21.9%) |
| 3 or 4 Children | 0 (0.0%) | 38 (100.0%) |
| 5 or more Children | 0 (0.0%) | 0 (0.0%) |
| Total | 14 (16.3%) | 54 (38.9%) |
Income Below Poverty Among Married-Couple vs Single-Parent Households in Wellington
The poverty data for Wellington shows that 80 of the married-couple family households (24.2%) and 68 of the single-parent households (30.2%) are living below the poverty level. Within the married-couple family households, those with no children have the highest poverty rate, with 44 households (28.8%) falling below the poverty line. Among the single-parent households, those with 3 or 4 children have the highest poverty rate, with 38 household (50.0%) living below poverty.
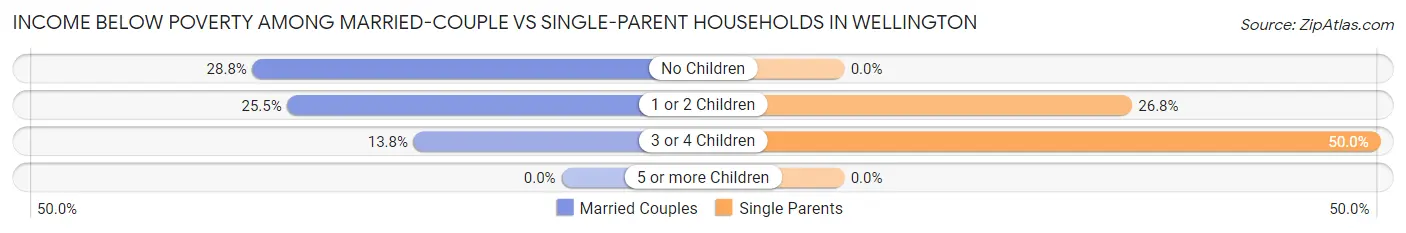
| Children | Married-Couple Families | Single-Parent Households |
| No Children | 44 (28.8%) | 0 (0.0%) |
| 1 or 2 Children | 25 (25.5%) | 30 (26.8%) |
| 3 or 4 Children | 11 (13.8%) | 38 (50.0%) |
| 5 or more Children | 0 (0.0%) | 0 (0.0%) |
| Total | 80 (24.2%) | 68 (30.2%) |
Race in Wellington
The most populous races in Wellington are White / Caucasian (1,423 | 64.6%), Hispanic or Latino (807 | 36.7%), and Two or more Races (421 | 19.1%).
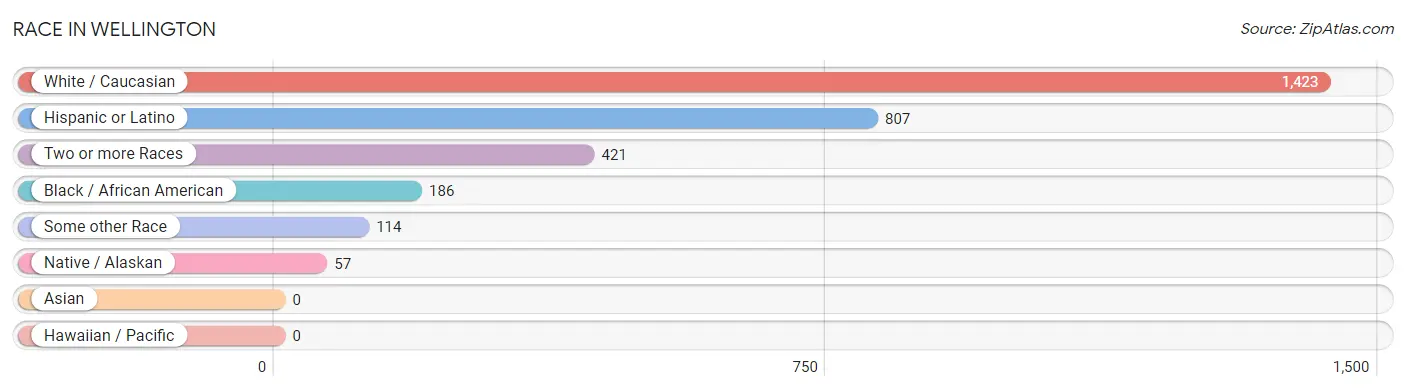
| Race | # Population | % Population |
| Asian | 0 | 0.0% |
| Black / African American | 186 | 8.5% |
| Hawaiian / Pacific | 0 | 0.0% |
| Hispanic or Latino | 807 | 36.7% |
| Native / Alaskan | 57 | 2.6% |
| White / Caucasian | 1,423 | 64.6% |
| Two or more Races | 421 | 19.1% |
| Some other Race | 114 | 5.2% |
| Total | 2,201 | 100.0% |
Ancestry in Wellington
The most populous ancestries reported in Wellington are Mexican (607 | 27.6%), Irish (329 | 14.9%), German (284 | 12.9%), English (278 | 12.6%), and American (106 | 4.8%), together accounting for 72.9% of all Wellington residents.
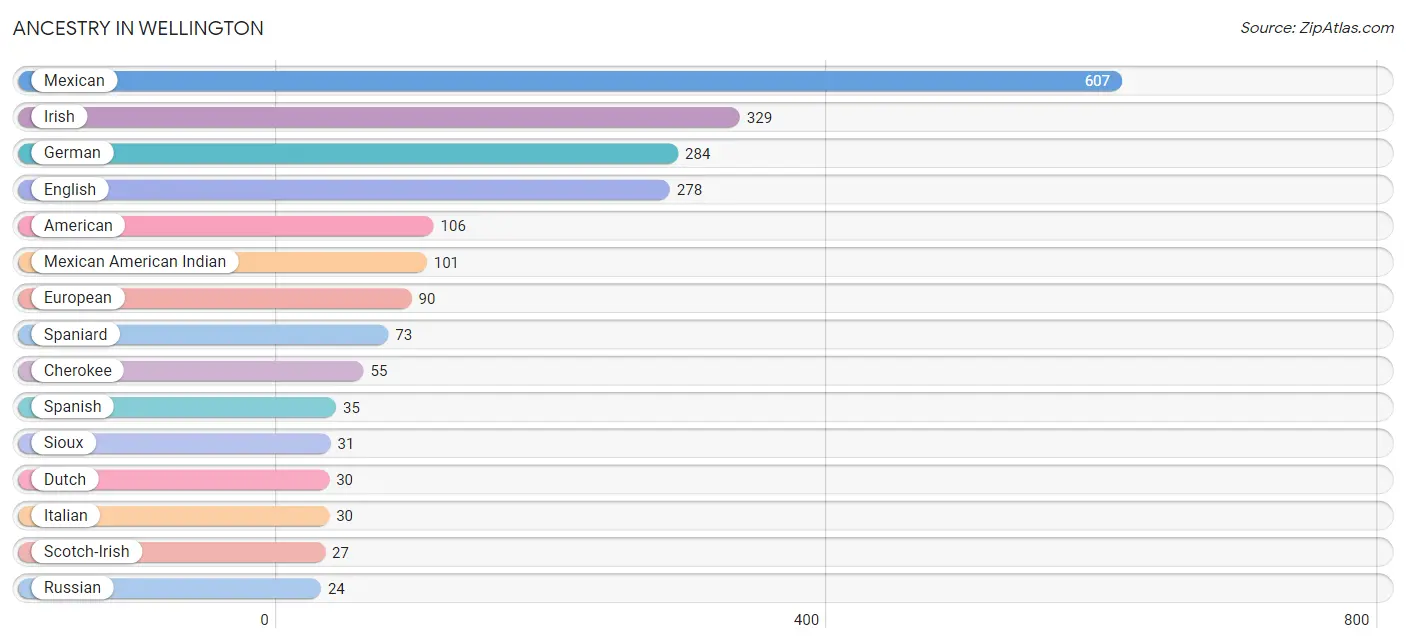
| Ancestry | # Population | % Population |
| American | 106 | 4.8% |
| Apache | 6 | 0.3% |
| Arapaho | 7 | 0.3% |
| Cherokee | 55 | 2.5% |
| Chickasaw | 4 | 0.2% |
| Choctaw | 2 | 0.1% |
| Comanche | 9 | 0.4% |
| Dutch | 30 | 1.4% |
| English | 278 | 12.6% |
| European | 90 | 4.1% |
| German | 284 | 12.9% |
| Irish | 329 | 14.9% |
| Iroquois | 2 | 0.1% |
| Italian | 30 | 1.4% |
| Mexican | 607 | 27.6% |
| Mexican American Indian | 101 | 4.6% |
| Polish | 11 | 0.5% |
| Russian | 24 | 1.1% |
| Scandinavian | 2 | 0.1% |
| Scotch-Irish | 27 | 1.2% |
| Scottish | 10 | 0.4% |
| Sioux | 31 | 1.4% |
| Spaniard | 73 | 3.3% |
| Spanish | 35 | 1.6% |
| Swiss | 4 | 0.2% |
| Turkish | 8 | 0.4% |
| Welsh | 12 | 0.5% | View All 27 Rows |
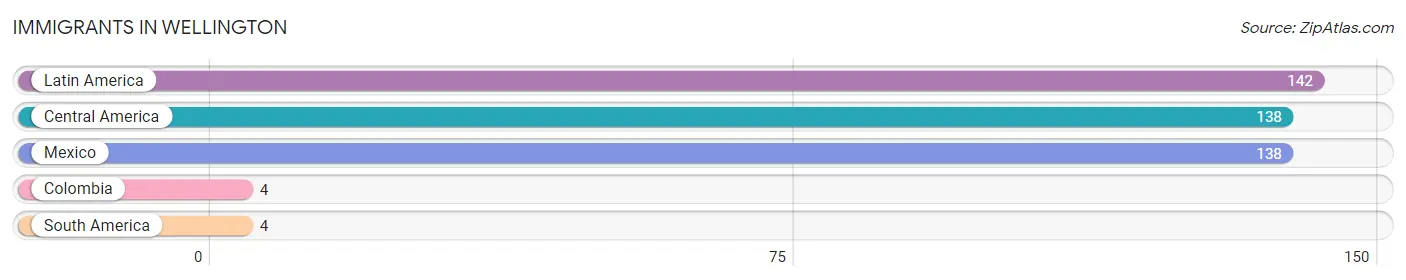
Immigrants in Wellington
The most numerous immigrant groups reported in Wellington came from Latin America (142 | 6.5%), Central America (138 | 6.3%), Mexico (138 | 6.3%), Colombia (4 | 0.2%), and South America (4 | 0.2%), together accounting for 19.4% of all Wellington residents.
| Immigration Origin | # Population | % Population |
| Central America | 138 | 6.3% |
| Colombia | 4 | 0.2% |
| Latin America | 142 | 6.5% |
| Mexico | 138 | 6.3% |
| South America | 4 | 0.2% | View All 5 Rows |
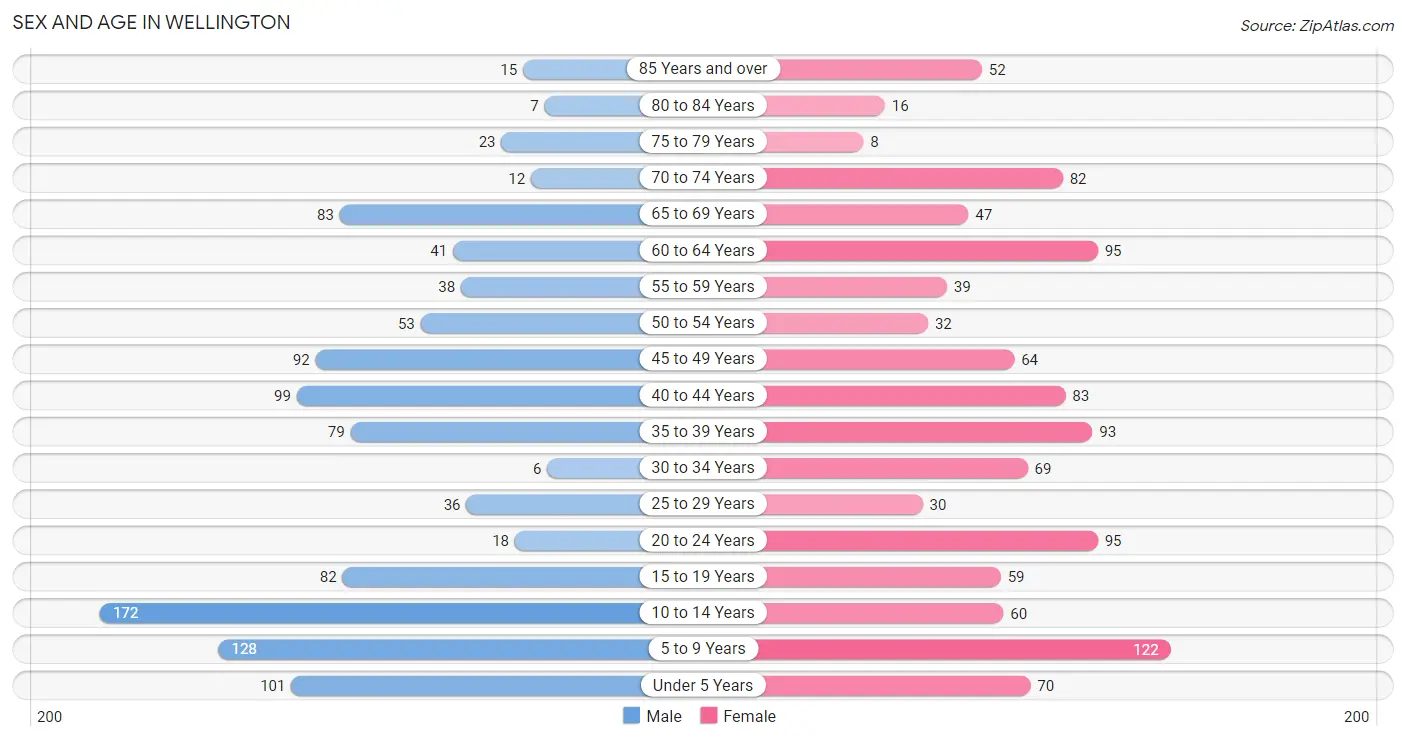
Sex and Age in Wellington
Sex and Age in Wellington
The most populous age groups in Wellington are 10 to 14 Years (172 | 15.9%) for men and 5 to 9 Years (122 | 10.9%) for women.
| Age Bracket | Male | Female |
| Under 5 Years | 101 (9.3%) | 70 (6.3%) |
| 5 to 9 Years | 128 (11.8%) | 122 (10.9%) |
| 10 to 14 Years | 172 (15.9%) | 60 (5.4%) |
| 15 to 19 Years | 82 (7.6%) | 59 (5.3%) |
| 20 to 24 Years | 18 (1.7%) | 95 (8.5%) |
| 25 to 29 Years | 36 (3.3%) | 30 (2.7%) |
| 30 to 34 Years | 6 (0.5%) | 69 (6.2%) |
| 35 to 39 Years | 79 (7.3%) | 93 (8.3%) |
| 40 to 44 Years | 99 (9.1%) | 83 (7.4%) |
| 45 to 49 Years | 92 (8.5%) | 64 (5.7%) |
| 50 to 54 Years | 53 (4.9%) | 32 (2.9%) |
| 55 to 59 Years | 38 (3.5%) | 39 (3.5%) |
| 60 to 64 Years | 41 (3.8%) | 95 (8.5%) |
| 65 to 69 Years | 83 (7.6%) | 47 (4.2%) |
| 70 to 74 Years | 12 (1.1%) | 82 (7.3%) |
| 75 to 79 Years | 23 (2.1%) | 8 (0.7%) |
| 80 to 84 Years | 7 (0.6%) | 16 (1.4%) |
| 85 Years and over | 15 (1.4%) | 52 (4.7%) |
| Total | 1,085 (100.0%) | 1,116 (100.0%) |
Families and Households in Wellington
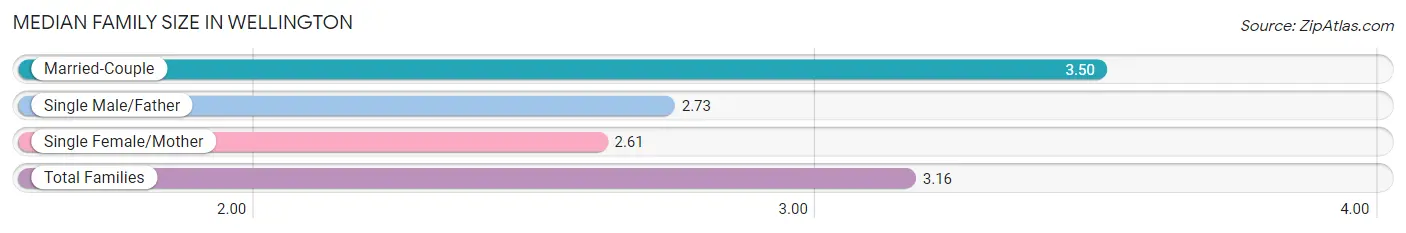
Median Family Size in Wellington
The median family size in Wellington is 3.16 persons per family, with married-couple families (331 | 59.5%) accounting for the largest median family size of 3.5 persons per family. On the other hand, single female/mother families (139 | 25.0%) represent the smallest median family size with 2.61 persons per family.
| Family Type | # Families | Family Size |
| Married-Couple | 331 (59.5%) | 3.50 |
| Single Male/Father | 86 (15.5%) | 2.73 |
| Single Female/Mother | 139 (25.0%) | 2.61 |
| Total Families | 556 (100.0%) | 3.16 |
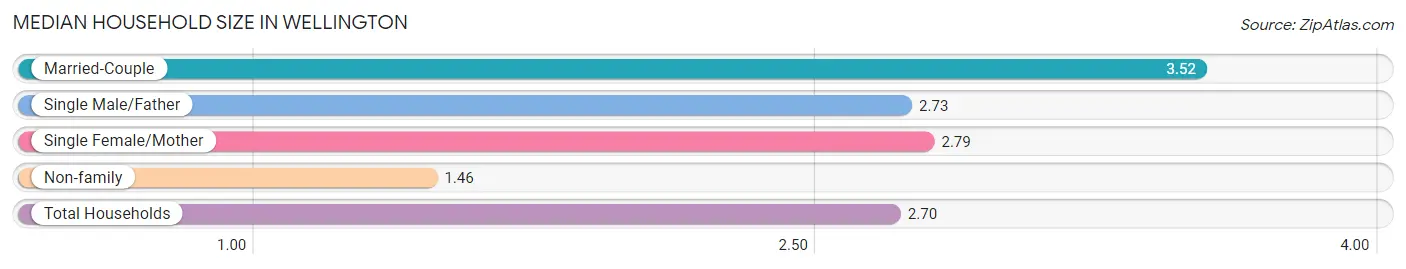
Median Household Size in Wellington
The median household size in Wellington is 2.70 persons per household, with married-couple households (331 | 41.9%) accounting for the largest median household size of 3.52 persons per household. non-family households (234 | 29.6%) represent the smallest median household size with 1.46 persons per household.
| Household Type | # Households | Household Size |
| Married-Couple | 331 (41.9%) | 3.52 |
| Single Male/Father | 86 (10.9%) | 2.73 |
| Single Female/Mother | 139 (17.6%) | 2.79 |
| Non-family | 234 (29.6%) | 1.46 |
| Total Households | 790 (100.0%) | 2.70 |
Household Size by Marriage Status in Wellington
Out of a total of 790 households in Wellington, 556 (70.4%) are family households, while 234 (29.6%) are nonfamily households. The most numerous type of family households are 2-person households, comprising 189, and the most common type of nonfamily households are 1-person households, comprising 179.
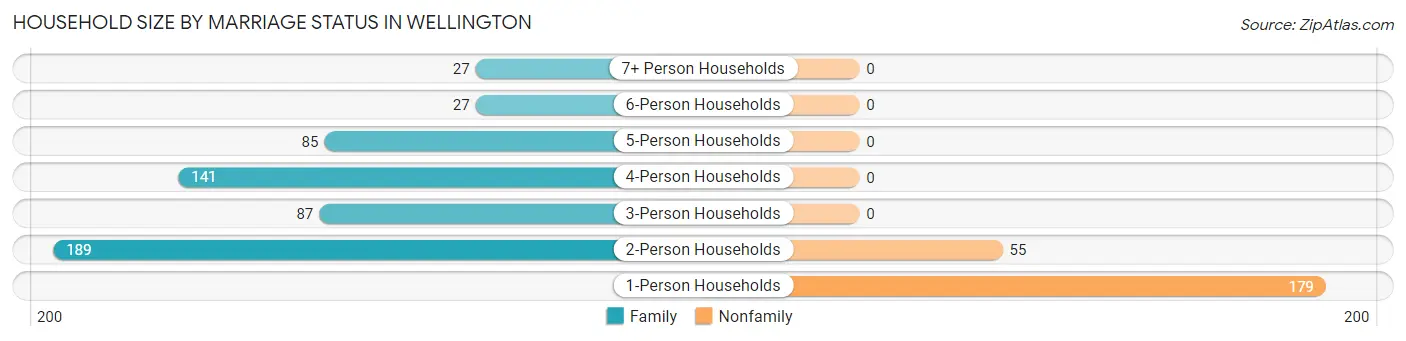
| Household Size | Family Households | Nonfamily Households |
| 1-Person Households | - | 179 (22.7%) |
| 2-Person Households | 189 (23.9%) | 55 (7.0%) |
| 3-Person Households | 87 (11.0%) | 0 (0.0%) |
| 4-Person Households | 141 (17.8%) | 0 (0.0%) |
| 5-Person Households | 85 (10.8%) | 0 (0.0%) |
| 6-Person Households | 27 (3.4%) | 0 (0.0%) |
| 7+ Person Households | 27 (3.4%) | 0 (0.0%) |
| Total | 556 (70.4%) | 234 (29.6%) |
Female Fertility in Wellington
Fertility by Age in Wellington
Average fertility rate in Wellington is 95.0 births per 1,000 women. Women in the age bracket of 20 to 34 years have the highest fertility rate with 165.0 births per 1,000 women. Women in the age bracket of 20 to 34 years acount for 68.1% of all women with births.
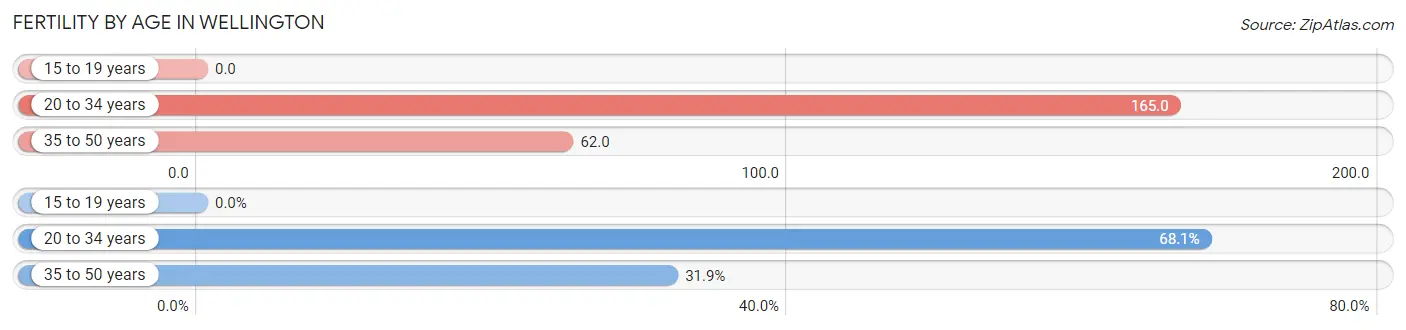
| Age Bracket | Women with Births | Births / 1,000 Women |
| 15 to 19 years | 0 (0.0%) | 0.0 |
| 20 to 34 years | 32 (68.1%) | 165.0 |
| 35 to 50 years | 15 (31.9%) | 62.0 |
| Total | 47 (100.0%) | 95.0 |
Fertility by Age by Marriage Status in Wellington
8.5% of women with births (47) in Wellington are married. The highest percentage of unmarried women with births falls into 35 to 50 years age bracket with 100.0% of them unmarried at the time of birth, while the lowest percentage of unmarried women with births belong to 20 to 34 years age bracket with 87.5% of them unmarried.
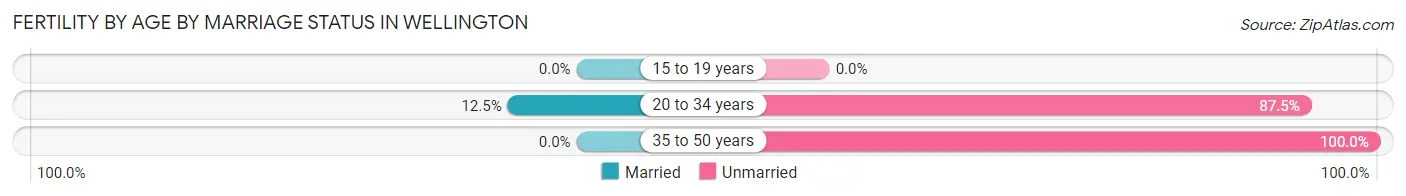
| Age Bracket | Married | Unmarried |
| 15 to 19 years | 0 (0.0%) | 0 (0.0%) |
| 20 to 34 years | 4 (12.5%) | 28 (87.5%) |
| 35 to 50 years | 0 (0.0%) | 15 (100.0%) |
| Total | 4 (8.5%) | 43 (91.5%) |
Fertility by Education in Wellington
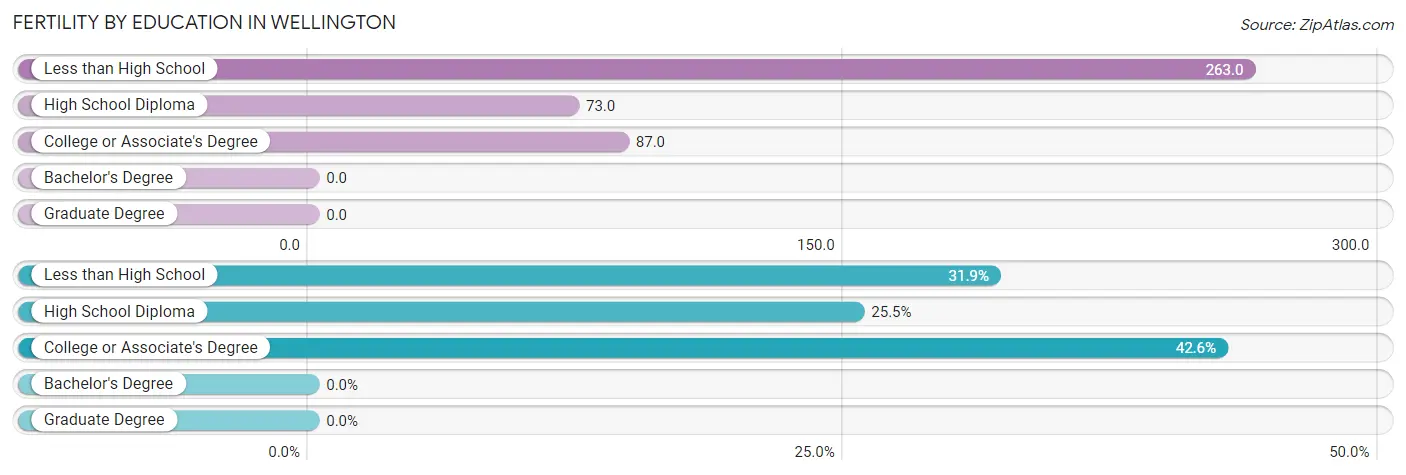
| Educational Attainment | Women with Births | Births / 1,000 Women |
| Less than High School | 15 (31.9%) | 263.0 |
| High School Diploma | 12 (25.5%) | 73.0 |
| College or Associate's Degree | 20 (42.5%) | 87.0 |
| Bachelor's Degree | 0 (0.0%) | 0.0 |
| Graduate Degree | 0 (0.0%) | 0.0 |
| Total | 47 (100.0%) | 95.0 |
Fertility by Education by Marriage Status in Wellington
91.5% of women with births in Wellington are unmarried. Women with the educational attainment of college or associate's degree are most likely to be married with 20.0% of them married at childbirth, while women with the educational attainment of less than high school are least likely to be married with 100.0% of them unmarried at childbirth.
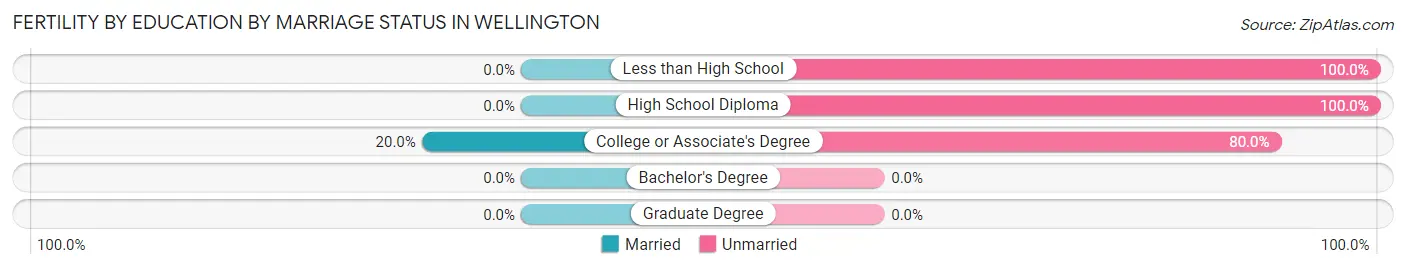
| Educational Attainment | Married | Unmarried |
| Less than High School | 0 (0.0%) | 15 (100.0%) |
| High School Diploma | 0 (0.0%) | 12 (100.0%) |
| College or Associate's Degree | 4 (20.0%) | 16 (80.0%) |
| Bachelor's Degree | 0 (0.0%) | 0 (0.0%) |
| Graduate Degree | 0 (0.0%) | 0 (0.0%) |
| Total | 4 (8.5%) | 43 (91.5%) |
Employment Characteristics in Wellington
Employment by Class of Employer in Wellington
Among the 888 employed individuals in Wellington, private company employees (477 | 53.7%), local government employees (139 | 15.7%), and self-employed (not incorporated) (105 | 11.8%) make up the most common classes of employment.
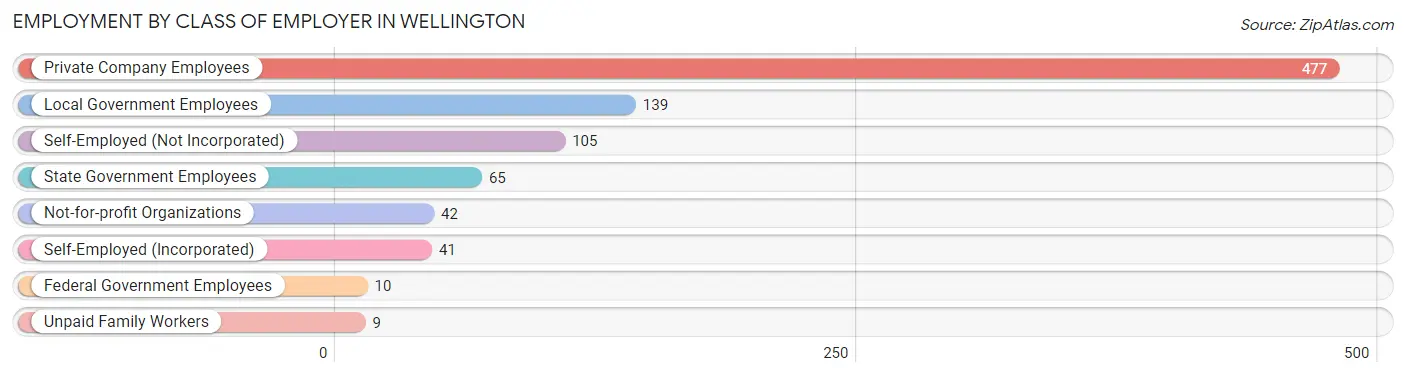
| Employer Class | # Employees | % Employees |
| Private Company Employees | 477 | 53.7% |
| Self-Employed (Incorporated) | 41 | 4.6% |
| Self-Employed (Not Incorporated) | 105 | 11.8% |
| Not-for-profit Organizations | 42 | 4.7% |
| Local Government Employees | 139 | 15.7% |
| State Government Employees | 65 | 7.3% |
| Federal Government Employees | 10 | 1.1% |
| Unpaid Family Workers | 9 | 1.0% |
| Total | 888 | 100.0% |
Employment Status by Age in Wellington
According to the labor force statistics for Wellington, out of the total population over 16 years of age (1,521), 65.9% or 1,002 individuals are in the labor force, with 2.7% or 27 of them unemployed. The age group with the highest labor force participation rate is 30 to 34 years, with 98.7% or 74 individuals in the labor force. Within the labor force, the 35 to 44 years age range has the highest percentage of unemployed individuals, with 10.1% or 27 of them being unemployed.
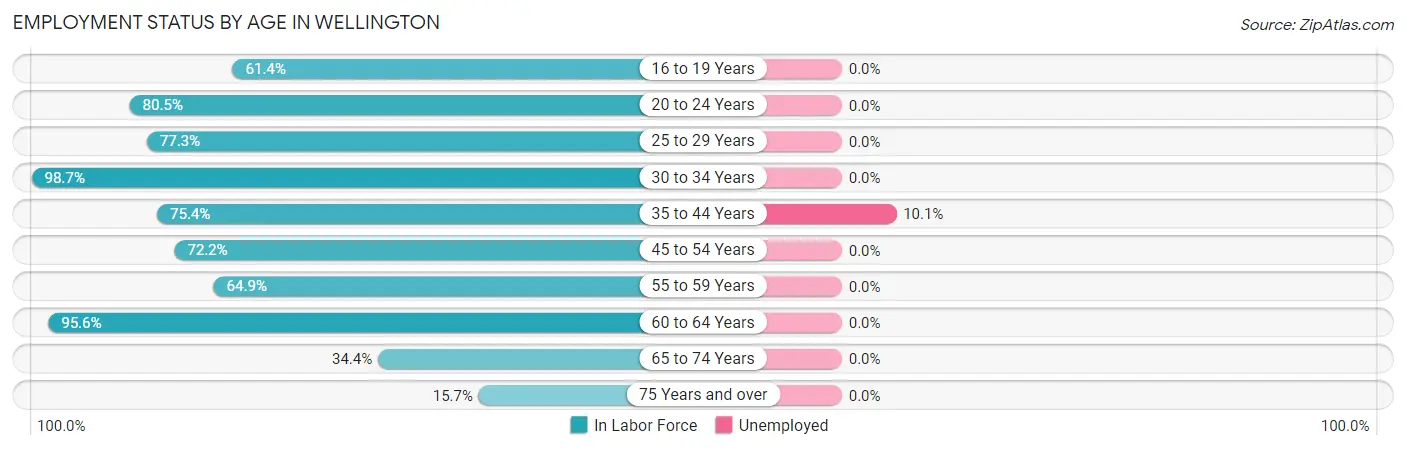
| Age Bracket | In Labor Force | Unemployed |
| 16 to 19 Years | 70 (61.4%) | 0 (0.0%) |
| 20 to 24 Years | 91 (80.5%) | 0 (0.0%) |
| 25 to 29 Years | 51 (77.3%) | 0 (0.0%) |
| 30 to 34 Years | 74 (98.7%) | 0 (0.0%) |
| 35 to 44 Years | 267 (75.4%) | 27 (10.1%) |
| 45 to 54 Years | 174 (72.2%) | 0 (0.0%) |
| 55 to 59 Years | 50 (64.9%) | 0 (0.0%) |
| 60 to 64 Years | 130 (95.6%) | 0 (0.0%) |
| 65 to 74 Years | 77 (34.4%) | 0 (0.0%) |
| 75 Years and over | 19 (15.7%) | 0 (0.0%) |
| Total | 1,002 (65.9%) | 27 (2.7%) |
Employment Status by Educational Attainment in Wellington
According to labor force statistics for Wellington, 78.6% of individuals (746) out of the total population between 25 and 64 years of age (949) are in the labor force, with 3.6% or 27 of them being unemployed. The group with the highest labor force participation rate are those with the educational attainment of bachelor's degree or higher, with 100.0% or 164 individuals in the labor force. Within the labor force, individuals with college / associate degree education have the highest percentage of unemployment, with 13.3% or 27 of them being unemployed.
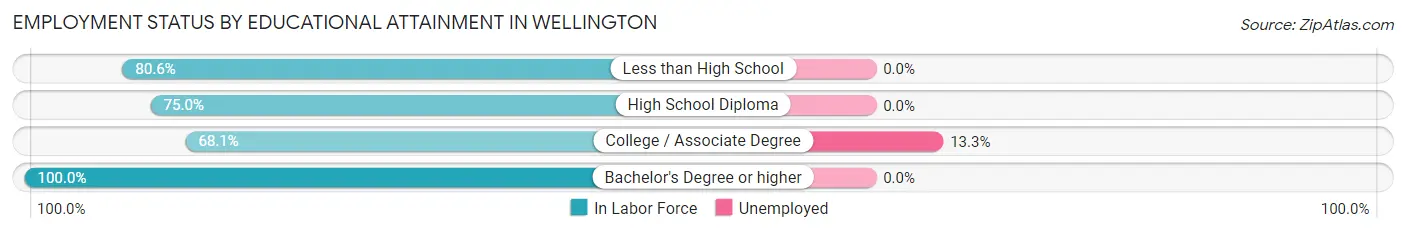
| Educational Attainment | In Labor Force | Unemployed |
| Less than High School | 199 (80.6%) | 0 (0.0%) |
| High School Diploma | 180 (75.0%) | 0 (0.0%) |
| College / Associate Degree | 203 (68.1%) | 40 (13.3%) |
| Bachelor's Degree or higher | 164 (100.0%) | 0 (0.0%) |
| Total | 746 (78.6%) | 34 (3.6%) |
Employment Occupations by Sex in Wellington
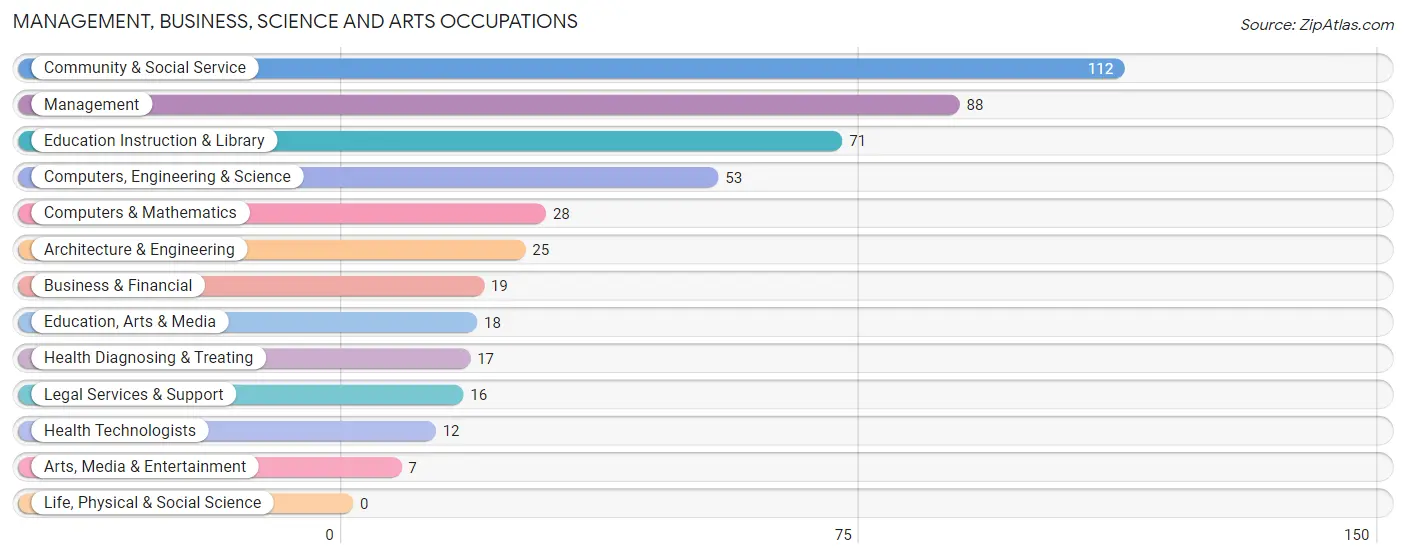
Management, Business, Science and Arts Occupations
The most common Management, Business, Science and Arts occupations in Wellington are Community & Social Service (112 | 11.5%), Management (88 | 9.0%), Education Instruction & Library (71 | 7.3%), Computers, Engineering & Science (53 | 5.4%), and Computers & Mathematics (28 | 2.9%).
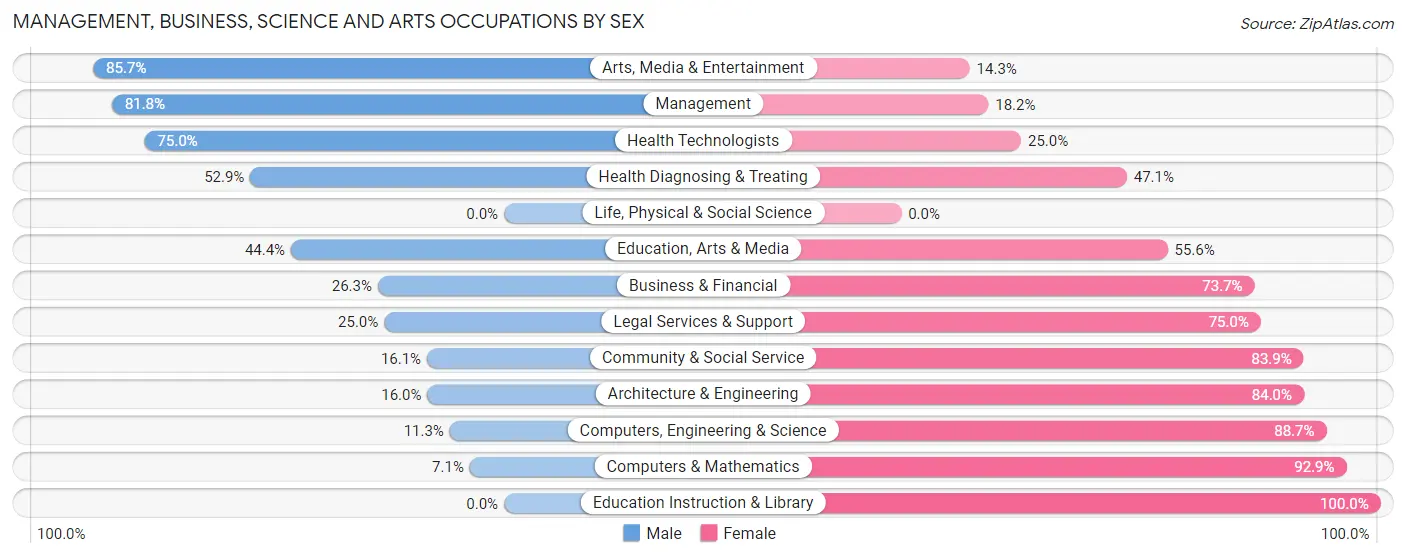
Management, Business, Science and Arts Occupations by Sex
Within the Management, Business, Science and Arts occupations in Wellington, the most male-oriented occupations are Arts, Media & Entertainment (85.7%), Management (81.8%), and Health Technologists (75.0%), while the most female-oriented occupations are Education Instruction & Library (100.0%), Computers & Mathematics (92.9%), and Computers, Engineering & Science (88.7%).
| Occupation | Male | Female |
| Management | 72 (81.8%) | 16 (18.2%) |
| Business & Financial | 5 (26.3%) | 14 (73.7%) |
| Computers, Engineering & Science | 6 (11.3%) | 47 (88.7%) |
| Computers & Mathematics | 2 (7.1%) | 26 (92.9%) |
| Architecture & Engineering | 4 (16.0%) | 21 (84.0%) |
| Life, Physical & Social Science | 0 (0.0%) | 0 (0.0%) |
| Community & Social Service | 18 (16.1%) | 94 (83.9%) |
| Education, Arts & Media | 8 (44.4%) | 10 (55.6%) |
| Legal Services & Support | 4 (25.0%) | 12 (75.0%) |
| Education Instruction & Library | 0 (0.0%) | 71 (100.0%) |
| Arts, Media & Entertainment | 6 (85.7%) | 1 (14.3%) |
| Health Diagnosing & Treating | 9 (52.9%) | 8 (47.1%) |
| Health Technologists | 9 (75.0%) | 3 (25.0%) |
| Total (Category) | 110 (38.1%) | 179 (61.9%) |
| Total (Overall) | 455 (46.6%) | 521 (53.4%) |
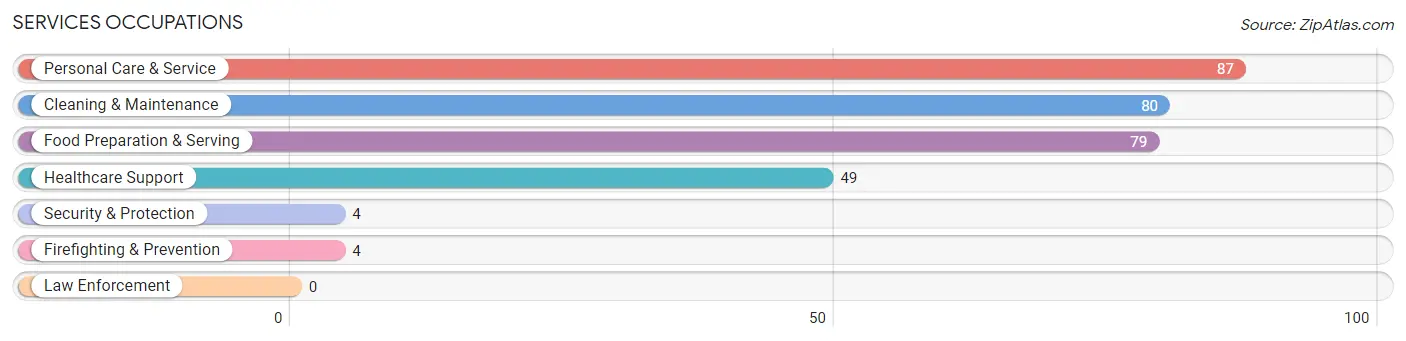
Services Occupations
The most common Services occupations in Wellington are Personal Care & Service (87 | 8.9%), Cleaning & Maintenance (80 | 8.2%), Food Preparation & Serving (79 | 8.1%), Healthcare Support (49 | 5.0%), and Security & Protection (4 | 0.4%).
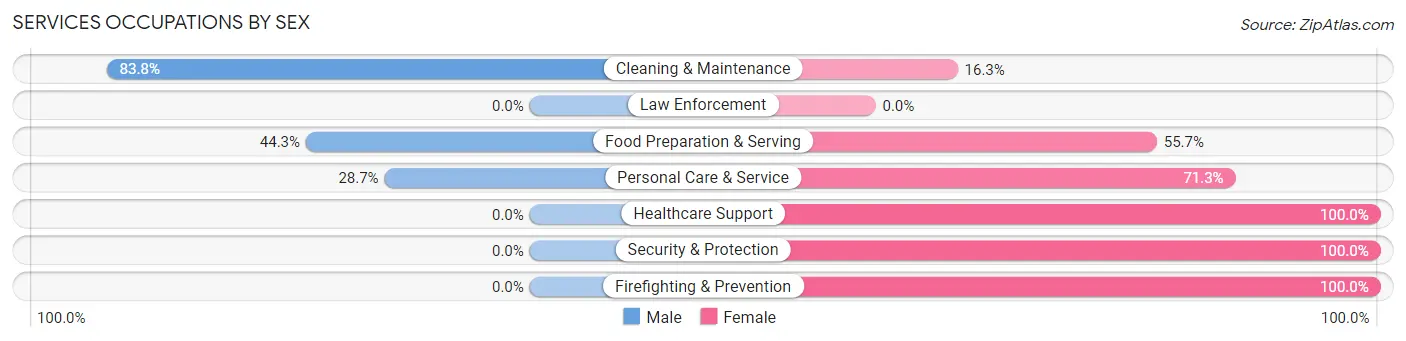
Services Occupations by Sex
Within the Services occupations in Wellington, the most male-oriented occupations are Cleaning & Maintenance (83.8%), Food Preparation & Serving (44.3%), and Personal Care & Service (28.7%), while the most female-oriented occupations are Healthcare Support (100.0%), Security & Protection (100.0%), and Firefighting & Prevention (100.0%).
| Occupation | Male | Female |
| Healthcare Support | 0 (0.0%) | 49 (100.0%) |
| Security & Protection | 0 (0.0%) | 4 (100.0%) |
| Firefighting & Prevention | 0 (0.0%) | 4 (100.0%) |
| Law Enforcement | 0 (0.0%) | 0 (0.0%) |
| Food Preparation & Serving | 35 (44.3%) | 44 (55.7%) |
| Cleaning & Maintenance | 67 (83.8%) | 13 (16.3%) |
| Personal Care & Service | 25 (28.7%) | 62 (71.3%) |
| Total (Category) | 127 (42.5%) | 172 (57.5%) |
| Total (Overall) | 455 (46.6%) | 521 (53.4%) |
Sales and Office Occupations
The most common Sales and Office occupations in Wellington are Office & Administration (114 | 11.7%), and Sales & Related (48 | 4.9%).
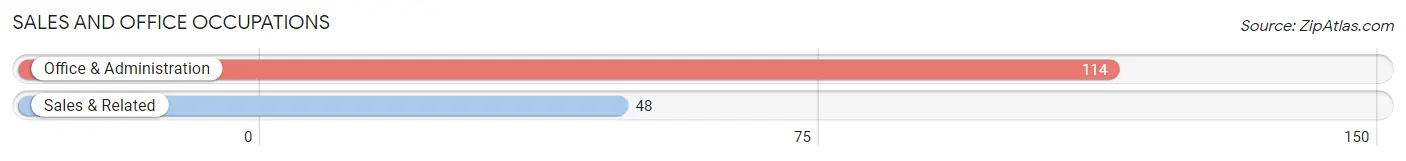
Sales and Office Occupations by Sex
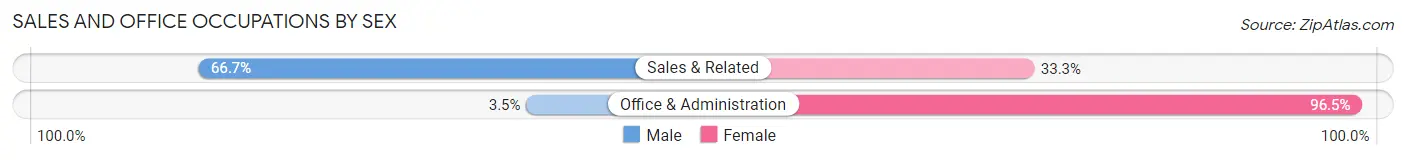
| Occupation | Male | Female |
| Sales & Related | 32 (66.7%) | 16 (33.3%) |
| Office & Administration | 4 (3.5%) | 110 (96.5%) |
| Total (Category) | 36 (22.2%) | 126 (77.8%) |
| Total (Overall) | 455 (46.6%) | 521 (53.4%) |
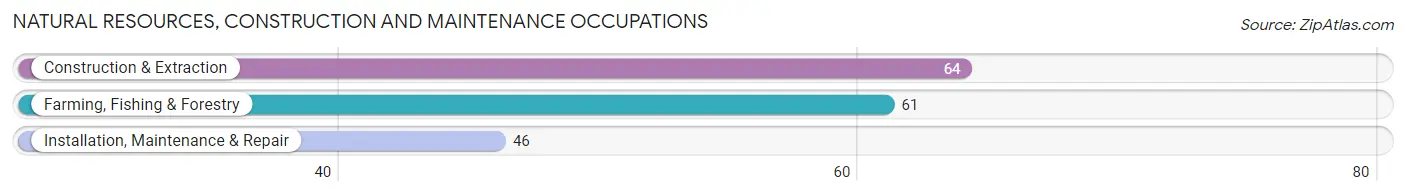
Natural Resources, Construction and Maintenance Occupations
The most common Natural Resources, Construction and Maintenance occupations in Wellington are Construction & Extraction (64 | 6.6%), Farming, Fishing & Forestry (61 | 6.2%), and Installation, Maintenance & Repair (46 | 4.7%).
Natural Resources, Construction and Maintenance Occupations by Sex
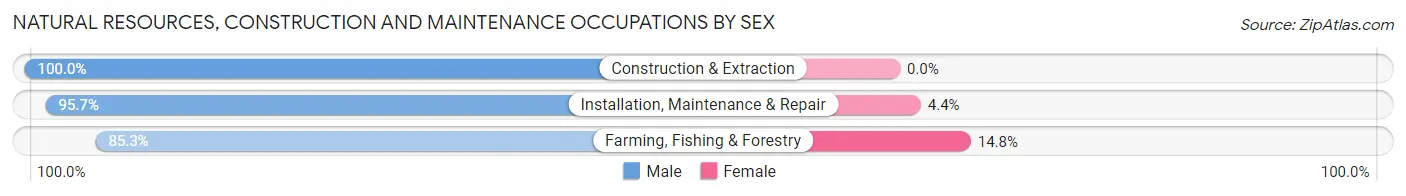
| Occupation | Male | Female |
| Farming, Fishing & Forestry | 52 (85.3%) | 9 (14.7%) |
| Construction & Extraction | 64 (100.0%) | 0 (0.0%) |
| Installation, Maintenance & Repair | 44 (95.7%) | 2 (4.3%) |
| Total (Category) | 160 (93.6%) | 11 (6.4%) |
| Total (Overall) | 455 (46.6%) | 521 (53.4%) |
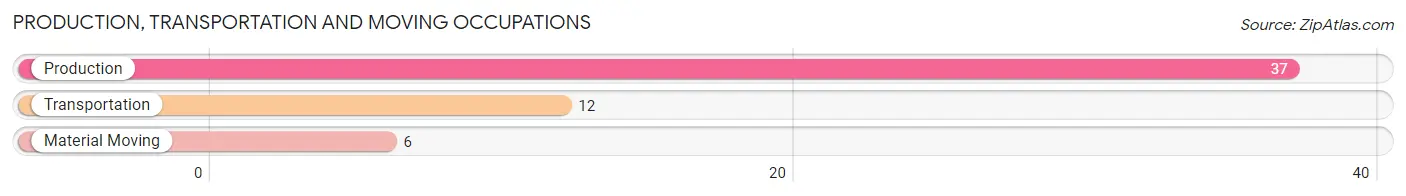
Production, Transportation and Moving Occupations
The most common Production, Transportation and Moving occupations in Wellington are Production (37 | 3.8%), Transportation (12 | 1.2%), and Material Moving (6 | 0.6%).
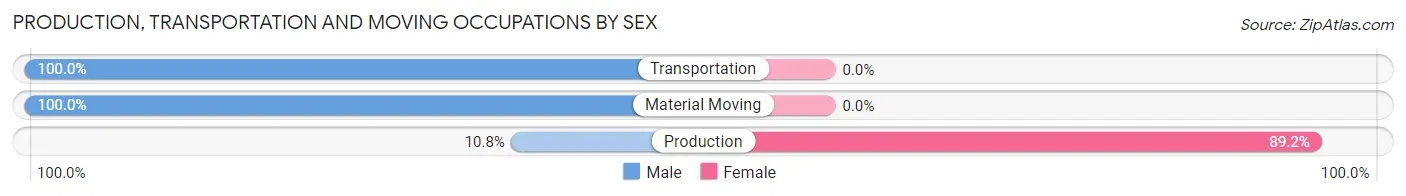
Production, Transportation and Moving Occupations by Sex
| Occupation | Male | Female |
| Production | 4 (10.8%) | 33 (89.2%) |
| Transportation | 12 (100.0%) | 0 (0.0%) |
| Material Moving | 6 (100.0%) | 0 (0.0%) |
| Total (Category) | 22 (40.0%) | 33 (60.0%) |
| Total (Overall) | 455 (46.6%) | 521 (53.4%) |
Employment Industries by Sex in Wellington
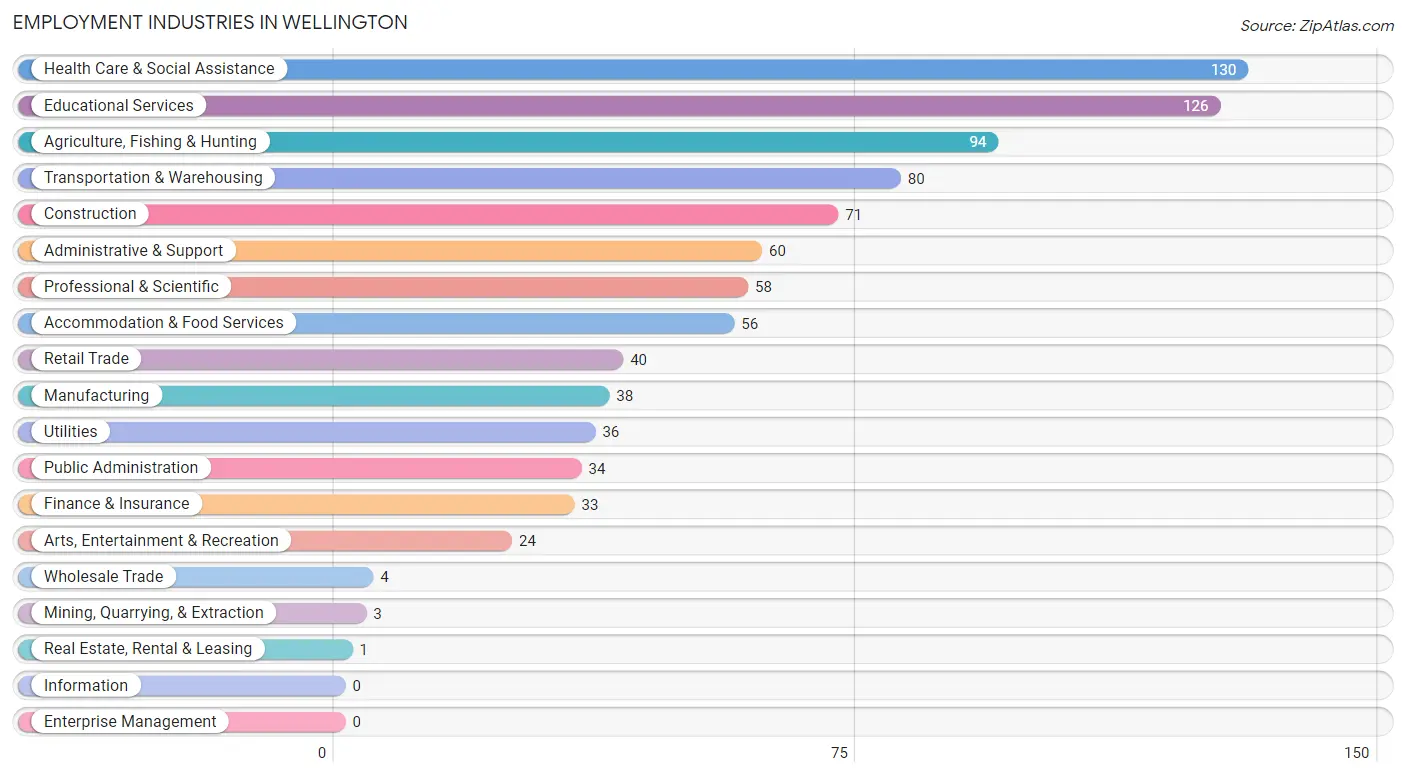
Employment Industries in Wellington
The major employment industries in Wellington include Health Care & Social Assistance (130 | 13.3%), Educational Services (126 | 12.9%), Agriculture, Fishing & Hunting (94 | 9.6%), Transportation & Warehousing (80 | 8.2%), and Construction (71 | 7.3%).
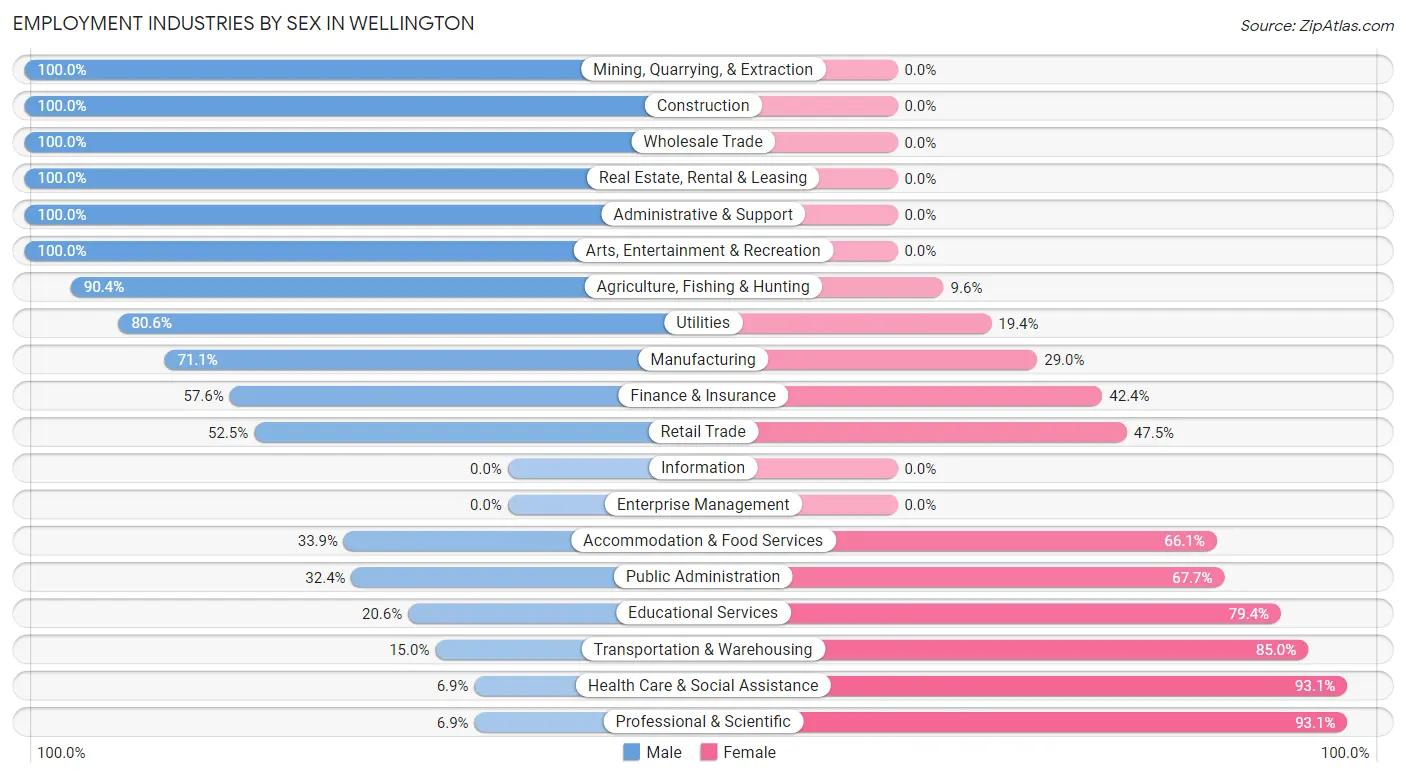
Employment Industries by Sex in Wellington
The Wellington industries that see more men than women are Mining, Quarrying, & Extraction (100.0%), Construction (100.0%), and Wholesale Trade (100.0%), whereas the industries that tend to have a higher number of women are Professional & Scientific (93.1%), Health Care & Social Assistance (93.1%), and Transportation & Warehousing (85.0%).
| Industry | Male | Female |
| Agriculture, Fishing & Hunting | 85 (90.4%) | 9 (9.6%) |
| Mining, Quarrying, & Extraction | 3 (100.0%) | 0 (0.0%) |
| Construction | 71 (100.0%) | 0 (0.0%) |
| Manufacturing | 27 (71.1%) | 11 (28.9%) |
| Wholesale Trade | 4 (100.0%) | 0 (0.0%) |
| Retail Trade | 21 (52.5%) | 19 (47.5%) |
| Transportation & Warehousing | 12 (15.0%) | 68 (85.0%) |
| Utilities | 29 (80.6%) | 7 (19.4%) |
| Information | 0 (0.0%) | 0 (0.0%) |
| Finance & Insurance | 19 (57.6%) | 14 (42.4%) |
| Real Estate, Rental & Leasing | 1 (100.0%) | 0 (0.0%) |
| Professional & Scientific | 4 (6.9%) | 54 (93.1%) |
| Enterprise Management | 0 (0.0%) | 0 (0.0%) |
| Administrative & Support | 60 (100.0%) | 0 (0.0%) |
| Educational Services | 26 (20.6%) | 100 (79.4%) |
| Health Care & Social Assistance | 9 (6.9%) | 121 (93.1%) |
| Arts, Entertainment & Recreation | 24 (100.0%) | 0 (0.0%) |
| Accommodation & Food Services | 19 (33.9%) | 37 (66.1%) |
| Public Administration | 11 (32.4%) | 23 (67.6%) |
| Total | 455 (46.6%) | 521 (53.4%) |
Education in Wellington
School Enrollment in Wellington
The most common levels of schooling among the 695 students in Wellington are elementary school (217 | 31.2%), middle school (177 | 25.5%), and high school (126 | 18.1%).
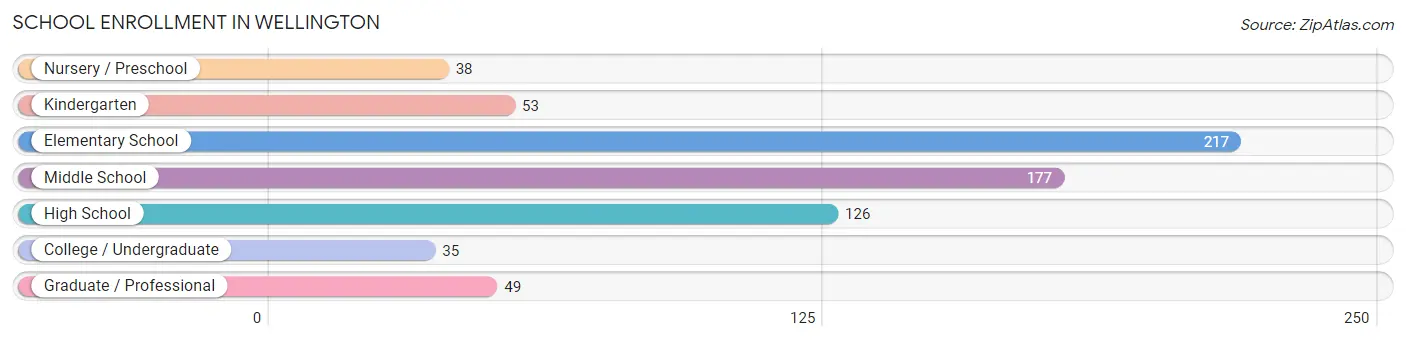
| School Level | # Students | % Students |
| Nursery / Preschool | 38 | 5.5% |
| Kindergarten | 53 | 7.6% |
| Elementary School | 217 | 31.2% |
| Middle School | 177 | 25.5% |
| High School | 126 | 18.1% |
| College / Undergraduate | 35 | 5.0% |
| Graduate / Professional | 49 | 7.0% |
| Total | 695 | 100.0% |
School Enrollment by Age by Funding Source in Wellington
Out of a total of 695 students who are enrolled in schools in Wellington, 19 (2.7%) attend a private institution, while the remaining 676 (97.3%) are enrolled in public schools. The age group of 35 years and over has the highest likelihood of being enrolled in private schools, with 13 (20.3% in the age bracket) enrolled. Conversely, the age group of 10 to 14 year olds has the lowest likelihood of being enrolled in a private school, with 232 (100.0% in the age bracket) attending a public institution.
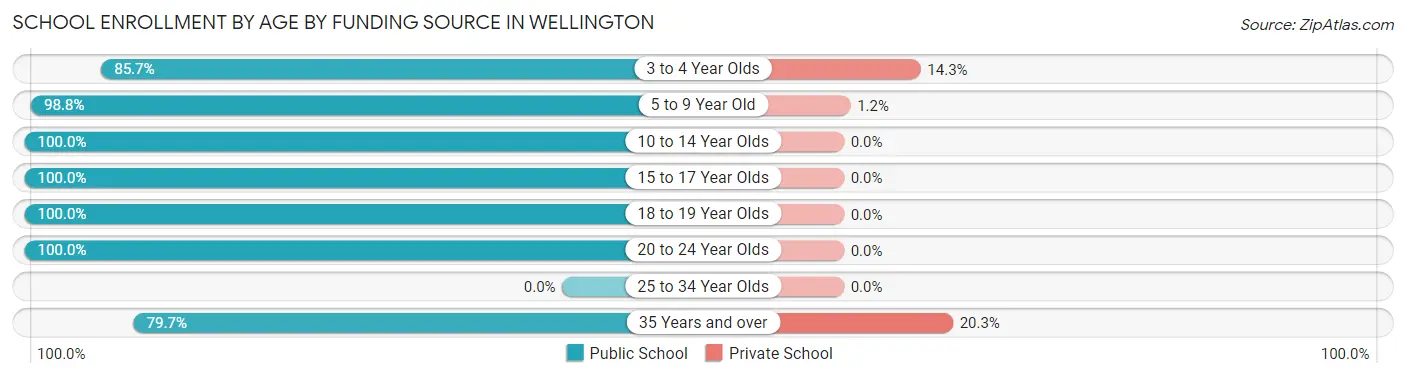
| Age Bracket | Public School | Private School |
| 3 to 4 Year Olds | 18 (85.7%) | 3 (14.3%) |
| 5 to 9 Year Old | 243 (98.8%) | 3 (1.2%) |
| 10 to 14 Year Olds | 232 (100.0%) | 0 (0.0%) |
| 15 to 17 Year Olds | 57 (100.0%) | 0 (0.0%) |
| 18 to 19 Year Olds | 44 (100.0%) | 0 (0.0%) |
| 20 to 24 Year Olds | 31 (100.0%) | 0 (0.0%) |
| 25 to 34 Year Olds | 0 (0.0%) | 0 (0.0%) |
| 35 Years and over | 51 (79.7%) | 13 (20.3%) |
| Total | 676 (97.3%) | 19 (2.7%) |
Educational Attainment by Field of Study in Wellington
Psychology (47 | 19.6%), social sciences (38 | 15.8%), science & technology (36 | 15.0%), education (33 | 13.8%), and literature & languages (26 | 10.8%) are the most common fields of study among 240 individuals in Wellington who have obtained a bachelor's degree or higher.
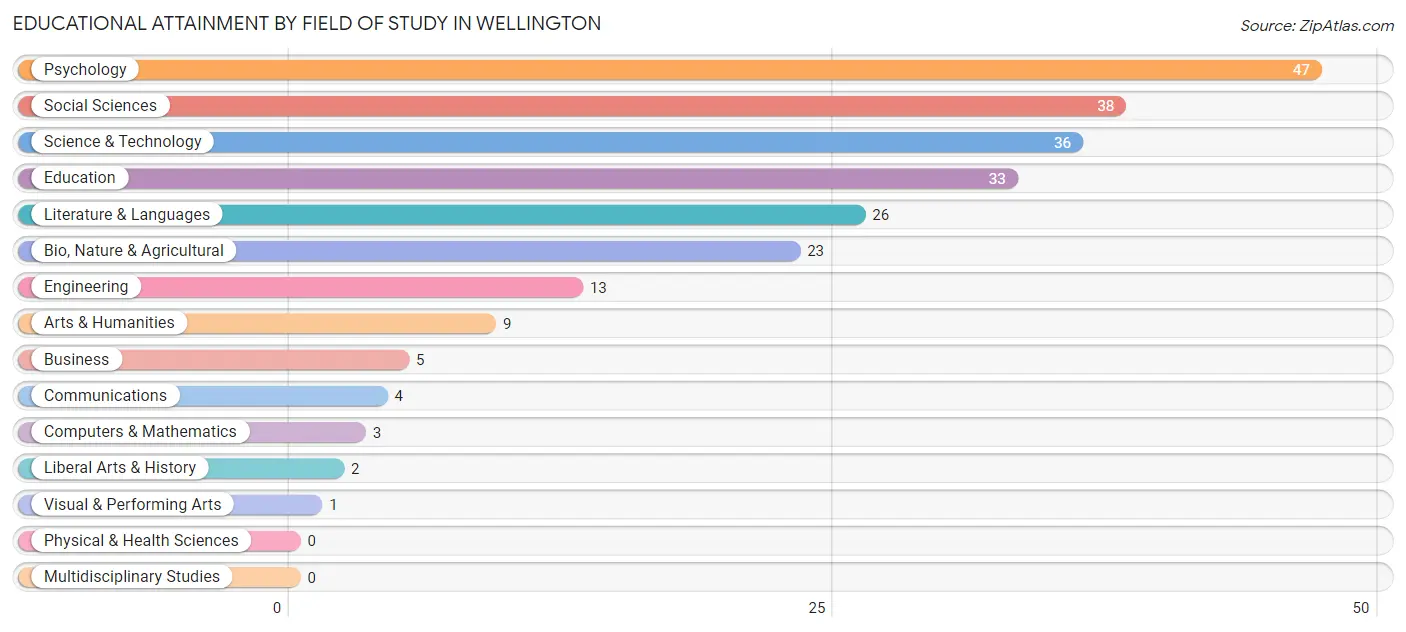
| Field of Study | # Graduates | % Graduates |
| Computers & Mathematics | 3 | 1.3% |
| Bio, Nature & Agricultural | 23 | 9.6% |
| Physical & Health Sciences | 0 | 0.0% |
| Psychology | 47 | 19.6% |
| Social Sciences | 38 | 15.8% |
| Engineering | 13 | 5.4% |
| Multidisciplinary Studies | 0 | 0.0% |
| Science & Technology | 36 | 15.0% |
| Business | 5 | 2.1% |
| Education | 33 | 13.8% |
| Literature & Languages | 26 | 10.8% |
| Liberal Arts & History | 2 | 0.8% |
| Visual & Performing Arts | 1 | 0.4% |
| Communications | 4 | 1.7% |
| Arts & Humanities | 9 | 3.7% |
| Total | 240 | 100.0% |
Transportation & Commute in Wellington
Vehicle Availability by Sex in Wellington
The most prevalent vehicle ownership categories in Wellington are males with 2 vehicles (249, accounting for 54.7%) and females with 2 vehicles (153, making up 57.5%).
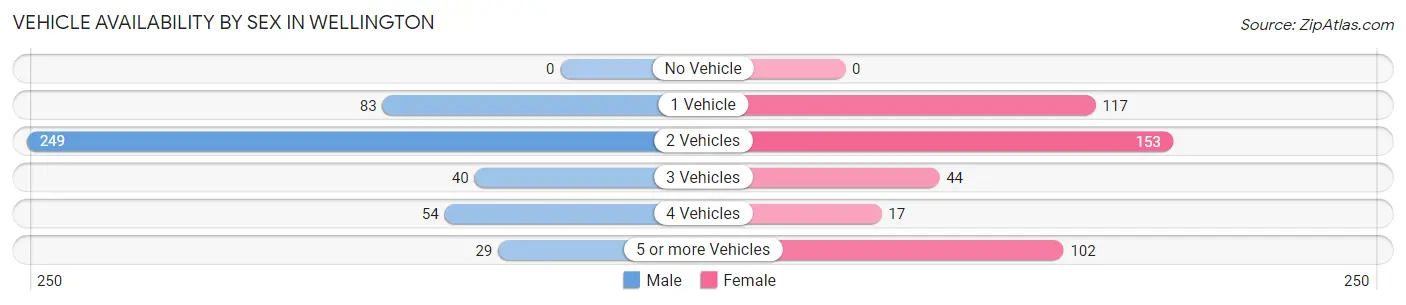
| Vehicles Available | Male | Female |
| No Vehicle | 0 (0.0%) | 0 (0.0%) |
| 1 Vehicle | 83 (18.2%) | 117 (27.0%) |
| 2 Vehicles | 249 (54.7%) | 153 (35.3%) |
| 3 Vehicles | 40 (8.8%) | 44 (10.2%) |
| 4 Vehicles | 54 (11.9%) | 17 (3.9%) |
| 5 or more Vehicles | 29 (6.4%) | 102 (23.6%) |
| Total | 455 (100.0%) | 433 (100.0%) |
Commute Time in Wellington
The most frequently occuring commute durations in Wellington are 5 to 9 minutes (299 commuters, 35.5%), less than 5 minutes (247 commuters, 29.3%), and 15 to 19 minutes (84 commuters, 10.0%).
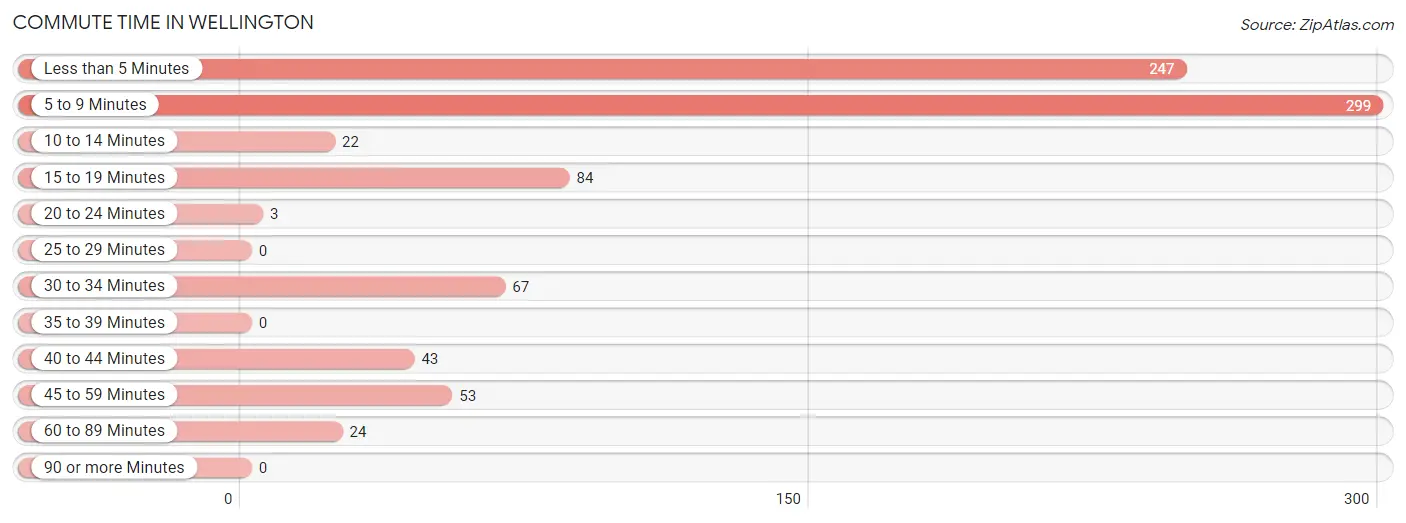
| Commute Time | # Commuters | % Commuters |
| Less than 5 Minutes | 247 | 29.3% |
| 5 to 9 Minutes | 299 | 35.5% |
| 10 to 14 Minutes | 22 | 2.6% |
| 15 to 19 Minutes | 84 | 10.0% |
| 20 to 24 Minutes | 3 | 0.4% |
| 25 to 29 Minutes | 0 | 0.0% |
| 30 to 34 Minutes | 67 | 8.0% |
| 35 to 39 Minutes | 0 | 0.0% |
| 40 to 44 Minutes | 43 | 5.1% |
| 45 to 59 Minutes | 53 | 6.3% |
| 60 to 89 Minutes | 24 | 2.9% |
| 90 or more Minutes | 0 | 0.0% |
Commute Time by Sex in Wellington
The most common commute times in Wellington are 5 to 9 minutes (122 commuters, 27.1%) for males and 5 to 9 minutes (177 commuters, 45.3%) for females.
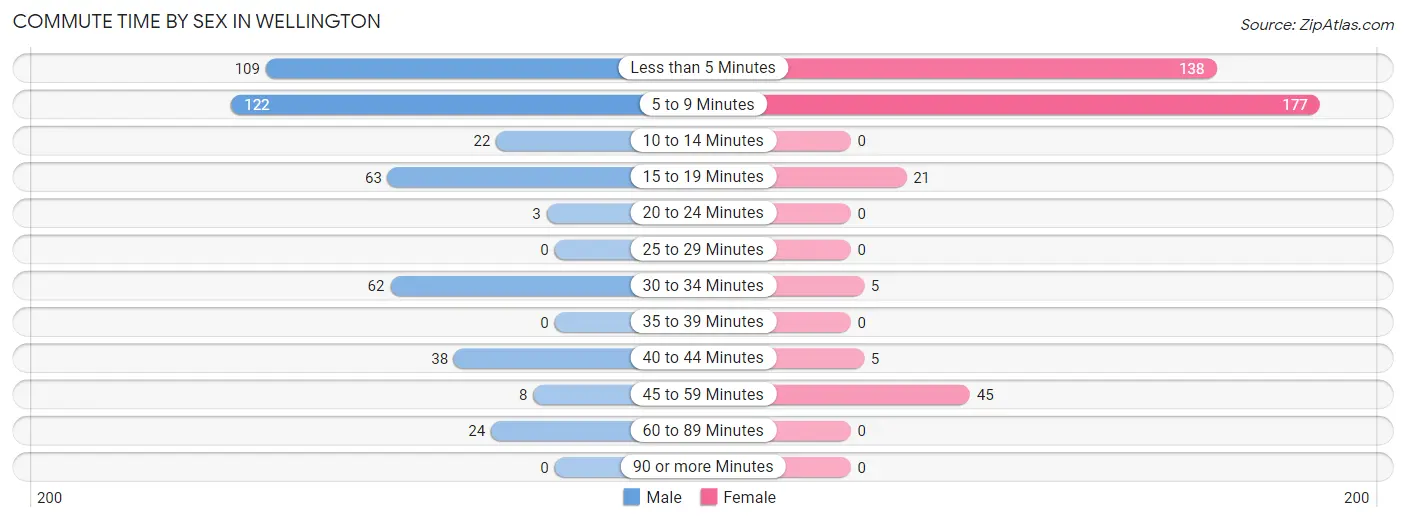
| Commute Time | Male | Female |
| Less than 5 Minutes | 109 (24.2%) | 138 (35.3%) |
| 5 to 9 Minutes | 122 (27.1%) | 177 (45.3%) |
| 10 to 14 Minutes | 22 (4.9%) | 0 (0.0%) |
| 15 to 19 Minutes | 63 (14.0%) | 21 (5.4%) |
| 20 to 24 Minutes | 3 (0.7%) | 0 (0.0%) |
| 25 to 29 Minutes | 0 (0.0%) | 0 (0.0%) |
| 30 to 34 Minutes | 62 (13.8%) | 5 (1.3%) |
| 35 to 39 Minutes | 0 (0.0%) | 0 (0.0%) |
| 40 to 44 Minutes | 38 (8.4%) | 5 (1.3%) |
| 45 to 59 Minutes | 8 (1.8%) | 45 (11.5%) |
| 60 to 89 Minutes | 24 (5.3%) | 0 (0.0%) |
| 90 or more Minutes | 0 (0.0%) | 0 (0.0%) |
Time of Departure to Work by Sex in Wellington
The most frequent times of departure to work in Wellington are 7:30 AM to 7:59 AM (98, 21.7%) for males and 9:00 AM to 9:59 AM (71, 18.2%) for females.
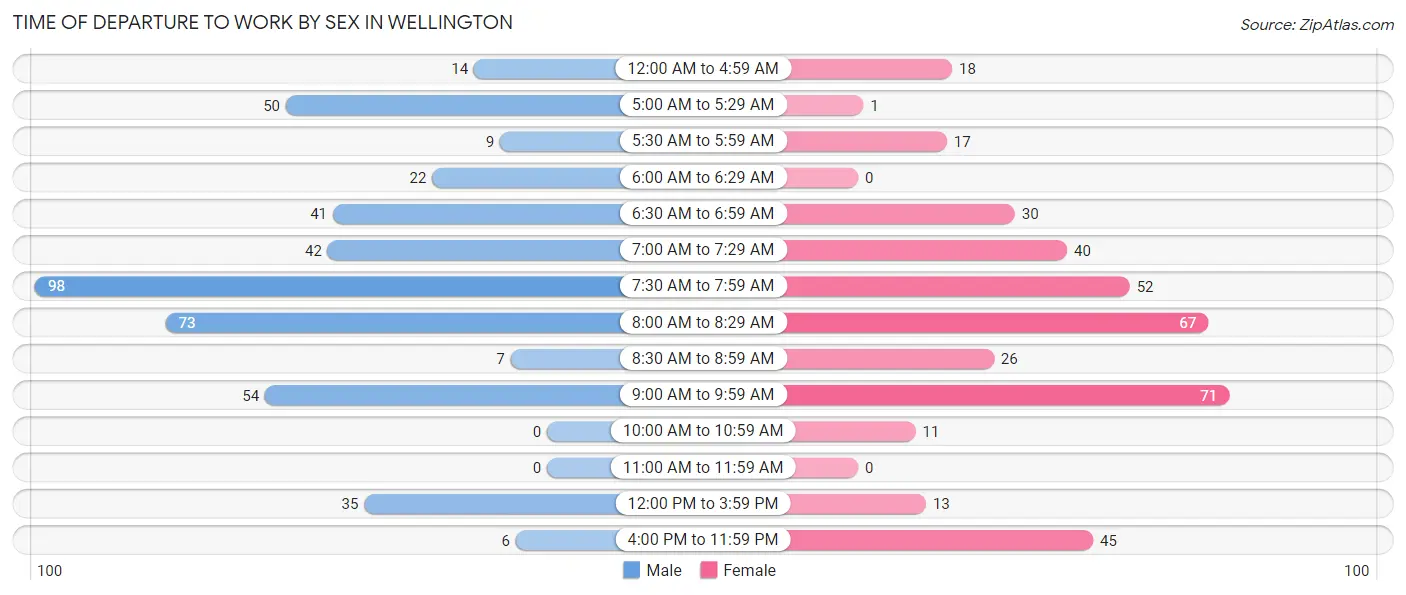
| Time of Departure | Male | Female |
| 12:00 AM to 4:59 AM | 14 (3.1%) | 18 (4.6%) |
| 5:00 AM to 5:29 AM | 50 (11.1%) | 1 (0.3%) |
| 5:30 AM to 5:59 AM | 9 (2.0%) | 17 (4.3%) |
| 6:00 AM to 6:29 AM | 22 (4.9%) | 0 (0.0%) |
| 6:30 AM to 6:59 AM | 41 (9.1%) | 30 (7.7%) |
| 7:00 AM to 7:29 AM | 42 (9.3%) | 40 (10.2%) |
| 7:30 AM to 7:59 AM | 98 (21.7%) | 52 (13.3%) |
| 8:00 AM to 8:29 AM | 73 (16.2%) | 67 (17.1%) |
| 8:30 AM to 8:59 AM | 7 (1.5%) | 26 (6.7%) |
| 9:00 AM to 9:59 AM | 54 (12.0%) | 71 (18.2%) |
| 10:00 AM to 10:59 AM | 0 (0.0%) | 11 (2.8%) |
| 11:00 AM to 11:59 AM | 0 (0.0%) | 0 (0.0%) |
| 12:00 PM to 3:59 PM | 35 (7.8%) | 13 (3.3%) |
| 4:00 PM to 11:59 PM | 6 (1.3%) | 45 (11.5%) |
| Total | 451 (100.0%) | 391 (100.0%) |
Housing Occupancy in Wellington
Occupancy by Ownership in Wellington
Of the total 790 dwellings in Wellington, owner-occupied units account for 584 (73.9%), while renter-occupied units make up 206 (26.1%).
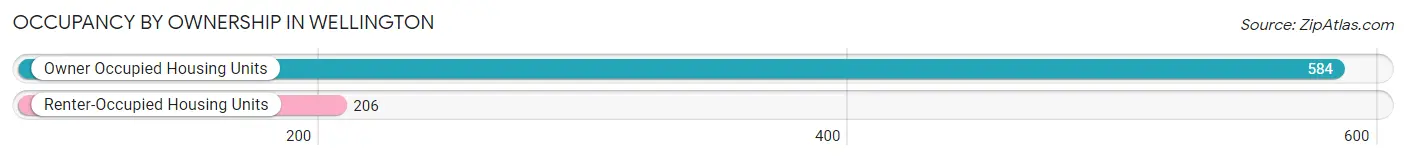
| Occupancy | # Housing Units | % Housing Units |
| Owner Occupied Housing Units | 584 | 73.9% |
| Renter-Occupied Housing Units | 206 | 26.1% |
| Total Occupied Housing Units | 790 | 100.0% |
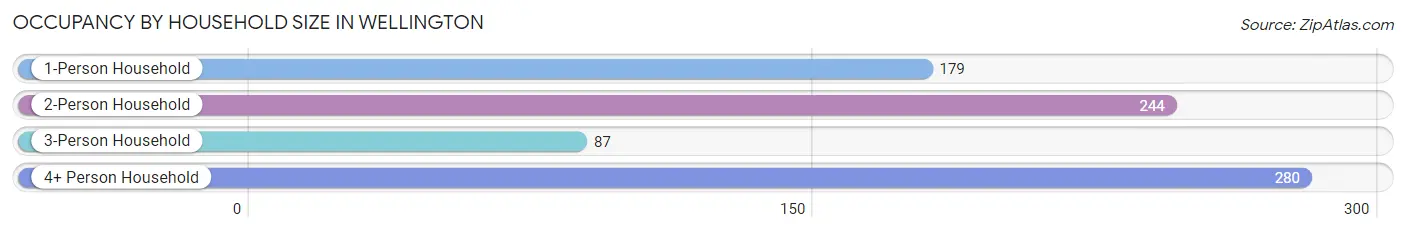
Occupancy by Household Size in Wellington
| Household Size | # Housing Units | % Housing Units |
| 1-Person Household | 179 | 22.7% |
| 2-Person Household | 244 | 30.9% |
| 3-Person Household | 87 | 11.0% |
| 4+ Person Household | 280 | 35.4% |
| Total Housing Units | 790 | 100.0% |
Occupancy by Ownership by Household Size in Wellington
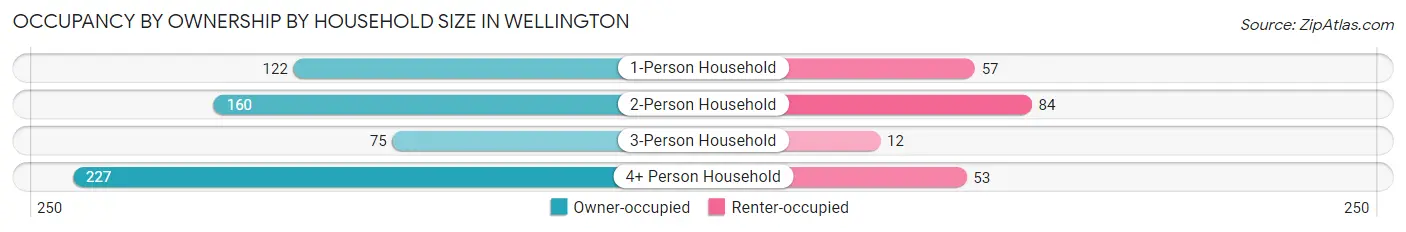
| Household Size | Owner-occupied | Renter-occupied |
| 1-Person Household | 122 (68.2%) | 57 (31.8%) |
| 2-Person Household | 160 (65.6%) | 84 (34.4%) |
| 3-Person Household | 75 (86.2%) | 12 (13.8%) |
| 4+ Person Household | 227 (81.1%) | 53 (18.9%) |
| Total Housing Units | 584 (73.9%) | 206 (26.1%) |
Occupancy by Educational Attainment in Wellington
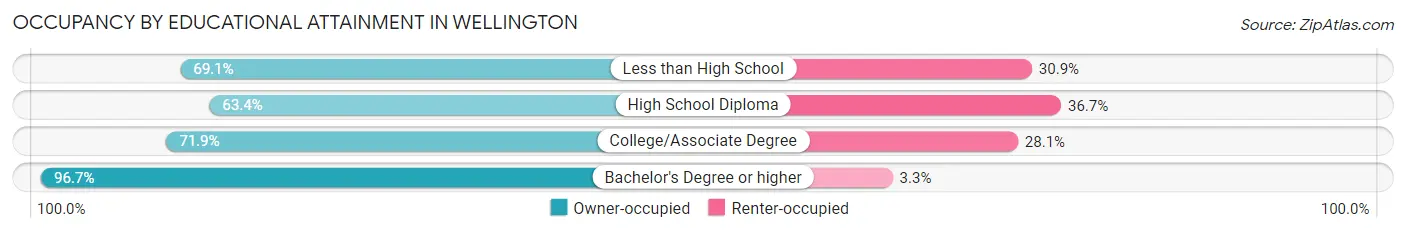
| Household Size | Owner-occupied | Renter-occupied |
| Less than High School | 141 (69.1%) | 63 (30.9%) |
| High School Diploma | 121 (63.3%) | 70 (36.6%) |
| College/Associate Degree | 174 (71.9%) | 68 (28.1%) |
| Bachelor's Degree or higher | 148 (96.7%) | 5 (3.3%) |
Occupancy by Age of Householder in Wellington
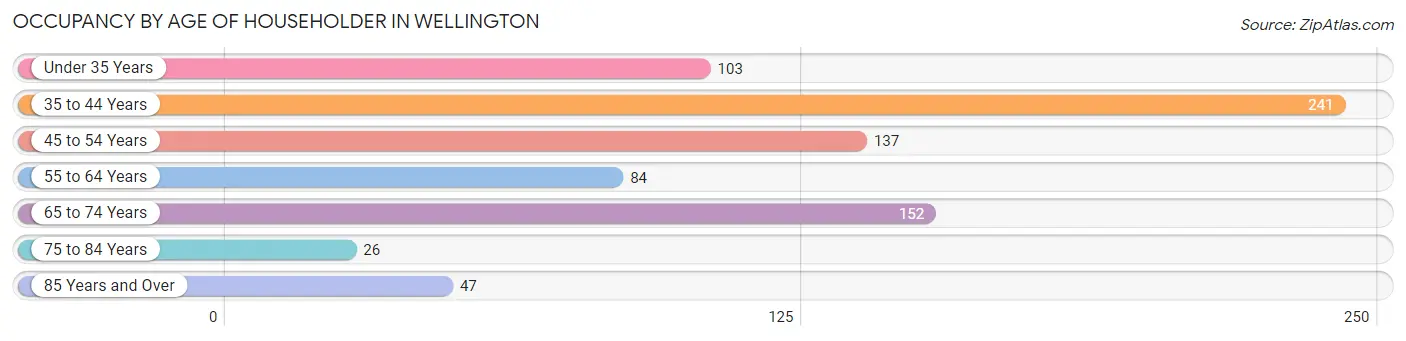
| Age Bracket | # Households | % Households |
| Under 35 Years | 103 | 13.0% |
| 35 to 44 Years | 241 | 30.5% |
| 45 to 54 Years | 137 | 17.3% |
| 55 to 64 Years | 84 | 10.6% |
| 65 to 74 Years | 152 | 19.2% |
| 75 to 84 Years | 26 | 3.3% |
| 85 Years and Over | 47 | 5.9% |
| Total | 790 | 100.0% |
Housing Finances in Wellington
Median Income by Occupancy in Wellington
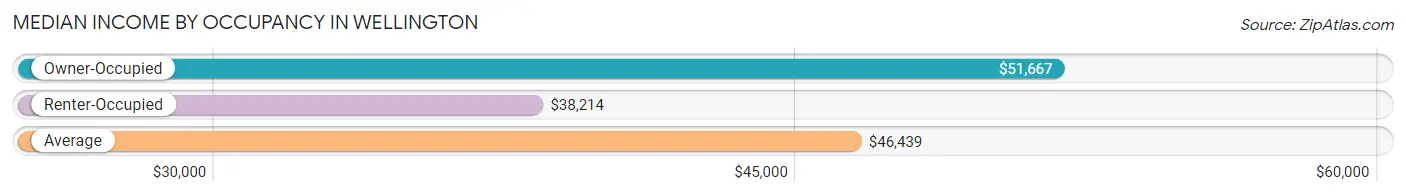
| Occupancy Type | # Households | Median Income |
| Owner-Occupied | 584 (73.9%) | $51,667 |
| Renter-Occupied | 206 (26.1%) | $38,214 |
| Average | 790 (100.0%) | $46,439 |
Occupancy by Householder Income Bracket in Wellington
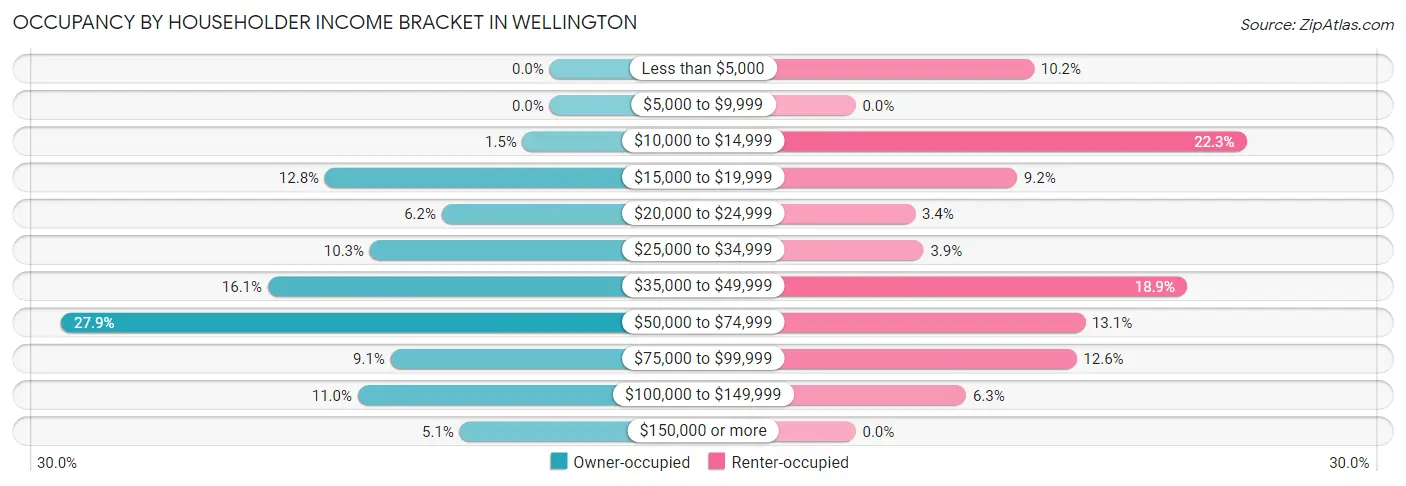
| Income Bracket | Owner-occupied | Renter-occupied |
| Less than $5,000 | 0 (0.0%) | 21 (10.2%) |
| $5,000 to $9,999 | 0 (0.0%) | 0 (0.0%) |
| $10,000 to $14,999 | 9 (1.5%) | 46 (22.3%) |
| $15,000 to $19,999 | 75 (12.8%) | 19 (9.2%) |
| $20,000 to $24,999 | 36 (6.2%) | 7 (3.4%) |
| $25,000 to $34,999 | 60 (10.3%) | 8 (3.9%) |
| $35,000 to $49,999 | 94 (16.1%) | 39 (18.9%) |
| $50,000 to $74,999 | 163 (27.9%) | 27 (13.1%) |
| $75,000 to $99,999 | 53 (9.1%) | 26 (12.6%) |
| $100,000 to $149,999 | 64 (11.0%) | 13 (6.3%) |
| $150,000 or more | 30 (5.1%) | 0 (0.0%) |
| Total | 584 (100.0%) | 206 (100.0%) |
Monthly Housing Cost Tiers in Wellington
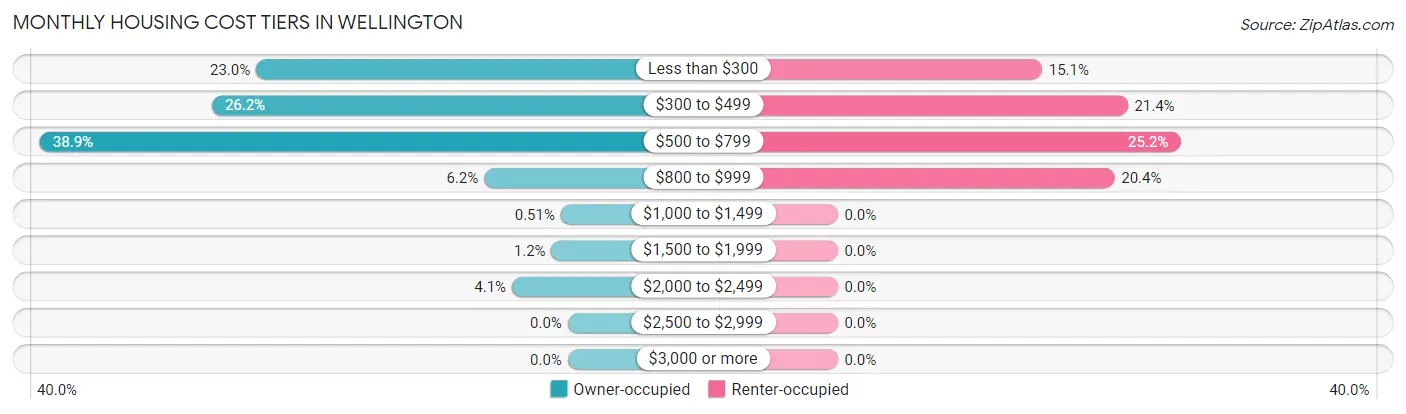
| Monthly Cost | Owner-occupied | Renter-occupied |
| Less than $300 | 134 (23.0%) | 31 (15.0%) |
| $300 to $499 | 153 (26.2%) | 44 (21.4%) |
| $500 to $799 | 227 (38.9%) | 52 (25.2%) |
| $800 to $999 | 36 (6.2%) | 42 (20.4%) |
| $1,000 to $1,499 | 3 (0.5%) | 0 (0.0%) |
| $1,500 to $1,999 | 7 (1.2%) | 0 (0.0%) |
| $2,000 to $2,499 | 24 (4.1%) | 0 (0.0%) |
| $2,500 to $2,999 | 0 (0.0%) | 0 (0.0%) |
| $3,000 or more | 0 (0.0%) | 0 (0.0%) |
| Total | 584 (100.0%) | 206 (100.0%) |
Physical Housing Characteristics in Wellington
Housing Structures in Wellington
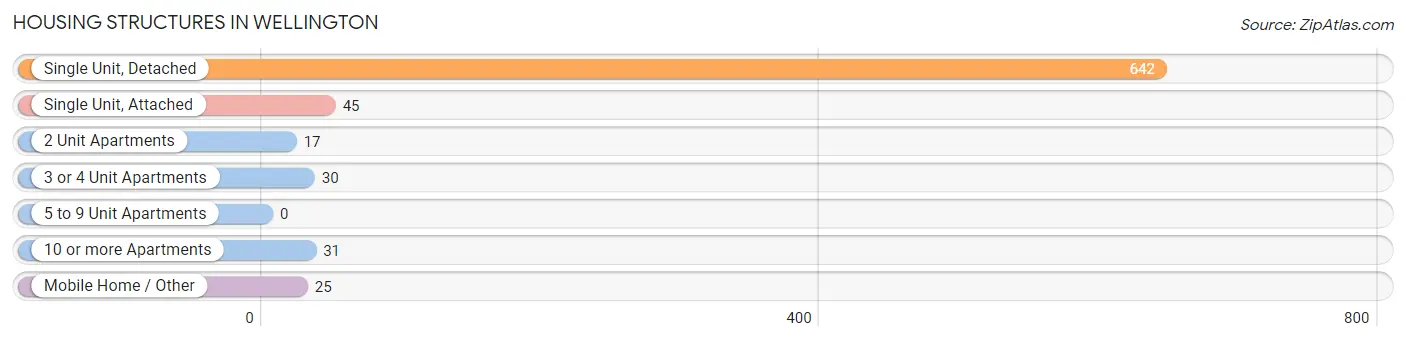
| Structure Type | # Housing Units | % Housing Units |
| Single Unit, Detached | 642 | 81.3% |
| Single Unit, Attached | 45 | 5.7% |
| 2 Unit Apartments | 17 | 2.1% |
| 3 or 4 Unit Apartments | 30 | 3.8% |
| 5 to 9 Unit Apartments | 0 | 0.0% |
| 10 or more Apartments | 31 | 3.9% |
| Mobile Home / Other | 25 | 3.2% |
| Total | 790 | 100.0% |
Housing Structures by Occupancy in Wellington
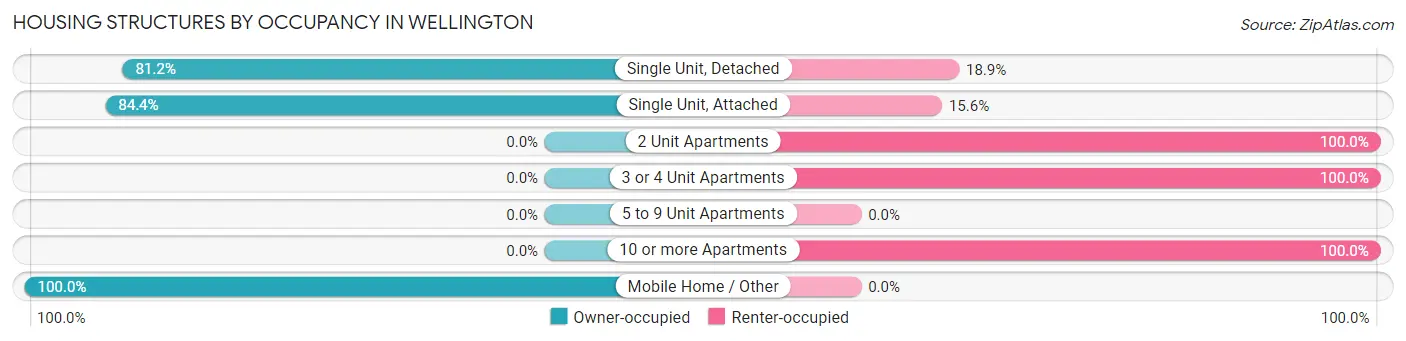
| Structure Type | Owner-occupied | Renter-occupied |
| Single Unit, Detached | 521 (81.1%) | 121 (18.9%) |
| Single Unit, Attached | 38 (84.4%) | 7 (15.6%) |
| 2 Unit Apartments | 0 (0.0%) | 17 (100.0%) |
| 3 or 4 Unit Apartments | 0 (0.0%) | 30 (100.0%) |
| 5 to 9 Unit Apartments | 0 (0.0%) | 0 (0.0%) |
| 10 or more Apartments | 0 (0.0%) | 31 (100.0%) |
| Mobile Home / Other | 25 (100.0%) | 0 (0.0%) |
| Total | 584 (73.9%) | 206 (26.1%) |
Housing Structures by Number of Rooms in Wellington
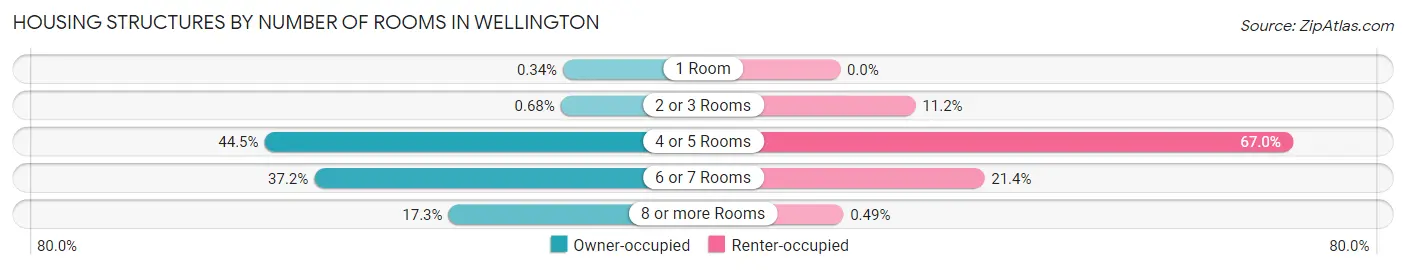
| Number of Rooms | Owner-occupied | Renter-occupied |
| 1 Room | 2 (0.3%) | 0 (0.0%) |
| 2 or 3 Rooms | 4 (0.7%) | 23 (11.2%) |
| 4 or 5 Rooms | 260 (44.5%) | 138 (67.0%) |
| 6 or 7 Rooms | 217 (37.2%) | 44 (21.4%) |
| 8 or more Rooms | 101 (17.3%) | 1 (0.5%) |
| Total | 584 (100.0%) | 206 (100.0%) |
Housing Structure by Heating Type in Wellington
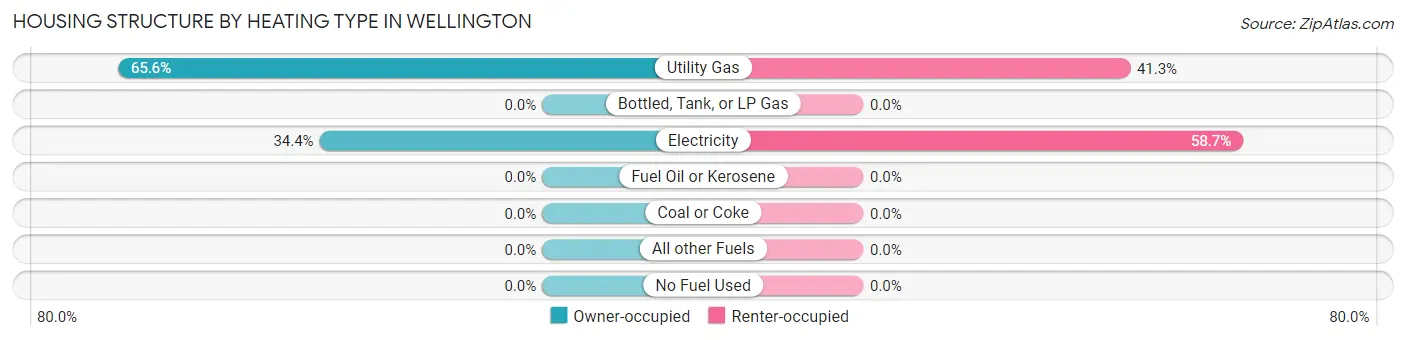
| Heating Type | Owner-occupied | Renter-occupied |
| Utility Gas | 383 (65.6%) | 85 (41.3%) |
| Bottled, Tank, or LP Gas | 0 (0.0%) | 0 (0.0%) |
| Electricity | 201 (34.4%) | 121 (58.7%) |
| Fuel Oil or Kerosene | 0 (0.0%) | 0 (0.0%) |
| Coal or Coke | 0 (0.0%) | 0 (0.0%) |
| All other Fuels | 0 (0.0%) | 0 (0.0%) |
| No Fuel Used | 0 (0.0%) | 0 (0.0%) |
| Total | 584 (100.0%) | 206 (100.0%) |
Household Vehicle Usage in Wellington
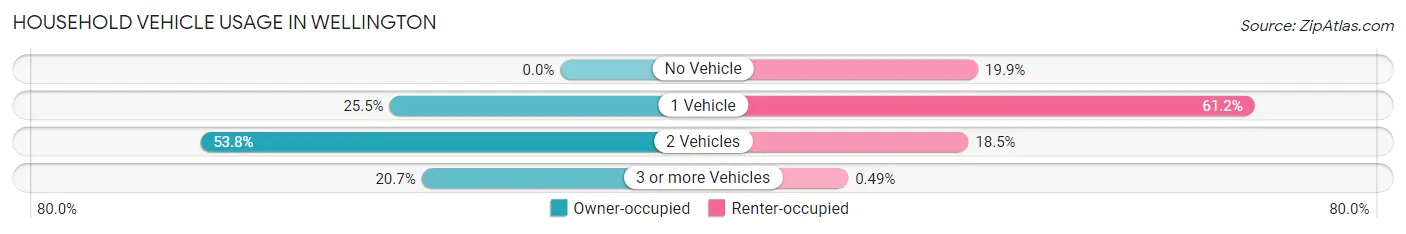
| Vehicles per Household | Owner-occupied | Renter-occupied |
| No Vehicle | 0 (0.0%) | 41 (19.9%) |
| 1 Vehicle | 149 (25.5%) | 126 (61.2%) |
| 2 Vehicles | 314 (53.8%) | 38 (18.4%) |
| 3 or more Vehicles | 121 (20.7%) | 1 (0.5%) |
| Total | 584 (100.0%) | 206 (100.0%) |
Real Estate & Mortgages in Wellington
Real Estate and Mortgage Overview in Wellington
| Characteristic | Without Mortgage | With Mortgage |
| Housing Units | 389 | 195 |
| Median Property Value | $91,700 | $69,300 |
| Median Household Income | $57,981 | $16 |
| Monthly Housing Costs | $360 | $0 |
| Real Estate Taxes | $1,149 | $0 |
Property Value by Mortgage Status in Wellington
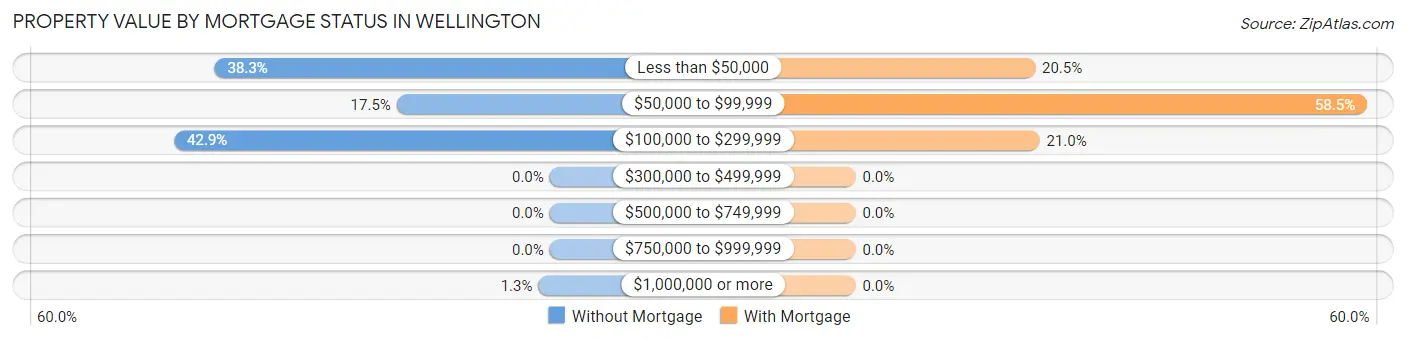
| Property Value | Without Mortgage | With Mortgage |
| Less than $50,000 | 149 (38.3%) | 40 (20.5%) |
| $50,000 to $99,999 | 68 (17.5%) | 114 (58.5%) |
| $100,000 to $299,999 | 167 (42.9%) | 41 (21.0%) |
| $300,000 to $499,999 | 0 (0.0%) | 0 (0.0%) |
| $500,000 to $749,999 | 0 (0.0%) | 0 (0.0%) |
| $750,000 to $999,999 | 0 (0.0%) | 0 (0.0%) |
| $1,000,000 or more | 5 (1.3%) | 0 (0.0%) |
| Total | 389 (100.0%) | 195 (100.0%) |
Household Income by Mortgage Status in Wellington
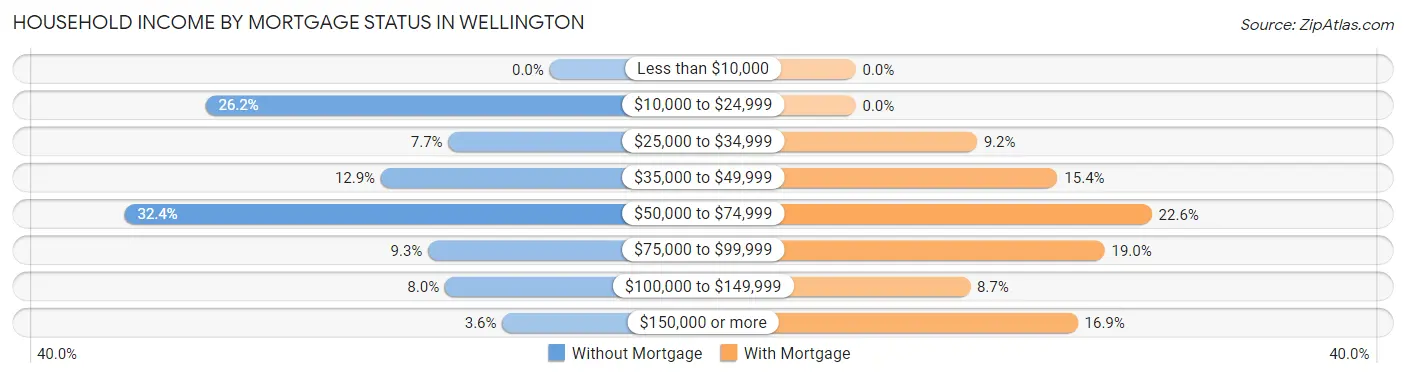
| Household Income | Without Mortgage | With Mortgage |
| Less than $10,000 | 0 (0.0%) | 0 (0.0%) |
| $10,000 to $24,999 | 102 (26.2%) | 0 (0.0%) |
| $25,000 to $34,999 | 30 (7.7%) | 18 (9.2%) |
| $35,000 to $49,999 | 50 (12.9%) | 30 (15.4%) |
| $50,000 to $74,999 | 126 (32.4%) | 44 (22.6%) |
| $75,000 to $99,999 | 36 (9.2%) | 37 (19.0%) |
| $100,000 to $149,999 | 31 (8.0%) | 17 (8.7%) |
| $150,000 or more | 14 (3.6%) | 33 (16.9%) |
| Total | 389 (100.0%) | 195 (100.0%) |
Property Value to Household Income Ratio in Wellington
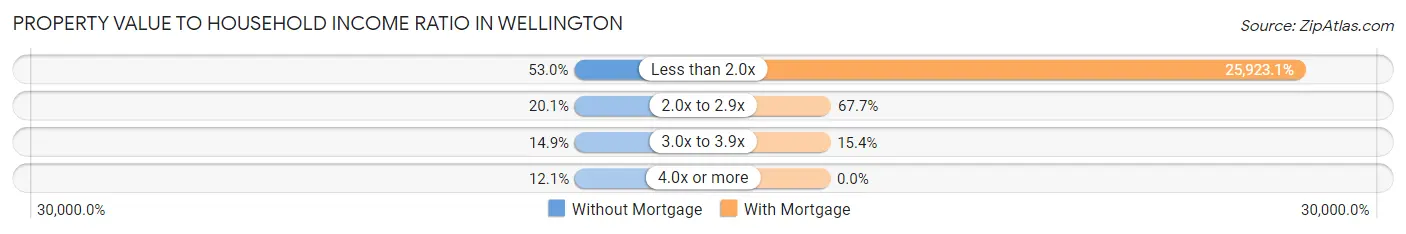
| Value-to-Income Ratio | Without Mortgage | With Mortgage |
| Less than 2.0x | 206 (53.0%) | 50,550 (25,923.1%) |
| 2.0x to 2.9x | 78 (20.1%) | 132 (67.7%) |
| 3.0x to 3.9x | 58 (14.9%) | 30 (15.4%) |
| 4.0x or more | 47 (12.1%) | 0 (0.0%) |
| Total | 389 (100.0%) | 195 (100.0%) |
Real Estate Taxes by Mortgage Status in Wellington
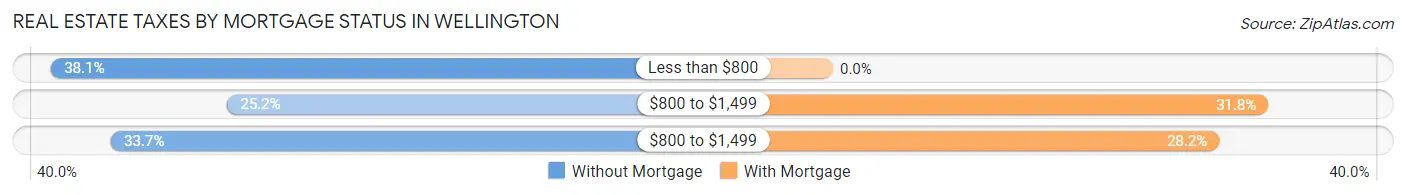
| Property Taxes | Without Mortgage | With Mortgage |
| Less than $800 | 148 (38.1%) | 0 (0.0%) |
| $800 to $1,499 | 98 (25.2%) | 62 (31.8%) |
| $800 to $1,499 | 131 (33.7%) | 55 (28.2%) |
| Total | 389 (100.0%) | 195 (100.0%) |
Health & Disability in Wellington
Health Insurance Coverage by Age in Wellington
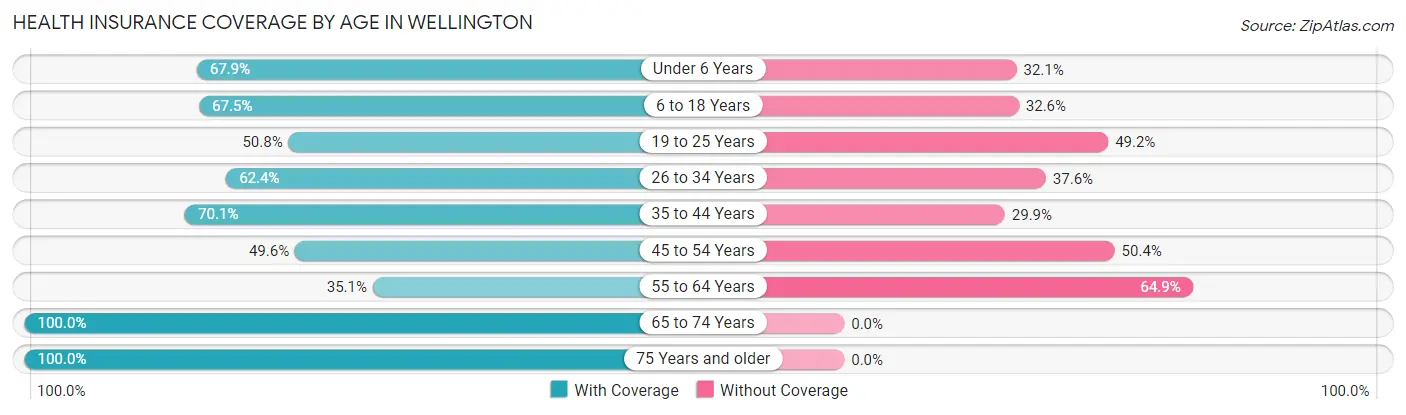
| Age Bracket | With Coverage | Without Coverage |
| Under 6 Years | 131 (67.9%) | 62 (32.1%) |
| 6 to 18 Years | 404 (67.4%) | 195 (32.6%) |
| 19 to 25 Years | 64 (50.8%) | 62 (49.2%) |
| 26 to 34 Years | 78 (62.4%) | 47 (37.6%) |
| 35 to 44 Years | 241 (70.1%) | 103 (29.9%) |
| 45 to 54 Years | 117 (49.6%) | 119 (50.4%) |
| 55 to 64 Years | 74 (35.1%) | 137 (64.9%) |
| 65 to 74 Years | 198 (100.0%) | 0 (0.0%) |
| 75 Years and older | 98 (100.0%) | 0 (0.0%) |
| Total | 1,405 (66.0%) | 725 (34.0%) |
Health Insurance Coverage by Citizenship Status in Wellington
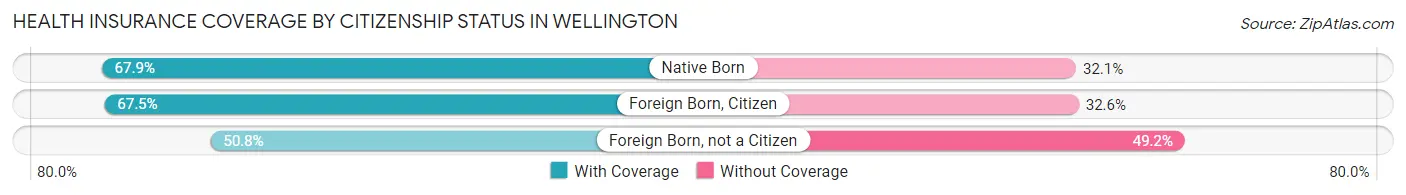
| Citizenship Status | With Coverage | Without Coverage |
| Native Born | 131 (67.9%) | 62 (32.1%) |
| Foreign Born, Citizen | 404 (67.4%) | 195 (32.6%) |
| Foreign Born, not a Citizen | 64 (50.8%) | 62 (49.2%) |
Health Insurance Coverage by Household Income in Wellington
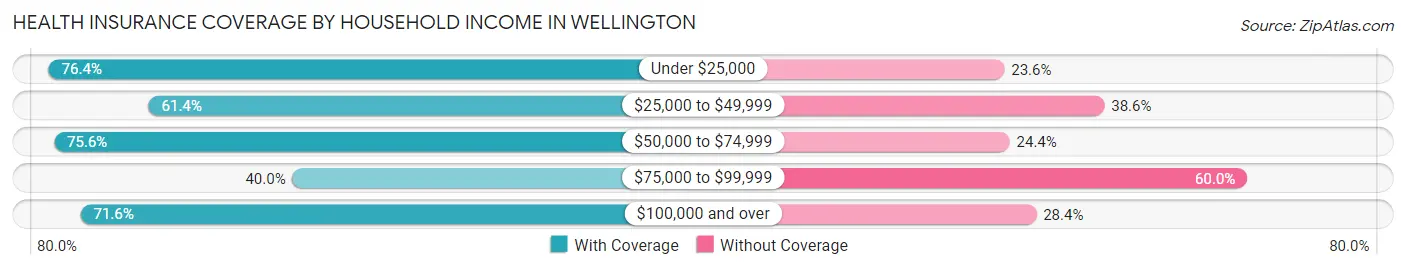
| Household Income | With Coverage | Without Coverage |
| Under $25,000 | 330 (76.4%) | 102 (23.6%) |
| $25,000 to $49,999 | 358 (61.4%) | 225 (38.6%) |
| $50,000 to $74,999 | 313 (75.6%) | 101 (24.4%) |
| $75,000 to $99,999 | 124 (40.0%) | 186 (60.0%) |
| $100,000 and over | 280 (71.6%) | 111 (28.4%) |
Public vs Private Health Insurance Coverage by Age in Wellington
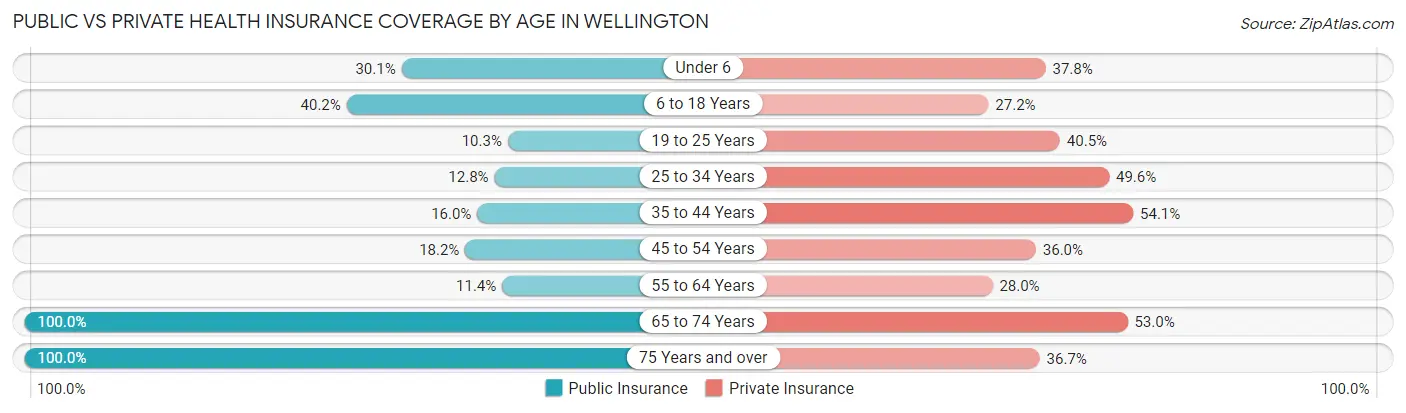
| Age Bracket | Public Insurance | Private Insurance |
| Under 6 | 58 (30.0%) | 73 (37.8%) |
| 6 to 18 Years | 241 (40.2%) | 163 (27.2%) |
| 19 to 25 Years | 13 (10.3%) | 51 (40.5%) |
| 25 to 34 Years | 16 (12.8%) | 62 (49.6%) |
| 35 to 44 Years | 55 (16.0%) | 186 (54.1%) |
| 45 to 54 Years | 43 (18.2%) | 85 (36.0%) |
| 55 to 64 Years | 24 (11.4%) | 59 (28.0%) |
| 65 to 74 Years | 198 (100.0%) | 105 (53.0%) |
| 75 Years and over | 98 (100.0%) | 36 (36.7%) |
| Total | 746 (35.0%) | 820 (38.5%) |
Disability Status by Sex by Age in Wellington
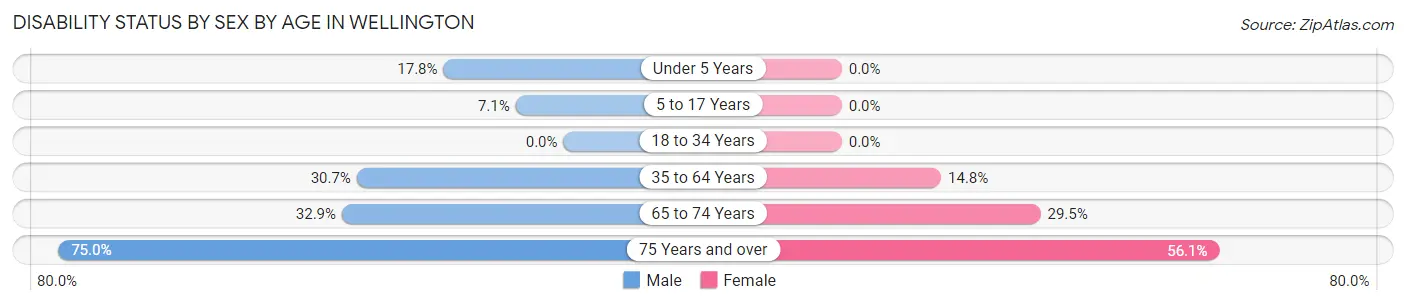
| Age Bracket | Male | Female |
| Under 5 Years | 18 (17.8%) | 0 (0.0%) |
| 5 to 17 Years | 24 (7.1%) | 0 (0.0%) |
| 18 to 34 Years | 0 (0.0%) | 0 (0.0%) |
| 35 to 64 Years | 120 (30.7%) | 59 (14.7%) |
| 65 to 74 Years | 25 (32.9%) | 36 (29.5%) |
| 75 Years and over | 24 (75.0%) | 37 (56.1%) |
Disability Class by Sex by Age in Wellington
Disability Class: Hearing Difficulty
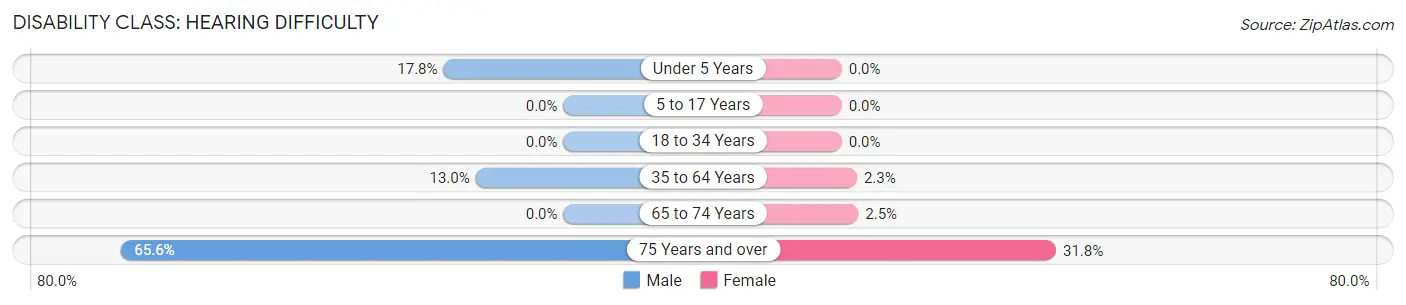
| Age Bracket | Male | Female |
| Under 5 Years | 18 (17.8%) | 0 (0.0%) |
| 5 to 17 Years | 0 (0.0%) | 0 (0.0%) |
| 18 to 34 Years | 0 (0.0%) | 0 (0.0%) |
| 35 to 64 Years | 51 (13.0%) | 9 (2.2%) |
| 65 to 74 Years | 0 (0.0%) | 3 (2.5%) |
| 75 Years and over | 21 (65.6%) | 21 (31.8%) |
Disability Class: Vision Difficulty
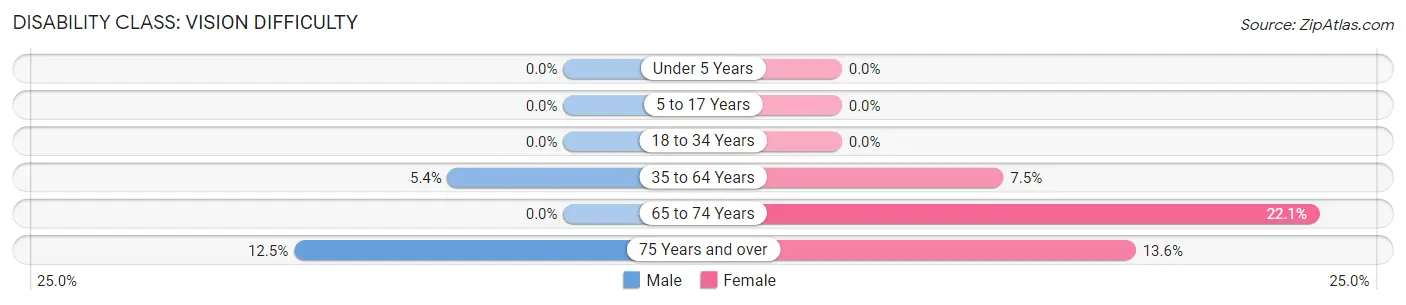
| Age Bracket | Male | Female |
| Under 5 Years | 0 (0.0%) | 0 (0.0%) |
| 5 to 17 Years | 0 (0.0%) | 0 (0.0%) |
| 18 to 34 Years | 0 (0.0%) | 0 (0.0%) |
| 35 to 64 Years | 21 (5.4%) | 30 (7.5%) |
| 65 to 74 Years | 0 (0.0%) | 27 (22.1%) |
| 75 Years and over | 4 (12.5%) | 9 (13.6%) |
Disability Class: Cognitive Difficulty
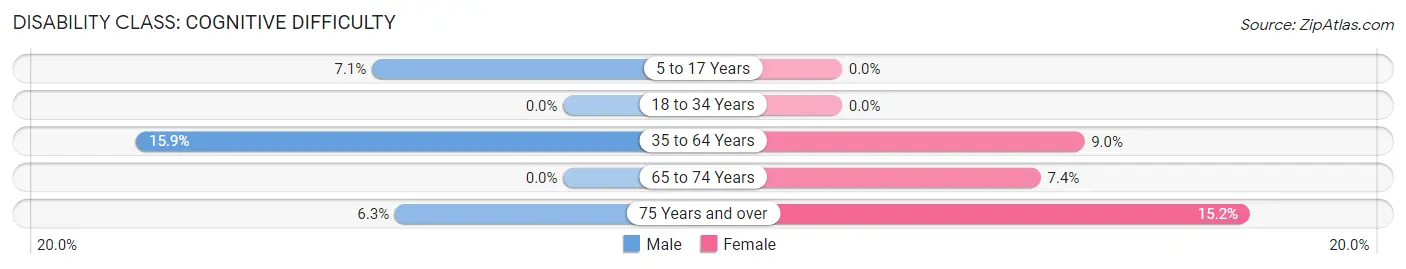
| Age Bracket | Male | Female |
| 5 to 17 Years | 24 (7.1%) | 0 (0.0%) |
| 18 to 34 Years | 0 (0.0%) | 0 (0.0%) |
| 35 to 64 Years | 62 (15.9%) | 36 (9.0%) |
| 65 to 74 Years | 0 (0.0%) | 9 (7.4%) |
| 75 Years and over | 2 (6.2%) | 10 (15.1%) |
Disability Class: Ambulatory Difficulty
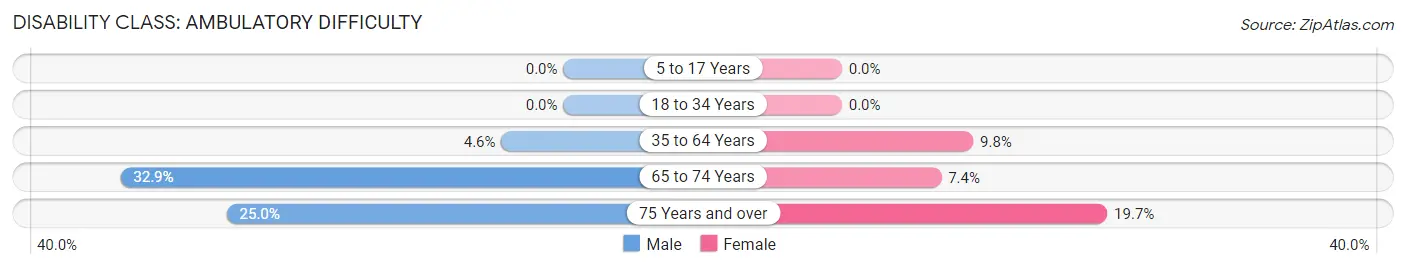
| Age Bracket | Male | Female |
| 5 to 17 Years | 0 (0.0%) | 0 (0.0%) |
| 18 to 34 Years | 0 (0.0%) | 0 (0.0%) |
| 35 to 64 Years | 18 (4.6%) | 39 (9.8%) |
| 65 to 74 Years | 25 (32.9%) | 9 (7.4%) |
| 75 Years and over | 8 (25.0%) | 13 (19.7%) |
Disability Class: Self-Care Difficulty
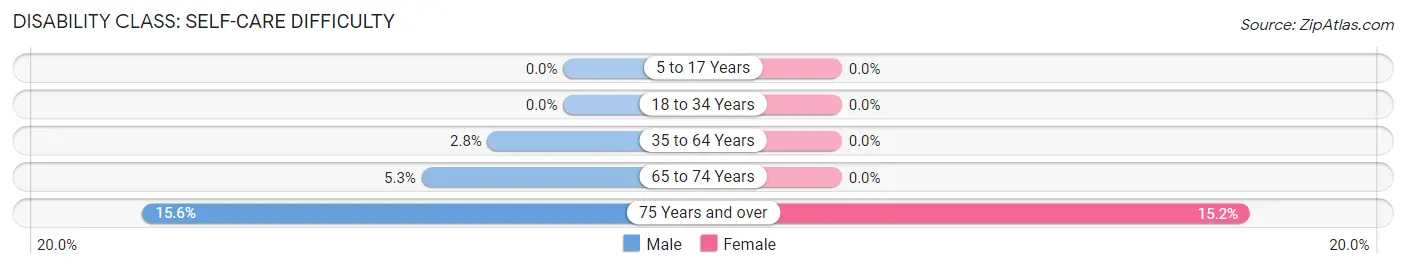
| Age Bracket | Male | Female |
| 5 to 17 Years | 0 (0.0%) | 0 (0.0%) |
| 18 to 34 Years | 0 (0.0%) | 0 (0.0%) |
| 35 to 64 Years | 11 (2.8%) | 0 (0.0%) |
| 65 to 74 Years | 4 (5.3%) | 0 (0.0%) |
| 75 Years and over | 5 (15.6%) | 10 (15.1%) |
Technology Access in Wellington
Computing Device Access in Wellington
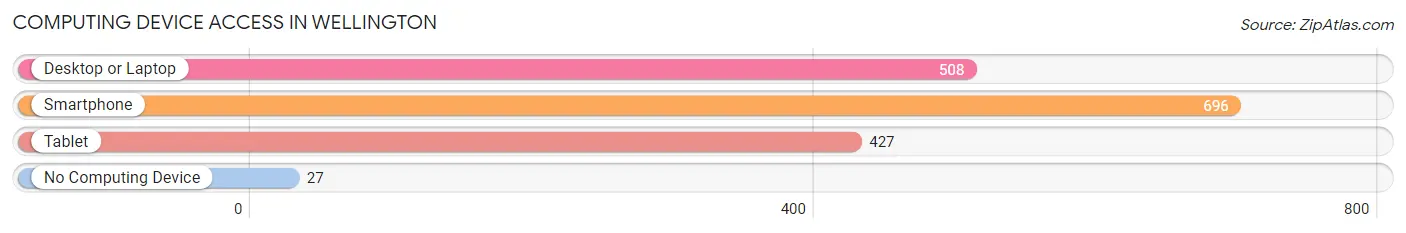
| Device Type | # Households | % Households |
| Desktop or Laptop | 508 | 64.3% |
| Smartphone | 696 | 88.1% |
| Tablet | 427 | 54.0% |
| No Computing Device | 27 | 3.4% |
| Total | 790 | 100.0% |
Internet Access in Wellington
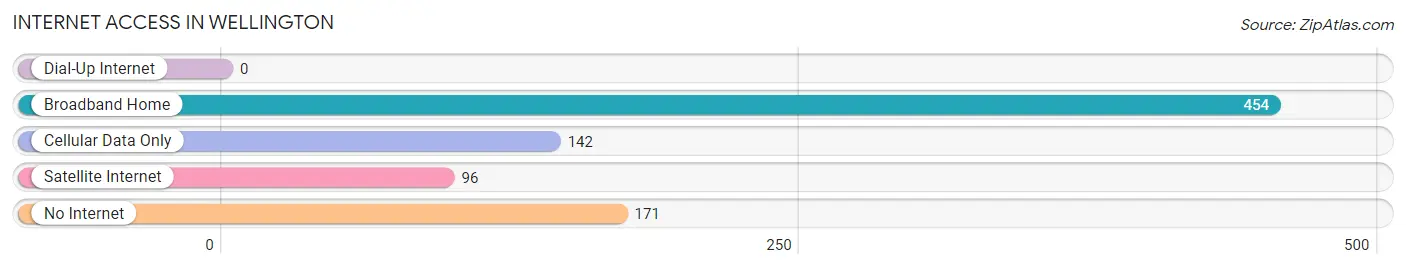
| Internet Type | # Households | % Households |
| Dial-Up Internet | 0 | 0.0% |
| Broadband Home | 454 | 57.5% |
| Cellular Data Only | 142 | 18.0% |
| Satellite Internet | 96 | 12.1% |
| No Internet | 171 | 21.6% |
| Total | 790 | 100.0% |
Wellington Summary
Wellington is a city located in Collingsworth County, Texas, United States. It is the county seat of Collingsworth County and is located on the banks of the Red River. The population was 2,275 at the 2010 census.
History
The area that is now Wellington was first settled in the late 1800s by ranchers and farmers. The town was originally known as "Wells Station" after the Wells family, who were among the first settlers in the area. In 1891, the town was renamed "Wellington" after the Duke of Wellington, a British military leader.
In 1892, the town was officially incorporated and the first post office was established. The town quickly grew and by 1900, the population had reached 1,000.
In the early 1900s, the town was a major shipping point for cattle and other livestock. The town also had a number of businesses, including a bank, a hotel, a newspaper, and a number of stores.
In the 1920s, the town was hit hard by the Great Depression and many of the businesses closed. The population declined and the town was nearly abandoned.
In the 1940s, the town began to recover and the population began to grow again. The town was also the site of a prisoner of war camp during World War II.
In the 1950s, the town continued to grow and the population reached 2,000. The town also had a number of businesses, including a movie theater, a bowling alley, and a number of stores.
In the 1960s, the town was hit hard by the oil bust and many of the businesses closed. The population declined and the town was nearly abandoned again.
In the 1970s, the town began to recover and the population began to grow again. The town also had a number of businesses, including a movie theater, a bowling alley, and a number of stores.
In the 1980s, the town continued to grow and the population reached 2,500. The town also had a number of businesses, including a movie theater, a bowling alley, and a number of stores.
In the 1990s, the town continued to grow and the population reached 2,700. The town also had a number of businesses, including a movie theater, a bowling alley, and a number of stores.
Geography
Wellington is located at the intersection of U.S. Route 83 and State Highway 203 in Collingsworth County, Texas. The town is situated on the banks of the Red River and is located approximately 25 miles south of the Oklahoma border.
The climate in Wellington is semi-arid, with hot summers and mild winters. The average annual temperature is 68°F and the average annual precipitation is 22 inches.
Economy
The economy of Wellington is largely based on agriculture and ranching. The town is home to a number of farms and ranches, as well as a number of businesses, including a movie theater, a bowling alley, and a number of stores.
The town is also home to a number of manufacturing companies, including a plastics manufacturer and a metal fabrication company.
Demographics
As of the 2010 census, the population of Wellington was 2,275. The racial makeup of the town was 79.3% White, 0.2% African American, 0.2% Native American, 0.2% Asian, 0.1% Pacific Islander, 18.7% from other races, and 1.5% from two or more races. Hispanic or Latino of any race were 33.2% of the population.
The median income for a household in the town was $30,000 and the median income for a family was $35,000. The per capita income for the town was $14,000. About 18.7% of families and 22.2% of the population were below the poverty line, including 28.3% of those under age 18 and 16.7% of those age 65 or over.
Common Questions
What is Per Capita Income in Wellington?
Per Capita income in Wellington is $27,050.
What is the Median Family Income in Wellington?
Median Family Income in Wellington is $51,802.
What is the Median Household income in Wellington?
Median Household Income in Wellington is $46,439.
What is Income or Wage Gap in Wellington?
Income or Wage Gap in Wellington is 35.4%.
Women in Wellington earn 64.6 cents for every dollar earned by a man.
What is Inequality or Gini Index in Wellington?
Inequality or Gini Index in Wellington is 0.52.
What is the Total Population of Wellington?
Total Population of Wellington is 2,201.
What is the Total Male Population of Wellington?
Total Male Population of Wellington is 1,085.
What is the Total Female Population of Wellington?
Total Female Population of Wellington is 1,116.
What is the Ratio of Males per 100 Females in Wellington?
There are 97.22 Males per 100 Females in Wellington.
What is the Ratio of Females per 100 Males in Wellington?
There are 102.86 Females per 100 Males in Wellington.
What is the Median Population Age in Wellington?
Median Population Age in Wellington is 36.5 Years.
What is the Average Family Size in Wellington
Average Family Size in Wellington is 3.2 People.
What is the Average Household Size in Wellington
Average Household Size in Wellington is 2.7 People.
How Large is the Labor Force in Wellington?
There are 1,002 People in the Labor Forcein in Wellington.
What is the Percentage of People in the Labor Force in Wellington?
65.9% of People are in the Labor Force in Wellington.
What is the Unemployment Rate in Wellington?
Unemployment Rate in Wellington is 2.7%.