Weinert, TX Map & Demographics
Weinert Map
Weinert Overview
$22,655
PER CAPITA INCOME
$68,542
AVG FAMILY INCOME
$45,893
AVG HOUSEHOLD INCOME
0.35
INEQUALITY / GINI INDEX
169
TOTAL POPULATION
75
MALE POPULATION
94
FEMALE POPULATION
79.79
MALES / 100 FEMALES
125.33
FEMALES / 100 MALES
46.2
MEDIAN AGE
3.3
AVG FAMILY SIZE
2.2
AVG HOUSEHOLD SIZE
78
LABOR FORCE [ PEOPLE ]
54.9%
PERCENT IN LABOR FORCE
5.1%
UNEMPLOYMENT RATE
Weinert Zip Codes
Weinert Area Codes
Income in Weinert
Income Overview in Weinert
Per Capita Income in Weinert is $22,655, while median incomes of families and households are $68,542 and $45,893 respectively.
| Characteristic | Number | Measure |
| Per Capita Income | 169 | $22,655 |
| Median Family Income | 39 | $68,542 |
| Mean Family Income | 39 | $62,977 |
| Median Household Income | 75 | $45,893 |
| Mean Household Income | 75 | $52,216 |
| Income Deficit | 39 | $0 |
| Wage / Income Gap (%) | 169 | 0.00% |
| Wage / Income Gap ($) | 169 | 100.00¢ per $1 |
| Gini / Inequality Index | 169 | 0.35 |
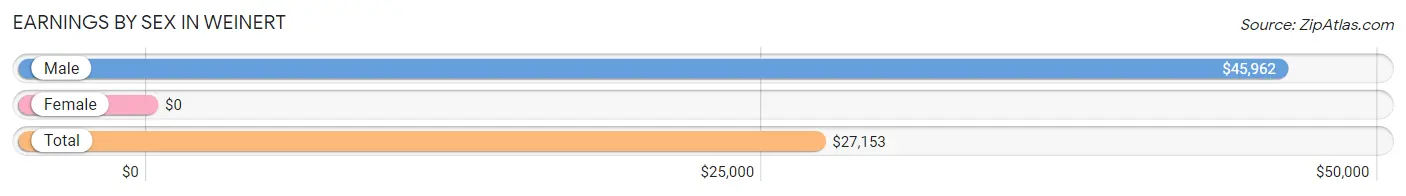
Earnings by Sex in Weinert
| Sex | Number | Average Earnings |
| Male | 38 (43.7%) | $45,962 |
| Female | 49 (56.3%) | $0 |
| Total | 87 (100.0%) | $27,153 |
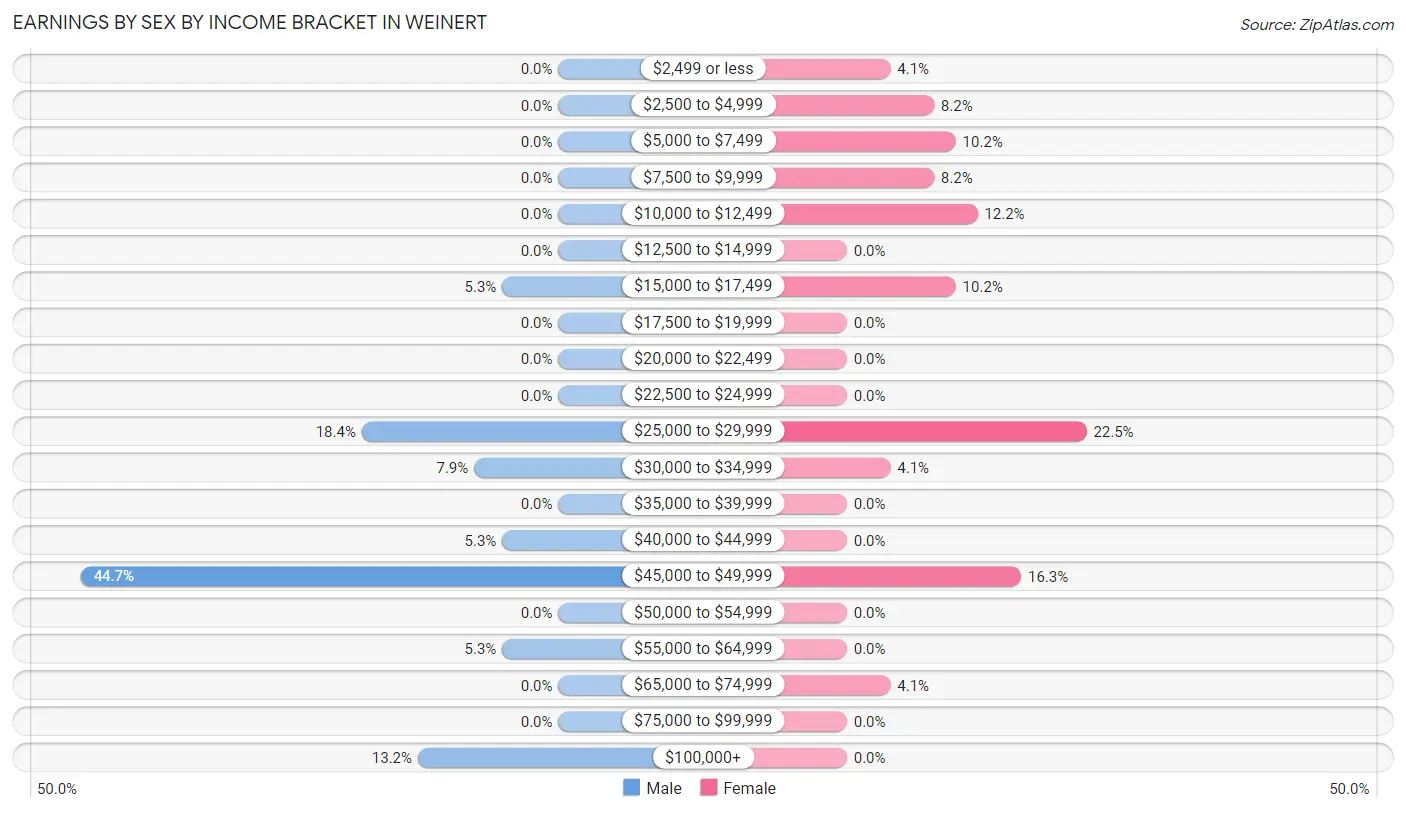
Earnings by Sex by Income Bracket in Weinert
The most common earnings brackets in Weinert are $45,000 to $49,999 for men (17 | 44.7%) and $25,000 to $29,999 for women (11 | 22.5%).
| Income | Male | Female |
| $2,499 or less | 0 (0.0%) | 2 (4.1%) |
| $2,500 to $4,999 | 0 (0.0%) | 4 (8.2%) |
| $5,000 to $7,499 | 0 (0.0%) | 5 (10.2%) |
| $7,500 to $9,999 | 0 (0.0%) | 4 (8.2%) |
| $10,000 to $12,499 | 0 (0.0%) | 6 (12.2%) |
| $12,500 to $14,999 | 0 (0.0%) | 0 (0.0%) |
| $15,000 to $17,499 | 2 (5.3%) | 5 (10.2%) |
| $17,500 to $19,999 | 0 (0.0%) | 0 (0.0%) |
| $20,000 to $22,499 | 0 (0.0%) | 0 (0.0%) |
| $22,500 to $24,999 | 0 (0.0%) | 0 (0.0%) |
| $25,000 to $29,999 | 7 (18.4%) | 11 (22.5%) |
| $30,000 to $34,999 | 3 (7.9%) | 2 (4.1%) |
| $35,000 to $39,999 | 0 (0.0%) | 0 (0.0%) |
| $40,000 to $44,999 | 2 (5.3%) | 0 (0.0%) |
| $45,000 to $49,999 | 17 (44.7%) | 8 (16.3%) |
| $50,000 to $54,999 | 0 (0.0%) | 0 (0.0%) |
| $55,000 to $64,999 | 2 (5.3%) | 0 (0.0%) |
| $65,000 to $74,999 | 0 (0.0%) | 2 (4.1%) |
| $75,000 to $99,999 | 0 (0.0%) | 0 (0.0%) |
| $100,000+ | 5 (13.2%) | 0 (0.0%) |
| Total | 38 (100.0%) | 49 (100.0%) |
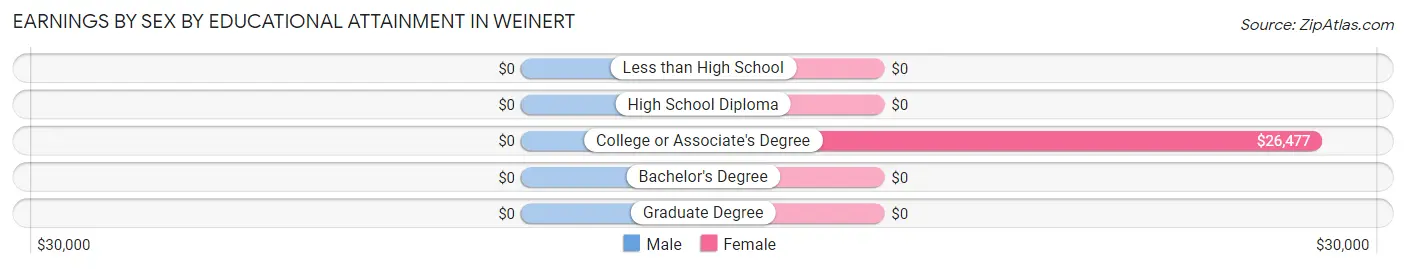
Earnings by Sex by Educational Attainment in Weinert
| Educational Attainment | Male Income | Female Income |
| Less than High School | - | - |
| High School Diploma | - | - |
| College or Associate's Degree | - | - |
| Bachelor's Degree | - | - |
| Graduate Degree | - | - |
| Total | $45,962 | $25,568 |
Family Income in Weinert
Family Income Brackets in Weinert
According to the Weinert family income data, there are 15 families falling into the $50,000 to $74,999 income range, which is the most common income bracket and makes up 38.5% of all families.
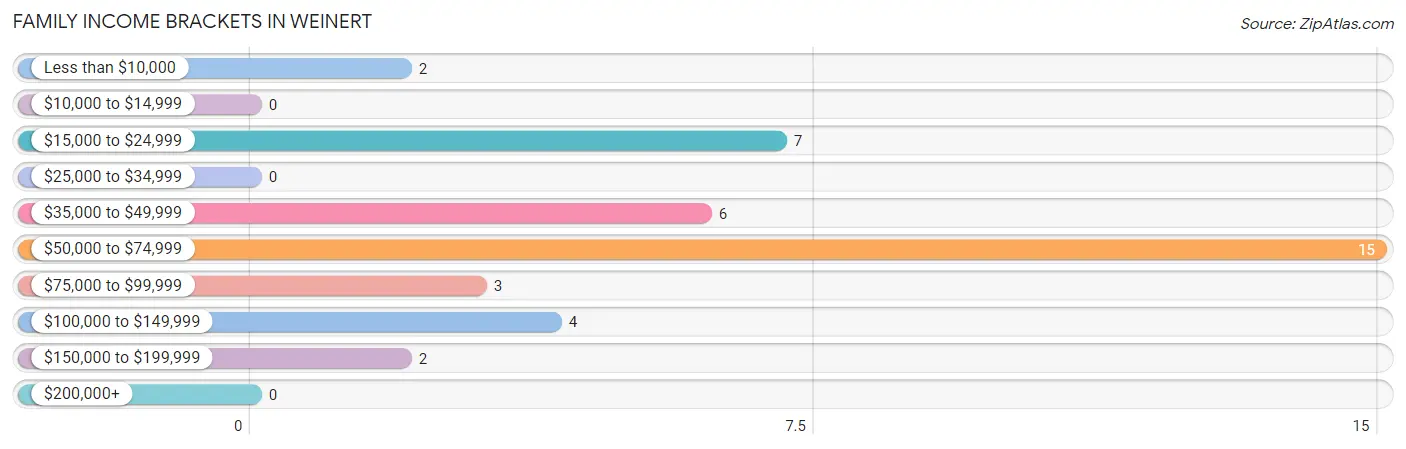
| Income Bracket | # Families | % Families |
| Less than $10,000 | 2 | 5.1% |
| $10,000 to $14,999 | 0 | 0.0% |
| $15,000 to $24,999 | 7 | 17.9% |
| $25,000 to $34,999 | 0 | 0.0% |
| $35,000 to $49,999 | 6 | 15.4% |
| $50,000 to $74,999 | 15 | 38.5% |
| $75,000 to $99,999 | 3 | 7.7% |
| $100,000 to $149,999 | 4 | 10.3% |
| $150,000 to $199,999 | 2 | 5.1% |
| $200,000+ | 0 | 0.0% |
Family Income by Famaliy Size in Weinert
3-person families (24 | 61.5%) account for the highest median family income in Weinert with $69,167 per family, while 3-person families (24 | 61.5%) have the highest median income of $23,056 per family member.
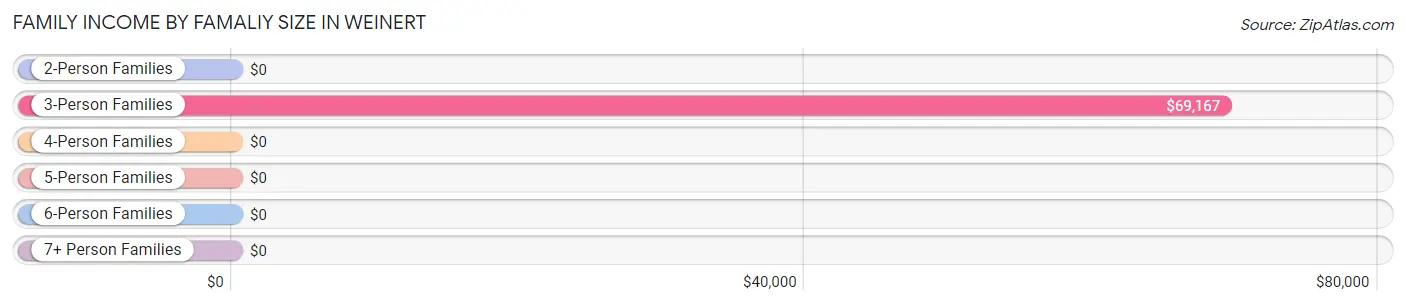
| Income Bracket | # Families | Median Income |
| 2-Person Families | 11 (28.2%) | $0 |
| 3-Person Families | 24 (61.5%) | $69,167 |
| 4-Person Families | 0 (0.0%) | $0 |
| 5-Person Families | 4 (10.3%) | $0 |
| 6-Person Families | 0 (0.0%) | $0 |
| 7+ Person Families | 0 (0.0%) | $0 |
| Total | 39 (100.0%) | $68,542 |
Family Income by Number of Earners in Weinert
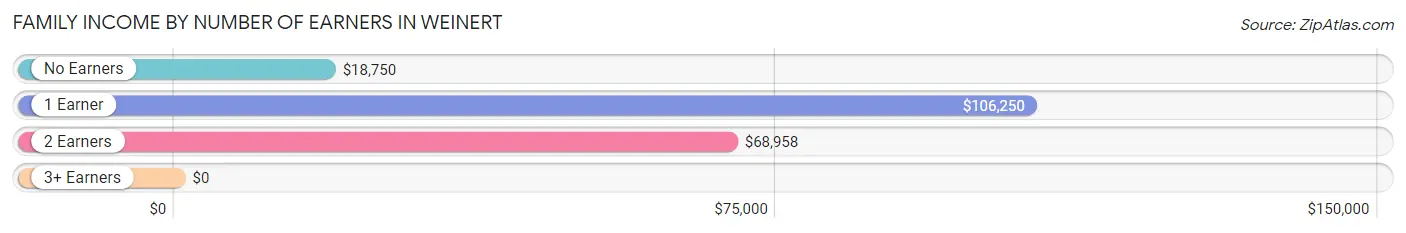
| Number of Earners | # Families | Median Income |
| No Earners | 7 (17.9%) | $18,750 |
| 1 Earner | 6 (15.4%) | $106,250 |
| 2 Earners | 23 (59.0%) | $68,958 |
| 3+ Earners | 3 (7.7%) | $0 |
| Total | 39 (100.0%) | $68,542 |
Household Income in Weinert
Household Income Brackets in Weinert
With 21 households falling in the category, the $35,000 to $49,999 income range is the most frequent in Weinert, accounting for 28.0% of all households.
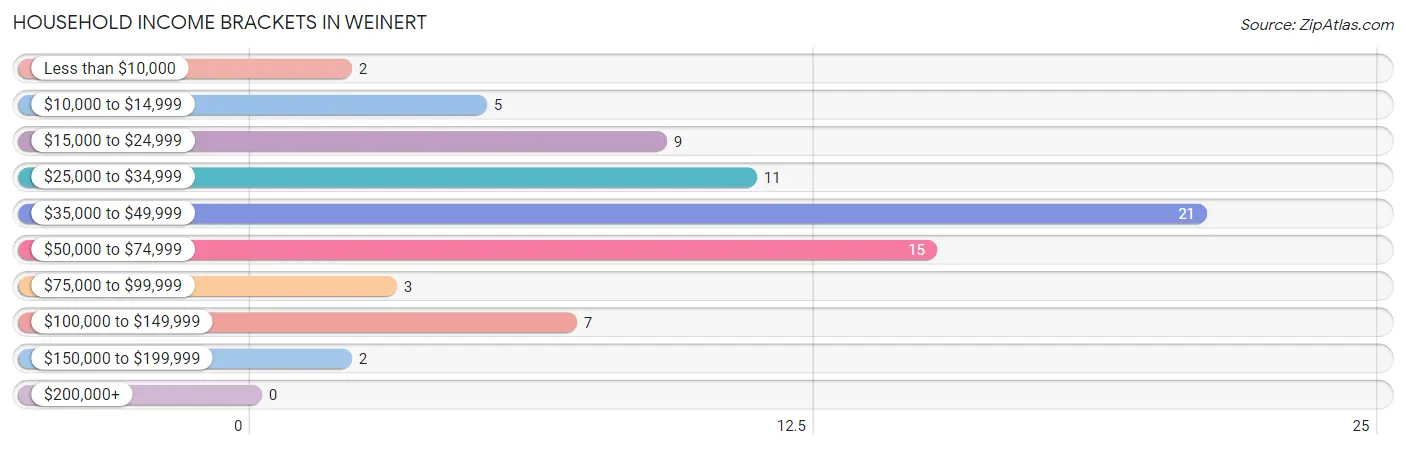
| Income Bracket | # Households | % Households |
| Less than $10,000 | 2 | 2.7% |
| $10,000 to $14,999 | 5 | 6.7% |
| $15,000 to $24,999 | 9 | 12.0% |
| $25,000 to $34,999 | 11 | 14.7% |
| $35,000 to $49,999 | 21 | 28.0% |
| $50,000 to $74,999 | 15 | 20.0% |
| $75,000 to $99,999 | 3 | 4.0% |
| $100,000 to $149,999 | 7 | 9.3% |
| $150,000 to $199,999 | 2 | 2.7% |
| $200,000+ | 0 | 0.0% |
Household Income by Householder Age in Weinert
The median household income in Weinert is $45,893, with the highest median household income of $49,063 found in the 45 to 64 years age bracket for the primary householder. A total of 29 households (38.7%) fall into this category.
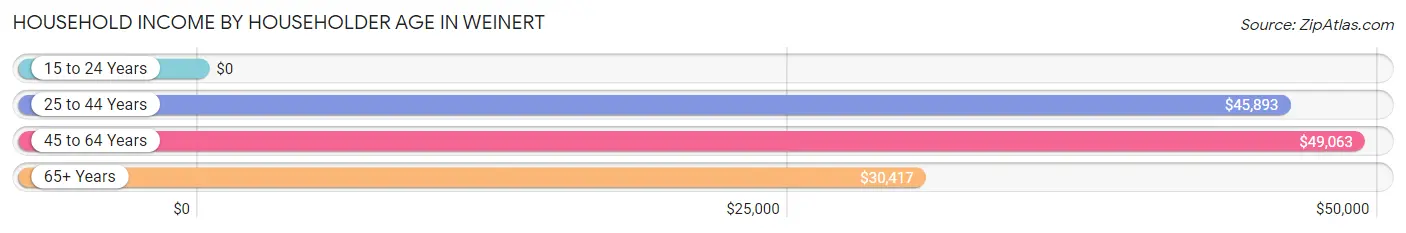
| Income Bracket | # Households | Median Income |
| 15 to 24 Years | 0 (0.0%) | $0 |
| 25 to 44 Years | 21 (28.0%) | $45,893 |
| 45 to 64 Years | 29 (38.7%) | $49,063 |
| 65+ Years | 25 (33.3%) | $30,417 |
| Total | 75 (100.0%) | $45,893 |
Poverty in Weinert
Income Below Poverty by Sex and Age in Weinert
With 13.3% poverty level for males and 20.2% for females among the residents of Weinert, under 5 year old males and 6 to 11 year old females are the most vulnerable to poverty, with 3 males (50.0%) and 4 females (57.1%) in their respective age groups living below the poverty level.
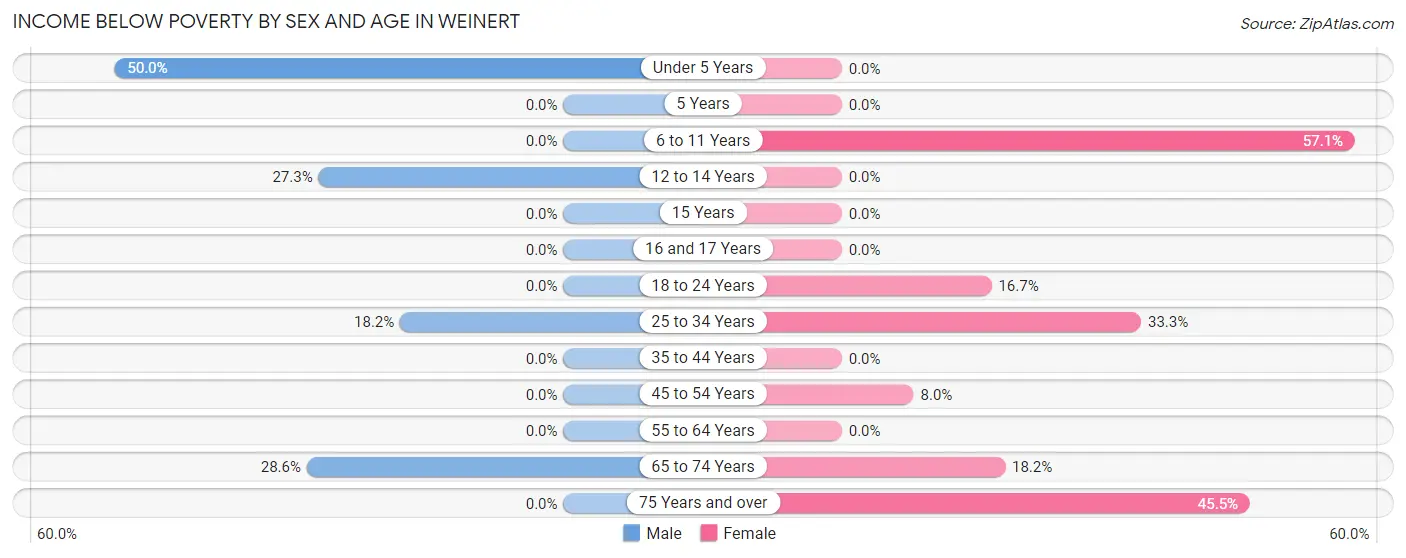
| Age Bracket | Male | Female |
| Under 5 Years | 3 (50.0%) | 0 (0.0%) |
| 5 Years | 0 (0.0%) | 0 (0.0%) |
| 6 to 11 Years | 0 (0.0%) | 4 (57.1%) |
| 12 to 14 Years | 3 (27.3%) | 0 (0.0%) |
| 15 Years | 0 (0.0%) | 0 (0.0%) |
| 16 and 17 Years | 0 (0.0%) | 0 (0.0%) |
| 18 to 24 Years | 0 (0.0%) | 4 (16.7%) |
| 25 to 34 Years | 2 (18.2%) | 2 (33.3%) |
| 35 to 44 Years | 0 (0.0%) | 0 (0.0%) |
| 45 to 54 Years | 0 (0.0%) | 2 (8.0%) |
| 55 to 64 Years | 0 (0.0%) | 0 (0.0%) |
| 65 to 74 Years | 2 (28.6%) | 2 (18.2%) |
| 75 Years and over | 0 (0.0%) | 5 (45.5%) |
| Total | 10 (13.3%) | 19 (20.2%) |
Income Above Poverty by Sex and Age in Weinert
According to the poverty statistics in Weinert, males aged 6 to 11 years and females aged 35 to 44 years are the age groups that are most secure financially, with 100.0% of males and 100.0% of females in these age groups living above the poverty line.
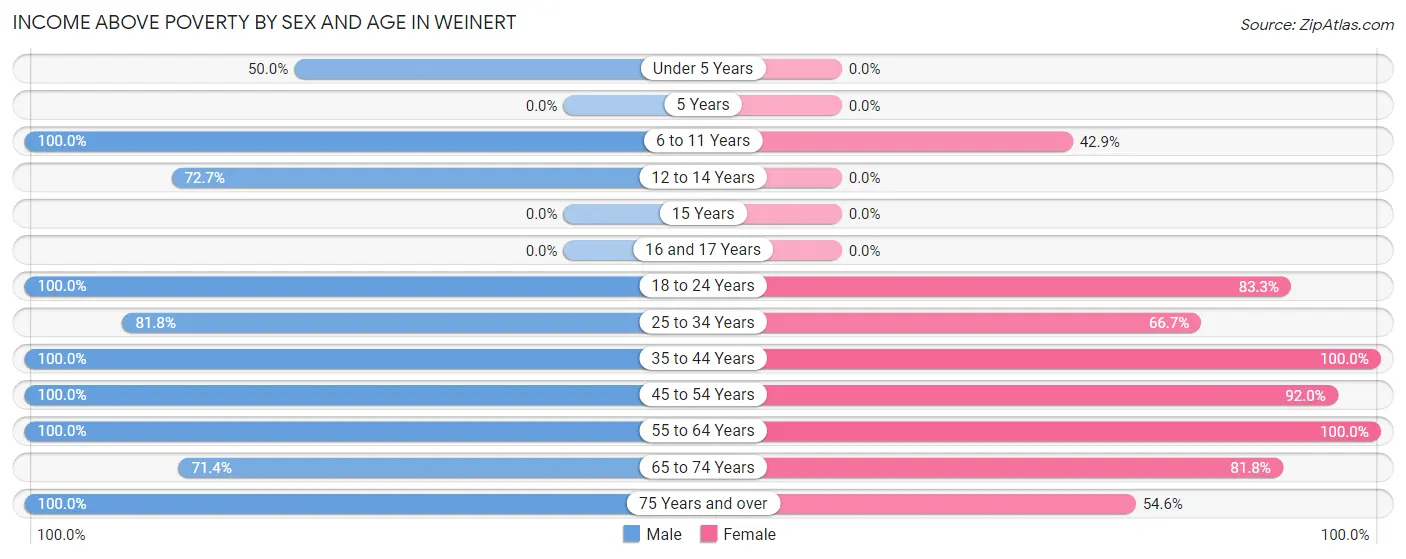
| Age Bracket | Male | Female |
| Under 5 Years | 3 (50.0%) | 0 (0.0%) |
| 5 Years | 0 (0.0%) | 0 (0.0%) |
| 6 to 11 Years | 3 (100.0%) | 3 (42.9%) |
| 12 to 14 Years | 8 (72.7%) | 0 (0.0%) |
| 15 Years | 0 (0.0%) | 0 (0.0%) |
| 16 and 17 Years | 0 (0.0%) | 0 (0.0%) |
| 18 to 24 Years | 3 (100.0%) | 20 (83.3%) |
| 25 to 34 Years | 9 (81.8%) | 4 (66.7%) |
| 35 to 44 Years | 7 (100.0%) | 5 (100.0%) |
| 45 to 54 Years | 13 (100.0%) | 23 (92.0%) |
| 55 to 64 Years | 5 (100.0%) | 5 (100.0%) |
| 65 to 74 Years | 5 (71.4%) | 9 (81.8%) |
| 75 Years and over | 9 (100.0%) | 6 (54.5%) |
| Total | 65 (86.7%) | 75 (79.8%) |
Income Below Poverty Among Married-Couple Families in Weinert
The poverty statistics for married-couple families in Weinert show that 11.4% or 4 of the total 35 families live below the poverty line. Families with 1 or 2 children have the highest poverty rate of 25.0%, comprising of 2 families. On the other hand, families with 3 or 4 children have the lowest poverty rate of 0.0%, which includes 0 families.
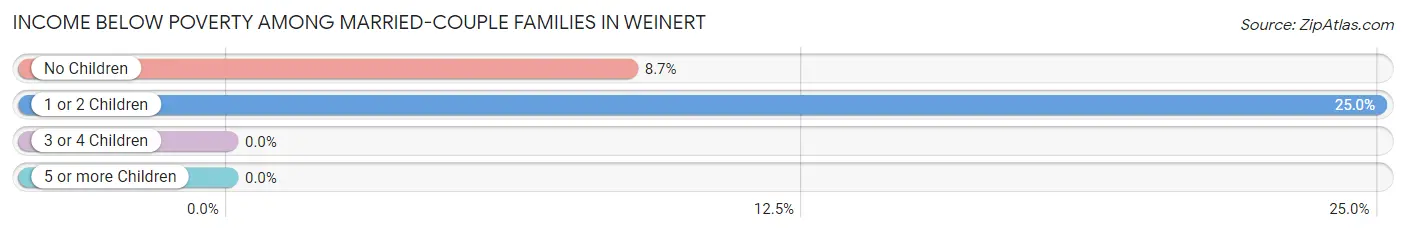
| Children | Above Poverty | Below Poverty |
| No Children | 21 (91.3%) | 2 (8.7%) |
| 1 or 2 Children | 6 (75.0%) | 2 (25.0%) |
| 3 or 4 Children | 4 (100.0%) | 0 (0.0%) |
| 5 or more Children | 0 (0.0%) | 0 (0.0%) |
| Total | 31 (88.6%) | 4 (11.4%) |
Income Below Poverty Among Single-Parent Households in Weinert
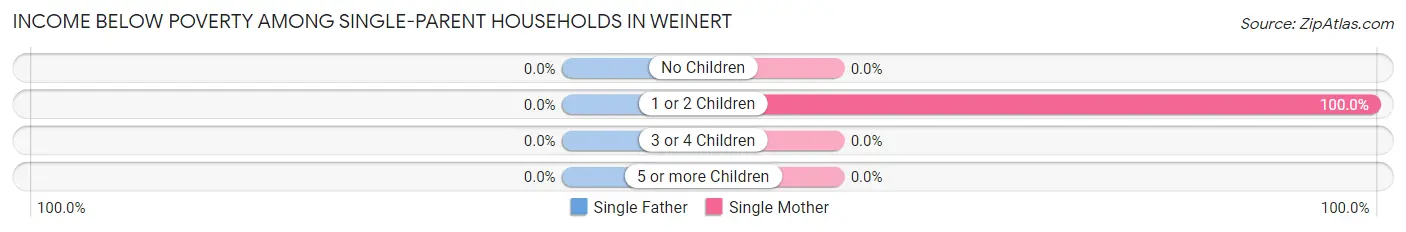
| Children | Single Father | Single Mother |
| No Children | 0 (0.0%) | 0 (0.0%) |
| 1 or 2 Children | 0 (0.0%) | 2 (100.0%) |
| 3 or 4 Children | 0 (0.0%) | 0 (0.0%) |
| 5 or more Children | 0 (0.0%) | 0 (0.0%) |
| Total | 0 (0.0%) | 2 (50.0%) |
Income Below Poverty Among Married-Couple vs Single-Parent Households in Weinert
The poverty data for Weinert shows that 4 of the married-couple family households (11.4%) and 2 of the single-parent households (50.0%) are living below the poverty level. Within the married-couple family households, those with 1 or 2 children have the highest poverty rate, with 2 households (25.0%) falling below the poverty line. Among the single-parent households, those with 1 or 2 children have the highest poverty rate, with 2 household (100.0%) living below poverty.
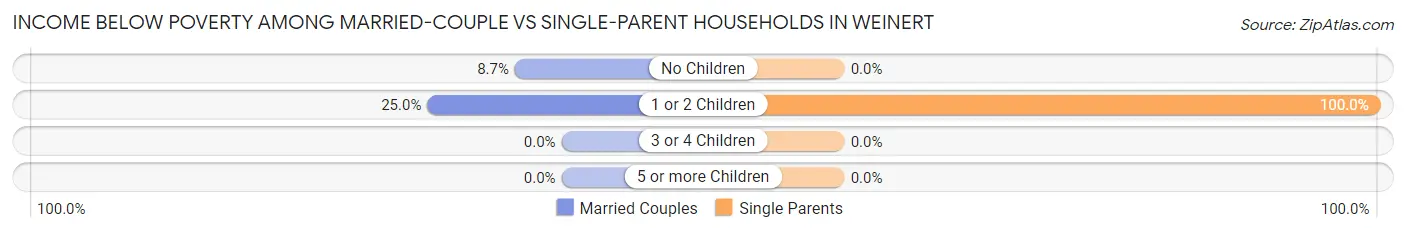
| Children | Married-Couple Families | Single-Parent Households |
| No Children | 2 (8.7%) | 0 (0.0%) |
| 1 or 2 Children | 2 (25.0%) | 2 (100.0%) |
| 3 or 4 Children | 0 (0.0%) | 0 (0.0%) |
| 5 or more Children | 0 (0.0%) | 0 (0.0%) |
| Total | 4 (11.4%) | 2 (50.0%) |
Race in Weinert
The most populous races in Weinert are White / Caucasian (146 | 86.4%), Hispanic or Latino (73 | 43.2%), and Two or more Races (12 | 7.1%).
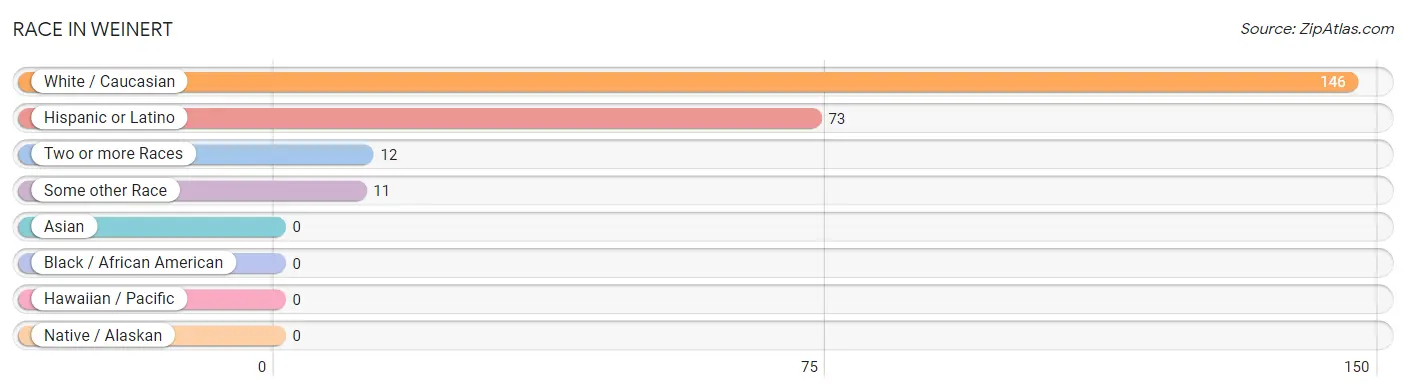
| Race | # Population | % Population |
| Asian | 0 | 0.0% |
| Black / African American | 0 | 0.0% |
| Hawaiian / Pacific | 0 | 0.0% |
| Hispanic or Latino | 73 | 43.2% |
| Native / Alaskan | 0 | 0.0% |
| White / Caucasian | 146 | 86.4% |
| Two or more Races | 12 | 7.1% |
| Some other Race | 11 | 6.5% |
| Total | 169 | 100.0% |
Ancestry in Weinert
The most populous ancestries reported in Weinert are Mexican (60 | 35.5%), American (18 | 10.6%), German (6 | 3.5%), Irish (6 | 3.5%), and Sioux (6 | 3.5%), together accounting for 56.8% of all Weinert residents.
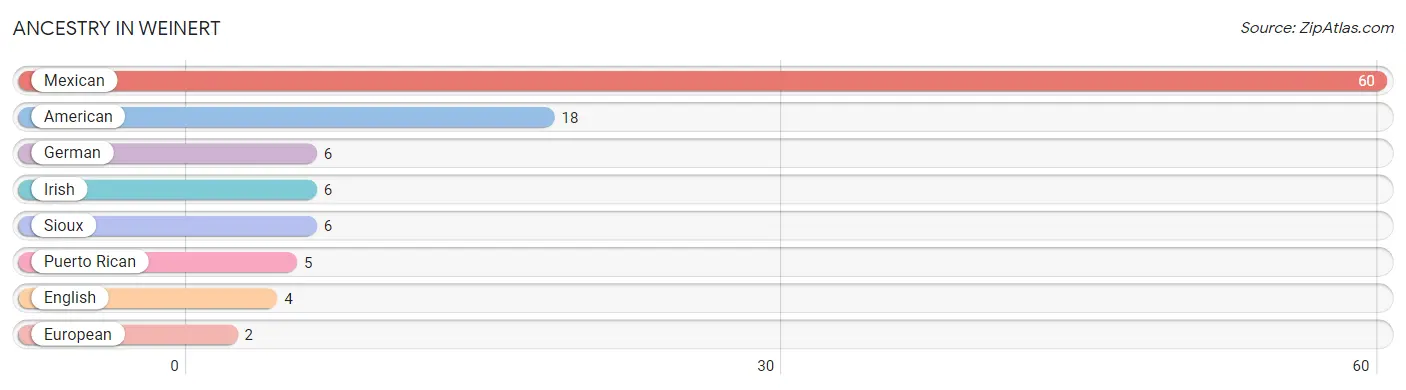
| Ancestry | # Population | % Population |
| American | 18 | 10.6% |
| English | 4 | 2.4% |
| European | 2 | 1.2% |
| German | 6 | 3.5% |
| Irish | 6 | 3.5% |
| Mexican | 60 | 35.5% |
| Puerto Rican | 5 | 3.0% |
| Sioux | 6 | 3.5% | View All 8 Rows |
Immigrants in Weinert
The most numerous immigrant groups reported in Weinert came from Central America (3 | 1.8%), Latin America (3 | 1.8%), and Mexico (3 | 1.8%), together accounting for 5.3% of all Weinert residents.
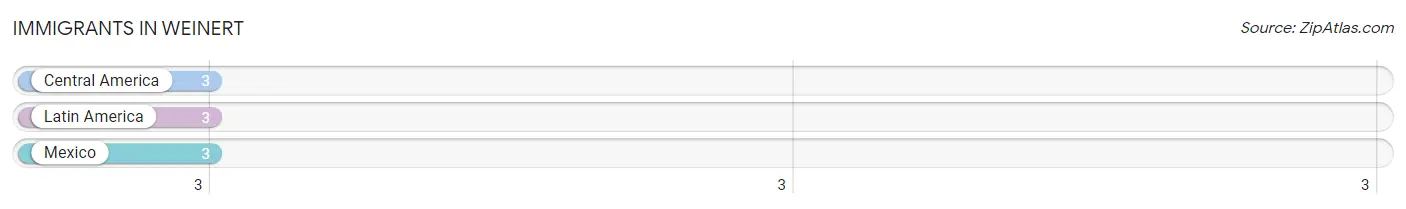
| Immigration Origin | # Population | % Population |
| Central America | 3 | 1.8% |
| Latin America | 3 | 1.8% |
| Mexico | 3 | 1.8% | View All 3 Rows |
Sex and Age in Weinert
Sex and Age in Weinert
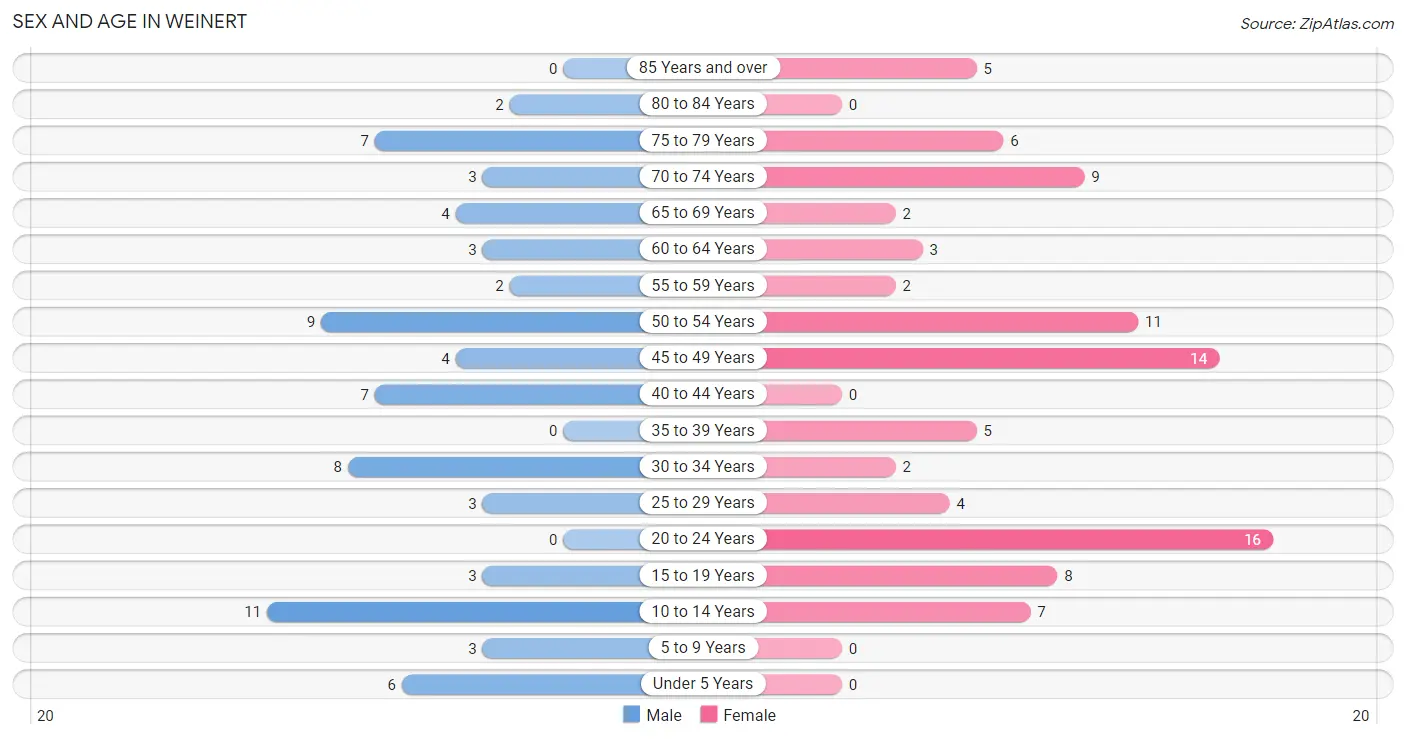
The most populous age groups in Weinert are 10 to 14 Years (11 | 14.7%) for men and 20 to 24 Years (16 | 17.0%) for women.
| Age Bracket | Male | Female |
| Under 5 Years | 6 (8.0%) | 0 (0.0%) |
| 5 to 9 Years | 3 (4.0%) | 0 (0.0%) |
| 10 to 14 Years | 11 (14.7%) | 7 (7.4%) |
| 15 to 19 Years | 3 (4.0%) | 8 (8.5%) |
| 20 to 24 Years | 0 (0.0%) | 16 (17.0%) |
| 25 to 29 Years | 3 (4.0%) | 4 (4.3%) |
| 30 to 34 Years | 8 (10.7%) | 2 (2.1%) |
| 35 to 39 Years | 0 (0.0%) | 5 (5.3%) |
| 40 to 44 Years | 7 (9.3%) | 0 (0.0%) |
| 45 to 49 Years | 4 (5.3%) | 14 (14.9%) |
| 50 to 54 Years | 9 (12.0%) | 11 (11.7%) |
| 55 to 59 Years | 2 (2.7%) | 2 (2.1%) |
| 60 to 64 Years | 3 (4.0%) | 3 (3.2%) |
| 65 to 69 Years | 4 (5.3%) | 2 (2.1%) |
| 70 to 74 Years | 3 (4.0%) | 9 (9.6%) |
| 75 to 79 Years | 7 (9.3%) | 6 (6.4%) |
| 80 to 84 Years | 2 (2.7%) | 0 (0.0%) |
| 85 Years and over | 0 (0.0%) | 5 (5.3%) |
| Total | 75 (100.0%) | 94 (100.0%) |
Families and Households in Weinert
Median Family Size in Weinert
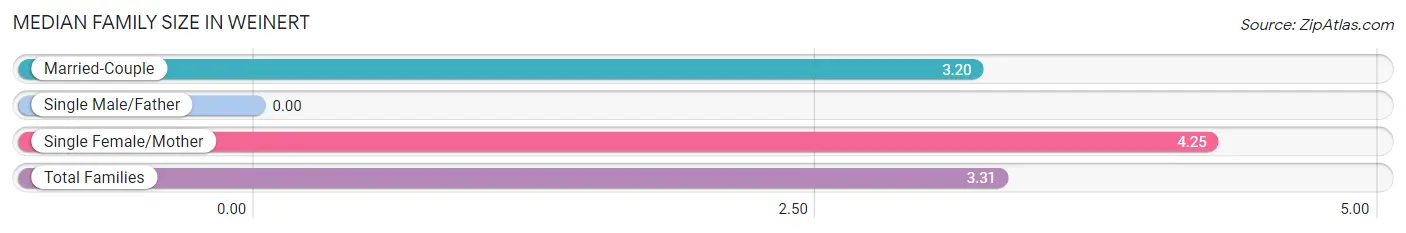
| Family Type | # Families | Family Size |
| Married-Couple | 35 (89.7%) | 3.20 |
| Single Male/Father | 0 (0.0%) | - |
| Single Female/Mother | 4 (10.3%) | 4.25 |
| Total Families | 39 (100.0%) | 3.31 |
Median Household Size in Weinert
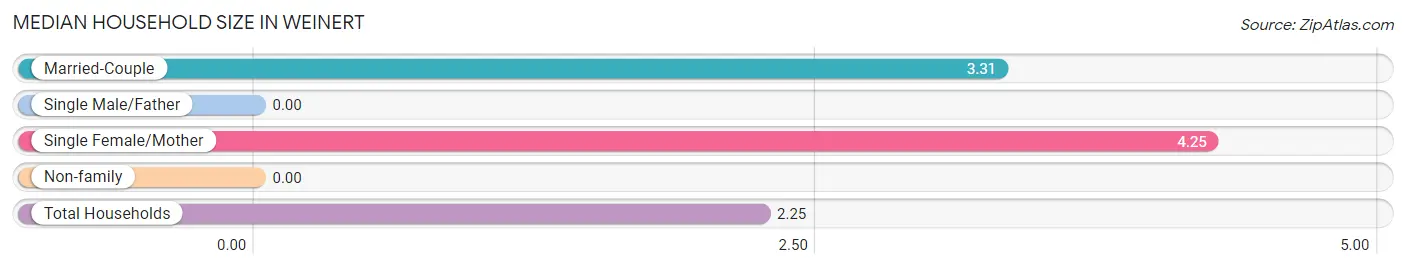
| Household Type | # Households | Household Size |
| Married-Couple | 35 (46.7%) | 3.31 |
| Single Male/Father | 0 (0.0%) | - |
| Single Female/Mother | 4 (5.3%) | 4.25 |
| Non-family | 36 (48.0%) | - |
| Total Households | 75 (100.0%) | 2.25 |
Household Size by Marriage Status in Weinert
Out of a total of 75 households in Weinert, 39 (52.0%) are family households, while 36 (48.0%) are nonfamily households. The most numerous type of family households are 3-person households, comprising 21, and the most common type of nonfamily households are 1-person households, comprising 36.
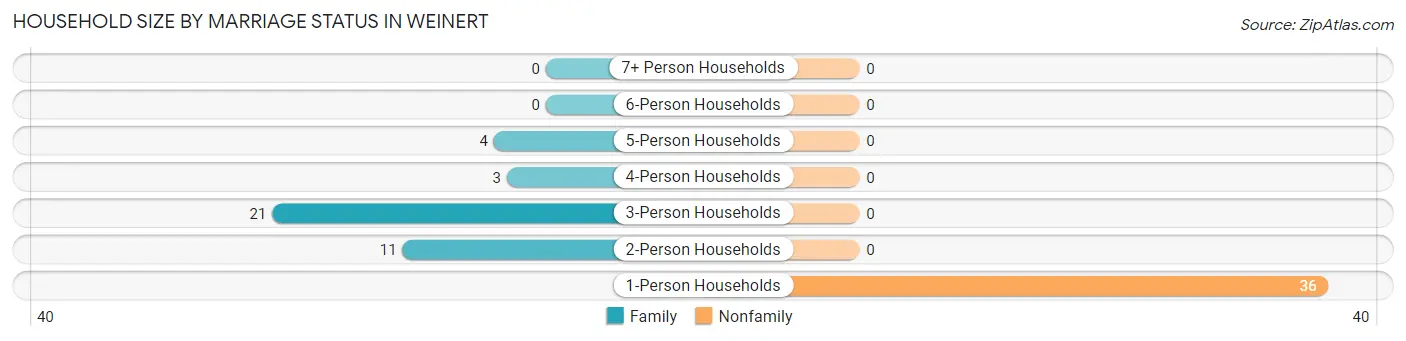
| Household Size | Family Households | Nonfamily Households |
| 1-Person Households | - | 36 (48.0%) |
| 2-Person Households | 11 (14.7%) | 0 (0.0%) |
| 3-Person Households | 21 (28.0%) | 0 (0.0%) |
| 4-Person Households | 3 (4.0%) | 0 (0.0%) |
| 5-Person Households | 4 (5.3%) | 0 (0.0%) |
| 6-Person Households | 0 (0.0%) | 0 (0.0%) |
| 7+ Person Households | 0 (0.0%) | 0 (0.0%) |
| Total | 39 (52.0%) | 36 (48.0%) |
Female Fertility in Weinert
Fertility by Age in Weinert
| Age Bracket | Women with Births | Births / 1,000 Women |
| 15 to 19 years | 0 (0.0%) | 0.0 |
| 20 to 34 years | 0 (0.0%) | 0.0 |
| 35 to 50 years | 0 (0.0%) | 0.0 |
| Total | 0 (0.0%) | 0.0 |
Fertility by Age by Marriage Status in Weinert
| Age Bracket | Married | Unmarried |
| 15 to 19 years | 0 (0.0%) | 0 (0.0%) |
| 20 to 34 years | 0 (0.0%) | 0 (0.0%) |
| 35 to 50 years | 0 (0.0%) | 0 (0.0%) |
| Total | 0 (0.0%) | 0 (0.0%) |
Fertility by Education in Weinert
| Educational Attainment | Women with Births | Births / 1,000 Women |
| Less than High School | 0 (0.0%) | 0.0 |
| High School Diploma | 0 (0.0%) | 0.0 |
| College or Associate's Degree | 0 (0.0%) | 0.0 |
| Bachelor's Degree | 0 (0.0%) | 0.0 |
| Graduate Degree | 0 (0.0%) | 0.0 |
| Total | 0 (0.0%) | 0.0 |
Fertility by Education by Marriage Status in Weinert
| Educational Attainment | Married | Unmarried |
| Less than High School | 0 (0.0%) | 0 (0.0%) |
| High School Diploma | 0 (0.0%) | 0 (0.0%) |
| College or Associate's Degree | 0 (0.0%) | 0 (0.0%) |
| Bachelor's Degree | 0 (0.0%) | 0 (0.0%) |
| Graduate Degree | 0 (0.0%) | 0 (0.0%) |
| Total | 0 (0.0%) | 0 (0.0%) |
Employment Characteristics in Weinert
Employment by Class of Employer in Weinert
Among the 74 employed individuals in Weinert, private company employees (43 | 58.1%), local government employees (14 | 18.9%), and federal government employees (8 | 10.8%) make up the most common classes of employment.
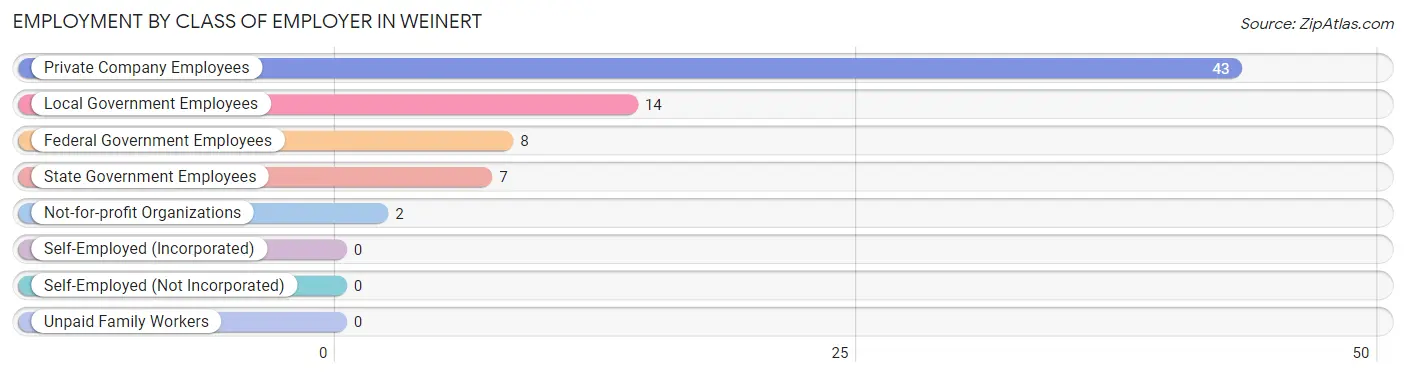
| Employer Class | # Employees | % Employees |
| Private Company Employees | 43 | 58.1% |
| Self-Employed (Incorporated) | 0 | 0.0% |
| Self-Employed (Not Incorporated) | 0 | 0.0% |
| Not-for-profit Organizations | 2 | 2.7% |
| Local Government Employees | 14 | 18.9% |
| State Government Employees | 7 | 9.5% |
| Federal Government Employees | 8 | 10.8% |
| Unpaid Family Workers | 0 | 0.0% |
| Total | 74 | 100.0% |
Employment Status by Age in Weinert
According to the labor force statistics for Weinert, out of the total population over 16 years of age (142), 54.9% or 78 individuals are in the labor force, with 5.1% or 4 of them unemployed. The age group with the highest labor force participation rate is 25 to 29 years, with 100.0% or 7 individuals in the labor force. Within the labor force, the 25 to 29 years age range has the highest percentage of unemployed individuals, with 57.1% or 4 of them being unemployed.
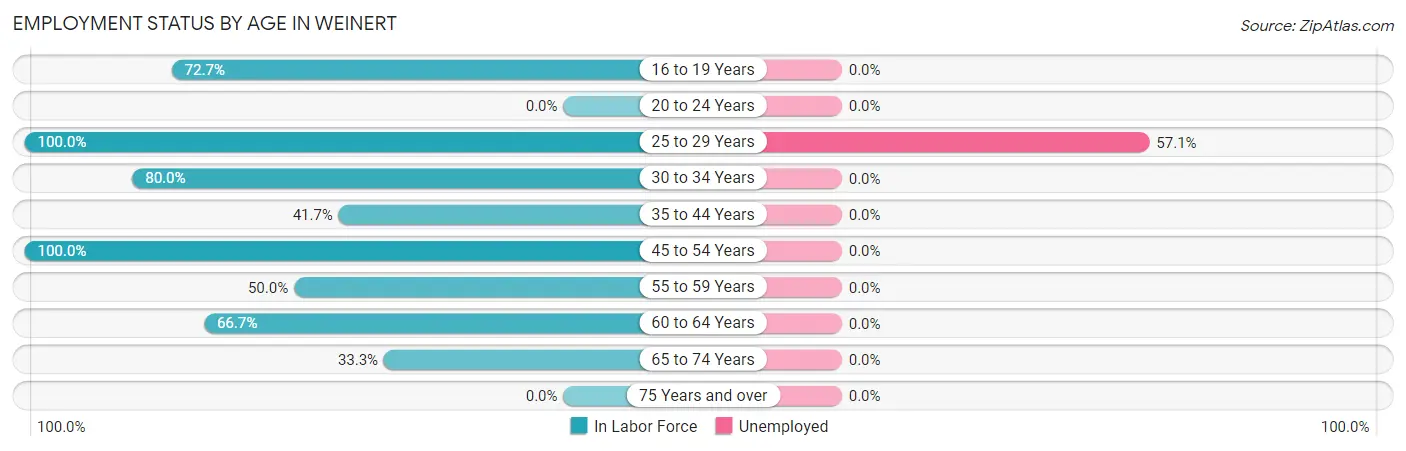
| Age Bracket | In Labor Force | Unemployed |
| 16 to 19 Years | 8 (72.7%) | 0 (0.0%) |
| 20 to 24 Years | 0 (0.0%) | 0 (0.0%) |
| 25 to 29 Years | 7 (100.0%) | 4 (57.1%) |
| 30 to 34 Years | 8 (80.0%) | 0 (0.0%) |
| 35 to 44 Years | 5 (41.7%) | 0 (0.0%) |
| 45 to 54 Years | 38 (100.0%) | 0 (0.0%) |
| 55 to 59 Years | 2 (50.0%) | 0 (0.0%) |
| 60 to 64 Years | 4 (66.7%) | 0 (0.0%) |
| 65 to 74 Years | 6 (33.3%) | 0 (0.0%) |
| 75 Years and over | 0 (0.0%) | 0 (0.0%) |
| Total | 78 (54.9%) | 4 (5.1%) |
Employment Status by Educational Attainment in Weinert
According to labor force statistics for Weinert, 83.1% of individuals (64) out of the total population between 25 and 64 years of age (77) are in the labor force, with 6.3% or 4 of them being unemployed. The group with the highest labor force participation rate are those with the educational attainment of less than high school, with 100.0% or 7 individuals in the labor force. Within the labor force, individuals with high school diploma education have the highest percentage of unemployment, with 10.0% or 4 of them being unemployed.
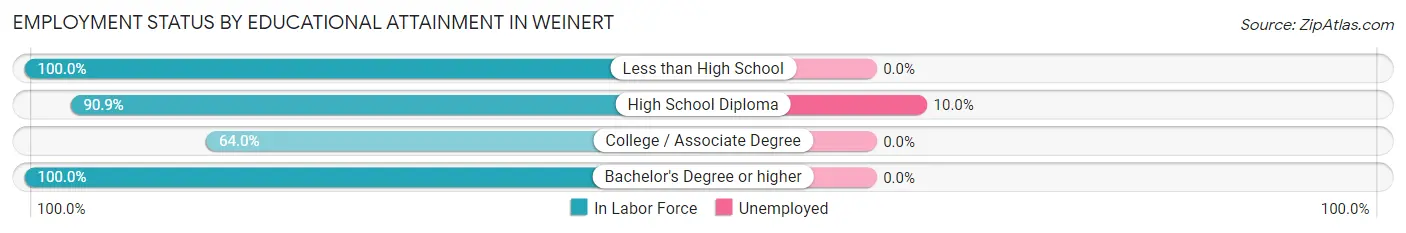
| Educational Attainment | In Labor Force | Unemployed |
| Less than High School | 7 (100.0%) | 0 (0.0%) |
| High School Diploma | 40 (90.9%) | 4 (10.0%) |
| College / Associate Degree | 16 (64.0%) | 0 (0.0%) |
| Bachelor's Degree or higher | 1 (100.0%) | 0 (0.0%) |
| Total | 64 (83.1%) | 5 (6.3%) |
Employment Occupations by Sex in Weinert
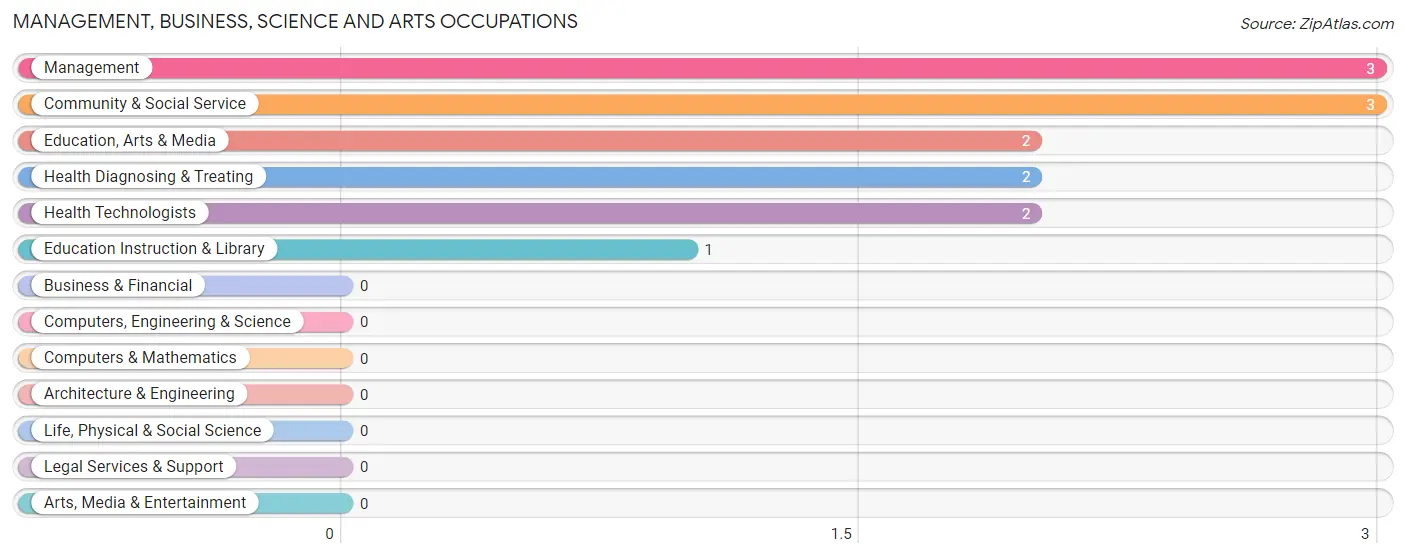
Management, Business, Science and Arts Occupations
The most common Management, Business, Science and Arts occupations in Weinert are Management (3 | 4.1%), Community & Social Service (3 | 4.1%), Education, Arts & Media (2 | 2.7%), Health Diagnosing & Treating (2 | 2.7%), and Health Technologists (2 | 2.7%).
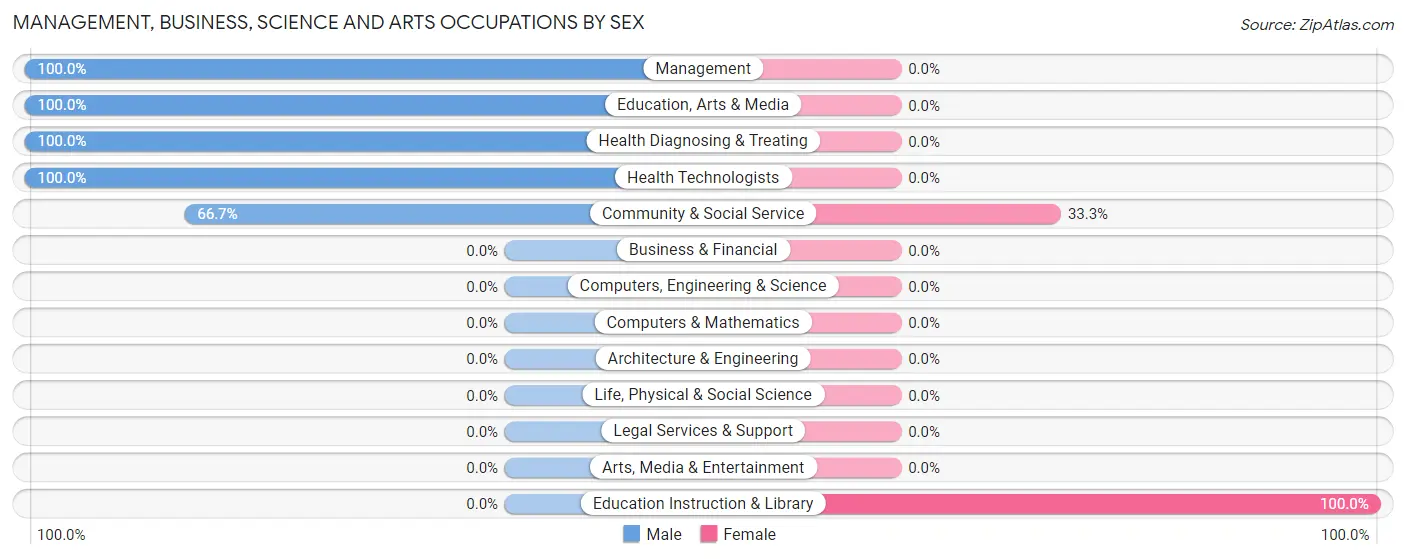
Management, Business, Science and Arts Occupations by Sex
Within the Management, Business, Science and Arts occupations in Weinert, the most male-oriented occupations are Management (100.0%), Education, Arts & Media (100.0%), and Health Diagnosing & Treating (100.0%), while the most female-oriented occupations are Education Instruction & Library (100.0%), and Community & Social Service (33.3%).
| Occupation | Male | Female |
| Management | 3 (100.0%) | 0 (0.0%) |
| Business & Financial | 0 (0.0%) | 0 (0.0%) |
| Computers, Engineering & Science | 0 (0.0%) | 0 (0.0%) |
| Computers & Mathematics | 0 (0.0%) | 0 (0.0%) |
| Architecture & Engineering | 0 (0.0%) | 0 (0.0%) |
| Life, Physical & Social Science | 0 (0.0%) | 0 (0.0%) |
| Community & Social Service | 2 (66.7%) | 1 (33.3%) |
| Education, Arts & Media | 2 (100.0%) | 0 (0.0%) |
| Legal Services & Support | 0 (0.0%) | 0 (0.0%) |
| Education Instruction & Library | 0 (0.0%) | 1 (100.0%) |
| Arts, Media & Entertainment | 0 (0.0%) | 0 (0.0%) |
| Health Diagnosing & Treating | 2 (100.0%) | 0 (0.0%) |
| Health Technologists | 2 (100.0%) | 0 (0.0%) |
| Total (Category) | 7 (87.5%) | 1 (12.5%) |
| Total (Overall) | 31 (41.9%) | 43 (58.1%) |
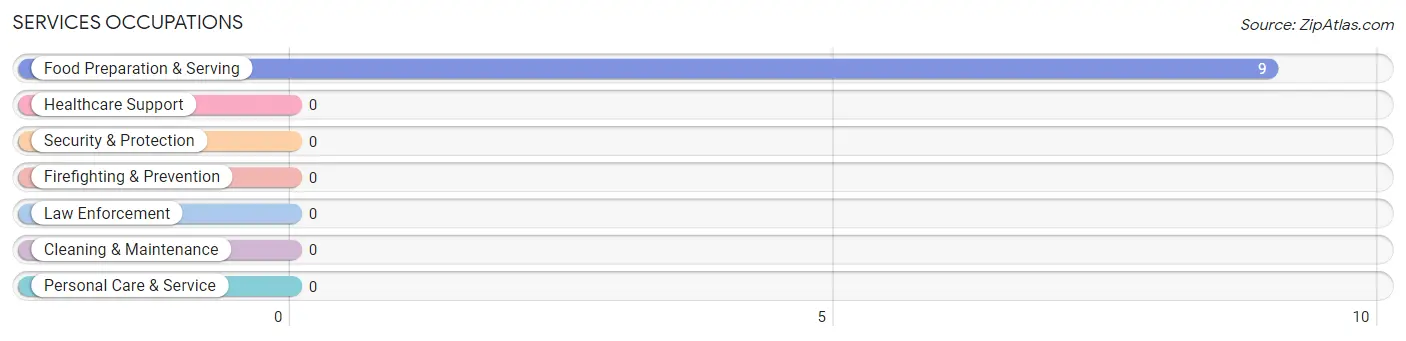
Services Occupations
The most common Services occupations in Weinert are , and Food Preparation & Serving (9 | 12.2%).
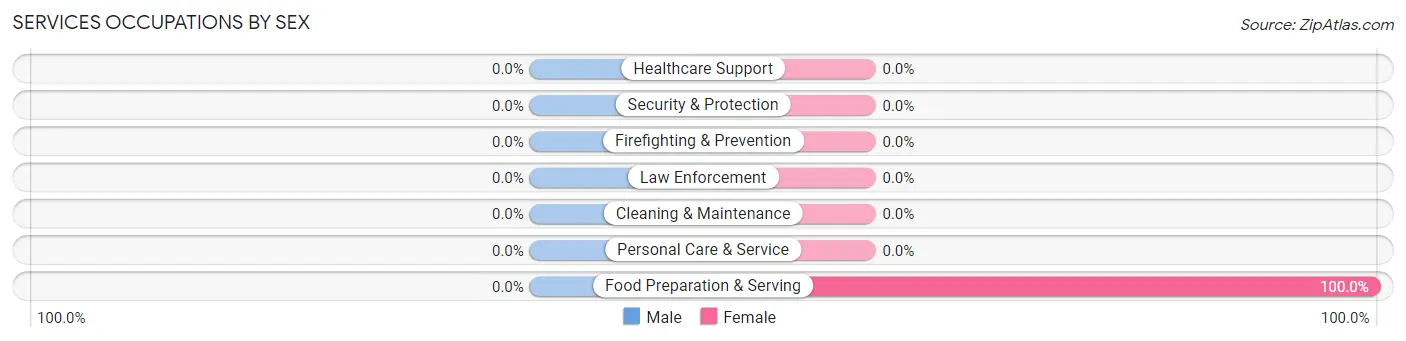
Services Occupations by Sex
| Occupation | Male | Female |
| Healthcare Support | 0 (0.0%) | 0 (0.0%) |
| Security & Protection | 0 (0.0%) | 0 (0.0%) |
| Firefighting & Prevention | 0 (0.0%) | 0 (0.0%) |
| Law Enforcement | 0 (0.0%) | 0 (0.0%) |
| Food Preparation & Serving | 0 (0.0%) | 9 (100.0%) |
| Cleaning & Maintenance | 0 (0.0%) | 0 (0.0%) |
| Personal Care & Service | 0 (0.0%) | 0 (0.0%) |
| Total (Category) | 0 (0.0%) | 9 (100.0%) |
| Total (Overall) | 31 (41.9%) | 43 (58.1%) |
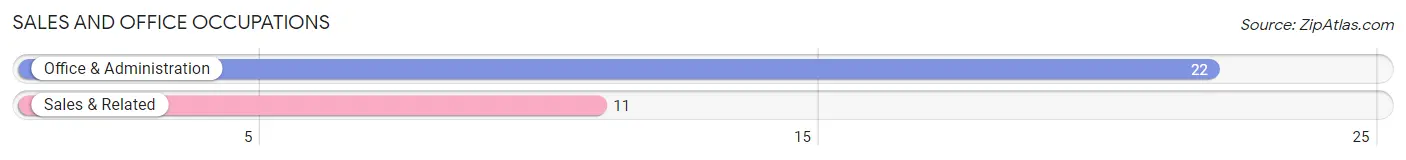
Sales and Office Occupations
The most common Sales and Office occupations in Weinert are Office & Administration (22 | 29.7%), and Sales & Related (11 | 14.9%).
Sales and Office Occupations by Sex
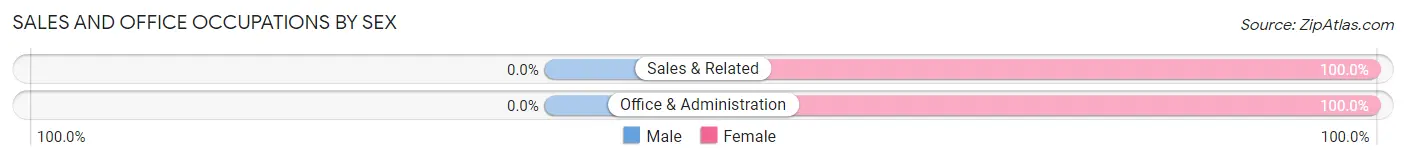
| Occupation | Male | Female |
| Sales & Related | 0 (0.0%) | 11 (100.0%) |
| Office & Administration | 0 (0.0%) | 22 (100.0%) |
| Total (Category) | 0 (0.0%) | 33 (100.0%) |
| Total (Overall) | 31 (41.9%) | 43 (58.1%) |
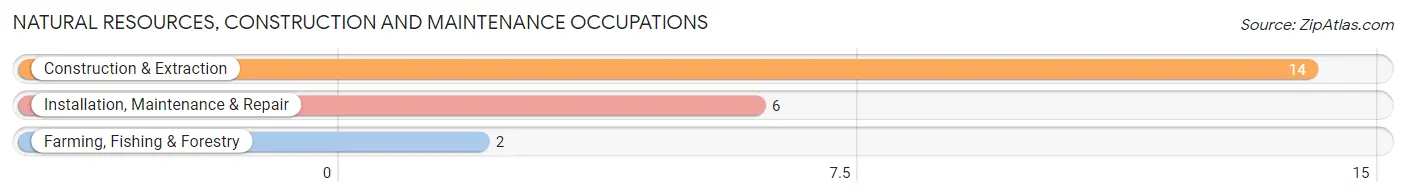
Natural Resources, Construction and Maintenance Occupations
The most common Natural Resources, Construction and Maintenance occupations in Weinert are Construction & Extraction (14 | 18.9%), Installation, Maintenance & Repair (6 | 8.1%), and Farming, Fishing & Forestry (2 | 2.7%).
Natural Resources, Construction and Maintenance Occupations by Sex
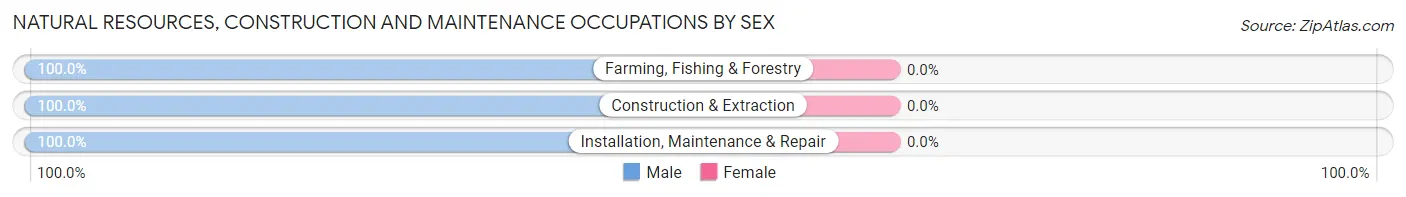
| Occupation | Male | Female |
| Farming, Fishing & Forestry | 2 (100.0%) | 0 (0.0%) |
| Construction & Extraction | 14 (100.0%) | 0 (0.0%) |
| Installation, Maintenance & Repair | 6 (100.0%) | 0 (0.0%) |
| Total (Category) | 22 (100.0%) | 0 (0.0%) |
| Total (Overall) | 31 (41.9%) | 43 (58.1%) |
Production, Transportation and Moving Occupations
The most common Production, Transportation and Moving occupations in Weinert are , and Production (2 | 2.7%).
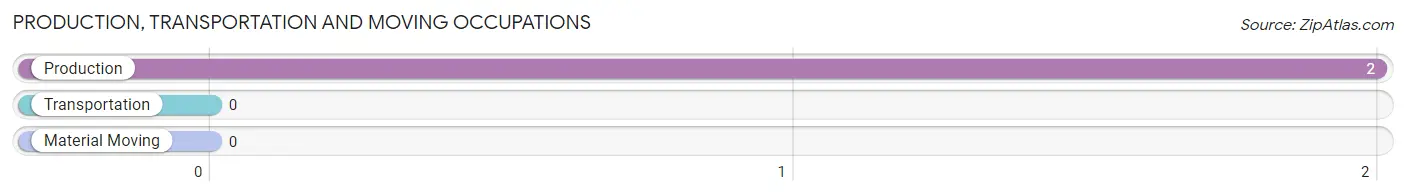
Production, Transportation and Moving Occupations by Sex
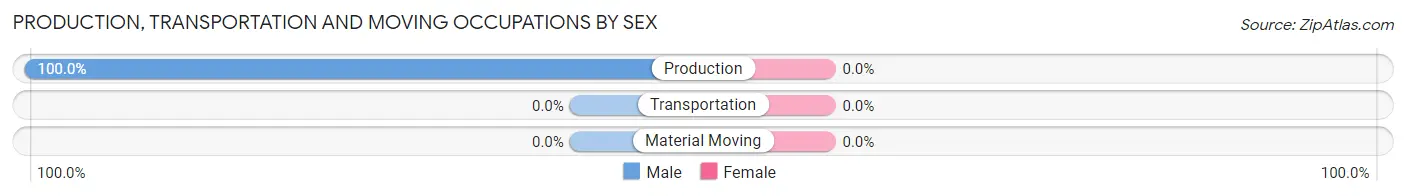
| Occupation | Male | Female |
| Production | 2 (100.0%) | 0 (0.0%) |
| Transportation | 0 (0.0%) | 0 (0.0%) |
| Material Moving | 0 (0.0%) | 0 (0.0%) |
| Total (Category) | 2 (100.0%) | 0 (0.0%) |
| Total (Overall) | 31 (41.9%) | 43 (58.1%) |
Employment Industries by Sex in Weinert
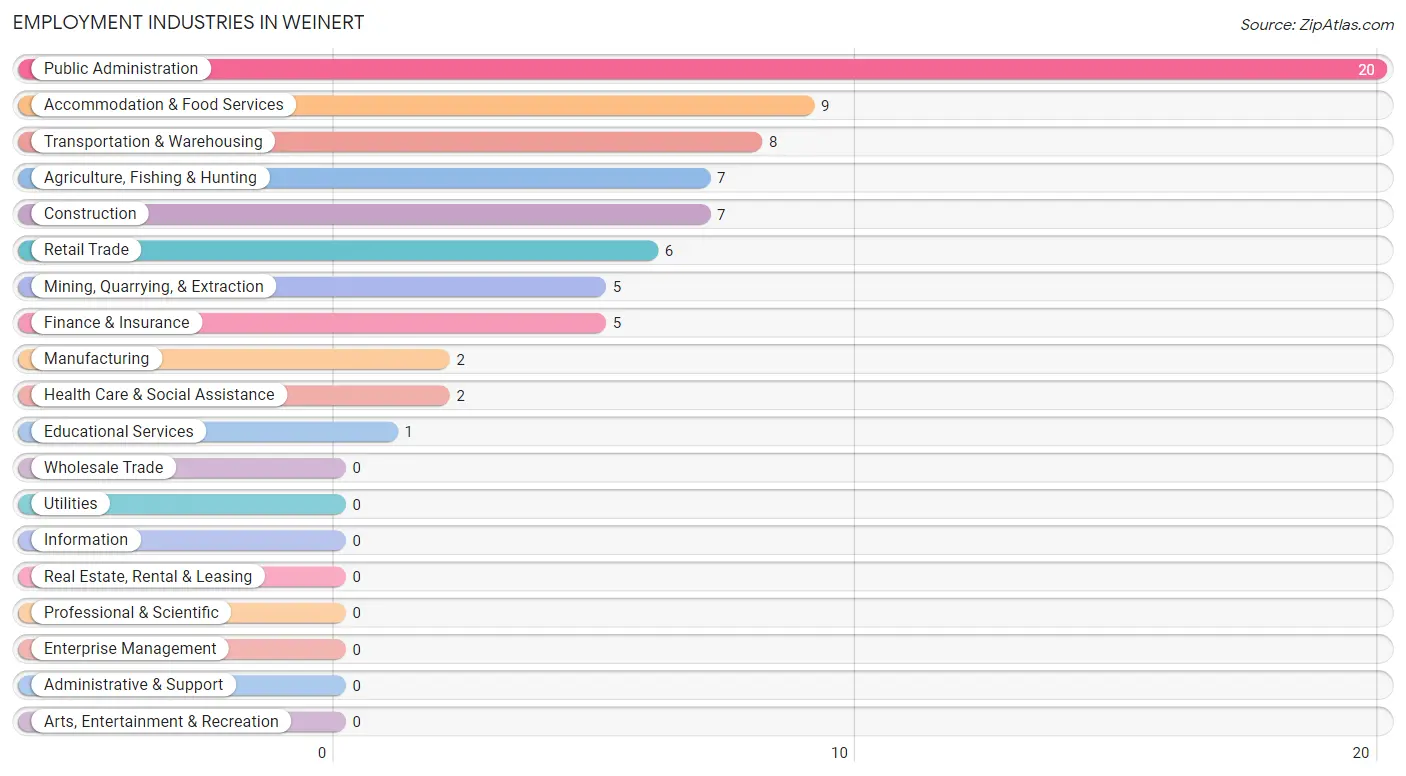
Employment Industries in Weinert
The major employment industries in Weinert include Public Administration (20 | 27.0%), Accommodation & Food Services (9 | 12.2%), Transportation & Warehousing (8 | 10.8%), Agriculture, Fishing & Hunting (7 | 9.5%), and Construction (7 | 9.5%).
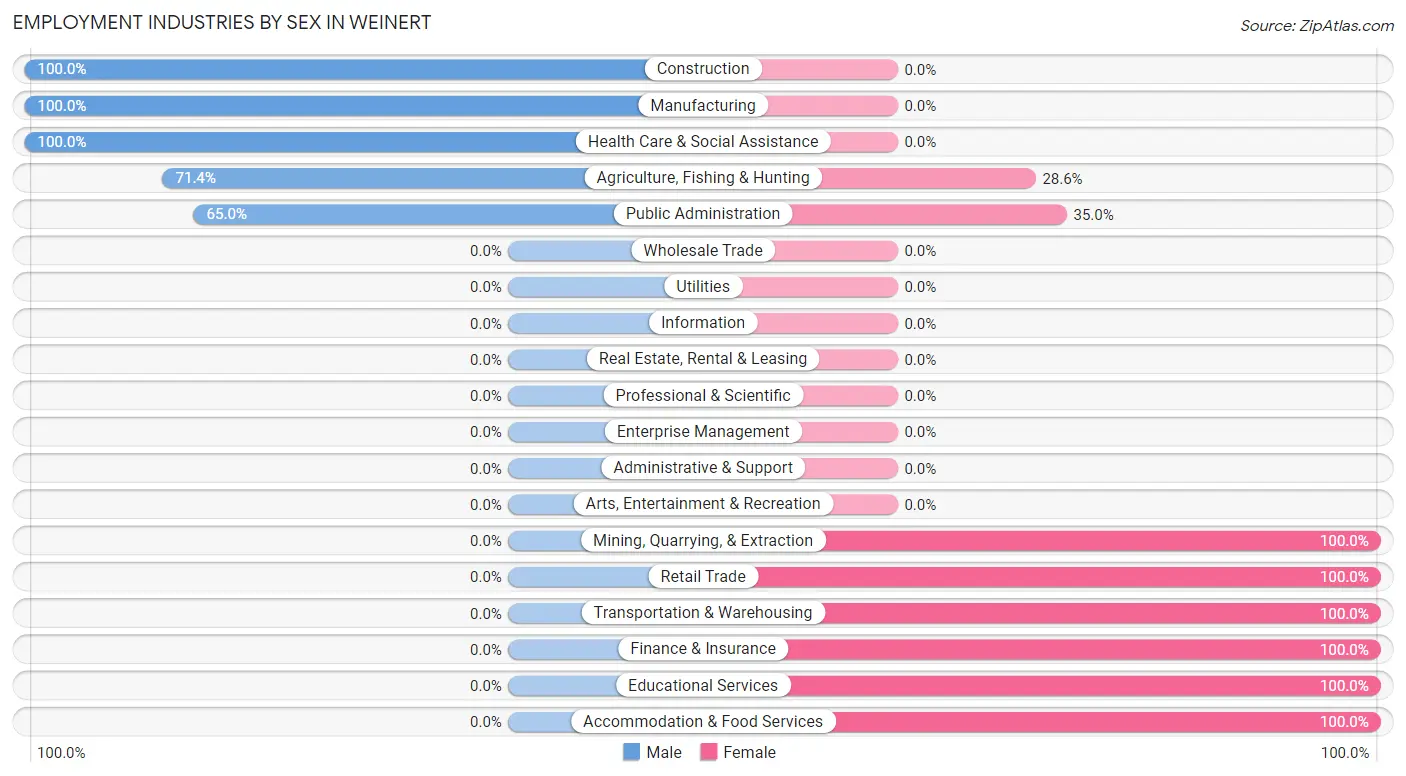
Employment Industries by Sex in Weinert
The Weinert industries that see more men than women are Construction (100.0%), Manufacturing (100.0%), and Health Care & Social Assistance (100.0%), whereas the industries that tend to have a higher number of women are Mining, Quarrying, & Extraction (100.0%), Retail Trade (100.0%), and Transportation & Warehousing (100.0%).
| Industry | Male | Female |
| Agriculture, Fishing & Hunting | 5 (71.4%) | 2 (28.6%) |
| Mining, Quarrying, & Extraction | 0 (0.0%) | 5 (100.0%) |
| Construction | 7 (100.0%) | 0 (0.0%) |
| Manufacturing | 2 (100.0%) | 0 (0.0%) |
| Wholesale Trade | 0 (0.0%) | 0 (0.0%) |
| Retail Trade | 0 (0.0%) | 6 (100.0%) |
| Transportation & Warehousing | 0 (0.0%) | 8 (100.0%) |
| Utilities | 0 (0.0%) | 0 (0.0%) |
| Information | 0 (0.0%) | 0 (0.0%) |
| Finance & Insurance | 0 (0.0%) | 5 (100.0%) |
| Real Estate, Rental & Leasing | 0 (0.0%) | 0 (0.0%) |
| Professional & Scientific | 0 (0.0%) | 0 (0.0%) |
| Enterprise Management | 0 (0.0%) | 0 (0.0%) |
| Administrative & Support | 0 (0.0%) | 0 (0.0%) |
| Educational Services | 0 (0.0%) | 1 (100.0%) |
| Health Care & Social Assistance | 2 (100.0%) | 0 (0.0%) |
| Arts, Entertainment & Recreation | 0 (0.0%) | 0 (0.0%) |
| Accommodation & Food Services | 0 (0.0%) | 9 (100.0%) |
| Public Administration | 13 (65.0%) | 7 (35.0%) |
| Total | 31 (41.9%) | 43 (58.1%) |
Education in Weinert
School Enrollment in Weinert
The most common levels of schooling among the 47 students in Weinert are college / undergraduate (16 | 34.0%), middle school (11 | 23.4%), and elementary school (10 | 21.3%).
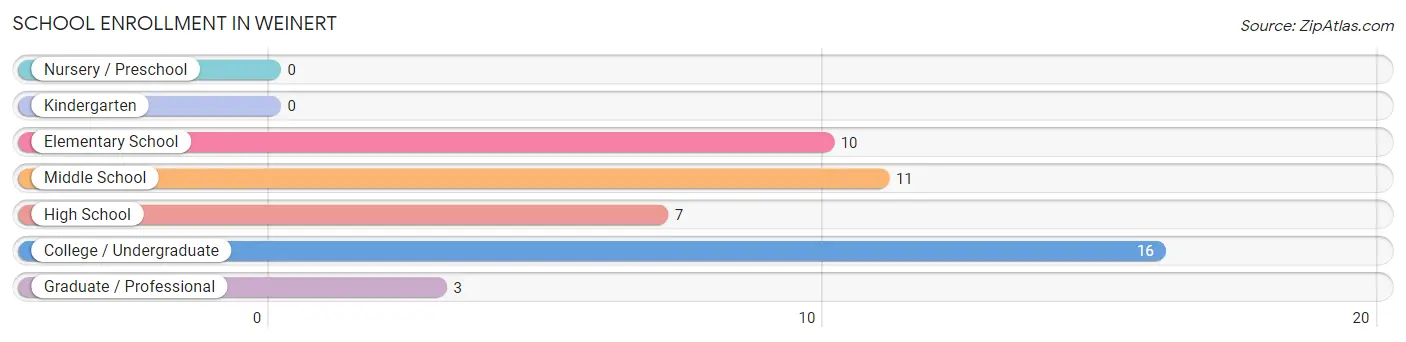
| School Level | # Students | % Students |
| Nursery / Preschool | 0 | 0.0% |
| Kindergarten | 0 | 0.0% |
| Elementary School | 10 | 21.3% |
| Middle School | 11 | 23.4% |
| High School | 7 | 14.9% |
| College / Undergraduate | 16 | 34.0% |
| Graduate / Professional | 3 | 6.4% |
| Total | 47 | 100.0% |
School Enrollment by Age by Funding Source in Weinert
Out of a total of 47 students who are enrolled in schools in Weinert, 3 (6.4%) attend a private institution, while the remaining 44 (93.6%) are enrolled in public schools. The age group of 18 to 19 year olds has the highest likelihood of being enrolled in private schools, with 3 (42.9% in the age bracket) enrolled. Conversely, the age group of 5 to 9 year old has the lowest likelihood of being enrolled in a private school, with 3 (100.0% in the age bracket) attending a public institution.
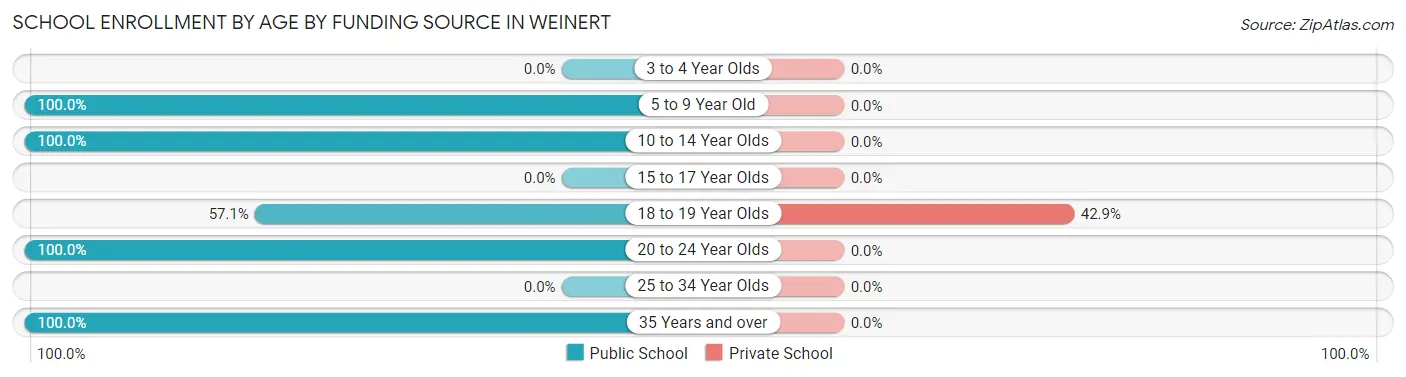
| Age Bracket | Public School | Private School |
| 3 to 4 Year Olds | 0 (0.0%) | 0 (0.0%) |
| 5 to 9 Year Old | 3 (100.0%) | 0 (0.0%) |
| 10 to 14 Year Olds | 18 (100.0%) | 0 (0.0%) |
| 15 to 17 Year Olds | 0 (0.0%) | 0 (0.0%) |
| 18 to 19 Year Olds | 4 (57.1%) | 3 (42.9%) |
| 20 to 24 Year Olds | 16 (100.0%) | 0 (0.0%) |
| 25 to 34 Year Olds | 0 (0.0%) | 0 (0.0%) |
| 35 Years and over | 3 (100.0%) | 0 (0.0%) |
| Total | 44 (93.6%) | 3 (6.4%) |
Educational Attainment by Field of Study in Weinert
Education (3 | 42.9%), computers & mathematics (2 | 28.6%), and science & technology (2 | 28.6%) are the most common fields of study among 7 individuals in Weinert who have obtained a bachelor's degree or higher.
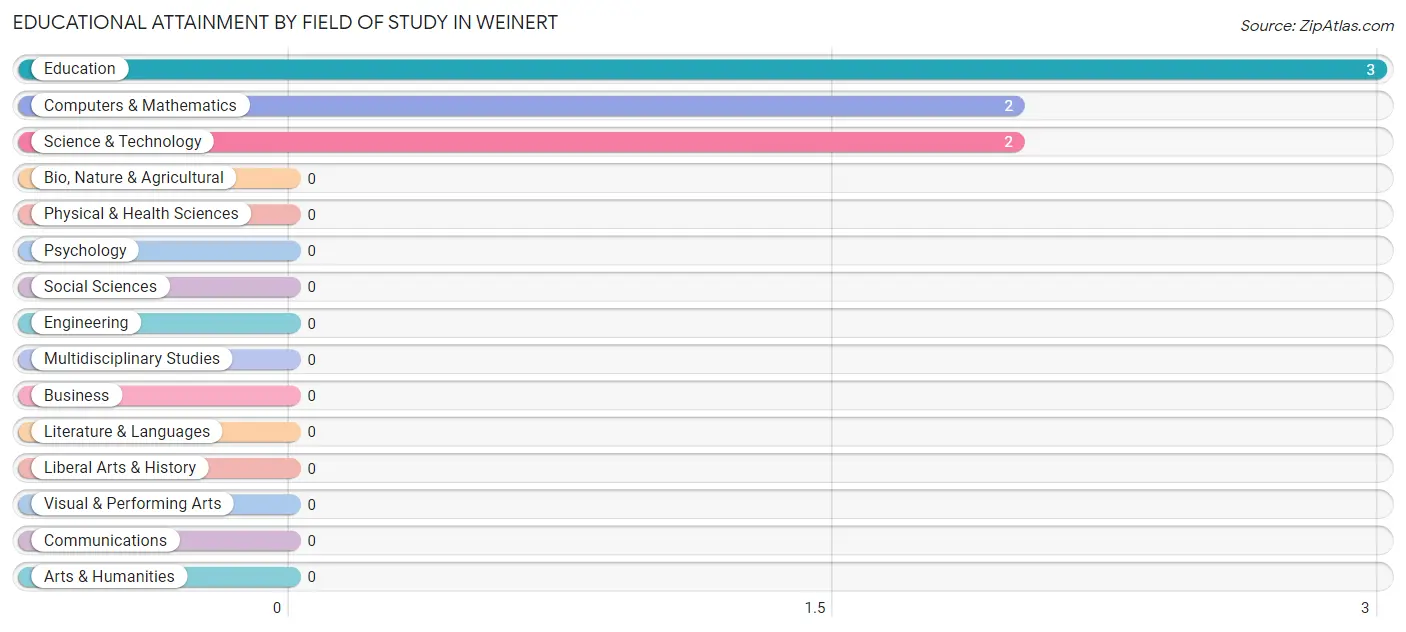
| Field of Study | # Graduates | % Graduates |
| Computers & Mathematics | 2 | 28.6% |
| Bio, Nature & Agricultural | 0 | 0.0% |
| Physical & Health Sciences | 0 | 0.0% |
| Psychology | 0 | 0.0% |
| Social Sciences | 0 | 0.0% |
| Engineering | 0 | 0.0% |
| Multidisciplinary Studies | 0 | 0.0% |
| Science & Technology | 2 | 28.6% |
| Business | 0 | 0.0% |
| Education | 3 | 42.9% |
| Literature & Languages | 0 | 0.0% |
| Liberal Arts & History | 0 | 0.0% |
| Visual & Performing Arts | 0 | 0.0% |
| Communications | 0 | 0.0% |
| Arts & Humanities | 0 | 0.0% |
| Total | 7 | 100.0% |
Transportation & Commute in Weinert
Vehicle Availability by Sex in Weinert
The most prevalent vehicle ownership categories in Weinert are males with 1 vehicle (12, accounting for 38.7%) and females with 1 vehicle (7, making up 27.9%).
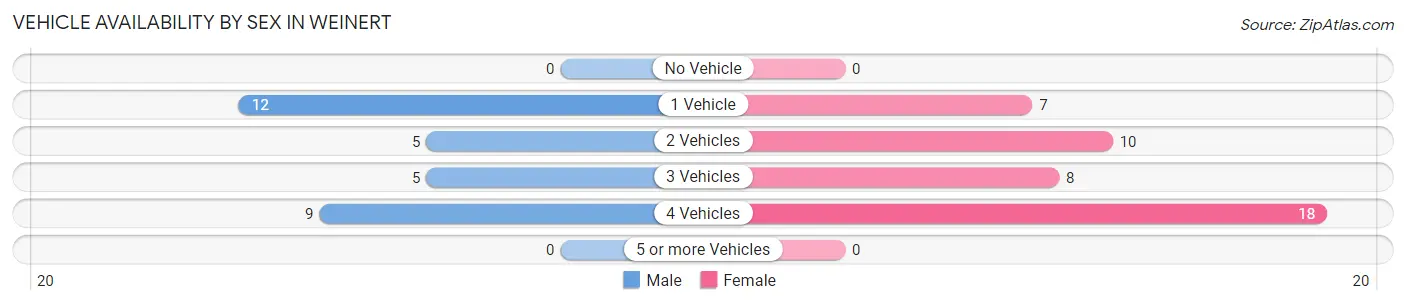
| Vehicles Available | Male | Female |
| No Vehicle | 0 (0.0%) | 0 (0.0%) |
| 1 Vehicle | 12 (38.7%) | 7 (16.3%) |
| 2 Vehicles | 5 (16.1%) | 10 (23.3%) |
| 3 Vehicles | 5 (16.1%) | 8 (18.6%) |
| 4 Vehicles | 9 (29.0%) | 18 (41.9%) |
| 5 or more Vehicles | 0 (0.0%) | 0 (0.0%) |
| Total | 31 (100.0%) | 43 (100.0%) |
Commute Time in Weinert
The most frequently occuring commute durations in Weinert are 10 to 14 minutes (25 commuters, 33.8%), 15 to 19 minutes (24 commuters, 32.4%), and less than 5 minutes (11 commuters, 14.9%).
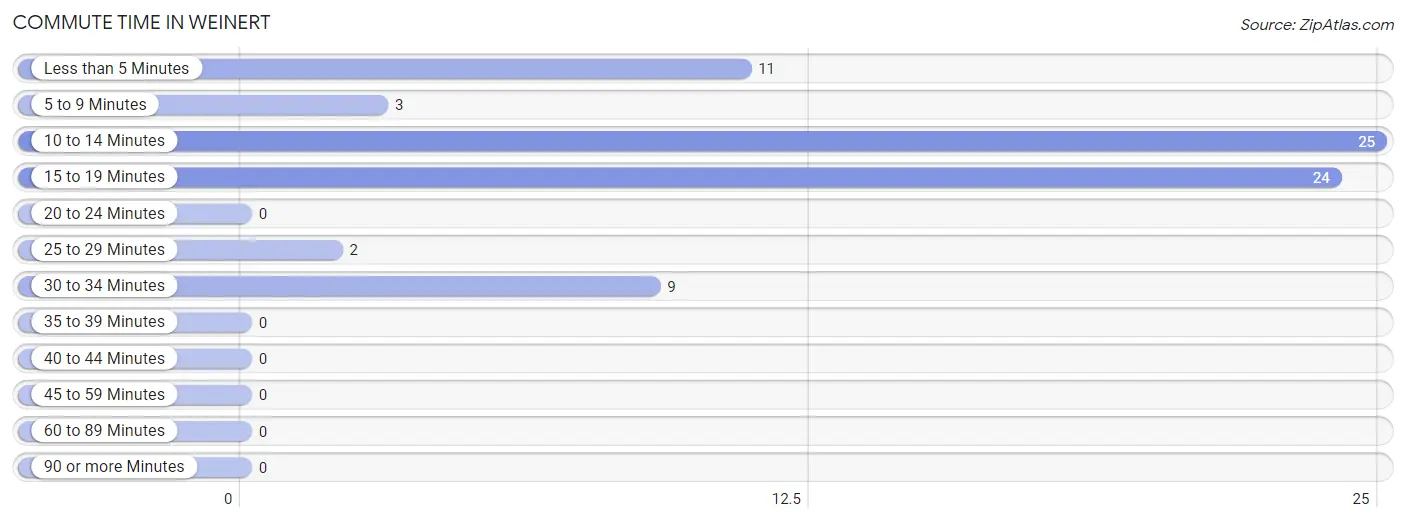
| Commute Time | # Commuters | % Commuters |
| Less than 5 Minutes | 11 | 14.9% |
| 5 to 9 Minutes | 3 | 4.1% |
| 10 to 14 Minutes | 25 | 33.8% |
| 15 to 19 Minutes | 24 | 32.4% |
| 20 to 24 Minutes | 0 | 0.0% |
| 25 to 29 Minutes | 2 | 2.7% |
| 30 to 34 Minutes | 9 | 12.2% |
| 35 to 39 Minutes | 0 | 0.0% |
| 40 to 44 Minutes | 0 | 0.0% |
| 45 to 59 Minutes | 0 | 0.0% |
| 60 to 89 Minutes | 0 | 0.0% |
| 90 or more Minutes | 0 | 0.0% |
Commute Time by Sex in Weinert
The most common commute times in Weinert are less than 5 minutes (11 commuters, 35.5%) for males and 10 to 14 minutes (16 commuters, 37.2%) for females.
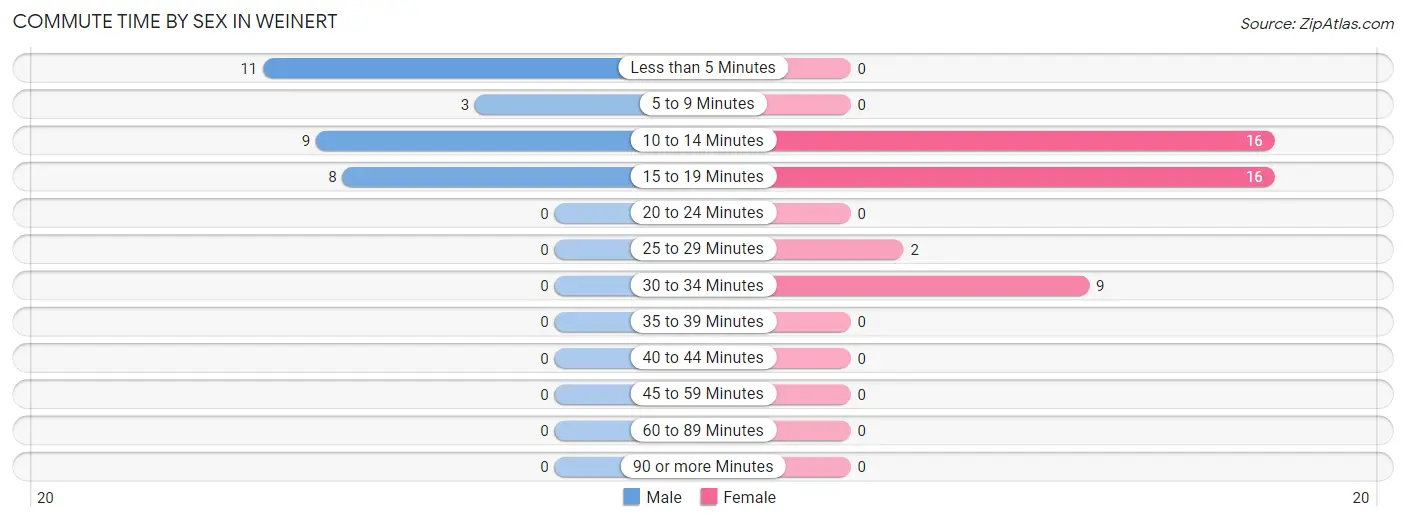
| Commute Time | Male | Female |
| Less than 5 Minutes | 11 (35.5%) | 0 (0.0%) |
| 5 to 9 Minutes | 3 (9.7%) | 0 (0.0%) |
| 10 to 14 Minutes | 9 (29.0%) | 16 (37.2%) |
| 15 to 19 Minutes | 8 (25.8%) | 16 (37.2%) |
| 20 to 24 Minutes | 0 (0.0%) | 0 (0.0%) |
| 25 to 29 Minutes | 0 (0.0%) | 2 (4.6%) |
| 30 to 34 Minutes | 0 (0.0%) | 9 (20.9%) |
| 35 to 39 Minutes | 0 (0.0%) | 0 (0.0%) |
| 40 to 44 Minutes | 0 (0.0%) | 0 (0.0%) |
| 45 to 59 Minutes | 0 (0.0%) | 0 (0.0%) |
| 60 to 89 Minutes | 0 (0.0%) | 0 (0.0%) |
| 90 or more Minutes | 0 (0.0%) | 0 (0.0%) |
Time of Departure to Work by Sex in Weinert
The most frequent times of departure to work in Weinert are 7:30 AM to 7:59 AM (19, 61.3%) for males and 7:30 AM to 7:59 AM (13, 30.2%) for females.
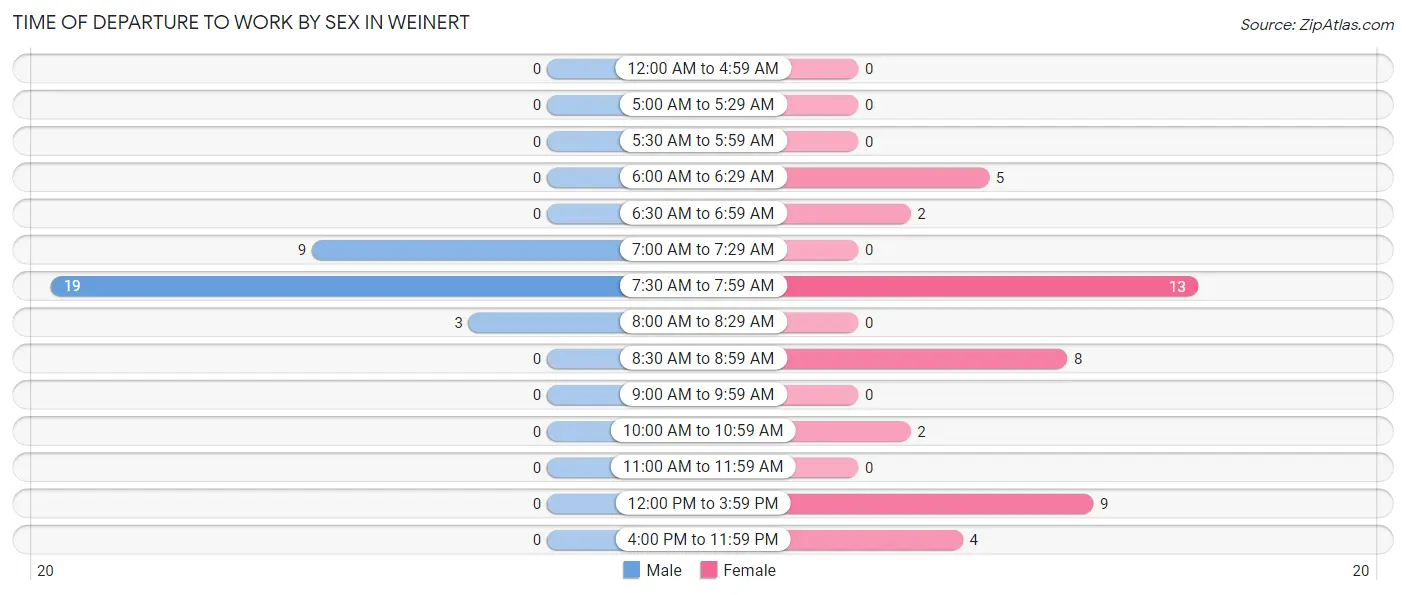
| Time of Departure | Male | Female |
| 12:00 AM to 4:59 AM | 0 (0.0%) | 0 (0.0%) |
| 5:00 AM to 5:29 AM | 0 (0.0%) | 0 (0.0%) |
| 5:30 AM to 5:59 AM | 0 (0.0%) | 0 (0.0%) |
| 6:00 AM to 6:29 AM | 0 (0.0%) | 5 (11.6%) |
| 6:30 AM to 6:59 AM | 0 (0.0%) | 2 (4.6%) |
| 7:00 AM to 7:29 AM | 9 (29.0%) | 0 (0.0%) |
| 7:30 AM to 7:59 AM | 19 (61.3%) | 13 (30.2%) |
| 8:00 AM to 8:29 AM | 3 (9.7%) | 0 (0.0%) |
| 8:30 AM to 8:59 AM | 0 (0.0%) | 8 (18.6%) |
| 9:00 AM to 9:59 AM | 0 (0.0%) | 0 (0.0%) |
| 10:00 AM to 10:59 AM | 0 (0.0%) | 2 (4.6%) |
| 11:00 AM to 11:59 AM | 0 (0.0%) | 0 (0.0%) |
| 12:00 PM to 3:59 PM | 0 (0.0%) | 9 (20.9%) |
| 4:00 PM to 11:59 PM | 0 (0.0%) | 4 (9.3%) |
| Total | 31 (100.0%) | 43 (100.0%) |
Housing Occupancy in Weinert
Occupancy by Ownership in Weinert
Of the total 75 dwellings in Weinert, owner-occupied units account for 50 (66.7%), while renter-occupied units make up 25 (33.3%).
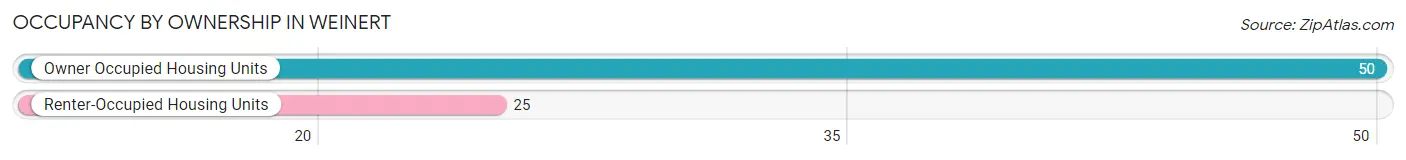
| Occupancy | # Housing Units | % Housing Units |
| Owner Occupied Housing Units | 50 | 66.7% |
| Renter-Occupied Housing Units | 25 | 33.3% |
| Total Occupied Housing Units | 75 | 100.0% |
Occupancy by Household Size in Weinert
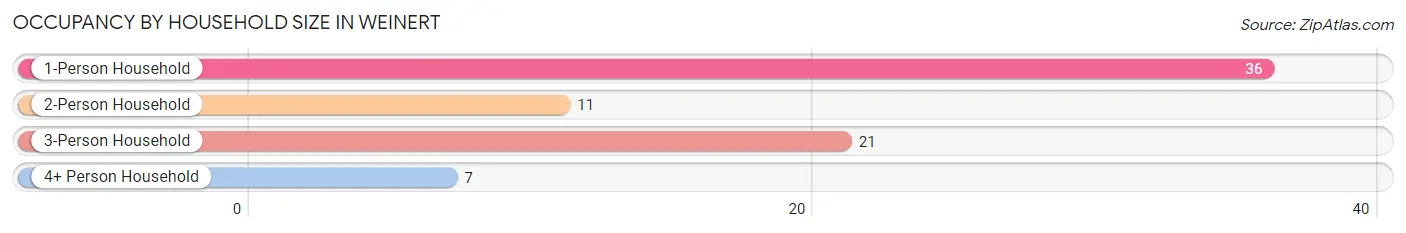
| Household Size | # Housing Units | % Housing Units |
| 1-Person Household | 36 | 48.0% |
| 2-Person Household | 11 | 14.7% |
| 3-Person Household | 21 | 28.0% |
| 4+ Person Household | 7 | 9.3% |
| Total Housing Units | 75 | 100.0% |
Occupancy by Ownership by Household Size in Weinert
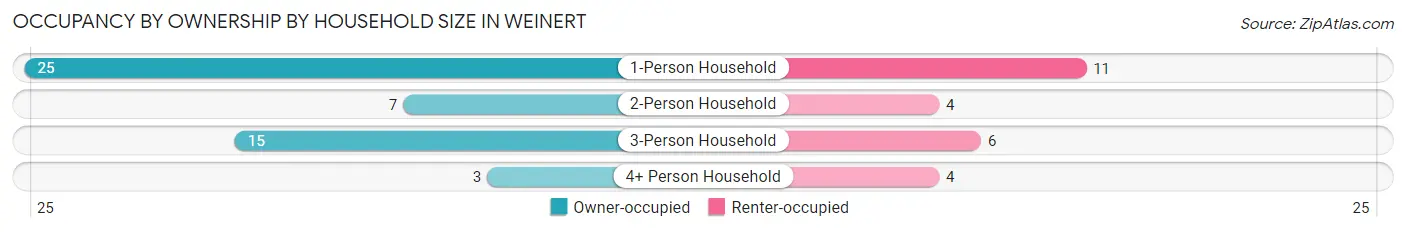
| Household Size | Owner-occupied | Renter-occupied |
| 1-Person Household | 25 (69.4%) | 11 (30.6%) |
| 2-Person Household | 7 (63.6%) | 4 (36.4%) |
| 3-Person Household | 15 (71.4%) | 6 (28.6%) |
| 4+ Person Household | 3 (42.9%) | 4 (57.1%) |
| Total Housing Units | 50 (66.7%) | 25 (33.3%) |
Occupancy by Educational Attainment in Weinert
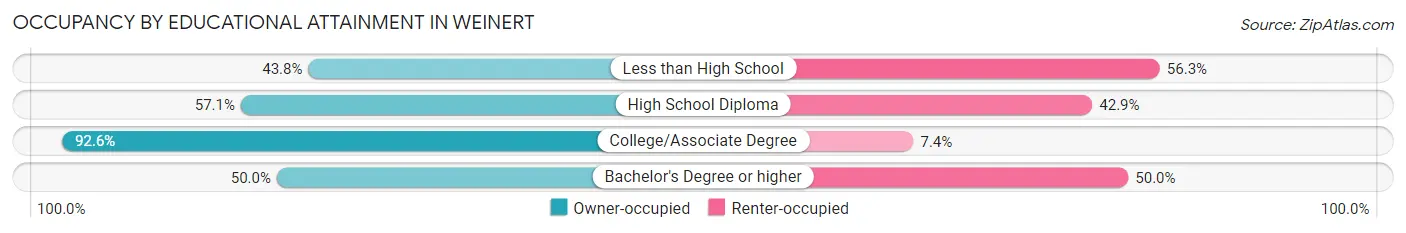
| Household Size | Owner-occupied | Renter-occupied |
| Less than High School | 7 (43.8%) | 9 (56.2%) |
| High School Diploma | 16 (57.1%) | 12 (42.9%) |
| College/Associate Degree | 25 (92.6%) | 2 (7.4%) |
| Bachelor's Degree or higher | 2 (50.0%) | 2 (50.0%) |
Occupancy by Age of Householder in Weinert
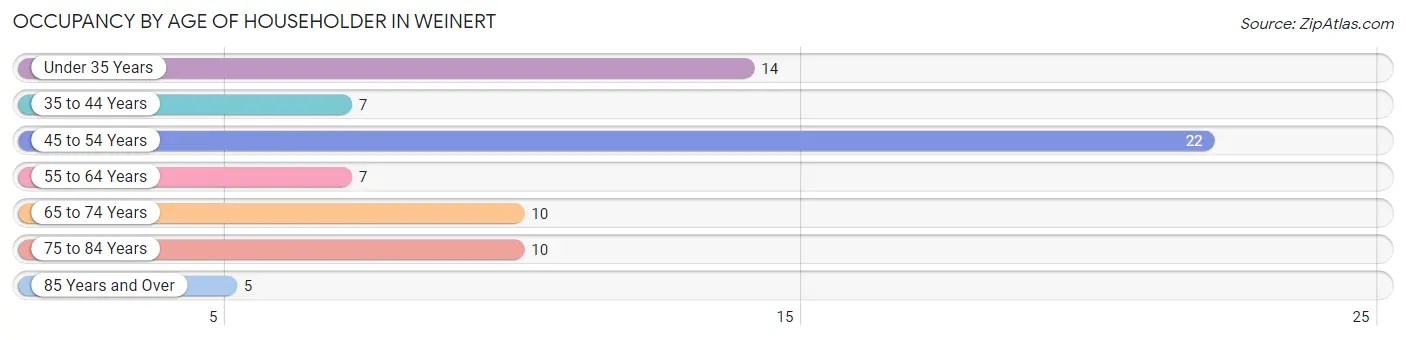
| Age Bracket | # Households | % Households |
| Under 35 Years | 14 | 18.7% |
| 35 to 44 Years | 7 | 9.3% |
| 45 to 54 Years | 22 | 29.3% |
| 55 to 64 Years | 7 | 9.3% |
| 65 to 74 Years | 10 | 13.3% |
| 75 to 84 Years | 10 | 13.3% |
| 85 Years and Over | 5 | 6.7% |
| Total | 75 | 100.0% |
Housing Finances in Weinert
Median Income by Occupancy in Weinert
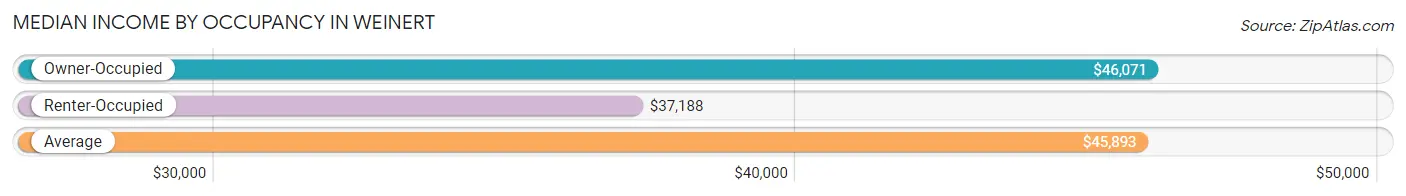
| Occupancy Type | # Households | Median Income |
| Owner-Occupied | 50 (66.7%) | $46,071 |
| Renter-Occupied | 25 (33.3%) | $37,188 |
| Average | 75 (100.0%) | $45,893 |
Occupancy by Householder Income Bracket in Weinert
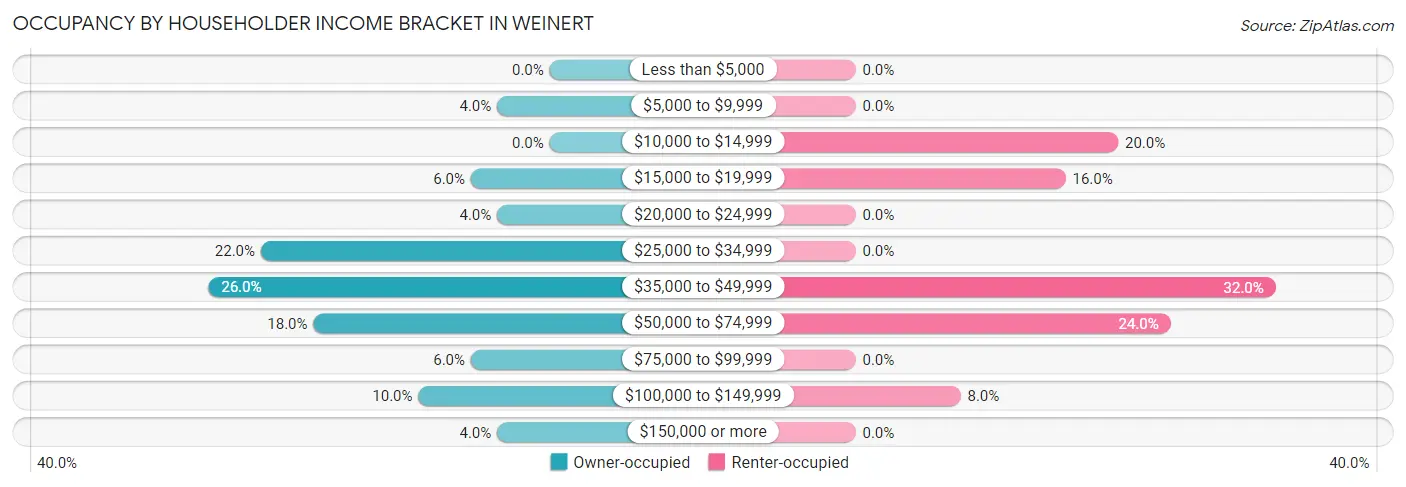
| Income Bracket | Owner-occupied | Renter-occupied |
| Less than $5,000 | 0 (0.0%) | 0 (0.0%) |
| $5,000 to $9,999 | 2 (4.0%) | 0 (0.0%) |
| $10,000 to $14,999 | 0 (0.0%) | 5 (20.0%) |
| $15,000 to $19,999 | 3 (6.0%) | 4 (16.0%) |
| $20,000 to $24,999 | 2 (4.0%) | 0 (0.0%) |
| $25,000 to $34,999 | 11 (22.0%) | 0 (0.0%) |
| $35,000 to $49,999 | 13 (26.0%) | 8 (32.0%) |
| $50,000 to $74,999 | 9 (18.0%) | 6 (24.0%) |
| $75,000 to $99,999 | 3 (6.0%) | 0 (0.0%) |
| $100,000 to $149,999 | 5 (10.0%) | 2 (8.0%) |
| $150,000 or more | 2 (4.0%) | 0 (0.0%) |
| Total | 50 (100.0%) | 25 (100.0%) |
Monthly Housing Cost Tiers in Weinert
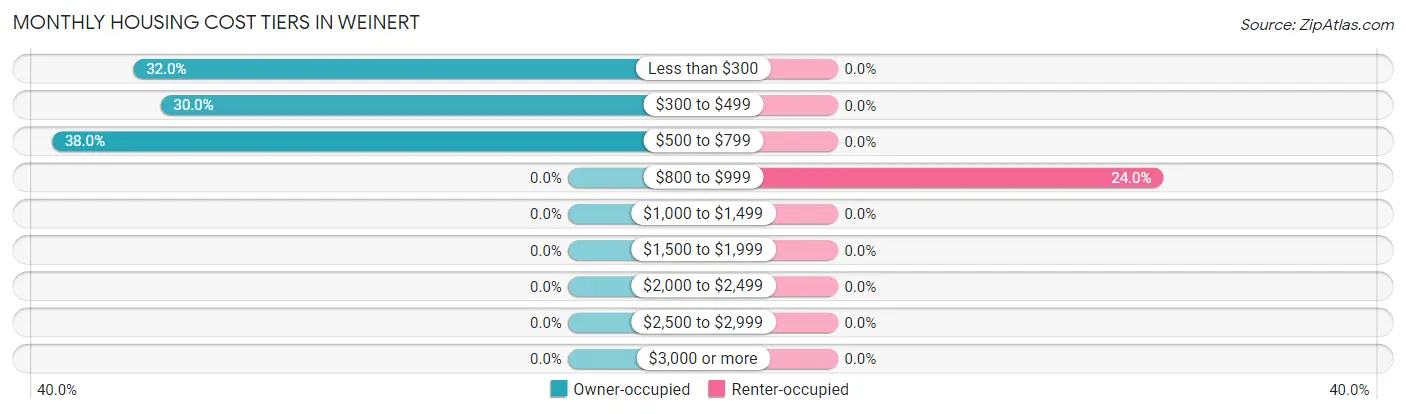
| Monthly Cost | Owner-occupied | Renter-occupied |
| Less than $300 | 16 (32.0%) | 0 (0.0%) |
| $300 to $499 | 15 (30.0%) | 0 (0.0%) |
| $500 to $799 | 19 (38.0%) | 0 (0.0%) |
| $800 to $999 | 0 (0.0%) | 6 (24.0%) |
| $1,000 to $1,499 | 0 (0.0%) | 0 (0.0%) |
| $1,500 to $1,999 | 0 (0.0%) | 0 (0.0%) |
| $2,000 to $2,499 | 0 (0.0%) | 0 (0.0%) |
| $2,500 to $2,999 | 0 (0.0%) | 0 (0.0%) |
| $3,000 or more | 0 (0.0%) | 0 (0.0%) |
| Total | 50 (100.0%) | 25 (100.0%) |
Physical Housing Characteristics in Weinert
Housing Structures in Weinert
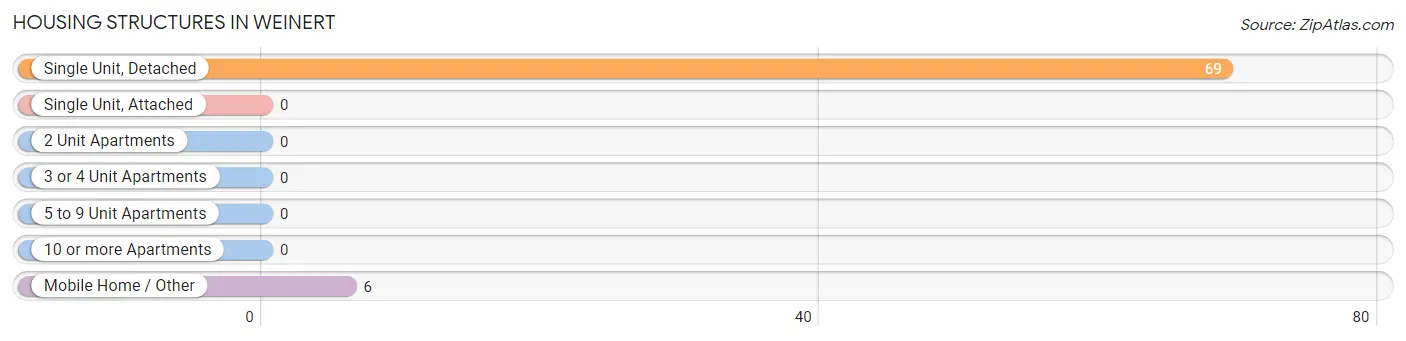
| Structure Type | # Housing Units | % Housing Units |
| Single Unit, Detached | 69 | 92.0% |
| Single Unit, Attached | 0 | 0.0% |
| 2 Unit Apartments | 0 | 0.0% |
| 3 or 4 Unit Apartments | 0 | 0.0% |
| 5 to 9 Unit Apartments | 0 | 0.0% |
| 10 or more Apartments | 0 | 0.0% |
| Mobile Home / Other | 6 | 8.0% |
| Total | 75 | 100.0% |
Housing Structures by Occupancy in Weinert
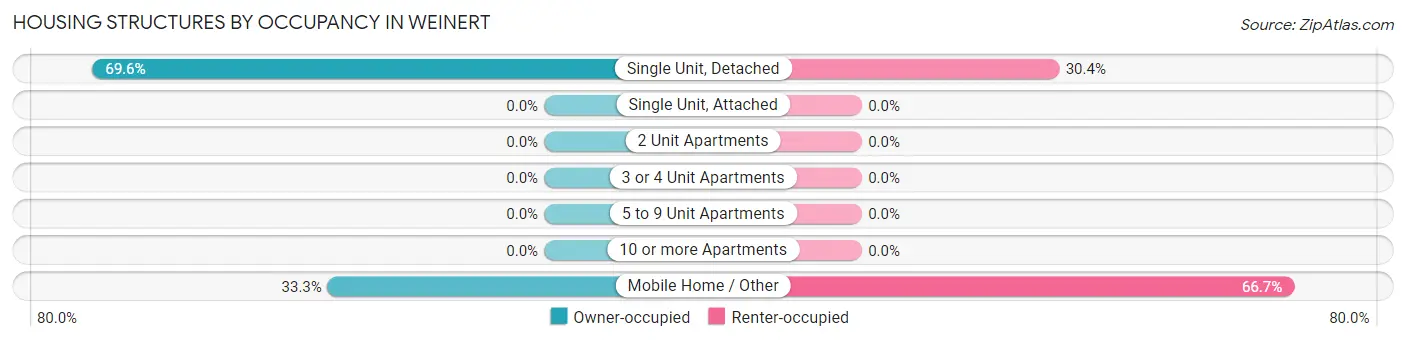
| Structure Type | Owner-occupied | Renter-occupied |
| Single Unit, Detached | 48 (69.6%) | 21 (30.4%) |
| Single Unit, Attached | 0 (0.0%) | 0 (0.0%) |
| 2 Unit Apartments | 0 (0.0%) | 0 (0.0%) |
| 3 or 4 Unit Apartments | 0 (0.0%) | 0 (0.0%) |
| 5 to 9 Unit Apartments | 0 (0.0%) | 0 (0.0%) |
| 10 or more Apartments | 0 (0.0%) | 0 (0.0%) |
| Mobile Home / Other | 2 (33.3%) | 4 (66.7%) |
| Total | 50 (66.7%) | 25 (33.3%) |
Housing Structures by Number of Rooms in Weinert
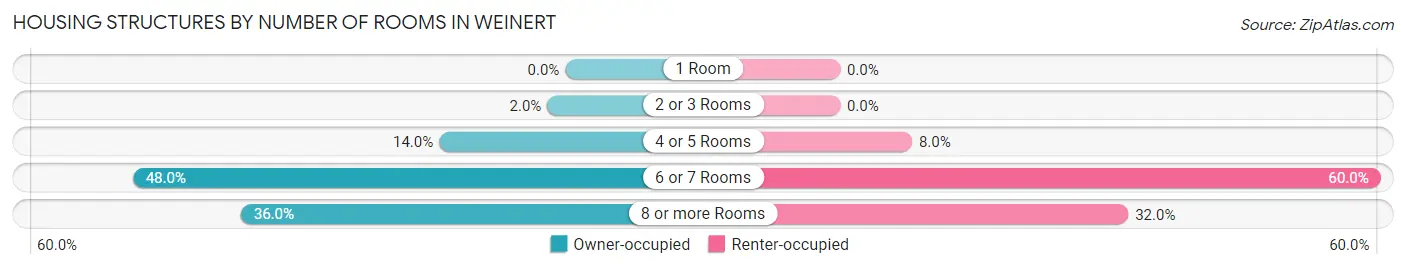
| Number of Rooms | Owner-occupied | Renter-occupied |
| 1 Room | 0 (0.0%) | 0 (0.0%) |
| 2 or 3 Rooms | 1 (2.0%) | 0 (0.0%) |
| 4 or 5 Rooms | 7 (14.0%) | 2 (8.0%) |
| 6 or 7 Rooms | 24 (48.0%) | 15 (60.0%) |
| 8 or more Rooms | 18 (36.0%) | 8 (32.0%) |
| Total | 50 (100.0%) | 25 (100.0%) |
Housing Structure by Heating Type in Weinert
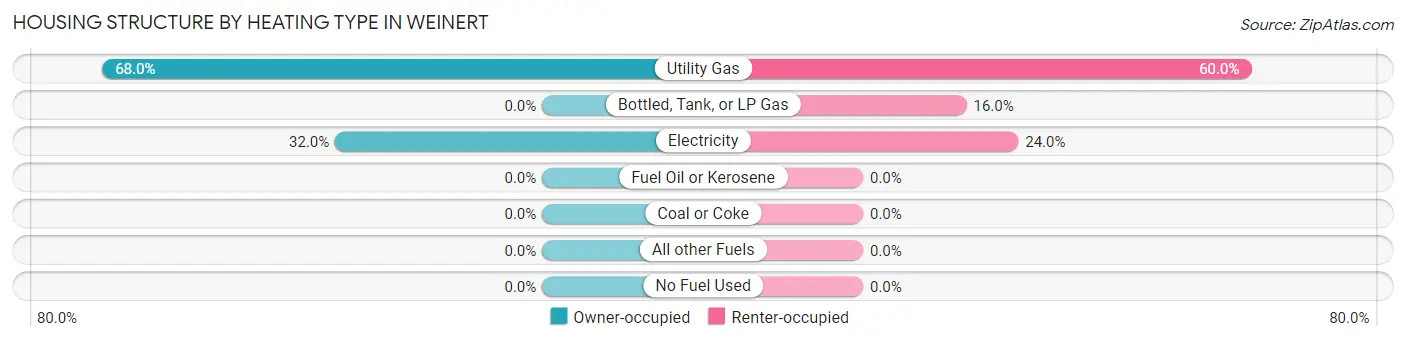
| Heating Type | Owner-occupied | Renter-occupied |
| Utility Gas | 34 (68.0%) | 15 (60.0%) |
| Bottled, Tank, or LP Gas | 0 (0.0%) | 4 (16.0%) |
| Electricity | 16 (32.0%) | 6 (24.0%) |
| Fuel Oil or Kerosene | 0 (0.0%) | 0 (0.0%) |
| Coal or Coke | 0 (0.0%) | 0 (0.0%) |
| All other Fuels | 0 (0.0%) | 0 (0.0%) |
| No Fuel Used | 0 (0.0%) | 0 (0.0%) |
| Total | 50 (100.0%) | 25 (100.0%) |
Household Vehicle Usage in Weinert
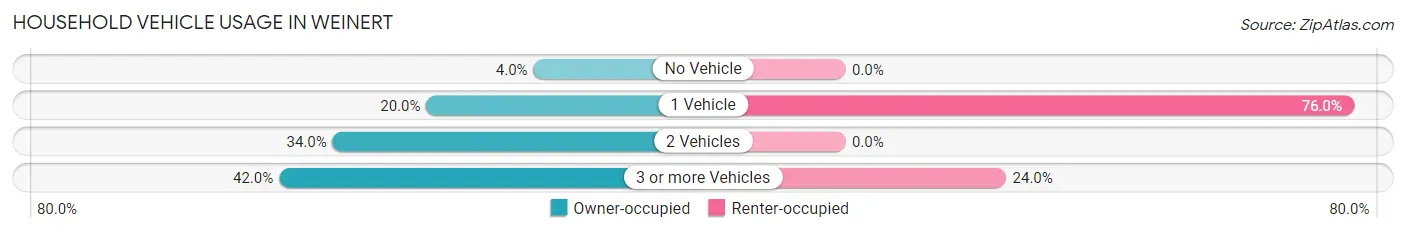
| Vehicles per Household | Owner-occupied | Renter-occupied |
| No Vehicle | 2 (4.0%) | 0 (0.0%) |
| 1 Vehicle | 10 (20.0%) | 19 (76.0%) |
| 2 Vehicles | 17 (34.0%) | 0 (0.0%) |
| 3 or more Vehicles | 21 (42.0%) | 6 (24.0%) |
| Total | 50 (100.0%) | 25 (100.0%) |
Real Estate & Mortgages in Weinert
Real Estate and Mortgage Overview in Weinert
| Characteristic | Without Mortgage | With Mortgage |
| Housing Units | 50 | 0 |
| Median Property Value | $50,000 | $0 |
| Median Household Income | $46,071 | $0 |
| Monthly Housing Costs | $445 | $0 |
| Real Estate Taxes | $800 | $0 |
Property Value by Mortgage Status in Weinert
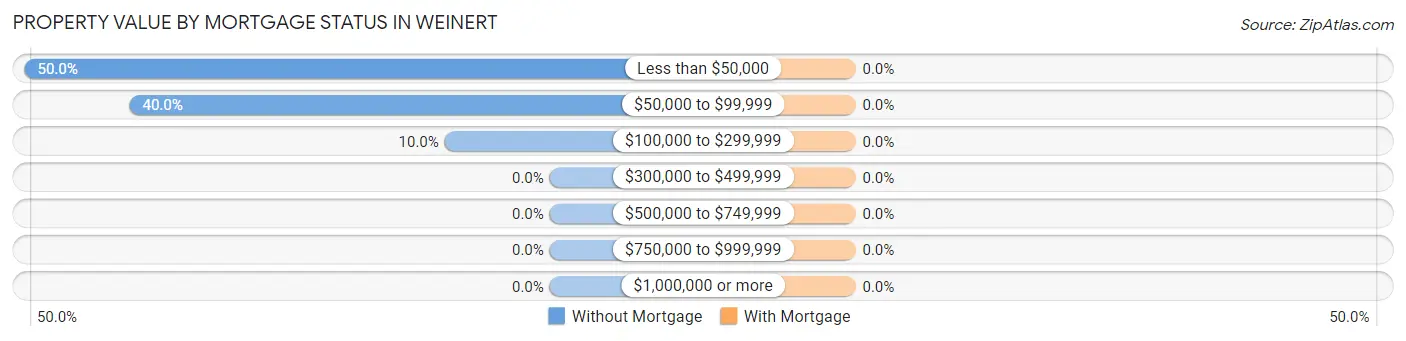
| Property Value | Without Mortgage | With Mortgage |
| Less than $50,000 | 25 (50.0%) | 0 (0.0%) |
| $50,000 to $99,999 | 20 (40.0%) | 0 (0.0%) |
| $100,000 to $299,999 | 5 (10.0%) | 0 (0.0%) |
| $300,000 to $499,999 | 0 (0.0%) | 0 (0.0%) |
| $500,000 to $749,999 | 0 (0.0%) | 0 (0.0%) |
| $750,000 to $999,999 | 0 (0.0%) | 0 (0.0%) |
| $1,000,000 or more | 0 (0.0%) | 0 (0.0%) |
| Total | 50 (100.0%) | 0 (0.0%) |
Household Income by Mortgage Status in Weinert
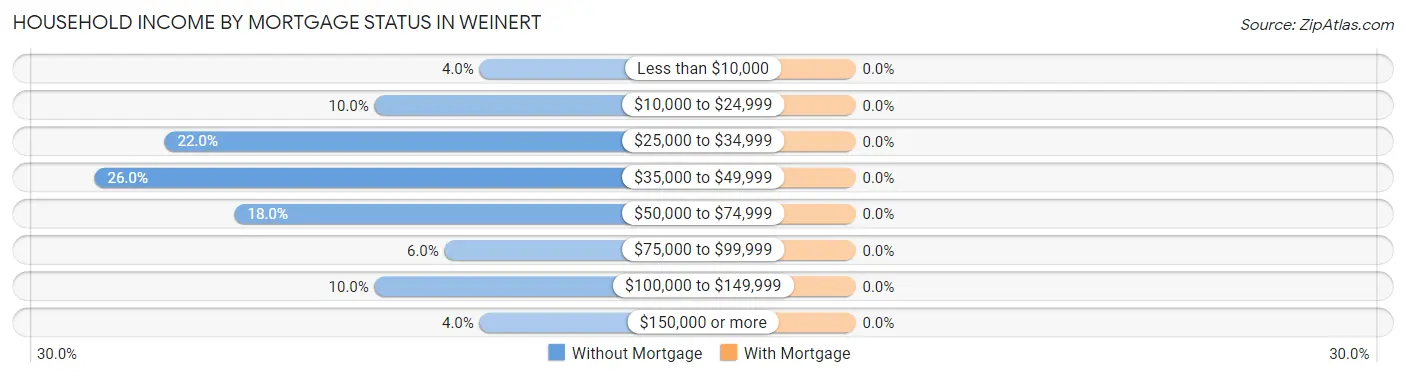
| Household Income | Without Mortgage | With Mortgage |
| Less than $10,000 | 2 (4.0%) | 0 (0.0%) |
| $10,000 to $24,999 | 5 (10.0%) | 0 (0.0%) |
| $25,000 to $34,999 | 11 (22.0%) | 0 (0.0%) |
| $35,000 to $49,999 | 13 (26.0%) | 0 (0.0%) |
| $50,000 to $74,999 | 9 (18.0%) | 0 (0.0%) |
| $75,000 to $99,999 | 3 (6.0%) | 0 (0.0%) |
| $100,000 to $149,999 | 5 (10.0%) | 0 (0.0%) |
| $150,000 or more | 2 (4.0%) | 0 (0.0%) |
| Total | 50 (100.0%) | 0 (0.0%) |
Property Value to Household Income Ratio in Weinert
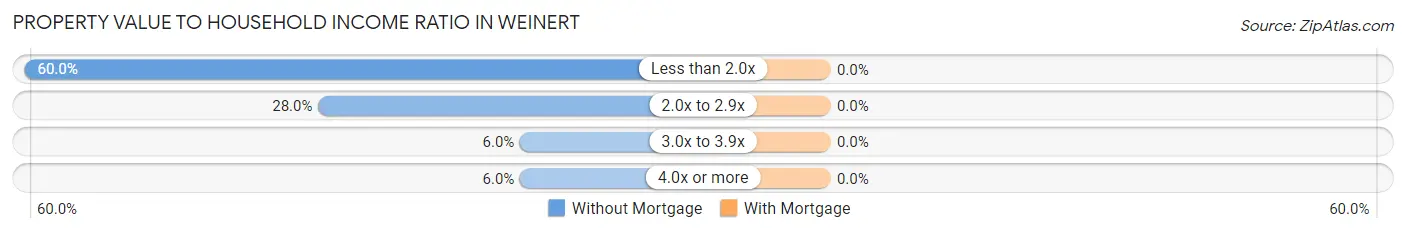
| Value-to-Income Ratio | Without Mortgage | With Mortgage |
| Less than 2.0x | 30 (60.0%) | 0 (0.0%) |
| 2.0x to 2.9x | 14 (28.0%) | 0 (0.0%) |
| 3.0x to 3.9x | 3 (6.0%) | 0 (0.0%) |
| 4.0x or more | 3 (6.0%) | 0 (0.0%) |
| Total | 50 (100.0%) | 0 (0.0%) |
Real Estate Taxes by Mortgage Status in Weinert
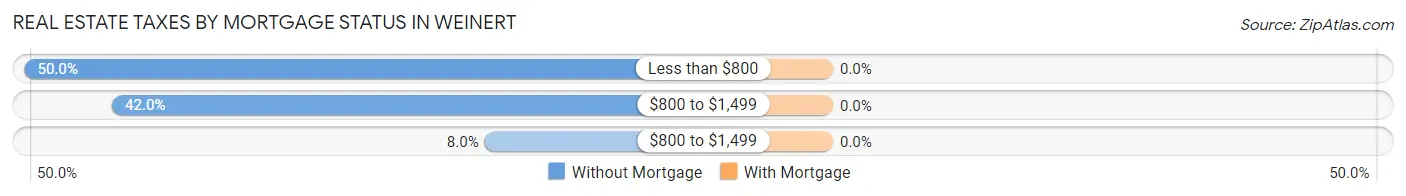
| Property Taxes | Without Mortgage | With Mortgage |
| Less than $800 | 25 (50.0%) | 0 (0.0%) |
| $800 to $1,499 | 21 (42.0%) | 0 (0.0%) |
| $800 to $1,499 | 4 (8.0%) | 0 (0.0%) |
| Total | 50 (100.0%) | 0 (0.0%) |
Health & Disability in Weinert
Health Insurance Coverage by Age in Weinert
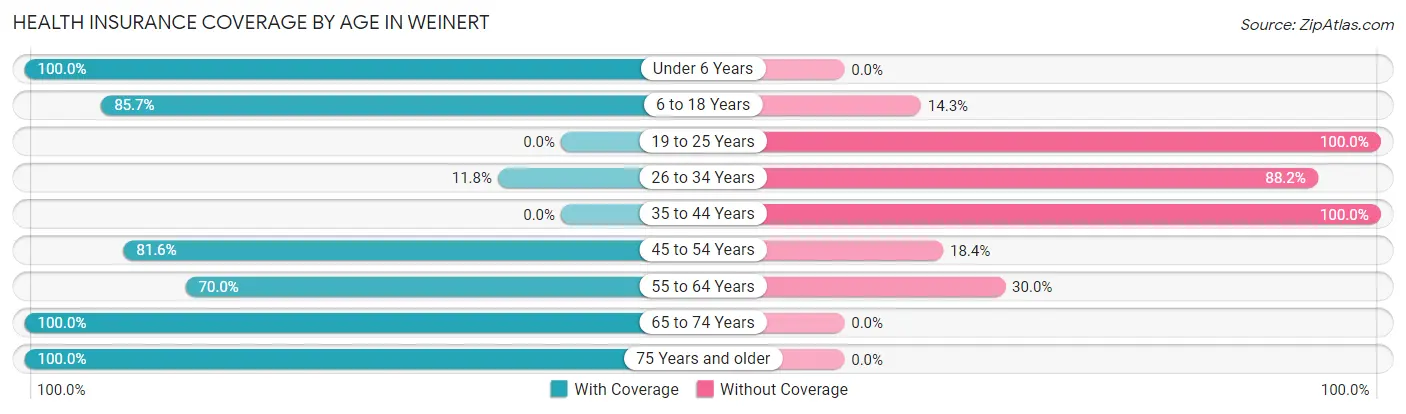
| Age Bracket | With Coverage | Without Coverage |
| Under 6 Years | 6 (100.0%) | 0 (0.0%) |
| 6 to 18 Years | 24 (85.7%) | 4 (14.3%) |
| 19 to 25 Years | 0 (0.0%) | 20 (100.0%) |
| 26 to 34 Years | 2 (11.8%) | 15 (88.2%) |
| 35 to 44 Years | 0 (0.0%) | 12 (100.0%) |
| 45 to 54 Years | 31 (81.6%) | 7 (18.4%) |
| 55 to 64 Years | 7 (70.0%) | 3 (30.0%) |
| 65 to 74 Years | 18 (100.0%) | 0 (0.0%) |
| 75 Years and older | 20 (100.0%) | 0 (0.0%) |
| Total | 108 (63.9%) | 61 (36.1%) |
Health Insurance Coverage by Citizenship Status in Weinert
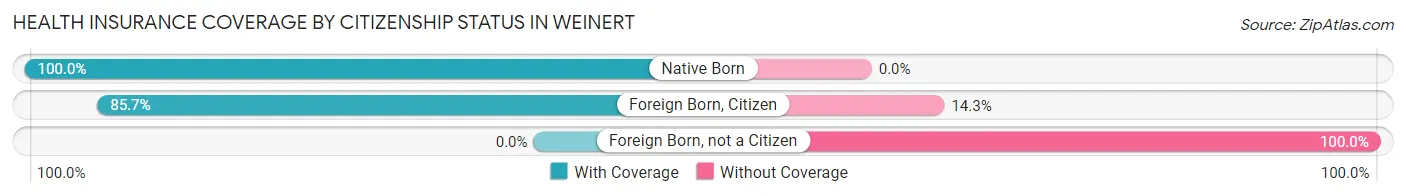
| Citizenship Status | With Coverage | Without Coverage |
| Native Born | 6 (100.0%) | 0 (0.0%) |
| Foreign Born, Citizen | 24 (85.7%) | 4 (14.3%) |
| Foreign Born, not a Citizen | 0 (0.0%) | 20 (100.0%) |
Health Insurance Coverage by Household Income in Weinert
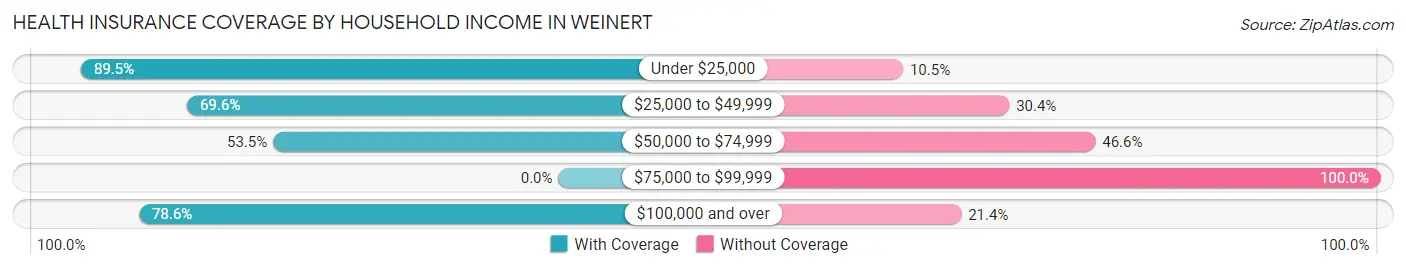
| Household Income | With Coverage | Without Coverage |
| Under $25,000 | 34 (89.5%) | 4 (10.5%) |
| $25,000 to $49,999 | 32 (69.6%) | 14 (30.4%) |
| $50,000 to $74,999 | 31 (53.4%) | 27 (46.6%) |
| $75,000 to $99,999 | 0 (0.0%) | 13 (100.0%) |
| $100,000 and over | 11 (78.6%) | 3 (21.4%) |
Public vs Private Health Insurance Coverage by Age in Weinert
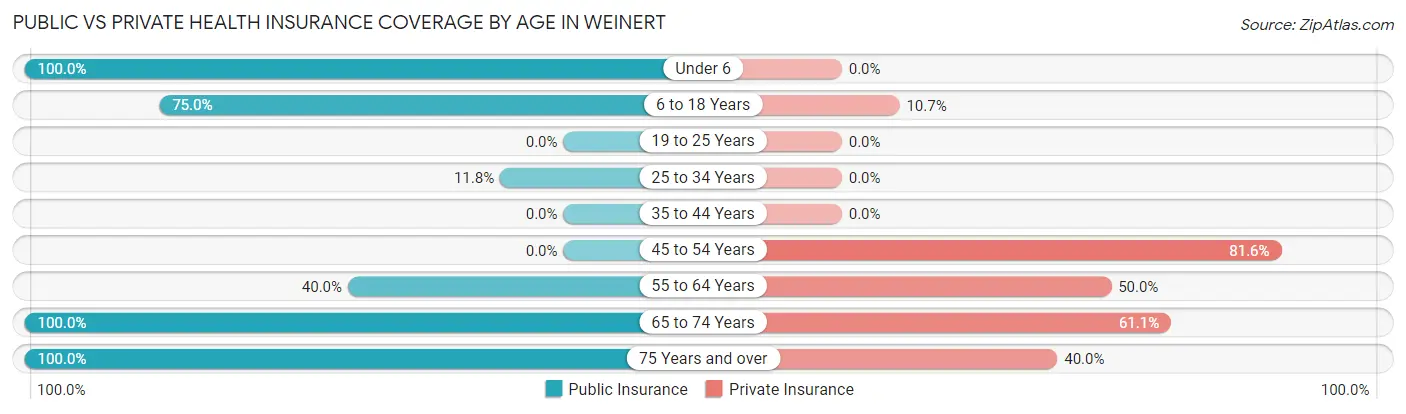
| Age Bracket | Public Insurance | Private Insurance |
| Under 6 | 6 (100.0%) | 0 (0.0%) |
| 6 to 18 Years | 21 (75.0%) | 3 (10.7%) |
| 19 to 25 Years | 0 (0.0%) | 0 (0.0%) |
| 25 to 34 Years | 2 (11.8%) | 0 (0.0%) |
| 35 to 44 Years | 0 (0.0%) | 0 (0.0%) |
| 45 to 54 Years | 0 (0.0%) | 31 (81.6%) |
| 55 to 64 Years | 4 (40.0%) | 5 (50.0%) |
| 65 to 74 Years | 18 (100.0%) | 11 (61.1%) |
| 75 Years and over | 20 (100.0%) | 8 (40.0%) |
| Total | 71 (42.0%) | 58 (34.3%) |
Disability Status by Sex by Age in Weinert
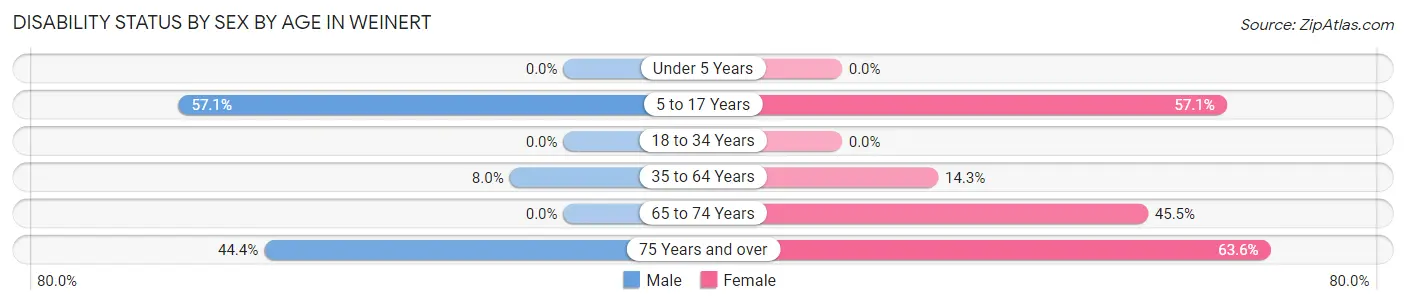
| Age Bracket | Male | Female |
| Under 5 Years | 0 (0.0%) | 0 (0.0%) |
| 5 to 17 Years | 8 (57.1%) | 4 (57.1%) |
| 18 to 34 Years | 0 (0.0%) | 0 (0.0%) |
| 35 to 64 Years | 2 (8.0%) | 5 (14.3%) |
| 65 to 74 Years | 0 (0.0%) | 5 (45.5%) |
| 75 Years and over | 4 (44.4%) | 7 (63.6%) |
Disability Class by Sex by Age in Weinert
Disability Class: Hearing Difficulty
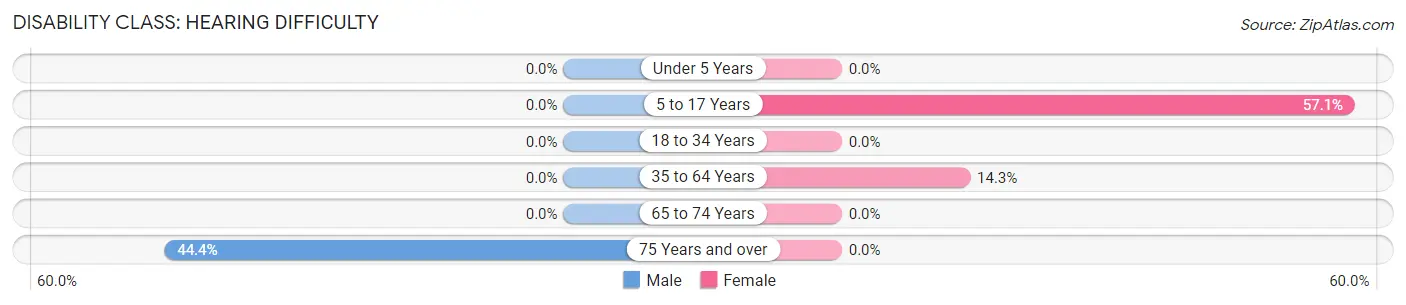
| Age Bracket | Male | Female |
| Under 5 Years | 0 (0.0%) | 0 (0.0%) |
| 5 to 17 Years | 0 (0.0%) | 4 (57.1%) |
| 18 to 34 Years | 0 (0.0%) | 0 (0.0%) |
| 35 to 64 Years | 0 (0.0%) | 5 (14.3%) |
| 65 to 74 Years | 0 (0.0%) | 0 (0.0%) |
| 75 Years and over | 4 (44.4%) | 0 (0.0%) |
Disability Class: Vision Difficulty
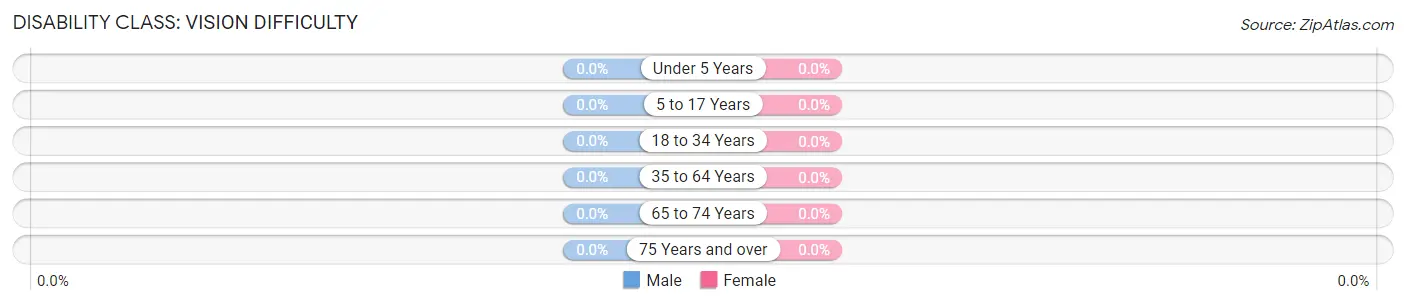
| Age Bracket | Male | Female |
| Under 5 Years | 0 (0.0%) | 0 (0.0%) |
| 5 to 17 Years | 0 (0.0%) | 0 (0.0%) |
| 18 to 34 Years | 0 (0.0%) | 0 (0.0%) |
| 35 to 64 Years | 0 (0.0%) | 0 (0.0%) |
| 65 to 74 Years | 0 (0.0%) | 0 (0.0%) |
| 75 Years and over | 0 (0.0%) | 0 (0.0%) |
Disability Class: Cognitive Difficulty
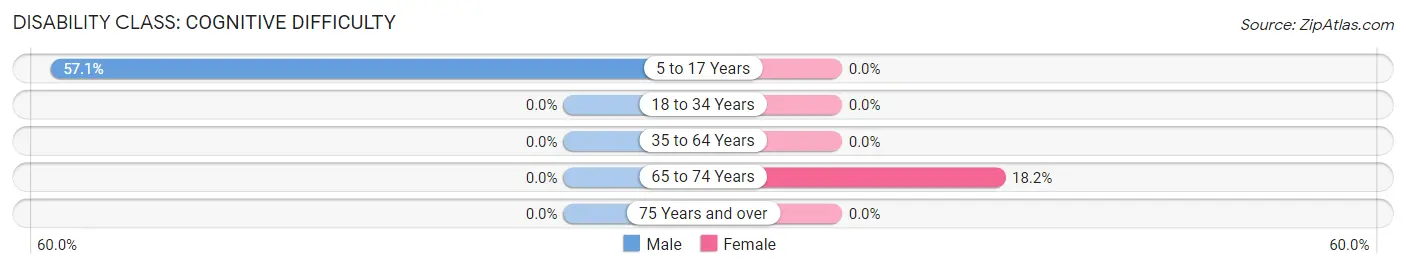
| Age Bracket | Male | Female |
| 5 to 17 Years | 8 (57.1%) | 0 (0.0%) |
| 18 to 34 Years | 0 (0.0%) | 0 (0.0%) |
| 35 to 64 Years | 0 (0.0%) | 0 (0.0%) |
| 65 to 74 Years | 0 (0.0%) | 2 (18.2%) |
| 75 Years and over | 0 (0.0%) | 0 (0.0%) |
Disability Class: Ambulatory Difficulty
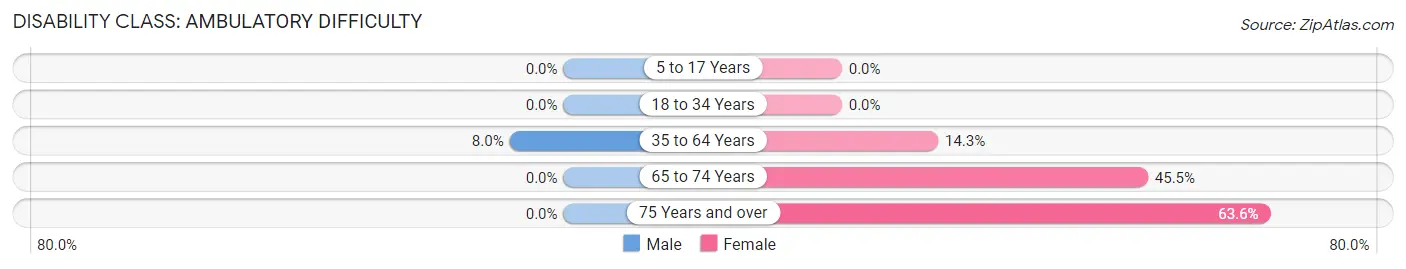
| Age Bracket | Male | Female |
| 5 to 17 Years | 0 (0.0%) | 0 (0.0%) |
| 18 to 34 Years | 0 (0.0%) | 0 (0.0%) |
| 35 to 64 Years | 2 (8.0%) | 5 (14.3%) |
| 65 to 74 Years | 0 (0.0%) | 5 (45.5%) |
| 75 Years and over | 0 (0.0%) | 7 (63.6%) |
Disability Class: Self-Care Difficulty
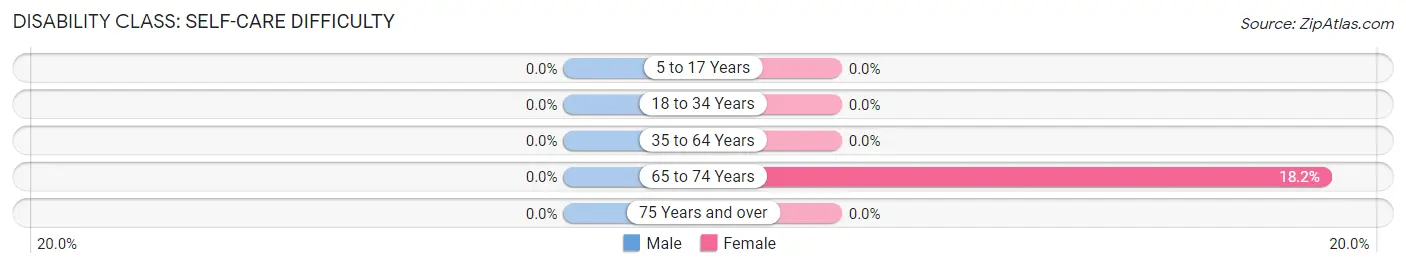
| Age Bracket | Male | Female |
| 5 to 17 Years | 0 (0.0%) | 0 (0.0%) |
| 18 to 34 Years | 0 (0.0%) | 0 (0.0%) |
| 35 to 64 Years | 0 (0.0%) | 0 (0.0%) |
| 65 to 74 Years | 0 (0.0%) | 2 (18.2%) |
| 75 Years and over | 0 (0.0%) | 0 (0.0%) |
Technology Access in Weinert
Computing Device Access in Weinert
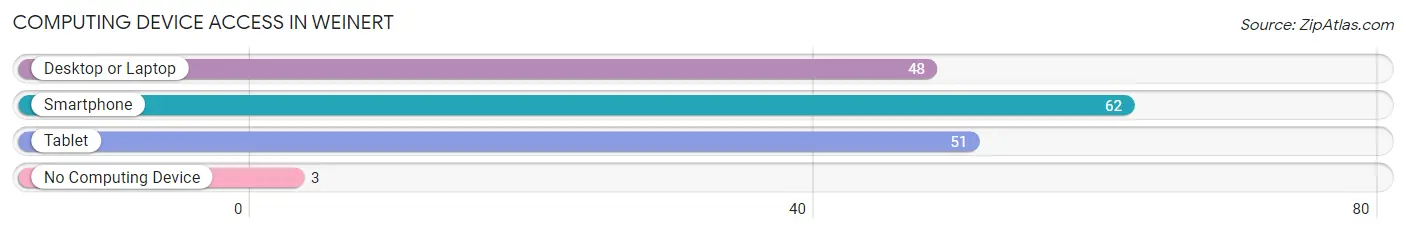
| Device Type | # Households | % Households |
| Desktop or Laptop | 48 | 64.0% |
| Smartphone | 62 | 82.7% |
| Tablet | 51 | 68.0% |
| No Computing Device | 3 | 4.0% |
| Total | 75 | 100.0% |
Internet Access in Weinert
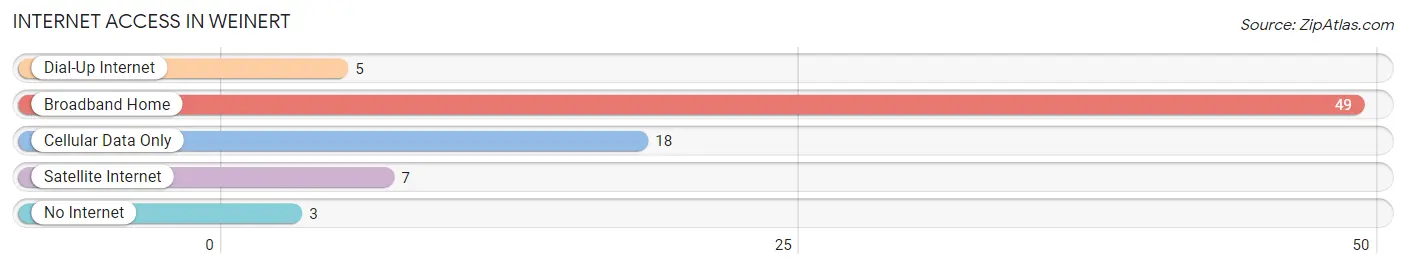
| Internet Type | # Households | % Households |
| Dial-Up Internet | 5 | 6.7% |
| Broadband Home | 49 | 65.3% |
| Cellular Data Only | 18 | 24.0% |
| Satellite Internet | 7 | 9.3% |
| No Internet | 3 | 4.0% |
| Total | 75 | 100.0% |
Weinert Summary
Weinert, Texas is a small unincorporated community located in the northern part of the state, in Clay County. It is situated about 20 miles northwest of Wichita Falls and about 30 miles south of the Oklahoma border. The population of Weinert was estimated to be around 200 people in 2020.
History
Weinert was founded in 1891 by German immigrants who had settled in the area. The town was named after one of the original settlers, John Weinert. The town was originally a farming community, but it soon became a center for the local oil industry. In the early 1900s, the town was home to several oil wells, and the population grew to over 500 people.
In the 1920s, the town experienced a boom in population and businesses. The town had a bank, a hotel, a movie theater, and several stores. The town also had a school, which was attended by students from the surrounding area.
In the 1930s, the Great Depression hit Weinert hard. Many of the businesses closed, and the population declined. The town was able to survive, however, and by the 1940s, the population had grown to over 600 people.
Geography
Weinert is located in the northern part of Clay County, Texas. It is situated about 20 miles northwest of Wichita Falls and about 30 miles south of the Oklahoma border. The town is located in the Red River Valley, which is a flat, fertile area that is ideal for farming. The town is surrounded by rolling hills and is located near the Red River.
Economy
Weinert’s economy is largely based on agriculture. The town is home to several farms, which produce a variety of crops, including cotton, corn, wheat, and hay. The town also has several oil wells, which provide jobs for many of the town’s residents.
In addition to agriculture and oil, Weinert also has a few small businesses, including a grocery store, a hardware store, and a few restaurants. The town also has a post office and a few churches.
Demographics
Weinert is a small, rural community with a population of around 200 people. The town is predominantly white, with a small Hispanic population. The median household income in Weinert is around $30,000, and the median home value is around $80,000. The town has a low unemployment rate and a low crime rate.
Conclusion
Weinert, Texas is a small, rural community located in the northern part of the state. The town was founded in 1891 by German immigrants and has a population of around 200 people. The town’s economy is largely based on agriculture and oil, and it has a few small businesses. The town is predominantly white, with a small Hispanic population, and has a median household income of around $30,000. Weinert is a peaceful, quiet town with a low crime rate and a low unemployment rate.
Common Questions
What is Per Capita Income in Weinert?
Per Capita income in Weinert is $22,655.
What is the Median Family Income in Weinert?
Median Family Income in Weinert is $68,542.
What is the Median Household income in Weinert?
Median Household Income in Weinert is $45,893.
What is Inequality or Gini Index in Weinert?
Inequality or Gini Index in Weinert is 0.35.
What is the Total Population of Weinert?
Total Population of Weinert is 169.
What is the Total Male Population of Weinert?
Total Male Population of Weinert is 75.
What is the Total Female Population of Weinert?
Total Female Population of Weinert is 94.
What is the Ratio of Males per 100 Females in Weinert?
There are 79.79 Males per 100 Females in Weinert.
What is the Ratio of Females per 100 Males in Weinert?
There are 125.33 Females per 100 Males in Weinert.
What is the Median Population Age in Weinert?
Median Population Age in Weinert is 46.2 Years.
What is the Average Family Size in Weinert
Average Family Size in Weinert is 3.3 People.
What is the Average Household Size in Weinert
Average Household Size in Weinert is 2.2 People.
How Large is the Labor Force in Weinert?
There are 78 People in the Labor Forcein in Weinert.
What is the Percentage of People in the Labor Force in Weinert?
54.9% of People are in the Labor Force in Weinert.
What is the Unemployment Rate in Weinert?
Unemployment Rate in Weinert is 5.1%.