Utopia, TX Map & Demographics
Utopia Map
Utopia Overview
$42,348
PER CAPITA INCOME
$78,750
AVG FAMILY INCOME
$107,619
AVG HOUSEHOLD INCOME
48.7%
WAGE / INCOME GAP [ % ]
51.3¢/ $1
WAGE / INCOME GAP [ $ ]
0.15
INEQUALITY / GINI INDEX
228
TOTAL POPULATION
156
MALE POPULATION
72
FEMALE POPULATION
216.67
MALES / 100 FEMALES
46.15
FEMALES / 100 MALES
32.6
MEDIAN AGE
3.3
AVG FAMILY SIZE
2.5
AVG HOUSEHOLD SIZE
173
LABOR FORCE [ PEOPLE ]
93.0%
PERCENT IN LABOR FORCE
Utopia Zip Codes
Utopia Area Codes
Income in Utopia
Income Overview in Utopia
Per Capita Income in Utopia is $42,348, while median incomes of families and households are $78,750 and $107,619 respectively.
| Characteristic | Number | Measure |
| Per Capita Income | 228 | $42,348 |
| Median Family Income | 48 | $78,750 |
| Mean Family Income | 48 | $78,192 |
| Median Household Income | 90 | $107,619 |
| Mean Household Income | 90 | $98,233 |
| Income Deficit | 48 | $0 |
| Wage / Income Gap (%) | 228 | 48.70% |
| Wage / Income Gap ($) | 228 | 51.30¢ per $1 |
| Gini / Inequality Index | 228 | 0.15 |
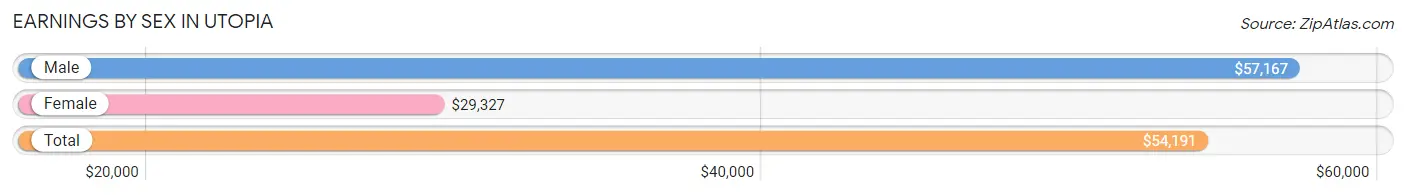
Earnings by Sex in Utopia
Average Earnings in Utopia are $54,191, $57,167 for men and $29,327 for women, a difference of 48.7%.
| Sex | Number | Average Earnings |
| Male | 118 (68.2%) | $57,167 |
| Female | 55 (31.8%) | $29,327 |
| Total | 173 (100.0%) | $54,191 |
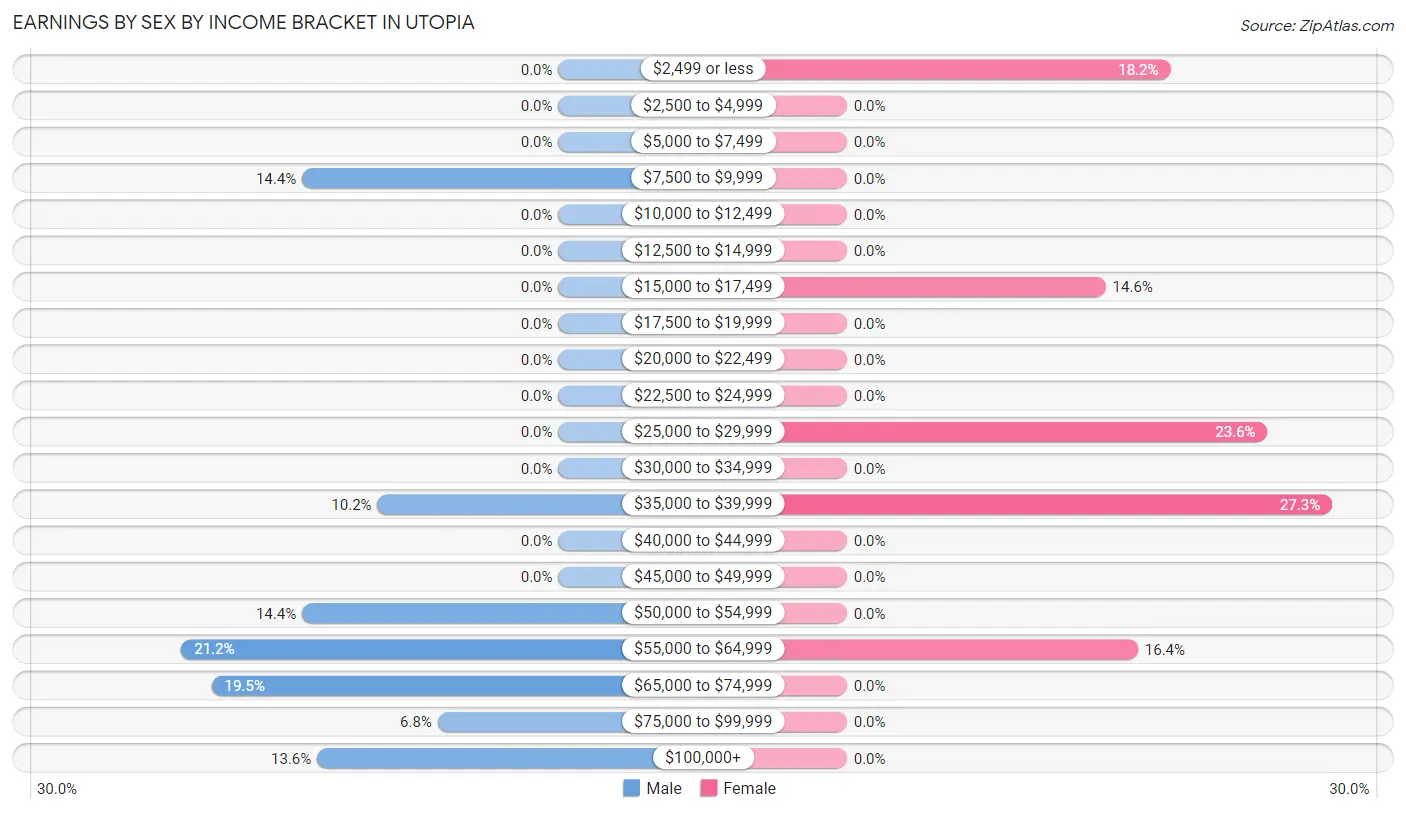
Earnings by Sex by Income Bracket in Utopia
The most common earnings brackets in Utopia are $55,000 to $64,999 for men (25 | 21.2%) and $35,000 to $39,999 for women (15 | 27.3%).
| Income | Male | Female |
| $2,499 or less | 0 (0.0%) | 10 (18.2%) |
| $2,500 to $4,999 | 0 (0.0%) | 0 (0.0%) |
| $5,000 to $7,499 | 0 (0.0%) | 0 (0.0%) |
| $7,500 to $9,999 | 17 (14.4%) | 0 (0.0%) |
| $10,000 to $12,499 | 0 (0.0%) | 0 (0.0%) |
| $12,500 to $14,999 | 0 (0.0%) | 0 (0.0%) |
| $15,000 to $17,499 | 0 (0.0%) | 8 (14.5%) |
| $17,500 to $19,999 | 0 (0.0%) | 0 (0.0%) |
| $20,000 to $22,499 | 0 (0.0%) | 0 (0.0%) |
| $22,500 to $24,999 | 0 (0.0%) | 0 (0.0%) |
| $25,000 to $29,999 | 0 (0.0%) | 13 (23.6%) |
| $30,000 to $34,999 | 0 (0.0%) | 0 (0.0%) |
| $35,000 to $39,999 | 12 (10.2%) | 15 (27.3%) |
| $40,000 to $44,999 | 0 (0.0%) | 0 (0.0%) |
| $45,000 to $49,999 | 0 (0.0%) | 0 (0.0%) |
| $50,000 to $54,999 | 17 (14.4%) | 0 (0.0%) |
| $55,000 to $64,999 | 25 (21.2%) | 9 (16.4%) |
| $65,000 to $74,999 | 23 (19.5%) | 0 (0.0%) |
| $75,000 to $99,999 | 8 (6.8%) | 0 (0.0%) |
| $100,000+ | 16 (13.6%) | 0 (0.0%) |
| Total | 118 (100.0%) | 55 (100.0%) |
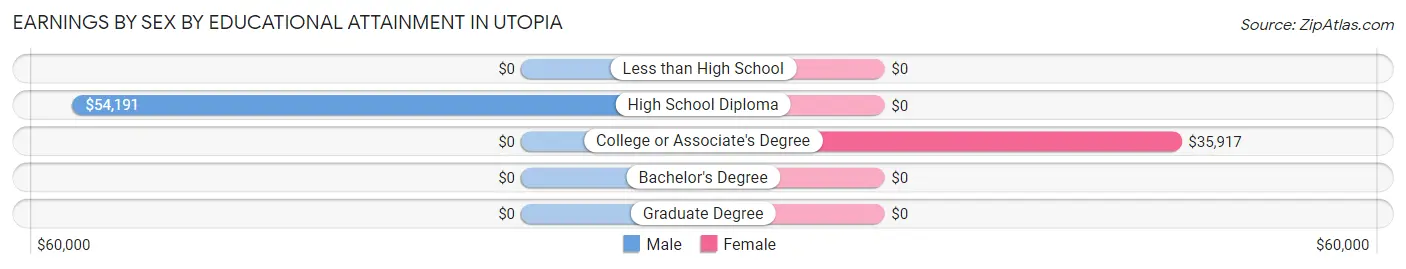
Earnings by Sex by Educational Attainment in Utopia
Average earnings in Utopia are $58,000 for men and $35,250 for women, a difference of 39.2%. Men with an educational attainment of high school diploma enjoy the highest average annual earnings of $54,191, while those with high school diploma education earn the least with $54,191. Women with an educational attainment of college or associate's degree earn the most with the average annual earnings of $35,917, while those with college or associate's degree education have the smallest earnings of $35,917.
| Educational Attainment | Male Income | Female Income |
| Less than High School | - | - |
| High School Diploma | $54,191 | $0 |
| College or Associate's Degree | - | - |
| Bachelor's Degree | - | - |
| Graduate Degree | - | - |
| Total | $58,000 | $35,250 |
Family Income in Utopia
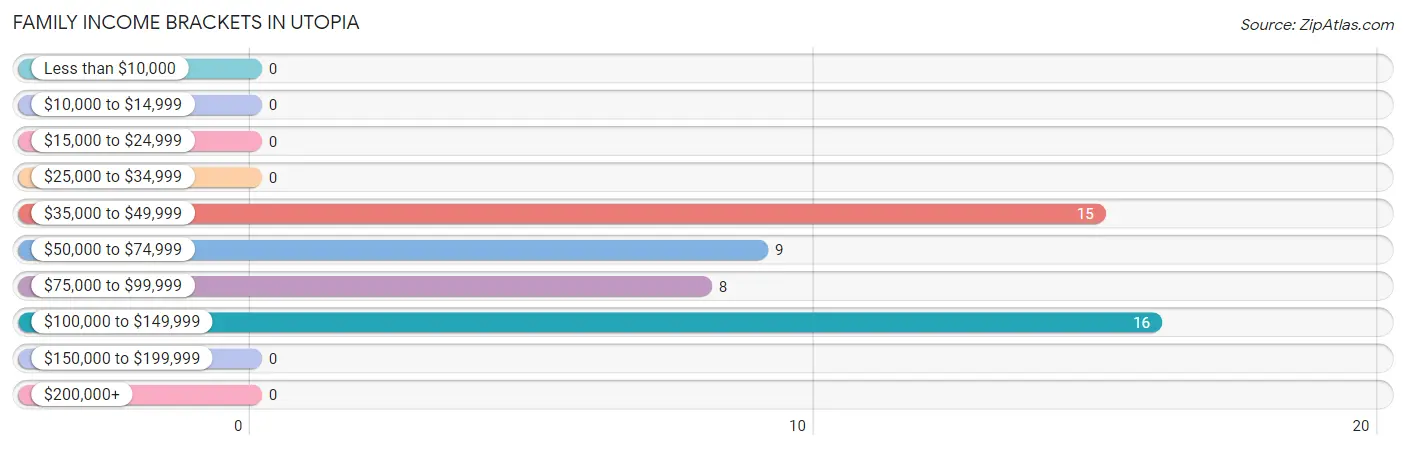
Family Income Brackets in Utopia
According to the Utopia family income data, there are 16 families falling into the $100,000 to $149,999 income range, which is the most common income bracket and makes up 33.3% of all families.
| Income Bracket | # Families | % Families |
| Less than $10,000 | 0 | 0.0% |
| $10,000 to $14,999 | 0 | 0.0% |
| $15,000 to $24,999 | 0 | 0.0% |
| $25,000 to $34,999 | 0 | 0.0% |
| $35,000 to $49,999 | 15 | 31.3% |
| $50,000 to $74,999 | 9 | 18.8% |
| $75,000 to $99,999 | 8 | 16.7% |
| $100,000 to $149,999 | 16 | 33.3% |
| $150,000 to $199,999 | 0 | 0.0% |
| $200,000+ | 0 | 0.0% |
Family Income by Famaliy Size in Utopia
| Income Bracket | # Families | Median Income |
| 2-Person Families | 16 (33.3%) | $0 |
| 3-Person Families | 15 (31.2%) | $0 |
| 4-Person Families | 17 (35.4%) | $0 |
| 5-Person Families | 0 (0.0%) | $0 |
| 6-Person Families | 0 (0.0%) | $0 |
| 7+ Person Families | 0 (0.0%) | $0 |
| Total | 48 (100.0%) | $78,750 |
Family Income by Number of Earners in Utopia
| Number of Earners | # Families | Median Income |
| No Earners | 0 (0.0%) | $0 |
| 1 Earner | 16 (33.3%) | $0 |
| 2 Earners | 24 (50.0%) | $0 |
| 3+ Earners | 8 (16.7%) | $0 |
| Total | 48 (100.0%) | $78,750 |
Household Income in Utopia
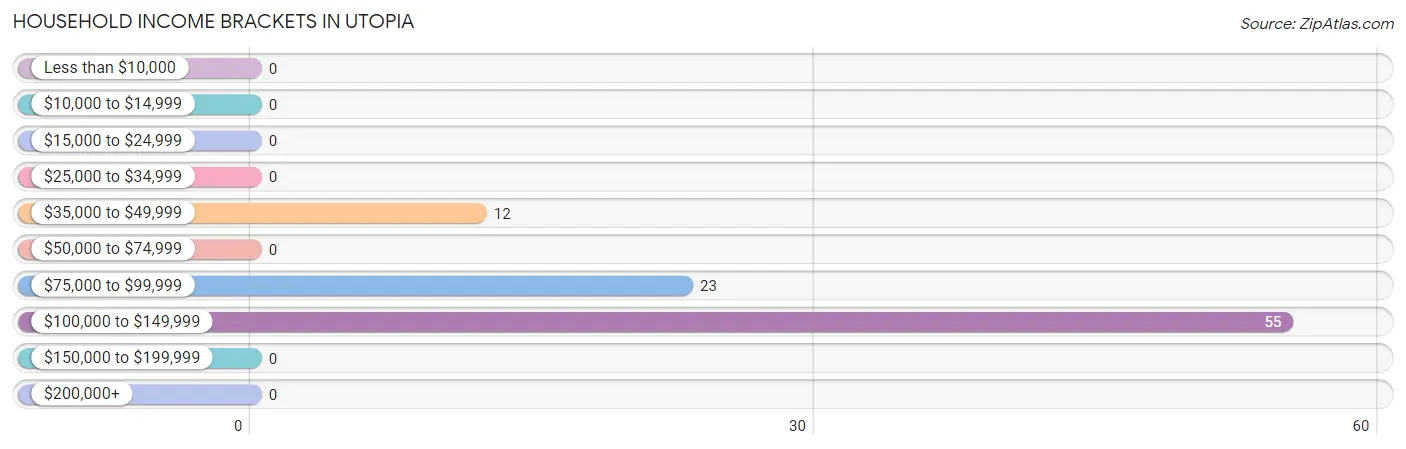
Household Income Brackets in Utopia
With 55 households falling in the category, the $100,000 to $149,999 income range is the most frequent in Utopia, accounting for 61.1% of all households.
| Income Bracket | # Households | % Households |
| Less than $10,000 | 0 | 0.0% |
| $10,000 to $14,999 | 0 | 0.0% |
| $15,000 to $24,999 | 0 | 0.0% |
| $25,000 to $34,999 | 0 | 0.0% |
| $35,000 to $49,999 | 12 | 13.3% |
| $50,000 to $74,999 | 0 | 0.0% |
| $75,000 to $99,999 | 23 | 25.6% |
| $100,000 to $149,999 | 55 | 61.1% |
| $150,000 to $199,999 | 0 | 0.0% |
| $200,000+ | 0 | 0.0% |
Household Income by Householder Age in Utopia
The median household income in Utopia is $107,619, with the highest median household income of $92,833 found in the 25 to 44 years age bracket for the primary householder. A total of 44 households (48.9%) fall into this category. Meanwhile, the 15 to 24 years age bracket for the primary householder has the lowest median household income of $0, with 9 households (10.0%) in this group.
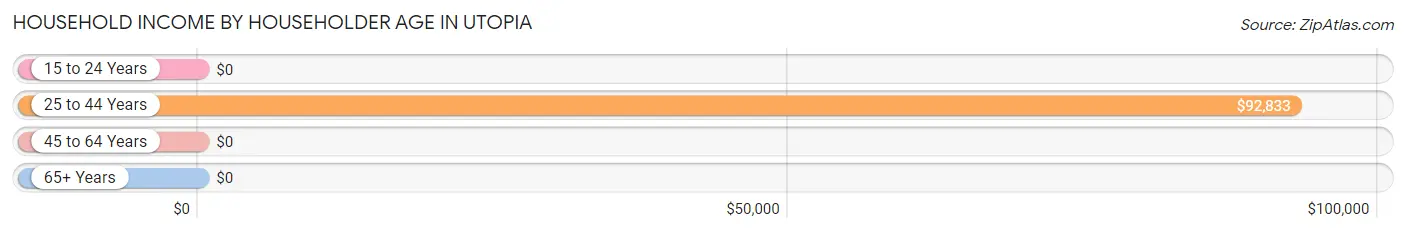
| Income Bracket | # Households | Median Income |
| 15 to 24 Years | 9 (10.0%) | $0 |
| 25 to 44 Years | 44 (48.9%) | $92,833 |
| 45 to 64 Years | 30 (33.3%) | $0 |
| 65+ Years | 7 (7.8%) | $0 |
| Total | 90 (100.0%) | $107,619 |
Poverty in Utopia
Income Below Poverty by Sex and Age in Utopia
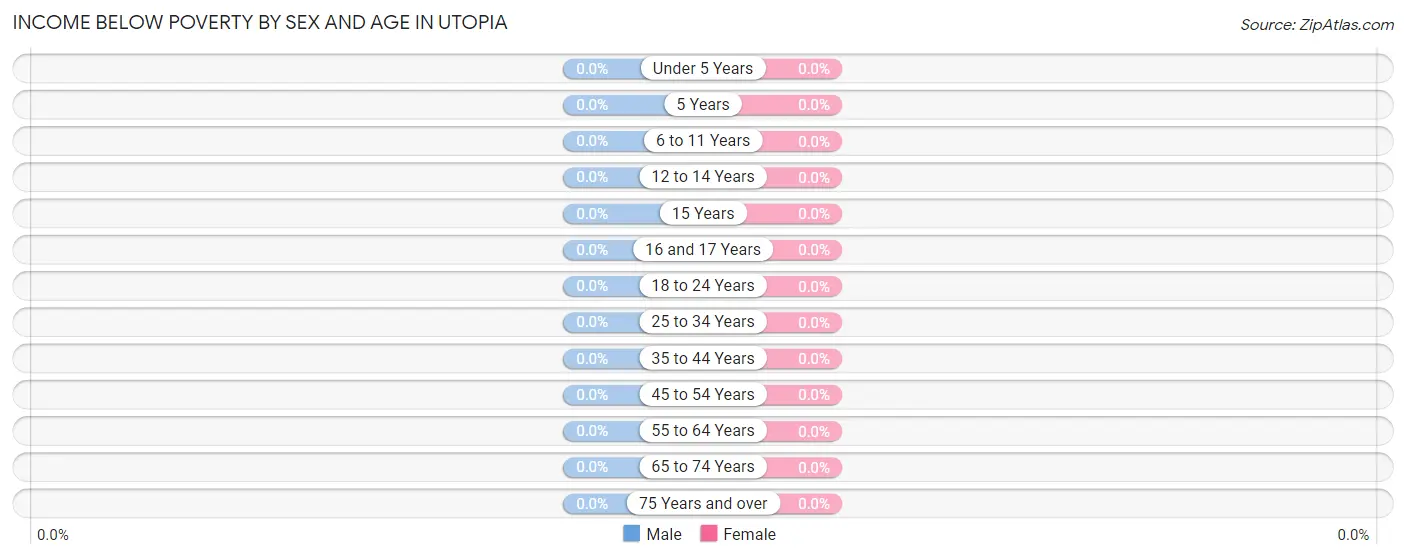
| Age Bracket | Male | Female |
| Under 5 Years | 0 (0.0%) | 0 (0.0%) |
| 5 Years | 0 (0.0%) | 0 (0.0%) |
| 6 to 11 Years | 0 (0.0%) | 0 (0.0%) |
| 12 to 14 Years | 0 (0.0%) | 0 (0.0%) |
| 15 Years | 0 (0.0%) | 0 (0.0%) |
| 16 and 17 Years | 0 (0.0%) | 0 (0.0%) |
| 18 to 24 Years | 0 (0.0%) | 0 (0.0%) |
| 25 to 34 Years | 0 (0.0%) | 0 (0.0%) |
| 35 to 44 Years | 0 (0.0%) | 0 (0.0%) |
| 45 to 54 Years | 0 (0.0%) | 0 (0.0%) |
| 55 to 64 Years | 0 (0.0%) | 0 (0.0%) |
| 65 to 74 Years | 0 (0.0%) | 0 (0.0%) |
| 75 Years and over | 0 (0.0%) | 0 (0.0%) |
| Total | 0 (0.0%) | 0 (0.0%) |
Income Above Poverty by Sex and Age in Utopia
According to the poverty statistics in Utopia, males aged under 5 years and females aged 6 to 11 years are the age groups that are most secure financially, with 100.0% of males and 100.0% of females in these age groups living above the poverty line.
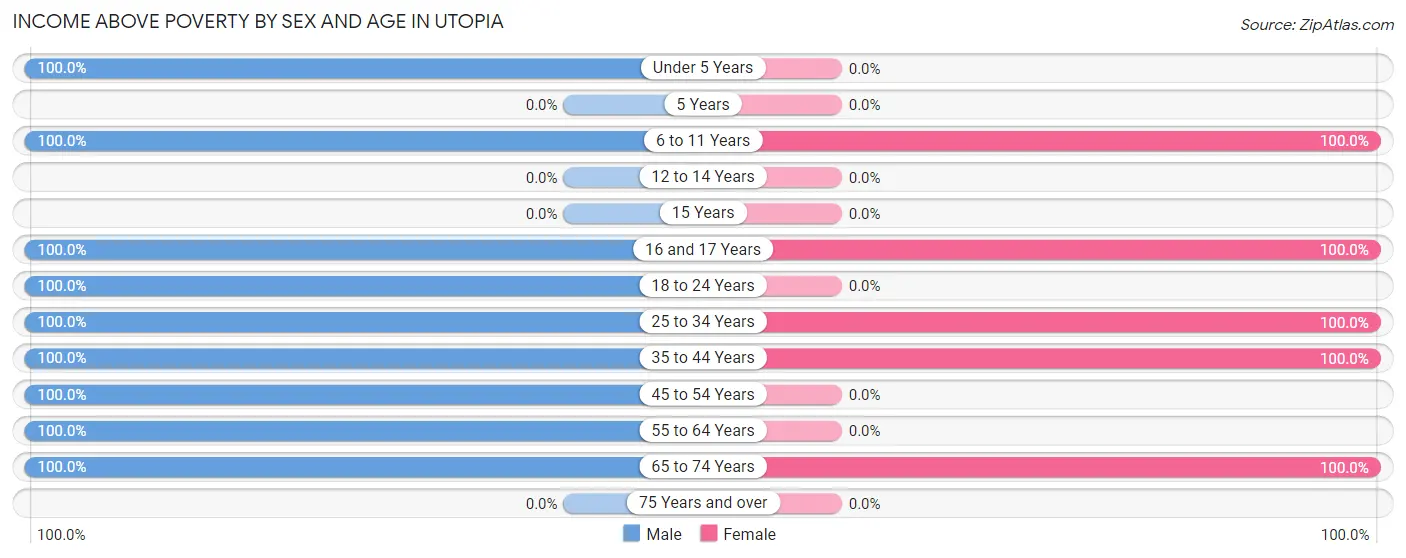
| Age Bracket | Male | Female |
| Under 5 Years | 4 (100.0%) | 0 (0.0%) |
| 5 Years | 0 (0.0%) | 0 (0.0%) |
| 6 to 11 Years | 28 (100.0%) | 10 (100.0%) |
| 12 to 14 Years | 0 (0.0%) | 0 (0.0%) |
| 15 Years | 0 (0.0%) | 0 (0.0%) |
| 16 and 17 Years | 23 (100.0%) | 10 (100.0%) |
| 18 to 24 Years | 9 (100.0%) | 0 (0.0%) |
| 25 to 34 Years | 12 (100.0%) | 21 (100.0%) |
| 35 to 44 Years | 42 (100.0%) | 24 (100.0%) |
| 45 to 54 Years | 16 (100.0%) | 0 (0.0%) |
| 55 to 64 Years | 14 (100.0%) | 0 (0.0%) |
| 65 to 74 Years | 8 (100.0%) | 7 (100.0%) |
| 75 Years and over | 0 (0.0%) | 0 (0.0%) |
| Total | 156 (100.0%) | 72 (100.0%) |
Income Below Poverty Among Married-Couple Families in Utopia
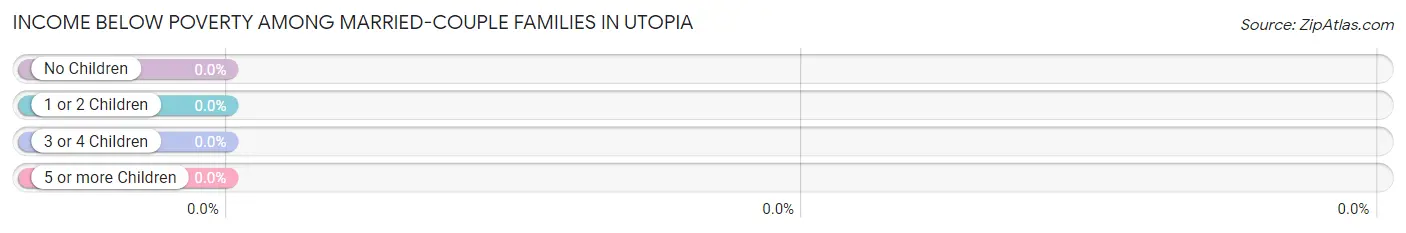
| Children | Above Poverty | Below Poverty |
| No Children | 7 (100.0%) | 0 (0.0%) |
| 1 or 2 Children | 17 (100.0%) | 0 (0.0%) |
| 3 or 4 Children | 0 (0.0%) | 0 (0.0%) |
| 5 or more Children | 0 (0.0%) | 0 (0.0%) |
| Total | 24 (100.0%) | 0 (0.0%) |
Income Below Poverty Among Single-Parent Households in Utopia
| Children | Single Father | Single Mother |
| No Children | 0 (0.0%) | 0 (0.0%) |
| 1 or 2 Children | 0 (0.0%) | 0 (0.0%) |
| 3 or 4 Children | 0 (0.0%) | 0 (0.0%) |
| 5 or more Children | 0 (0.0%) | 0 (0.0%) |
| Total | 0 (0.0%) | 0 (0.0%) |
Income Below Poverty Among Married-Couple vs Single-Parent Households in Utopia
| Children | Married-Couple Families | Single-Parent Households |
| No Children | 0 (0.0%) | 0 (0.0%) |
| 1 or 2 Children | 0 (0.0%) | 0 (0.0%) |
| 3 or 4 Children | 0 (0.0%) | 0 (0.0%) |
| 5 or more Children | 0 (0.0%) | 0 (0.0%) |
| Total | 0 (0.0%) | 0 (0.0%) |
Race in Utopia
The most populous races in Utopia are White / Caucasian (202 | 88.6%), Hispanic or Latino (26 | 11.4%), and Two or more Races (16 | 7.0%).
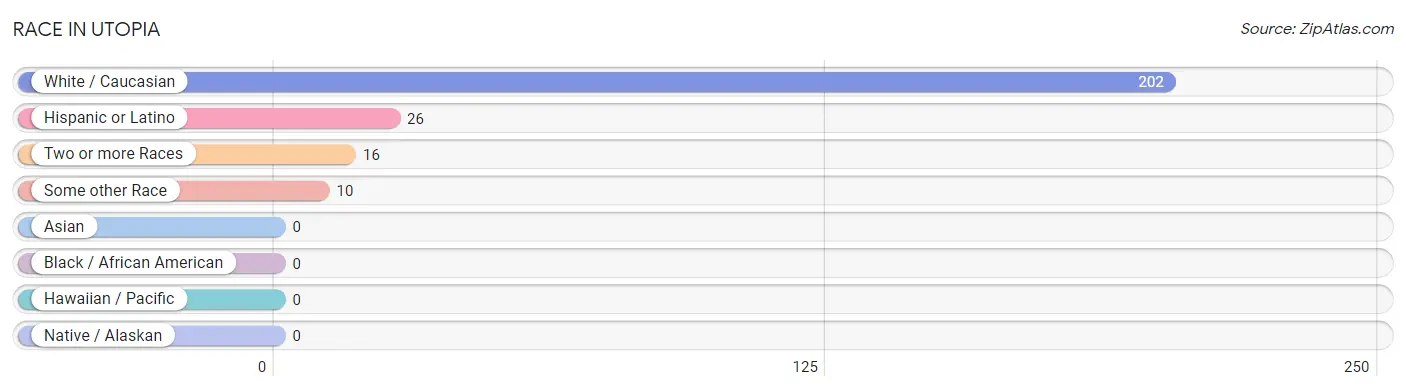
| Race | # Population | % Population |
| Asian | 0 | 0.0% |
| Black / African American | 0 | 0.0% |
| Hawaiian / Pacific | 0 | 0.0% |
| Hispanic or Latino | 26 | 11.4% |
| Native / Alaskan | 0 | 0.0% |
| White / Caucasian | 202 | 88.6% |
| Two or more Races | 16 | 7.0% |
| Some other Race | 10 | 4.4% |
| Total | 228 | 100.0% |
Ancestry in Utopia
The most populous ancestries reported in Utopia are English (67 | 29.4%), German (50 | 21.9%), Mexican (26 | 11.4%), Scottish (12 | 5.3%), and American (11 | 4.8%), together accounting for 72.8% of all Utopia residents.
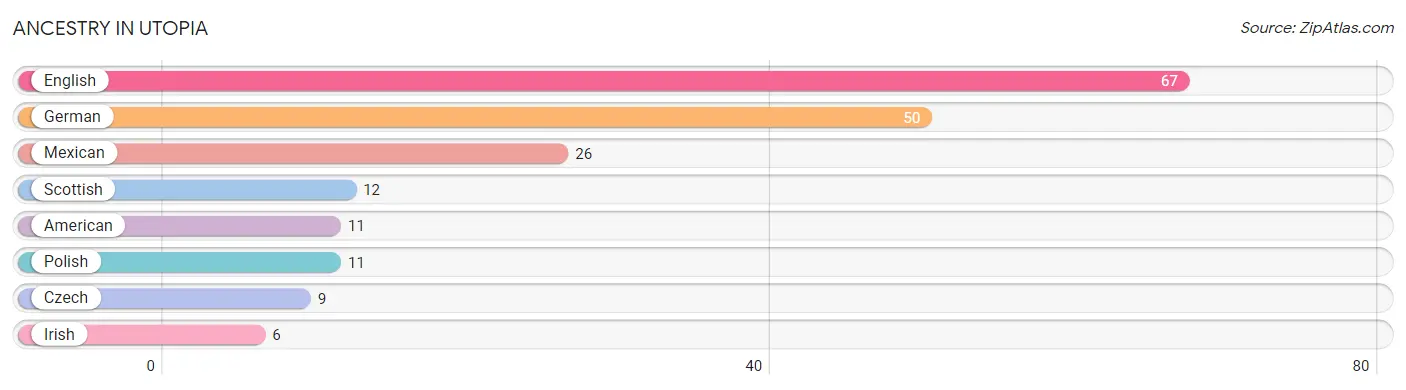
| Ancestry | # Population | % Population |
| American | 11 | 4.8% |
| Czech | 9 | 4.0% |
| English | 67 | 29.4% |
| German | 50 | 21.9% |
| Irish | 6 | 2.6% |
| Mexican | 26 | 11.4% |
| Polish | 11 | 4.8% |
| Scottish | 12 | 5.3% | View All 8 Rows |
Immigrants in Utopia

| Immigration Origin | # Population | % Population | View All 0 Rows |
Sex and Age in Utopia
Sex and Age in Utopia
The most populous age groups in Utopia are 40 to 44 Years (42 | 26.9%) for men and 40 to 44 Years (24 | 33.3%) for women.
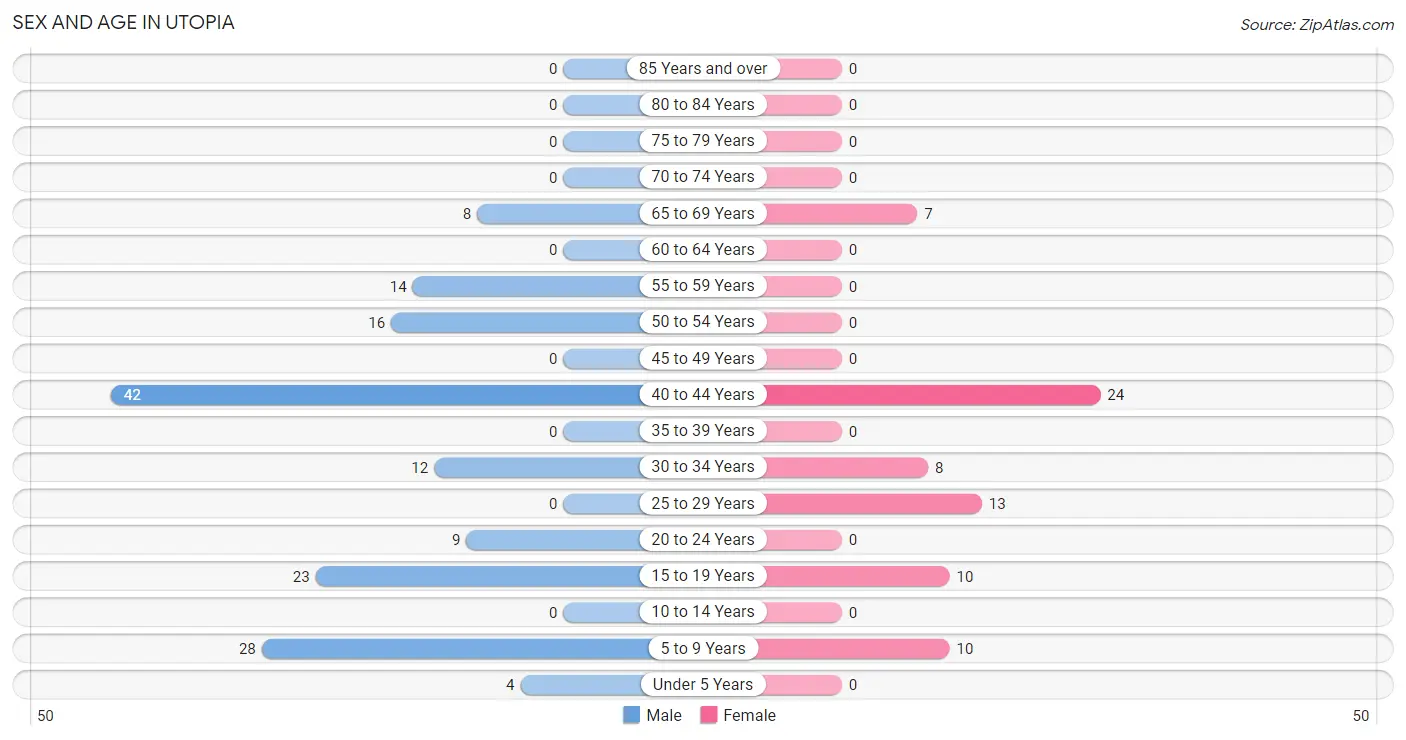
| Age Bracket | Male | Female |
| Under 5 Years | 4 (2.6%) | 0 (0.0%) |
| 5 to 9 Years | 28 (17.9%) | 10 (13.9%) |
| 10 to 14 Years | 0 (0.0%) | 0 (0.0%) |
| 15 to 19 Years | 23 (14.7%) | 10 (13.9%) |
| 20 to 24 Years | 9 (5.8%) | 0 (0.0%) |
| 25 to 29 Years | 0 (0.0%) | 13 (18.1%) |
| 30 to 34 Years | 12 (7.7%) | 8 (11.1%) |
| 35 to 39 Years | 0 (0.0%) | 0 (0.0%) |
| 40 to 44 Years | 42 (26.9%) | 24 (33.3%) |
| 45 to 49 Years | 0 (0.0%) | 0 (0.0%) |
| 50 to 54 Years | 16 (10.3%) | 0 (0.0%) |
| 55 to 59 Years | 14 (9.0%) | 0 (0.0%) |
| 60 to 64 Years | 0 (0.0%) | 0 (0.0%) |
| 65 to 69 Years | 8 (5.1%) | 7 (9.7%) |
| 70 to 74 Years | 0 (0.0%) | 0 (0.0%) |
| 75 to 79 Years | 0 (0.0%) | 0 (0.0%) |
| 80 to 84 Years | 0 (0.0%) | 0 (0.0%) |
| 85 Years and over | 0 (0.0%) | 0 (0.0%) |
| Total | 156 (100.0%) | 72 (100.0%) |
Families and Households in Utopia
Median Family Size in Utopia
The median family size in Utopia is 3.29 persons per family, with married-couple families (24 | 50.0%) accounting for the largest median family size of 4.29 persons per family. On the other hand, single male/father families (9 | 18.8%) represent the smallest median family size with 1.44 persons per family.
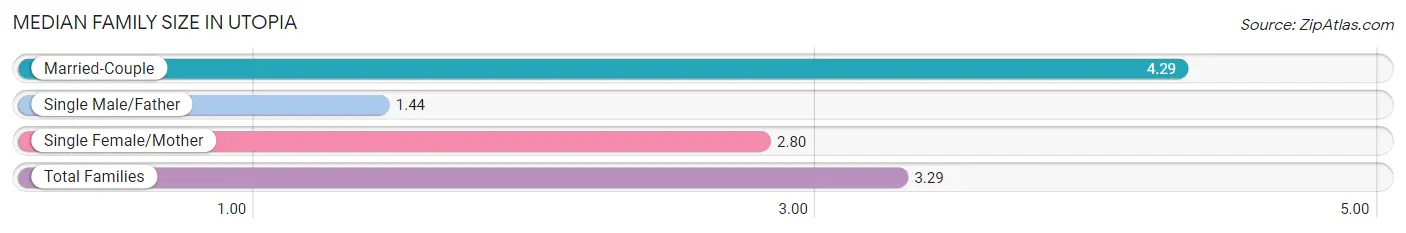
| Family Type | # Families | Family Size |
| Married-Couple | 24 (50.0%) | 4.29 |
| Single Male/Father | 9 (18.8%) | 1.44 |
| Single Female/Mother | 15 (31.2%) | 2.80 |
| Total Families | 48 (100.0%) | 3.29 |
Median Household Size in Utopia
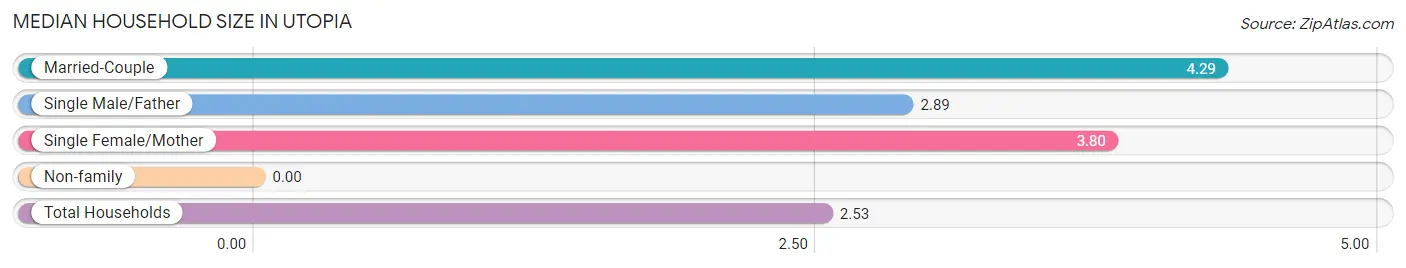
| Household Type | # Households | Household Size |
| Married-Couple | 24 (26.7%) | 4.29 |
| Single Male/Father | 9 (10.0%) | 2.89 |
| Single Female/Mother | 15 (16.7%) | 3.80 |
| Non-family | 42 (46.7%) | - |
| Total Households | 90 (100.0%) | 2.53 |
Household Size by Marriage Status in Utopia
Out of a total of 90 households in Utopia, 48 (53.3%) are family households, while 42 (46.7%) are nonfamily households. The most numerous type of family households are 4-person households, comprising 32, and the most common type of nonfamily households are 1-person households, comprising 42.
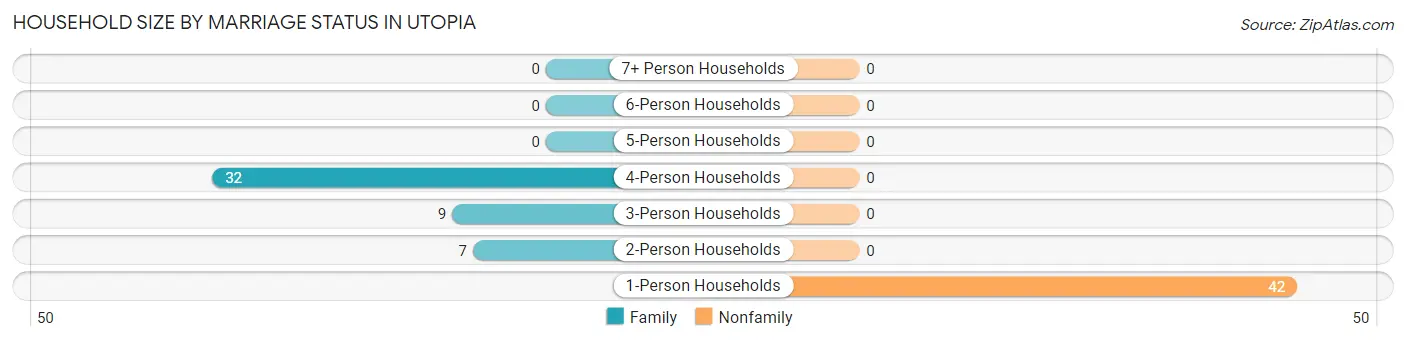
| Household Size | Family Households | Nonfamily Households |
| 1-Person Households | - | 42 (46.7%) |
| 2-Person Households | 7 (7.8%) | 0 (0.0%) |
| 3-Person Households | 9 (10.0%) | 0 (0.0%) |
| 4-Person Households | 32 (35.6%) | 0 (0.0%) |
| 5-Person Households | 0 (0.0%) | 0 (0.0%) |
| 6-Person Households | 0 (0.0%) | 0 (0.0%) |
| 7+ Person Households | 0 (0.0%) | 0 (0.0%) |
| Total | 48 (53.3%) | 42 (46.7%) |
Female Fertility in Utopia
Fertility by Age in Utopia
| Age Bracket | Women with Births | Births / 1,000 Women |
| 15 to 19 years | 0 (0.0%) | 0.0 |
| 20 to 34 years | 0 (0.0%) | 0.0 |
| 35 to 50 years | 0 (0.0%) | 0.0 |
| Total | 0 (0.0%) | 0.0 |
Fertility by Age by Marriage Status in Utopia
| Age Bracket | Married | Unmarried |
| 15 to 19 years | 0 (0.0%) | 0 (0.0%) |
| 20 to 34 years | 0 (0.0%) | 0 (0.0%) |
| 35 to 50 years | 0 (0.0%) | 0 (0.0%) |
| Total | 0 (0.0%) | 0 (0.0%) |
Fertility by Education in Utopia
| Educational Attainment | Women with Births | Births / 1,000 Women |
| Less than High School | 0 (0.0%) | 0.0 |
| High School Diploma | 0 (0.0%) | 0.0 |
| College or Associate's Degree | 0 (0.0%) | 0.0 |
| Bachelor's Degree | 0 (0.0%) | 0.0 |
| Graduate Degree | 0 (0.0%) | 0.0 |
| Total | 0 (0.0%) | 0.0 |
Fertility by Education by Marriage Status in Utopia
| Educational Attainment | Married | Unmarried |
| Less than High School | 0 (0.0%) | 0 (0.0%) |
| High School Diploma | 0 (0.0%) | 0 (0.0%) |
| College or Associate's Degree | 0 (0.0%) | 0 (0.0%) |
| Bachelor's Degree | 0 (0.0%) | 0 (0.0%) |
| Graduate Degree | 0 (0.0%) | 0 (0.0%) |
| Total | 0 (0.0%) | 0 (0.0%) |
Employment Characteristics in Utopia
Employment by Class of Employer in Utopia
Among the 173 employed individuals in Utopia, private company employees (135 | 78.0%), local government employees (30 | 17.3%), and self-employed (not incorporated) (8 | 4.6%) make up the most common classes of employment.
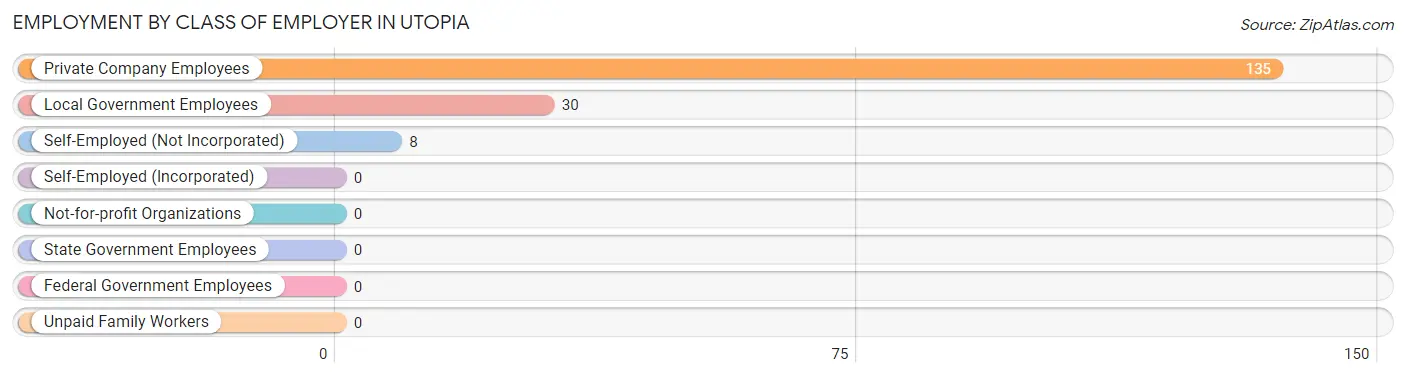
| Employer Class | # Employees | % Employees |
| Private Company Employees | 135 | 78.0% |
| Self-Employed (Incorporated) | 0 | 0.0% |
| Self-Employed (Not Incorporated) | 8 | 4.6% |
| Not-for-profit Organizations | 0 | 0.0% |
| Local Government Employees | 30 | 17.3% |
| State Government Employees | 0 | 0.0% |
| Federal Government Employees | 0 | 0.0% |
| Unpaid Family Workers | 0 | 0.0% |
| Total | 173 | 100.0% |
Employment Status by Age in Utopia
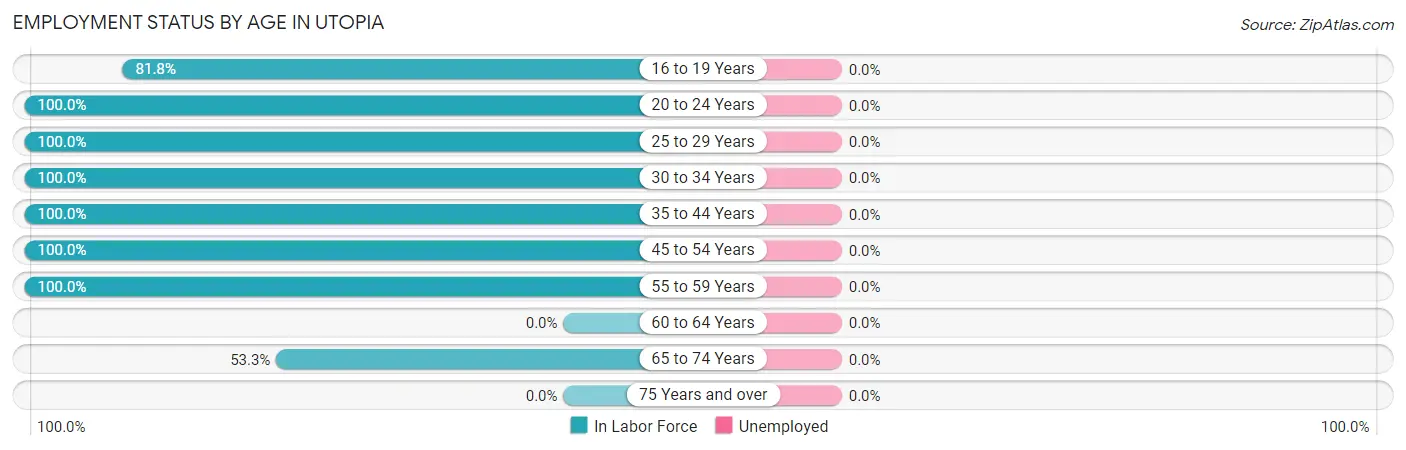
| Age Bracket | In Labor Force | Unemployed |
| 16 to 19 Years | 27 (81.8%) | 0 (0.0%) |
| 20 to 24 Years | 9 (100.0%) | 0 (0.0%) |
| 25 to 29 Years | 13 (100.0%) | 0 (0.0%) |
| 30 to 34 Years | 20 (100.0%) | 0 (0.0%) |
| 35 to 44 Years | 66 (100.0%) | 0 (0.0%) |
| 45 to 54 Years | 16 (100.0%) | 0 (0.0%) |
| 55 to 59 Years | 14 (100.0%) | 0 (0.0%) |
| 60 to 64 Years | 0 (0.0%) | 0 (0.0%) |
| 65 to 74 Years | 8 (53.3%) | 0 (0.0%) |
| 75 Years and over | 0 (0.0%) | 0 (0.0%) |
| Total | 173 (93.0%) | 0 (0.0%) |
Employment Status by Educational Attainment in Utopia
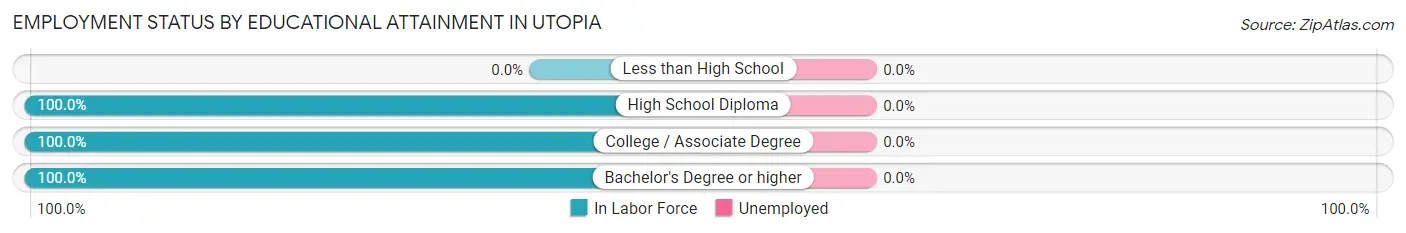
| Educational Attainment | In Labor Force | Unemployed |
| Less than High School | 0 (0.0%) | 0 (0.0%) |
| High School Diploma | 47 (100.0%) | 0 (0.0%) |
| College / Associate Degree | 68 (100.0%) | 0 (0.0%) |
| Bachelor's Degree or higher | 14 (100.0%) | 0 (0.0%) |
| Total | 129 (100.0%) | 0 (0.0%) |
Employment Occupations by Sex in Utopia
Management, Business, Science and Arts Occupations
The most common Management, Business, Science and Arts occupations in Utopia are Community & Social Service (14 | 8.1%), Education Instruction & Library (14 | 8.1%), Management (13 | 7.5%), and Business & Financial (8 | 4.6%).
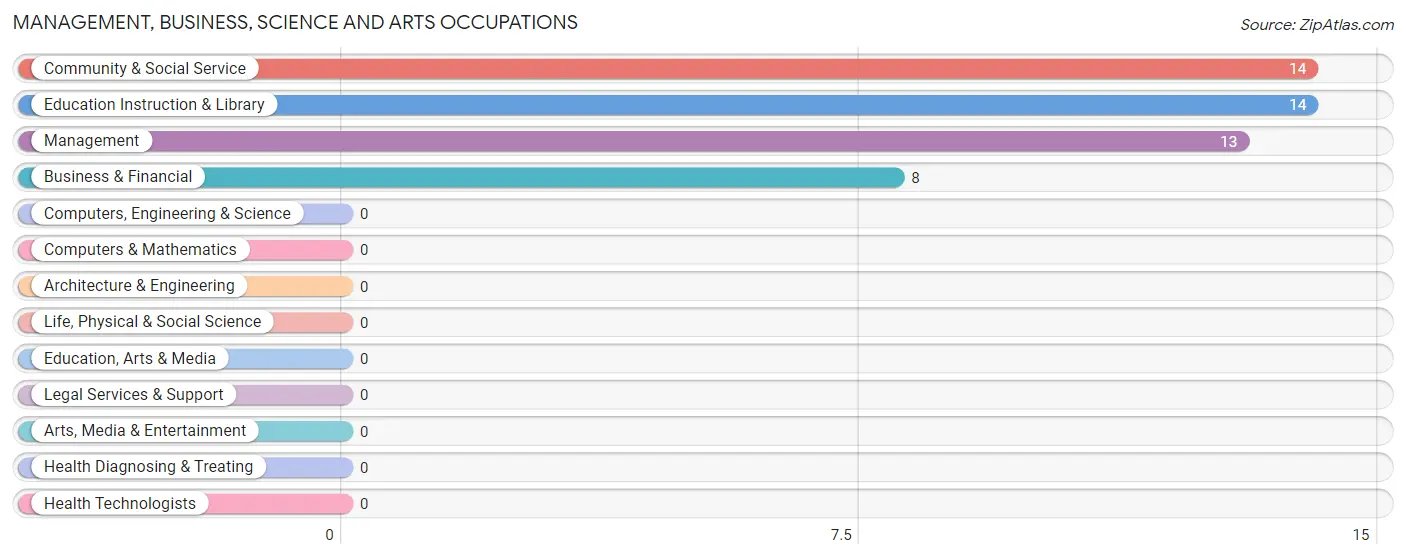
Management, Business, Science and Arts Occupations by Sex
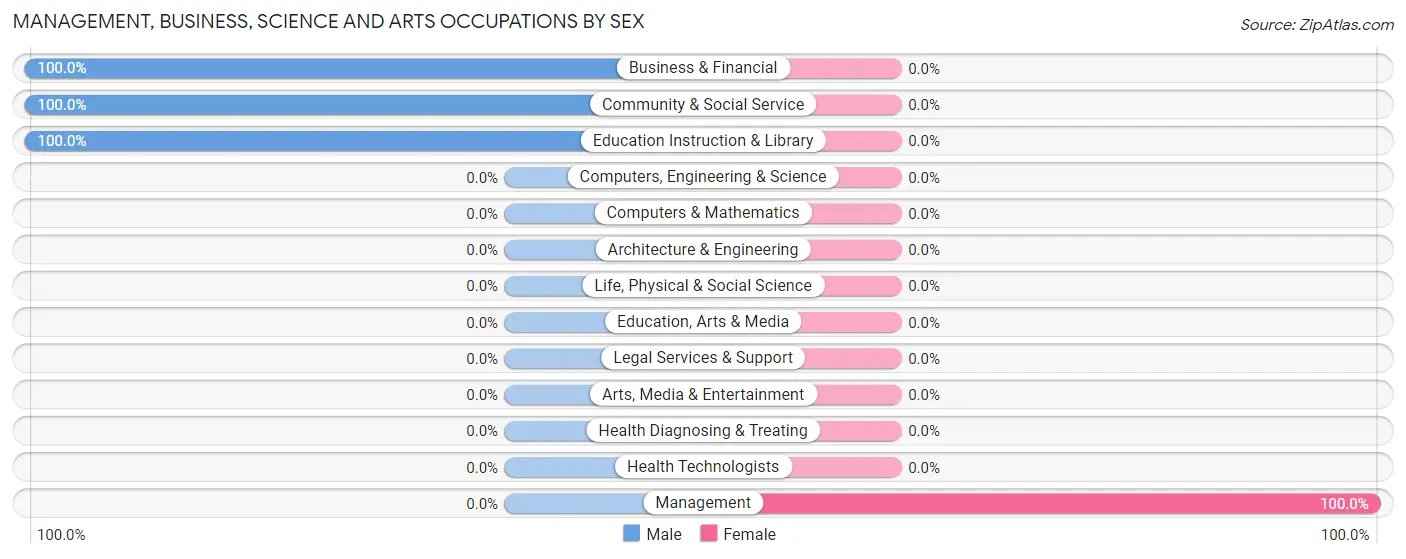
| Occupation | Male | Female |
| Management | 0 (0.0%) | 13 (100.0%) |
| Business & Financial | 8 (100.0%) | 0 (0.0%) |
| Computers, Engineering & Science | 0 (0.0%) | 0 (0.0%) |
| Computers & Mathematics | 0 (0.0%) | 0 (0.0%) |
| Architecture & Engineering | 0 (0.0%) | 0 (0.0%) |
| Life, Physical & Social Science | 0 (0.0%) | 0 (0.0%) |
| Community & Social Service | 14 (100.0%) | 0 (0.0%) |
| Education, Arts & Media | 0 (0.0%) | 0 (0.0%) |
| Legal Services & Support | 0 (0.0%) | 0 (0.0%) |
| Education Instruction & Library | 14 (100.0%) | 0 (0.0%) |
| Arts, Media & Entertainment | 0 (0.0%) | 0 (0.0%) |
| Health Diagnosing & Treating | 0 (0.0%) | 0 (0.0%) |
| Health Technologists | 0 (0.0%) | 0 (0.0%) |
| Total (Category) | 22 (62.9%) | 13 (37.1%) |
| Total (Overall) | 118 (68.2%) | 55 (31.8%) |
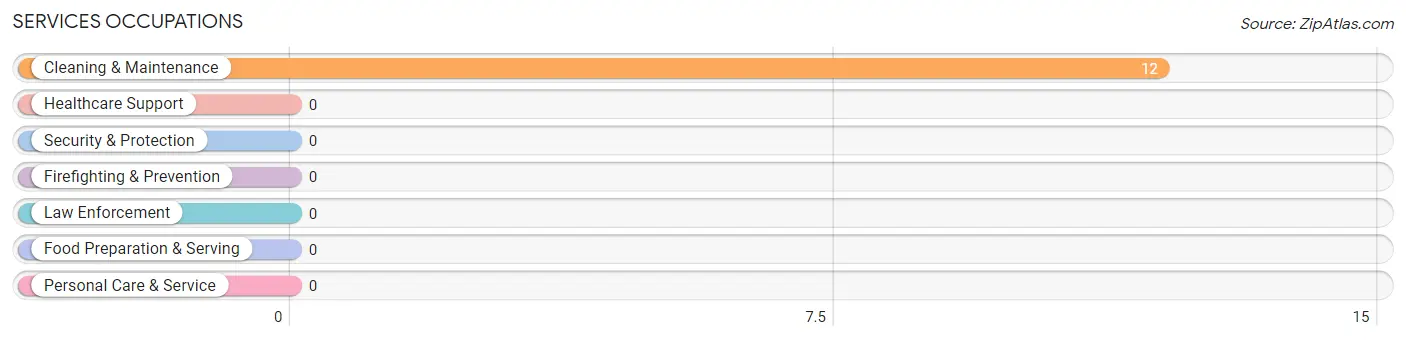
Services Occupations
The most common Services occupations in Utopia are , and Cleaning & Maintenance (12 | 6.9%).
Services Occupations by Sex
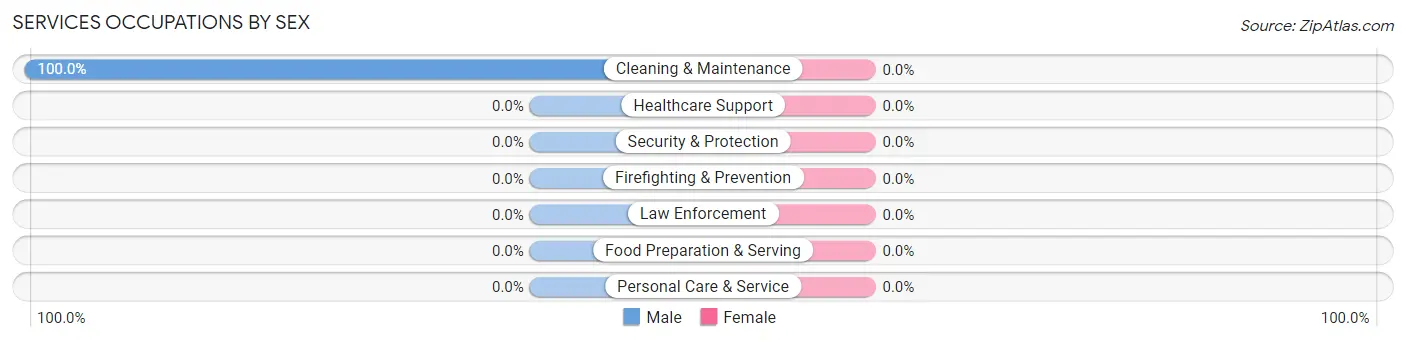
| Occupation | Male | Female |
| Healthcare Support | 0 (0.0%) | 0 (0.0%) |
| Security & Protection | 0 (0.0%) | 0 (0.0%) |
| Firefighting & Prevention | 0 (0.0%) | 0 (0.0%) |
| Law Enforcement | 0 (0.0%) | 0 (0.0%) |
| Food Preparation & Serving | 0 (0.0%) | 0 (0.0%) |
| Cleaning & Maintenance | 12 (100.0%) | 0 (0.0%) |
| Personal Care & Service | 0 (0.0%) | 0 (0.0%) |
| Total (Category) | 12 (100.0%) | 0 (0.0%) |
| Total (Overall) | 118 (68.2%) | 55 (31.8%) |
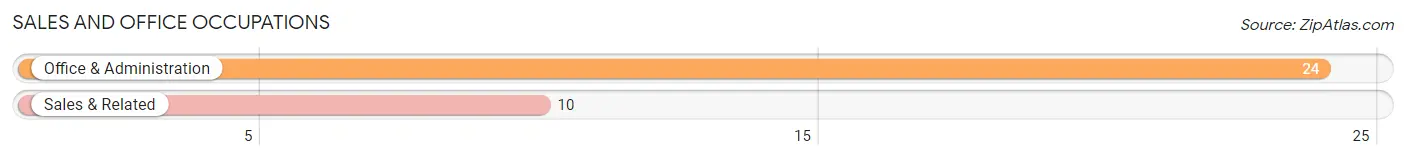
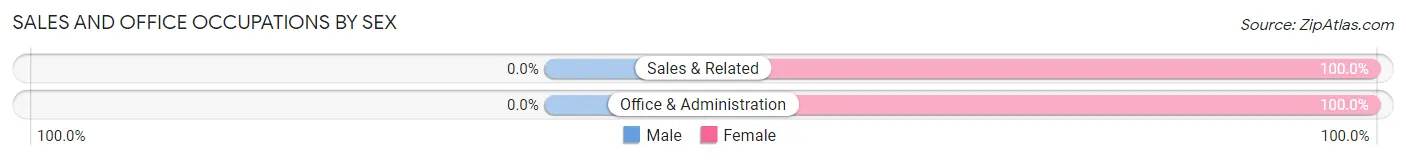
Sales and Office Occupations
The most common Sales and Office occupations in Utopia are Office & Administration (24 | 13.9%), and Sales & Related (10 | 5.8%).
Sales and Office Occupations by Sex
| Occupation | Male | Female |
| Sales & Related | 0 (0.0%) | 10 (100.0%) |
| Office & Administration | 0 (0.0%) | 24 (100.0%) |
| Total (Category) | 0 (0.0%) | 34 (100.0%) |
| Total (Overall) | 118 (68.2%) | 55 (31.8%) |
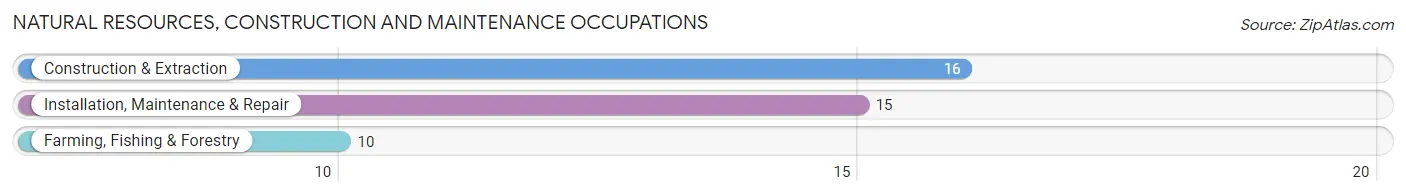
Natural Resources, Construction and Maintenance Occupations
The most common Natural Resources, Construction and Maintenance occupations in Utopia are Construction & Extraction (16 | 9.2%), Installation, Maintenance & Repair (15 | 8.7%), and Farming, Fishing & Forestry (10 | 5.8%).
Natural Resources, Construction and Maintenance Occupations by Sex
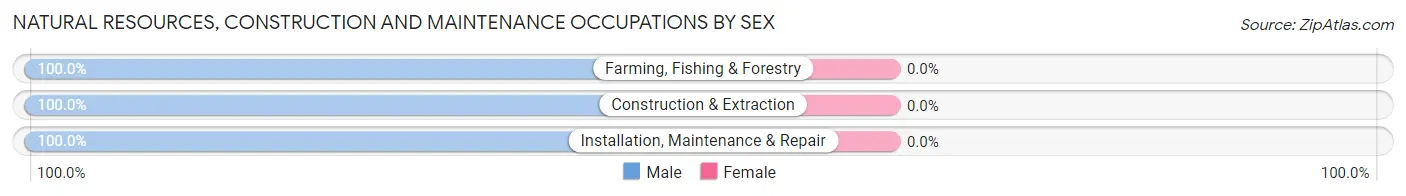
| Occupation | Male | Female |
| Farming, Fishing & Forestry | 10 (100.0%) | 0 (0.0%) |
| Construction & Extraction | 16 (100.0%) | 0 (0.0%) |
| Installation, Maintenance & Repair | 15 (100.0%) | 0 (0.0%) |
| Total (Category) | 41 (100.0%) | 0 (0.0%) |
| Total (Overall) | 118 (68.2%) | 55 (31.8%) |
Production, Transportation and Moving Occupations
The most common Production, Transportation and Moving occupations in Utopia are Production (26 | 15.0%), Transportation (17 | 9.8%), and Material Moving (8 | 4.6%).
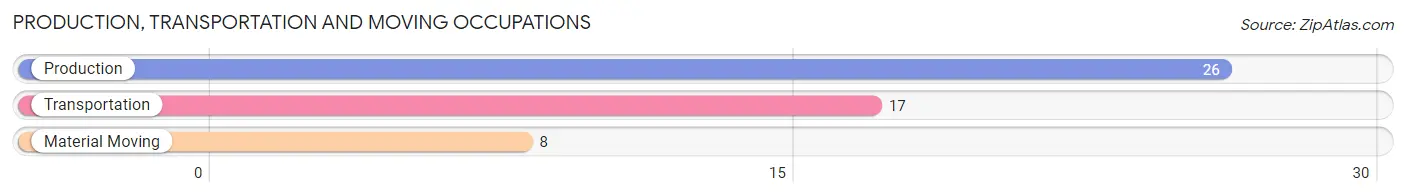
Production, Transportation and Moving Occupations by Sex
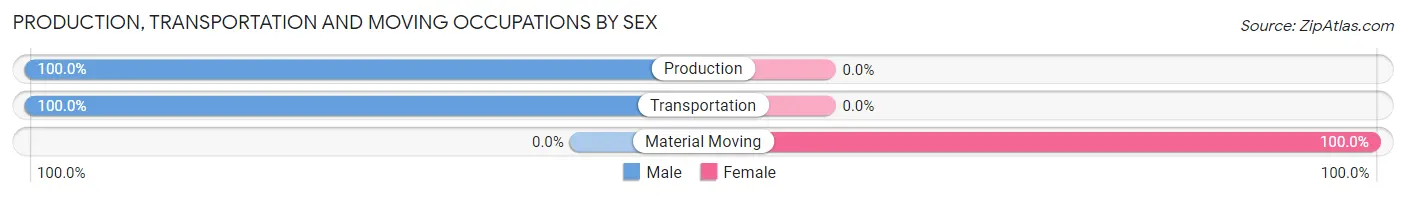
| Occupation | Male | Female |
| Production | 26 (100.0%) | 0 (0.0%) |
| Transportation | 17 (100.0%) | 0 (0.0%) |
| Material Moving | 0 (0.0%) | 8 (100.0%) |
| Total (Category) | 43 (84.3%) | 8 (15.7%) |
| Total (Overall) | 118 (68.2%) | 55 (31.8%) |
Employment Industries by Sex in Utopia
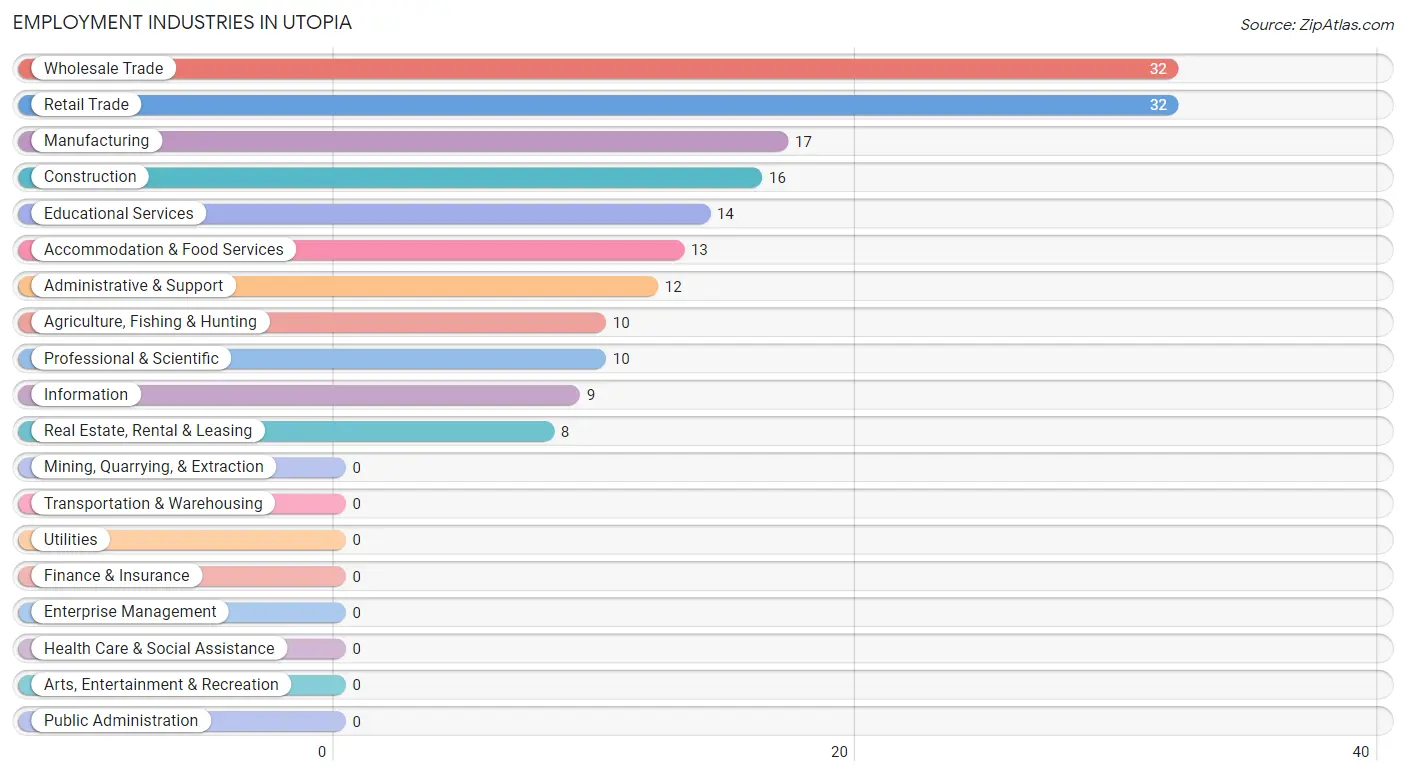
Employment Industries in Utopia
The major employment industries in Utopia include Wholesale Trade (32 | 18.5%), Retail Trade (32 | 18.5%), Manufacturing (17 | 9.8%), Construction (16 | 9.2%), and Educational Services (14 | 8.1%).
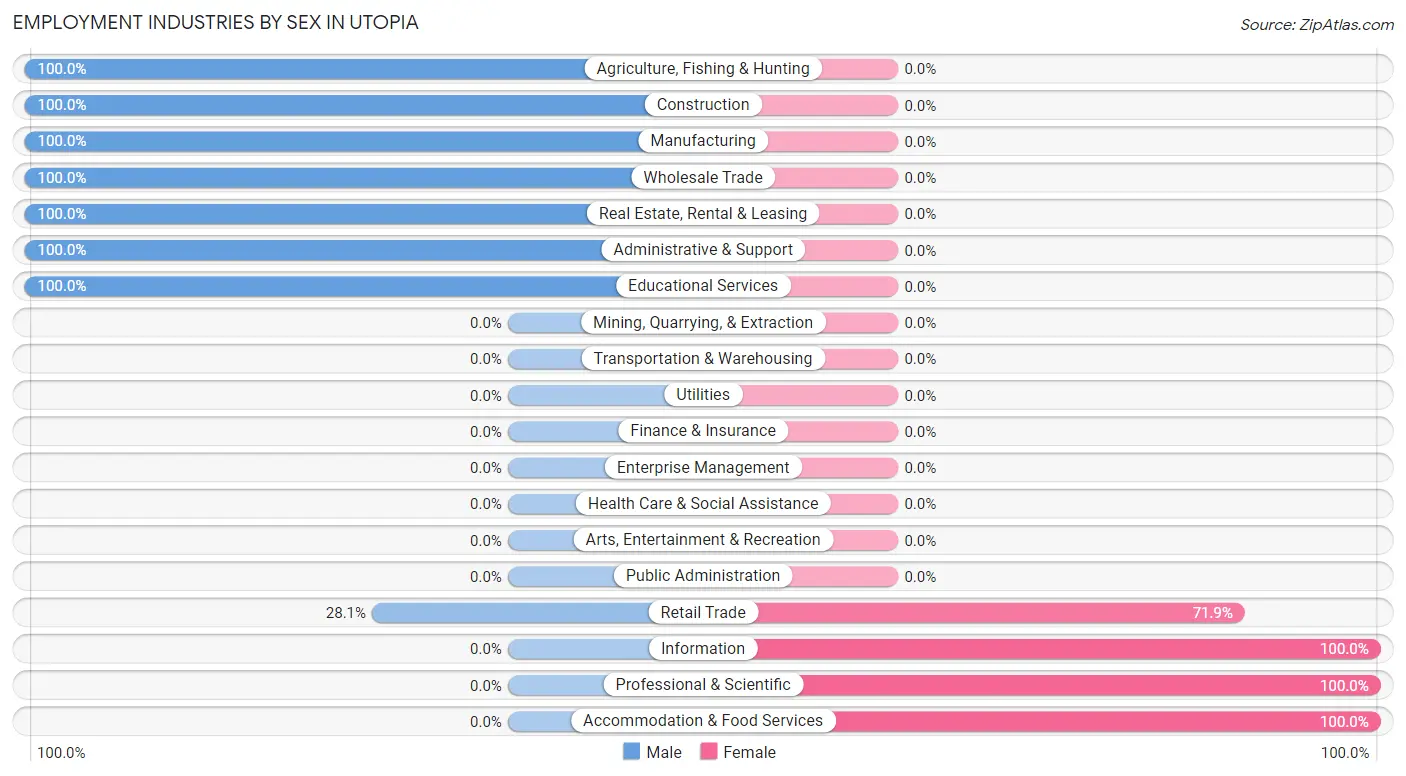
Employment Industries by Sex in Utopia
The Utopia industries that see more men than women are Agriculture, Fishing & Hunting (100.0%), Construction (100.0%), and Manufacturing (100.0%), whereas the industries that tend to have a higher number of women are Information (100.0%), Professional & Scientific (100.0%), and Accommodation & Food Services (100.0%).
| Industry | Male | Female |
| Agriculture, Fishing & Hunting | 10 (100.0%) | 0 (0.0%) |
| Mining, Quarrying, & Extraction | 0 (0.0%) | 0 (0.0%) |
| Construction | 16 (100.0%) | 0 (0.0%) |
| Manufacturing | 17 (100.0%) | 0 (0.0%) |
| Wholesale Trade | 32 (100.0%) | 0 (0.0%) |
| Retail Trade | 9 (28.1%) | 23 (71.9%) |
| Transportation & Warehousing | 0 (0.0%) | 0 (0.0%) |
| Utilities | 0 (0.0%) | 0 (0.0%) |
| Information | 0 (0.0%) | 9 (100.0%) |
| Finance & Insurance | 0 (0.0%) | 0 (0.0%) |
| Real Estate, Rental & Leasing | 8 (100.0%) | 0 (0.0%) |
| Professional & Scientific | 0 (0.0%) | 10 (100.0%) |
| Enterprise Management | 0 (0.0%) | 0 (0.0%) |
| Administrative & Support | 12 (100.0%) | 0 (0.0%) |
| Educational Services | 14 (100.0%) | 0 (0.0%) |
| Health Care & Social Assistance | 0 (0.0%) | 0 (0.0%) |
| Arts, Entertainment & Recreation | 0 (0.0%) | 0 (0.0%) |
| Accommodation & Food Services | 0 (0.0%) | 13 (100.0%) |
| Public Administration | 0 (0.0%) | 0 (0.0%) |
| Total | 118 (68.2%) | 55 (31.8%) |
Education in Utopia
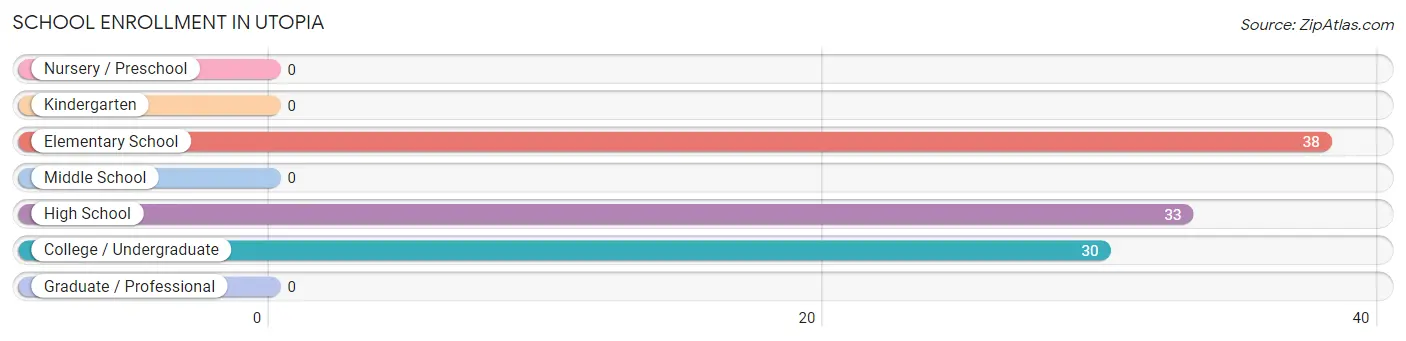
School Enrollment in Utopia
The most common levels of schooling among the 101 students in Utopia are elementary school (38 | 37.6%), high school (33 | 32.7%), and college / undergraduate (30 | 29.7%).
| School Level | # Students | % Students |
| Nursery / Preschool | 0 | 0.0% |
| Kindergarten | 0 | 0.0% |
| Elementary School | 38 | 37.6% |
| Middle School | 0 | 0.0% |
| High School | 33 | 32.7% |
| College / Undergraduate | 30 | 29.7% |
| Graduate / Professional | 0 | 0.0% |
| Total | 101 | 100.0% |
School Enrollment by Age by Funding Source in Utopia
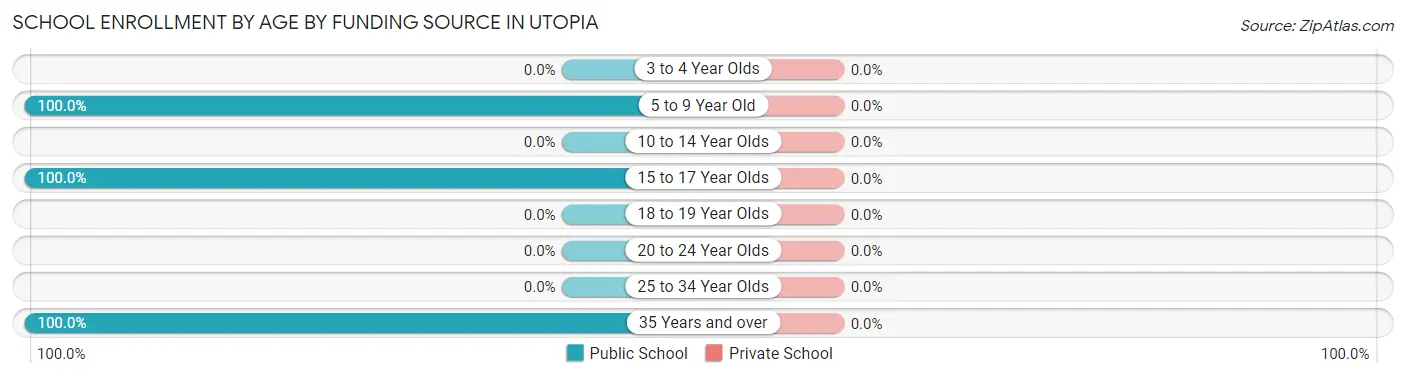
| Age Bracket | Public School | Private School |
| 3 to 4 Year Olds | 0 (0.0%) | 0 (0.0%) |
| 5 to 9 Year Old | 38 (100.0%) | 0 (0.0%) |
| 10 to 14 Year Olds | 0 (0.0%) | 0 (0.0%) |
| 15 to 17 Year Olds | 33 (100.0%) | 0 (0.0%) |
| 18 to 19 Year Olds | 0 (0.0%) | 0 (0.0%) |
| 20 to 24 Year Olds | 0 (0.0%) | 0 (0.0%) |
| 25 to 34 Year Olds | 0 (0.0%) | 0 (0.0%) |
| 35 Years and over | 30 (100.0%) | 0 (0.0%) |
| Total | 101 (100.0%) | 0 (0.0%) |
Educational Attainment by Field of Study in Utopia
Education (14 | 66.7%), and science & technology (7 | 33.3%) are the most common fields of study among 21 individuals in Utopia who have obtained a bachelor's degree or higher.
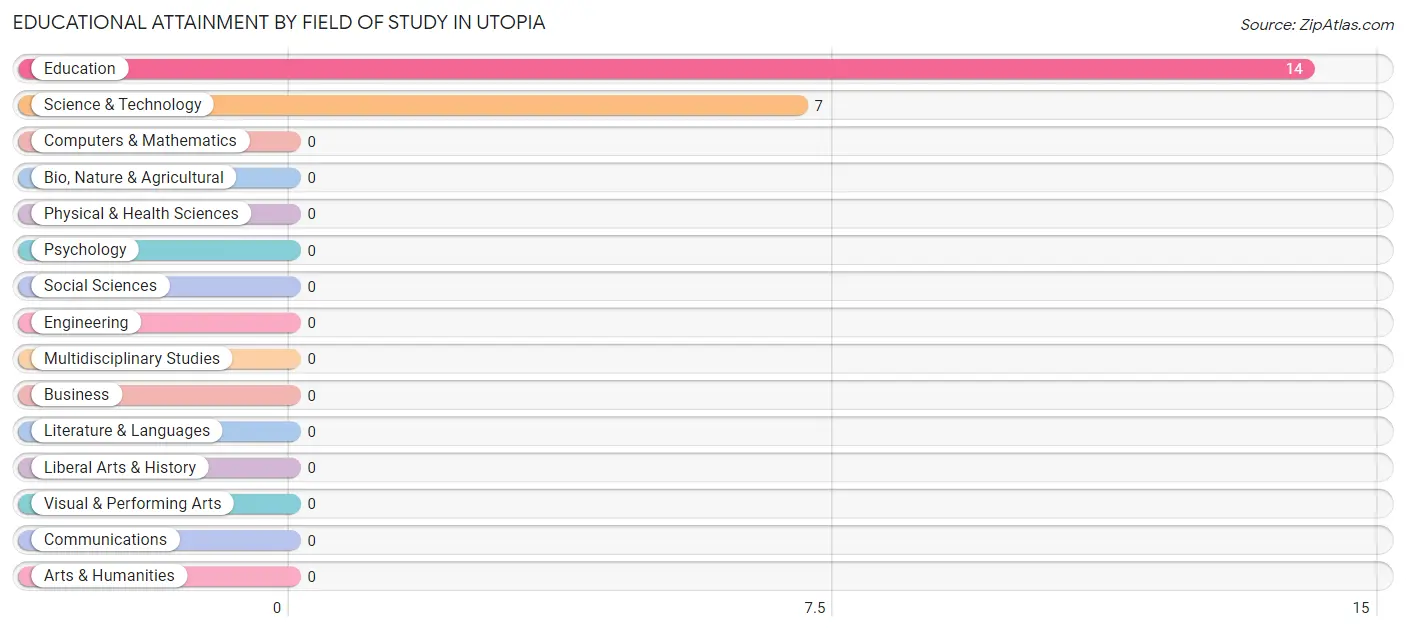
| Field of Study | # Graduates | % Graduates |
| Computers & Mathematics | 0 | 0.0% |
| Bio, Nature & Agricultural | 0 | 0.0% |
| Physical & Health Sciences | 0 | 0.0% |
| Psychology | 0 | 0.0% |
| Social Sciences | 0 | 0.0% |
| Engineering | 0 | 0.0% |
| Multidisciplinary Studies | 0 | 0.0% |
| Science & Technology | 7 | 33.3% |
| Business | 0 | 0.0% |
| Education | 14 | 66.7% |
| Literature & Languages | 0 | 0.0% |
| Liberal Arts & History | 0 | 0.0% |
| Visual & Performing Arts | 0 | 0.0% |
| Communications | 0 | 0.0% |
| Arts & Humanities | 0 | 0.0% |
| Total | 21 | 100.0% |
Transportation & Commute in Utopia
Vehicle Availability by Sex in Utopia
The most prevalent vehicle ownership categories in Utopia are males with 3 vehicles (68, accounting for 57.6%) and females with 3 vehicles (55, making up 123.6%).
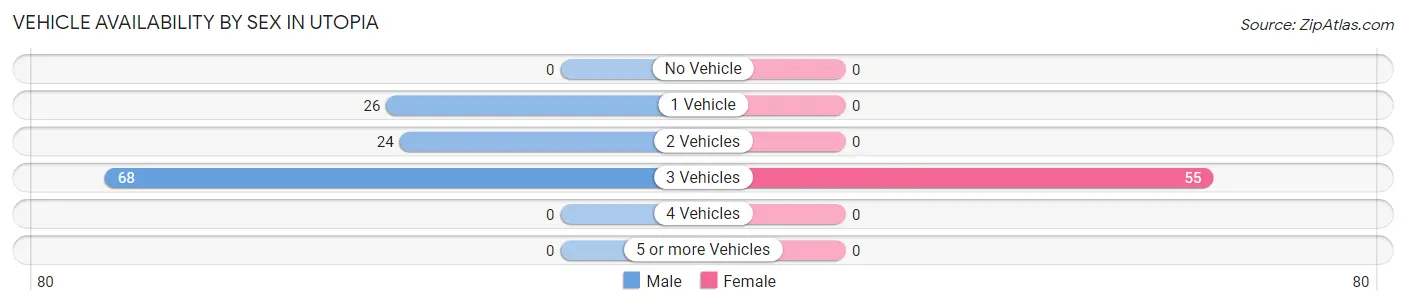
| Vehicles Available | Male | Female |
| No Vehicle | 0 (0.0%) | 0 (0.0%) |
| 1 Vehicle | 26 (22.0%) | 0 (0.0%) |
| 2 Vehicles | 24 (20.3%) | 0 (0.0%) |
| 3 Vehicles | 68 (57.6%) | 55 (100.0%) |
| 4 Vehicles | 0 (0.0%) | 0 (0.0%) |
| 5 or more Vehicles | 0 (0.0%) | 0 (0.0%) |
| Total | 118 (100.0%) | 55 (100.0%) |
Commute Time in Utopia
The most frequently occuring commute durations in Utopia are less than 5 minutes (97 commuters, 56.1%), 5 to 9 minutes (41 commuters, 23.7%), and 20 to 24 minutes (13 commuters, 7.5%).
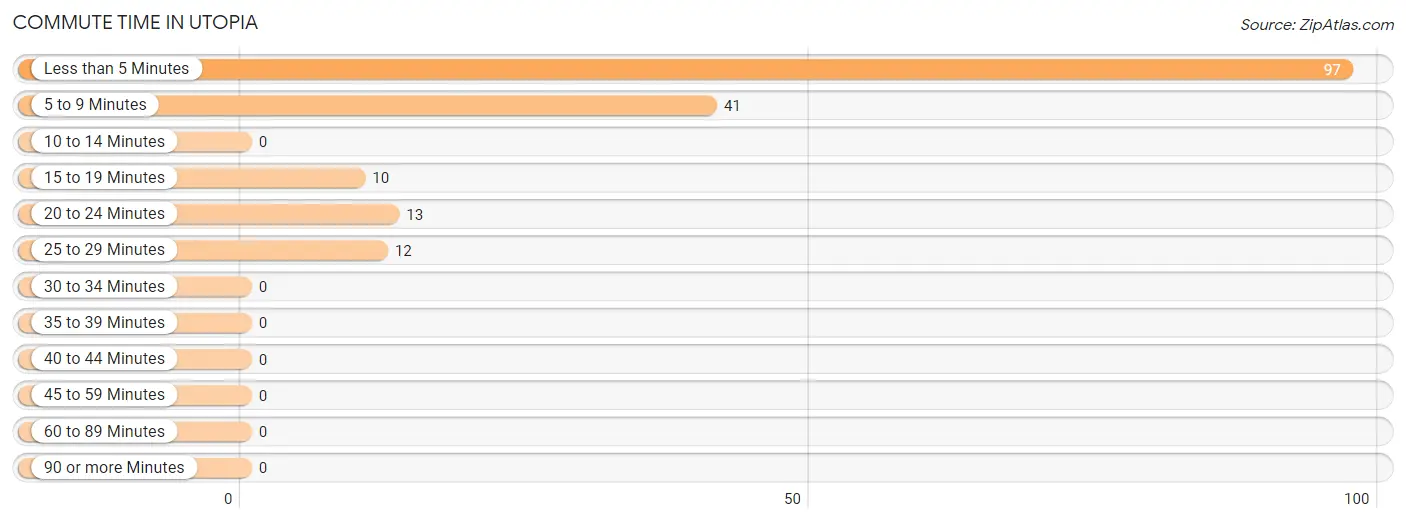
| Commute Time | # Commuters | % Commuters |
| Less than 5 Minutes | 97 | 56.1% |
| 5 to 9 Minutes | 41 | 23.7% |
| 10 to 14 Minutes | 0 | 0.0% |
| 15 to 19 Minutes | 10 | 5.8% |
| 20 to 24 Minutes | 13 | 7.5% |
| 25 to 29 Minutes | 12 | 6.9% |
| 30 to 34 Minutes | 0 | 0.0% |
| 35 to 39 Minutes | 0 | 0.0% |
| 40 to 44 Minutes | 0 | 0.0% |
| 45 to 59 Minutes | 0 | 0.0% |
| 60 to 89 Minutes | 0 | 0.0% |
| 90 or more Minutes | 0 | 0.0% |
Commute Time by Sex in Utopia
The most common commute times in Utopia are less than 5 minutes (74 commuters, 62.7%) for males and less than 5 minutes (23 commuters, 41.8%) for females.
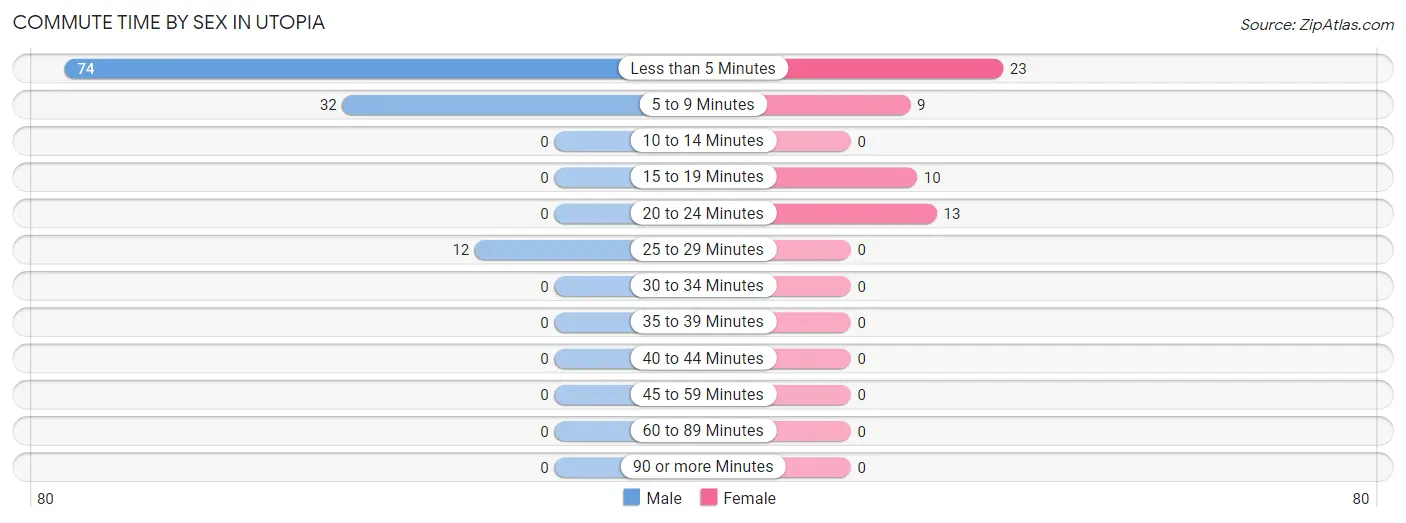
| Commute Time | Male | Female |
| Less than 5 Minutes | 74 (62.7%) | 23 (41.8%) |
| 5 to 9 Minutes | 32 (27.1%) | 9 (16.4%) |
| 10 to 14 Minutes | 0 (0.0%) | 0 (0.0%) |
| 15 to 19 Minutes | 0 (0.0%) | 10 (18.2%) |
| 20 to 24 Minutes | 0 (0.0%) | 13 (23.6%) |
| 25 to 29 Minutes | 12 (10.2%) | 0 (0.0%) |
| 30 to 34 Minutes | 0 (0.0%) | 0 (0.0%) |
| 35 to 39 Minutes | 0 (0.0%) | 0 (0.0%) |
| 40 to 44 Minutes | 0 (0.0%) | 0 (0.0%) |
| 45 to 59 Minutes | 0 (0.0%) | 0 (0.0%) |
| 60 to 89 Minutes | 0 (0.0%) | 0 (0.0%) |
| 90 or more Minutes | 0 (0.0%) | 0 (0.0%) |
Time of Departure to Work by Sex in Utopia
The most frequent times of departure to work in Utopia are 7:00 AM to 7:29 AM (24, 20.3%) for males and 7:30 AM to 7:59 AM (32, 58.2%) for females.
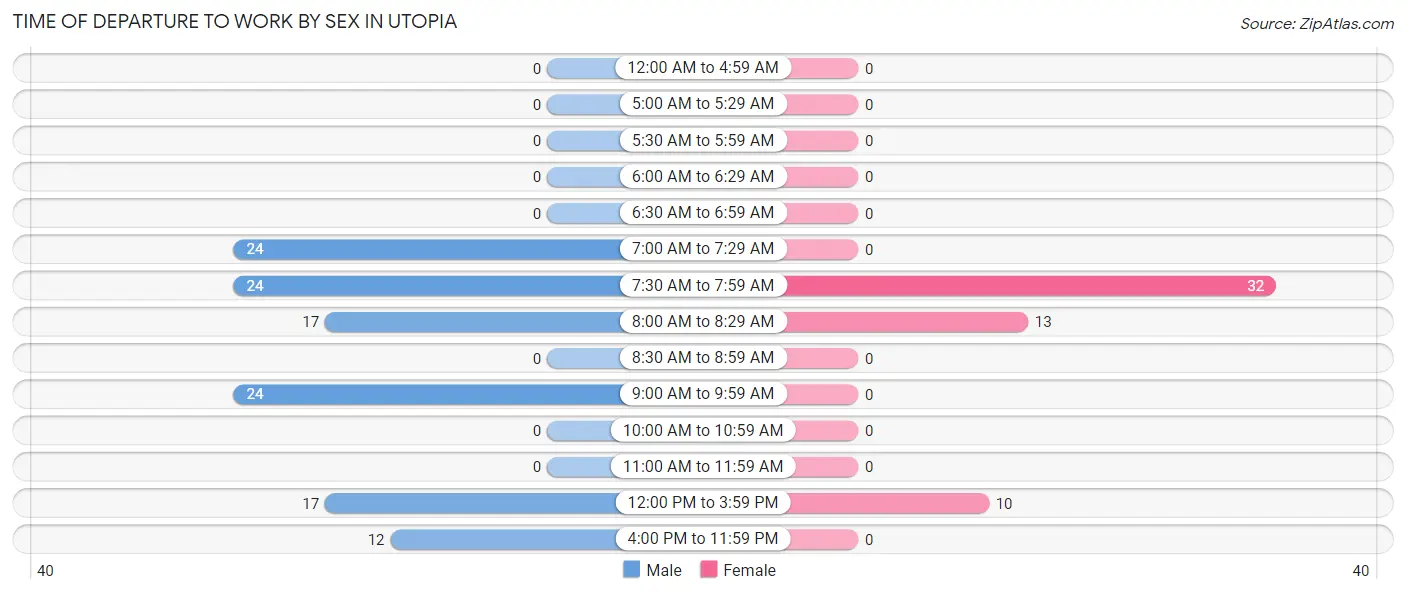
| Time of Departure | Male | Female |
| 12:00 AM to 4:59 AM | 0 (0.0%) | 0 (0.0%) |
| 5:00 AM to 5:29 AM | 0 (0.0%) | 0 (0.0%) |
| 5:30 AM to 5:59 AM | 0 (0.0%) | 0 (0.0%) |
| 6:00 AM to 6:29 AM | 0 (0.0%) | 0 (0.0%) |
| 6:30 AM to 6:59 AM | 0 (0.0%) | 0 (0.0%) |
| 7:00 AM to 7:29 AM | 24 (20.3%) | 0 (0.0%) |
| 7:30 AM to 7:59 AM | 24 (20.3%) | 32 (58.2%) |
| 8:00 AM to 8:29 AM | 17 (14.4%) | 13 (23.6%) |
| 8:30 AM to 8:59 AM | 0 (0.0%) | 0 (0.0%) |
| 9:00 AM to 9:59 AM | 24 (20.3%) | 0 (0.0%) |
| 10:00 AM to 10:59 AM | 0 (0.0%) | 0 (0.0%) |
| 11:00 AM to 11:59 AM | 0 (0.0%) | 0 (0.0%) |
| 12:00 PM to 3:59 PM | 17 (14.4%) | 10 (18.2%) |
| 4:00 PM to 11:59 PM | 12 (10.2%) | 0 (0.0%) |
| Total | 118 (100.0%) | 55 (100.0%) |
Housing Occupancy in Utopia
Occupancy by Ownership in Utopia
Of the total 90 dwellings in Utopia, owner-occupied units account for 25 (27.8%), while renter-occupied units make up 65 (72.2%).
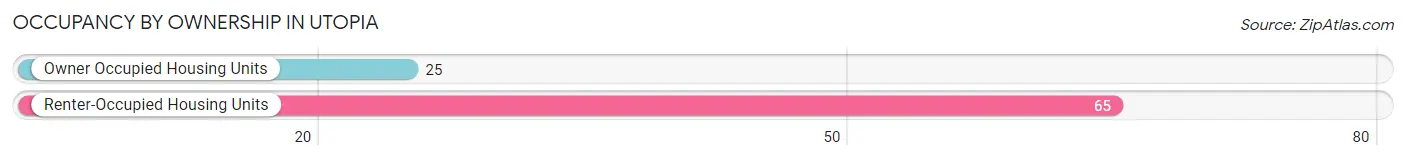
| Occupancy | # Housing Units | % Housing Units |
| Owner Occupied Housing Units | 25 | 27.8% |
| Renter-Occupied Housing Units | 65 | 72.2% |
| Total Occupied Housing Units | 90 | 100.0% |
Occupancy by Household Size in Utopia
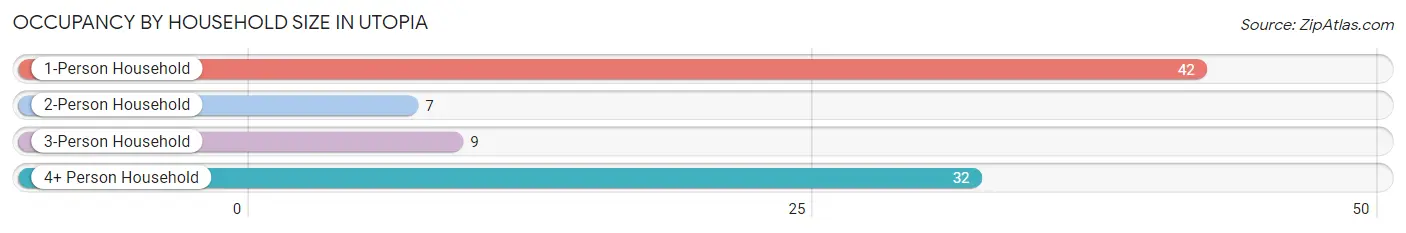
| Household Size | # Housing Units | % Housing Units |
| 1-Person Household | 42 | 46.7% |
| 2-Person Household | 7 | 7.8% |
| 3-Person Household | 9 | 10.0% |
| 4+ Person Household | 32 | 35.6% |
| Total Housing Units | 90 | 100.0% |
Occupancy by Ownership by Household Size in Utopia
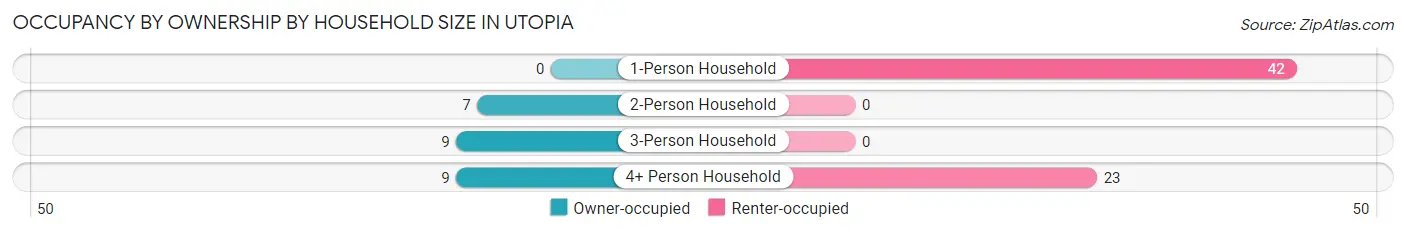
| Household Size | Owner-occupied | Renter-occupied |
| 1-Person Household | 0 (0.0%) | 42 (100.0%) |
| 2-Person Household | 7 (100.0%) | 0 (0.0%) |
| 3-Person Household | 9 (100.0%) | 0 (0.0%) |
| 4+ Person Household | 9 (28.1%) | 23 (71.9%) |
| Total Housing Units | 25 (27.8%) | 65 (72.2%) |
Occupancy by Educational Attainment in Utopia
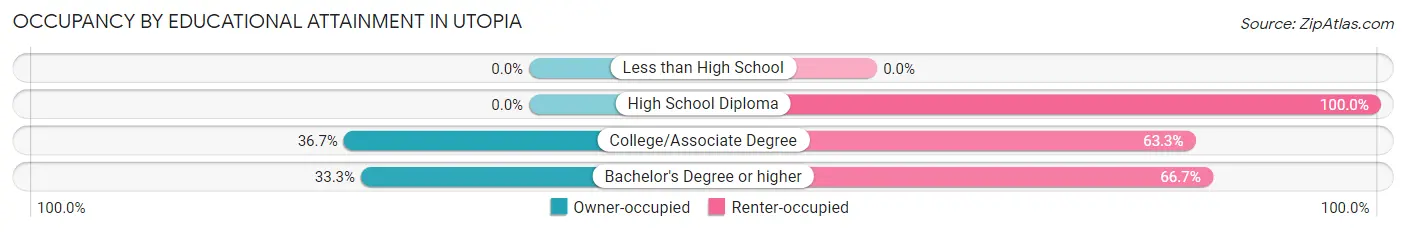
| Household Size | Owner-occupied | Renter-occupied |
| Less than High School | 0 (0.0%) | 0 (0.0%) |
| High School Diploma | 0 (0.0%) | 20 (100.0%) |
| College/Associate Degree | 18 (36.7%) | 31 (63.3%) |
| Bachelor's Degree or higher | 7 (33.3%) | 14 (66.7%) |
Occupancy by Age of Householder in Utopia
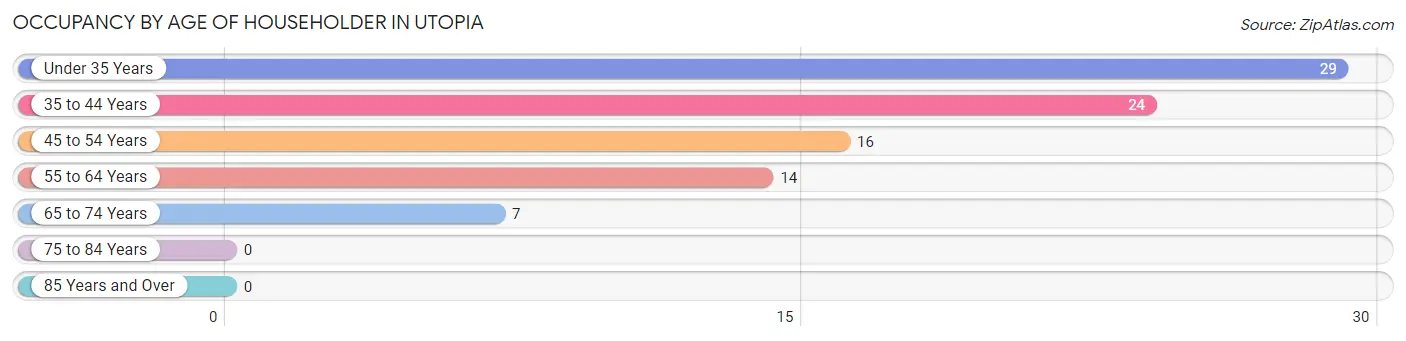
| Age Bracket | # Households | % Households |
| Under 35 Years | 29 | 32.2% |
| 35 to 44 Years | 24 | 26.7% |
| 45 to 54 Years | 16 | 17.8% |
| 55 to 64 Years | 14 | 15.6% |
| 65 to 74 Years | 7 | 7.8% |
| 75 to 84 Years | 0 | 0.0% |
| 85 Years and Over | 0 | 0.0% |
| Total | 90 | 100.0% |
Housing Finances in Utopia
Median Income by Occupancy in Utopia
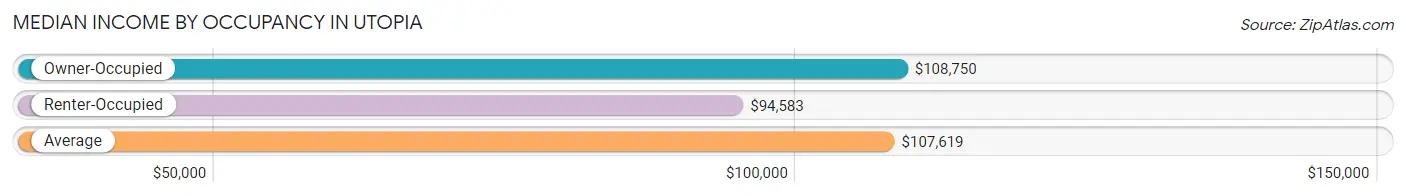
| Occupancy Type | # Households | Median Income |
| Owner-Occupied | 25 (27.8%) | $108,750 |
| Renter-Occupied | 65 (72.2%) | $94,583 |
| Average | 90 (100.0%) | $107,619 |
Occupancy by Householder Income Bracket in Utopia
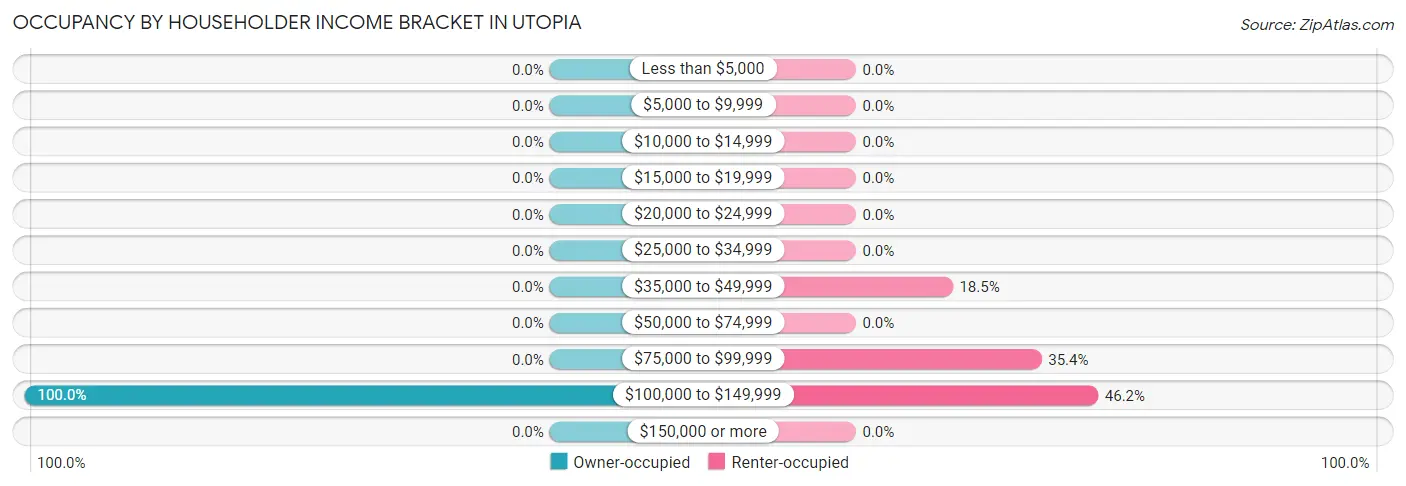
| Income Bracket | Owner-occupied | Renter-occupied |
| Less than $5,000 | 0 (0.0%) | 0 (0.0%) |
| $5,000 to $9,999 | 0 (0.0%) | 0 (0.0%) |
| $10,000 to $14,999 | 0 (0.0%) | 0 (0.0%) |
| $15,000 to $19,999 | 0 (0.0%) | 0 (0.0%) |
| $20,000 to $24,999 | 0 (0.0%) | 0 (0.0%) |
| $25,000 to $34,999 | 0 (0.0%) | 0 (0.0%) |
| $35,000 to $49,999 | 0 (0.0%) | 12 (18.5%) |
| $50,000 to $74,999 | 0 (0.0%) | 0 (0.0%) |
| $75,000 to $99,999 | 0 (0.0%) | 23 (35.4%) |
| $100,000 to $149,999 | 25 (100.0%) | 30 (46.2%) |
| $150,000 or more | 0 (0.0%) | 0 (0.0%) |
| Total | 25 (100.0%) | 65 (100.0%) |
Monthly Housing Cost Tiers in Utopia
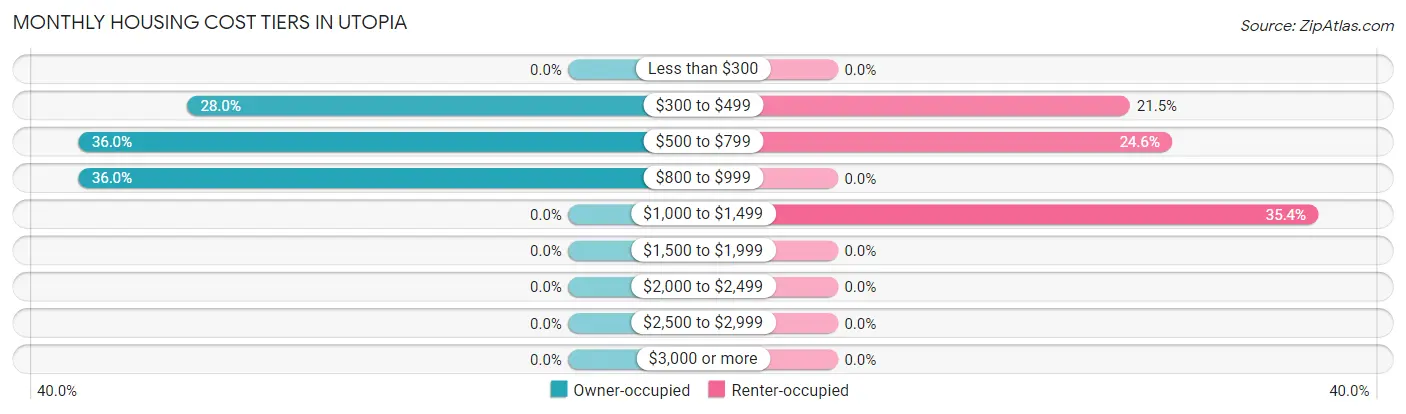
| Monthly Cost | Owner-occupied | Renter-occupied |
| Less than $300 | 0 (0.0%) | 0 (0.0%) |
| $300 to $499 | 7 (28.0%) | 14 (21.5%) |
| $500 to $799 | 9 (36.0%) | 16 (24.6%) |
| $800 to $999 | 9 (36.0%) | 0 (0.0%) |
| $1,000 to $1,499 | 0 (0.0%) | 23 (35.4%) |
| $1,500 to $1,999 | 0 (0.0%) | 0 (0.0%) |
| $2,000 to $2,499 | 0 (0.0%) | 0 (0.0%) |
| $2,500 to $2,999 | 0 (0.0%) | 0 (0.0%) |
| $3,000 or more | 0 (0.0%) | 0 (0.0%) |
| Total | 25 (100.0%) | 65 (100.0%) |
Physical Housing Characteristics in Utopia
Housing Structures in Utopia
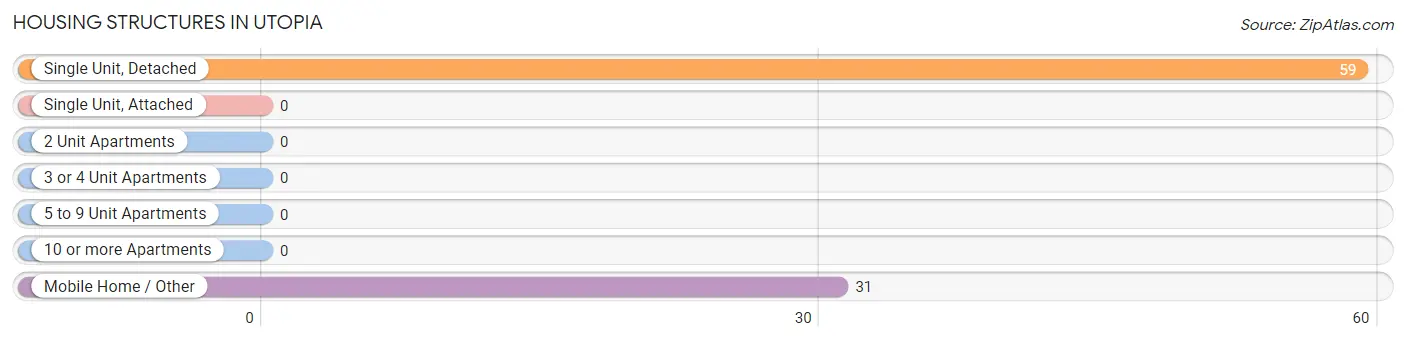
| Structure Type | # Housing Units | % Housing Units |
| Single Unit, Detached | 59 | 65.6% |
| Single Unit, Attached | 0 | 0.0% |
| 2 Unit Apartments | 0 | 0.0% |
| 3 or 4 Unit Apartments | 0 | 0.0% |
| 5 to 9 Unit Apartments | 0 | 0.0% |
| 10 or more Apartments | 0 | 0.0% |
| Mobile Home / Other | 31 | 34.4% |
| Total | 90 | 100.0% |
Housing Structures by Occupancy in Utopia
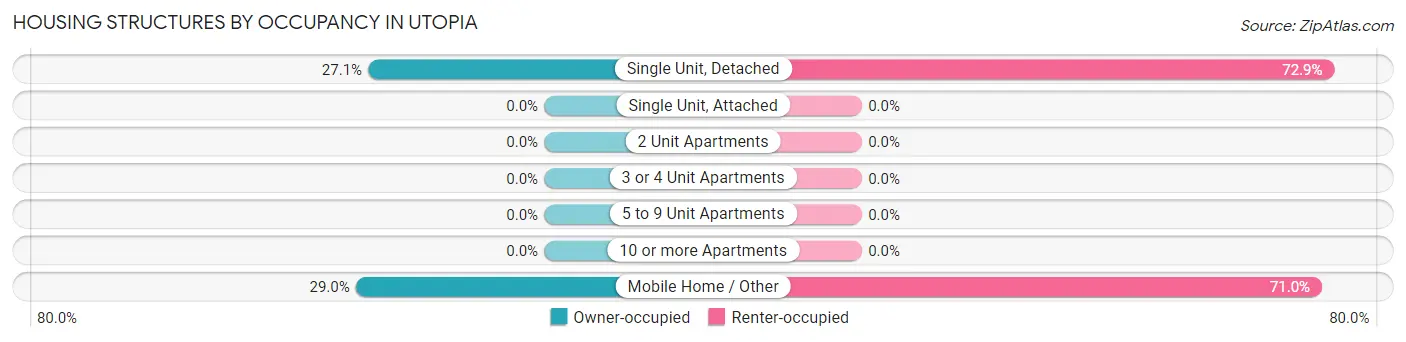
| Structure Type | Owner-occupied | Renter-occupied |
| Single Unit, Detached | 16 (27.1%) | 43 (72.9%) |
| Single Unit, Attached | 0 (0.0%) | 0 (0.0%) |
| 2 Unit Apartments | 0 (0.0%) | 0 (0.0%) |
| 3 or 4 Unit Apartments | 0 (0.0%) | 0 (0.0%) |
| 5 to 9 Unit Apartments | 0 (0.0%) | 0 (0.0%) |
| 10 or more Apartments | 0 (0.0%) | 0 (0.0%) |
| Mobile Home / Other | 9 (29.0%) | 22 (71.0%) |
| Total | 25 (27.8%) | 65 (72.2%) |
Housing Structures by Number of Rooms in Utopia
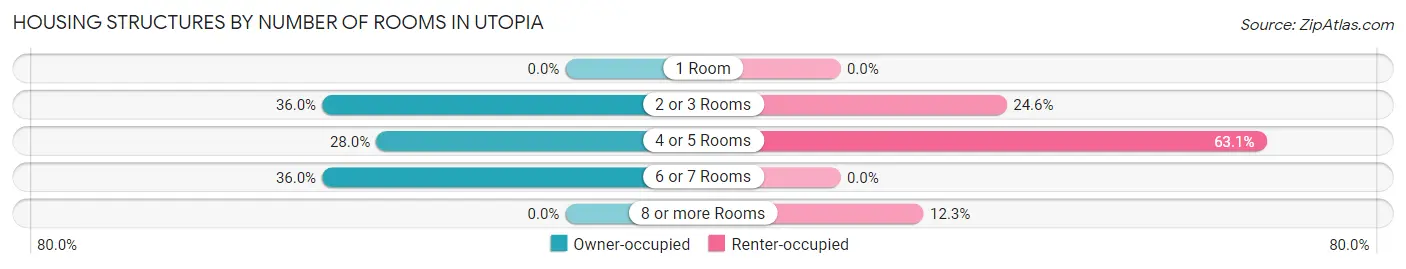
| Number of Rooms | Owner-occupied | Renter-occupied |
| 1 Room | 0 (0.0%) | 0 (0.0%) |
| 2 or 3 Rooms | 9 (36.0%) | 16 (24.6%) |
| 4 or 5 Rooms | 7 (28.0%) | 41 (63.1%) |
| 6 or 7 Rooms | 9 (36.0%) | 0 (0.0%) |
| 8 or more Rooms | 0 (0.0%) | 8 (12.3%) |
| Total | 25 (100.0%) | 65 (100.0%) |
Housing Structure by Heating Type in Utopia
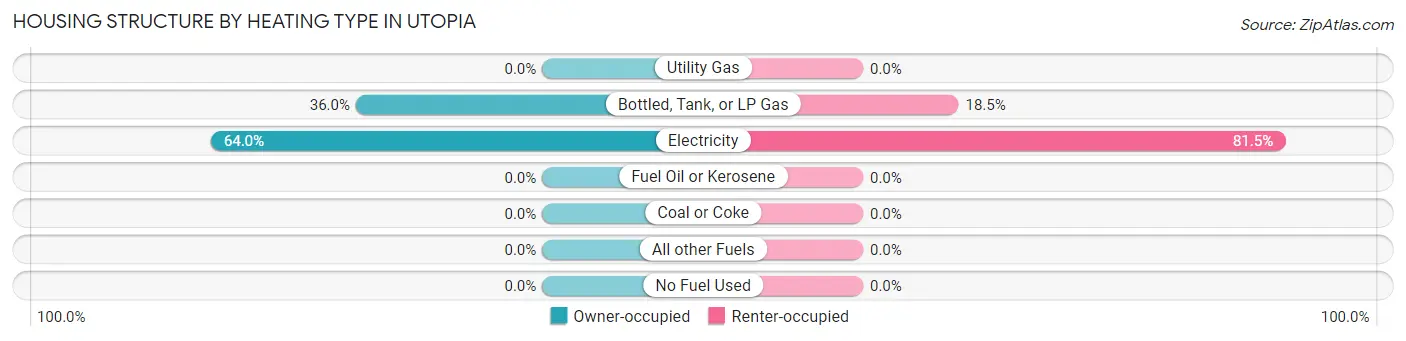
| Heating Type | Owner-occupied | Renter-occupied |
| Utility Gas | 0 (0.0%) | 0 (0.0%) |
| Bottled, Tank, or LP Gas | 9 (36.0%) | 12 (18.5%) |
| Electricity | 16 (64.0%) | 53 (81.5%) |
| Fuel Oil or Kerosene | 0 (0.0%) | 0 (0.0%) |
| Coal or Coke | 0 (0.0%) | 0 (0.0%) |
| All other Fuels | 0 (0.0%) | 0 (0.0%) |
| No Fuel Used | 0 (0.0%) | 0 (0.0%) |
| Total | 25 (100.0%) | 65 (100.0%) |
Household Vehicle Usage in Utopia
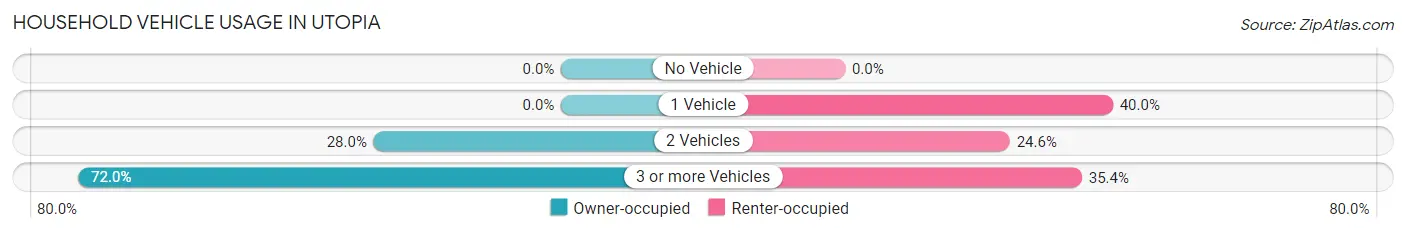
| Vehicles per Household | Owner-occupied | Renter-occupied |
| No Vehicle | 0 (0.0%) | 0 (0.0%) |
| 1 Vehicle | 0 (0.0%) | 26 (40.0%) |
| 2 Vehicles | 7 (28.0%) | 16 (24.6%) |
| 3 or more Vehicles | 18 (72.0%) | 23 (35.4%) |
| Total | 25 (100.0%) | 65 (100.0%) |
Real Estate & Mortgages in Utopia
Real Estate and Mortgage Overview in Utopia
| Characteristic | Without Mortgage | With Mortgage |
| Housing Units | 16 | 9 |
| Median Property Value | - | - |
| Median Household Income | - | - |
| Monthly Housing Costs | - | - |
| Real Estate Taxes | - | - |
Property Value by Mortgage Status in Utopia
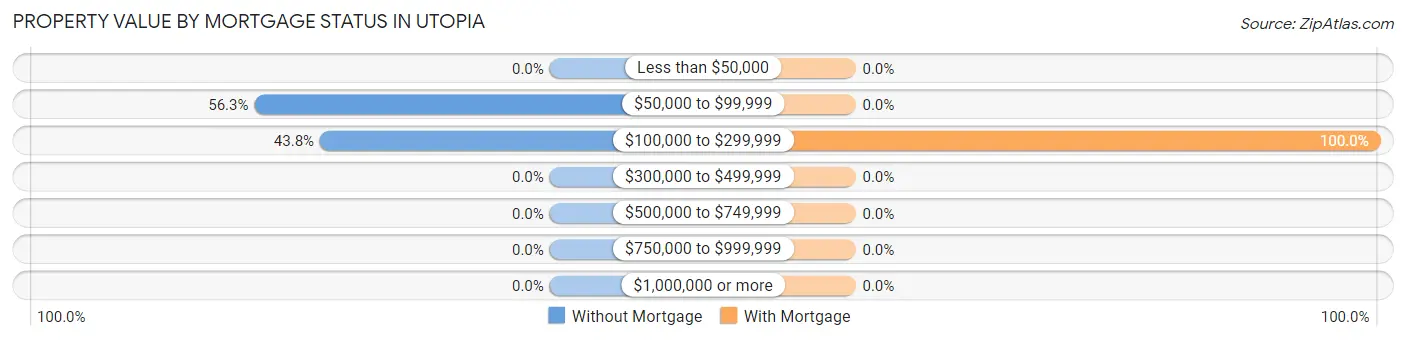
| Property Value | Without Mortgage | With Mortgage |
| Less than $50,000 | 0 (0.0%) | 0 (0.0%) |
| $50,000 to $99,999 | 9 (56.2%) | 0 (0.0%) |
| $100,000 to $299,999 | 7 (43.8%) | 9 (100.0%) |
| $300,000 to $499,999 | 0 (0.0%) | 0 (0.0%) |
| $500,000 to $749,999 | 0 (0.0%) | 0 (0.0%) |
| $750,000 to $999,999 | 0 (0.0%) | 0 (0.0%) |
| $1,000,000 or more | 0 (0.0%) | 0 (0.0%) |
| Total | 16 (100.0%) | 9 (100.0%) |
Household Income by Mortgage Status in Utopia
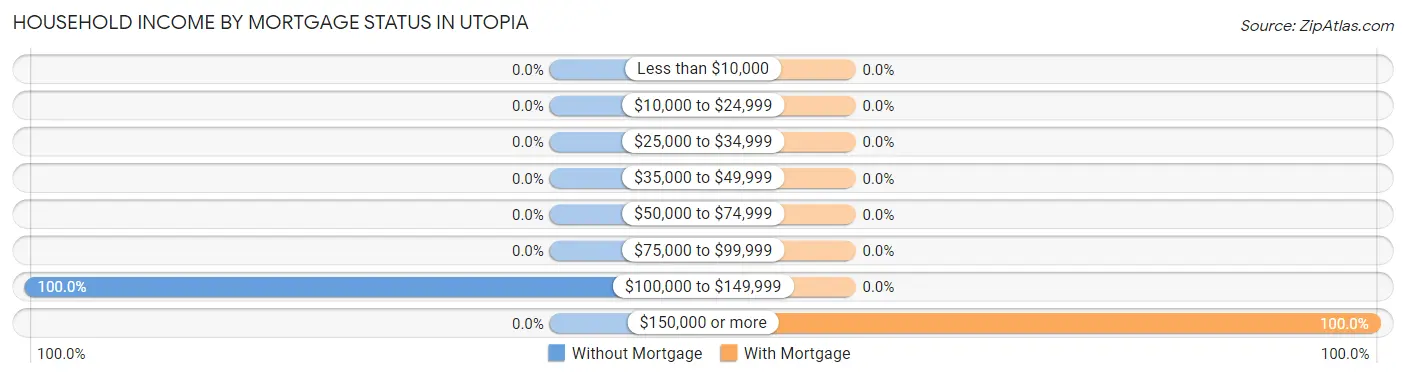
| Household Income | Without Mortgage | With Mortgage |
| Less than $10,000 | 0 (0.0%) | 0 (0.0%) |
| $10,000 to $24,999 | 0 (0.0%) | 0 (0.0%) |
| $25,000 to $34,999 | 0 (0.0%) | 0 (0.0%) |
| $35,000 to $49,999 | 0 (0.0%) | 0 (0.0%) |
| $50,000 to $74,999 | 0 (0.0%) | 0 (0.0%) |
| $75,000 to $99,999 | 0 (0.0%) | 0 (0.0%) |
| $100,000 to $149,999 | 16 (100.0%) | 0 (0.0%) |
| $150,000 or more | 0 (0.0%) | 9 (100.0%) |
| Total | 16 (100.0%) | 9 (100.0%) |
Property Value to Household Income Ratio in Utopia
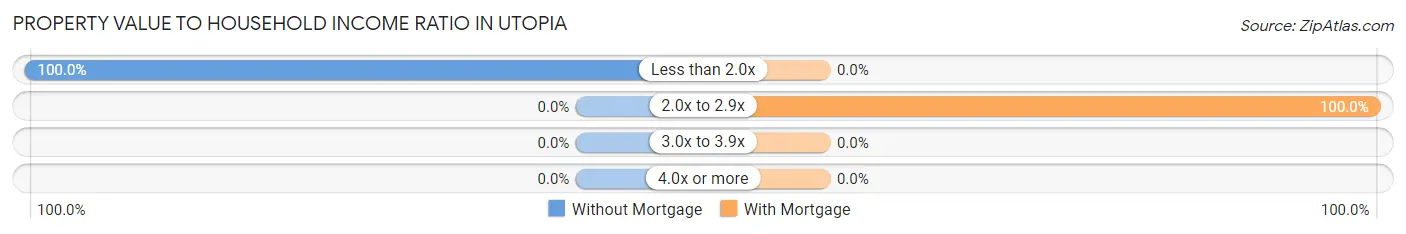
| Value-to-Income Ratio | Without Mortgage | With Mortgage |
| Less than 2.0x | 16 (100.0%) | 0 (0.0%) |
| 2.0x to 2.9x | 0 (0.0%) | 9 (100.0%) |
| 3.0x to 3.9x | 0 (0.0%) | 0 (0.0%) |
| 4.0x or more | 0 (0.0%) | 0 (0.0%) |
| Total | 16 (100.0%) | 9 (100.0%) |
Real Estate Taxes by Mortgage Status in Utopia
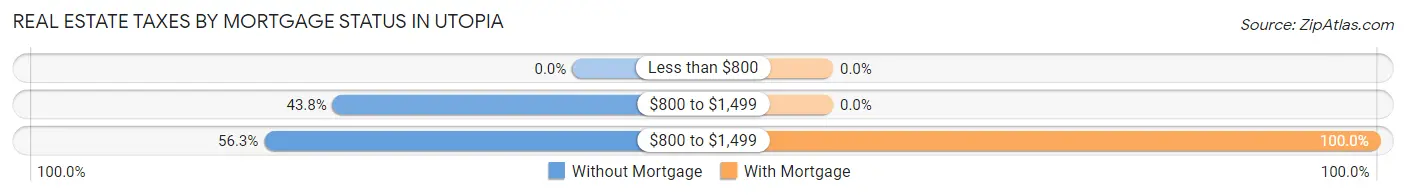
| Property Taxes | Without Mortgage | With Mortgage |
| Less than $800 | 0 (0.0%) | 0 (0.0%) |
| $800 to $1,499 | 7 (43.8%) | 0 (0.0%) |
| $800 to $1,499 | 9 (56.2%) | 9 (100.0%) |
| Total | 16 (100.0%) | 9 (100.0%) |
Health & Disability in Utopia
Health Insurance Coverage by Age in Utopia
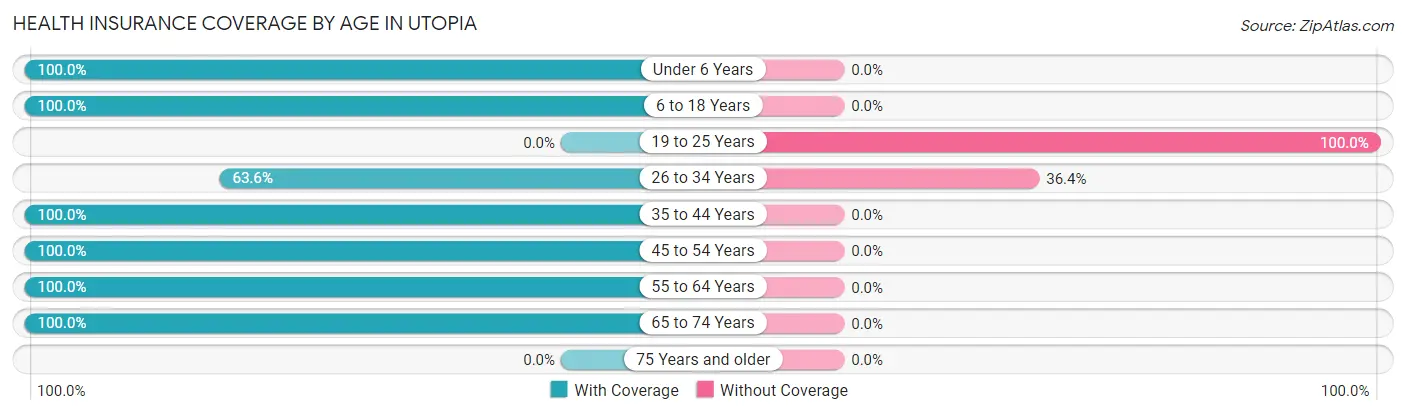
| Age Bracket | With Coverage | Without Coverage |
| Under 6 Years | 4 (100.0%) | 0 (0.0%) |
| 6 to 18 Years | 71 (100.0%) | 0 (0.0%) |
| 19 to 25 Years | 0 (0.0%) | 9 (100.0%) |
| 26 to 34 Years | 21 (63.6%) | 12 (36.4%) |
| 35 to 44 Years | 66 (100.0%) | 0 (0.0%) |
| 45 to 54 Years | 16 (100.0%) | 0 (0.0%) |
| 55 to 64 Years | 14 (100.0%) | 0 (0.0%) |
| 65 to 74 Years | 15 (100.0%) | 0 (0.0%) |
| 75 Years and older | 0 (0.0%) | 0 (0.0%) |
| Total | 207 (90.8%) | 21 (9.2%) |
Health Insurance Coverage by Citizenship Status in Utopia
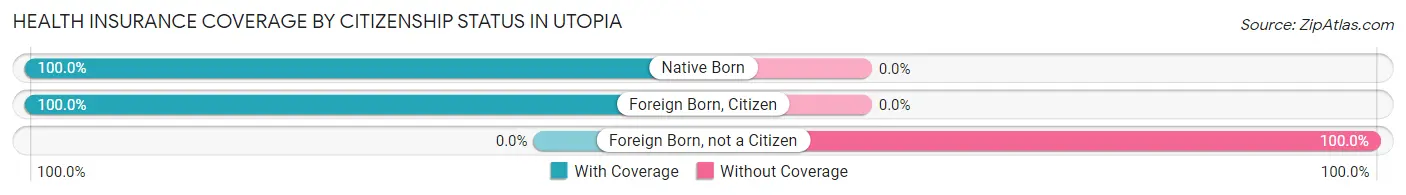
| Citizenship Status | With Coverage | Without Coverage |
| Native Born | 4 (100.0%) | 0 (0.0%) |
| Foreign Born, Citizen | 71 (100.0%) | 0 (0.0%) |
| Foreign Born, not a Citizen | 0 (0.0%) | 9 (100.0%) |
Health Insurance Coverage by Household Income in Utopia
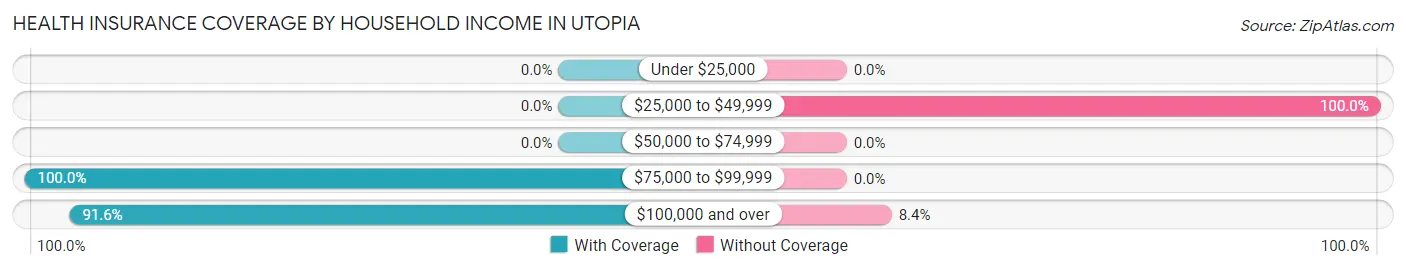
| Household Income | With Coverage | Without Coverage |
| Under $25,000 | 0 (0.0%) | 0 (0.0%) |
| $25,000 to $49,999 | 0 (0.0%) | 12 (100.0%) |
| $50,000 to $74,999 | 0 (0.0%) | 0 (0.0%) |
| $75,000 to $99,999 | 109 (100.0%) | 0 (0.0%) |
| $100,000 and over | 98 (91.6%) | 9 (8.4%) |
Public vs Private Health Insurance Coverage by Age in Utopia
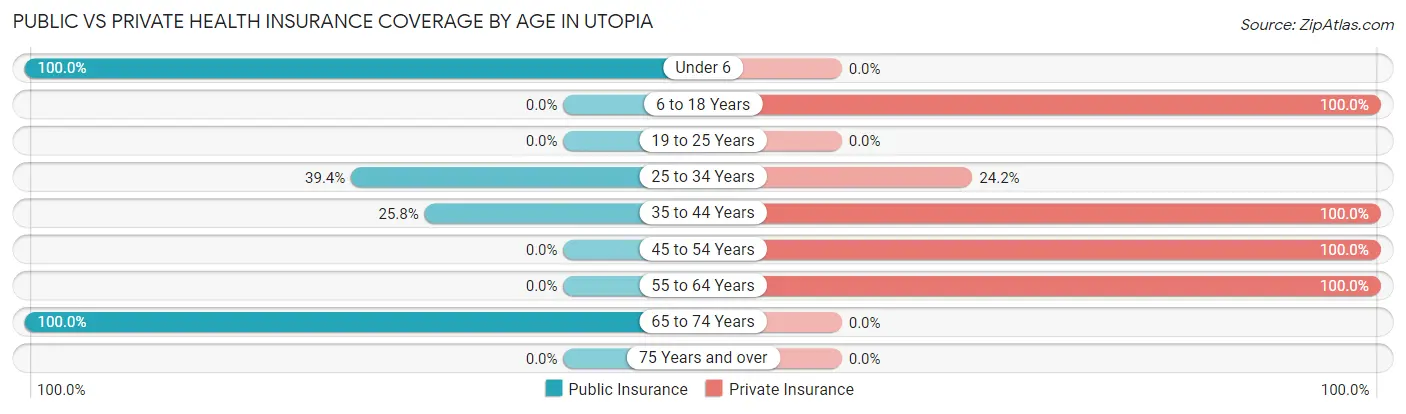
| Age Bracket | Public Insurance | Private Insurance |
| Under 6 | 4 (100.0%) | 0 (0.0%) |
| 6 to 18 Years | 0 (0.0%) | 71 (100.0%) |
| 19 to 25 Years | 0 (0.0%) | 0 (0.0%) |
| 25 to 34 Years | 13 (39.4%) | 8 (24.2%) |
| 35 to 44 Years | 17 (25.8%) | 66 (100.0%) |
| 45 to 54 Years | 0 (0.0%) | 16 (100.0%) |
| 55 to 64 Years | 0 (0.0%) | 14 (100.0%) |
| 65 to 74 Years | 15 (100.0%) | 0 (0.0%) |
| 75 Years and over | 0 (0.0%) | 0 (0.0%) |
| Total | 49 (21.5%) | 175 (76.7%) |
Disability Status by Sex by Age in Utopia
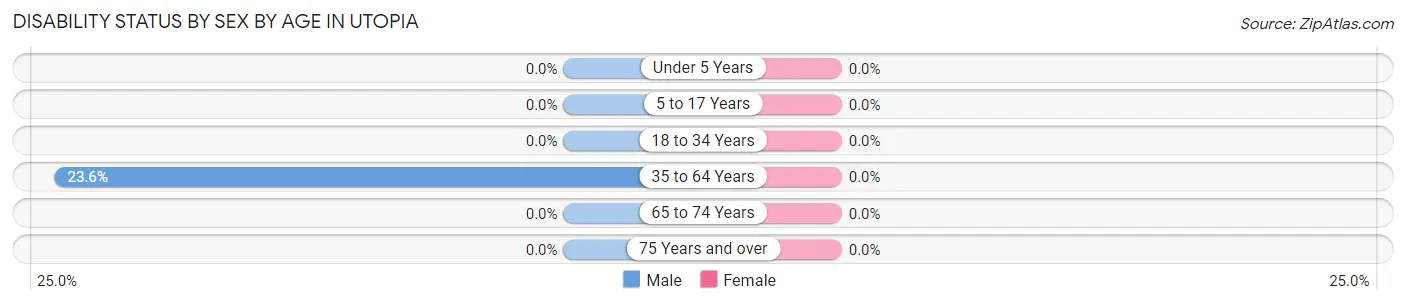
| Age Bracket | Male | Female |
| Under 5 Years | 0 (0.0%) | 0 (0.0%) |
| 5 to 17 Years | 0 (0.0%) | 0 (0.0%) |
| 18 to 34 Years | 0 (0.0%) | 0 (0.0%) |
| 35 to 64 Years | 17 (23.6%) | 0 (0.0%) |
| 65 to 74 Years | 0 (0.0%) | 0 (0.0%) |
| 75 Years and over | 0 (0.0%) | 0 (0.0%) |
Disability Class by Sex by Age in Utopia
Disability Class: Hearing Difficulty
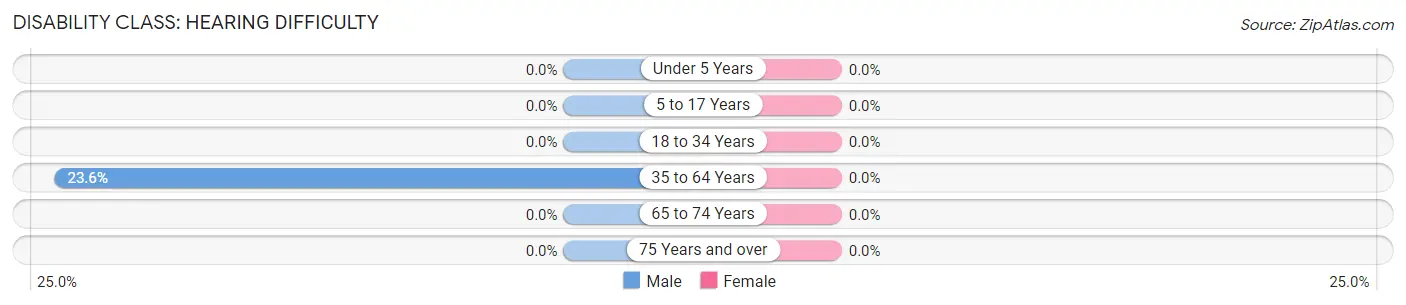
| Age Bracket | Male | Female |
| Under 5 Years | 0 (0.0%) | 0 (0.0%) |
| 5 to 17 Years | 0 (0.0%) | 0 (0.0%) |
| 18 to 34 Years | 0 (0.0%) | 0 (0.0%) |
| 35 to 64 Years | 17 (23.6%) | 0 (0.0%) |
| 65 to 74 Years | 0 (0.0%) | 0 (0.0%) |
| 75 Years and over | 0 (0.0%) | 0 (0.0%) |
Disability Class: Vision Difficulty
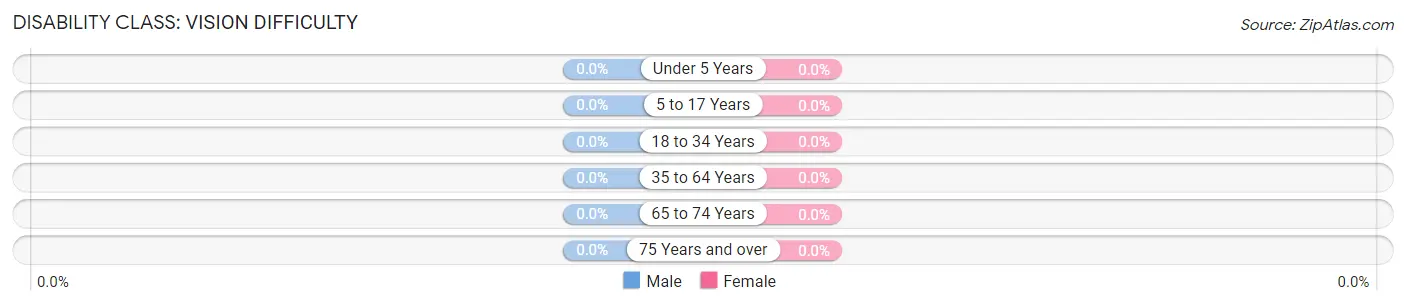
| Age Bracket | Male | Female |
| Under 5 Years | 0 (0.0%) | 0 (0.0%) |
| 5 to 17 Years | 0 (0.0%) | 0 (0.0%) |
| 18 to 34 Years | 0 (0.0%) | 0 (0.0%) |
| 35 to 64 Years | 0 (0.0%) | 0 (0.0%) |
| 65 to 74 Years | 0 (0.0%) | 0 (0.0%) |
| 75 Years and over | 0 (0.0%) | 0 (0.0%) |
Disability Class: Cognitive Difficulty
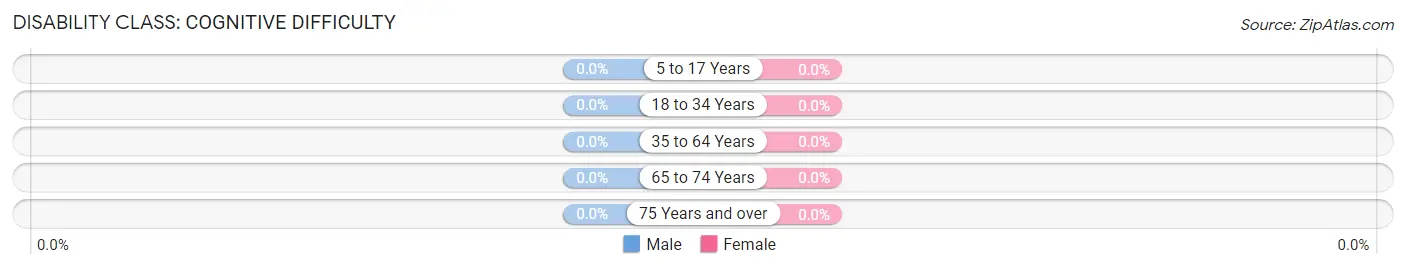
| Age Bracket | Male | Female |
| 5 to 17 Years | 0 (0.0%) | 0 (0.0%) |
| 18 to 34 Years | 0 (0.0%) | 0 (0.0%) |
| 35 to 64 Years | 0 (0.0%) | 0 (0.0%) |
| 65 to 74 Years | 0 (0.0%) | 0 (0.0%) |
| 75 Years and over | 0 (0.0%) | 0 (0.0%) |
Disability Class: Ambulatory Difficulty
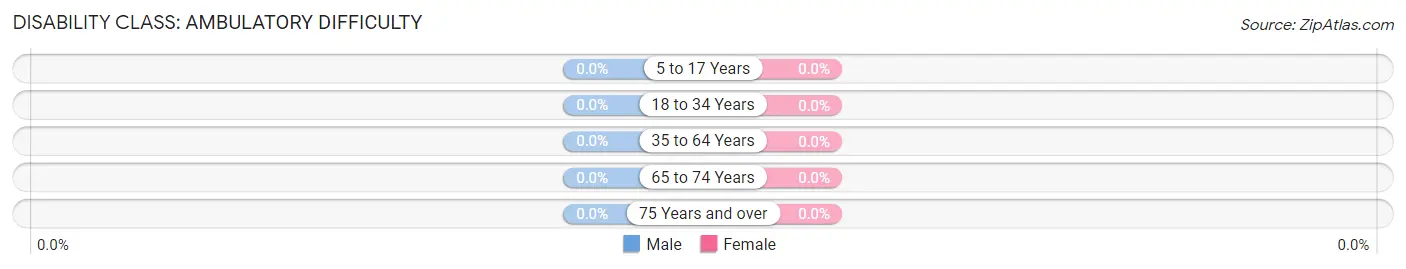
| Age Bracket | Male | Female |
| 5 to 17 Years | 0 (0.0%) | 0 (0.0%) |
| 18 to 34 Years | 0 (0.0%) | 0 (0.0%) |
| 35 to 64 Years | 0 (0.0%) | 0 (0.0%) |
| 65 to 74 Years | 0 (0.0%) | 0 (0.0%) |
| 75 Years and over | 0 (0.0%) | 0 (0.0%) |
Disability Class: Self-Care Difficulty

| Age Bracket | Male | Female |
| 5 to 17 Years | 0 (0.0%) | 0 (0.0%) |
| 18 to 34 Years | 0 (0.0%) | 0 (0.0%) |
| 35 to 64 Years | 0 (0.0%) | 0 (0.0%) |
| 65 to 74 Years | 0 (0.0%) | 0 (0.0%) |
| 75 Years and over | 0 (0.0%) | 0 (0.0%) |
Technology Access in Utopia
Computing Device Access in Utopia
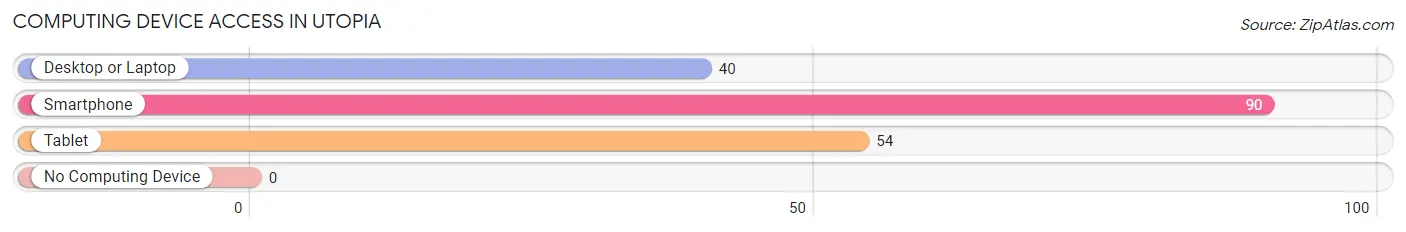
| Device Type | # Households | % Households |
| Desktop or Laptop | 40 | 44.4% |
| Smartphone | 90 | 100.0% |
| Tablet | 54 | 60.0% |
| No Computing Device | 0 | 0.0% |
| Total | 90 | 100.0% |
Internet Access in Utopia
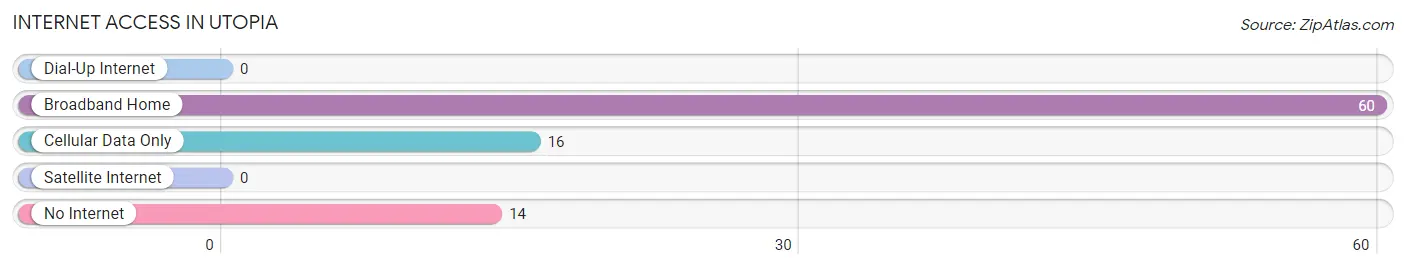
| Internet Type | # Households | % Households |
| Dial-Up Internet | 0 | 0.0% |
| Broadband Home | 60 | 66.7% |
| Cellular Data Only | 16 | 17.8% |
| Satellite Internet | 0 | 0.0% |
| No Internet | 14 | 15.6% |
| Total | 90 | 100.0% |
Utopia Summary
Utopia, Texas is a small town located in the heart of the Texas Hill Country, about an hour and a half northwest of San Antonio. It is situated in Uvalde County, and is home to a population of just over 2,000 people. The town was founded in 1854 by German immigrants, and has since become a popular tourist destination due to its picturesque scenery and unique history.
Geography
Utopia is located in the Edwards Plateau region of Texas, and is surrounded by rolling hills and lush vegetation. The town is situated on the banks of the Sabinal River, and is home to several creeks and springs. The climate in Utopia is generally mild, with temperatures ranging from the mid-50s in the winter to the mid-90s in the summer.
Economy
The economy of Utopia is largely based on tourism, with many visitors coming to the area to enjoy the natural beauty and unique history of the town. The town is also home to several small businesses, including a winery, a brewery, and a number of restaurants. Additionally, Utopia is home to a number of ranches, which provide employment for many of the town’s residents.
Demographics
As of the 2010 census, the population of Utopia was 2,062. The racial makeup of the town was 94.3% White, 0.7% African American, 0.3% Native American, 0.2% Asian, 0.1% Pacific Islander, 2.7% from other races, and 1.9% from two or more races. Hispanic or Latino of any race were 8.2% of the population.
The median income for a household in Utopia was $37,500, and the median income for a family was $45,000. The per capita income for the town was $19,000. About 11.2% of families and 14.2% of the population were below the poverty line, including 18.2% of those under age 18 and 8.3% of those age 65 or over.
Conclusion
Utopia, Texas is a small town with a rich history and a unique culture. It is situated in the heart of the Texas Hill Country, and is home to a population of just over 2,000 people. The town’s economy is largely based on tourism, and it is home to several small businesses, ranches, and restaurants. The population of Utopia is largely white, with a small percentage of African American, Native American, Asian, and Pacific Islander residents. The median income for a household in Utopia is $37,500, and the per capita income is $19,000.
Common Questions
What is Per Capita Income in Utopia?
Per Capita income in Utopia is $42,348.
What is the Median Family Income in Utopia?
Median Family Income in Utopia is $78,750.
What is the Median Household income in Utopia?
Median Household Income in Utopia is $107,619.
What is Income or Wage Gap in Utopia?
Income or Wage Gap in Utopia is 48.7%.
Women in Utopia earn 51.3 cents for every dollar earned by a man.
What is Inequality or Gini Index in Utopia?
Inequality or Gini Index in Utopia is 0.15.
What is the Total Population of Utopia?
Total Population of Utopia is 228.
What is the Total Male Population of Utopia?
Total Male Population of Utopia is 156.
What is the Total Female Population of Utopia?
Total Female Population of Utopia is 72.
What is the Ratio of Males per 100 Females in Utopia?
There are 216.67 Males per 100 Females in Utopia.
What is the Ratio of Females per 100 Males in Utopia?
There are 46.15 Females per 100 Males in Utopia.
What is the Median Population Age in Utopia?
Median Population Age in Utopia is 32.6 Years.
What is the Average Family Size in Utopia
Average Family Size in Utopia is 3.3 People.
What is the Average Household Size in Utopia
Average Household Size in Utopia is 2.5 People.
How Large is the Labor Force in Utopia?
There are 173 People in the Labor Forcein in Utopia.
What is the Percentage of People in the Labor Force in Utopia?
93.0% of People are in the Labor Force in Utopia.