Tulia, TX Map & Demographics
Tulia Map
Tulia Overview
$19,504
PER CAPITA INCOME
$46,000
AVG FAMILY INCOME
$29,408
AVG HOUSEHOLD INCOME
58.9%
WAGE / INCOME GAP [ % ]
41.1¢/ $1
WAGE / INCOME GAP [ $ ]
$10,850
FAMILY INCOME DEFICIT
0.50
INEQUALITY / GINI INDEX
4,430
TOTAL POPULATION
2,426
MALE POPULATION
2,004
FEMALE POPULATION
121.06
MALES / 100 FEMALES
82.61
FEMALES / 100 MALES
34.5
MEDIAN AGE
3.8
AVG FAMILY SIZE
2.7
AVG HOUSEHOLD SIZE
1,825
LABOR FORCE [ PEOPLE ]
52.1%
PERCENT IN LABOR FORCE
6.7%
UNEMPLOYMENT RATE
Tulia Zip Codes
Tulia Area Codes
Income in Tulia
Income Overview in Tulia
Per Capita Income in Tulia is $19,504, while median incomes of families and households are $46,000 and $29,408 respectively.
| Characteristic | Number | Measure |
| Per Capita Income | 4,430 | $19,504 |
| Median Family Income | 784 | $46,000 |
| Mean Family Income | 784 | $66,460 |
| Median Household Income | 1,495 | $29,408 |
| Mean Household Income | 1,495 | $50,367 |
| Income Deficit | 784 | $10,850 |
| Wage / Income Gap (%) | 4,430 | 58.92% |
| Wage / Income Gap ($) | 4,430 | 41.08¢ per $1 |
| Gini / Inequality Index | 4,430 | 0.50 |
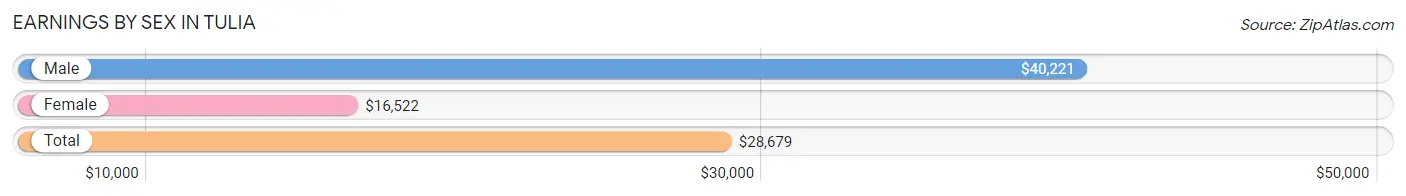
Earnings by Sex in Tulia
Average Earnings in Tulia are $28,679, $40,221 for men and $16,522 for women, a difference of 58.9%.
| Sex | Number | Average Earnings |
| Male | 953 (49.7%) | $40,221 |
| Female | 966 (50.3%) | $16,522 |
| Total | 1,919 (100.0%) | $28,679 |
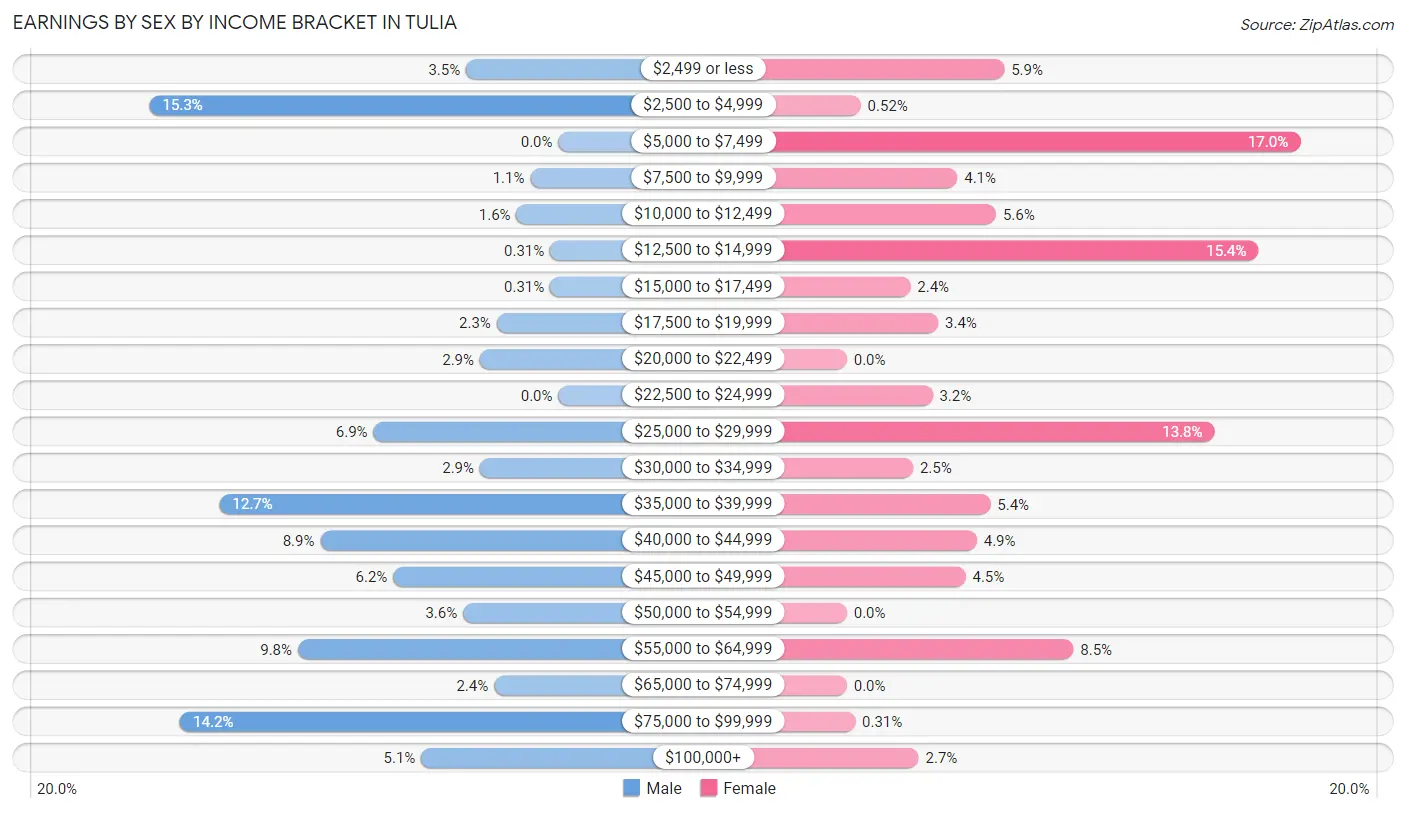
Earnings by Sex by Income Bracket in Tulia
The most common earnings brackets in Tulia are $2,500 to $4,999 for men (146 | 15.3%) and $5,000 to $7,499 for women (164 | 17.0%).
| Income | Male | Female |
| $2,499 or less | 33 (3.5%) | 57 (5.9%) |
| $2,500 to $4,999 | 146 (15.3%) | 5 (0.5%) |
| $5,000 to $7,499 | 0 (0.0%) | 164 (17.0%) |
| $7,500 to $9,999 | 10 (1.1%) | 40 (4.1%) |
| $10,000 to $12,499 | 15 (1.6%) | 54 (5.6%) |
| $12,500 to $14,999 | 3 (0.3%) | 149 (15.4%) |
| $15,000 to $17,499 | 3 (0.3%) | 23 (2.4%) |
| $17,500 to $19,999 | 22 (2.3%) | 33 (3.4%) |
| $20,000 to $22,499 | 28 (2.9%) | 0 (0.0%) |
| $22,500 to $24,999 | 0 (0.0%) | 31 (3.2%) |
| $25,000 to $29,999 | 66 (6.9%) | 133 (13.8%) |
| $30,000 to $34,999 | 28 (2.9%) | 24 (2.5%) |
| $35,000 to $39,999 | 121 (12.7%) | 52 (5.4%) |
| $40,000 to $44,999 | 85 (8.9%) | 47 (4.9%) |
| $45,000 to $49,999 | 59 (6.2%) | 43 (4.4%) |
| $50,000 to $54,999 | 34 (3.6%) | 0 (0.0%) |
| $55,000 to $64,999 | 93 (9.8%) | 82 (8.5%) |
| $65,000 to $74,999 | 23 (2.4%) | 0 (0.0%) |
| $75,000 to $99,999 | 135 (14.2%) | 3 (0.3%) |
| $100,000+ | 49 (5.1%) | 26 (2.7%) |
| Total | 953 (100.0%) | 966 (100.0%) |
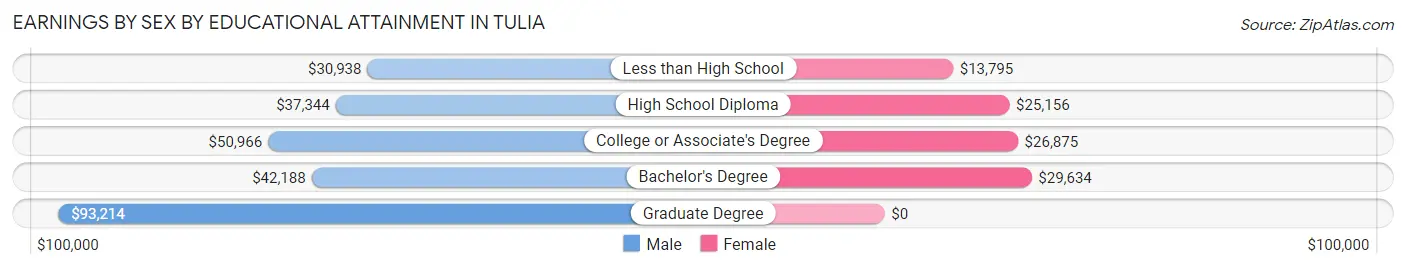
Earnings by Sex by Educational Attainment in Tulia
Average earnings in Tulia are $38,812 for men and $25,598 for women, a difference of 34.1%. Men with an educational attainment of graduate degree enjoy the highest average annual earnings of $93,214, while those with less than high school education earn the least with $30,938. Women with an educational attainment of bachelor's degree earn the most with the average annual earnings of $29,634, while those with less than high school education have the smallest earnings of $13,795.
| Educational Attainment | Male Income | Female Income |
| Less than High School | $30,938 | $13,795 |
| High School Diploma | $37,344 | $25,156 |
| College or Associate's Degree | $50,966 | $26,875 |
| Bachelor's Degree | $42,188 | $29,634 |
| Graduate Degree | $93,214 | $0 |
| Total | $38,812 | $25,598 |
Family Income in Tulia
Family Income Brackets in Tulia
According to the Tulia family income data, there are 183 families falling into the $25,000 to $34,999 income range, which is the most common income bracket and makes up 23.3% of all families. Conversely, the $150,000 to $199,999 income bracket is the least frequent group with only 7 families (0.9%) belonging to this category.
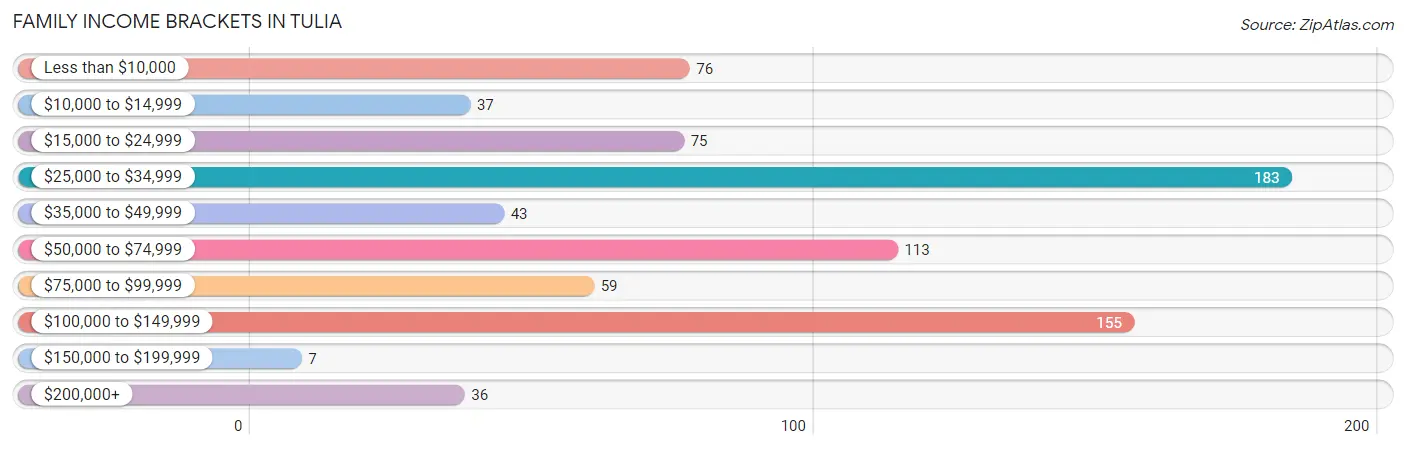
| Income Bracket | # Families | % Families |
| Less than $10,000 | 76 | 9.7% |
| $10,000 to $14,999 | 37 | 4.7% |
| $15,000 to $24,999 | 75 | 9.6% |
| $25,000 to $34,999 | 183 | 23.3% |
| $35,000 to $49,999 | 43 | 5.5% |
| $50,000 to $74,999 | 113 | 14.4% |
| $75,000 to $99,999 | 59 | 7.5% |
| $100,000 to $149,999 | 155 | 19.8% |
| $150,000 to $199,999 | 7 | 0.9% |
| $200,000+ | 36 | 4.6% |
Family Income by Famaliy Size in Tulia
5-person families (47 | 6.0%) account for the highest median family income in Tulia with $117,688 per family, while 2-person families (294 | 37.5%) have the highest median income of $26,042 per family member.
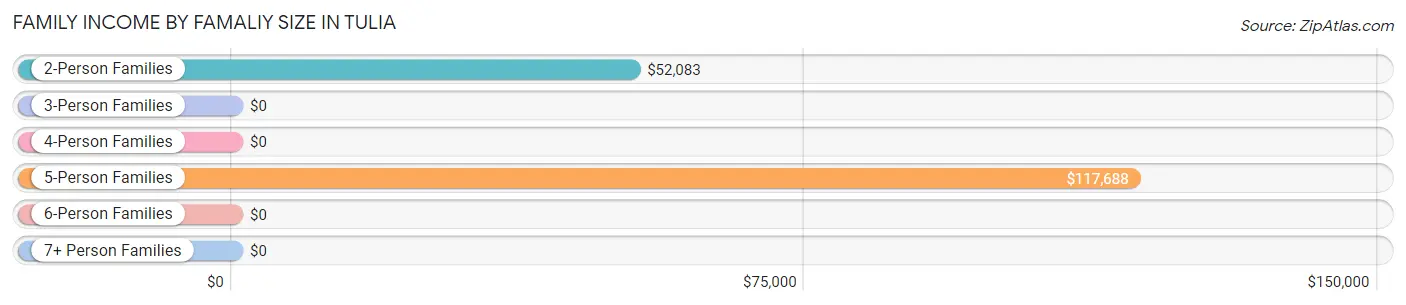
| Income Bracket | # Families | Median Income |
| 2-Person Families | 294 (37.5%) | $52,083 |
| 3-Person Families | 182 (23.2%) | $0 |
| 4-Person Families | 204 (26.0%) | $0 |
| 5-Person Families | 47 (6.0%) | $117,688 |
| 6-Person Families | 57 (7.3%) | $0 |
| 7+ Person Families | 0 (0.0%) | $0 |
| Total | 784 (100.0%) | $46,000 |
Family Income by Number of Earners in Tulia
The median family income in Tulia is $46,000, with families comprising 3+ earners (20) having the highest median family income of $250,001, while families with no earners (175) have the lowest median family income of $11,422, accounting for 2.5% and 22.3% of families, respectively.
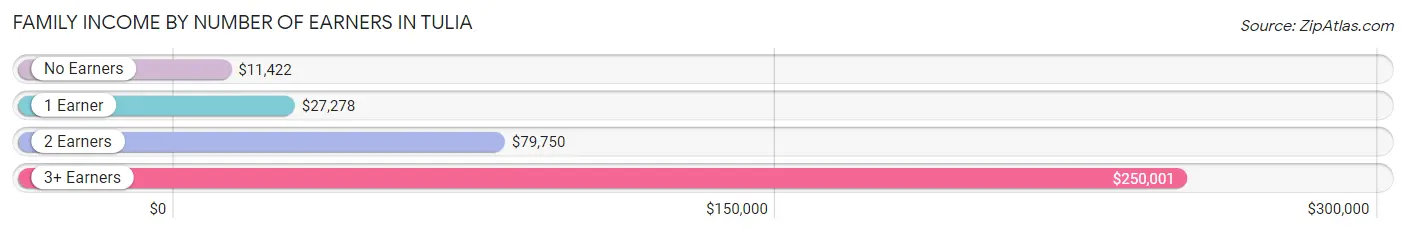
| Number of Earners | # Families | Median Income |
| No Earners | 175 (22.3%) | $11,422 |
| 1 Earner | 177 (22.6%) | $27,278 |
| 2 Earners | 412 (52.5%) | $79,750 |
| 3+ Earners | 20 (2.5%) | $250,001 |
| Total | 784 (100.0%) | $46,000 |
Household Income in Tulia
Household Income Brackets in Tulia
With 253 households falling in the category, the $25,000 to $34,999 income range is the most frequent in Tulia, accounting for 16.9% of all households. In contrast, only 7 households (0.5%) fall into the $150,000 to $199,999 income bracket, making it the least populous group.
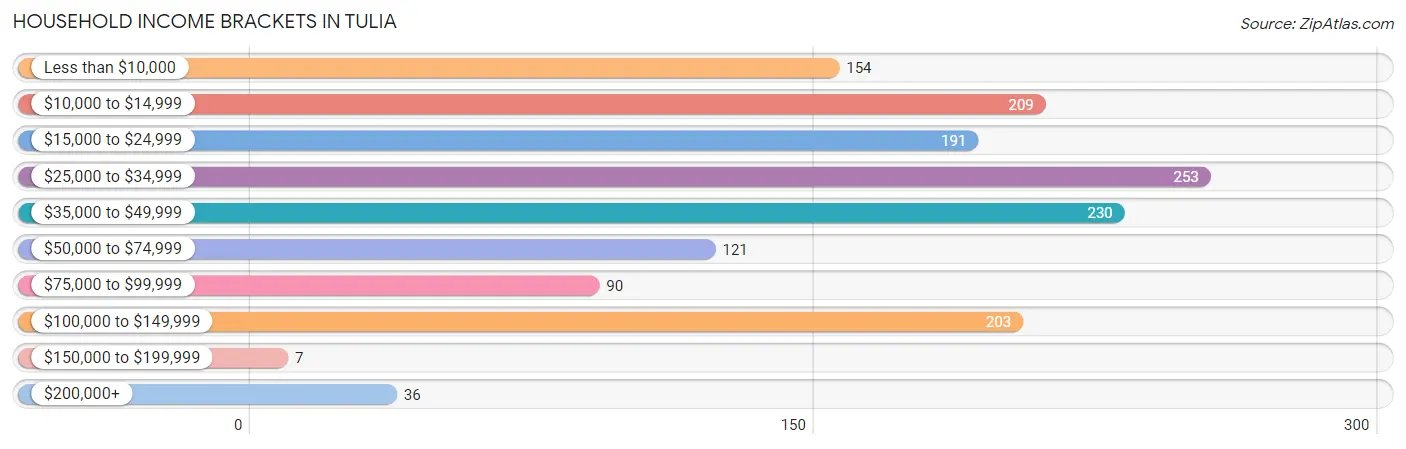
| Income Bracket | # Households | % Households |
| Less than $10,000 | 154 | 10.3% |
| $10,000 to $14,999 | 209 | 14.0% |
| $15,000 to $24,999 | 191 | 12.8% |
| $25,000 to $34,999 | 253 | 16.9% |
| $35,000 to $49,999 | 230 | 15.4% |
| $50,000 to $74,999 | 121 | 8.1% |
| $75,000 to $99,999 | 90 | 6.0% |
| $100,000 to $149,999 | 203 | 13.6% |
| $150,000 to $199,999 | 7 | 0.5% |
| $200,000+ | 36 | 2.4% |
Household Income by Householder Age in Tulia
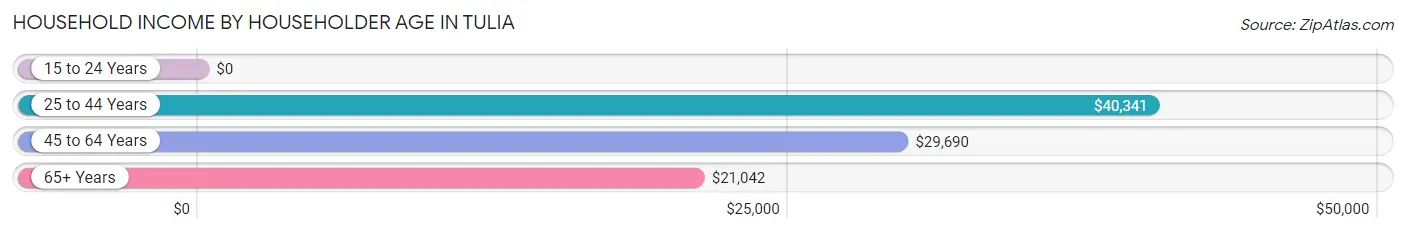
The median household income in Tulia is $29,408, with the highest median household income of $40,341 found in the 25 to 44 years age bracket for the primary householder. A total of 307 households (20.5%) fall into this category. Meanwhile, the 15 to 24 years age bracket for the primary householder has the lowest median household income of $0, with 159 households (10.6%) in this group.
| Income Bracket | # Households | Median Income |
| 15 to 24 Years | 159 (10.6%) | $0 |
| 25 to 44 Years | 307 (20.5%) | $40,341 |
| 45 to 64 Years | 473 (31.6%) | $29,690 |
| 65+ Years | 556 (37.2%) | $21,042 |
| Total | 1,495 (100.0%) | $29,408 |
Poverty in Tulia
Income Below Poverty by Sex and Age in Tulia
With 33.7% poverty level for males and 38.3% for females among the residents of Tulia, 16 and 17 year old males and under 5 year old females are the most vulnerable to poverty, with 42 males (82.4%) and 81 females (75.0%) in their respective age groups living below the poverty level.
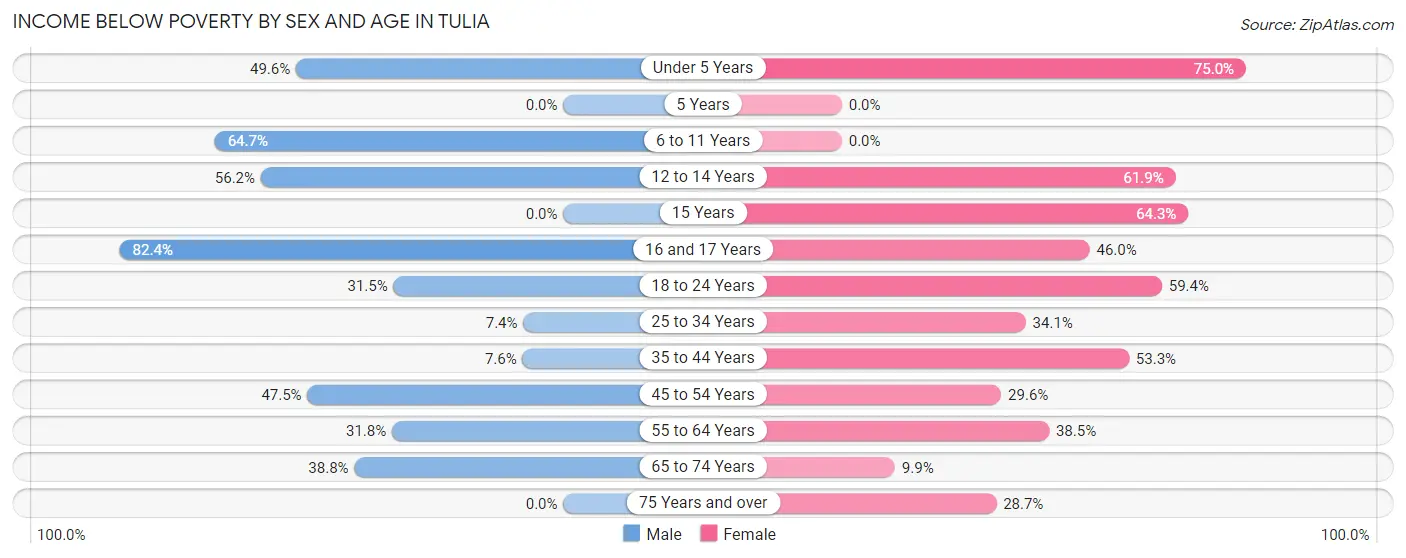
| Age Bracket | Male | Female |
| Under 5 Years | 65 (49.6%) | 81 (75.0%) |
| 5 Years | 0 (0.0%) | 0 (0.0%) |
| 6 to 11 Years | 121 (64.7%) | 0 (0.0%) |
| 12 to 14 Years | 73 (56.1%) | 96 (61.9%) |
| 15 Years | 0 (0.0%) | 18 (64.3%) |
| 16 and 17 Years | 42 (82.4%) | 40 (46.0%) |
| 18 to 24 Years | 87 (31.5%) | 139 (59.4%) |
| 25 to 34 Years | 19 (7.4%) | 86 (34.1%) |
| 35 to 44 Years | 14 (7.6%) | 89 (53.3%) |
| 45 to 54 Years | 95 (47.5%) | 63 (29.6%) |
| 55 to 64 Years | 76 (31.8%) | 80 (38.5%) |
| 65 to 74 Years | 95 (38.8%) | 21 (9.9%) |
| 75 Years and over | 0 (0.0%) | 47 (28.7%) |
| Total | 687 (33.7%) | 760 (38.3%) |
Income Above Poverty by Sex and Age in Tulia
According to the poverty statistics in Tulia, males aged 5 years and females aged 6 to 11 years are the age groups that are most secure financially, with 100.0% of males and 100.0% of females in these age groups living above the poverty line.
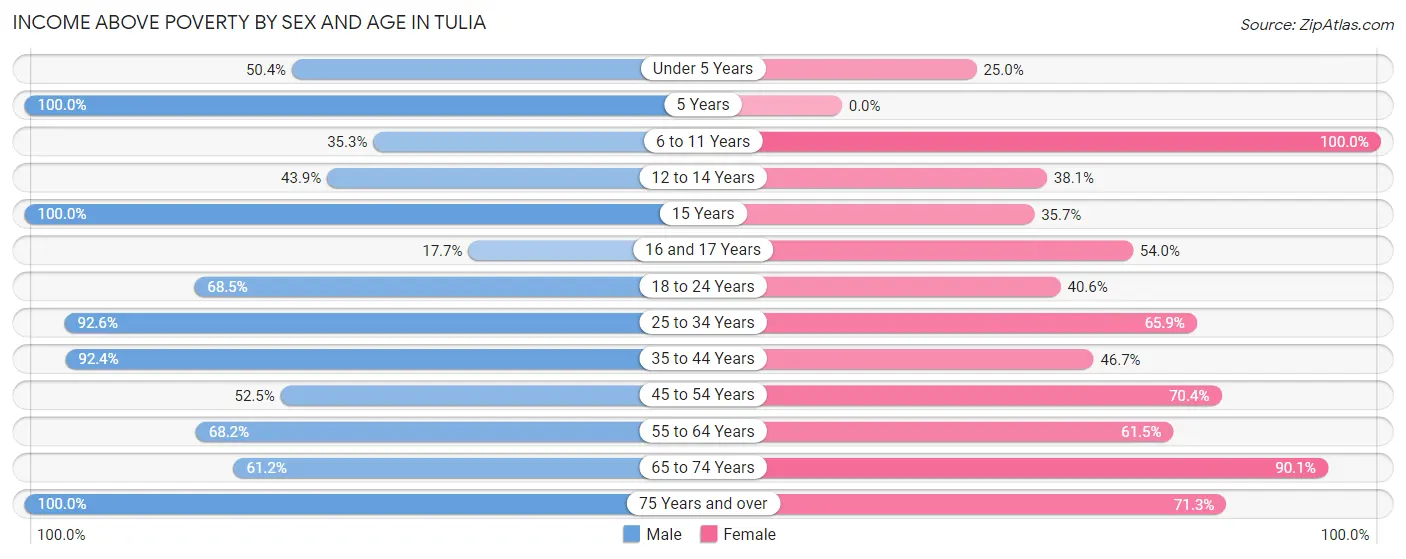
| Age Bracket | Male | Female |
| Under 5 Years | 66 (50.4%) | 27 (25.0%) |
| 5 Years | 28 (100.0%) | 0 (0.0%) |
| 6 to 11 Years | 66 (35.3%) | 154 (100.0%) |
| 12 to 14 Years | 57 (43.9%) | 59 (38.1%) |
| 15 Years | 7 (100.0%) | 10 (35.7%) |
| 16 and 17 Years | 9 (17.6%) | 47 (54.0%) |
| 18 to 24 Years | 189 (68.5%) | 95 (40.6%) |
| 25 to 34 Years | 237 (92.6%) | 166 (65.9%) |
| 35 to 44 Years | 171 (92.4%) | 78 (46.7%) |
| 45 to 54 Years | 105 (52.5%) | 150 (70.4%) |
| 55 to 64 Years | 163 (68.2%) | 128 (61.5%) |
| 65 to 74 Years | 150 (61.2%) | 192 (90.1%) |
| 75 Years and over | 105 (100.0%) | 117 (71.3%) |
| Total | 1,353 (66.3%) | 1,223 (61.7%) |
Income Below Poverty Among Married-Couple Families in Tulia
The poverty statistics for married-couple families in Tulia show that 20.6% or 121 of the total 588 families live below the poverty line. Families with 3 or 4 children have the highest poverty rate of 57.6%, comprising of 57 families. On the other hand, families with no children have the lowest poverty rate of 3.5%, which includes 9 families.
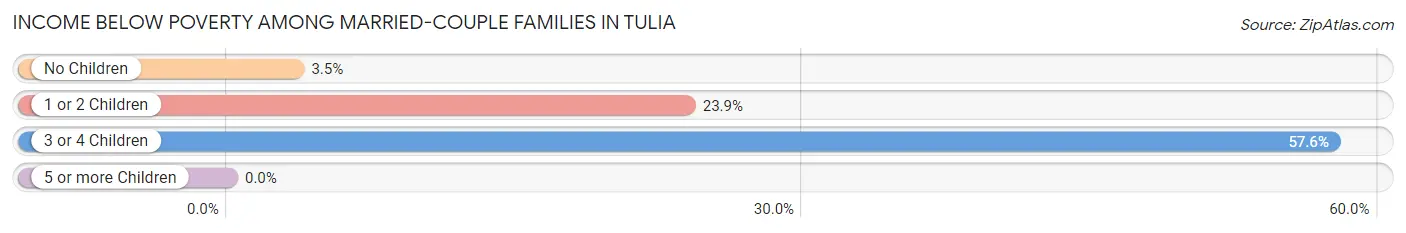
| Children | Above Poverty | Below Poverty |
| No Children | 250 (96.5%) | 9 (3.5%) |
| 1 or 2 Children | 175 (76.1%) | 55 (23.9%) |
| 3 or 4 Children | 42 (42.4%) | 57 (57.6%) |
| 5 or more Children | 0 (0.0%) | 0 (0.0%) |
| Total | 467 (79.4%) | 121 (20.6%) |
Income Below Poverty Among Single-Parent Households in Tulia
According to the poverty data in Tulia, 61.8% or 47 single-father households and 67.5% or 81 single-mother households are living below the poverty line. Among single-father households, those with 3 or 4 children have the highest poverty rate, with 29 households (100.0%) experiencing poverty. Likewise, among single-mother households, those with 1 or 2 children have the highest poverty rate, with 81 households (91.0%) falling below the poverty line.
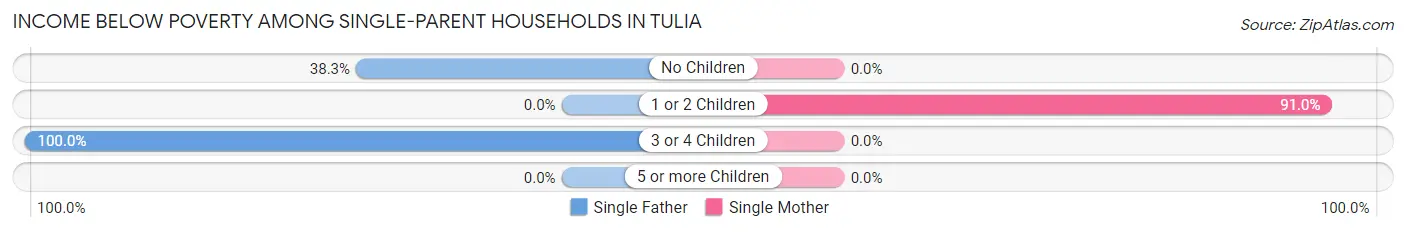
| Children | Single Father | Single Mother |
| No Children | 18 (38.3%) | 0 (0.0%) |
| 1 or 2 Children | 0 (0.0%) | 81 (91.0%) |
| 3 or 4 Children | 29 (100.0%) | 0 (0.0%) |
| 5 or more Children | 0 (0.0%) | 0 (0.0%) |
| Total | 47 (61.8%) | 81 (67.5%) |
Income Below Poverty Among Married-Couple vs Single-Parent Households in Tulia
The poverty data for Tulia shows that 121 of the married-couple family households (20.6%) and 128 of the single-parent households (65.3%) are living below the poverty level. Within the married-couple family households, those with 3 or 4 children have the highest poverty rate, with 57 households (57.6%) falling below the poverty line. Among the single-parent households, those with 3 or 4 children have the highest poverty rate, with 29 household (100.0%) living below poverty.
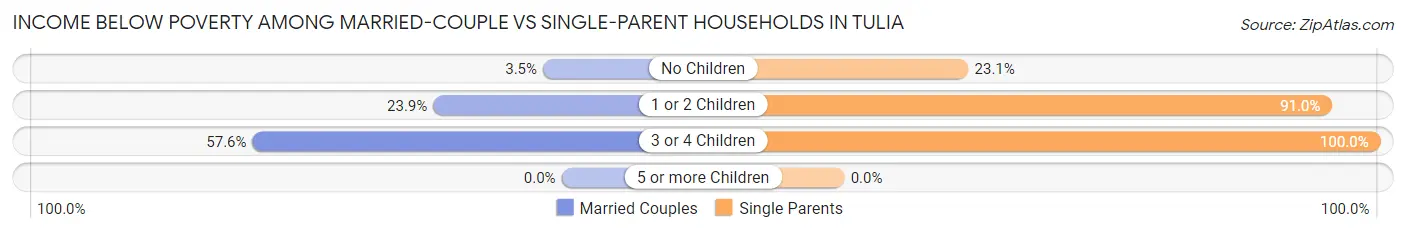
| Children | Married-Couple Families | Single-Parent Households |
| No Children | 9 (3.5%) | 18 (23.1%) |
| 1 or 2 Children | 55 (23.9%) | 81 (91.0%) |
| 3 or 4 Children | 57 (57.6%) | 29 (100.0%) |
| 5 or more Children | 0 (0.0%) | 0 (0.0%) |
| Total | 121 (20.6%) | 128 (65.3%) |
Race in Tulia
The most populous races in Tulia are White / Caucasian (3,009 | 67.9%), Hispanic or Latino (2,387 | 53.9%), and Two or more Races (666 | 15.0%).
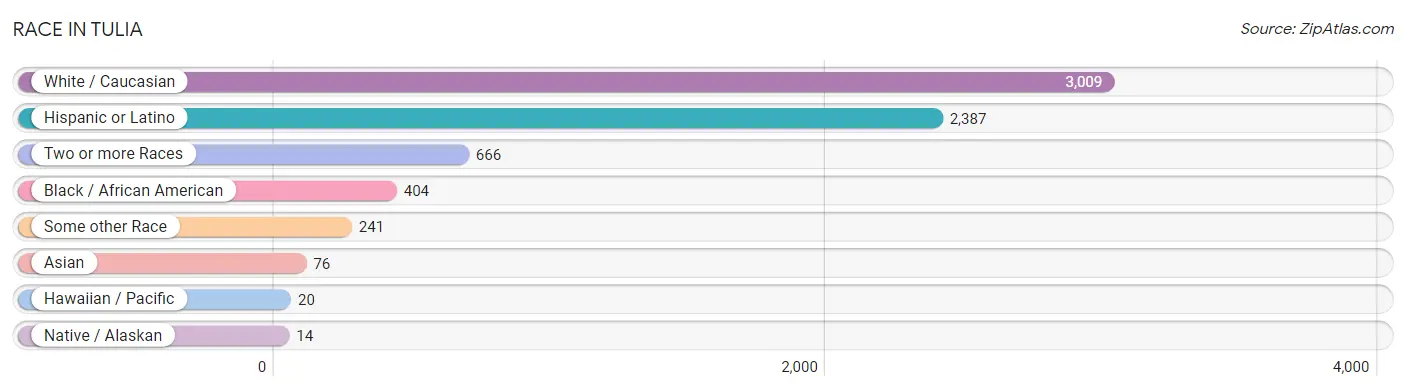
| Race | # Population | % Population |
| Asian | 76 | 1.7% |
| Black / African American | 404 | 9.1% |
| Hawaiian / Pacific | 20 | 0.4% |
| Hispanic or Latino | 2,387 | 53.9% |
| Native / Alaskan | 14 | 0.3% |
| White / Caucasian | 3,009 | 67.9% |
| Two or more Races | 666 | 15.0% |
| Some other Race | 241 | 5.4% |
| Total | 4,430 | 100.0% |
Ancestry in Tulia
The most populous ancestries reported in Tulia are Mexican (2,155 | 48.6%), German (238 | 5.4%), American (194 | 4.4%), African (140 | 3.2%), and Irish (140 | 3.2%), together accounting for 64.7% of all Tulia residents.
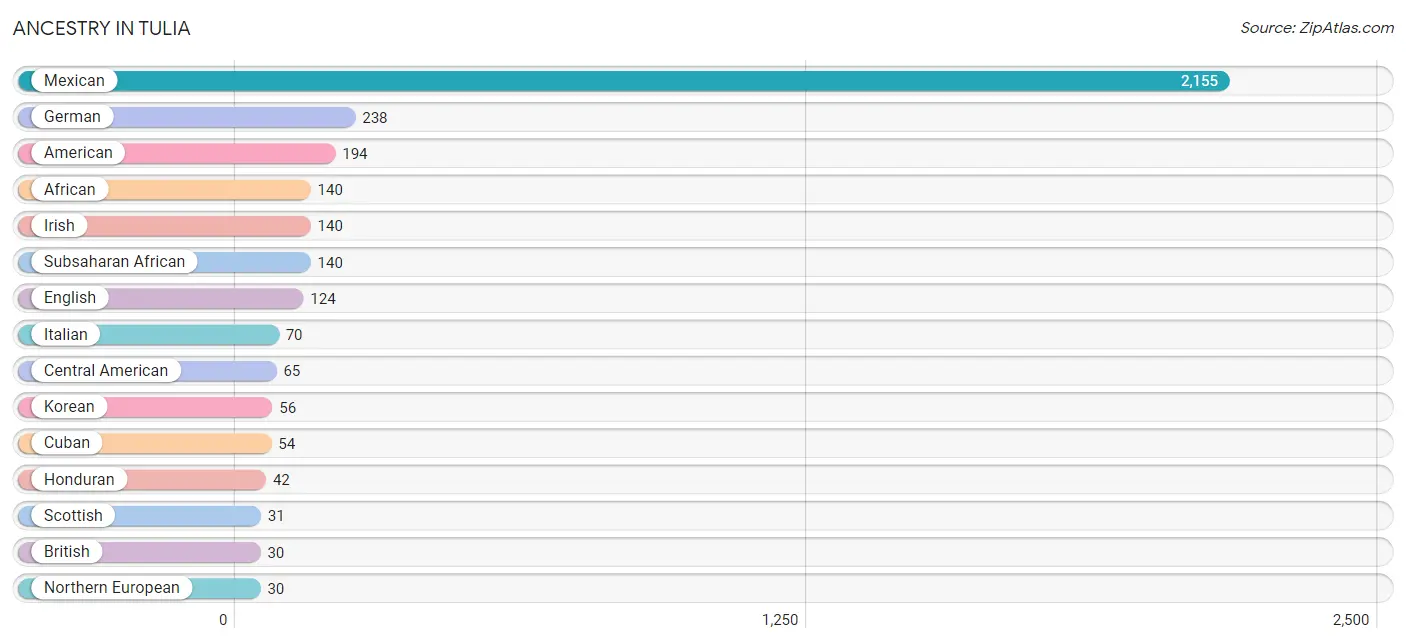
| Ancestry | # Population | % Population |
| African | 140 | 3.2% |
| American | 194 | 4.4% |
| Arab | 8 | 0.2% |
| Blackfeet | 7 | 0.2% |
| British | 30 | 0.7% |
| Central American | 65 | 1.5% |
| Cherokee | 15 | 0.3% |
| Cuban | 54 | 1.2% |
| Danish | 12 | 0.3% |
| Delaware | 11 | 0.3% |
| Dutch | 5 | 0.1% |
| English | 124 | 2.8% |
| French | 7 | 0.2% |
| German | 238 | 5.4% |
| Guamanian / Chamorro | 20 | 0.4% |
| Guatemalan | 20 | 0.4% |
| Honduran | 42 | 0.9% |
| Indian (Asian) | 2 | 0.1% |
| Irish | 140 | 3.2% |
| Italian | 70 | 1.6% |
| Korean | 56 | 1.3% |
| Lebanese | 8 | 0.2% |
| Mexican | 2,155 | 48.6% |
| Navajo | 3 | 0.1% |
| Northern European | 30 | 0.7% |
| Norwegian | 26 | 0.6% |
| Polish | 12 | 0.3% |
| Portuguese | 2 | 0.1% |
| Salvadoran | 3 | 0.1% |
| Scotch-Irish | 7 | 0.2% |
| Scottish | 31 | 0.7% |
| Spaniard | 7 | 0.2% |
| Spanish | 5 | 0.1% |
| Subsaharan African | 140 | 3.2% |
| Sudanese | 4 | 0.1% |
| Thai | 17 | 0.4% |
| Welsh | 13 | 0.3% | View All 37 Rows |
Immigrants in Tulia
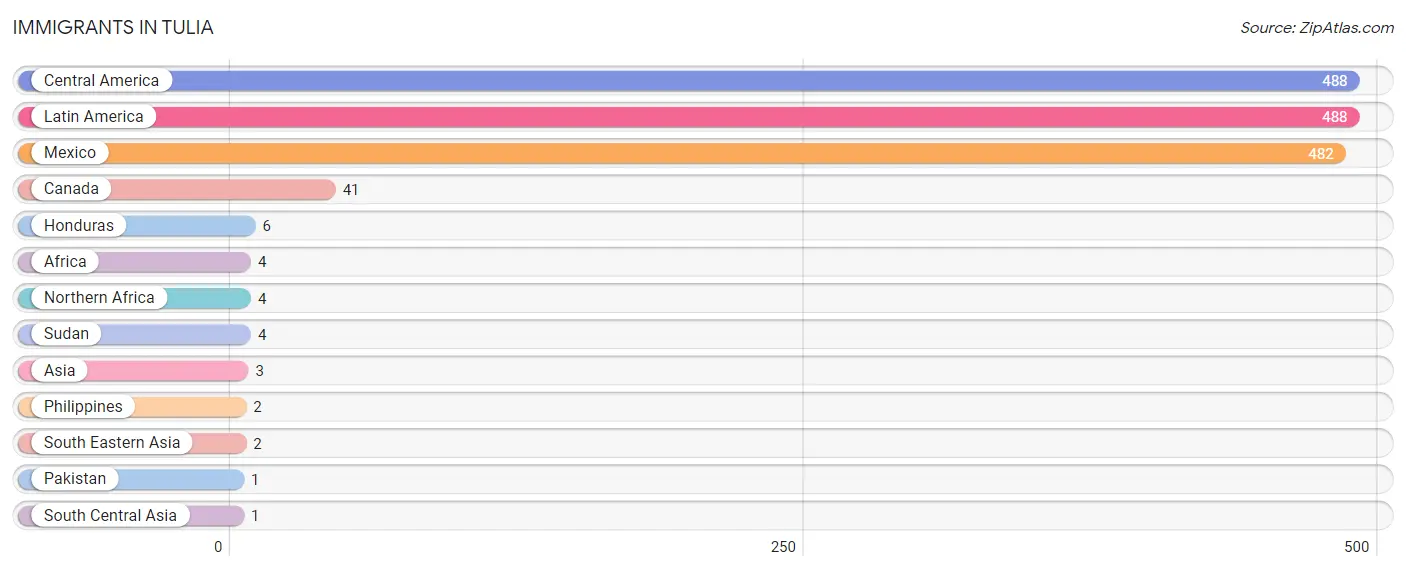
The most numerous immigrant groups reported in Tulia came from Central America (488 | 11.0%), Latin America (488 | 11.0%), Mexico (482 | 10.9%), Canada (41 | 0.9%), and Honduras (6 | 0.1%), together accounting for 34.0% of all Tulia residents.
| Immigration Origin | # Population | % Population |
| Africa | 4 | 0.1% |
| Asia | 3 | 0.1% |
| Canada | 41 | 0.9% |
| Central America | 488 | 11.0% |
| Honduras | 6 | 0.1% |
| Latin America | 488 | 11.0% |
| Mexico | 482 | 10.9% |
| Northern Africa | 4 | 0.1% |
| Pakistan | 1 | 0.0% |
| Philippines | 2 | 0.1% |
| South Central Asia | 1 | 0.0% |
| South Eastern Asia | 2 | 0.1% |
| Sudan | 4 | 0.1% | View All 13 Rows |
Sex and Age in Tulia
Sex and Age in Tulia
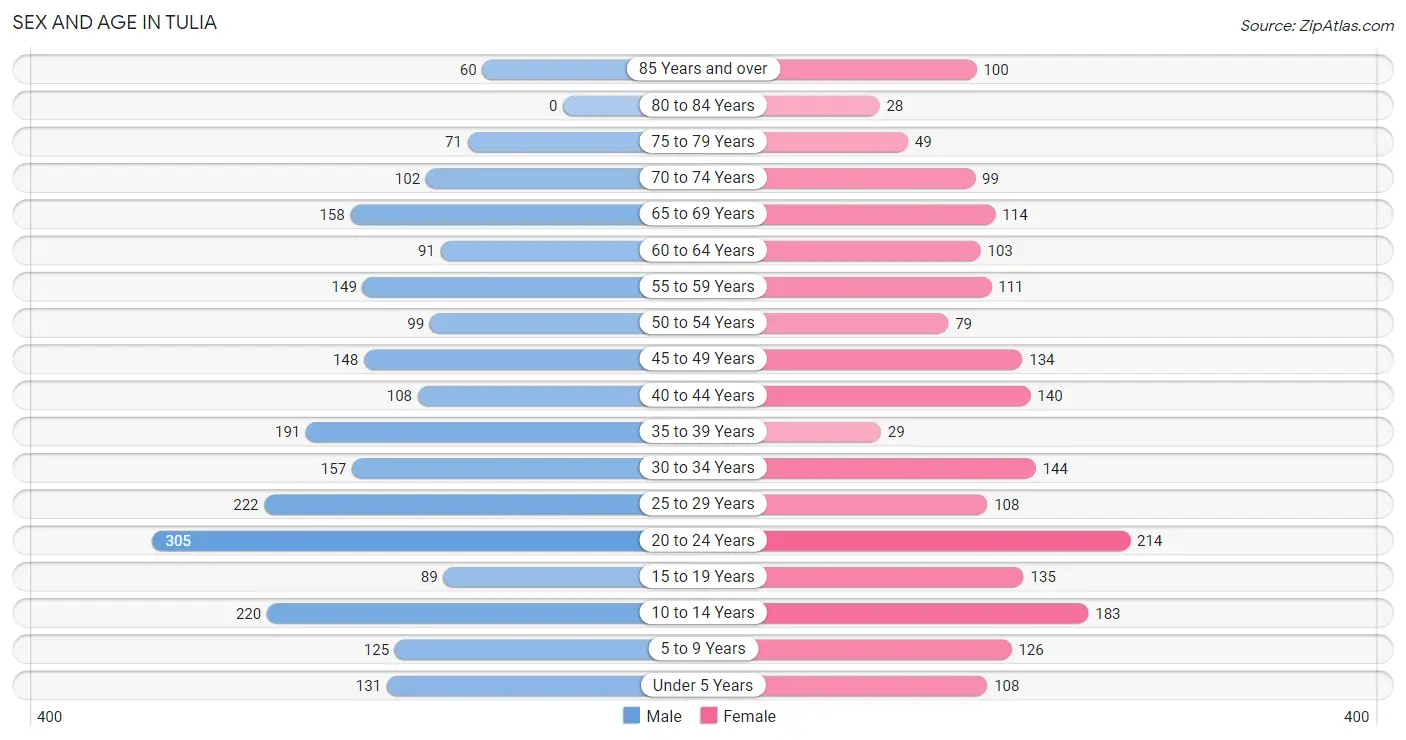
The most populous age groups in Tulia are 20 to 24 Years (305 | 12.6%) for men and 20 to 24 Years (214 | 10.7%) for women.
| Age Bracket | Male | Female |
| Under 5 Years | 131 (5.4%) | 108 (5.4%) |
| 5 to 9 Years | 125 (5.1%) | 126 (6.3%) |
| 10 to 14 Years | 220 (9.1%) | 183 (9.1%) |
| 15 to 19 Years | 89 (3.7%) | 135 (6.7%) |
| 20 to 24 Years | 305 (12.6%) | 214 (10.7%) |
| 25 to 29 Years | 222 (9.1%) | 108 (5.4%) |
| 30 to 34 Years | 157 (6.5%) | 144 (7.2%) |
| 35 to 39 Years | 191 (7.9%) | 29 (1.5%) |
| 40 to 44 Years | 108 (4.4%) | 140 (7.0%) |
| 45 to 49 Years | 148 (6.1%) | 134 (6.7%) |
| 50 to 54 Years | 99 (4.1%) | 79 (3.9%) |
| 55 to 59 Years | 149 (6.1%) | 111 (5.5%) |
| 60 to 64 Years | 91 (3.7%) | 103 (5.1%) |
| 65 to 69 Years | 158 (6.5%) | 114 (5.7%) |
| 70 to 74 Years | 102 (4.2%) | 99 (4.9%) |
| 75 to 79 Years | 71 (2.9%) | 49 (2.5%) |
| 80 to 84 Years | 0 (0.0%) | 28 (1.4%) |
| 85 Years and over | 60 (2.5%) | 100 (5.0%) |
| Total | 2,426 (100.0%) | 2,004 (100.0%) |
Families and Households in Tulia
Median Family Size in Tulia
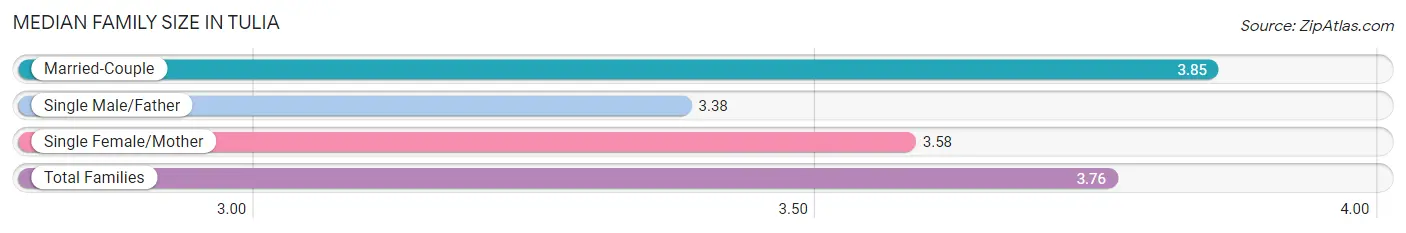
The median family size in Tulia is 3.76 persons per family, with married-couple families (588 | 75.0%) accounting for the largest median family size of 3.85 persons per family. On the other hand, single male/father families (76 | 9.7%) represent the smallest median family size with 3.38 persons per family.
| Family Type | # Families | Family Size |
| Married-Couple | 588 (75.0%) | 3.85 |
| Single Male/Father | 76 (9.7%) | 3.38 |
| Single Female/Mother | 120 (15.3%) | 3.58 |
| Total Families | 784 (100.0%) | 3.76 |
Median Household Size in Tulia
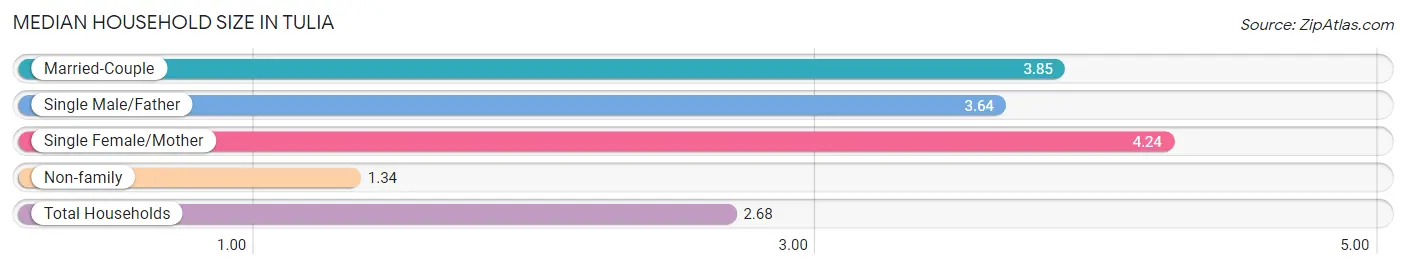
The median household size in Tulia is 2.68 persons per household, with single female/mother households (120 | 8.0%) accounting for the largest median household size of 4.24 persons per household. non-family households (711 | 47.6%) represent the smallest median household size with 1.34 persons per household.
| Household Type | # Households | Household Size |
| Married-Couple | 588 (39.3%) | 3.85 |
| Single Male/Father | 76 (5.1%) | 3.64 |
| Single Female/Mother | 120 (8.0%) | 4.24 |
| Non-family | 711 (47.6%) | 1.34 |
| Total Households | 1,495 (100.0%) | 2.68 |
Household Size by Marriage Status in Tulia
Out of a total of 1,495 households in Tulia, 784 (52.4%) are family households, while 711 (47.6%) are nonfamily households. The most numerous type of family households are 2-person households, comprising 294, and the most common type of nonfamily households are 1-person households, comprising 602.
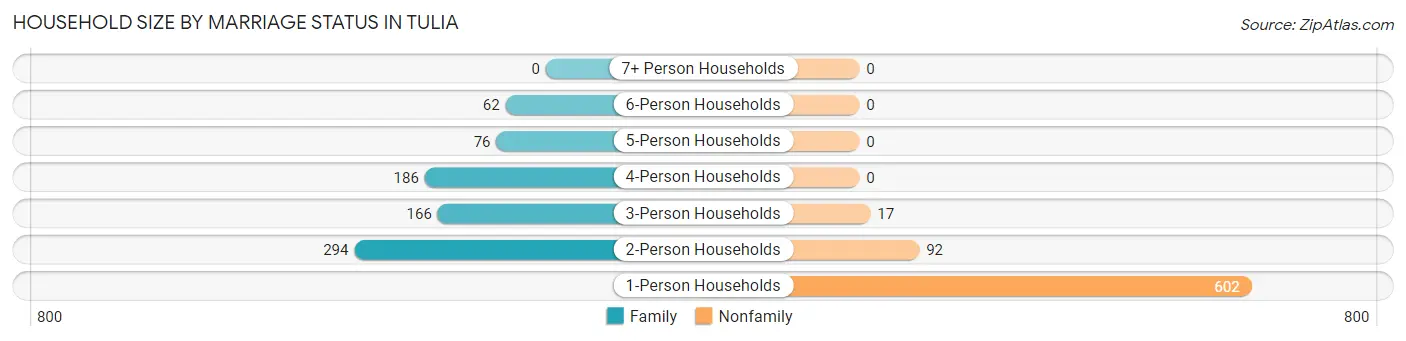
| Household Size | Family Households | Nonfamily Households |
| 1-Person Households | - | 602 (40.3%) |
| 2-Person Households | 294 (19.7%) | 92 (6.1%) |
| 3-Person Households | 166 (11.1%) | 17 (1.1%) |
| 4-Person Households | 186 (12.4%) | 0 (0.0%) |
| 5-Person Households | 76 (5.1%) | 0 (0.0%) |
| 6-Person Households | 62 (4.2%) | 0 (0.0%) |
| 7+ Person Households | 0 (0.0%) | 0 (0.0%) |
| Total | 784 (52.4%) | 711 (47.6%) |
Female Fertility in Tulia
Fertility by Age in Tulia
| Age Bracket | Women with Births | Births / 1,000 Women |
| 15 to 19 years | 0 (0.0%) | 0.0 |
| 20 to 34 years | 0 (0.0%) | 0.0 |
| 35 to 50 years | 0 (0.0%) | 0.0 |
| Total | 0 (0.0%) | 0.0 |
Fertility by Age by Marriage Status in Tulia
| Age Bracket | Married | Unmarried |
| 15 to 19 years | 0 (0.0%) | 0 (0.0%) |
| 20 to 34 years | 0 (0.0%) | 0 (0.0%) |
| 35 to 50 years | 0 (0.0%) | 0 (0.0%) |
| Total | 0 (0.0%) | 0 (0.0%) |
Fertility by Education in Tulia
| Educational Attainment | Women with Births | Births / 1,000 Women |
| Less than High School | 0 (0.0%) | 0.0 |
| High School Diploma | 0 (0.0%) | 0.0 |
| College or Associate's Degree | 0 (0.0%) | 0.0 |
| Bachelor's Degree | 0 (0.0%) | 0.0 |
| Graduate Degree | 0 (0.0%) | 0.0 |
| Total | 0 (0.0%) | 0.0 |
Fertility by Education by Marriage Status in Tulia
| Educational Attainment | Married | Unmarried |
| Less than High School | 0 (0.0%) | 0 (0.0%) |
| High School Diploma | 0 (0.0%) | 0 (0.0%) |
| College or Associate's Degree | 0 (0.0%) | 0 (0.0%) |
| Bachelor's Degree | 0 (0.0%) | 0 (0.0%) |
| Graduate Degree | 0 (0.0%) | 0 (0.0%) |
| Total | 0 (0.0%) | 0 (0.0%) |
Employment Characteristics in Tulia
Employment by Class of Employer in Tulia
Among the 1,675 employed individuals in Tulia, private company employees (892 | 53.2%), local government employees (325 | 19.4%), and state government employees (152 | 9.1%) make up the most common classes of employment.
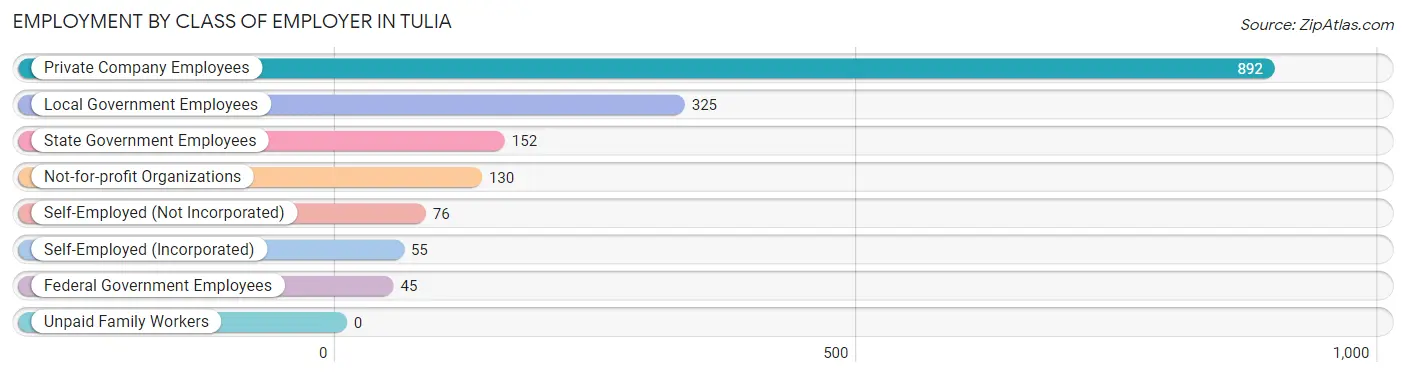
| Employer Class | # Employees | % Employees |
| Private Company Employees | 892 | 53.2% |
| Self-Employed (Incorporated) | 55 | 3.3% |
| Self-Employed (Not Incorporated) | 76 | 4.5% |
| Not-for-profit Organizations | 130 | 7.8% |
| Local Government Employees | 325 | 19.4% |
| State Government Employees | 152 | 9.1% |
| Federal Government Employees | 45 | 2.7% |
| Unpaid Family Workers | 0 | 0.0% |
| Total | 1,675 | 100.0% |
Employment Status by Age in Tulia
According to the labor force statistics for Tulia, out of the total population over 16 years of age (3,502), 52.1% or 1,825 individuals are in the labor force, with 6.7% or 122 of them unemployed. The age group with the highest labor force participation rate is 20 to 24 years, with 85.0% or 441 individuals in the labor force. Within the labor force, the 16 to 19 years age range has the highest percentage of unemployed individuals, with 35.6% or 16 of them being unemployed.
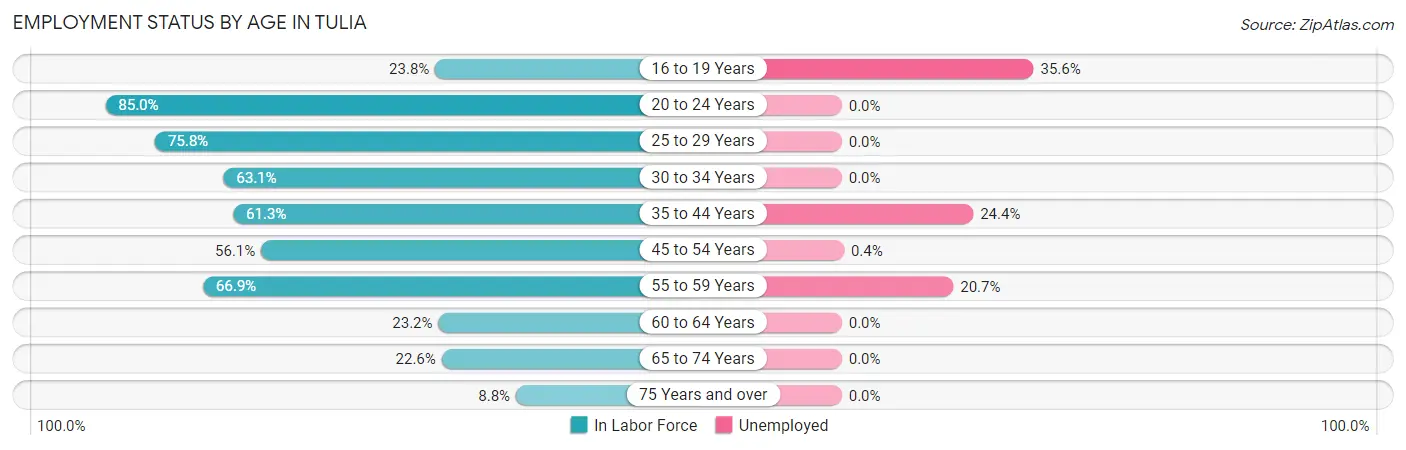
| Age Bracket | In Labor Force | Unemployed |
| 16 to 19 Years | 45 (23.8%) | 16 (35.6%) |
| 20 to 24 Years | 441 (85.0%) | 0 (0.0%) |
| 25 to 29 Years | 250 (75.8%) | 0 (0.0%) |
| 30 to 34 Years | 190 (63.1%) | 0 (0.0%) |
| 35 to 44 Years | 287 (61.3%) | 70 (24.4%) |
| 45 to 54 Years | 258 (56.1%) | 1 (0.4%) |
| 55 to 59 Years | 174 (66.9%) | 36 (20.7%) |
| 60 to 64 Years | 45 (23.2%) | 0 (0.0%) |
| 65 to 74 Years | 107 (22.6%) | 0 (0.0%) |
| 75 Years and over | 27 (8.8%) | 0 (0.0%) |
| Total | 1,825 (52.1%) | 122 (6.7%) |
Employment Status by Educational Attainment in Tulia
According to labor force statistics for Tulia, 59.8% of individuals (1,204) out of the total population between 25 and 64 years of age (2,013) are in the labor force, with 8.9% or 107 of them being unemployed. The group with the highest labor force participation rate are those with the educational attainment of bachelor's degree or higher, with 89.5% or 314 individuals in the labor force. Within the labor force, individuals with less than high school education have the highest percentage of unemployment, with 15.9% or 27 of them being unemployed.
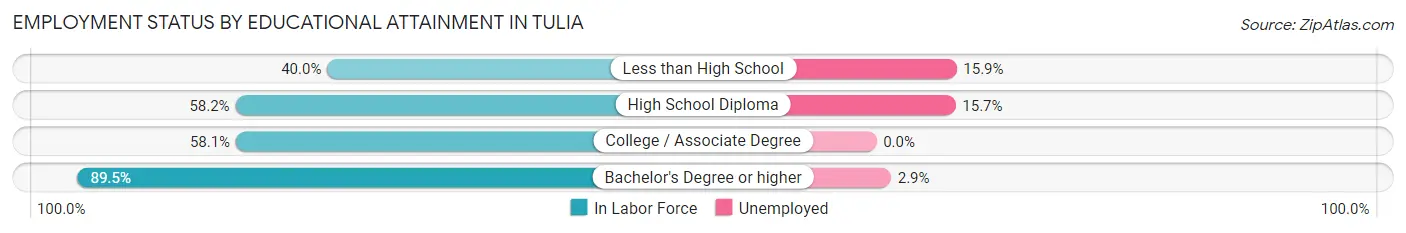
| Educational Attainment | In Labor Force | Unemployed |
| Less than High School | 170 (40.0%) | 68 (15.9%) |
| High School Diploma | 452 (58.2%) | 122 (15.7%) |
| College / Associate Degree | 268 (58.1%) | 0 (0.0%) |
| Bachelor's Degree or higher | 314 (89.5%) | 10 (2.9%) |
| Total | 1,204 (59.8%) | 179 (8.9%) |
Employment Occupations by Sex in Tulia
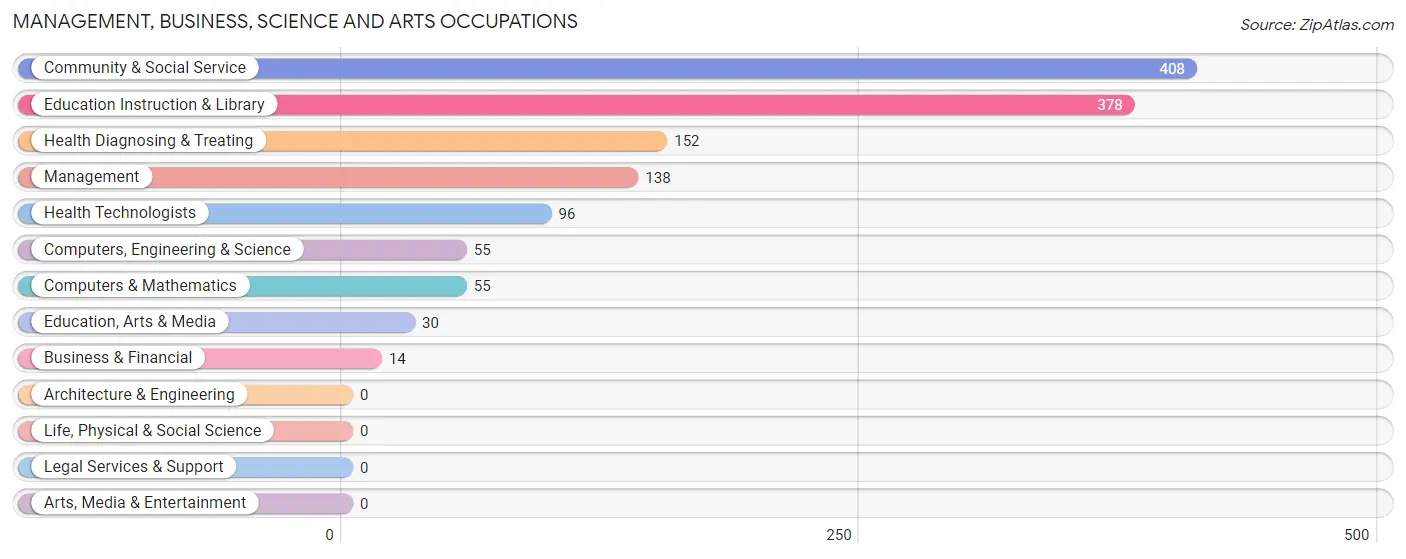
Management, Business, Science and Arts Occupations
The most common Management, Business, Science and Arts occupations in Tulia are Community & Social Service (408 | 24.0%), Education Instruction & Library (378 | 22.2%), Health Diagnosing & Treating (152 | 8.9%), Management (138 | 8.1%), and Health Technologists (96 | 5.6%).
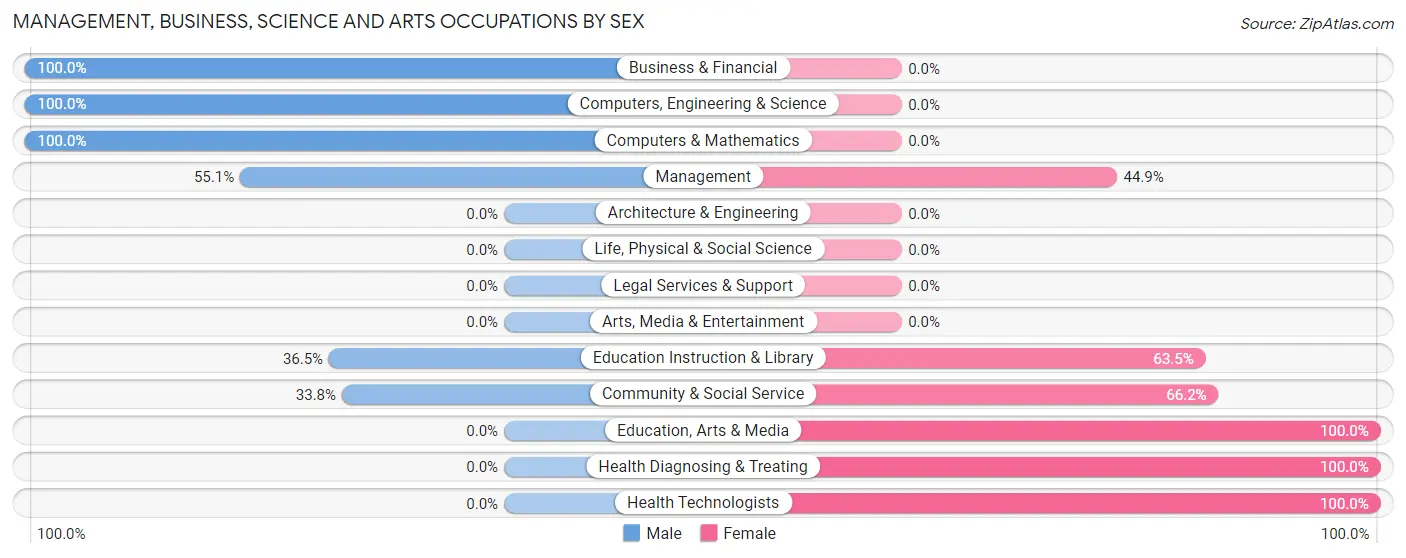
Management, Business, Science and Arts Occupations by Sex
Within the Management, Business, Science and Arts occupations in Tulia, the most male-oriented occupations are Business & Financial (100.0%), Computers, Engineering & Science (100.0%), and Computers & Mathematics (100.0%), while the most female-oriented occupations are Education, Arts & Media (100.0%), Health Diagnosing & Treating (100.0%), and Health Technologists (100.0%).
| Occupation | Male | Female |
| Management | 76 (55.1%) | 62 (44.9%) |
| Business & Financial | 14 (100.0%) | 0 (0.0%) |
| Computers, Engineering & Science | 55 (100.0%) | 0 (0.0%) |
| Computers & Mathematics | 55 (100.0%) | 0 (0.0%) |
| Architecture & Engineering | 0 (0.0%) | 0 (0.0%) |
| Life, Physical & Social Science | 0 (0.0%) | 0 (0.0%) |
| Community & Social Service | 138 (33.8%) | 270 (66.2%) |
| Education, Arts & Media | 0 (0.0%) | 30 (100.0%) |
| Legal Services & Support | 0 (0.0%) | 0 (0.0%) |
| Education Instruction & Library | 138 (36.5%) | 240 (63.5%) |
| Arts, Media & Entertainment | 0 (0.0%) | 0 (0.0%) |
| Health Diagnosing & Treating | 0 (0.0%) | 152 (100.0%) |
| Health Technologists | 0 (0.0%) | 96 (100.0%) |
| Total (Category) | 283 (36.9%) | 484 (63.1%) |
| Total (Overall) | 805 (47.3%) | 896 (52.7%) |
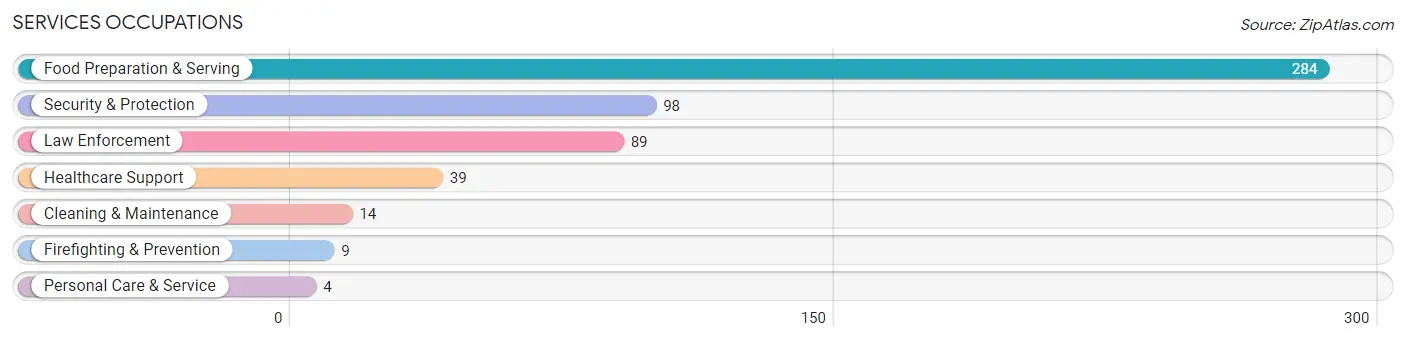
Services Occupations
The most common Services occupations in Tulia are Food Preparation & Serving (284 | 16.7%), Security & Protection (98 | 5.8%), Law Enforcement (89 | 5.2%), Healthcare Support (39 | 2.3%), and Cleaning & Maintenance (14 | 0.8%).
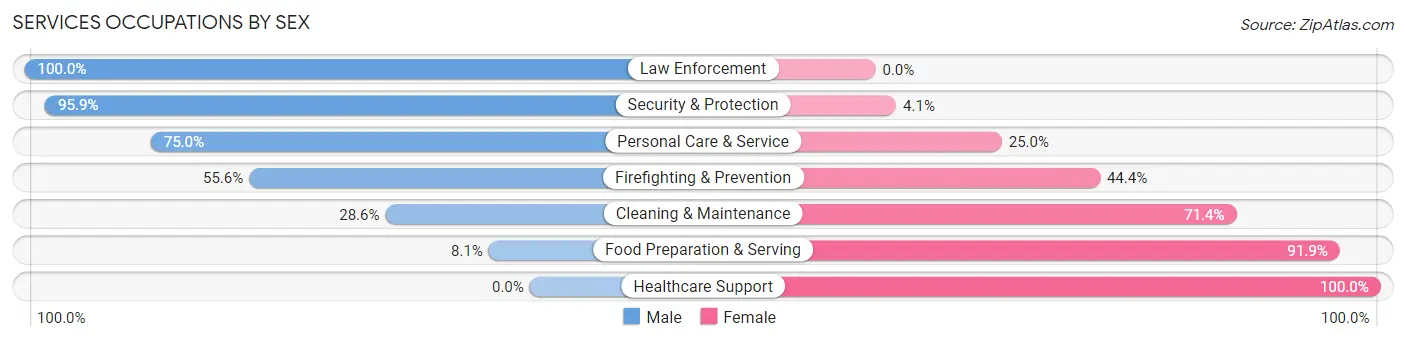
Services Occupations by Sex
Within the Services occupations in Tulia, the most male-oriented occupations are Law Enforcement (100.0%), Security & Protection (95.9%), and Personal Care & Service (75.0%), while the most female-oriented occupations are Healthcare Support (100.0%), Food Preparation & Serving (91.9%), and Cleaning & Maintenance (71.4%).
| Occupation | Male | Female |
| Healthcare Support | 0 (0.0%) | 39 (100.0%) |
| Security & Protection | 94 (95.9%) | 4 (4.1%) |
| Firefighting & Prevention | 5 (55.6%) | 4 (44.4%) |
| Law Enforcement | 89 (100.0%) | 0 (0.0%) |
| Food Preparation & Serving | 23 (8.1%) | 261 (91.9%) |
| Cleaning & Maintenance | 4 (28.6%) | 10 (71.4%) |
| Personal Care & Service | 3 (75.0%) | 1 (25.0%) |
| Total (Category) | 124 (28.2%) | 315 (71.8%) |
| Total (Overall) | 805 (47.3%) | 896 (52.7%) |
Sales and Office Occupations
The most common Sales and Office occupations in Tulia are Office & Administration (78 | 4.6%), and Sales & Related (69 | 4.1%).

Sales and Office Occupations by Sex

| Occupation | Male | Female |
| Sales & Related | 39 (56.5%) | 30 (43.5%) |
| Office & Administration | 24 (30.8%) | 54 (69.2%) |
| Total (Category) | 63 (42.9%) | 84 (57.1%) |
| Total (Overall) | 805 (47.3%) | 896 (52.7%) |
Natural Resources, Construction and Maintenance Occupations
The most common Natural Resources, Construction and Maintenance occupations in Tulia are Farming, Fishing & Forestry (95 | 5.6%), Construction & Extraction (53 | 3.1%), and Installation, Maintenance & Repair (47 | 2.8%).
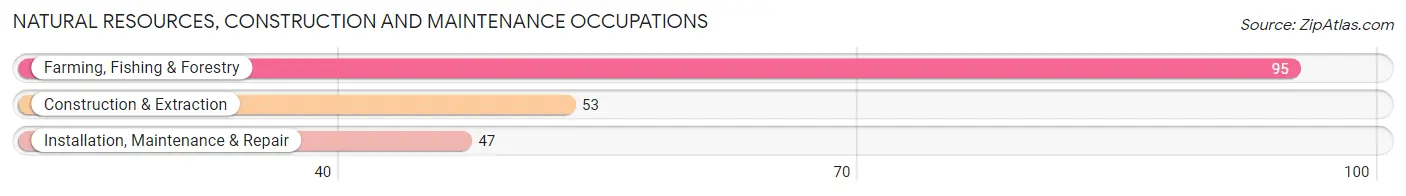
Natural Resources, Construction and Maintenance Occupations by Sex

| Occupation | Male | Female |
| Farming, Fishing & Forestry | 95 (100.0%) | 0 (0.0%) |
| Construction & Extraction | 40 (75.5%) | 13 (24.5%) |
| Installation, Maintenance & Repair | 47 (100.0%) | 0 (0.0%) |
| Total (Category) | 182 (93.3%) | 13 (6.7%) |
| Total (Overall) | 805 (47.3%) | 896 (52.7%) |
Production, Transportation and Moving Occupations
The most common Production, Transportation and Moving occupations in Tulia are Transportation (117 | 6.9%), Production (30 | 1.8%), and Material Moving (6 | 0.4%).
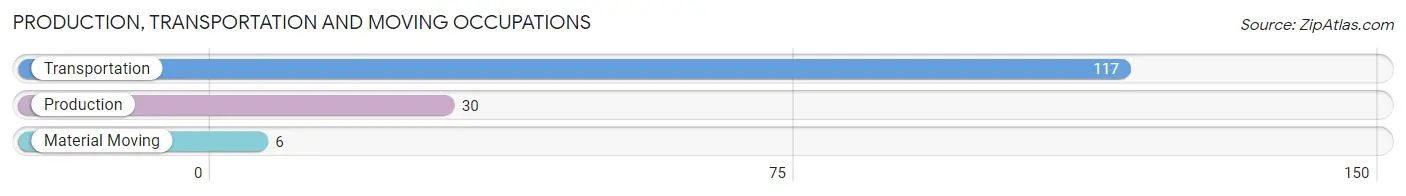
Production, Transportation and Moving Occupations by Sex
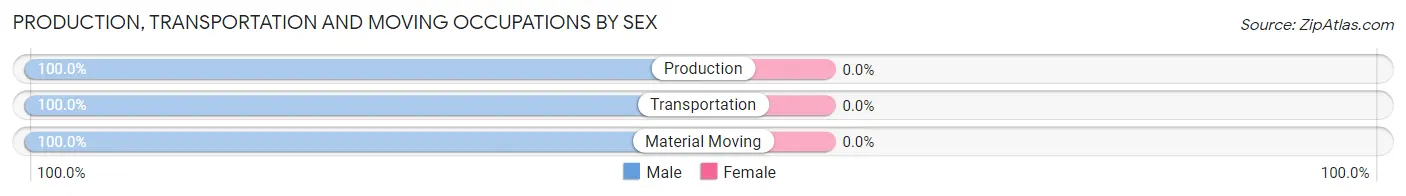
| Occupation | Male | Female |
| Production | 30 (100.0%) | 0 (0.0%) |
| Transportation | 117 (100.0%) | 0 (0.0%) |
| Material Moving | 6 (100.0%) | 0 (0.0%) |
| Total (Category) | 153 (100.0%) | 0 (0.0%) |
| Total (Overall) | 805 (47.3%) | 896 (52.7%) |
Employment Industries by Sex in Tulia
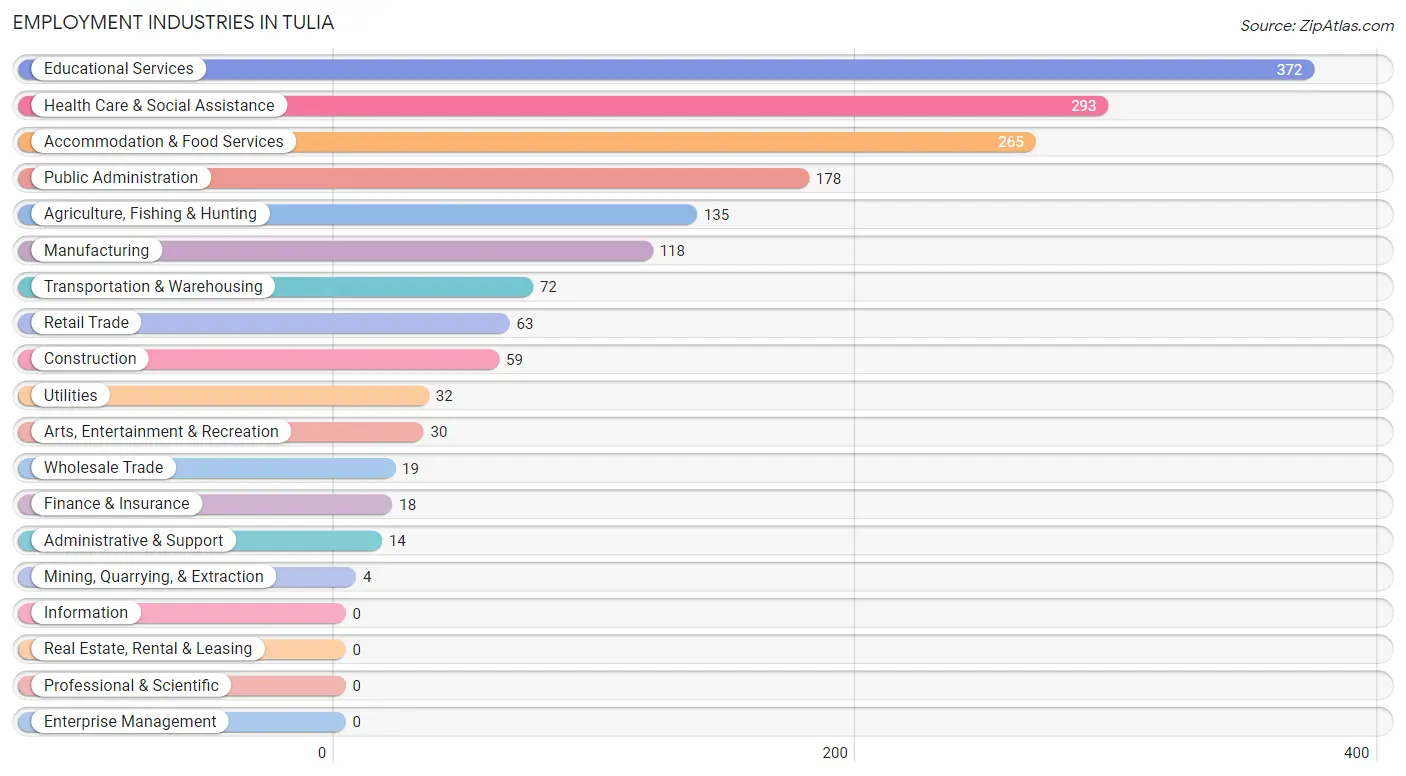
Employment Industries in Tulia
The major employment industries in Tulia include Educational Services (372 | 21.9%), Health Care & Social Assistance (293 | 17.2%), Accommodation & Food Services (265 | 15.6%), Public Administration (178 | 10.5%), and Agriculture, Fishing & Hunting (135 | 7.9%).
Employment Industries by Sex in Tulia
The Tulia industries that see more men than women are Mining, Quarrying, & Extraction (100.0%), Manufacturing (100.0%), and Wholesale Trade (100.0%), whereas the industries that tend to have a higher number of women are Health Care & Social Assistance (94.5%), Accommodation & Food Services (87.9%), and Retail Trade (60.3%).
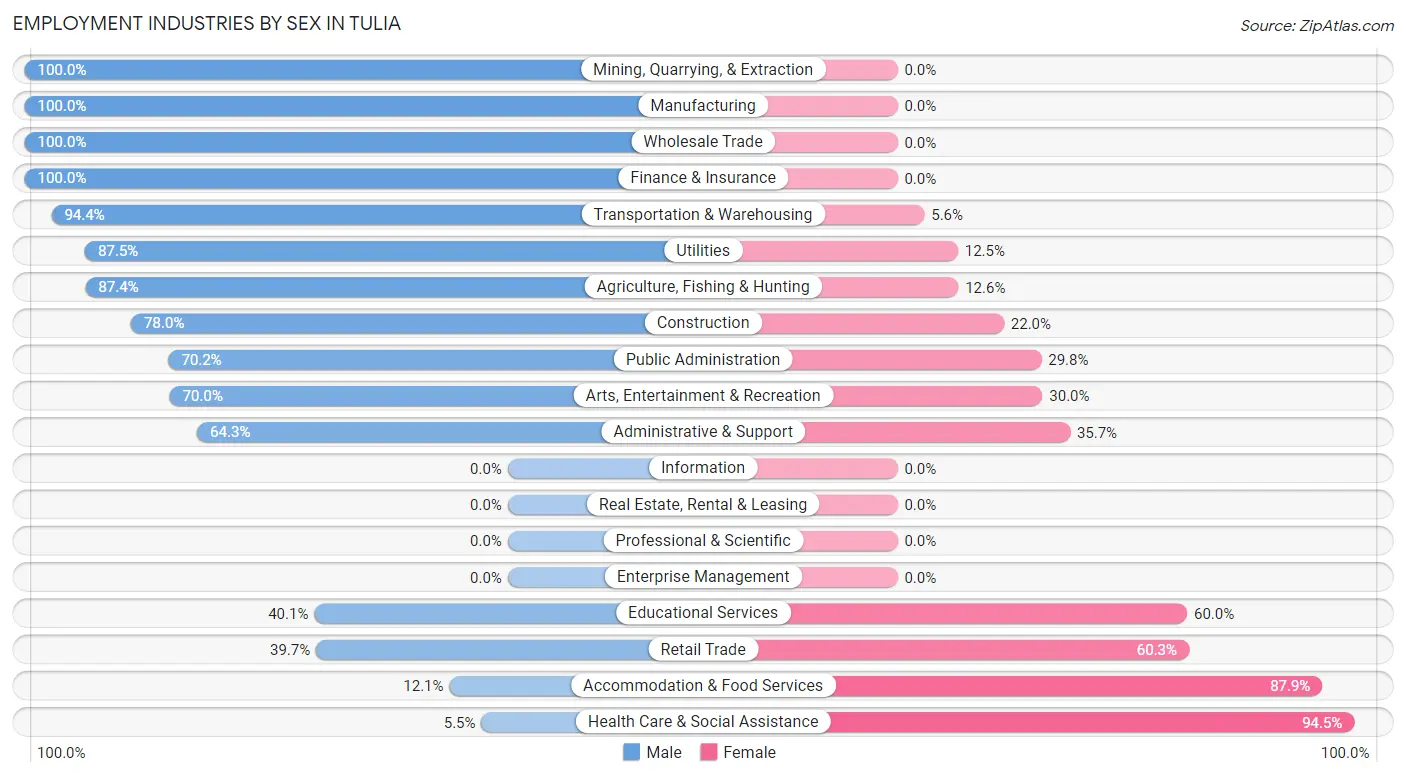
| Industry | Male | Female |
| Agriculture, Fishing & Hunting | 118 (87.4%) | 17 (12.6%) |
| Mining, Quarrying, & Extraction | 4 (100.0%) | 0 (0.0%) |
| Construction | 46 (78.0%) | 13 (22.0%) |
| Manufacturing | 118 (100.0%) | 0 (0.0%) |
| Wholesale Trade | 19 (100.0%) | 0 (0.0%) |
| Retail Trade | 25 (39.7%) | 38 (60.3%) |
| Transportation & Warehousing | 68 (94.4%) | 4 (5.6%) |
| Utilities | 28 (87.5%) | 4 (12.5%) |
| Information | 0 (0.0%) | 0 (0.0%) |
| Finance & Insurance | 18 (100.0%) | 0 (0.0%) |
| Real Estate, Rental & Leasing | 0 (0.0%) | 0 (0.0%) |
| Professional & Scientific | 0 (0.0%) | 0 (0.0%) |
| Enterprise Management | 0 (0.0%) | 0 (0.0%) |
| Administrative & Support | 9 (64.3%) | 5 (35.7%) |
| Educational Services | 149 (40.1%) | 223 (60.0%) |
| Health Care & Social Assistance | 16 (5.5%) | 277 (94.5%) |
| Arts, Entertainment & Recreation | 21 (70.0%) | 9 (30.0%) |
| Accommodation & Food Services | 32 (12.1%) | 233 (87.9%) |
| Public Administration | 125 (70.2%) | 53 (29.8%) |
| Total | 805 (47.3%) | 896 (52.7%) |
Education in Tulia
School Enrollment in Tulia
The most common levels of schooling among the 1,361 students in Tulia are college / undergraduate (380 | 27.9%), middle school (286 | 21.0%), and high school (231 | 17.0%).
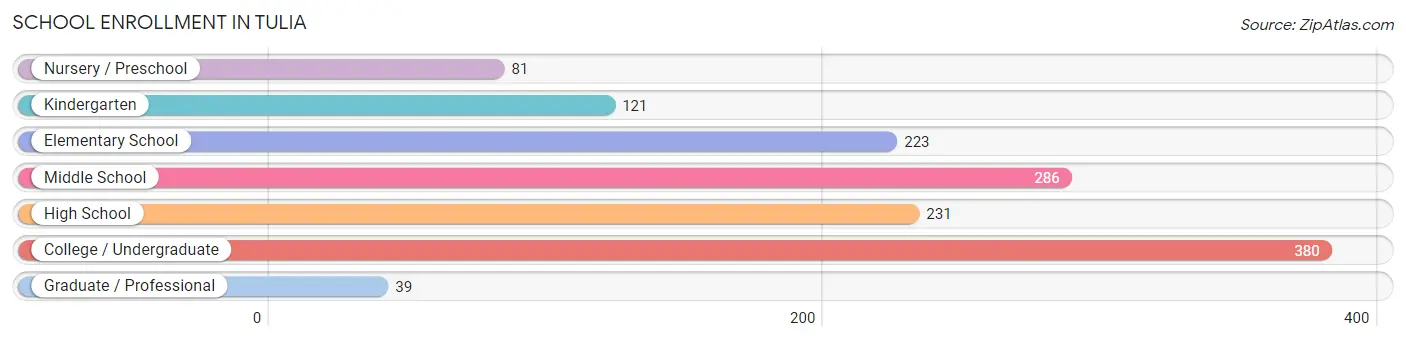
| School Level | # Students | % Students |
| Nursery / Preschool | 81 | 5.9% |
| Kindergarten | 121 | 8.9% |
| Elementary School | 223 | 16.4% |
| Middle School | 286 | 21.0% |
| High School | 231 | 17.0% |
| College / Undergraduate | 380 | 27.9% |
| Graduate / Professional | 39 | 2.9% |
| Total | 1,361 | 100.0% |
School Enrollment by Age by Funding Source in Tulia
Out of a total of 1,361 students who are enrolled in schools in Tulia, 31 (2.3%) attend a private institution, while the remaining 1,330 (97.7%) are enrolled in public schools. The age group of 3 to 4 year olds has the highest likelihood of being enrolled in private schools, with 31 (38.3% in the age bracket) enrolled. Conversely, the age group of 5 to 9 year old has the lowest likelihood of being enrolled in a private school, with 251 (100.0% in the age bracket) attending a public institution.
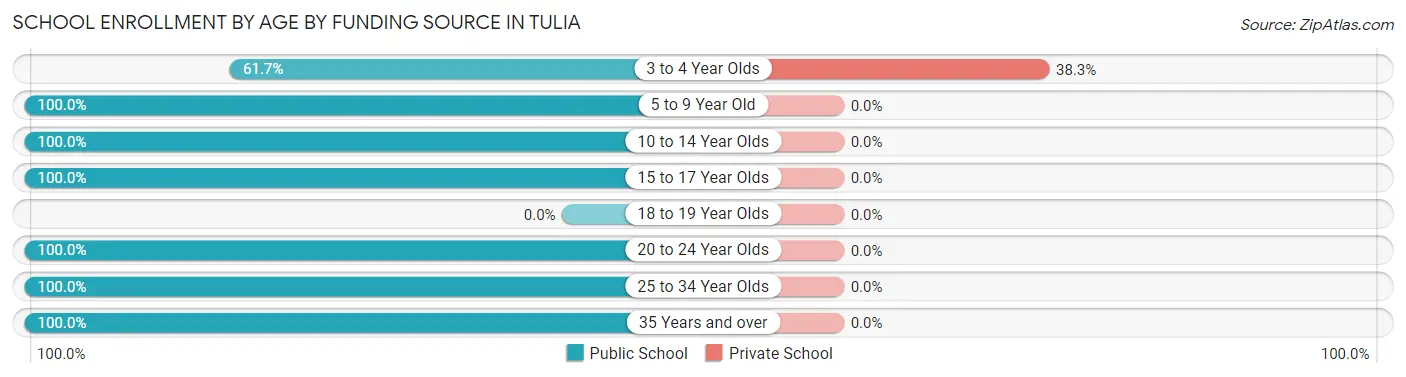
| Age Bracket | Public School | Private School |
| 3 to 4 Year Olds | 50 (61.7%) | 31 (38.3%) |
| 5 to 9 Year Old | 251 (100.0%) | 0 (0.0%) |
| 10 to 14 Year Olds | 403 (100.0%) | 0 (0.0%) |
| 15 to 17 Year Olds | 173 (100.0%) | 0 (0.0%) |
| 18 to 19 Year Olds | 0 (0.0%) | 0 (0.0%) |
| 20 to 24 Year Olds | 226 (100.0%) | 0 (0.0%) |
| 25 to 34 Year Olds | 185 (100.0%) | 0 (0.0%) |
| 35 Years and over | 42 (100.0%) | 0 (0.0%) |
| Total | 1,330 (97.7%) | 31 (2.3%) |
Educational Attainment by Field of Study in Tulia
Education (175 | 31.7%), business (100 | 18.1%), science & technology (70 | 12.7%), bio, nature & agricultural (64 | 11.6%), and psychology (33 | 6.0%) are the most common fields of study among 553 individuals in Tulia who have obtained a bachelor's degree or higher.
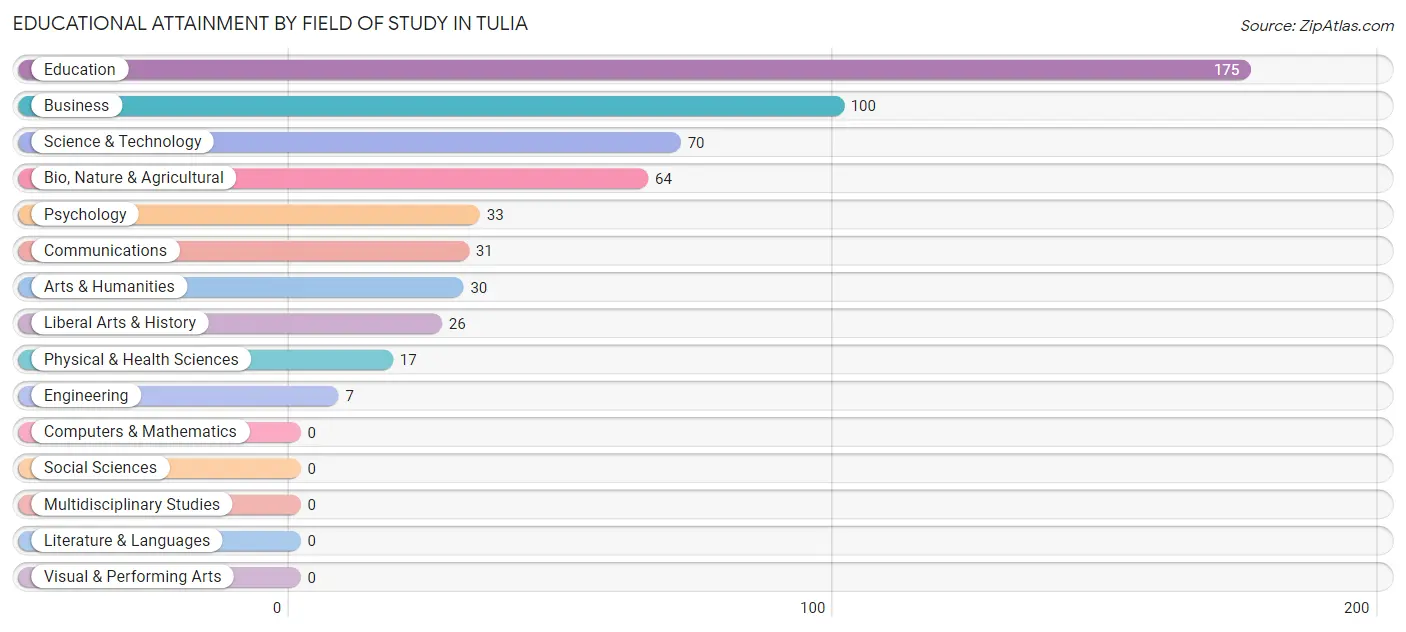
| Field of Study | # Graduates | % Graduates |
| Computers & Mathematics | 0 | 0.0% |
| Bio, Nature & Agricultural | 64 | 11.6% |
| Physical & Health Sciences | 17 | 3.1% |
| Psychology | 33 | 6.0% |
| Social Sciences | 0 | 0.0% |
| Engineering | 7 | 1.3% |
| Multidisciplinary Studies | 0 | 0.0% |
| Science & Technology | 70 | 12.7% |
| Business | 100 | 18.1% |
| Education | 175 | 31.7% |
| Literature & Languages | 0 | 0.0% |
| Liberal Arts & History | 26 | 4.7% |
| Visual & Performing Arts | 0 | 0.0% |
| Communications | 31 | 5.6% |
| Arts & Humanities | 30 | 5.4% |
| Total | 553 | 100.0% |
Transportation & Commute in Tulia
Vehicle Availability by Sex in Tulia
The most prevalent vehicle ownership categories in Tulia are males with 2 vehicles (389, accounting for 49.7%) and females with 2 vehicles (341, making up 43.9%).
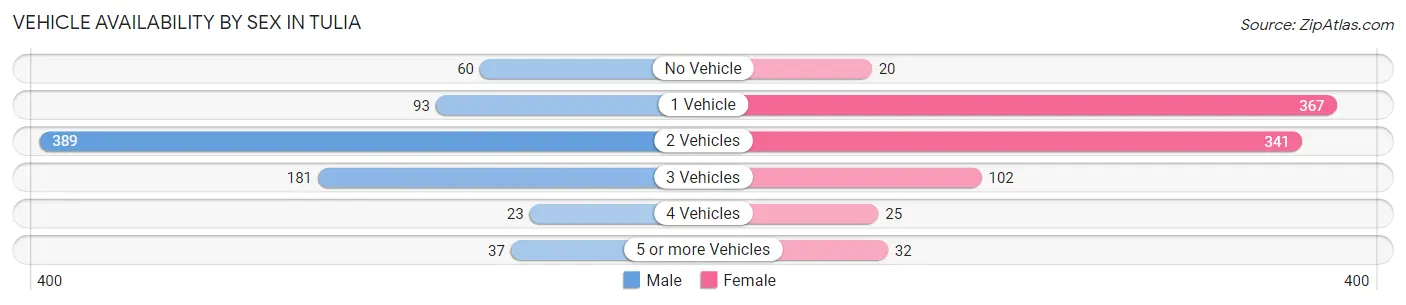
| Vehicles Available | Male | Female |
| No Vehicle | 60 (7.7%) | 20 (2.2%) |
| 1 Vehicle | 93 (11.9%) | 367 (41.4%) |
| 2 Vehicles | 389 (49.7%) | 341 (38.4%) |
| 3 Vehicles | 181 (23.1%) | 102 (11.5%) |
| 4 Vehicles | 23 (2.9%) | 25 (2.8%) |
| 5 or more Vehicles | 37 (4.7%) | 32 (3.6%) |
| Total | 783 (100.0%) | 887 (100.0%) |
Commute Time in Tulia
The most frequently occuring commute durations in Tulia are less than 5 minutes (400 commuters, 24.1%), 5 to 9 minutes (369 commuters, 22.2%), and 10 to 14 minutes (251 commuters, 15.1%).
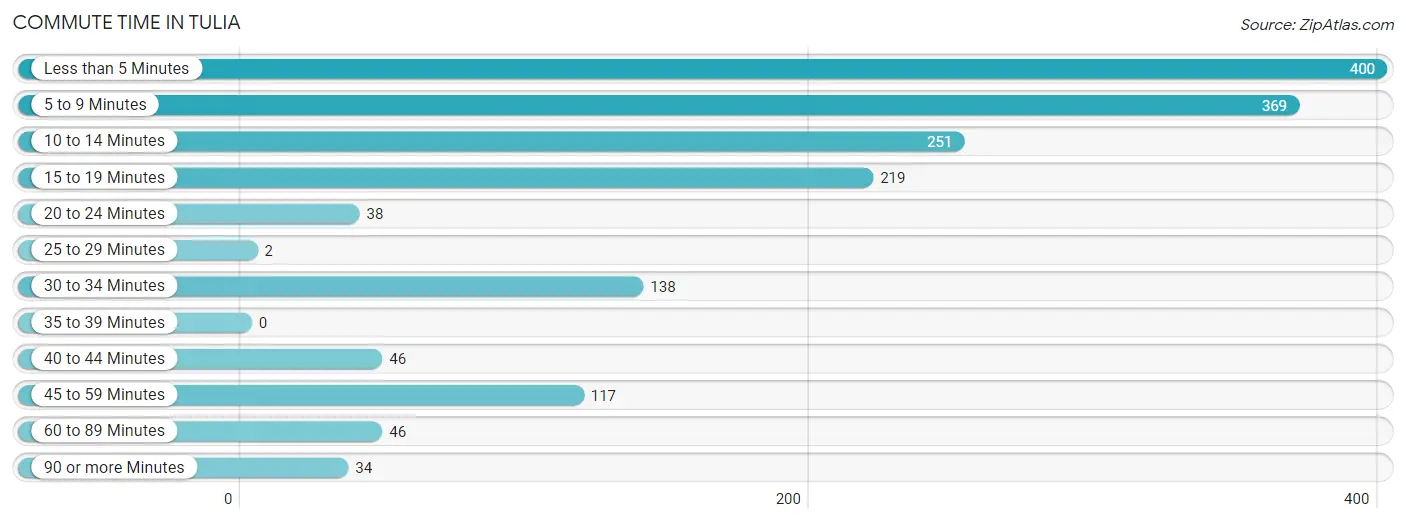
| Commute Time | # Commuters | % Commuters |
| Less than 5 Minutes | 400 | 24.1% |
| 5 to 9 Minutes | 369 | 22.2% |
| 10 to 14 Minutes | 251 | 15.1% |
| 15 to 19 Minutes | 219 | 13.2% |
| 20 to 24 Minutes | 38 | 2.3% |
| 25 to 29 Minutes | 2 | 0.1% |
| 30 to 34 Minutes | 138 | 8.3% |
| 35 to 39 Minutes | 0 | 0.0% |
| 40 to 44 Minutes | 46 | 2.8% |
| 45 to 59 Minutes | 117 | 7.0% |
| 60 to 89 Minutes | 46 | 2.8% |
| 90 or more Minutes | 34 | 2.1% |
Commute Time by Sex in Tulia
The most common commute times in Tulia are 15 to 19 minutes (166 commuters, 21.5%) for males and less than 5 minutes (278 commuters, 31.3%) for females.
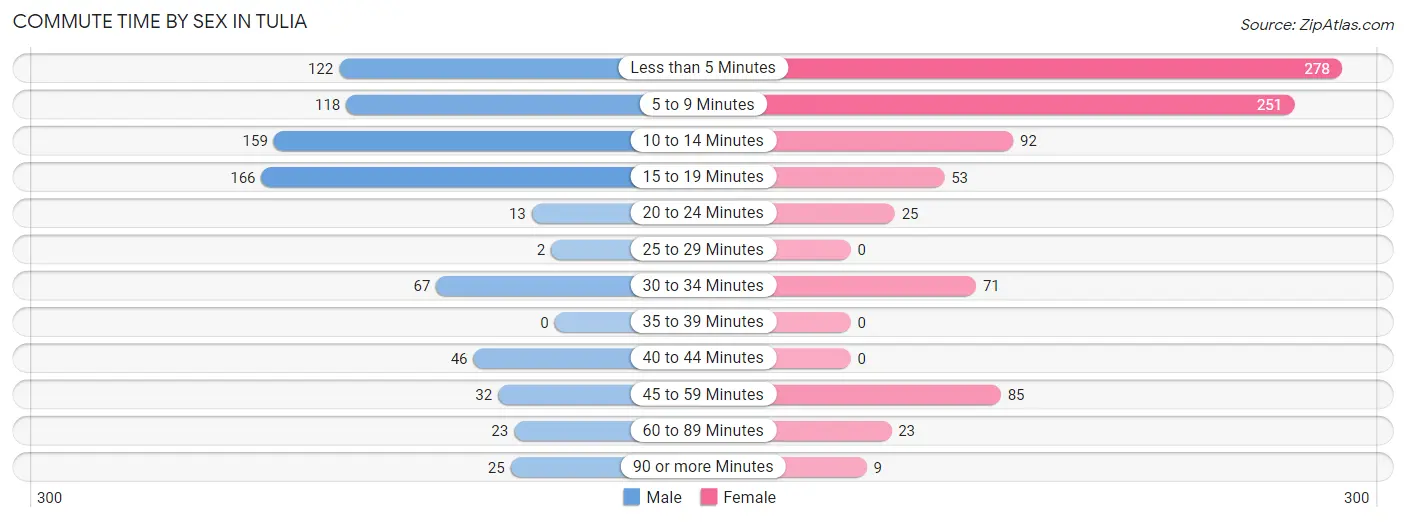
| Commute Time | Male | Female |
| Less than 5 Minutes | 122 (15.8%) | 278 (31.3%) |
| 5 to 9 Minutes | 118 (15.3%) | 251 (28.3%) |
| 10 to 14 Minutes | 159 (20.6%) | 92 (10.4%) |
| 15 to 19 Minutes | 166 (21.5%) | 53 (6.0%) |
| 20 to 24 Minutes | 13 (1.7%) | 25 (2.8%) |
| 25 to 29 Minutes | 2 (0.3%) | 0 (0.0%) |
| 30 to 34 Minutes | 67 (8.7%) | 71 (8.0%) |
| 35 to 39 Minutes | 0 (0.0%) | 0 (0.0%) |
| 40 to 44 Minutes | 46 (5.9%) | 0 (0.0%) |
| 45 to 59 Minutes | 32 (4.1%) | 85 (9.6%) |
| 60 to 89 Minutes | 23 (3.0%) | 23 (2.6%) |
| 90 or more Minutes | 25 (3.2%) | 9 (1.0%) |
Time of Departure to Work by Sex in Tulia
The most frequent times of departure to work in Tulia are 8:00 AM to 8:29 AM (200, 25.9%) for males and 8:00 AM to 8:29 AM (216, 24.3%) for females.
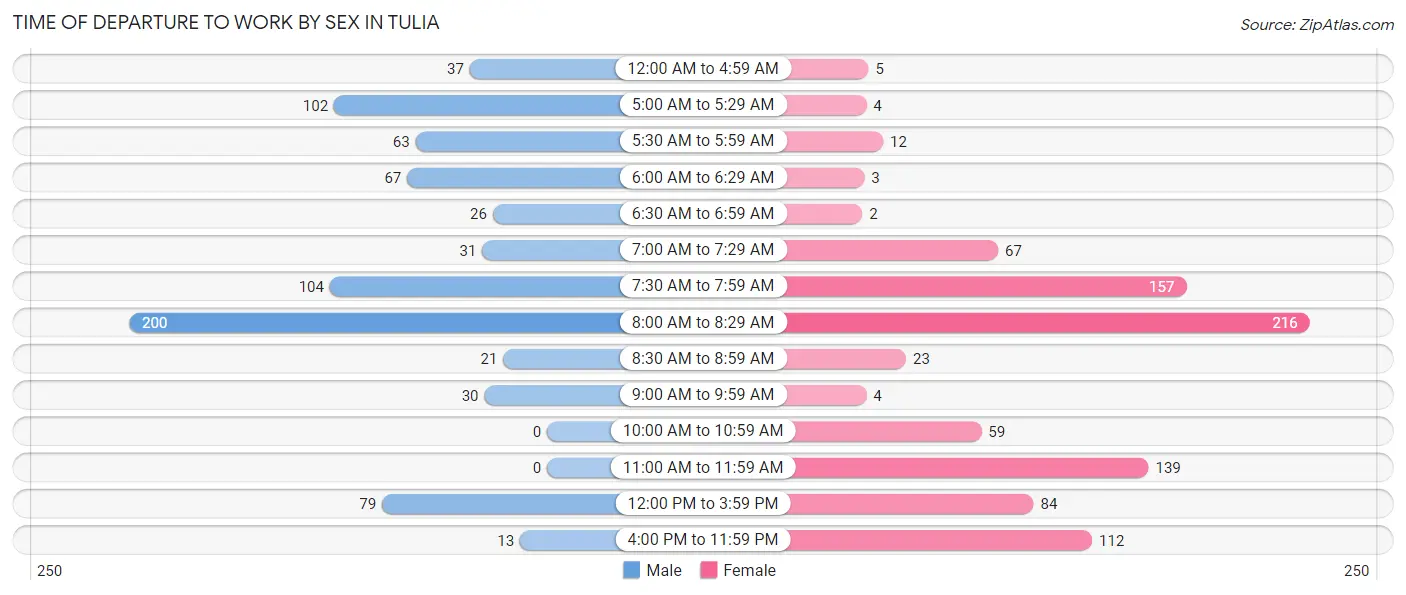
| Time of Departure | Male | Female |
| 12:00 AM to 4:59 AM | 37 (4.8%) | 5 (0.6%) |
| 5:00 AM to 5:29 AM | 102 (13.2%) | 4 (0.4%) |
| 5:30 AM to 5:59 AM | 63 (8.2%) | 12 (1.3%) |
| 6:00 AM to 6:29 AM | 67 (8.7%) | 3 (0.3%) |
| 6:30 AM to 6:59 AM | 26 (3.4%) | 2 (0.2%) |
| 7:00 AM to 7:29 AM | 31 (4.0%) | 67 (7.5%) |
| 7:30 AM to 7:59 AM | 104 (13.5%) | 157 (17.7%) |
| 8:00 AM to 8:29 AM | 200 (25.9%) | 216 (24.3%) |
| 8:30 AM to 8:59 AM | 21 (2.7%) | 23 (2.6%) |
| 9:00 AM to 9:59 AM | 30 (3.9%) | 4 (0.4%) |
| 10:00 AM to 10:59 AM | 0 (0.0%) | 59 (6.7%) |
| 11:00 AM to 11:59 AM | 0 (0.0%) | 139 (15.7%) |
| 12:00 PM to 3:59 PM | 79 (10.2%) | 84 (9.5%) |
| 4:00 PM to 11:59 PM | 13 (1.7%) | 112 (12.6%) |
| Total | 773 (100.0%) | 887 (100.0%) |
Housing Occupancy in Tulia
Occupancy by Ownership in Tulia
Of the total 1,495 dwellings in Tulia, owner-occupied units account for 918 (61.4%), while renter-occupied units make up 577 (38.6%).
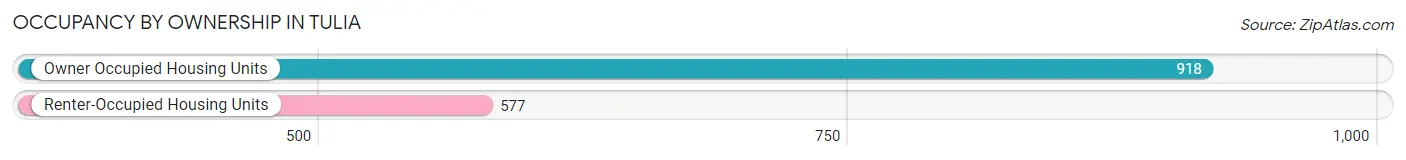
| Occupancy | # Housing Units | % Housing Units |
| Owner Occupied Housing Units | 918 | 61.4% |
| Renter-Occupied Housing Units | 577 | 38.6% |
| Total Occupied Housing Units | 1,495 | 100.0% |
Occupancy by Household Size in Tulia
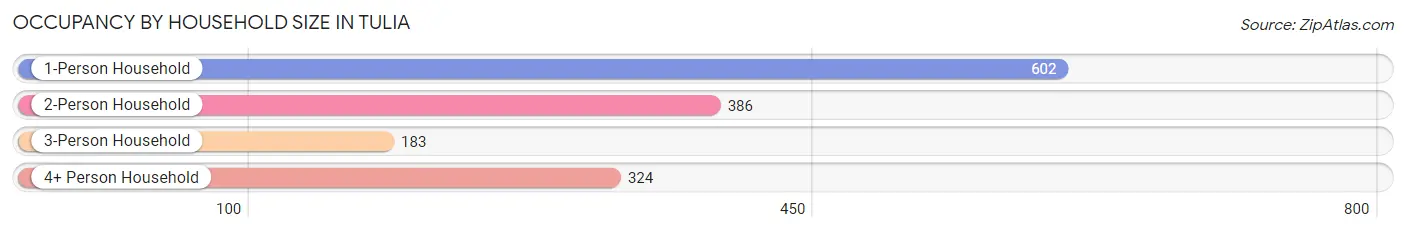
| Household Size | # Housing Units | % Housing Units |
| 1-Person Household | 602 | 40.3% |
| 2-Person Household | 386 | 25.8% |
| 3-Person Household | 183 | 12.2% |
| 4+ Person Household | 324 | 21.7% |
| Total Housing Units | 1,495 | 100.0% |
Occupancy by Ownership by Household Size in Tulia
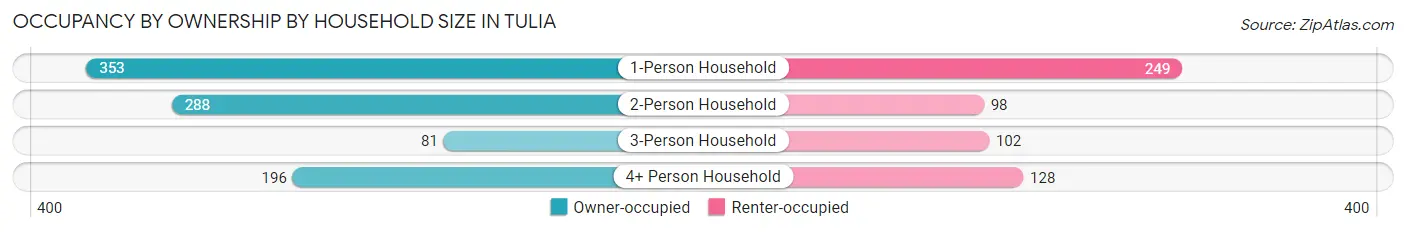
| Household Size | Owner-occupied | Renter-occupied |
| 1-Person Household | 353 (58.6%) | 249 (41.4%) |
| 2-Person Household | 288 (74.6%) | 98 (25.4%) |
| 3-Person Household | 81 (44.3%) | 102 (55.7%) |
| 4+ Person Household | 196 (60.5%) | 128 (39.5%) |
| Total Housing Units | 918 (61.4%) | 577 (38.6%) |
Occupancy by Educational Attainment in Tulia
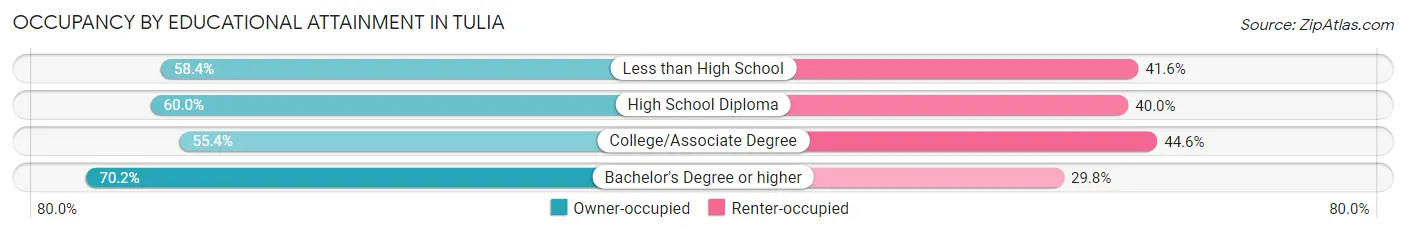
| Household Size | Owner-occupied | Renter-occupied |
| Less than High School | 216 (58.4%) | 154 (41.6%) |
| High School Diploma | 243 (60.0%) | 162 (40.0%) |
| College/Associate Degree | 174 (55.4%) | 140 (44.6%) |
| Bachelor's Degree or higher | 285 (70.2%) | 121 (29.8%) |
Occupancy by Age of Householder in Tulia
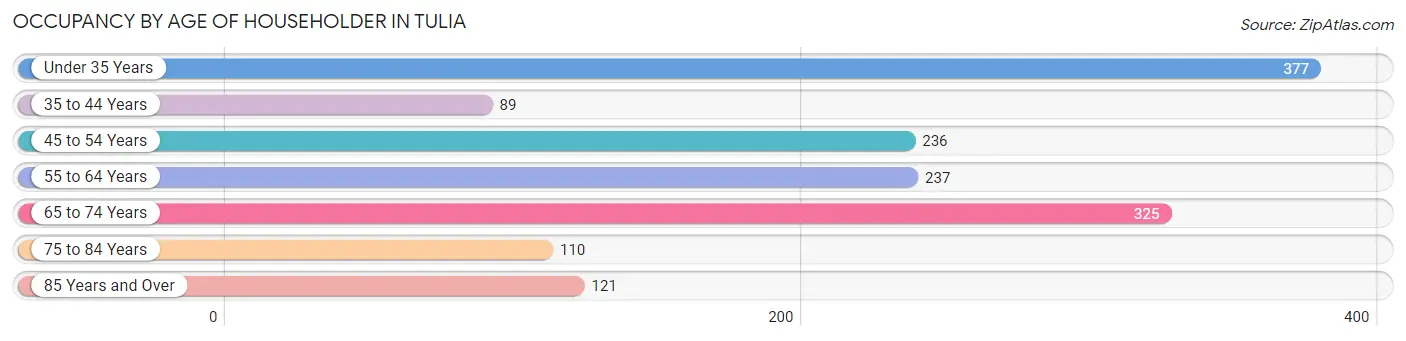
| Age Bracket | # Households | % Households |
| Under 35 Years | 377 | 25.2% |
| 35 to 44 Years | 89 | 5.9% |
| 45 to 54 Years | 236 | 15.8% |
| 55 to 64 Years | 237 | 15.9% |
| 65 to 74 Years | 325 | 21.7% |
| 75 to 84 Years | 110 | 7.4% |
| 85 Years and Over | 121 | 8.1% |
| Total | 1,495 | 100.0% |
Housing Finances in Tulia
Median Income by Occupancy in Tulia
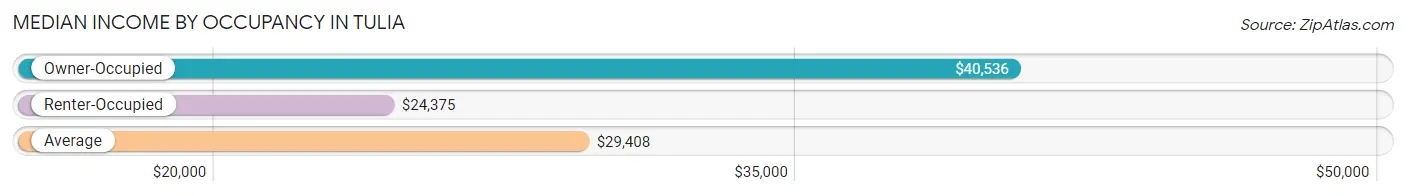
| Occupancy Type | # Households | Median Income |
| Owner-Occupied | 918 (61.4%) | $40,536 |
| Renter-Occupied | 577 (38.6%) | $24,375 |
| Average | 1,495 (100.0%) | $29,408 |
Occupancy by Householder Income Bracket in Tulia
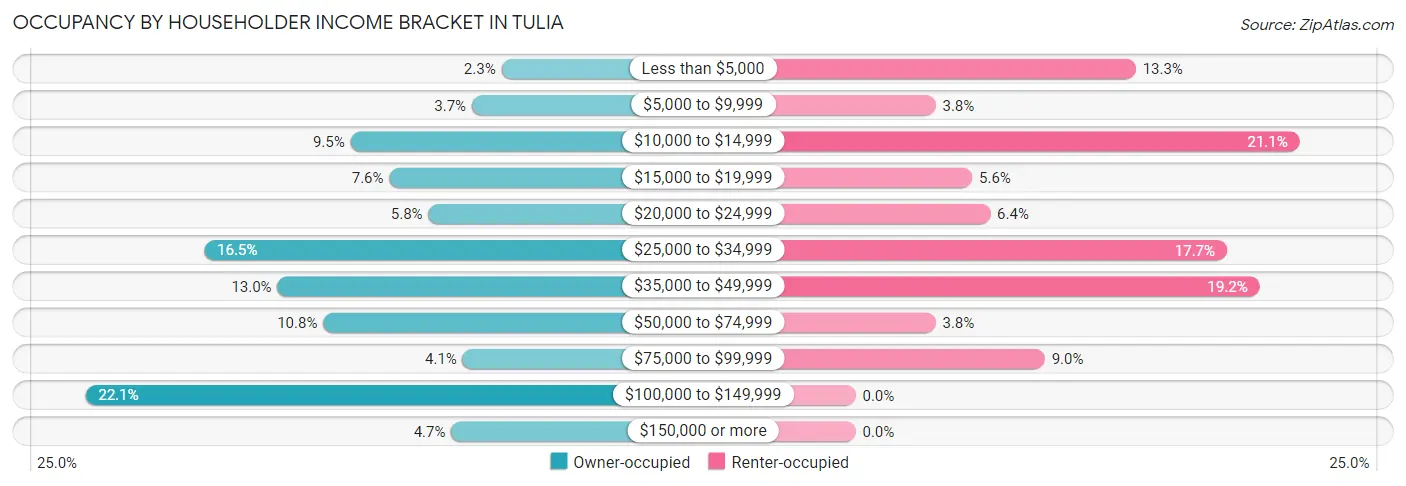
| Income Bracket | Owner-occupied | Renter-occupied |
| Less than $5,000 | 21 (2.3%) | 77 (13.3%) |
| $5,000 to $9,999 | 34 (3.7%) | 22 (3.8%) |
| $10,000 to $14,999 | 87 (9.5%) | 122 (21.1%) |
| $15,000 to $19,999 | 70 (7.6%) | 32 (5.6%) |
| $20,000 to $24,999 | 53 (5.8%) | 37 (6.4%) |
| $25,000 to $34,999 | 151 (16.5%) | 102 (17.7%) |
| $35,000 to $49,999 | 119 (13.0%) | 111 (19.2%) |
| $50,000 to $74,999 | 99 (10.8%) | 22 (3.8%) |
| $75,000 to $99,999 | 38 (4.1%) | 52 (9.0%) |
| $100,000 to $149,999 | 203 (22.1%) | 0 (0.0%) |
| $150,000 or more | 43 (4.7%) | 0 (0.0%) |
| Total | 918 (100.0%) | 577 (100.0%) |
Monthly Housing Cost Tiers in Tulia
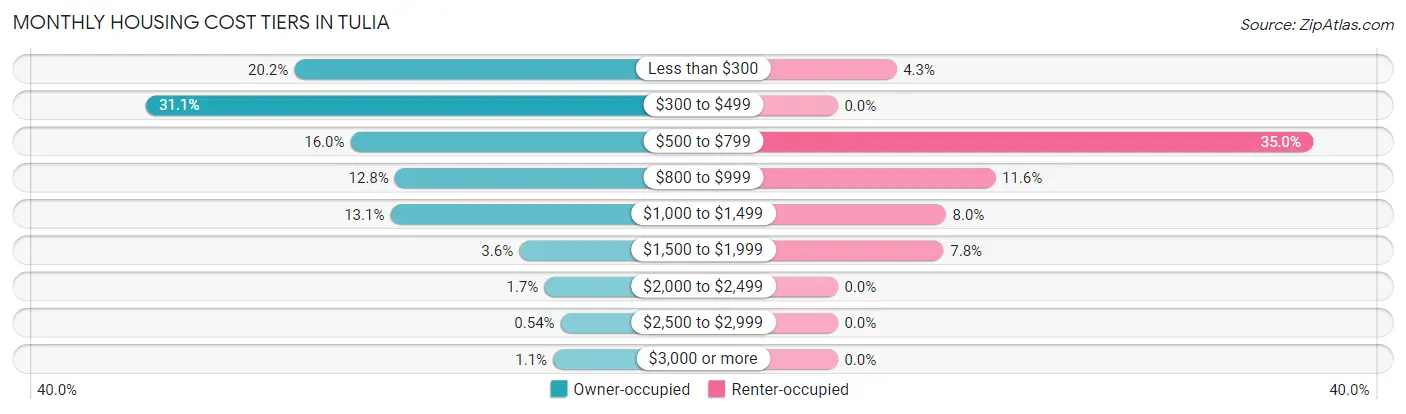
| Monthly Cost | Owner-occupied | Renter-occupied |
| Less than $300 | 185 (20.2%) | 25 (4.3%) |
| $300 to $499 | 285 (31.0%) | 0 (0.0%) |
| $500 to $799 | 147 (16.0%) | 202 (35.0%) |
| $800 to $999 | 117 (12.8%) | 67 (11.6%) |
| $1,000 to $1,499 | 120 (13.1%) | 46 (8.0%) |
| $1,500 to $1,999 | 33 (3.6%) | 45 (7.8%) |
| $2,000 to $2,499 | 16 (1.7%) | 0 (0.0%) |
| $2,500 to $2,999 | 5 (0.5%) | 0 (0.0%) |
| $3,000 or more | 10 (1.1%) | 0 (0.0%) |
| Total | 918 (100.0%) | 577 (100.0%) |
Physical Housing Characteristics in Tulia
Housing Structures in Tulia
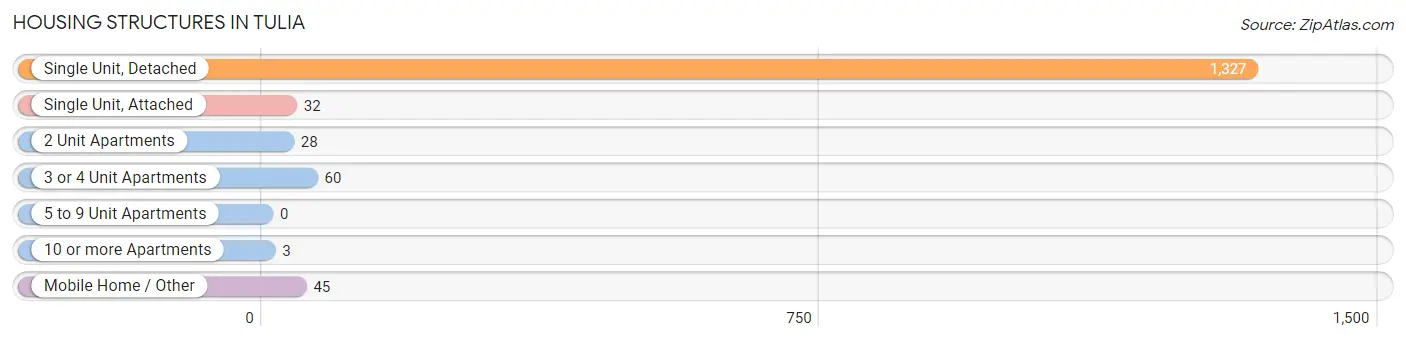
| Structure Type | # Housing Units | % Housing Units |
| Single Unit, Detached | 1,327 | 88.8% |
| Single Unit, Attached | 32 | 2.1% |
| 2 Unit Apartments | 28 | 1.9% |
| 3 or 4 Unit Apartments | 60 | 4.0% |
| 5 to 9 Unit Apartments | 0 | 0.0% |
| 10 or more Apartments | 3 | 0.2% |
| Mobile Home / Other | 45 | 3.0% |
| Total | 1,495 | 100.0% |
Housing Structures by Occupancy in Tulia
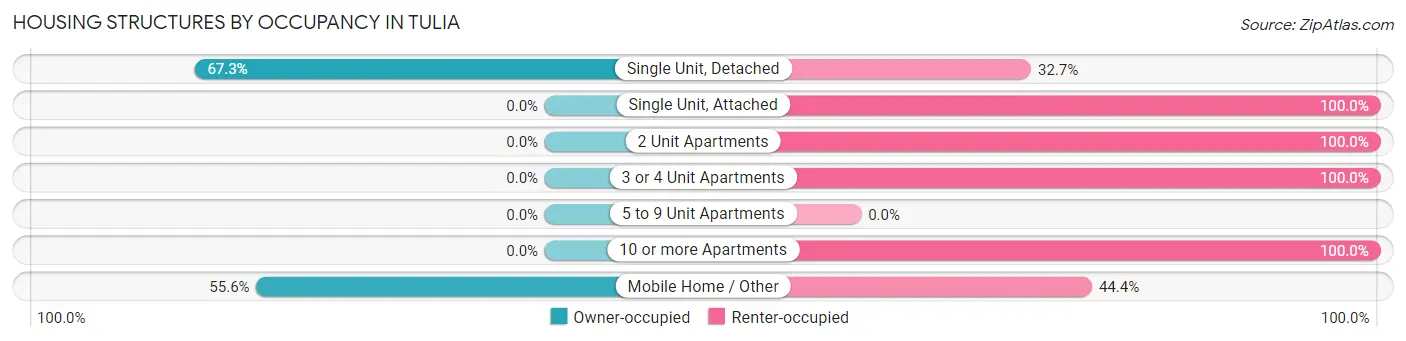
| Structure Type | Owner-occupied | Renter-occupied |
| Single Unit, Detached | 893 (67.3%) | 434 (32.7%) |
| Single Unit, Attached | 0 (0.0%) | 32 (100.0%) |
| 2 Unit Apartments | 0 (0.0%) | 28 (100.0%) |
| 3 or 4 Unit Apartments | 0 (0.0%) | 60 (100.0%) |
| 5 to 9 Unit Apartments | 0 (0.0%) | 0 (0.0%) |
| 10 or more Apartments | 0 (0.0%) | 3 (100.0%) |
| Mobile Home / Other | 25 (55.6%) | 20 (44.4%) |
| Total | 918 (61.4%) | 577 (38.6%) |
Housing Structures by Number of Rooms in Tulia
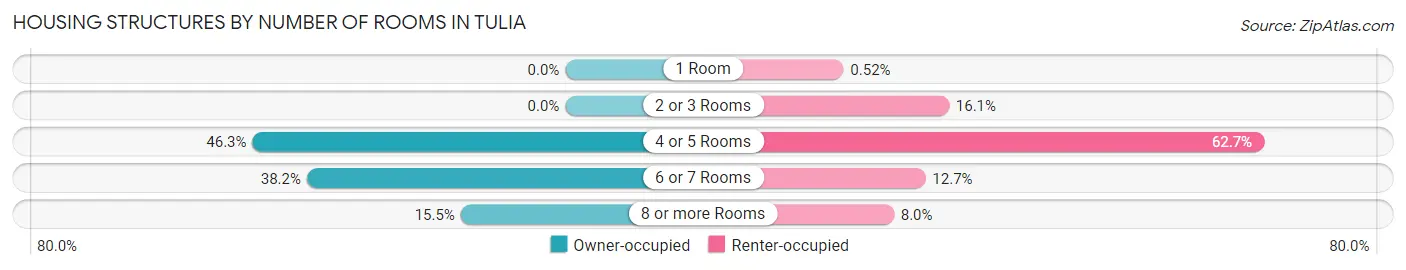
| Number of Rooms | Owner-occupied | Renter-occupied |
| 1 Room | 0 (0.0%) | 3 (0.5%) |
| 2 or 3 Rooms | 0 (0.0%) | 93 (16.1%) |
| 4 or 5 Rooms | 425 (46.3%) | 362 (62.7%) |
| 6 or 7 Rooms | 351 (38.2%) | 73 (12.7%) |
| 8 or more Rooms | 142 (15.5%) | 46 (8.0%) |
| Total | 918 (100.0%) | 577 (100.0%) |
Housing Structure by Heating Type in Tulia
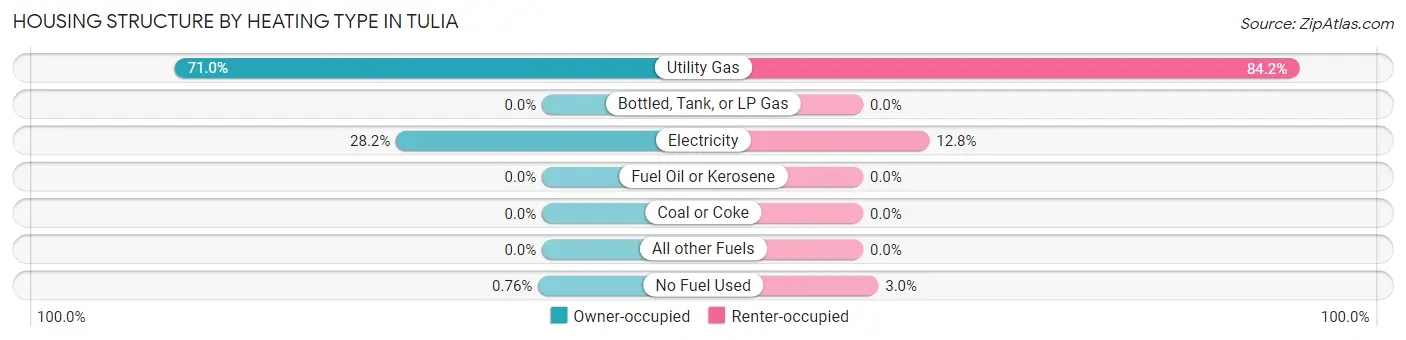
| Heating Type | Owner-occupied | Renter-occupied |
| Utility Gas | 652 (71.0%) | 486 (84.2%) |
| Bottled, Tank, or LP Gas | 0 (0.0%) | 0 (0.0%) |
| Electricity | 259 (28.2%) | 74 (12.8%) |
| Fuel Oil or Kerosene | 0 (0.0%) | 0 (0.0%) |
| Coal or Coke | 0 (0.0%) | 0 (0.0%) |
| All other Fuels | 0 (0.0%) | 0 (0.0%) |
| No Fuel Used | 7 (0.8%) | 17 (2.9%) |
| Total | 918 (100.0%) | 577 (100.0%) |
Household Vehicle Usage in Tulia
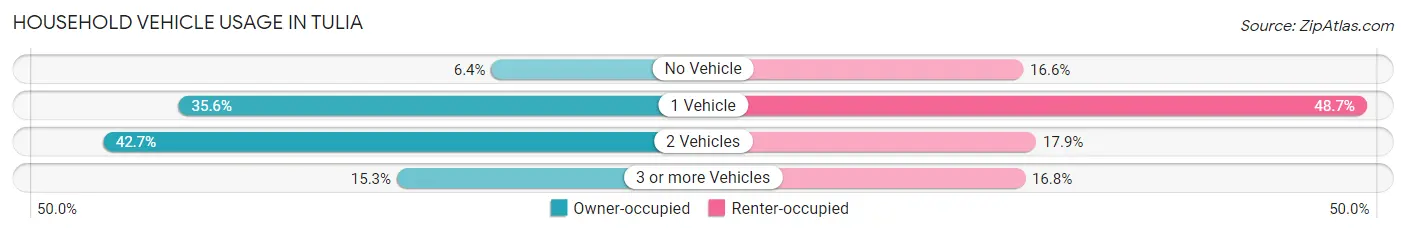
| Vehicles per Household | Owner-occupied | Renter-occupied |
| No Vehicle | 59 (6.4%) | 96 (16.6%) |
| 1 Vehicle | 327 (35.6%) | 281 (48.7%) |
| 2 Vehicles | 392 (42.7%) | 103 (17.8%) |
| 3 or more Vehicles | 140 (15.2%) | 97 (16.8%) |
| Total | 918 (100.0%) | 577 (100.0%) |
Real Estate & Mortgages in Tulia
Real Estate and Mortgage Overview in Tulia
| Characteristic | Without Mortgage | With Mortgage |
| Housing Units | 667 | 251 |
| Median Property Value | $57,000 | $107,900 |
| Median Household Income | $28,918 | $21 |
| Monthly Housing Costs | $385 | $10 |
| Real Estate Taxes | $717 | $5 |
Property Value by Mortgage Status in Tulia
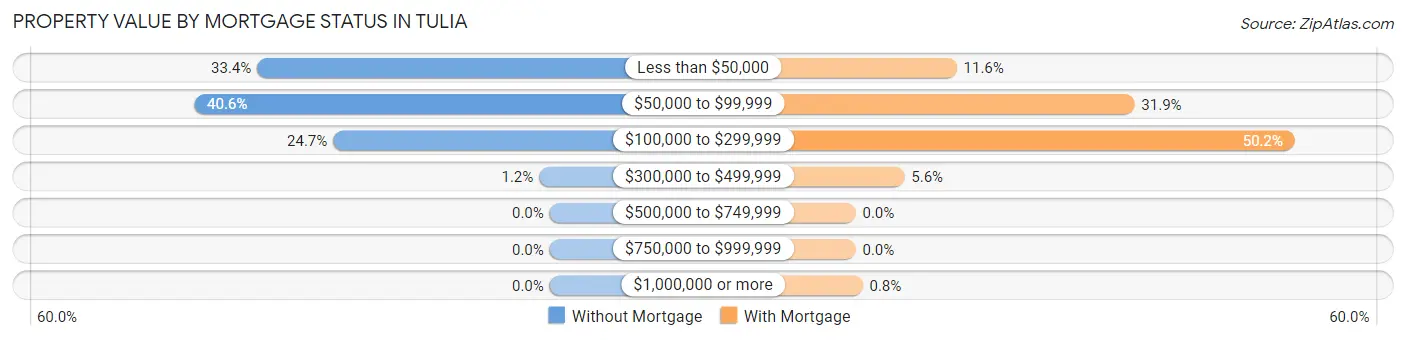
| Property Value | Without Mortgage | With Mortgage |
| Less than $50,000 | 223 (33.4%) | 29 (11.6%) |
| $50,000 to $99,999 | 271 (40.6%) | 80 (31.9%) |
| $100,000 to $299,999 | 165 (24.7%) | 126 (50.2%) |
| $300,000 to $499,999 | 8 (1.2%) | 14 (5.6%) |
| $500,000 to $749,999 | 0 (0.0%) | 0 (0.0%) |
| $750,000 to $999,999 | 0 (0.0%) | 0 (0.0%) |
| $1,000,000 or more | 0 (0.0%) | 2 (0.8%) |
| Total | 667 (100.0%) | 251 (100.0%) |
Household Income by Mortgage Status in Tulia
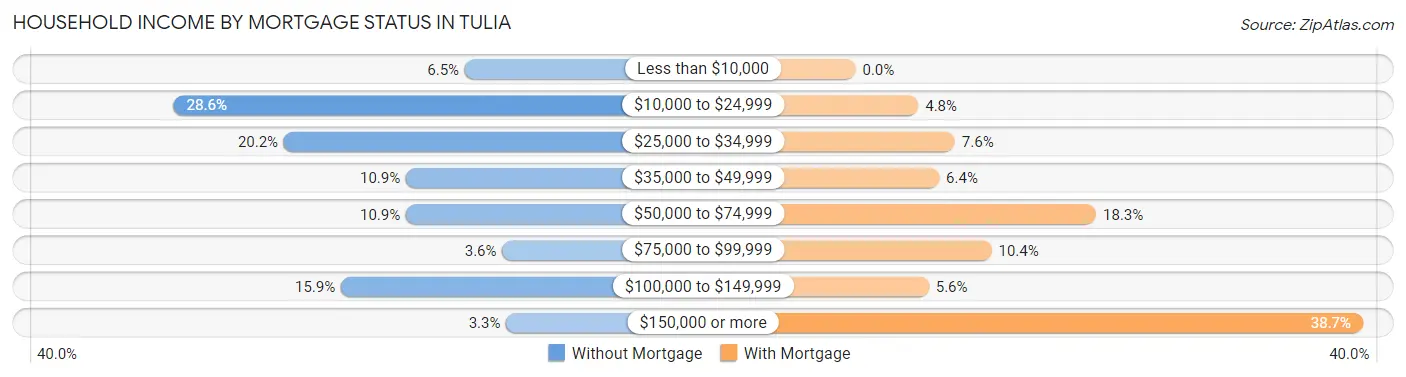
| Household Income | Without Mortgage | With Mortgage |
| Less than $10,000 | 43 (6.5%) | 0 (0.0%) |
| $10,000 to $24,999 | 191 (28.6%) | 12 (4.8%) |
| $25,000 to $34,999 | 135 (20.2%) | 19 (7.6%) |
| $35,000 to $49,999 | 73 (10.9%) | 16 (6.4%) |
| $50,000 to $74,999 | 73 (10.9%) | 46 (18.3%) |
| $75,000 to $99,999 | 24 (3.6%) | 26 (10.4%) |
| $100,000 to $149,999 | 106 (15.9%) | 14 (5.6%) |
| $150,000 or more | 22 (3.3%) | 97 (38.7%) |
| Total | 667 (100.0%) | 251 (100.0%) |
Property Value to Household Income Ratio in Tulia
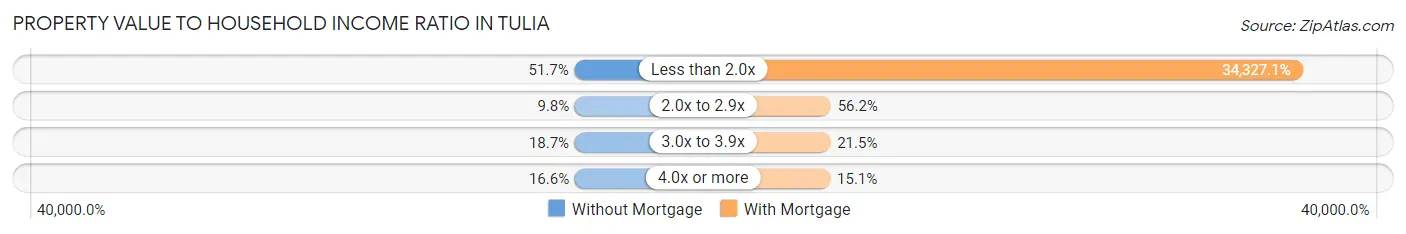
| Value-to-Income Ratio | Without Mortgage | With Mortgage |
| Less than 2.0x | 345 (51.7%) | 86,161 (34,327.1%) |
| 2.0x to 2.9x | 65 (9.8%) | 141 (56.2%) |
| 3.0x to 3.9x | 125 (18.7%) | 54 (21.5%) |
| 4.0x or more | 111 (16.6%) | 38 (15.1%) |
| Total | 667 (100.0%) | 251 (100.0%) |
Real Estate Taxes by Mortgage Status in Tulia
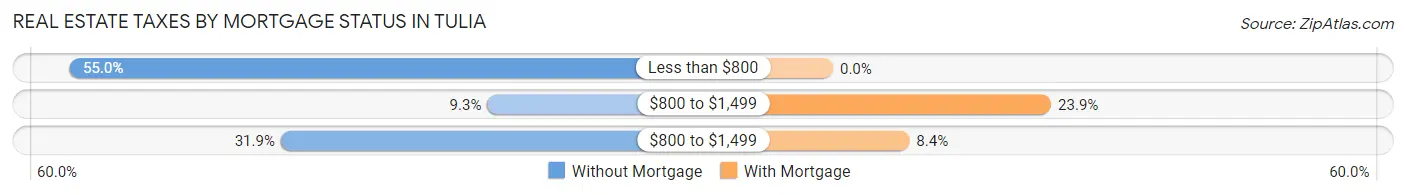
| Property Taxes | Without Mortgage | With Mortgage |
| Less than $800 | 367 (55.0%) | 0 (0.0%) |
| $800 to $1,499 | 62 (9.3%) | 60 (23.9%) |
| $800 to $1,499 | 213 (31.9%) | 21 (8.4%) |
| Total | 667 (100.0%) | 251 (100.0%) |
Health & Disability in Tulia
Health Insurance Coverage by Age in Tulia
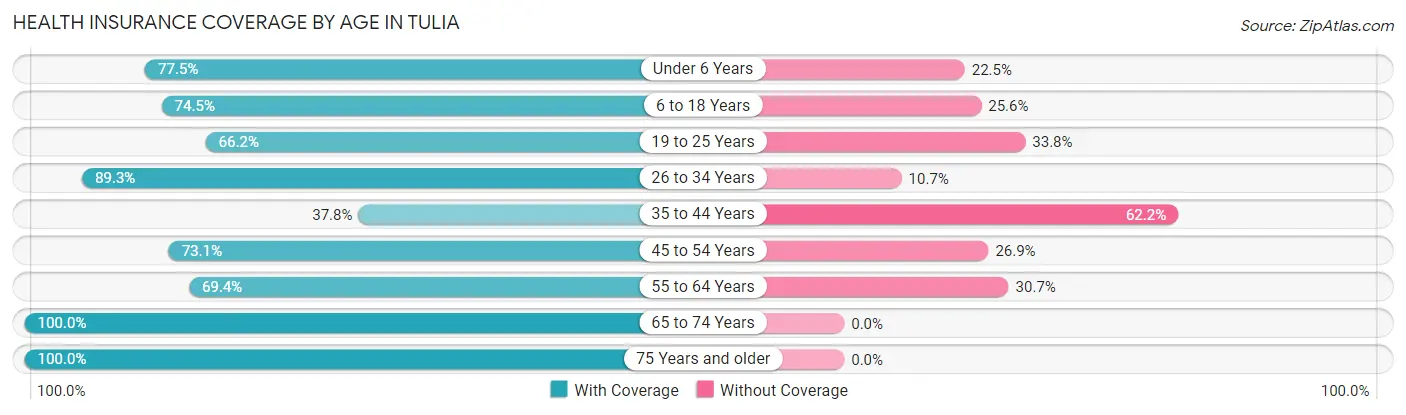
| Age Bracket | With Coverage | Without Coverage |
| Under 6 Years | 207 (77.5%) | 60 (22.5%) |
| 6 to 18 Years | 606 (74.5%) | 208 (25.6%) |
| 19 to 25 Years | 361 (66.2%) | 184 (33.8%) |
| 26 to 34 Years | 409 (89.3%) | 49 (10.7%) |
| 35 to 44 Years | 133 (37.8%) | 219 (62.2%) |
| 45 to 54 Years | 302 (73.1%) | 111 (26.9%) |
| 55 to 64 Years | 310 (69.4%) | 137 (30.6%) |
| 65 to 74 Years | 458 (100.0%) | 0 (0.0%) |
| 75 Years and older | 269 (100.0%) | 0 (0.0%) |
| Total | 3,055 (75.9%) | 968 (24.1%) |
Health Insurance Coverage by Citizenship Status in Tulia
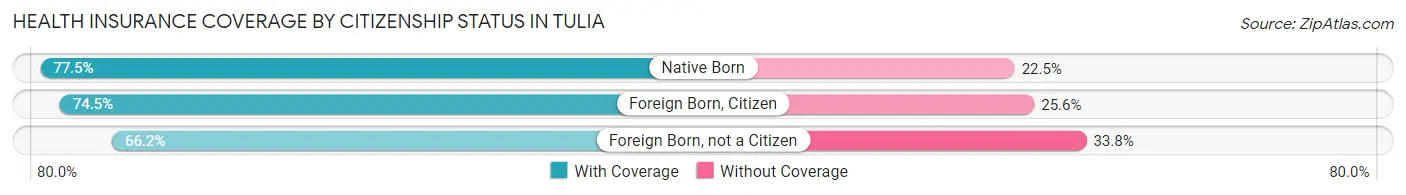
| Citizenship Status | With Coverage | Without Coverage |
| Native Born | 207 (77.5%) | 60 (22.5%) |
| Foreign Born, Citizen | 606 (74.5%) | 208 (25.6%) |
| Foreign Born, not a Citizen | 361 (66.2%) | 184 (33.8%) |
Health Insurance Coverage by Household Income in Tulia
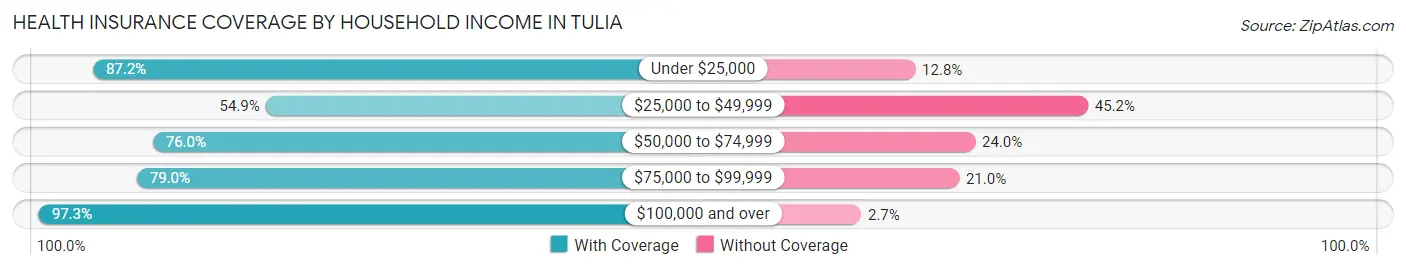
| Household Income | With Coverage | Without Coverage |
| Under $25,000 | 885 (87.2%) | 130 (12.8%) |
| $25,000 to $49,999 | 786 (54.8%) | 647 (45.2%) |
| $50,000 to $74,999 | 275 (76.0%) | 87 (24.0%) |
| $75,000 to $99,999 | 263 (79.0%) | 70 (21.0%) |
| $100,000 and over | 837 (97.3%) | 23 (2.7%) |
Public vs Private Health Insurance Coverage by Age in Tulia
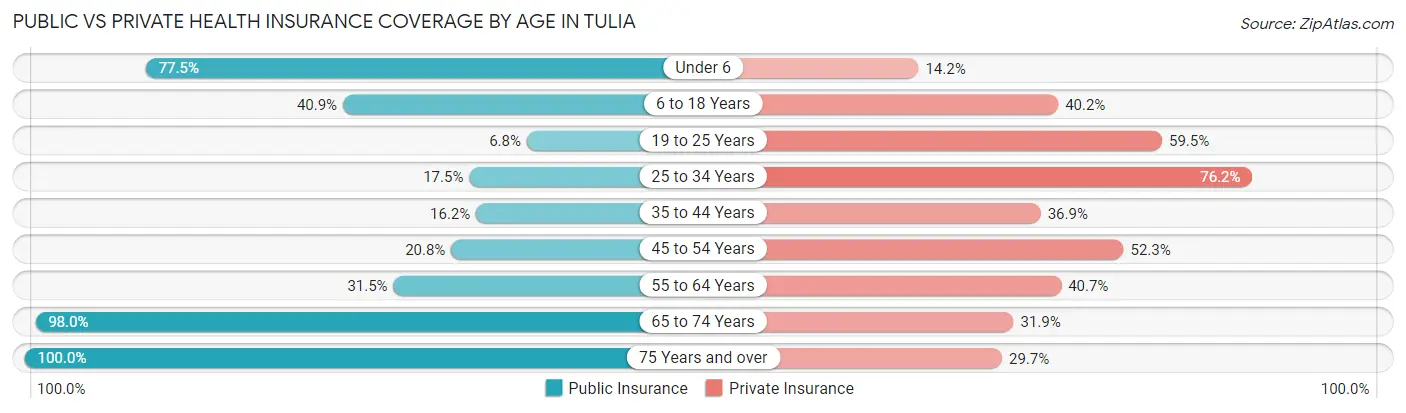
| Age Bracket | Public Insurance | Private Insurance |
| Under 6 | 207 (77.5%) | 38 (14.2%) |
| 6 to 18 Years | 333 (40.9%) | 327 (40.2%) |
| 19 to 25 Years | 37 (6.8%) | 324 (59.5%) |
| 25 to 34 Years | 80 (17.5%) | 349 (76.2%) |
| 35 to 44 Years | 57 (16.2%) | 130 (36.9%) |
| 45 to 54 Years | 86 (20.8%) | 216 (52.3%) |
| 55 to 64 Years | 141 (31.5%) | 182 (40.7%) |
| 65 to 74 Years | 449 (98.0%) | 146 (31.9%) |
| 75 Years and over | 269 (100.0%) | 80 (29.7%) |
| Total | 1,659 (41.2%) | 1,792 (44.5%) |
Disability Status by Sex by Age in Tulia
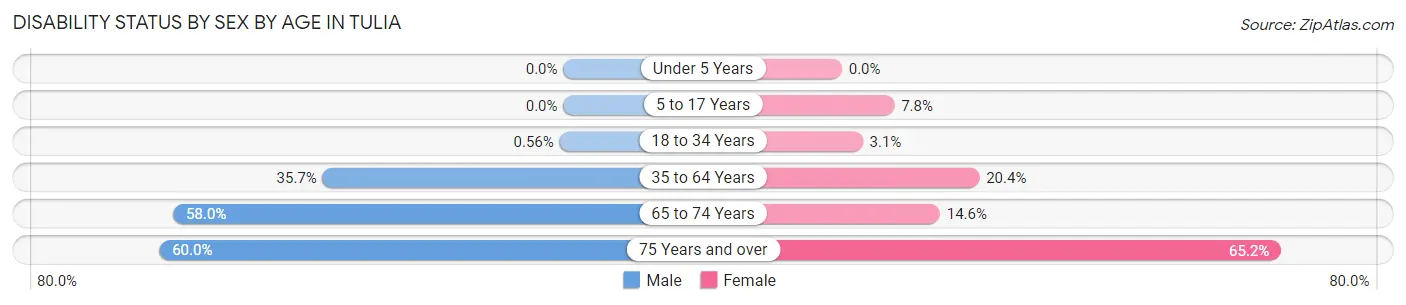
| Age Bracket | Male | Female |
| Under 5 Years | 0 (0.0%) | 0 (0.0%) |
| 5 to 17 Years | 0 (0.0%) | 33 (7.8%) |
| 18 to 34 Years | 3 (0.6%) | 15 (3.1%) |
| 35 to 64 Years | 223 (35.7%) | 120 (20.4%) |
| 65 to 74 Years | 142 (58.0%) | 31 (14.5%) |
| 75 Years and over | 63 (60.0%) | 107 (65.2%) |
Disability Class by Sex by Age in Tulia
Disability Class: Hearing Difficulty
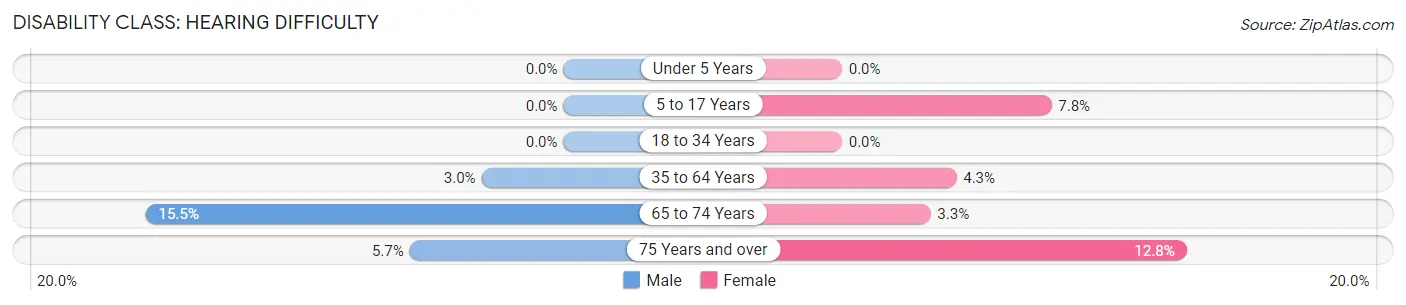
| Age Bracket | Male | Female |
| Under 5 Years | 0 (0.0%) | 0 (0.0%) |
| 5 to 17 Years | 0 (0.0%) | 33 (7.8%) |
| 18 to 34 Years | 0 (0.0%) | 0 (0.0%) |
| 35 to 64 Years | 19 (3.0%) | 25 (4.3%) |
| 65 to 74 Years | 38 (15.5%) | 7 (3.3%) |
| 75 Years and over | 6 (5.7%) | 21 (12.8%) |
Disability Class: Vision Difficulty
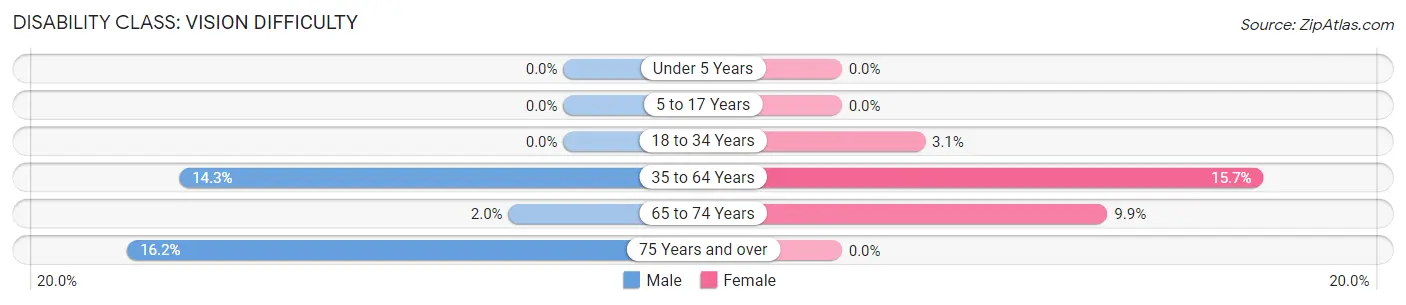
| Age Bracket | Male | Female |
| Under 5 Years | 0 (0.0%) | 0 (0.0%) |
| 5 to 17 Years | 0 (0.0%) | 0 (0.0%) |
| 18 to 34 Years | 0 (0.0%) | 15 (3.1%) |
| 35 to 64 Years | 89 (14.3%) | 92 (15.7%) |
| 65 to 74 Years | 5 (2.0%) | 21 (9.9%) |
| 75 Years and over | 17 (16.2%) | 0 (0.0%) |
Disability Class: Cognitive Difficulty
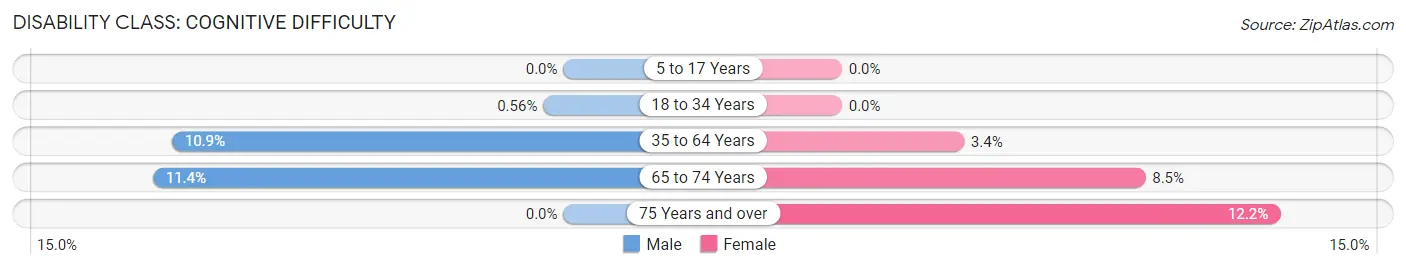
| Age Bracket | Male | Female |
| 5 to 17 Years | 0 (0.0%) | 0 (0.0%) |
| 18 to 34 Years | 3 (0.6%) | 0 (0.0%) |
| 35 to 64 Years | 68 (10.9%) | 20 (3.4%) |
| 65 to 74 Years | 28 (11.4%) | 18 (8.5%) |
| 75 Years and over | 0 (0.0%) | 20 (12.2%) |
Disability Class: Ambulatory Difficulty
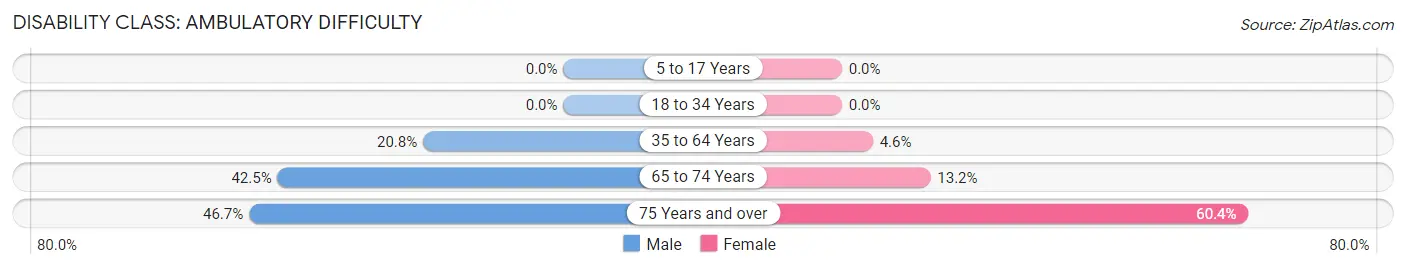
| Age Bracket | Male | Female |
| 5 to 17 Years | 0 (0.0%) | 0 (0.0%) |
| 18 to 34 Years | 0 (0.0%) | 0 (0.0%) |
| 35 to 64 Years | 130 (20.8%) | 27 (4.6%) |
| 65 to 74 Years | 104 (42.4%) | 28 (13.2%) |
| 75 Years and over | 49 (46.7%) | 99 (60.4%) |
Disability Class: Self-Care Difficulty
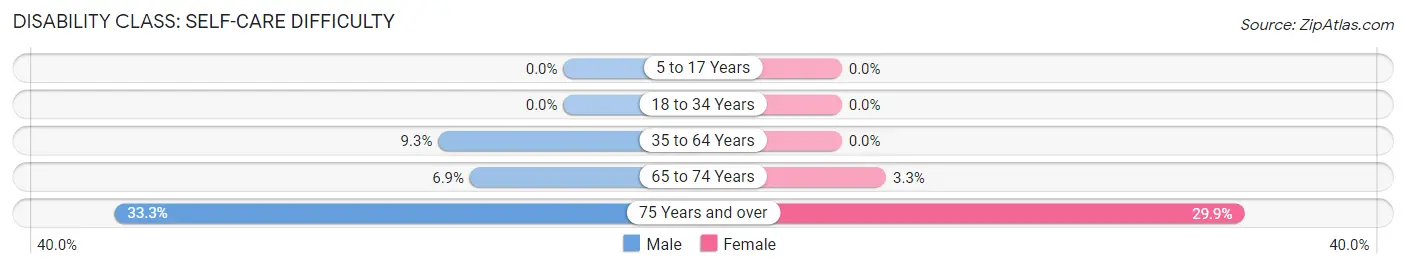
| Age Bracket | Male | Female |
| 5 to 17 Years | 0 (0.0%) | 0 (0.0%) |
| 18 to 34 Years | 0 (0.0%) | 0 (0.0%) |
| 35 to 64 Years | 58 (9.3%) | 0 (0.0%) |
| 65 to 74 Years | 17 (6.9%) | 7 (3.3%) |
| 75 Years and over | 35 (33.3%) | 49 (29.9%) |
Technology Access in Tulia
Computing Device Access in Tulia
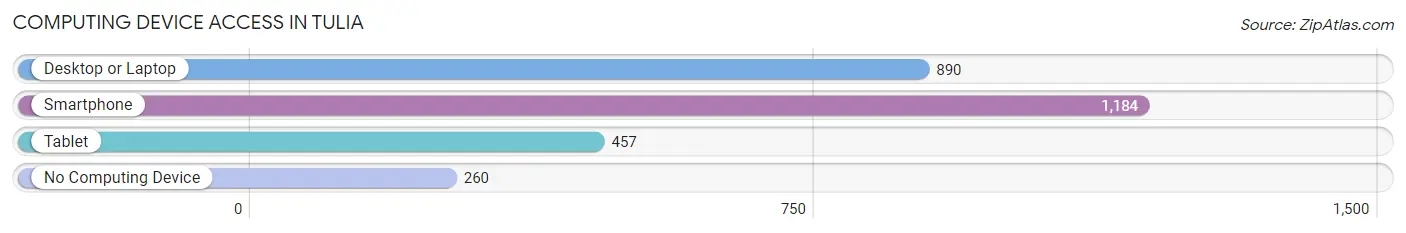
| Device Type | # Households | % Households |
| Desktop or Laptop | 890 | 59.5% |
| Smartphone | 1,184 | 79.2% |
| Tablet | 457 | 30.6% |
| No Computing Device | 260 | 17.4% |
| Total | 1,495 | 100.0% |
Internet Access in Tulia
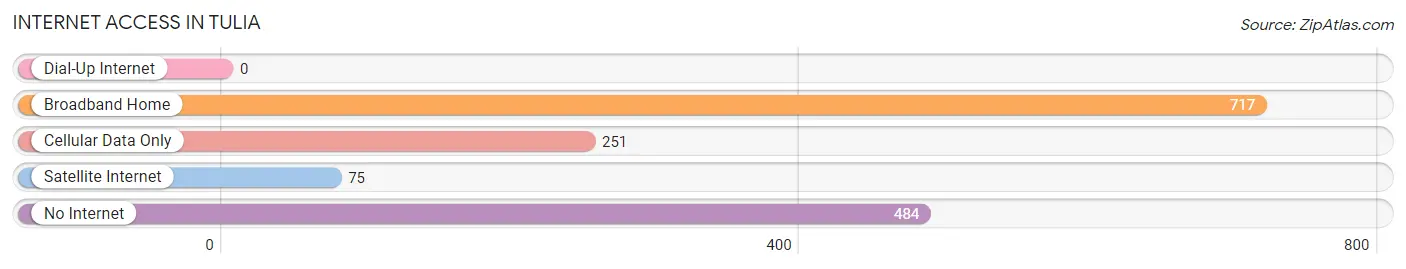
| Internet Type | # Households | % Households |
| Dial-Up Internet | 0 | 0.0% |
| Broadband Home | 717 | 48.0% |
| Cellular Data Only | 251 | 16.8% |
| Satellite Internet | 75 | 5.0% |
| No Internet | 484 | 32.4% |
| Total | 1,495 | 100.0% |
Tulia Summary
Tulia is a small town located in the Texas Panhandle, in Swisher County, Texas. It is situated on the High Plains of the Llano Estacado, approximately 30 miles south of Amarillo. The town was founded in 1887 and incorporated in 1905. As of the 2010 census, the population of Tulia was 5,117.
History
Tulia was founded in 1887 by the Santa Fe Railroad. The town was named after the daughter of a railroad official, and was originally known as “Tulia Station”. The town was incorporated in 1905, and the first mayor was J.W. Johnson.
In the early 1900s, Tulia was a thriving agricultural community, with cotton, corn, and wheat being the main crops. The town also had a number of businesses, including a bank, a hotel, a newspaper, and a movie theater.
In the 1950s, the town began to decline as the railroad industry began to decline. The population of Tulia dropped from a high of 2,500 in 1950 to 1,500 in 1960.
In the late 1990s, the town began to experience a resurgence. The population began to grow again, and new businesses began to open. The town also began to attract tourists, as it is located near the Palo Duro Canyon State Park.
Geography
Tulia is located in the Texas Panhandle, in Swisher County, Texas. It is situated on the High Plains of the Llano Estacado, approximately 30 miles south of Amarillo. The town is located at an elevation of 3,400 feet.
The climate in Tulia is semi-arid, with hot summers and cold winters. The average annual temperature is 64°F, and the average annual precipitation is 17.5 inches.
Economy
The economy of Tulia is largely based on agriculture. The main crops grown in the area are cotton, corn, and wheat. The town also has a number of businesses, including a bank, a hotel, a newspaper, and a movie theater.
The town is also home to a number of manufacturing companies, including a plastics factory, a furniture factory, and a metal fabrication plant.
Demographics
As of the 2010 census, the population of Tulia was 5,117. The racial makeup of the town was 79.3% White, 0.7% African American, 0.3% Native American, 0.2% Asian, 0.1% Pacific Islander, 17.7% from other races, and 1.9% from two or more races. Hispanic or Latino of any race were 33.2% of the population.
The median household income in Tulia was $31,944, and the median family income was $37,813. The per capita income was $15,945. About 17.2% of the population was below the poverty line.
Common Questions
What is Per Capita Income in Tulia?
Per Capita income in Tulia is $19,504.
What is the Median Family Income in Tulia?
Median Family Income in Tulia is $46,000.
What is the Median Household income in Tulia?
Median Household Income in Tulia is $29,408.
What is Income or Wage Gap in Tulia?
Income or Wage Gap in Tulia is 58.9%.
Women in Tulia earn 41.1 cents for every dollar earned by a man.
What is Family Income Deficit in Tulia?
Family Income Deficit in Tulia is $10,850.
Families that are below poverty line in Tulia earn $10,850 less on average than the poverty threshold level.
What is Inequality or Gini Index in Tulia?
Inequality or Gini Index in Tulia is 0.50.
What is the Total Population of Tulia?
Total Population of Tulia is 4,430.
What is the Total Male Population of Tulia?
Total Male Population of Tulia is 2,426.
What is the Total Female Population of Tulia?
Total Female Population of Tulia is 2,004.
What is the Ratio of Males per 100 Females in Tulia?
There are 121.06 Males per 100 Females in Tulia.
What is the Ratio of Females per 100 Males in Tulia?
There are 82.61 Females per 100 Males in Tulia.
What is the Median Population Age in Tulia?
Median Population Age in Tulia is 34.5 Years.
What is the Average Family Size in Tulia
Average Family Size in Tulia is 3.8 People.
What is the Average Household Size in Tulia
Average Household Size in Tulia is 2.7 People.
How Large is the Labor Force in Tulia?
There are 1,825 People in the Labor Forcein in Tulia.
What is the Percentage of People in the Labor Force in Tulia?
52.1% of People are in the Labor Force in Tulia.
What is the Unemployment Rate in Tulia?
Unemployment Rate in Tulia is 6.7%.