Troup, TX Map & Demographics
Troup Map
Troup Overview
$19,983
PER CAPITA INCOME
$56,250
AVG FAMILY INCOME
$49,063
AVG HOUSEHOLD INCOME
43.7%
WAGE / INCOME GAP [ % ]
56.3¢/ $1
WAGE / INCOME GAP [ $ ]
0.43
INEQUALITY / GINI INDEX
2,148
TOTAL POPULATION
1,026
MALE POPULATION
1,122
FEMALE POPULATION
91.44
MALES / 100 FEMALES
109.36
FEMALES / 100 MALES
31.5
MEDIAN AGE
3.8
AVG FAMILY SIZE
3.1
AVG HOUSEHOLD SIZE
969
LABOR FORCE [ PEOPLE ]
63.4%
PERCENT IN LABOR FORCE
18.5%
UNEMPLOYMENT RATE
Troup Zip Codes
Income in Troup
Income Overview in Troup
Per Capita Income in Troup is $19,983, while median incomes of families and households are $56,250 and $49,063 respectively.
| Characteristic | Number | Measure |
| Per Capita Income | 2,148 | $19,983 |
| Median Family Income | 487 | $56,250 |
| Mean Family Income | 487 | $68,466 |
| Median Household Income | 689 | $49,063 |
| Mean Household Income | 689 | $62,079 |
| Income Deficit | 487 | $0 |
| Wage / Income Gap (%) | 2,148 | 43.67% |
| Wage / Income Gap ($) | 2,148 | 56.33¢ per $1 |
| Gini / Inequality Index | 2,148 | 0.43 |
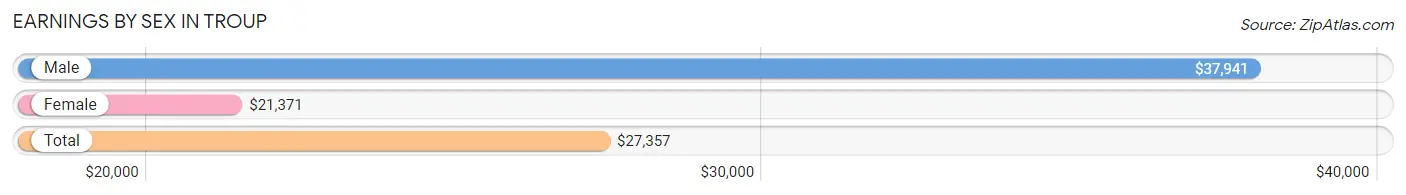
Earnings by Sex in Troup
Average Earnings in Troup are $27,357, $37,941 for men and $21,371 for women, a difference of 43.7%.
| Sex | Number | Average Earnings |
| Male | 444 (47.0%) | $37,941 |
| Female | 500 (53.0%) | $21,371 |
| Total | 944 (100.0%) | $27,357 |
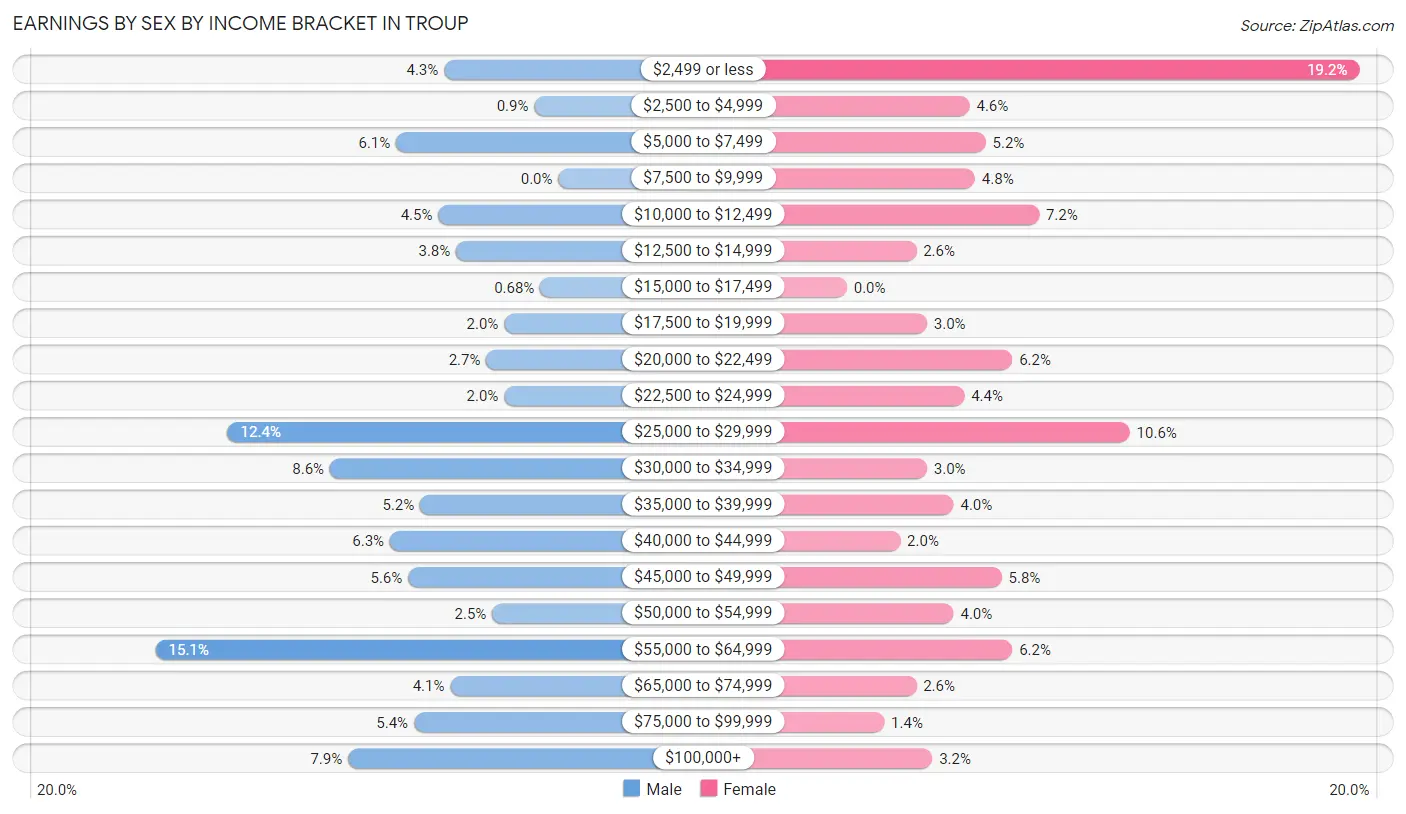
Earnings by Sex by Income Bracket in Troup
The most common earnings brackets in Troup are $55,000 to $64,999 for men (67 | 15.1%) and $2,499 or less for women (96 | 19.2%).
| Income | Male | Female |
| $2,499 or less | 19 (4.3%) | 96 (19.2%) |
| $2,500 to $4,999 | 4 (0.9%) | 23 (4.6%) |
| $5,000 to $7,499 | 27 (6.1%) | 26 (5.2%) |
| $7,500 to $9,999 | 0 (0.0%) | 24 (4.8%) |
| $10,000 to $12,499 | 20 (4.5%) | 36 (7.2%) |
| $12,500 to $14,999 | 17 (3.8%) | 13 (2.6%) |
| $15,000 to $17,499 | 3 (0.7%) | 0 (0.0%) |
| $17,500 to $19,999 | 9 (2.0%) | 15 (3.0%) |
| $20,000 to $22,499 | 12 (2.7%) | 31 (6.2%) |
| $22,500 to $24,999 | 9 (2.0%) | 22 (4.4%) |
| $25,000 to $29,999 | 55 (12.4%) | 53 (10.6%) |
| $30,000 to $34,999 | 38 (8.6%) | 15 (3.0%) |
| $35,000 to $39,999 | 23 (5.2%) | 20 (4.0%) |
| $40,000 to $44,999 | 28 (6.3%) | 10 (2.0%) |
| $45,000 to $49,999 | 25 (5.6%) | 29 (5.8%) |
| $50,000 to $54,999 | 11 (2.5%) | 20 (4.0%) |
| $55,000 to $64,999 | 67 (15.1%) | 31 (6.2%) |
| $65,000 to $74,999 | 18 (4.1%) | 13 (2.6%) |
| $75,000 to $99,999 | 24 (5.4%) | 7 (1.4%) |
| $100,000+ | 35 (7.9%) | 16 (3.2%) |
| Total | 444 (100.0%) | 500 (100.0%) |
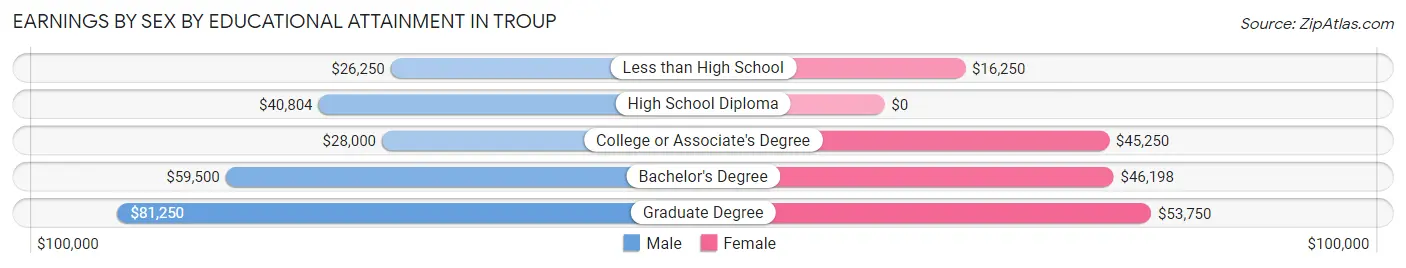
Earnings by Sex by Educational Attainment in Troup
Average earnings in Troup are $38,462 for men and $29,015 for women, a difference of 24.6%. Men with an educational attainment of graduate degree enjoy the highest average annual earnings of $81,250, while those with less than high school education earn the least with $26,250. Women with an educational attainment of graduate degree earn the most with the average annual earnings of $53,750, while those with less than high school education have the smallest earnings of $16,250.
| Educational Attainment | Male Income | Female Income |
| Less than High School | $26,250 | $16,250 |
| High School Diploma | $40,804 | $0 |
| College or Associate's Degree | $28,000 | $45,250 |
| Bachelor's Degree | $59,500 | $46,198 |
| Graduate Degree | $81,250 | $53,750 |
| Total | $38,462 | $29,015 |
Family Income in Troup
Family Income Brackets in Troup
According to the Troup family income data, there are 99 families falling into the $100,000 to $149,999 income range, which is the most common income bracket and makes up 20.3% of all families. Conversely, the $10,000 to $14,999 income bracket is the least frequent group with only 5 families (1.0%) belonging to this category.
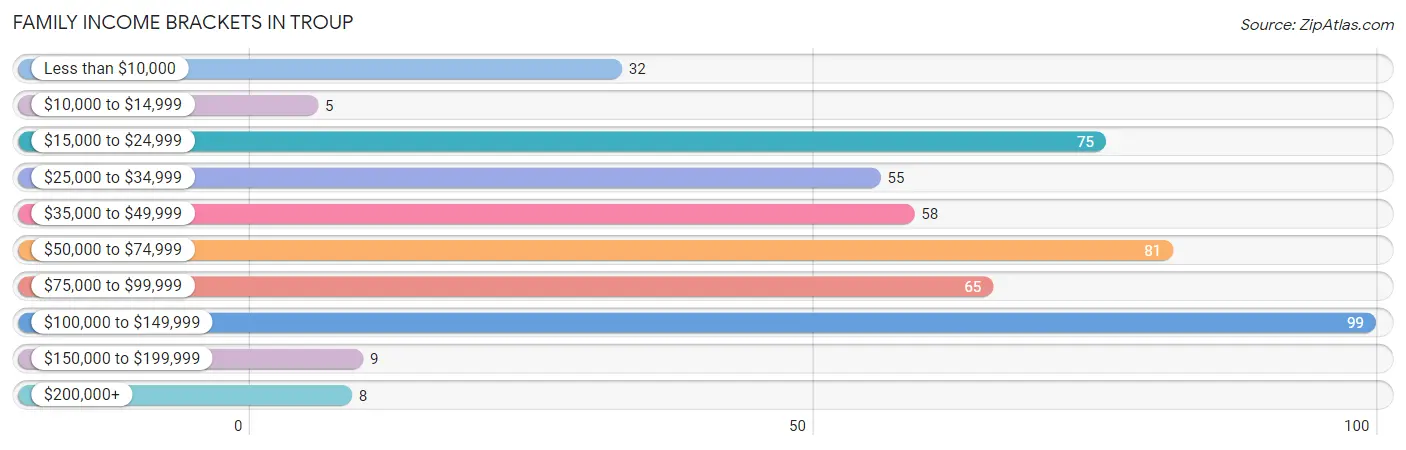
| Income Bracket | # Families | % Families |
| Less than $10,000 | 32 | 6.6% |
| $10,000 to $14,999 | 5 | 1.0% |
| $15,000 to $24,999 | 75 | 15.4% |
| $25,000 to $34,999 | 55 | 11.3% |
| $35,000 to $49,999 | 58 | 11.9% |
| $50,000 to $74,999 | 81 | 16.6% |
| $75,000 to $99,999 | 65 | 13.3% |
| $100,000 to $149,999 | 99 | 20.3% |
| $150,000 to $199,999 | 9 | 1.8% |
| $200,000+ | 8 | 1.6% |
Family Income by Famaliy Size in Troup
4-person families (127 | 26.1%) account for the highest median family income in Troup with $98,523 per family, while 4-person families (127 | 26.1%) have the highest median income of $24,631 per family member.
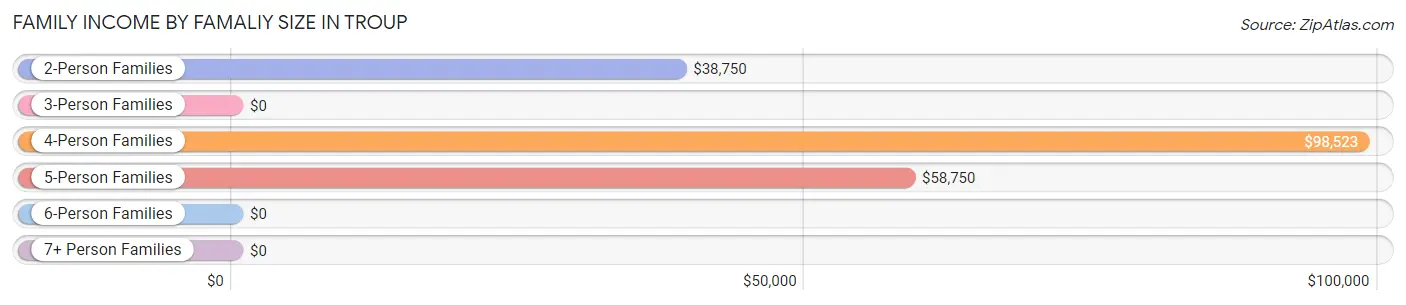
| Income Bracket | # Families | Median Income |
| 2-Person Families | 176 (36.1%) | $38,750 |
| 3-Person Families | 76 (15.6%) | $0 |
| 4-Person Families | 127 (26.1%) | $98,523 |
| 5-Person Families | 54 (11.1%) | $58,750 |
| 6-Person Families | 34 (7.0%) | $0 |
| 7+ Person Families | 20 (4.1%) | $0 |
| Total | 487 (100.0%) | $56,250 |
Family Income by Number of Earners in Troup
The median family income in Troup is $56,250, with families comprising 3+ earners (67) having the highest median family income of $123,750, while families with no earners (101) have the lowest median family income of $30,551, accounting for 13.8% and 20.7% of families, respectively.
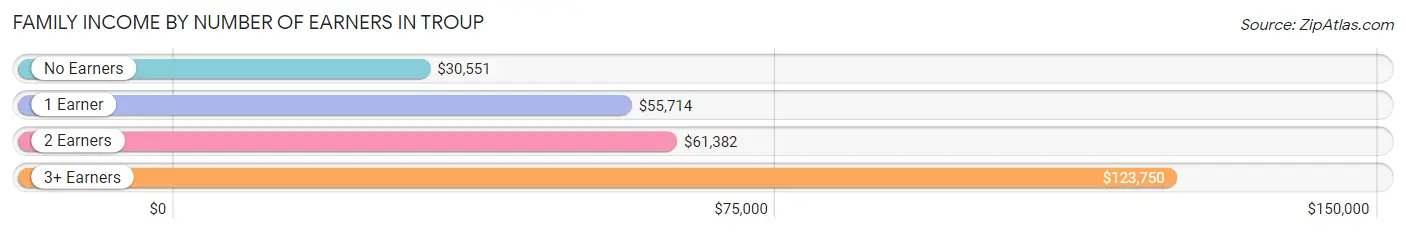
| Number of Earners | # Families | Median Income |
| No Earners | 101 (20.7%) | $30,551 |
| 1 Earner | 150 (30.8%) | $55,714 |
| 2 Earners | 169 (34.7%) | $61,382 |
| 3+ Earners | 67 (13.8%) | $123,750 |
| Total | 487 (100.0%) | $56,250 |
Household Income in Troup
Household Income Brackets in Troup
With 123 households falling in the category, the $50,000 to $74,999 income range is the most frequent in Troup, accounting for 17.8% of all households. In contrast, only 8 households (1.2%) fall into the $200,000+ income bracket, making it the least populous group.
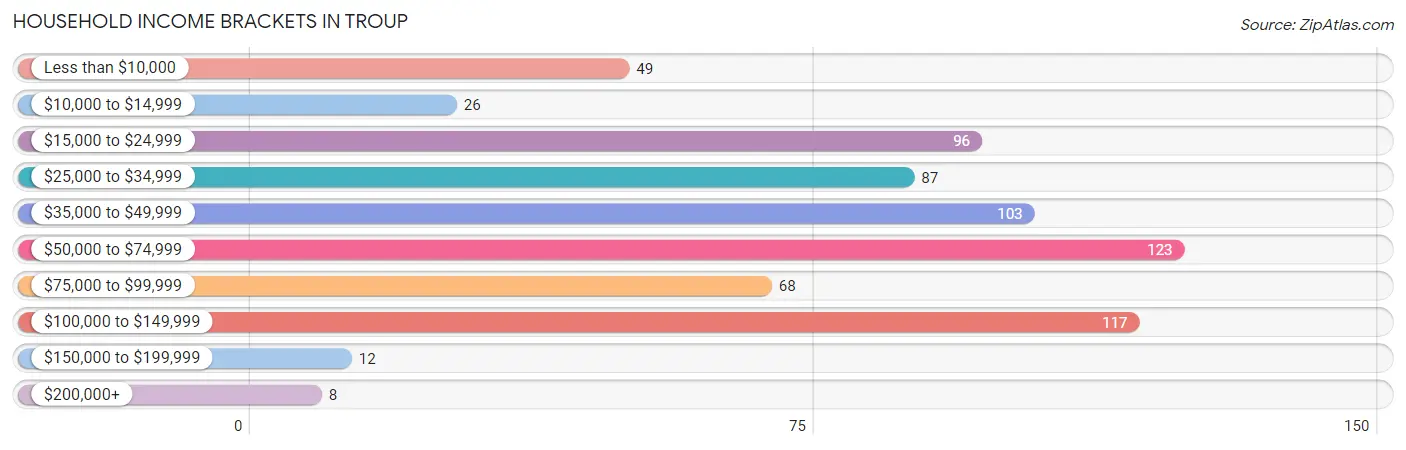
| Income Bracket | # Households | % Households |
| Less than $10,000 | 49 | 7.1% |
| $10,000 to $14,999 | 26 | 3.8% |
| $15,000 to $24,999 | 96 | 13.9% |
| $25,000 to $34,999 | 87 | 12.6% |
| $35,000 to $49,999 | 103 | 14.9% |
| $50,000 to $74,999 | 123 | 17.9% |
| $75,000 to $99,999 | 68 | 9.9% |
| $100,000 to $149,999 | 117 | 17.0% |
| $150,000 to $199,999 | 12 | 1.7% |
| $200,000+ | 8 | 1.2% |
Household Income by Householder Age in Troup
The median household income in Troup is $49,063, with the highest median household income of $52,250 found in the 25 to 44 years age bracket for the primary householder. A total of 246 households (35.7%) fall into this category. Meanwhile, the 15 to 24 years age bracket for the primary householder has the lowest median household income of $0, with 8 households (1.2%) in this group.
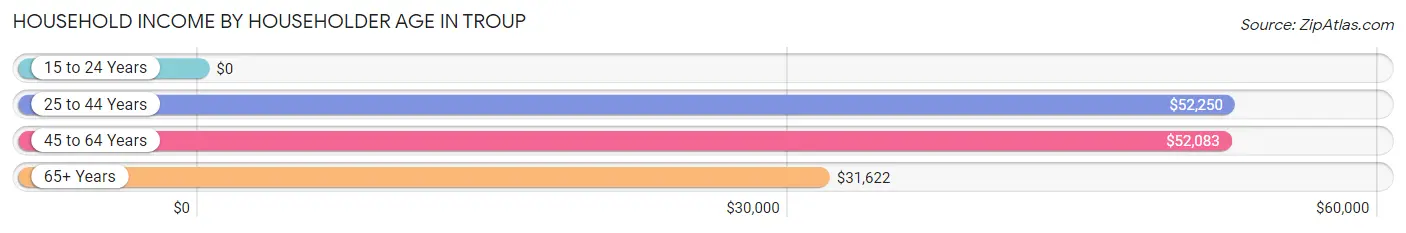
| Income Bracket | # Households | Median Income |
| 15 to 24 Years | 8 (1.2%) | $0 |
| 25 to 44 Years | 246 (35.7%) | $52,250 |
| 45 to 64 Years | 261 (37.9%) | $52,083 |
| 65+ Years | 174 (25.3%) | $31,622 |
| Total | 689 (100.0%) | $49,063 |
Poverty in Troup
Income Below Poverty by Sex and Age in Troup
With 24.7% poverty level for males and 38.8% for females among the residents of Troup, 18 to 24 year old males and 15 year old females are the most vulnerable to poverty, with 41 males (61.2%) and 12 females (100.0%) in their respective age groups living below the poverty level.
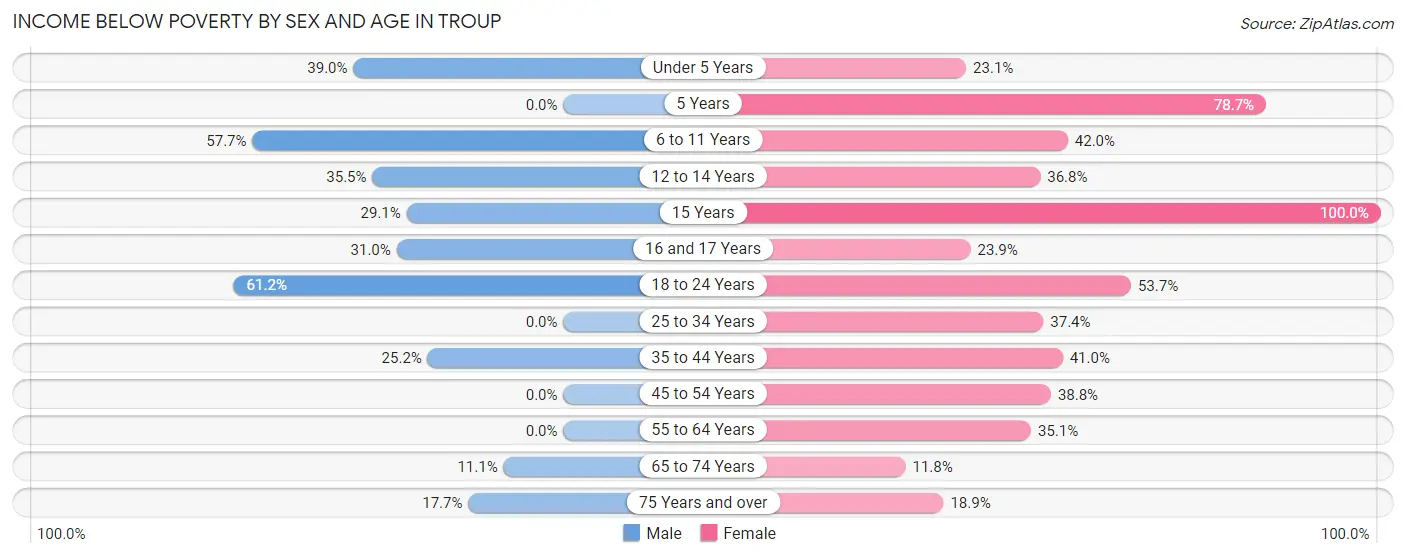
| Age Bracket | Male | Female |
| Under 5 Years | 23 (39.0%) | 6 (23.1%) |
| 5 Years | 0 (0.0%) | 37 (78.7%) |
| 6 to 11 Years | 71 (57.7%) | 47 (42.0%) |
| 12 to 14 Years | 39 (35.4%) | 28 (36.8%) |
| 15 Years | 16 (29.1%) | 12 (100.0%) |
| 16 and 17 Years | 13 (30.9%) | 11 (23.9%) |
| 18 to 24 Years | 41 (61.2%) | 73 (53.7%) |
| 25 to 34 Years | 0 (0.0%) | 55 (37.4%) |
| 35 to 44 Years | 34 (25.2%) | 73 (41.0%) |
| 45 to 54 Years | 0 (0.0%) | 33 (38.8%) |
| 55 to 64 Years | 0 (0.0%) | 39 (35.1%) |
| 65 to 74 Years | 10 (11.1%) | 11 (11.8%) |
| 75 Years and over | 6 (17.6%) | 10 (18.9%) |
| Total | 253 (24.7%) | 435 (38.8%) |
Income Above Poverty by Sex and Age in Troup
According to the poverty statistics in Troup, males aged 25 to 34 years and females aged 65 to 74 years are the age groups that are most secure financially, with 100.0% of males and 88.2% of females in these age groups living above the poverty line.
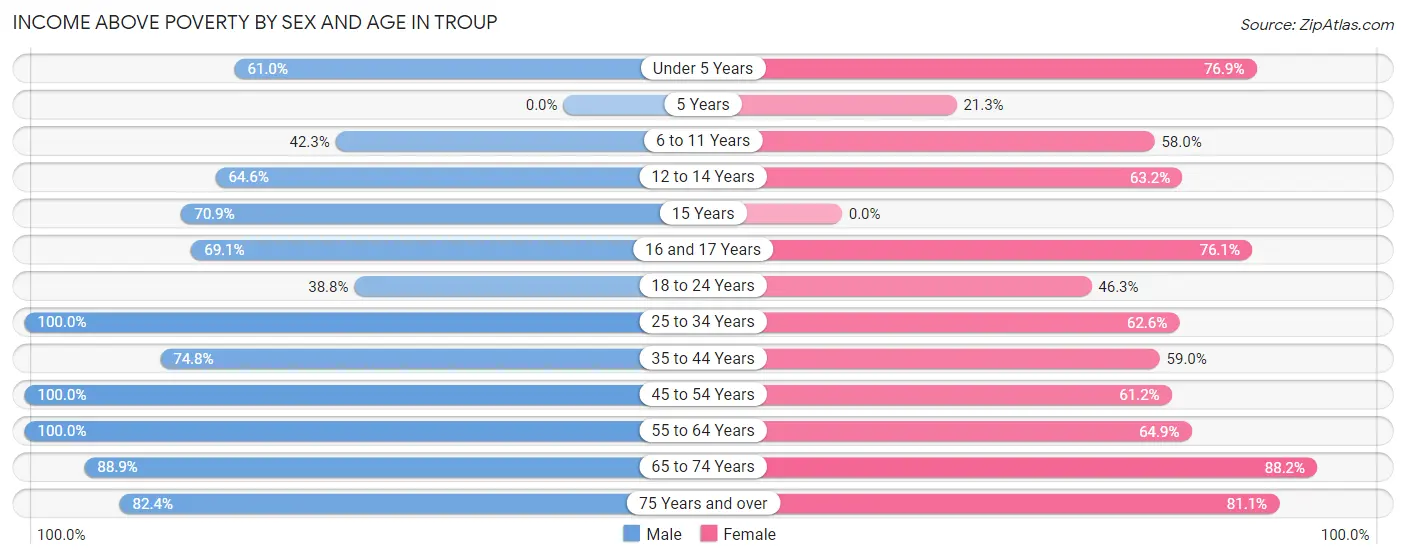
| Age Bracket | Male | Female |
| Under 5 Years | 36 (61.0%) | 20 (76.9%) |
| 5 Years | 0 (0.0%) | 10 (21.3%) |
| 6 to 11 Years | 52 (42.3%) | 65 (58.0%) |
| 12 to 14 Years | 71 (64.5%) | 48 (63.2%) |
| 15 Years | 39 (70.9%) | 0 (0.0%) |
| 16 and 17 Years | 29 (69.1%) | 35 (76.1%) |
| 18 to 24 Years | 26 (38.8%) | 63 (46.3%) |
| 25 to 34 Years | 138 (100.0%) | 92 (62.6%) |
| 35 to 44 Years | 101 (74.8%) | 105 (59.0%) |
| 45 to 54 Years | 85 (100.0%) | 52 (61.2%) |
| 55 to 64 Years | 88 (100.0%) | 72 (64.9%) |
| 65 to 74 Years | 80 (88.9%) | 82 (88.2%) |
| 75 Years and over | 28 (82.4%) | 43 (81.1%) |
| Total | 773 (75.3%) | 687 (61.2%) |
Income Below Poverty Among Married-Couple Families in Troup
The poverty statistics for married-couple families in Troup show that 8.1% or 24 of the total 296 families live below the poverty line. Families with 3 or 4 children have the highest poverty rate of 29.7%, comprising of 11 families. On the other hand, families with 1 or 2 children have the lowest poverty rate of 2.6%, which includes 3 families.
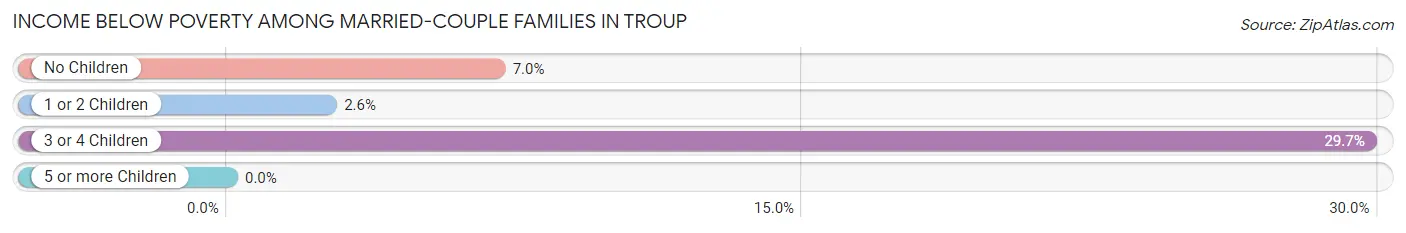
| Children | Above Poverty | Below Poverty |
| No Children | 133 (93.0%) | 10 (7.0%) |
| 1 or 2 Children | 113 (97.4%) | 3 (2.6%) |
| 3 or 4 Children | 26 (70.3%) | 11 (29.7%) |
| 5 or more Children | 0 (0.0%) | 0 (0.0%) |
| Total | 272 (91.9%) | 24 (8.1%) |
Income Below Poverty Among Single-Parent Households in Troup
According to the poverty data in Troup, 50.0% or 20 single-father households and 51.7% or 78 single-mother households are living below the poverty line. Among single-father households, those with 5 or more children have the highest poverty rate, with 20 households (100.0%) experiencing poverty. Likewise, among single-mother households, those with 3 or 4 children have the highest poverty rate, with 25 households (75.8%) falling below the poverty line.
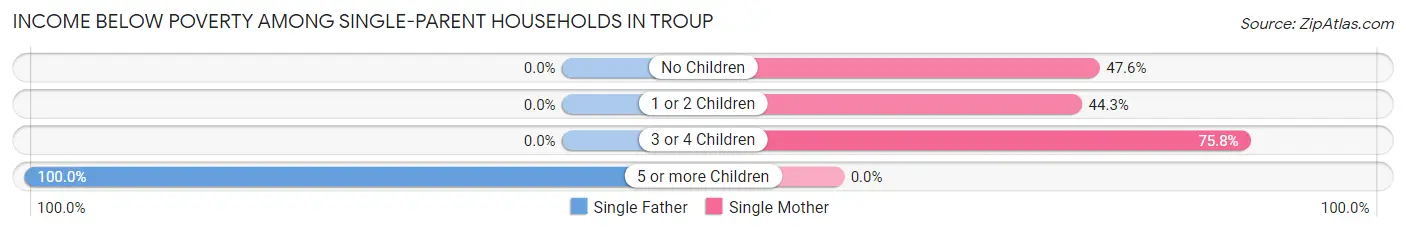
| Children | Single Father | Single Mother |
| No Children | 0 (0.0%) | 10 (47.6%) |
| 1 or 2 Children | 0 (0.0%) | 43 (44.3%) |
| 3 or 4 Children | 0 (0.0%) | 25 (75.8%) |
| 5 or more Children | 20 (100.0%) | 0 (0.0%) |
| Total | 20 (50.0%) | 78 (51.7%) |
Income Below Poverty Among Married-Couple vs Single-Parent Households in Troup
The poverty data for Troup shows that 24 of the married-couple family households (8.1%) and 98 of the single-parent households (51.3%) are living below the poverty level. Within the married-couple family households, those with 3 or 4 children have the highest poverty rate, with 11 households (29.7%) falling below the poverty line. Among the single-parent households, those with 5 or more children have the highest poverty rate, with 20 household (100.0%) living below poverty.
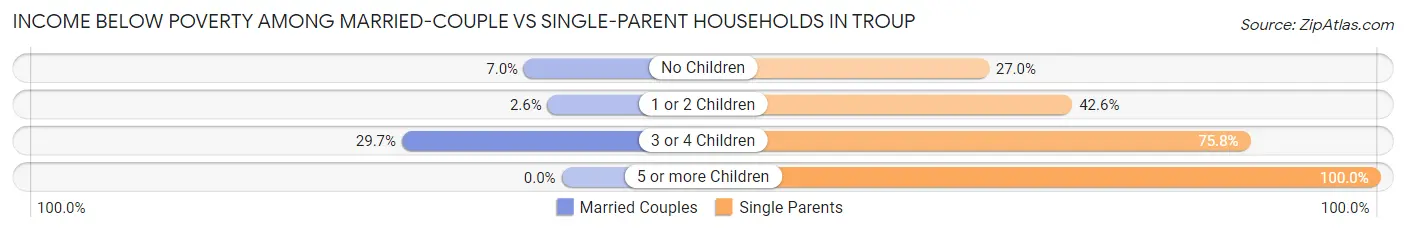
| Children | Married-Couple Families | Single-Parent Households |
| No Children | 10 (7.0%) | 10 (27.0%) |
| 1 or 2 Children | 3 (2.6%) | 43 (42.6%) |
| 3 or 4 Children | 11 (29.7%) | 25 (75.8%) |
| 5 or more Children | 0 (0.0%) | 20 (100.0%) |
| Total | 24 (8.1%) | 98 (51.3%) |
Race in Troup
The most populous races in Troup are White / Caucasian (1,419 | 66.1%), Hispanic or Latino (540 | 25.1%), and Black / African American (433 | 20.2%).
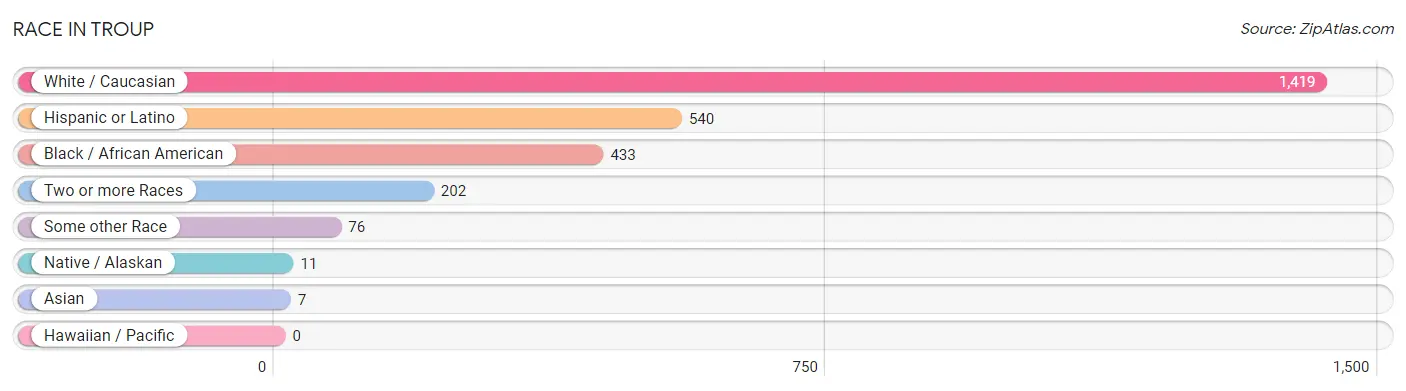
| Race | # Population | % Population |
| Asian | 7 | 0.3% |
| Black / African American | 433 | 20.2% |
| Hawaiian / Pacific | 0 | 0.0% |
| Hispanic or Latino | 540 | 25.1% |
| Native / Alaskan | 11 | 0.5% |
| White / Caucasian | 1,419 | 66.1% |
| Two or more Races | 202 | 9.4% |
| Some other Race | 76 | 3.5% |
| Total | 2,148 | 100.0% |
Ancestry in Troup
The most populous ancestries reported in Troup are Mexican (494 | 23.0%), American (270 | 12.6%), Irish (155 | 7.2%), German (104 | 4.8%), and English (103 | 4.8%), together accounting for 52.4% of all Troup residents.
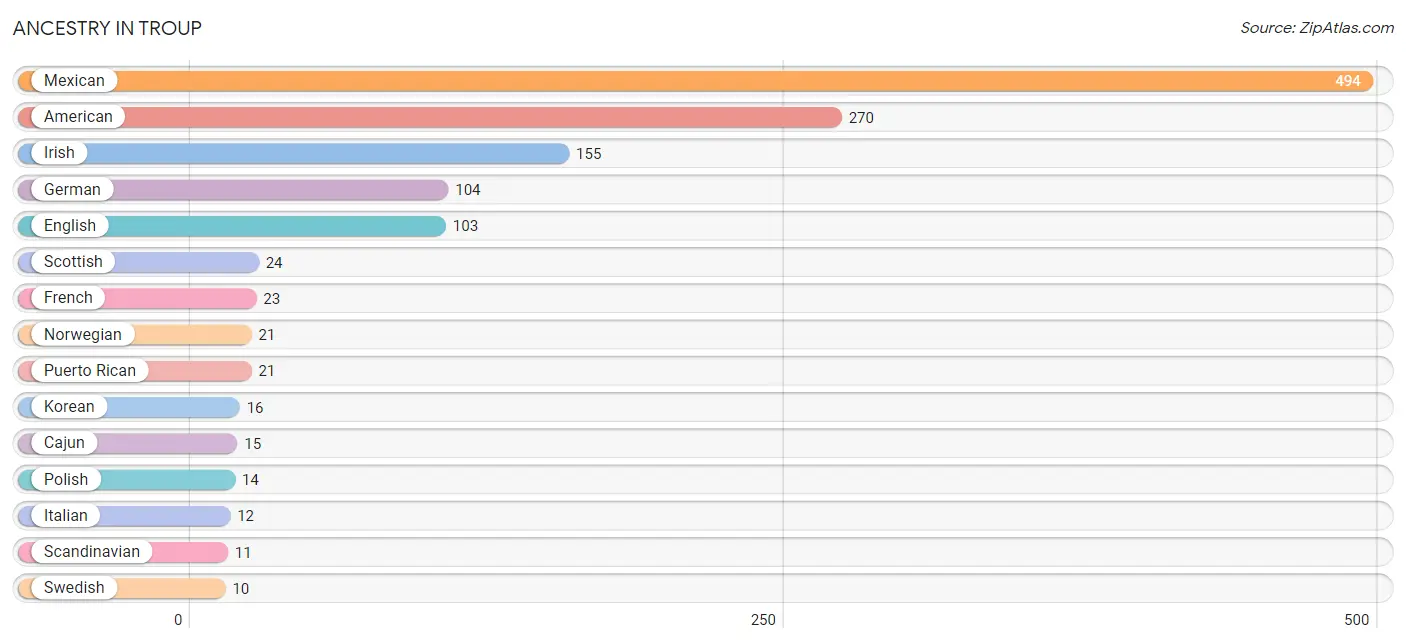
| Ancestry | # Population | % Population |
| American | 270 | 12.6% |
| Cajun | 15 | 0.7% |
| Central American | 4 | 0.2% |
| Central American Indian | 4 | 0.2% |
| Cherokee | 3 | 0.1% |
| Chickasaw | 5 | 0.2% |
| Choctaw | 3 | 0.1% |
| English | 103 | 4.8% |
| European | 3 | 0.1% |
| Finnish | 3 | 0.1% |
| French | 23 | 1.1% |
| French Canadian | 3 | 0.1% |
| German | 104 | 4.8% |
| Guatemalan | 4 | 0.2% |
| Irish | 155 | 7.2% |
| Italian | 12 | 0.6% |
| Korean | 16 | 0.7% |
| Mexican | 494 | 23.0% |
| Nigerian | 3 | 0.1% |
| Norwegian | 21 | 1.0% |
| Polish | 14 | 0.6% |
| Puerto Rican | 21 | 1.0% |
| Scandinavian | 11 | 0.5% |
| Scottish | 24 | 1.1% |
| Subsaharan African | 3 | 0.1% |
| Swedish | 10 | 0.5% |
| Welsh | 9 | 0.4% | View All 27 Rows |
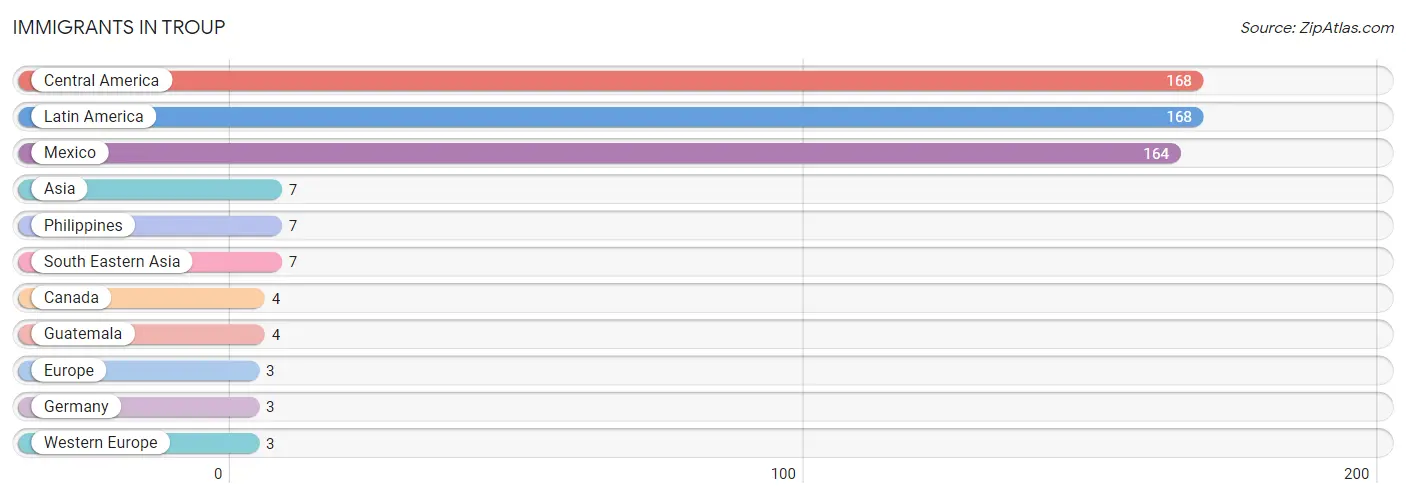
Immigrants in Troup
The most numerous immigrant groups reported in Troup came from Central America (168 | 7.8%), Latin America (168 | 7.8%), Mexico (164 | 7.6%), Asia (7 | 0.3%), and Philippines (7 | 0.3%), together accounting for 23.9% of all Troup residents.
| Immigration Origin | # Population | % Population |
| Asia | 7 | 0.3% |
| Canada | 4 | 0.2% |
| Central America | 168 | 7.8% |
| Europe | 3 | 0.1% |
| Germany | 3 | 0.1% |
| Guatemala | 4 | 0.2% |
| Latin America | 168 | 7.8% |
| Mexico | 164 | 7.6% |
| Philippines | 7 | 0.3% |
| South Eastern Asia | 7 | 0.3% |
| Western Europe | 3 | 0.1% | View All 11 Rows |
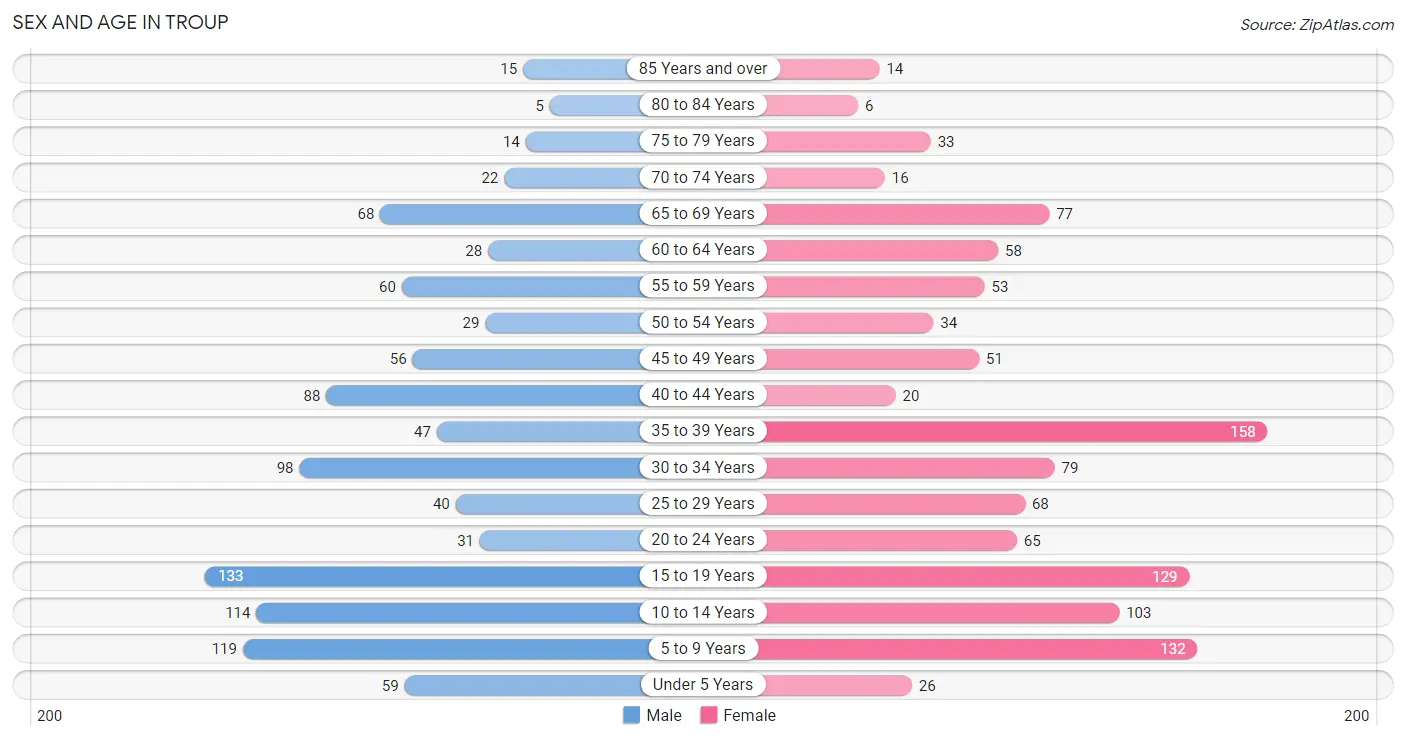
Sex and Age in Troup
Sex and Age in Troup
The most populous age groups in Troup are 15 to 19 Years (133 | 13.0%) for men and 35 to 39 Years (158 | 14.1%) for women.
| Age Bracket | Male | Female |
| Under 5 Years | 59 (5.8%) | 26 (2.3%) |
| 5 to 9 Years | 119 (11.6%) | 132 (11.8%) |
| 10 to 14 Years | 114 (11.1%) | 103 (9.2%) |
| 15 to 19 Years | 133 (13.0%) | 129 (11.5%) |
| 20 to 24 Years | 31 (3.0%) | 65 (5.8%) |
| 25 to 29 Years | 40 (3.9%) | 68 (6.1%) |
| 30 to 34 Years | 98 (9.6%) | 79 (7.0%) |
| 35 to 39 Years | 47 (4.6%) | 158 (14.1%) |
| 40 to 44 Years | 88 (8.6%) | 20 (1.8%) |
| 45 to 49 Years | 56 (5.5%) | 51 (4.5%) |
| 50 to 54 Years | 29 (2.8%) | 34 (3.0%) |
| 55 to 59 Years | 60 (5.9%) | 53 (4.7%) |
| 60 to 64 Years | 28 (2.7%) | 58 (5.2%) |
| 65 to 69 Years | 68 (6.6%) | 77 (6.9%) |
| 70 to 74 Years | 22 (2.1%) | 16 (1.4%) |
| 75 to 79 Years | 14 (1.4%) | 33 (2.9%) |
| 80 to 84 Years | 5 (0.5%) | 6 (0.5%) |
| 85 Years and over | 15 (1.5%) | 14 (1.3%) |
| Total | 1,026 (100.0%) | 1,122 (100.0%) |
Families and Households in Troup
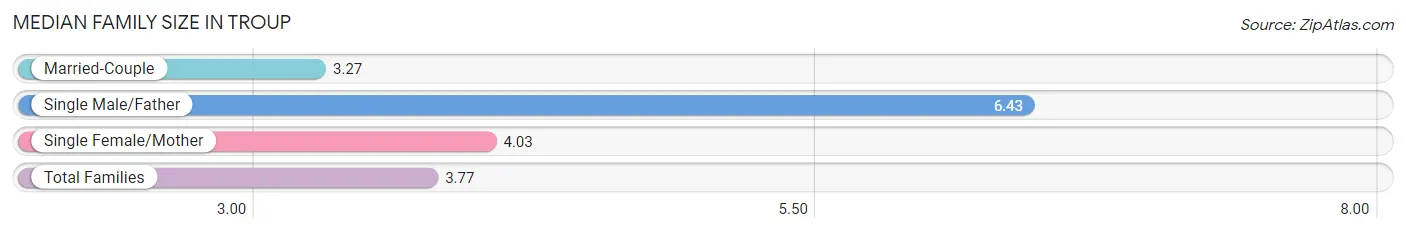
Median Family Size in Troup
The median family size in Troup is 3.77 persons per family, with single male/father families (40 | 8.2%) accounting for the largest median family size of 6.43 persons per family. On the other hand, married-couple families (296 | 60.8%) represent the smallest median family size with 3.27 persons per family.
| Family Type | # Families | Family Size |
| Married-Couple | 296 (60.8%) | 3.27 |
| Single Male/Father | 40 (8.2%) | 6.43 |
| Single Female/Mother | 151 (31.0%) | 4.03 |
| Total Families | 487 (100.0%) | 3.77 |
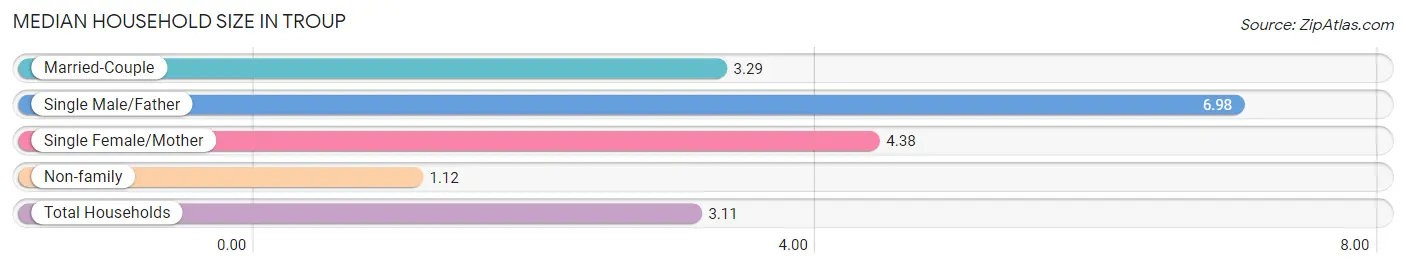
Median Household Size in Troup
The median household size in Troup is 3.11 persons per household, with single male/father households (40 | 5.8%) accounting for the largest median household size of 6.98 persons per household. non-family households (202 | 29.3%) represent the smallest median household size with 1.12 persons per household.
| Household Type | # Households | Household Size |
| Married-Couple | 296 (43.0%) | 3.29 |
| Single Male/Father | 40 (5.8%) | 6.98 |
| Single Female/Mother | 151 (21.9%) | 4.38 |
| Non-family | 202 (29.3%) | 1.12 |
| Total Households | 689 (100.0%) | 3.11 |
Household Size by Marriage Status in Troup
Out of a total of 689 households in Troup, 487 (70.7%) are family households, while 202 (29.3%) are nonfamily households. The most numerous type of family households are 2-person households, comprising 172, and the most common type of nonfamily households are 1-person households, comprising 177.
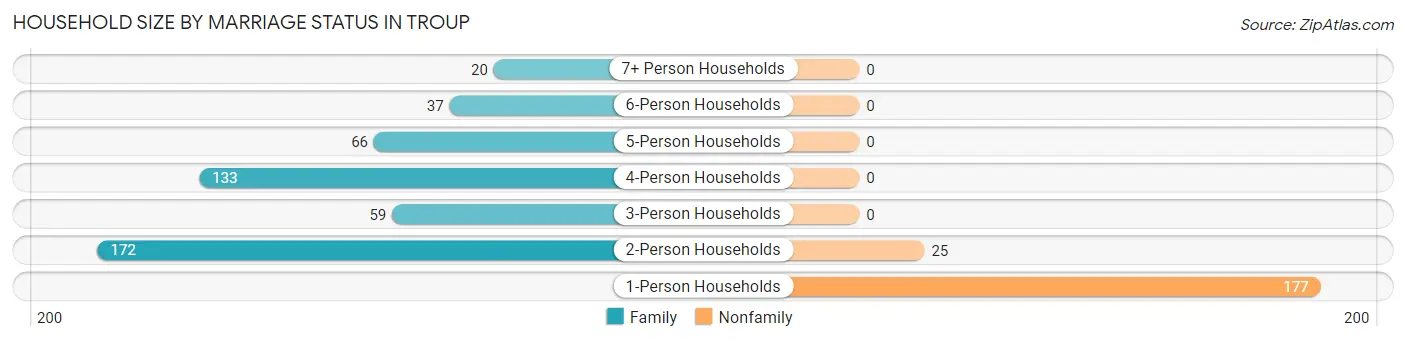
| Household Size | Family Households | Nonfamily Households |
| 1-Person Households | - | 177 (25.7%) |
| 2-Person Households | 172 (25.0%) | 25 (3.6%) |
| 3-Person Households | 59 (8.6%) | 0 (0.0%) |
| 4-Person Households | 133 (19.3%) | 0 (0.0%) |
| 5-Person Households | 66 (9.6%) | 0 (0.0%) |
| 6-Person Households | 37 (5.4%) | 0 (0.0%) |
| 7+ Person Households | 20 (2.9%) | 0 (0.0%) |
| Total | 487 (70.7%) | 202 (29.3%) |
Female Fertility in Troup
Fertility by Age in Troup
Average fertility rate in Troup is 66.0 births per 1,000 women. Women in the age bracket of 20 to 34 years have the highest fertility rate with 123.0 births per 1,000 women. Women in the age bracket of 20 to 34 years acount for 68.4% of all women with births.
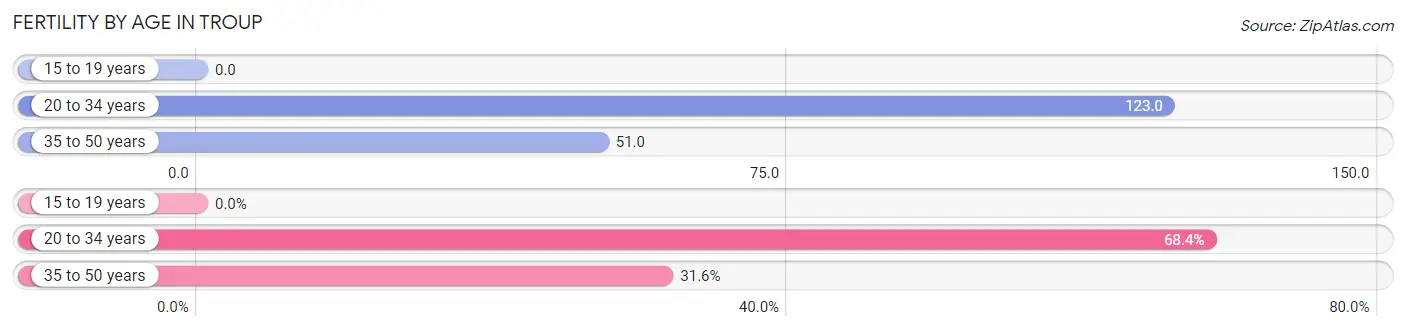
| Age Bracket | Women with Births | Births / 1,000 Women |
| 15 to 19 years | 0 (0.0%) | 0.0 |
| 20 to 34 years | 26 (68.4%) | 123.0 |
| 35 to 50 years | 12 (31.6%) | 51.0 |
| Total | 38 (100.0%) | 66.0 |
Fertility by Age by Marriage Status in Troup
60.5% of women with births (38) in Troup are married. The highest percentage of unmarried women with births falls into 20 to 34 years age bracket with 57.7% of them unmarried at the time of birth, while the lowest percentage of unmarried women with births belong to 35 to 50 years age bracket with 0.0% of them unmarried.
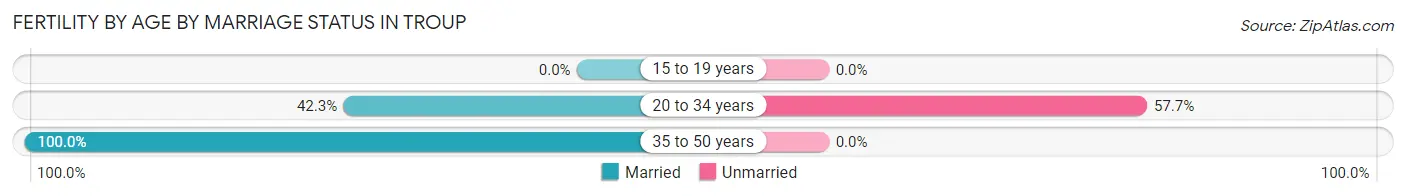
| Age Bracket | Married | Unmarried |
| 15 to 19 years | 0 (0.0%) | 0 (0.0%) |
| 20 to 34 years | 11 (42.3%) | 15 (57.7%) |
| 35 to 50 years | 12 (100.0%) | 0 (0.0%) |
| Total | 23 (60.5%) | 15 (39.5%) |
Fertility by Education in Troup
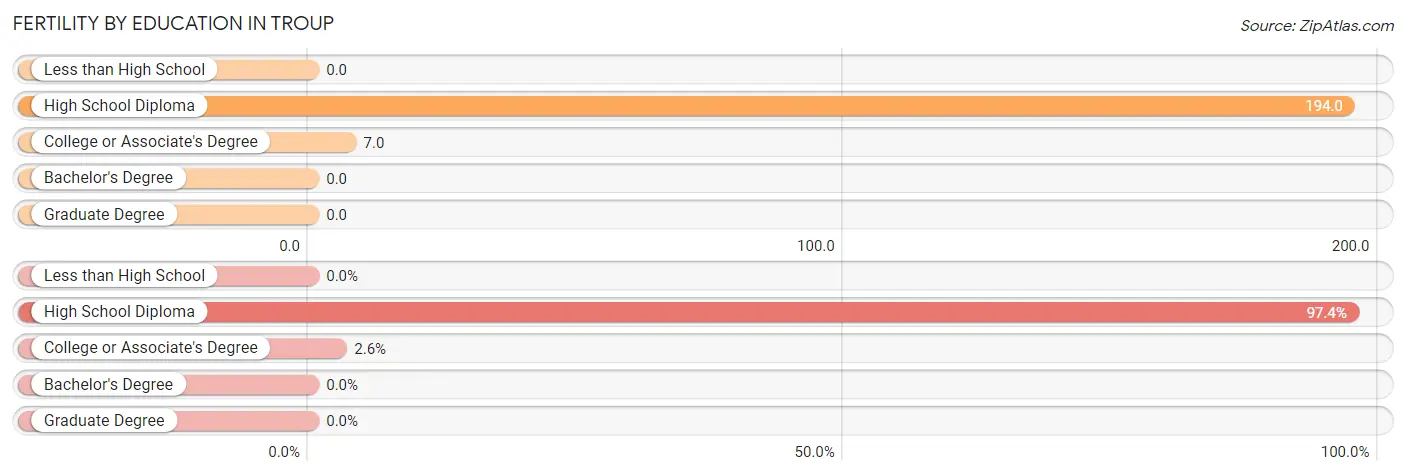
| Educational Attainment | Women with Births | Births / 1,000 Women |
| Less than High School | 0 (0.0%) | 0.0 |
| High School Diploma | 37 (97.4%) | 194.0 |
| College or Associate's Degree | 1 (2.6%) | 7.0 |
| Bachelor's Degree | 0 (0.0%) | 0.0 |
| Graduate Degree | 0 (0.0%) | 0.0 |
| Total | 38 (100.0%) | 66.0 |
Fertility by Education by Marriage Status in Troup
39.5% of women with births in Troup are unmarried. Women with the educational attainment of college or associate's degree are most likely to be married with 100.0% of them married at childbirth, while women with the educational attainment of high school diploma are least likely to be married with 40.5% of them unmarried at childbirth.
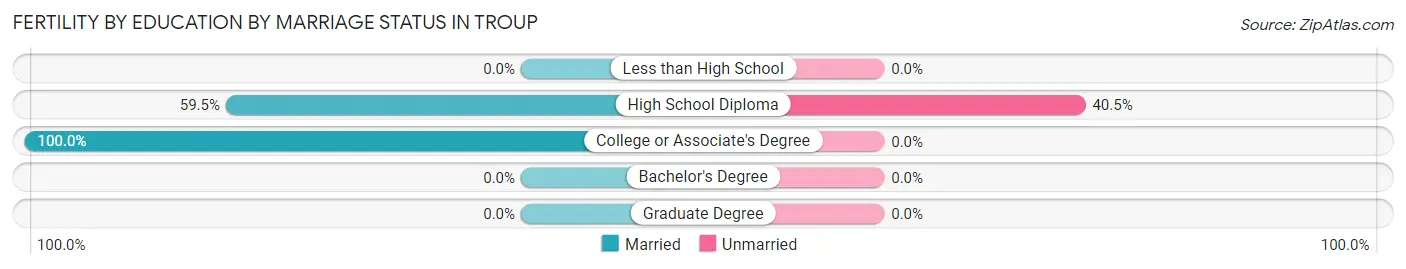
| Educational Attainment | Married | Unmarried |
| Less than High School | 0 (0.0%) | 0 (0.0%) |
| High School Diploma | 22 (59.5%) | 15 (40.5%) |
| College or Associate's Degree | 1 (100.0%) | 0 (0.0%) |
| Bachelor's Degree | 0 (0.0%) | 0 (0.0%) |
| Graduate Degree | 0 (0.0%) | 0 (0.0%) |
| Total | 23 (60.5%) | 15 (39.5%) |
Employment Characteristics in Troup
Employment by Class of Employer in Troup
Among the 762 employed individuals in Troup, private company employees (521 | 68.4%), local government employees (96 | 12.6%), and state government employees (57 | 7.5%) make up the most common classes of employment.
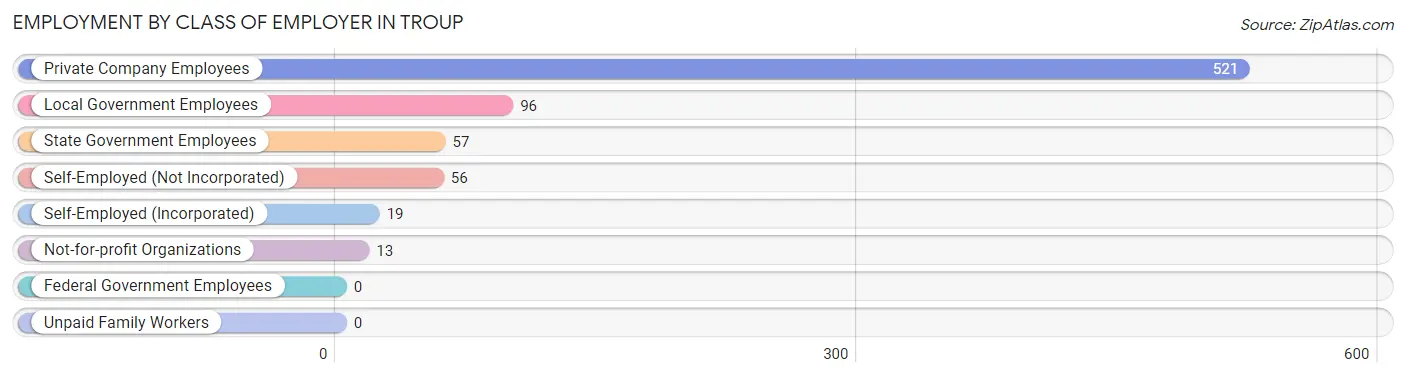
| Employer Class | # Employees | % Employees |
| Private Company Employees | 521 | 68.4% |
| Self-Employed (Incorporated) | 19 | 2.5% |
| Self-Employed (Not Incorporated) | 56 | 7.3% |
| Not-for-profit Organizations | 13 | 1.7% |
| Local Government Employees | 96 | 12.6% |
| State Government Employees | 57 | 7.5% |
| Federal Government Employees | 0 | 0.0% |
| Unpaid Family Workers | 0 | 0.0% |
| Total | 762 | 100.0% |
Employment Status by Age in Troup
According to the labor force statistics for Troup, out of the total population over 16 years of age (1,528), 63.4% or 969 individuals are in the labor force, with 18.5% or 179 of them unemployed. The age group with the highest labor force participation rate is 45 to 54 years, with 87.6% or 149 individuals in the labor force. Within the labor force, the 16 to 19 years age range has the highest percentage of unemployed individuals, with 46.2% or 55 of them being unemployed.
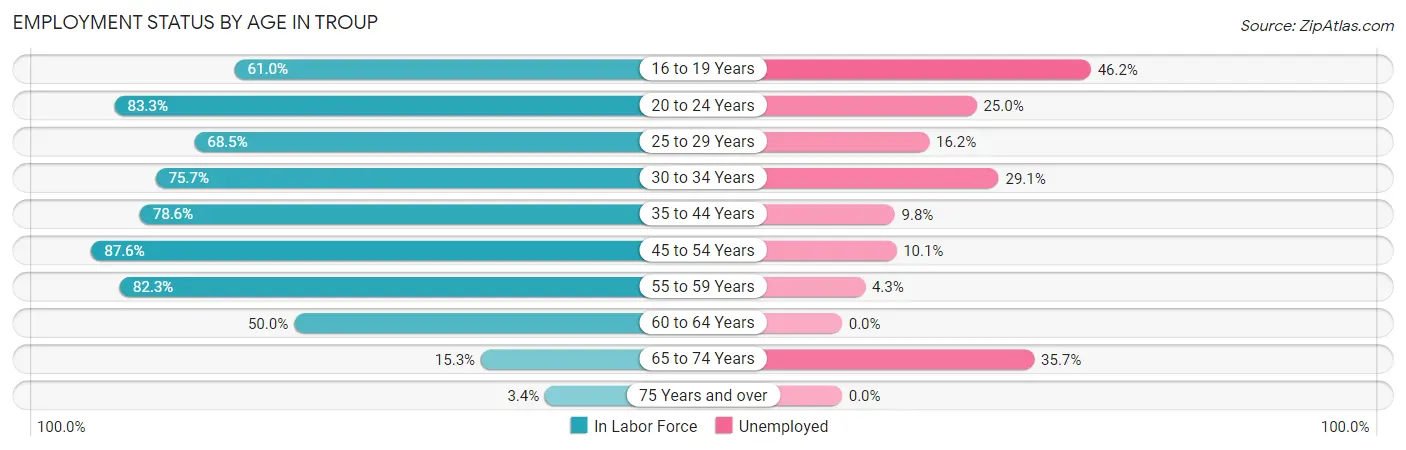
| Age Bracket | In Labor Force | Unemployed |
| 16 to 19 Years | 119 (61.0%) | 55 (46.2%) |
| 20 to 24 Years | 80 (83.3%) | 20 (25.0%) |
| 25 to 29 Years | 74 (68.5%) | 12 (16.2%) |
| 30 to 34 Years | 134 (75.7%) | 39 (29.1%) |
| 35 to 44 Years | 246 (78.6%) | 24 (9.8%) |
| 45 to 54 Years | 149 (87.6%) | 15 (10.1%) |
| 55 to 59 Years | 93 (82.3%) | 4 (4.3%) |
| 60 to 64 Years | 43 (50.0%) | 0 (0.0%) |
| 65 to 74 Years | 28 (15.3%) | 10 (35.7%) |
| 75 Years and over | 3 (3.4%) | 0 (0.0%) |
| Total | 969 (63.4%) | 179 (18.5%) |
Employment Status by Educational Attainment in Troup
According to labor force statistics for Troup, 76.4% of individuals (739) out of the total population between 25 and 64 years of age (967) are in the labor force, with 12.7% or 94 of them being unemployed. The group with the highest labor force participation rate are those with the educational attainment of bachelor's degree or higher, with 98.6% or 217 individuals in the labor force. Within the labor force, individuals with college / associate degree education have the highest percentage of unemployment, with 18.6% or 35 of them being unemployed.
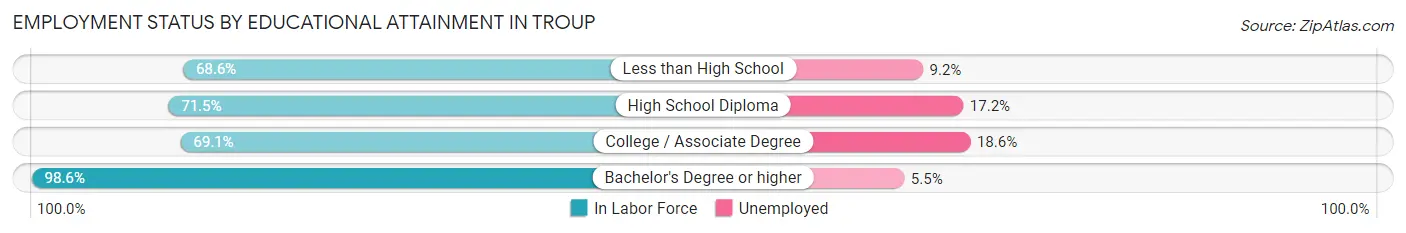
| Educational Attainment | In Labor Force | Unemployed |
| Less than High School | 131 (68.6%) | 18 (9.2%) |
| High School Diploma | 203 (71.5%) | 49 (17.2%) |
| College / Associate Degree | 188 (69.1%) | 51 (18.6%) |
| Bachelor's Degree or higher | 217 (98.6%) | 12 (5.5%) |
| Total | 739 (76.4%) | 123 (12.7%) |
Employment Occupations by Sex in Troup
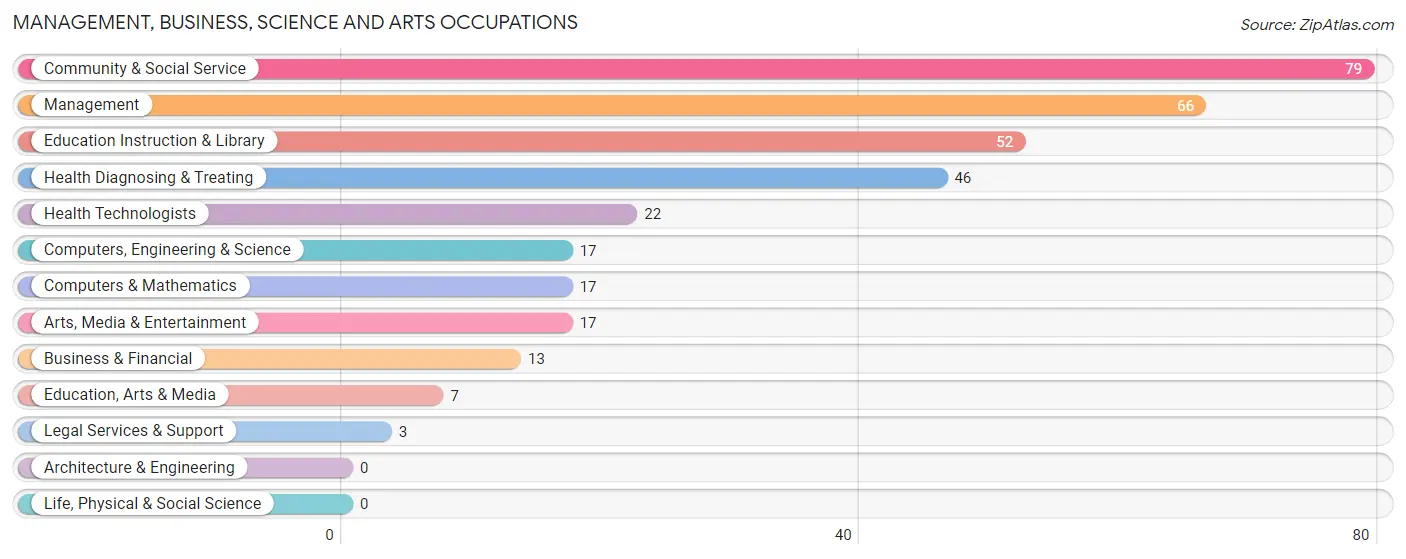
Management, Business, Science and Arts Occupations
The most common Management, Business, Science and Arts occupations in Troup are Community & Social Service (79 | 10.0%), Management (66 | 8.4%), Education Instruction & Library (52 | 6.6%), Health Diagnosing & Treating (46 | 5.8%), and Health Technologists (22 | 2.8%).
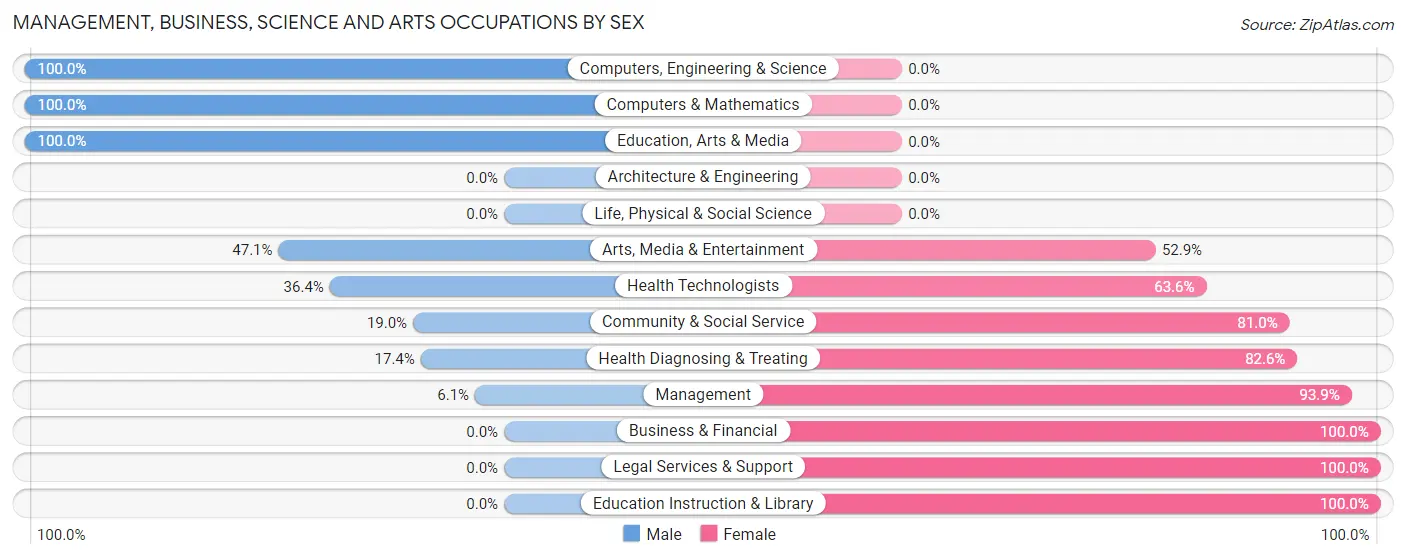
Management, Business, Science and Arts Occupations by Sex
Within the Management, Business, Science and Arts occupations in Troup, the most male-oriented occupations are Computers, Engineering & Science (100.0%), Computers & Mathematics (100.0%), and Education, Arts & Media (100.0%), while the most female-oriented occupations are Business & Financial (100.0%), Legal Services & Support (100.0%), and Education Instruction & Library (100.0%).
| Occupation | Male | Female |
| Management | 4 (6.1%) | 62 (93.9%) |
| Business & Financial | 0 (0.0%) | 13 (100.0%) |
| Computers, Engineering & Science | 17 (100.0%) | 0 (0.0%) |
| Computers & Mathematics | 17 (100.0%) | 0 (0.0%) |
| Architecture & Engineering | 0 (0.0%) | 0 (0.0%) |
| Life, Physical & Social Science | 0 (0.0%) | 0 (0.0%) |
| Community & Social Service | 15 (19.0%) | 64 (81.0%) |
| Education, Arts & Media | 7 (100.0%) | 0 (0.0%) |
| Legal Services & Support | 0 (0.0%) | 3 (100.0%) |
| Education Instruction & Library | 0 (0.0%) | 52 (100.0%) |
| Arts, Media & Entertainment | 8 (47.1%) | 9 (52.9%) |
| Health Diagnosing & Treating | 8 (17.4%) | 38 (82.6%) |
| Health Technologists | 8 (36.4%) | 14 (63.6%) |
| Total (Category) | 44 (19.9%) | 177 (80.1%) |
| Total (Overall) | 375 (47.5%) | 415 (52.5%) |
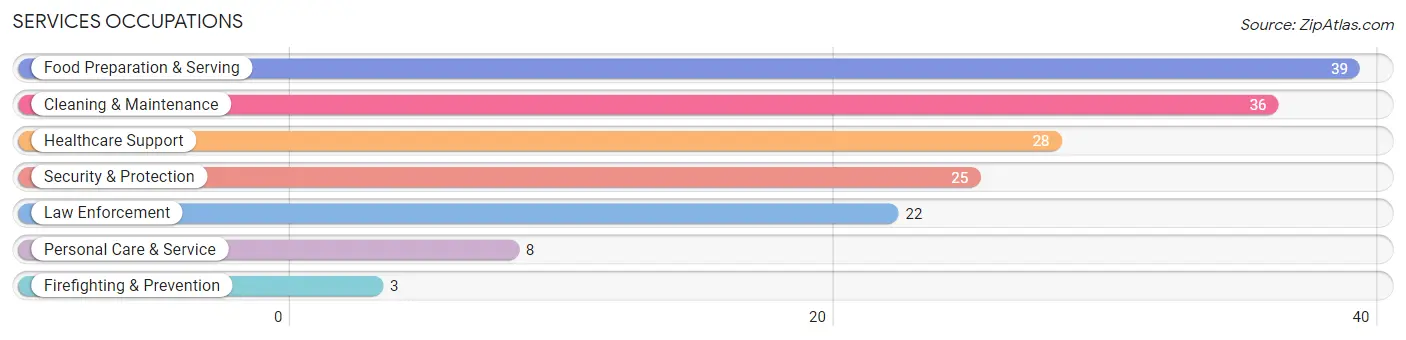
Services Occupations
The most common Services occupations in Troup are Food Preparation & Serving (39 | 4.9%), Cleaning & Maintenance (36 | 4.6%), Healthcare Support (28 | 3.5%), Security & Protection (25 | 3.2%), and Law Enforcement (22 | 2.8%).
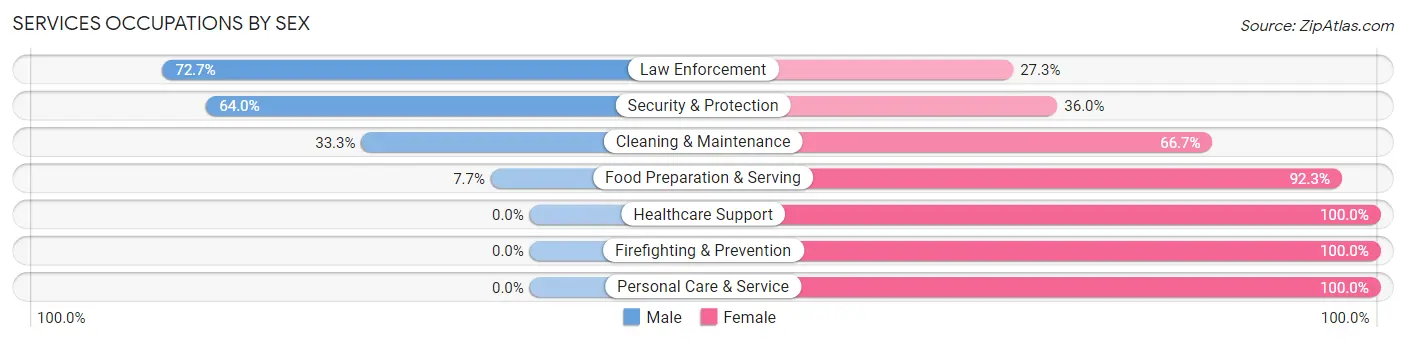
Services Occupations by Sex
Within the Services occupations in Troup, the most male-oriented occupations are Law Enforcement (72.7%), Security & Protection (64.0%), and Cleaning & Maintenance (33.3%), while the most female-oriented occupations are Healthcare Support (100.0%), Firefighting & Prevention (100.0%), and Personal Care & Service (100.0%).
| Occupation | Male | Female |
| Healthcare Support | 0 (0.0%) | 28 (100.0%) |
| Security & Protection | 16 (64.0%) | 9 (36.0%) |
| Firefighting & Prevention | 0 (0.0%) | 3 (100.0%) |
| Law Enforcement | 16 (72.7%) | 6 (27.3%) |
| Food Preparation & Serving | 3 (7.7%) | 36 (92.3%) |
| Cleaning & Maintenance | 12 (33.3%) | 24 (66.7%) |
| Personal Care & Service | 0 (0.0%) | 8 (100.0%) |
| Total (Category) | 31 (22.8%) | 105 (77.2%) |
| Total (Overall) | 375 (47.5%) | 415 (52.5%) |
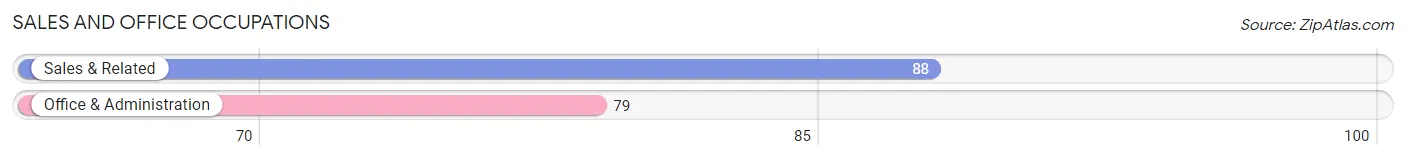
Sales and Office Occupations
The most common Sales and Office occupations in Troup are Sales & Related (88 | 11.1%), and Office & Administration (79 | 10.0%).
Sales and Office Occupations by Sex
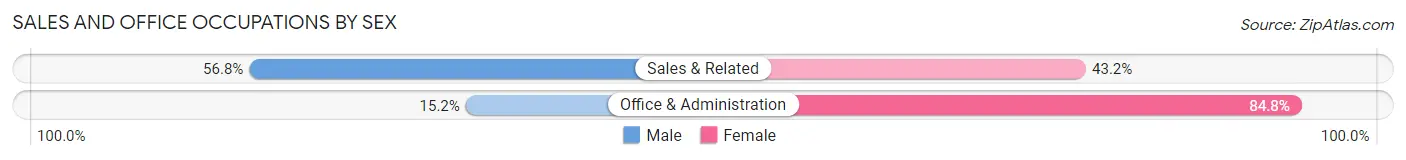
| Occupation | Male | Female |
| Sales & Related | 50 (56.8%) | 38 (43.2%) |
| Office & Administration | 12 (15.2%) | 67 (84.8%) |
| Total (Category) | 62 (37.1%) | 105 (62.9%) |
| Total (Overall) | 375 (47.5%) | 415 (52.5%) |
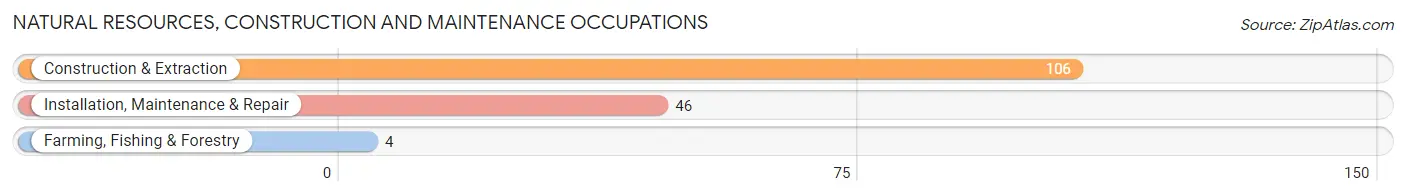
Natural Resources, Construction and Maintenance Occupations
The most common Natural Resources, Construction and Maintenance occupations in Troup are Construction & Extraction (106 | 13.4%), Installation, Maintenance & Repair (46 | 5.8%), and Farming, Fishing & Forestry (4 | 0.5%).
Natural Resources, Construction and Maintenance Occupations by Sex
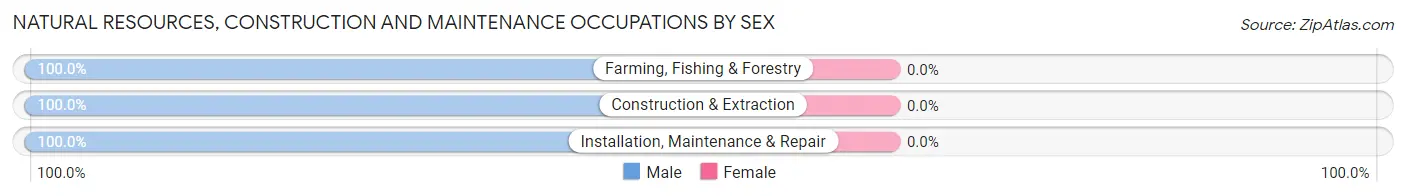
| Occupation | Male | Female |
| Farming, Fishing & Forestry | 4 (100.0%) | 0 (0.0%) |
| Construction & Extraction | 106 (100.0%) | 0 (0.0%) |
| Installation, Maintenance & Repair | 46 (100.0%) | 0 (0.0%) |
| Total (Category) | 156 (100.0%) | 0 (0.0%) |
| Total (Overall) | 375 (47.5%) | 415 (52.5%) |
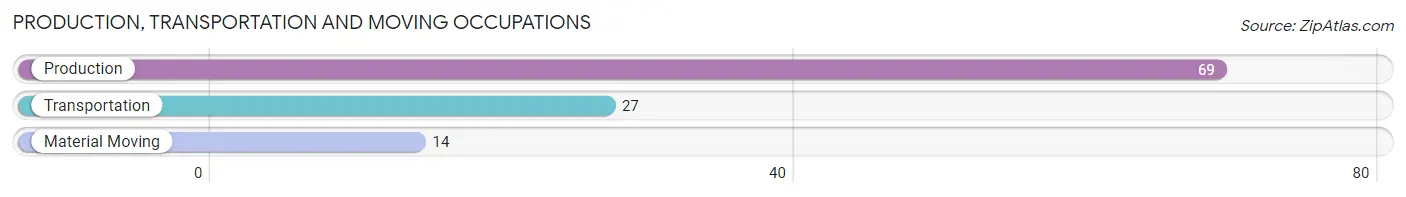
Production, Transportation and Moving Occupations
The most common Production, Transportation and Moving occupations in Troup are Production (69 | 8.7%), Transportation (27 | 3.4%), and Material Moving (14 | 1.8%).
Production, Transportation and Moving Occupations by Sex
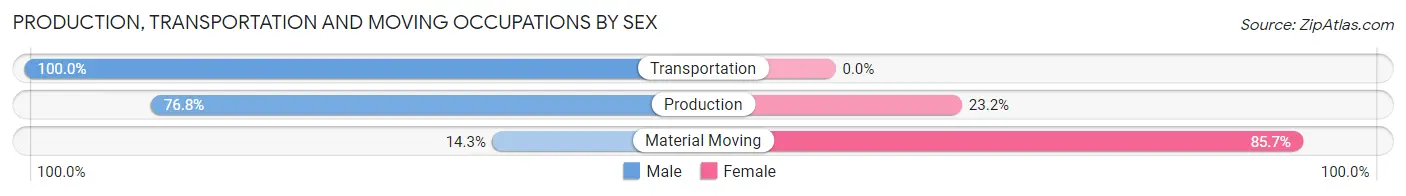
| Occupation | Male | Female |
| Production | 53 (76.8%) | 16 (23.2%) |
| Transportation | 27 (100.0%) | 0 (0.0%) |
| Material Moving | 2 (14.3%) | 12 (85.7%) |
| Total (Category) | 82 (74.6%) | 28 (25.5%) |
| Total (Overall) | 375 (47.5%) | 415 (52.5%) |
Employment Industries by Sex in Troup
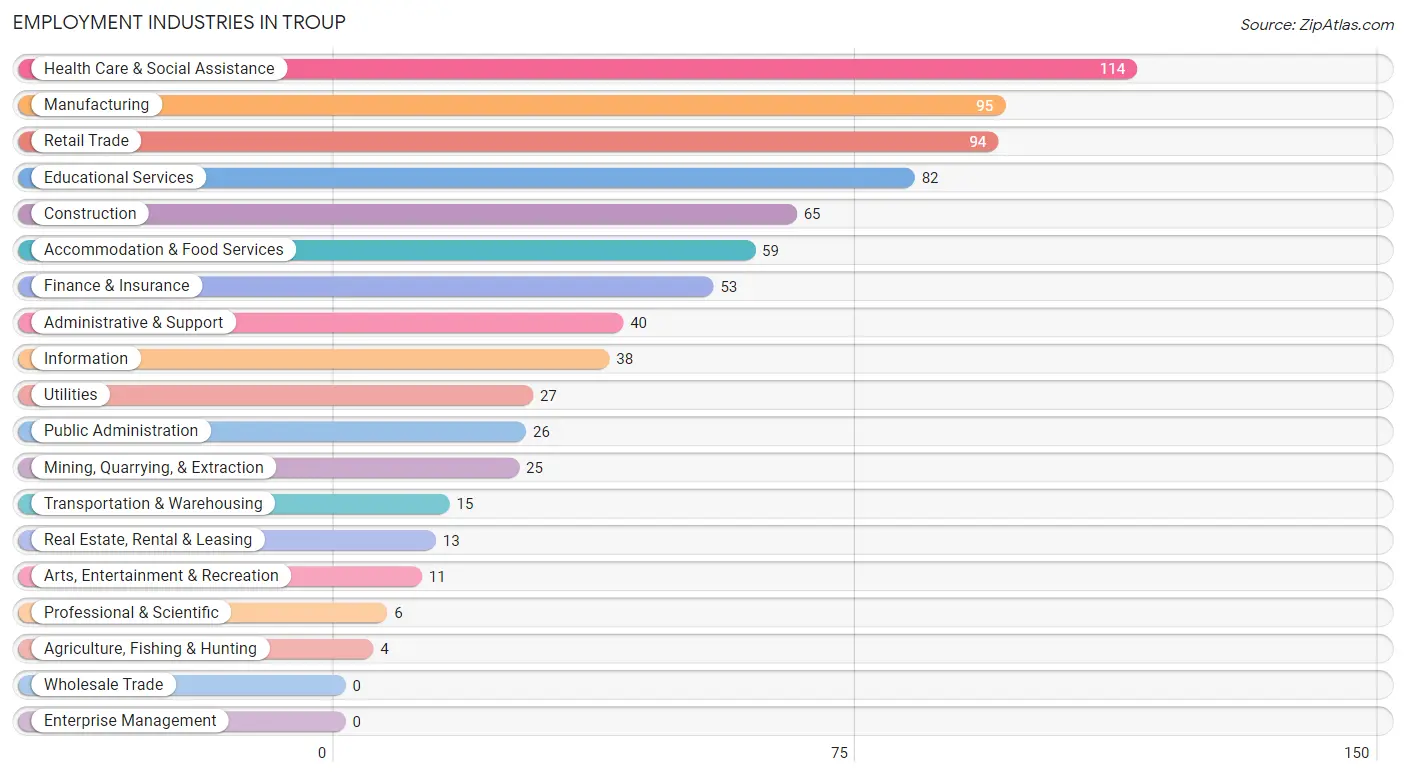
Employment Industries in Troup
The major employment industries in Troup include Health Care & Social Assistance (114 | 14.4%), Manufacturing (95 | 12.0%), Retail Trade (94 | 11.9%), Educational Services (82 | 10.4%), and Construction (65 | 8.2%).
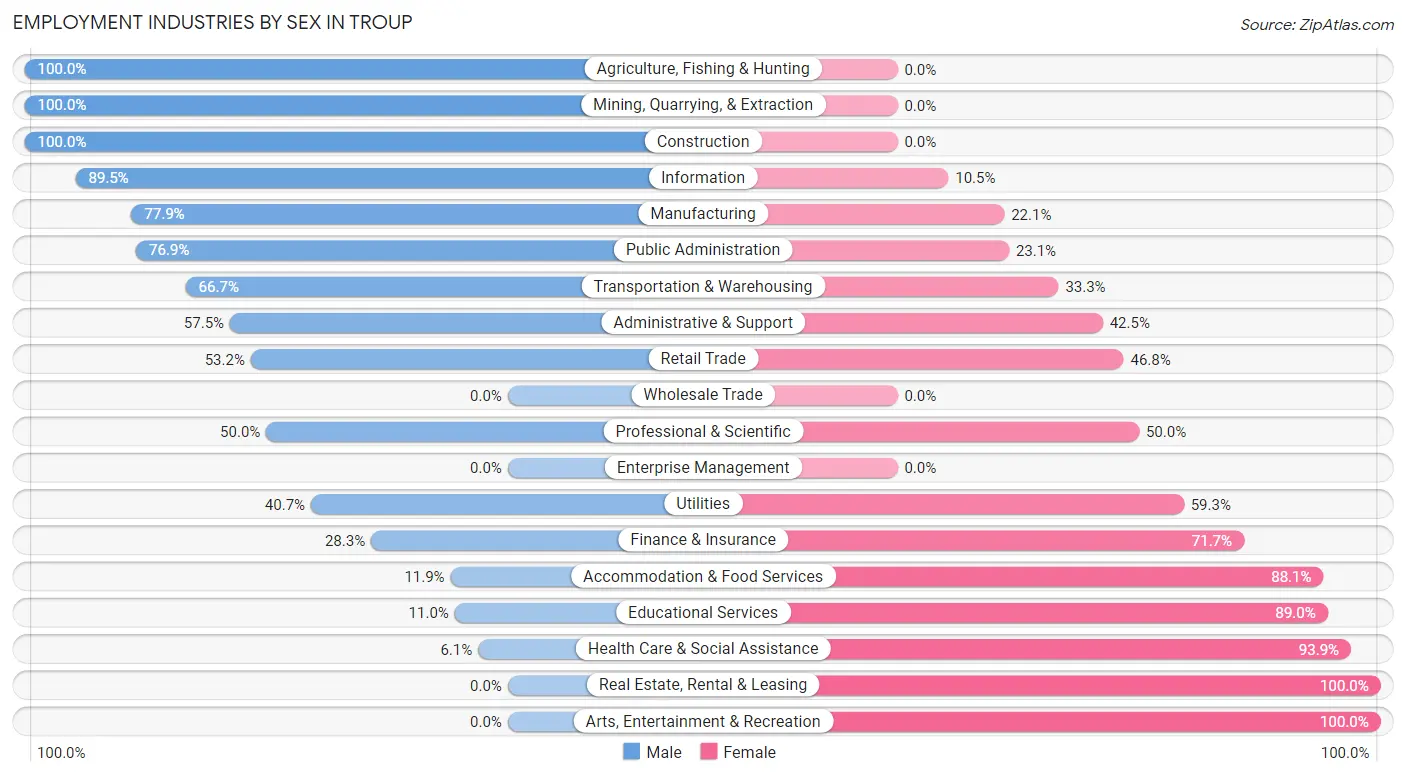
Employment Industries by Sex in Troup
The Troup industries that see more men than women are Agriculture, Fishing & Hunting (100.0%), Mining, Quarrying, & Extraction (100.0%), and Construction (100.0%), whereas the industries that tend to have a higher number of women are Real Estate, Rental & Leasing (100.0%), Arts, Entertainment & Recreation (100.0%), and Health Care & Social Assistance (93.9%).
| Industry | Male | Female |
| Agriculture, Fishing & Hunting | 4 (100.0%) | 0 (0.0%) |
| Mining, Quarrying, & Extraction | 25 (100.0%) | 0 (0.0%) |
| Construction | 65 (100.0%) | 0 (0.0%) |
| Manufacturing | 74 (77.9%) | 21 (22.1%) |
| Wholesale Trade | 0 (0.0%) | 0 (0.0%) |
| Retail Trade | 50 (53.2%) | 44 (46.8%) |
| Transportation & Warehousing | 10 (66.7%) | 5 (33.3%) |
| Utilities | 11 (40.7%) | 16 (59.3%) |
| Information | 34 (89.5%) | 4 (10.5%) |
| Finance & Insurance | 15 (28.3%) | 38 (71.7%) |
| Real Estate, Rental & Leasing | 0 (0.0%) | 13 (100.0%) |
| Professional & Scientific | 3 (50.0%) | 3 (50.0%) |
| Enterprise Management | 0 (0.0%) | 0 (0.0%) |
| Administrative & Support | 23 (57.5%) | 17 (42.5%) |
| Educational Services | 9 (11.0%) | 73 (89.0%) |
| Health Care & Social Assistance | 7 (6.1%) | 107 (93.9%) |
| Arts, Entertainment & Recreation | 0 (0.0%) | 11 (100.0%) |
| Accommodation & Food Services | 7 (11.9%) | 52 (88.1%) |
| Public Administration | 20 (76.9%) | 6 (23.1%) |
| Total | 375 (47.5%) | 415 (52.5%) |
Education in Troup
School Enrollment in Troup
The most common levels of schooling among the 762 students in Troup are middle school (212 | 27.8%), high school (202 | 26.5%), and elementary school (154 | 20.2%).
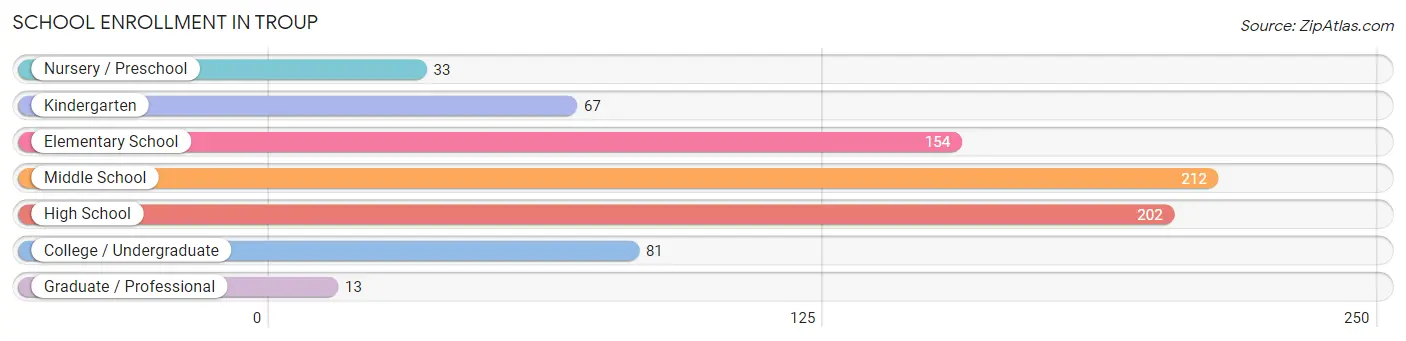
| School Level | # Students | % Students |
| Nursery / Preschool | 33 | 4.3% |
| Kindergarten | 67 | 8.8% |
| Elementary School | 154 | 20.2% |
| Middle School | 212 | 27.8% |
| High School | 202 | 26.5% |
| College / Undergraduate | 81 | 10.6% |
| Graduate / Professional | 13 | 1.7% |
| Total | 762 | 100.0% |
School Enrollment by Age by Funding Source in Troup
Out of a total of 762 students who are enrolled in schools in Troup, 112 (14.7%) attend a private institution, while the remaining 650 (85.3%) are enrolled in public schools. The age group of 3 to 4 year olds has the highest likelihood of being enrolled in private schools, with 16 (48.5% in the age bracket) enrolled. Conversely, the age group of 5 to 9 year old has the lowest likelihood of being enrolled in a private school, with 235 (100.0% in the age bracket) attending a public institution.
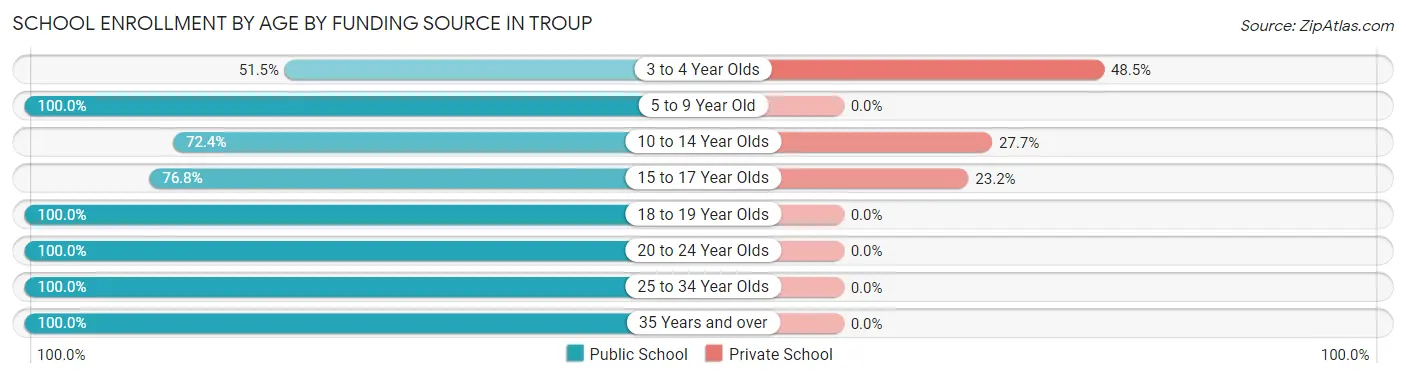
| Age Bracket | Public School | Private School |
| 3 to 4 Year Olds | 17 (51.5%) | 16 (48.5%) |
| 5 to 9 Year Old | 235 (100.0%) | 0 (0.0%) |
| 10 to 14 Year Olds | 157 (72.4%) | 60 (27.7%) |
| 15 to 17 Year Olds | 119 (76.8%) | 36 (23.2%) |
| 18 to 19 Year Olds | 72 (100.0%) | 0 (0.0%) |
| 20 to 24 Year Olds | 12 (100.0%) | 0 (0.0%) |
| 25 to 34 Year Olds | 15 (100.0%) | 0 (0.0%) |
| 35 Years and over | 23 (100.0%) | 0 (0.0%) |
| Total | 650 (85.3%) | 112 (14.7%) |
Educational Attainment by Field of Study in Troup
Education (48 | 19.6%), science & technology (43 | 17.5%), social sciences (42 | 17.1%), business (30 | 12.2%), and arts & humanities (26 | 10.6%) are the most common fields of study among 245 individuals in Troup who have obtained a bachelor's degree or higher.
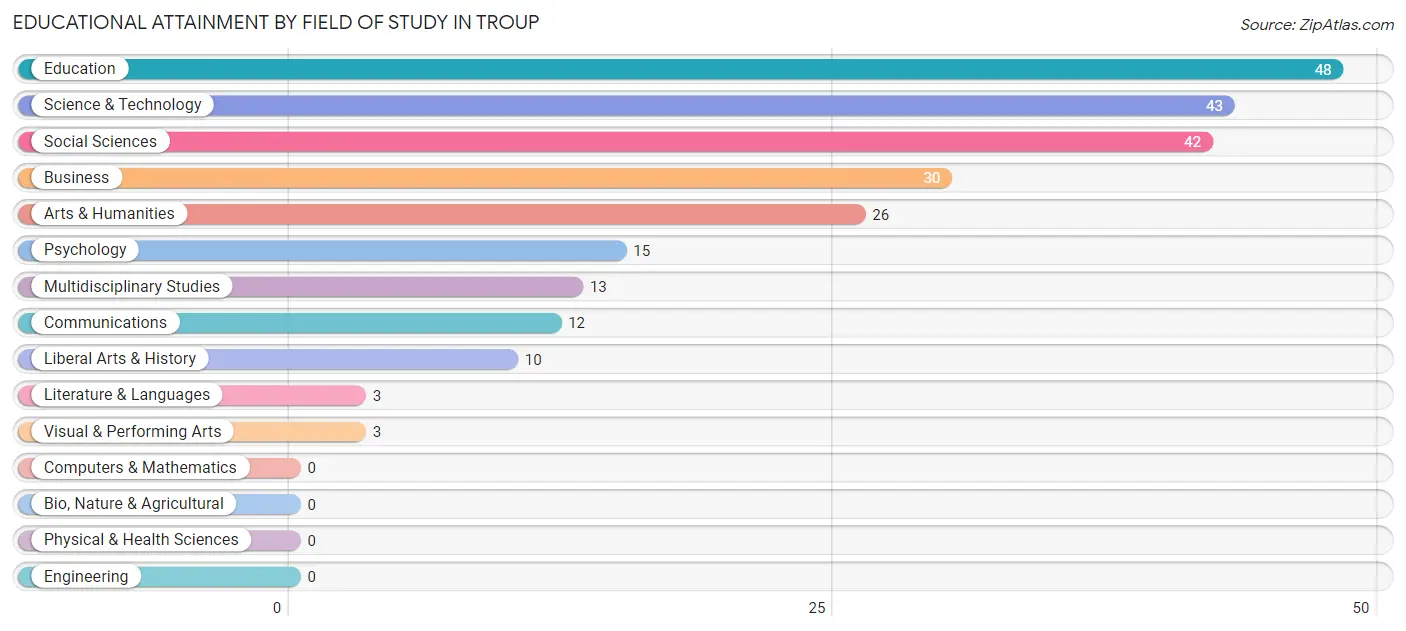
| Field of Study | # Graduates | % Graduates |
| Computers & Mathematics | 0 | 0.0% |
| Bio, Nature & Agricultural | 0 | 0.0% |
| Physical & Health Sciences | 0 | 0.0% |
| Psychology | 15 | 6.1% |
| Social Sciences | 42 | 17.1% |
| Engineering | 0 | 0.0% |
| Multidisciplinary Studies | 13 | 5.3% |
| Science & Technology | 43 | 17.5% |
| Business | 30 | 12.2% |
| Education | 48 | 19.6% |
| Literature & Languages | 3 | 1.2% |
| Liberal Arts & History | 10 | 4.1% |
| Visual & Performing Arts | 3 | 1.2% |
| Communications | 12 | 4.9% |
| Arts & Humanities | 26 | 10.6% |
| Total | 245 | 100.0% |
Transportation & Commute in Troup
Vehicle Availability by Sex in Troup
The most prevalent vehicle ownership categories in Troup are males with 2 vehicles (177, accounting for 47.2%) and females with 2 vehicles (147, making up 45.7%).
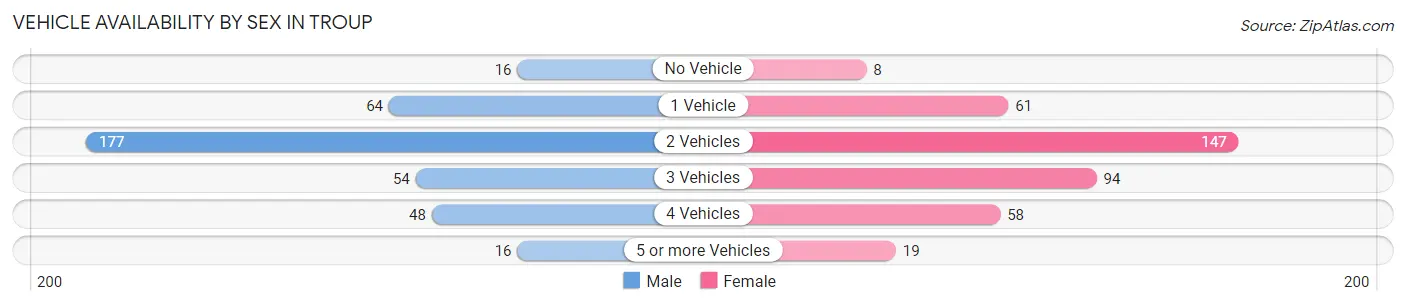
| Vehicles Available | Male | Female |
| No Vehicle | 16 (4.3%) | 8 (2.1%) |
| 1 Vehicle | 64 (17.1%) | 61 (15.8%) |
| 2 Vehicles | 177 (47.2%) | 147 (38.0%) |
| 3 Vehicles | 54 (14.4%) | 94 (24.3%) |
| 4 Vehicles | 48 (12.8%) | 58 (15.0%) |
| 5 or more Vehicles | 16 (4.3%) | 19 (4.9%) |
| Total | 375 (100.0%) | 387 (100.0%) |
Commute Time in Troup
The most frequently occuring commute durations in Troup are 30 to 34 minutes (174 commuters, 23.5%), 5 to 9 minutes (110 commuters, 14.9%), and 45 to 59 minutes (82 commuters, 11.1%).
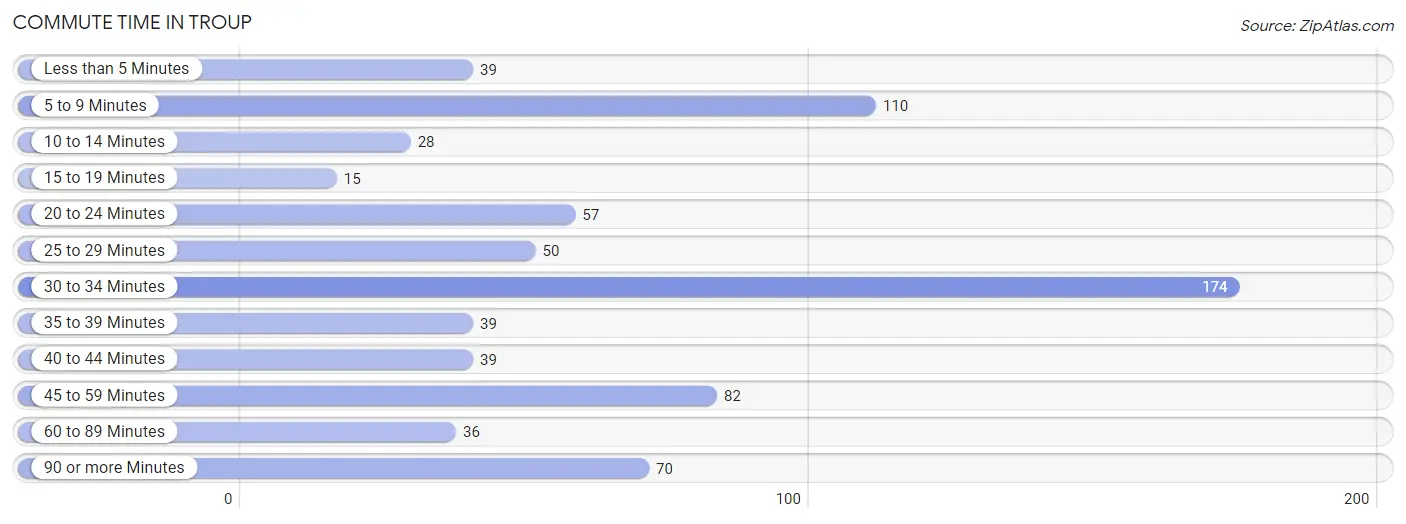
| Commute Time | # Commuters | % Commuters |
| Less than 5 Minutes | 39 | 5.3% |
| 5 to 9 Minutes | 110 | 14.9% |
| 10 to 14 Minutes | 28 | 3.8% |
| 15 to 19 Minutes | 15 | 2.0% |
| 20 to 24 Minutes | 57 | 7.7% |
| 25 to 29 Minutes | 50 | 6.8% |
| 30 to 34 Minutes | 174 | 23.5% |
| 35 to 39 Minutes | 39 | 5.3% |
| 40 to 44 Minutes | 39 | 5.3% |
| 45 to 59 Minutes | 82 | 11.1% |
| 60 to 89 Minutes | 36 | 4.9% |
| 90 or more Minutes | 70 | 9.5% |
Commute Time by Sex in Troup
The most common commute times in Troup are 5 to 9 minutes (77 commuters, 21.2%) for males and 30 to 34 minutes (111 commuters, 29.5%) for females.
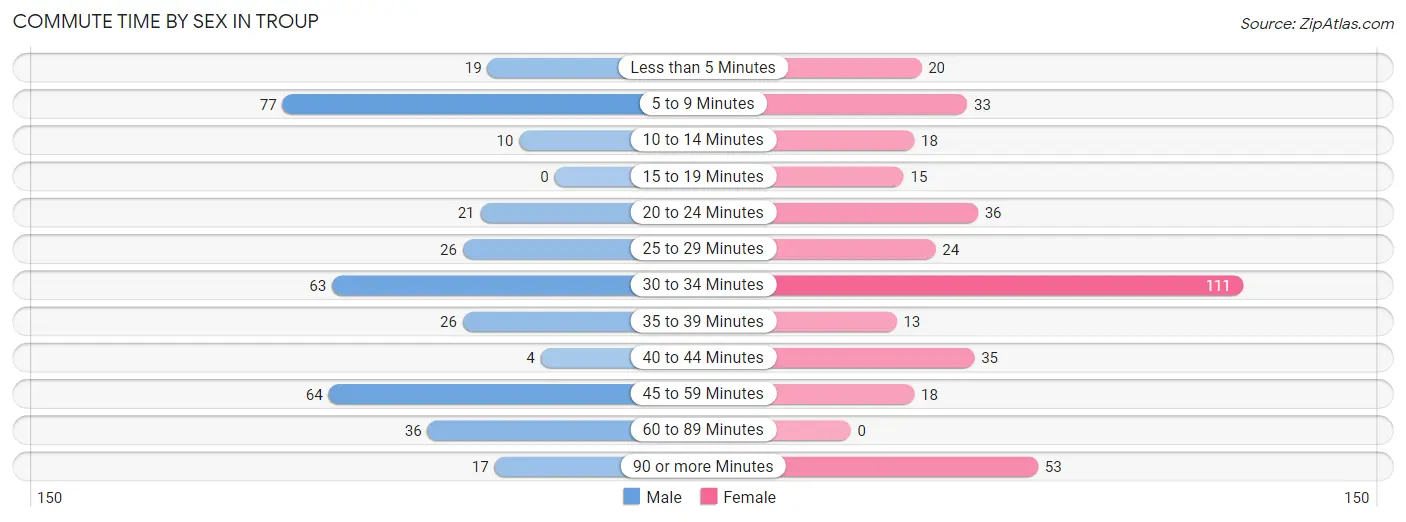
| Commute Time | Male | Female |
| Less than 5 Minutes | 19 (5.2%) | 20 (5.3%) |
| 5 to 9 Minutes | 77 (21.2%) | 33 (8.8%) |
| 10 to 14 Minutes | 10 (2.8%) | 18 (4.8%) |
| 15 to 19 Minutes | 0 (0.0%) | 15 (4.0%) |
| 20 to 24 Minutes | 21 (5.8%) | 36 (9.6%) |
| 25 to 29 Minutes | 26 (7.2%) | 24 (6.4%) |
| 30 to 34 Minutes | 63 (17.4%) | 111 (29.5%) |
| 35 to 39 Minutes | 26 (7.2%) | 13 (3.5%) |
| 40 to 44 Minutes | 4 (1.1%) | 35 (9.3%) |
| 45 to 59 Minutes | 64 (17.6%) | 18 (4.8%) |
| 60 to 89 Minutes | 36 (9.9%) | 0 (0.0%) |
| 90 or more Minutes | 17 (4.7%) | 53 (14.1%) |
Time of Departure to Work by Sex in Troup
The most frequent times of departure to work in Troup are 7:30 AM to 7:59 AM (61, 16.8%) for males and 7:00 AM to 7:29 AM (107, 28.5%) for females.
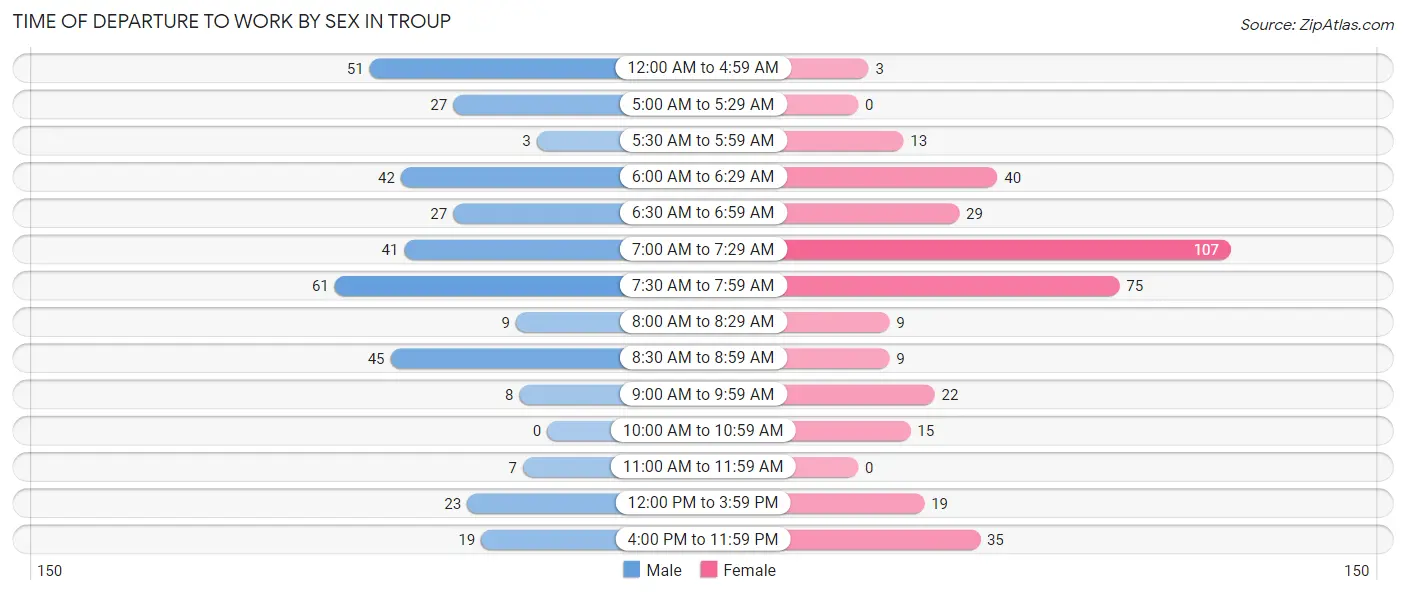
| Time of Departure | Male | Female |
| 12:00 AM to 4:59 AM | 51 (14.1%) | 3 (0.8%) |
| 5:00 AM to 5:29 AM | 27 (7.4%) | 0 (0.0%) |
| 5:30 AM to 5:59 AM | 3 (0.8%) | 13 (3.5%) |
| 6:00 AM to 6:29 AM | 42 (11.6%) | 40 (10.6%) |
| 6:30 AM to 6:59 AM | 27 (7.4%) | 29 (7.7%) |
| 7:00 AM to 7:29 AM | 41 (11.3%) | 107 (28.5%) |
| 7:30 AM to 7:59 AM | 61 (16.8%) | 75 (20.0%) |
| 8:00 AM to 8:29 AM | 9 (2.5%) | 9 (2.4%) |
| 8:30 AM to 8:59 AM | 45 (12.4%) | 9 (2.4%) |
| 9:00 AM to 9:59 AM | 8 (2.2%) | 22 (5.9%) |
| 10:00 AM to 10:59 AM | 0 (0.0%) | 15 (4.0%) |
| 11:00 AM to 11:59 AM | 7 (1.9%) | 0 (0.0%) |
| 12:00 PM to 3:59 PM | 23 (6.3%) | 19 (5.1%) |
| 4:00 PM to 11:59 PM | 19 (5.2%) | 35 (9.3%) |
| Total | 363 (100.0%) | 376 (100.0%) |
Housing Occupancy in Troup
Occupancy by Ownership in Troup
Of the total 689 dwellings in Troup, owner-occupied units account for 418 (60.7%), while renter-occupied units make up 271 (39.3%).
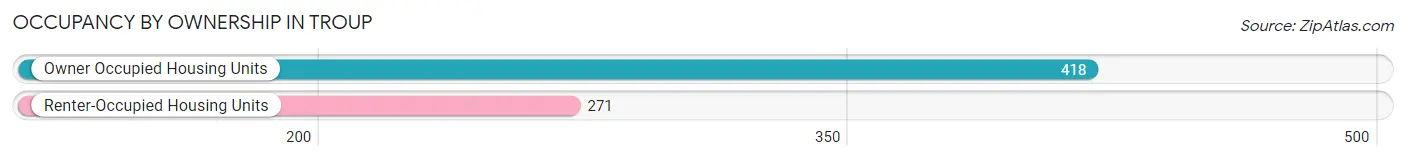
| Occupancy | # Housing Units | % Housing Units |
| Owner Occupied Housing Units | 418 | 60.7% |
| Renter-Occupied Housing Units | 271 | 39.3% |
| Total Occupied Housing Units | 689 | 100.0% |
Occupancy by Household Size in Troup
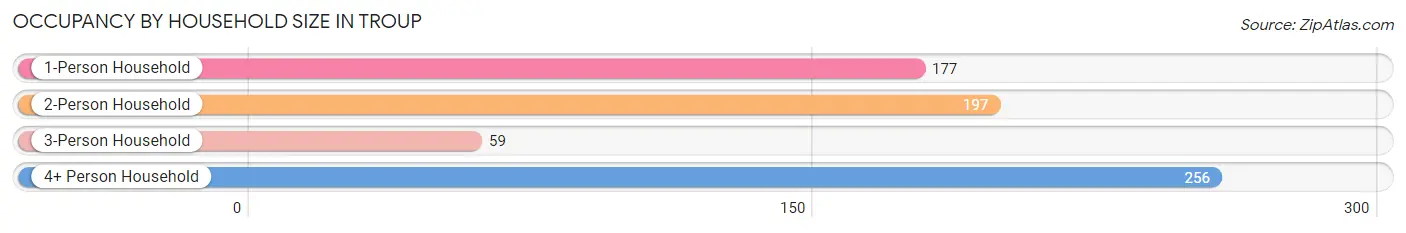
| Household Size | # Housing Units | % Housing Units |
| 1-Person Household | 177 | 25.7% |
| 2-Person Household | 197 | 28.6% |
| 3-Person Household | 59 | 8.6% |
| 4+ Person Household | 256 | 37.2% |
| Total Housing Units | 689 | 100.0% |
Occupancy by Ownership by Household Size in Troup
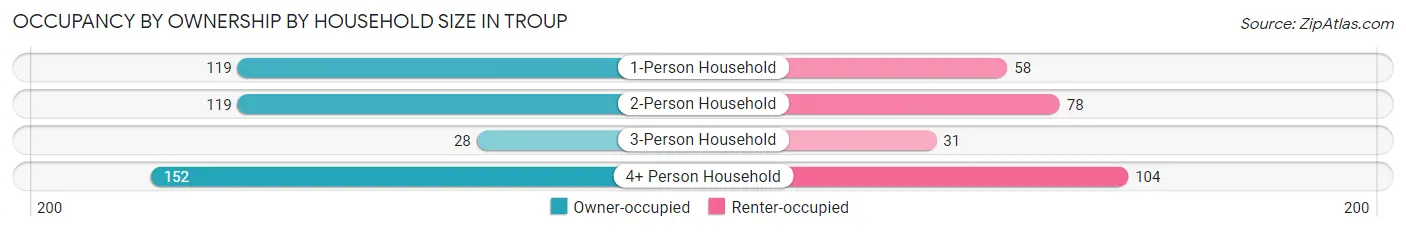
| Household Size | Owner-occupied | Renter-occupied |
| 1-Person Household | 119 (67.2%) | 58 (32.8%) |
| 2-Person Household | 119 (60.4%) | 78 (39.6%) |
| 3-Person Household | 28 (47.5%) | 31 (52.5%) |
| 4+ Person Household | 152 (59.4%) | 104 (40.6%) |
| Total Housing Units | 418 (60.7%) | 271 (39.3%) |
Occupancy by Educational Attainment in Troup
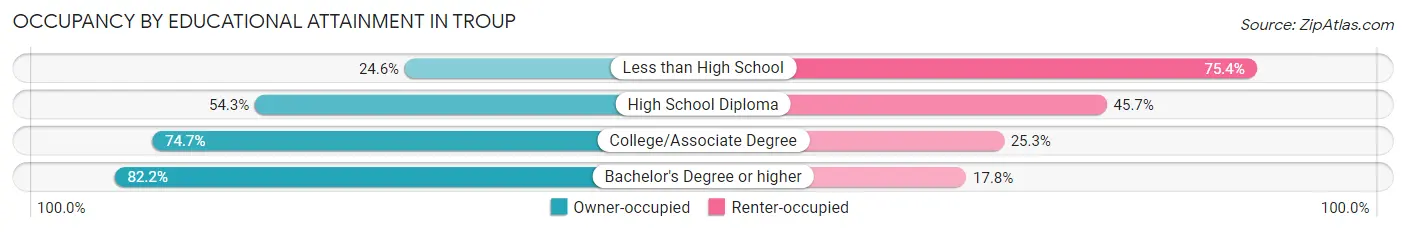
| Household Size | Owner-occupied | Renter-occupied |
| Less than High School | 30 (24.6%) | 92 (75.4%) |
| High School Diploma | 126 (54.3%) | 106 (45.7%) |
| College/Associate Degree | 133 (74.7%) | 45 (25.3%) |
| Bachelor's Degree or higher | 129 (82.2%) | 28 (17.8%) |
Occupancy by Age of Householder in Troup
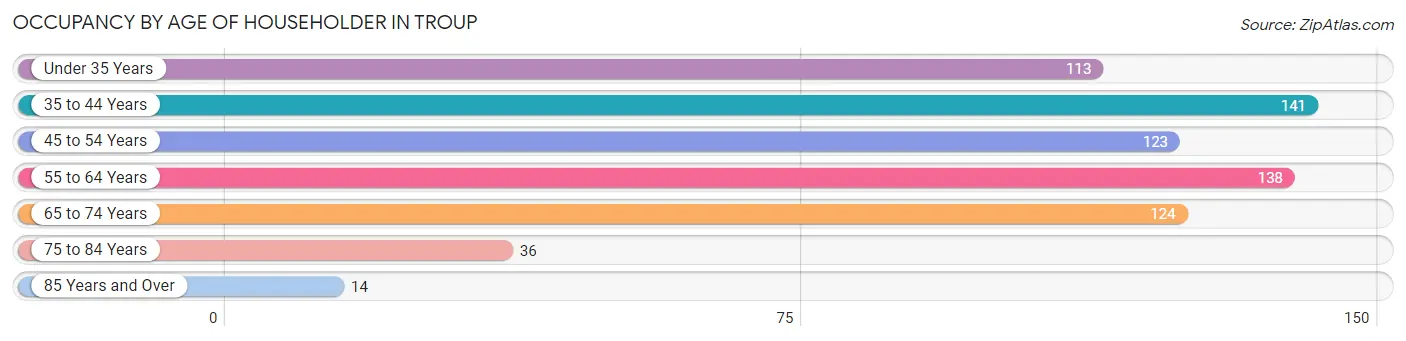
| Age Bracket | # Households | % Households |
| Under 35 Years | 113 | 16.4% |
| 35 to 44 Years | 141 | 20.5% |
| 45 to 54 Years | 123 | 17.8% |
| 55 to 64 Years | 138 | 20.0% |
| 65 to 74 Years | 124 | 18.0% |
| 75 to 84 Years | 36 | 5.2% |
| 85 Years and Over | 14 | 2.0% |
| Total | 689 | 100.0% |
Housing Finances in Troup
Median Income by Occupancy in Troup
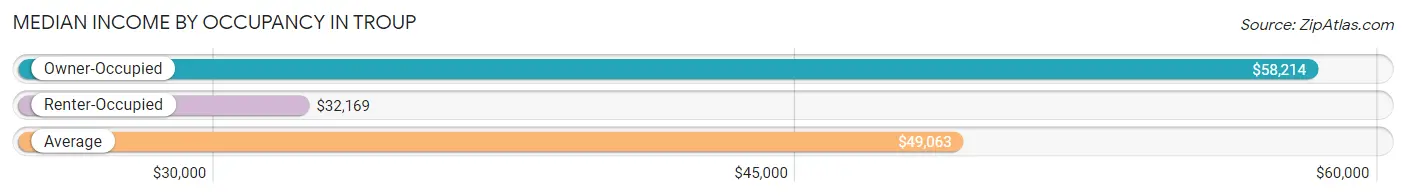
| Occupancy Type | # Households | Median Income |
| Owner-Occupied | 418 (60.7%) | $58,214 |
| Renter-Occupied | 271 (39.3%) | $32,169 |
| Average | 689 (100.0%) | $49,063 |
Occupancy by Householder Income Bracket in Troup
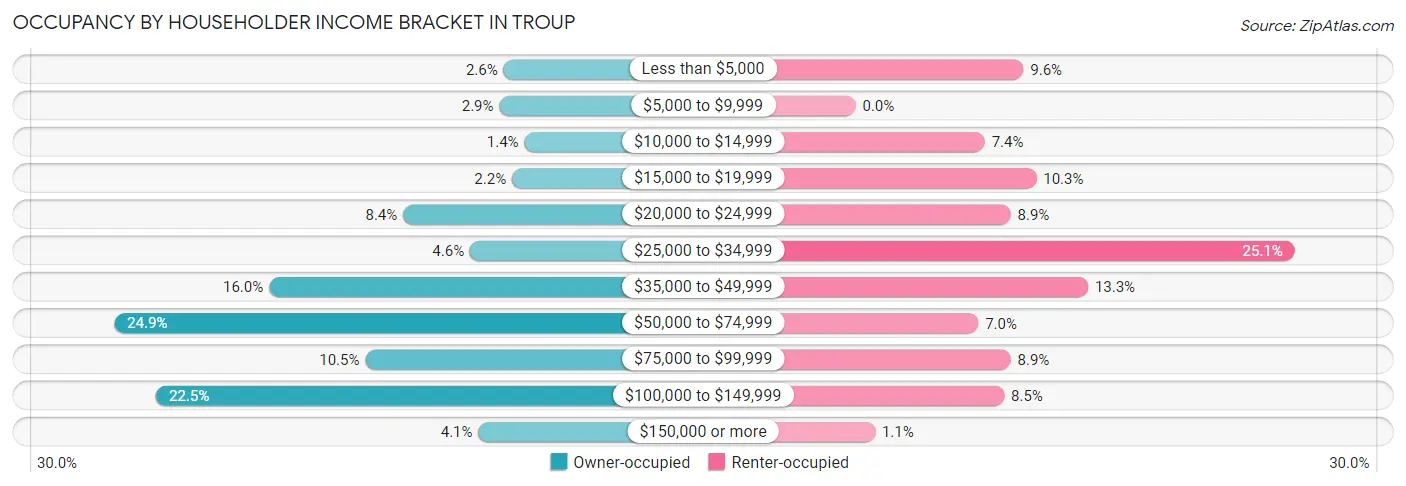
| Income Bracket | Owner-occupied | Renter-occupied |
| Less than $5,000 | 11 (2.6%) | 26 (9.6%) |
| $5,000 to $9,999 | 12 (2.9%) | 0 (0.0%) |
| $10,000 to $14,999 | 6 (1.4%) | 20 (7.4%) |
| $15,000 to $19,999 | 9 (2.1%) | 28 (10.3%) |
| $20,000 to $24,999 | 35 (8.4%) | 24 (8.9%) |
| $25,000 to $34,999 | 19 (4.5%) | 68 (25.1%) |
| $35,000 to $49,999 | 67 (16.0%) | 36 (13.3%) |
| $50,000 to $74,999 | 104 (24.9%) | 19 (7.0%) |
| $75,000 to $99,999 | 44 (10.5%) | 24 (8.9%) |
| $100,000 to $149,999 | 94 (22.5%) | 23 (8.5%) |
| $150,000 or more | 17 (4.1%) | 3 (1.1%) |
| Total | 418 (100.0%) | 271 (100.0%) |
Monthly Housing Cost Tiers in Troup
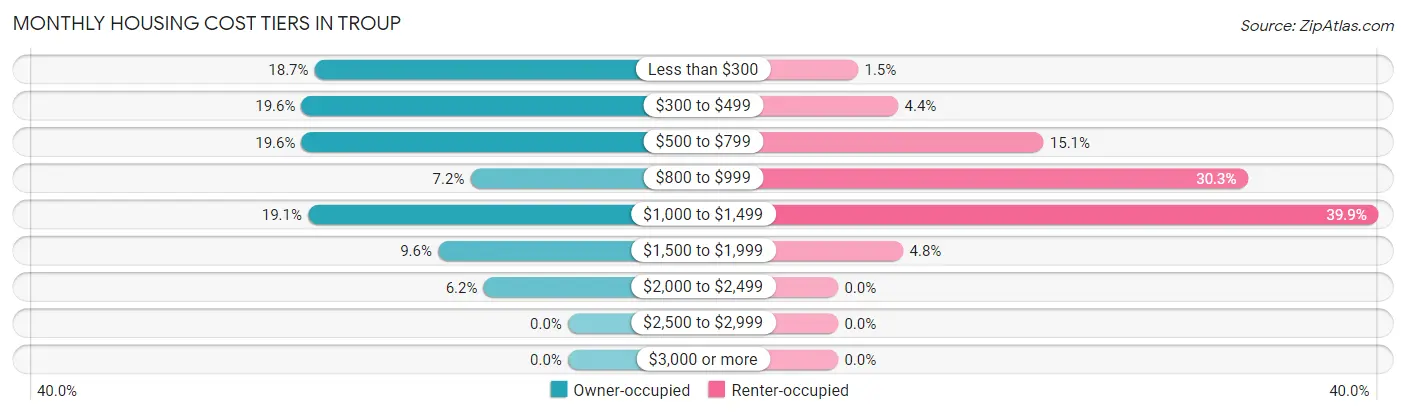
| Monthly Cost | Owner-occupied | Renter-occupied |
| Less than $300 | 78 (18.7%) | 4 (1.5%) |
| $300 to $499 | 82 (19.6%) | 12 (4.4%) |
| $500 to $799 | 82 (19.6%) | 41 (15.1%) |
| $800 to $999 | 30 (7.2%) | 82 (30.3%) |
| $1,000 to $1,499 | 80 (19.1%) | 108 (39.9%) |
| $1,500 to $1,999 | 40 (9.6%) | 13 (4.8%) |
| $2,000 to $2,499 | 26 (6.2%) | 0 (0.0%) |
| $2,500 to $2,999 | 0 (0.0%) | 0 (0.0%) |
| $3,000 or more | 0 (0.0%) | 0 (0.0%) |
| Total | 418 (100.0%) | 271 (100.0%) |
Physical Housing Characteristics in Troup
Housing Structures in Troup
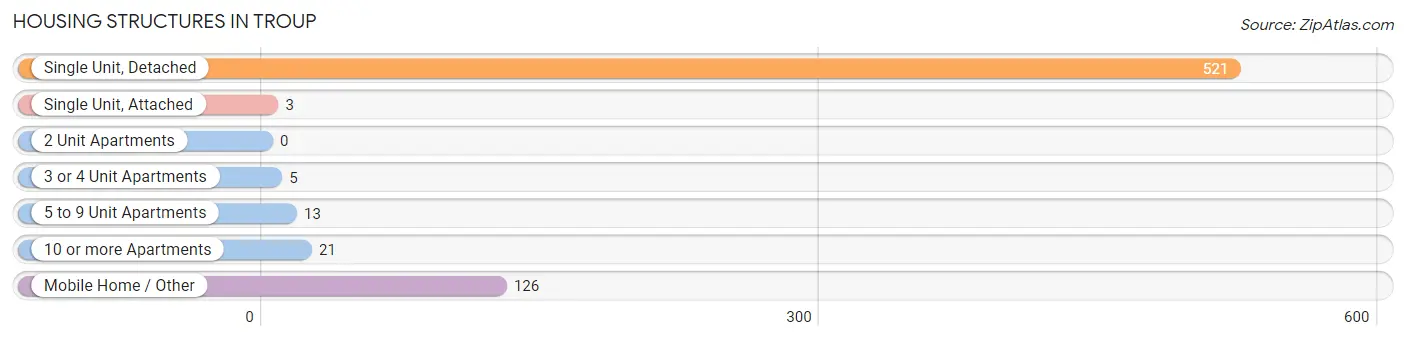
| Structure Type | # Housing Units | % Housing Units |
| Single Unit, Detached | 521 | 75.6% |
| Single Unit, Attached | 3 | 0.4% |
| 2 Unit Apartments | 0 | 0.0% |
| 3 or 4 Unit Apartments | 5 | 0.7% |
| 5 to 9 Unit Apartments | 13 | 1.9% |
| 10 or more Apartments | 21 | 3.0% |
| Mobile Home / Other | 126 | 18.3% |
| Total | 689 | 100.0% |
Housing Structures by Occupancy in Troup
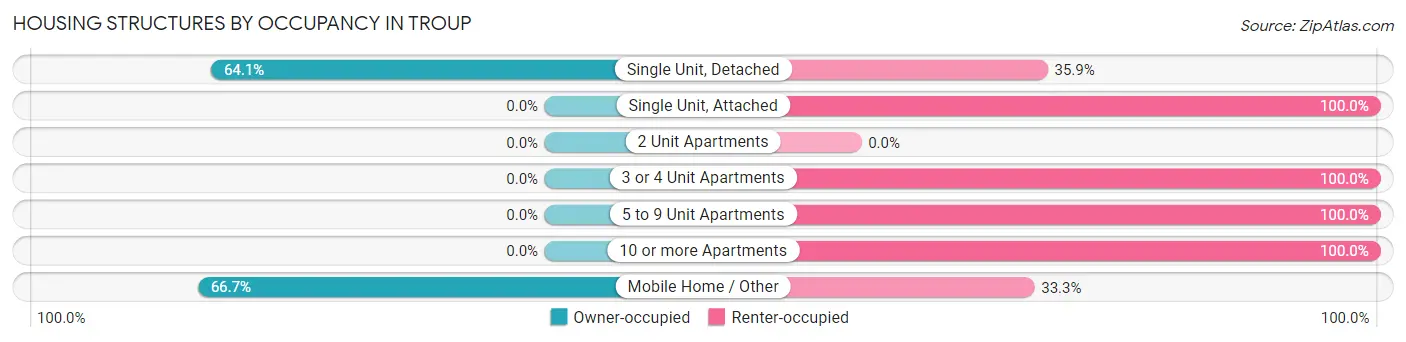
| Structure Type | Owner-occupied | Renter-occupied |
| Single Unit, Detached | 334 (64.1%) | 187 (35.9%) |
| Single Unit, Attached | 0 (0.0%) | 3 (100.0%) |
| 2 Unit Apartments | 0 (0.0%) | 0 (0.0%) |
| 3 or 4 Unit Apartments | 0 (0.0%) | 5 (100.0%) |
| 5 to 9 Unit Apartments | 0 (0.0%) | 13 (100.0%) |
| 10 or more Apartments | 0 (0.0%) | 21 (100.0%) |
| Mobile Home / Other | 84 (66.7%) | 42 (33.3%) |
| Total | 418 (60.7%) | 271 (39.3%) |
Housing Structures by Number of Rooms in Troup
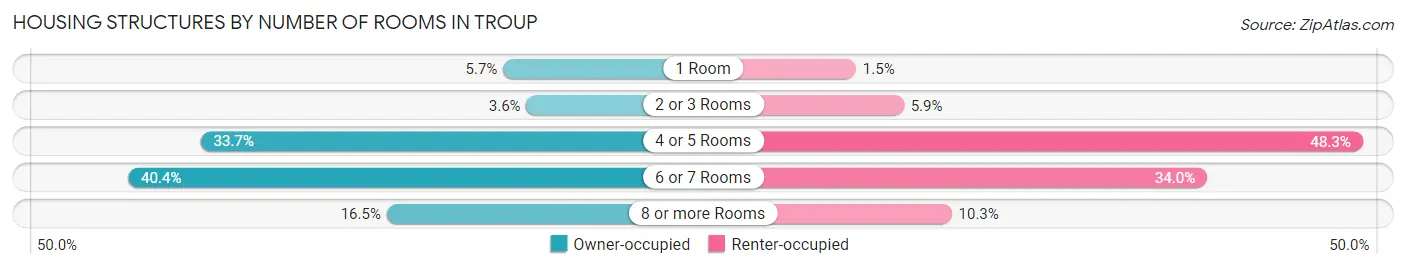
| Number of Rooms | Owner-occupied | Renter-occupied |
| 1 Room | 24 (5.7%) | 4 (1.5%) |
| 2 or 3 Rooms | 15 (3.6%) | 16 (5.9%) |
| 4 or 5 Rooms | 141 (33.7%) | 131 (48.3%) |
| 6 or 7 Rooms | 169 (40.4%) | 92 (34.0%) |
| 8 or more Rooms | 69 (16.5%) | 28 (10.3%) |
| Total | 418 (100.0%) | 271 (100.0%) |
Housing Structure by Heating Type in Troup
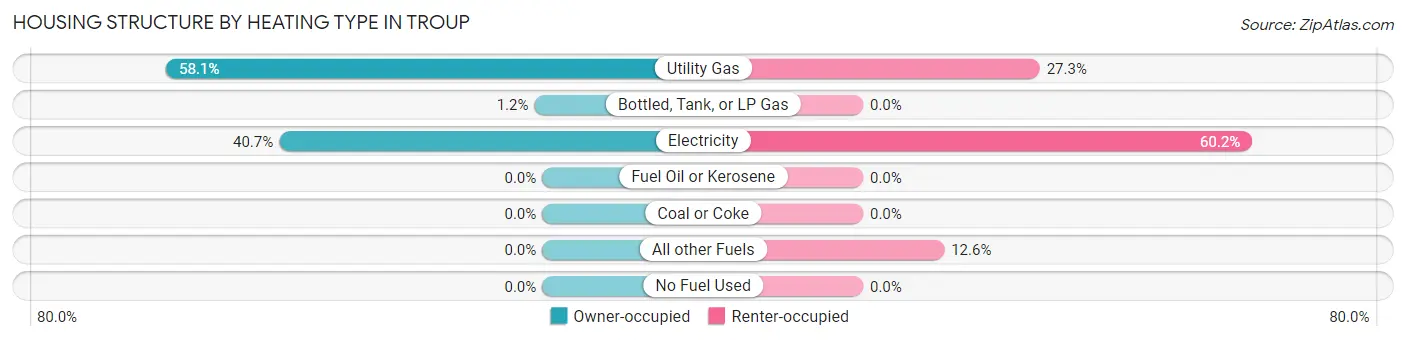
| Heating Type | Owner-occupied | Renter-occupied |
| Utility Gas | 243 (58.1%) | 74 (27.3%) |
| Bottled, Tank, or LP Gas | 5 (1.2%) | 0 (0.0%) |
| Electricity | 170 (40.7%) | 163 (60.2%) |
| Fuel Oil or Kerosene | 0 (0.0%) | 0 (0.0%) |
| Coal or Coke | 0 (0.0%) | 0 (0.0%) |
| All other Fuels | 0 (0.0%) | 34 (12.6%) |
| No Fuel Used | 0 (0.0%) | 0 (0.0%) |
| Total | 418 (100.0%) | 271 (100.0%) |
Household Vehicle Usage in Troup
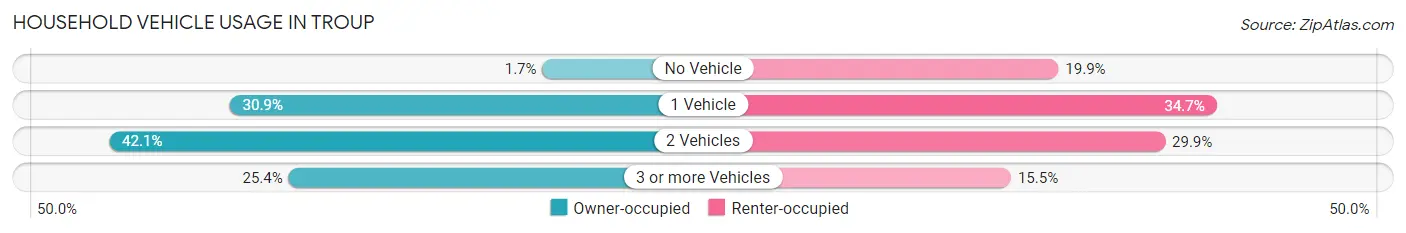
| Vehicles per Household | Owner-occupied | Renter-occupied |
| No Vehicle | 7 (1.7%) | 54 (19.9%) |
| 1 Vehicle | 129 (30.9%) | 94 (34.7%) |
| 2 Vehicles | 176 (42.1%) | 81 (29.9%) |
| 3 or more Vehicles | 106 (25.4%) | 42 (15.5%) |
| Total | 418 (100.0%) | 271 (100.0%) |
Real Estate & Mortgages in Troup
Real Estate and Mortgage Overview in Troup
| Characteristic | Without Mortgage | With Mortgage |
| Housing Units | 228 | 190 |
| Median Property Value | $86,700 | $146,900 |
| Median Household Income | $49,821 | $14 |
| Monthly Housing Costs | $378 | $0 |
| Real Estate Taxes | - | - |
Property Value by Mortgage Status in Troup
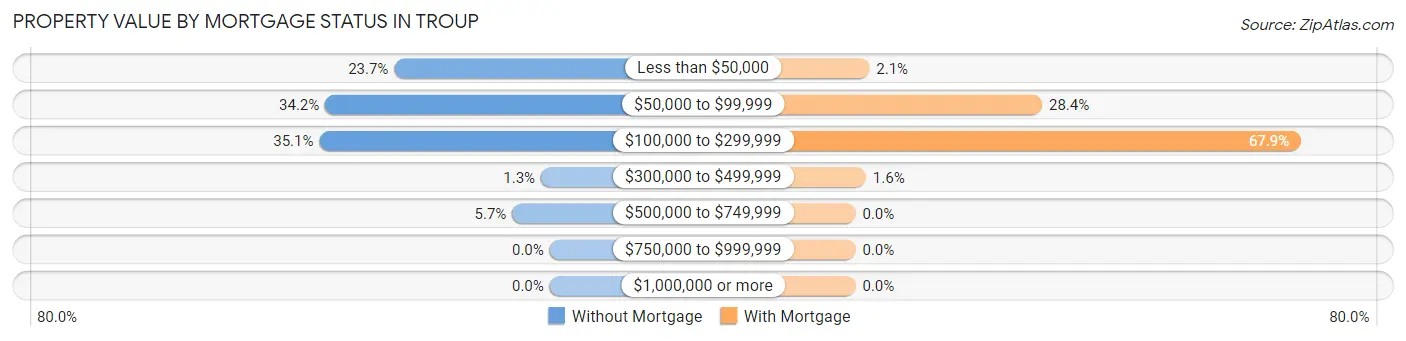
| Property Value | Without Mortgage | With Mortgage |
| Less than $50,000 | 54 (23.7%) | 4 (2.1%) |
| $50,000 to $99,999 | 78 (34.2%) | 54 (28.4%) |
| $100,000 to $299,999 | 80 (35.1%) | 129 (67.9%) |
| $300,000 to $499,999 | 3 (1.3%) | 3 (1.6%) |
| $500,000 to $749,999 | 13 (5.7%) | 0 (0.0%) |
| $750,000 to $999,999 | 0 (0.0%) | 0 (0.0%) |
| $1,000,000 or more | 0 (0.0%) | 0 (0.0%) |
| Total | 228 (100.0%) | 190 (100.0%) |
Household Income by Mortgage Status in Troup
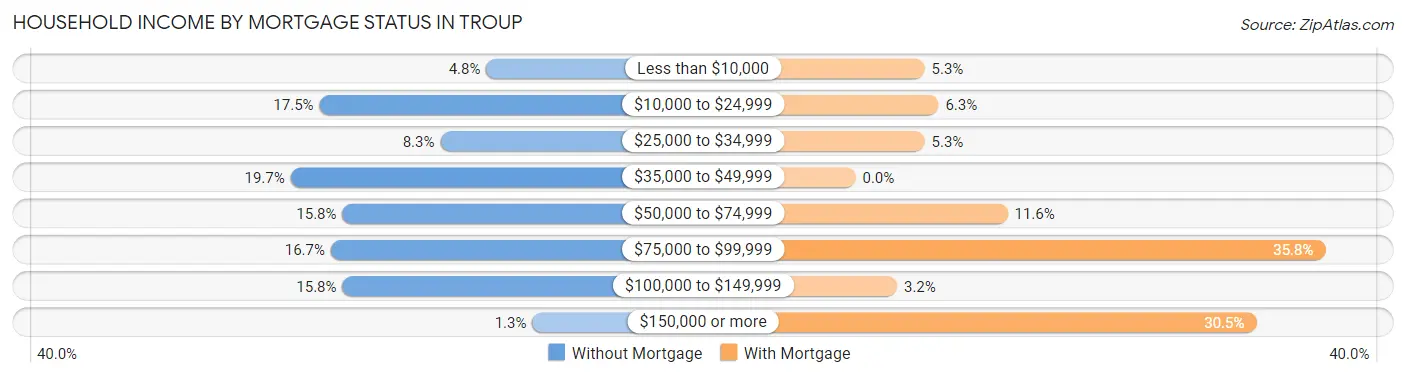
| Household Income | Without Mortgage | With Mortgage |
| Less than $10,000 | 11 (4.8%) | 10 (5.3%) |
| $10,000 to $24,999 | 40 (17.5%) | 12 (6.3%) |
| $25,000 to $34,999 | 19 (8.3%) | 10 (5.3%) |
| $35,000 to $49,999 | 45 (19.7%) | 0 (0.0%) |
| $50,000 to $74,999 | 36 (15.8%) | 22 (11.6%) |
| $75,000 to $99,999 | 38 (16.7%) | 68 (35.8%) |
| $100,000 to $149,999 | 36 (15.8%) | 6 (3.2%) |
| $150,000 or more | 3 (1.3%) | 58 (30.5%) |
| Total | 228 (100.0%) | 190 (100.0%) |
Property Value to Household Income Ratio in Troup
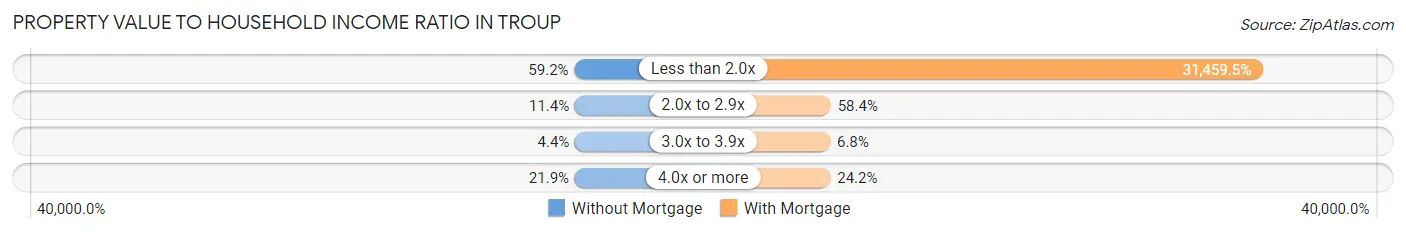
| Value-to-Income Ratio | Without Mortgage | With Mortgage |
| Less than 2.0x | 135 (59.2%) | 59,773 (31,459.5%) |
| 2.0x to 2.9x | 26 (11.4%) | 111 (58.4%) |
| 3.0x to 3.9x | 10 (4.4%) | 13 (6.8%) |
| 4.0x or more | 50 (21.9%) | 46 (24.2%) |
| Total | 228 (100.0%) | 190 (100.0%) |
Real Estate Taxes by Mortgage Status in Troup
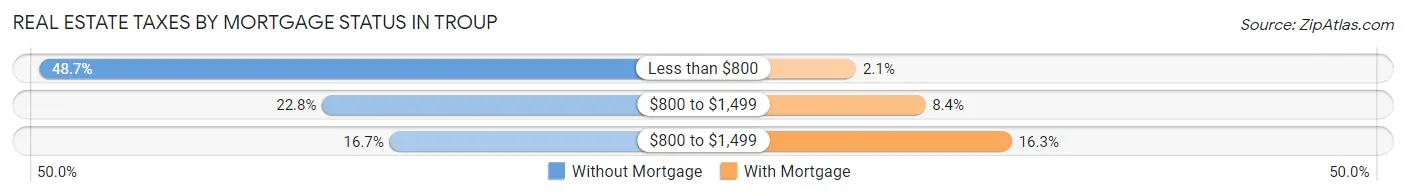
| Property Taxes | Without Mortgage | With Mortgage |
| Less than $800 | 111 (48.7%) | 4 (2.1%) |
| $800 to $1,499 | 52 (22.8%) | 16 (8.4%) |
| $800 to $1,499 | 38 (16.7%) | 31 (16.3%) |
| Total | 228 (100.0%) | 190 (100.0%) |
Health & Disability in Troup
Health Insurance Coverage by Age in Troup
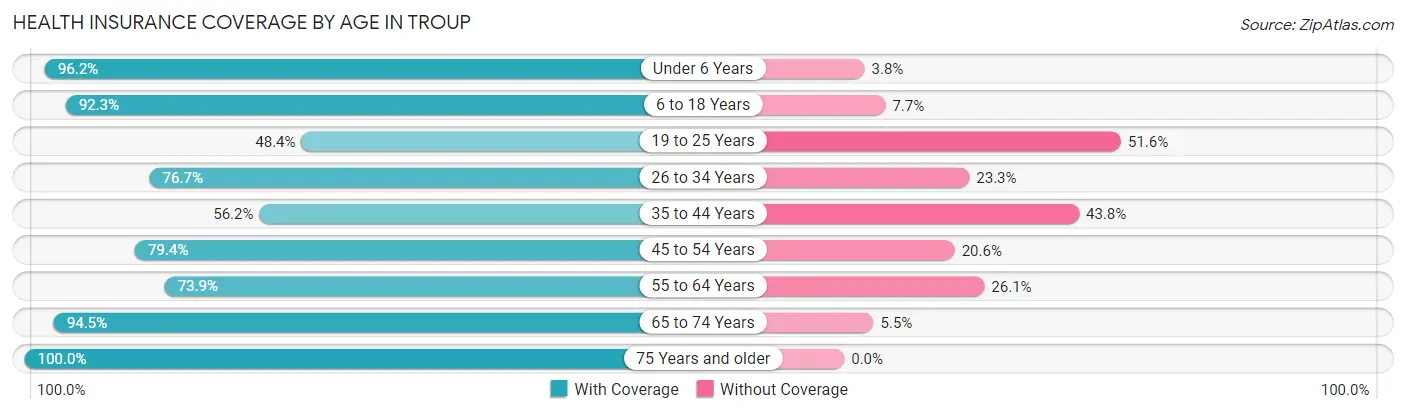
| Age Bracket | With Coverage | Without Coverage |
| Under 6 Years | 127 (96.2%) | 5 (3.8%) |
| 6 to 18 Years | 577 (92.3%) | 48 (7.7%) |
| 19 to 25 Years | 90 (48.4%) | 96 (51.6%) |
| 26 to 34 Years | 194 (76.7%) | 59 (23.3%) |
| 35 to 44 Years | 176 (56.2%) | 137 (43.8%) |
| 45 to 54 Years | 135 (79.4%) | 35 (20.6%) |
| 55 to 64 Years | 147 (73.9%) | 52 (26.1%) |
| 65 to 74 Years | 173 (94.5%) | 10 (5.5%) |
| 75 Years and older | 87 (100.0%) | 0 (0.0%) |
| Total | 1,706 (79.4%) | 442 (20.6%) |
Health Insurance Coverage by Citizenship Status in Troup
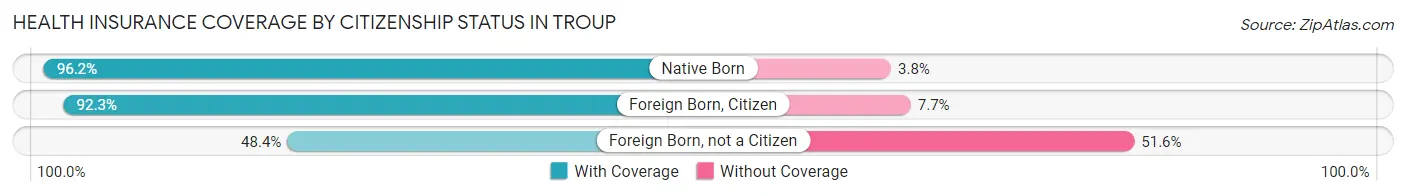
| Citizenship Status | With Coverage | Without Coverage |
| Native Born | 127 (96.2%) | 5 (3.8%) |
| Foreign Born, Citizen | 577 (92.3%) | 48 (7.7%) |
| Foreign Born, not a Citizen | 90 (48.4%) | 96 (51.6%) |
Health Insurance Coverage by Household Income in Troup
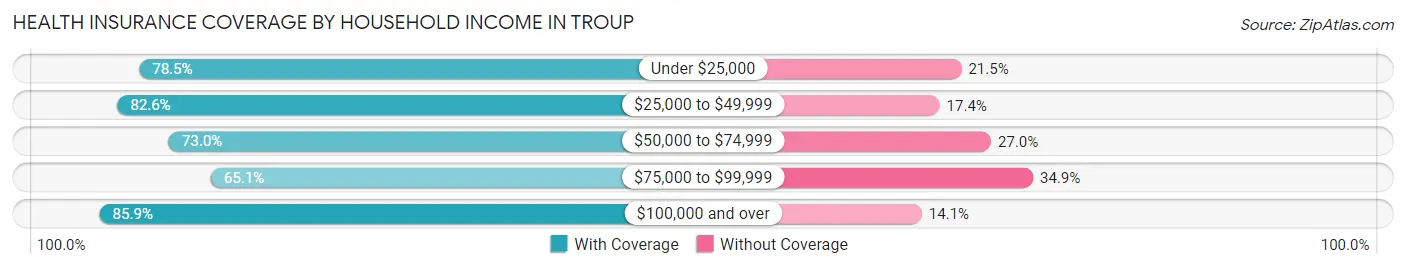
| Household Income | With Coverage | Without Coverage |
| Under $25,000 | 369 (78.5%) | 101 (21.5%) |
| $25,000 to $49,999 | 489 (82.6%) | 103 (17.4%) |
| $50,000 to $74,999 | 286 (73.0%) | 106 (27.0%) |
| $75,000 to $99,999 | 110 (65.1%) | 59 (34.9%) |
| $100,000 and over | 446 (85.9%) | 73 (14.1%) |
Public vs Private Health Insurance Coverage by Age in Troup
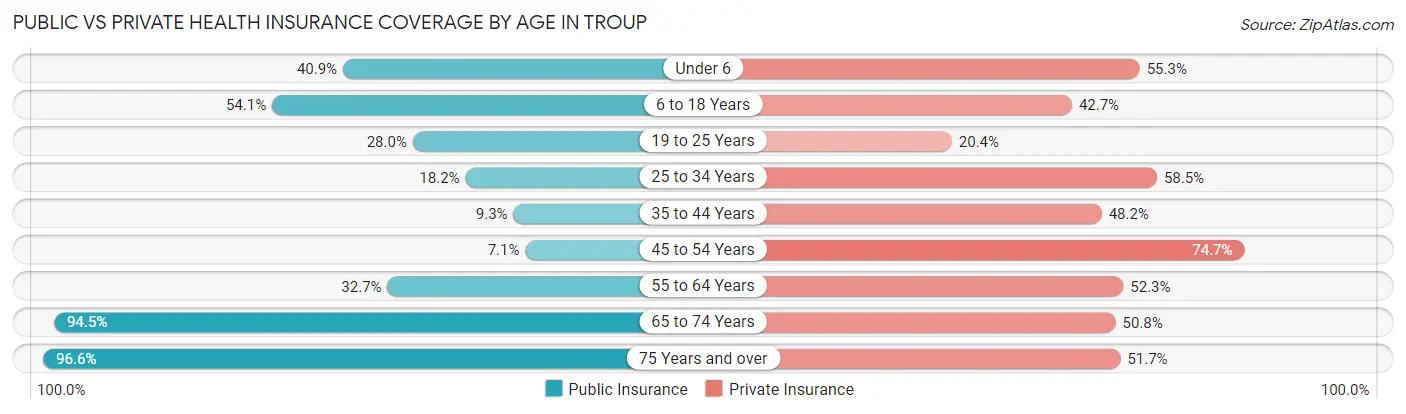
| Age Bracket | Public Insurance | Private Insurance |
| Under 6 | 54 (40.9%) | 73 (55.3%) |
| 6 to 18 Years | 338 (54.1%) | 267 (42.7%) |
| 19 to 25 Years | 52 (28.0%) | 38 (20.4%) |
| 25 to 34 Years | 46 (18.2%) | 148 (58.5%) |
| 35 to 44 Years | 29 (9.3%) | 151 (48.2%) |
| 45 to 54 Years | 12 (7.1%) | 127 (74.7%) |
| 55 to 64 Years | 65 (32.7%) | 104 (52.3%) |
| 65 to 74 Years | 173 (94.5%) | 93 (50.8%) |
| 75 Years and over | 84 (96.6%) | 45 (51.7%) |
| Total | 853 (39.7%) | 1,046 (48.7%) |
Disability Status by Sex by Age in Troup
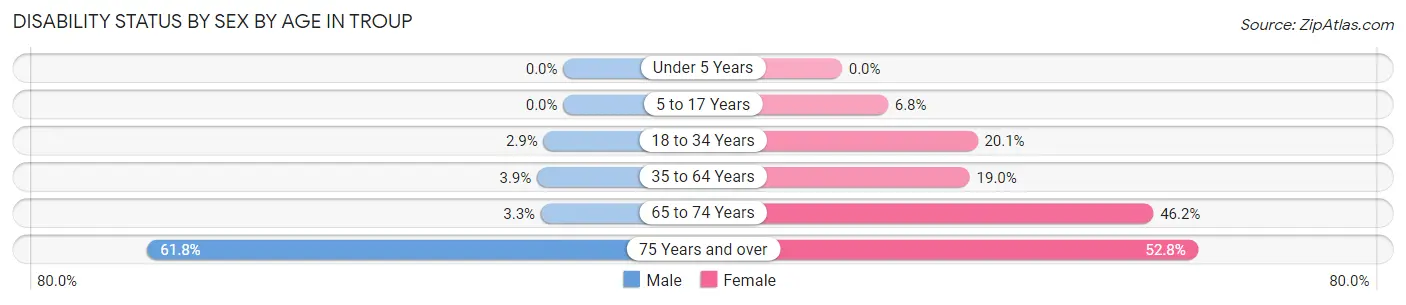
| Age Bracket | Male | Female |
| Under 5 Years | 0 (0.0%) | 0 (0.0%) |
| 5 to 17 Years | 0 (0.0%) | 20 (6.8%) |
| 18 to 34 Years | 6 (2.9%) | 57 (20.1%) |
| 35 to 64 Years | 12 (3.9%) | 71 (19.0%) |
| 65 to 74 Years | 3 (3.3%) | 43 (46.2%) |
| 75 Years and over | 21 (61.8%) | 28 (52.8%) |
Disability Class by Sex by Age in Troup
Disability Class: Hearing Difficulty
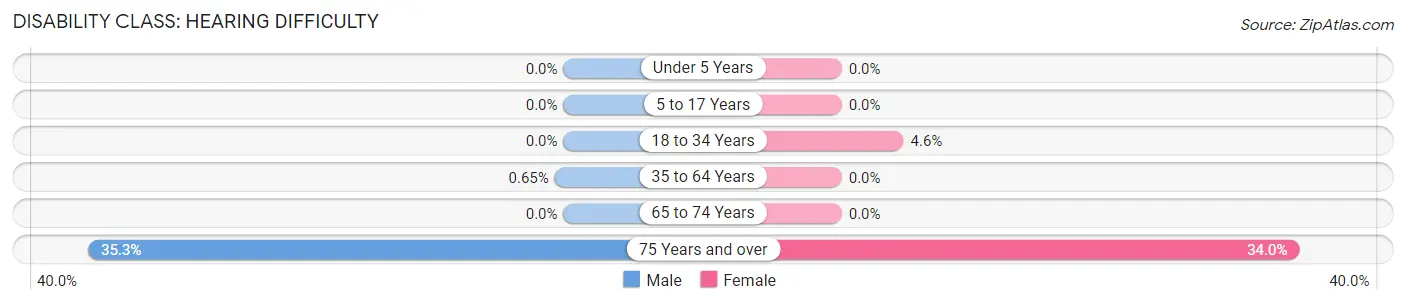
| Age Bracket | Male | Female |
| Under 5 Years | 0 (0.0%) | 0 (0.0%) |
| 5 to 17 Years | 0 (0.0%) | 0 (0.0%) |
| 18 to 34 Years | 0 (0.0%) | 13 (4.6%) |
| 35 to 64 Years | 2 (0.6%) | 0 (0.0%) |
| 65 to 74 Years | 0 (0.0%) | 0 (0.0%) |
| 75 Years and over | 12 (35.3%) | 18 (34.0%) |
Disability Class: Vision Difficulty
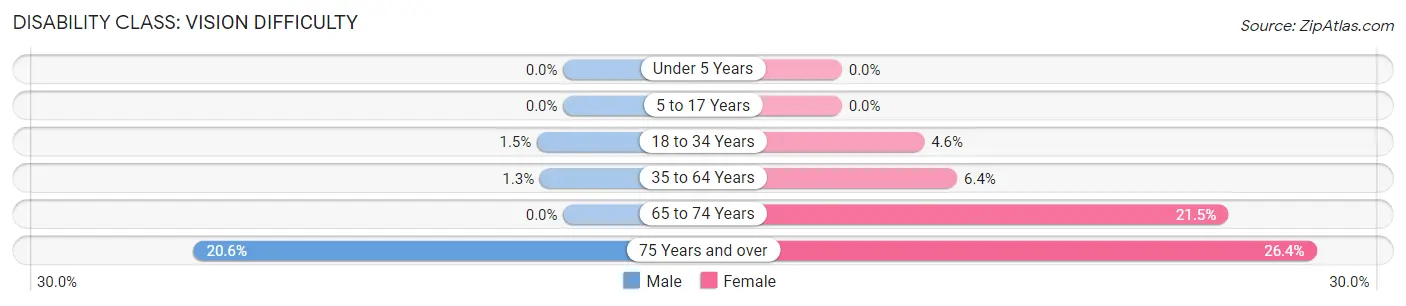
| Age Bracket | Male | Female |
| Under 5 Years | 0 (0.0%) | 0 (0.0%) |
| 5 to 17 Years | 0 (0.0%) | 0 (0.0%) |
| 18 to 34 Years | 3 (1.5%) | 13 (4.6%) |
| 35 to 64 Years | 4 (1.3%) | 24 (6.4%) |
| 65 to 74 Years | 0 (0.0%) | 20 (21.5%) |
| 75 Years and over | 7 (20.6%) | 14 (26.4%) |
Disability Class: Cognitive Difficulty
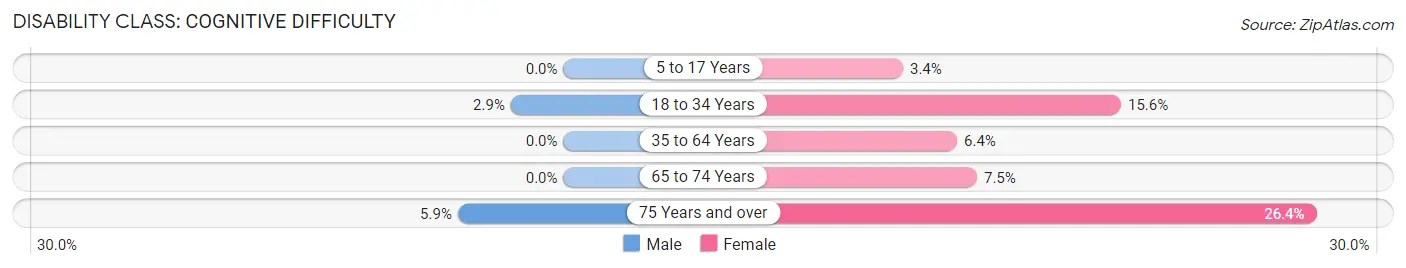
| Age Bracket | Male | Female |
| 5 to 17 Years | 0 (0.0%) | 10 (3.4%) |
| 18 to 34 Years | 6 (2.9%) | 44 (15.5%) |
| 35 to 64 Years | 0 (0.0%) | 24 (6.4%) |
| 65 to 74 Years | 0 (0.0%) | 7 (7.5%) |
| 75 Years and over | 2 (5.9%) | 14 (26.4%) |
Disability Class: Ambulatory Difficulty
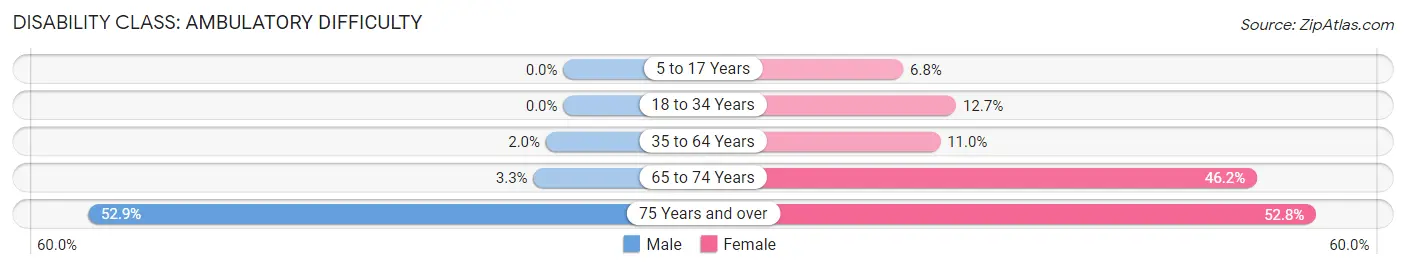
| Age Bracket | Male | Female |
| 5 to 17 Years | 0 (0.0%) | 20 (6.8%) |
| 18 to 34 Years | 0 (0.0%) | 36 (12.7%) |
| 35 to 64 Years | 6 (1.9%) | 41 (11.0%) |
| 65 to 74 Years | 3 (3.3%) | 43 (46.2%) |
| 75 Years and over | 18 (52.9%) | 28 (52.8%) |
Disability Class: Self-Care Difficulty
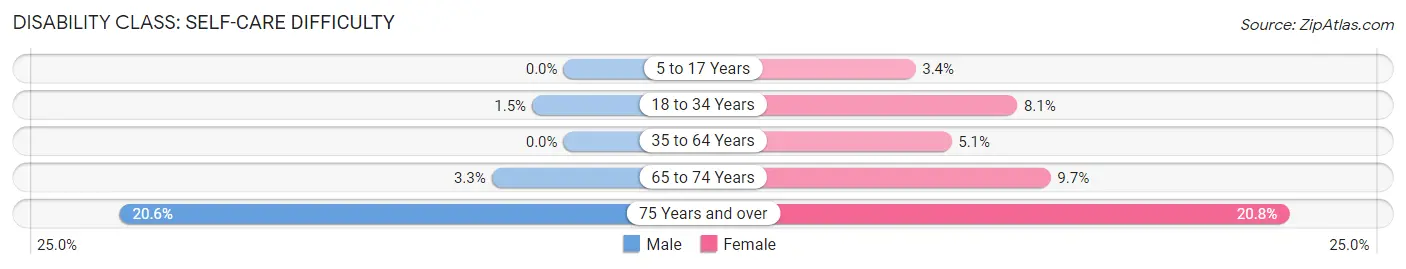
| Age Bracket | Male | Female |
| 5 to 17 Years | 0 (0.0%) | 10 (3.4%) |
| 18 to 34 Years | 3 (1.5%) | 23 (8.1%) |
| 35 to 64 Years | 0 (0.0%) | 19 (5.1%) |
| 65 to 74 Years | 3 (3.3%) | 9 (9.7%) |
| 75 Years and over | 7 (20.6%) | 11 (20.7%) |
Technology Access in Troup
Computing Device Access in Troup
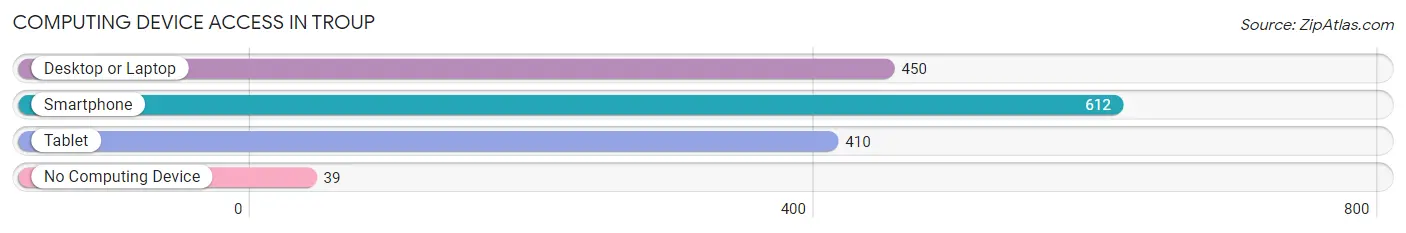
| Device Type | # Households | % Households |
| Desktop or Laptop | 450 | 65.3% |
| Smartphone | 612 | 88.8% |
| Tablet | 410 | 59.5% |
| No Computing Device | 39 | 5.7% |
| Total | 689 | 100.0% |
Internet Access in Troup
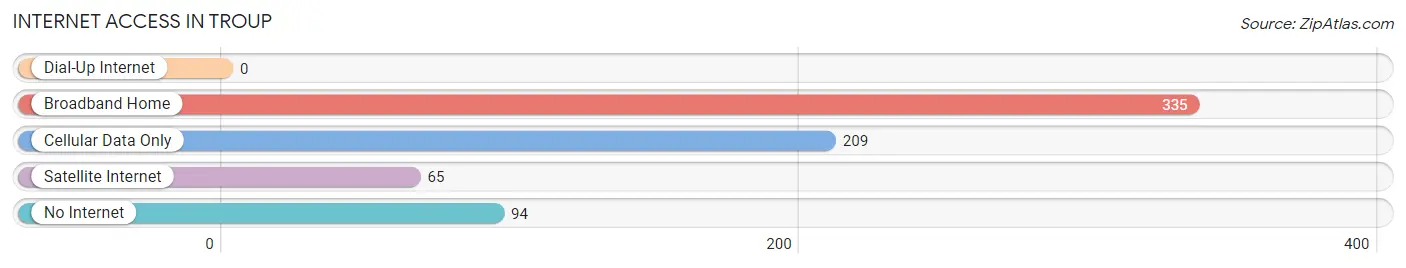
| Internet Type | # Households | % Households |
| Dial-Up Internet | 0 | 0.0% |
| Broadband Home | 335 | 48.6% |
| Cellular Data Only | 209 | 30.3% |
| Satellite Internet | 65 | 9.4% |
| No Internet | 94 | 13.6% |
| Total | 689 | 100.0% |
Troup Summary
Troup is a small town located in Smith County, Texas, United States. It is situated about 10 miles east of Tyler, the county seat. The population of Troup was 1,845 at the 2010 census, up from 1,717 at the 2000 census.
History
Troup was founded in 1872 by a group of settlers from Troup County, Georgia. The town was named after the county in Georgia, and the first post office was established in 1873. The town was incorporated in 1876.
Troup was a farming community for many years, and the town's economy was largely based on cotton production. In the early 1900s, the town began to diversify its economy, and the first bank was established in 1910.
In the 1920s, the town experienced a period of growth, and several new businesses were established. The town also saw the construction of a new school and a new courthouse.
In the 1950s, the town's economy began to decline, and many businesses closed. The population of Troup began to decline as well, and by the 1970s, the population had dropped to just over 1,000.
Geography
Troup is located at 32°14'25" North, 95°20'45" West (32.240278, -95.345833). The town is situated in the eastern part of Smith County, about 10 miles east of Tyler, the county seat.
The town has a total area of 2.2 square miles, all of which is land. The town is located in the Piney Woods region of East Texas, and the terrain is mostly flat.
Economy
The economy of Troup is largely based on agriculture. The town is home to several farms, and the main crops grown in the area are cotton, corn, and soybeans.
The town also has a few small businesses, including a grocery store, a hardware store, and a few restaurants.
Demographics
As of the 2010 census, the population of Troup was 1,845. The racial makeup of the town was 79.3% White, 17.2% African American, 0.7% Native American, 0.3% Asian, 0.1% Pacific Islander, and 2.4% from other races. Hispanic or Latino of any race were 4.2% of the population.
The median household income in Troup was $31,250, and the median family income was $37,500. The per capita income was $15,945. About 17.2% of families and 20.2% of the population were below the poverty line, including 28.3% of those under age 18 and 11.2% of those age 65 or over.
Common Questions
What is Per Capita Income in Troup?
Per Capita income in Troup is $19,983.
What is the Median Family Income in Troup?
Median Family Income in Troup is $56,250.
What is the Median Household income in Troup?
Median Household Income in Troup is $49,063.
What is Income or Wage Gap in Troup?
Income or Wage Gap in Troup is 43.7%.
Women in Troup earn 56.3 cents for every dollar earned by a man.
What is Inequality or Gini Index in Troup?
Inequality or Gini Index in Troup is 0.43.
What is the Total Population of Troup?
Total Population of Troup is 2,148.
What is the Total Male Population of Troup?
Total Male Population of Troup is 1,026.
What is the Total Female Population of Troup?
Total Female Population of Troup is 1,122.
What is the Ratio of Males per 100 Females in Troup?
There are 91.44 Males per 100 Females in Troup.
What is the Ratio of Females per 100 Males in Troup?
There are 109.36 Females per 100 Males in Troup.
What is the Median Population Age in Troup?
Median Population Age in Troup is 31.5 Years.
What is the Average Family Size in Troup
Average Family Size in Troup is 3.8 People.
What is the Average Household Size in Troup
Average Household Size in Troup is 3.1 People.
How Large is the Labor Force in Troup?
There are 969 People in the Labor Forcein in Troup.
What is the Percentage of People in the Labor Force in Troup?
63.4% of People are in the Labor Force in Troup.
What is the Unemployment Rate in Troup?
Unemployment Rate in Troup is 18.5%.