Trinidad, TX Map & Demographics
Trinidad Map
Trinidad Overview
$17,950
PER CAPITA INCOME
$56,250
AVG FAMILY INCOME
$32,143
AVG HOUSEHOLD INCOME
46.0%
WAGE / INCOME GAP [ % ]
54.0¢/ $1
WAGE / INCOME GAP [ $ ]
0.44
INEQUALITY / GINI INDEX
933
TOTAL POPULATION
444
MALE POPULATION
489
FEMALE POPULATION
90.80
MALES / 100 FEMALES
110.14
FEMALES / 100 MALES
34.2
MEDIAN AGE
3.7
AVG FAMILY SIZE
2.8
AVG HOUSEHOLD SIZE
320
LABOR FORCE [ PEOPLE ]
45.7%
PERCENT IN LABOR FORCE
2.5%
UNEMPLOYMENT RATE
Trinidad Zip Codes
Income in Trinidad
Income Overview in Trinidad
Per Capita Income in Trinidad is $17,950, while median incomes of families and households are $56,250 and $32,143 respectively.
| Characteristic | Number | Measure |
| Per Capita Income | 933 | $17,950 |
| Median Family Income | 210 | $56,250 |
| Mean Family Income | 210 | $60,921 |
| Median Household Income | 338 | $32,143 |
| Mean Household Income | 338 | $47,493 |
| Income Deficit | 210 | $0 |
| Wage / Income Gap (%) | 933 | 45.96% |
| Wage / Income Gap ($) | 933 | 54.04¢ per $1 |
| Gini / Inequality Index | 933 | 0.44 |
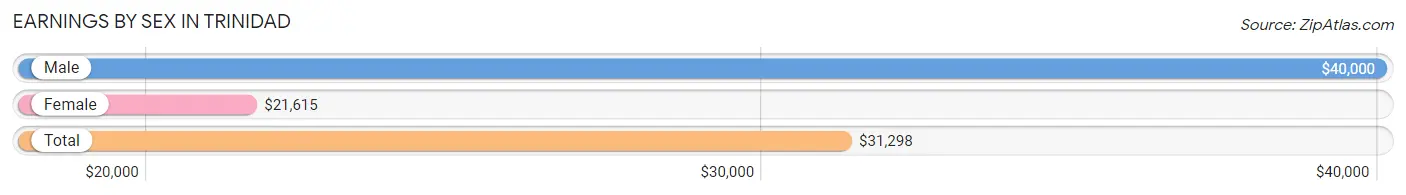
Earnings by Sex in Trinidad
Average Earnings in Trinidad are $31,298, $40,000 for men and $21,615 for women, a difference of 46.0%.
| Sex | Number | Average Earnings |
| Male | 172 (52.0%) | $40,000 |
| Female | 159 (48.0%) | $21,615 |
| Total | 331 (100.0%) | $31,298 |
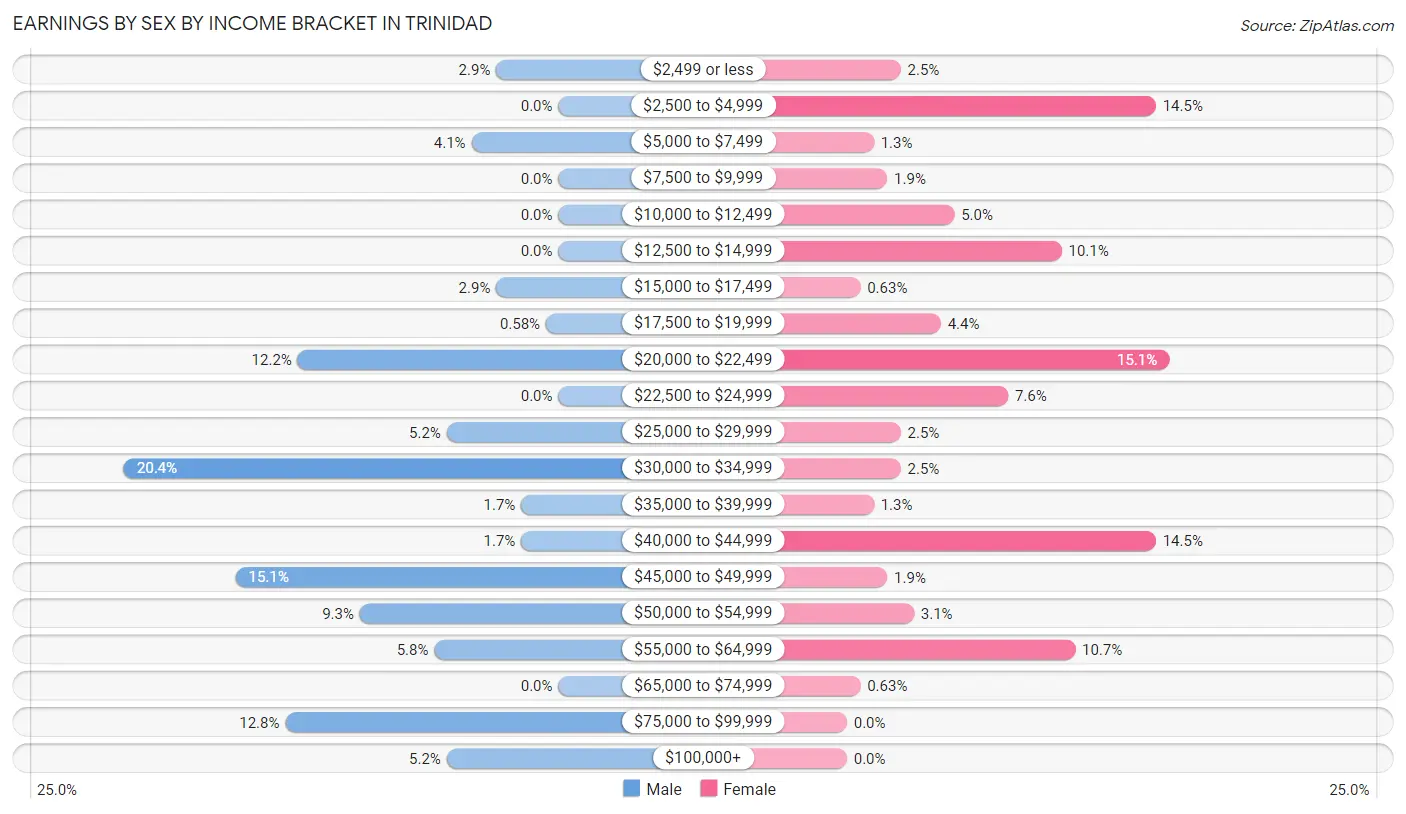
Earnings by Sex by Income Bracket in Trinidad
The most common earnings brackets in Trinidad are $30,000 to $34,999 for men (35 | 20.3%) and $20,000 to $22,499 for women (24 | 15.1%).
| Income | Male | Female |
| $2,499 or less | 5 (2.9%) | 4 (2.5%) |
| $2,500 to $4,999 | 0 (0.0%) | 23 (14.5%) |
| $5,000 to $7,499 | 7 (4.1%) | 2 (1.3%) |
| $7,500 to $9,999 | 0 (0.0%) | 3 (1.9%) |
| $10,000 to $12,499 | 0 (0.0%) | 8 (5.0%) |
| $12,500 to $14,999 | 0 (0.0%) | 16 (10.1%) |
| $15,000 to $17,499 | 5 (2.9%) | 1 (0.6%) |
| $17,500 to $19,999 | 1 (0.6%) | 7 (4.4%) |
| $20,000 to $22,499 | 21 (12.2%) | 24 (15.1%) |
| $22,500 to $24,999 | 0 (0.0%) | 12 (7.5%) |
| $25,000 to $29,999 | 9 (5.2%) | 4 (2.5%) |
| $30,000 to $34,999 | 35 (20.3%) | 4 (2.5%) |
| $35,000 to $39,999 | 3 (1.7%) | 2 (1.3%) |
| $40,000 to $44,999 | 3 (1.7%) | 23 (14.5%) |
| $45,000 to $49,999 | 26 (15.1%) | 3 (1.9%) |
| $50,000 to $54,999 | 16 (9.3%) | 5 (3.1%) |
| $55,000 to $64,999 | 10 (5.8%) | 17 (10.7%) |
| $65,000 to $74,999 | 0 (0.0%) | 1 (0.6%) |
| $75,000 to $99,999 | 22 (12.8%) | 0 (0.0%) |
| $100,000+ | 9 (5.2%) | 0 (0.0%) |
| Total | 172 (100.0%) | 159 (100.0%) |
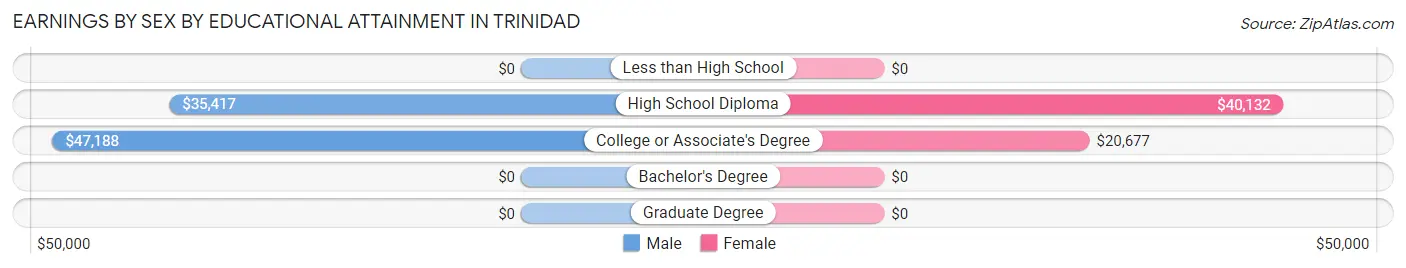
Earnings by Sex by Educational Attainment in Trinidad
Average earnings in Trinidad are $47,625 for men and $21,927 for women, a difference of 54.0%. Men with an educational attainment of college or associate's degree enjoy the highest average annual earnings of $47,188, while those with high school diploma education earn the least with $35,417. Women with an educational attainment of high school diploma earn the most with the average annual earnings of $40,132, while those with college or associate's degree education have the smallest earnings of $20,677.
| Educational Attainment | Male Income | Female Income |
| Less than High School | - | - |
| High School Diploma | $35,417 | $40,132 |
| College or Associate's Degree | $47,188 | $20,677 |
| Bachelor's Degree | - | - |
| Graduate Degree | - | - |
| Total | $47,625 | $21,927 |
Family Income in Trinidad
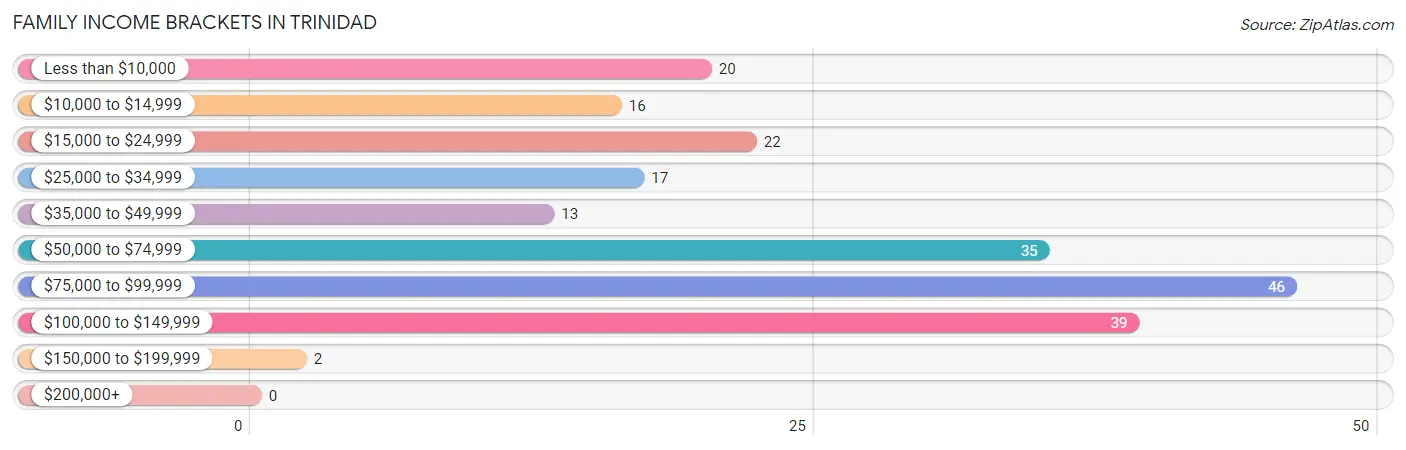
Family Income Brackets in Trinidad
According to the Trinidad family income data, there are 46 families falling into the $75,000 to $99,999 income range, which is the most common income bracket and makes up 21.9% of all families.
| Income Bracket | # Families | % Families |
| Less than $10,000 | 20 | 9.5% |
| $10,000 to $14,999 | 16 | 7.6% |
| $15,000 to $24,999 | 22 | 10.5% |
| $25,000 to $34,999 | 17 | 8.1% |
| $35,000 to $49,999 | 13 | 6.2% |
| $50,000 to $74,999 | 35 | 16.7% |
| $75,000 to $99,999 | 46 | 21.9% |
| $100,000 to $149,999 | 39 | 18.6% |
| $150,000 to $199,999 | 2 | 1.0% |
| $200,000+ | 0 | 0.0% |
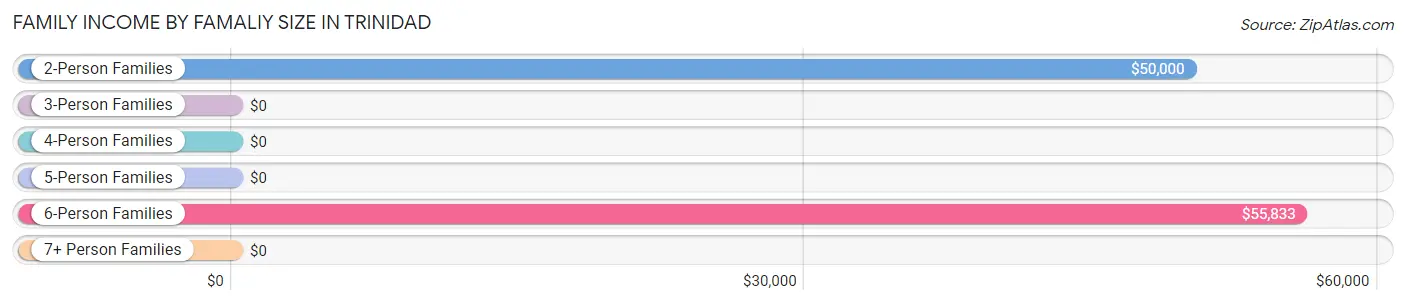
Family Income by Famaliy Size in Trinidad
6-person families (30 | 14.3%) account for the highest median family income in Trinidad with $55,833 per family, while 2-person families (90 | 42.9%) have the highest median income of $25,000 per family member.
| Income Bracket | # Families | Median Income |
| 2-Person Families | 90 (42.9%) | $50,000 |
| 3-Person Families | 49 (23.3%) | $0 |
| 4-Person Families | 35 (16.7%) | $0 |
| 5-Person Families | 6 (2.9%) | $0 |
| 6-Person Families | 30 (14.3%) | $55,833 |
| 7+ Person Families | 0 (0.0%) | $0 |
| Total | 210 (100.0%) | $56,250 |
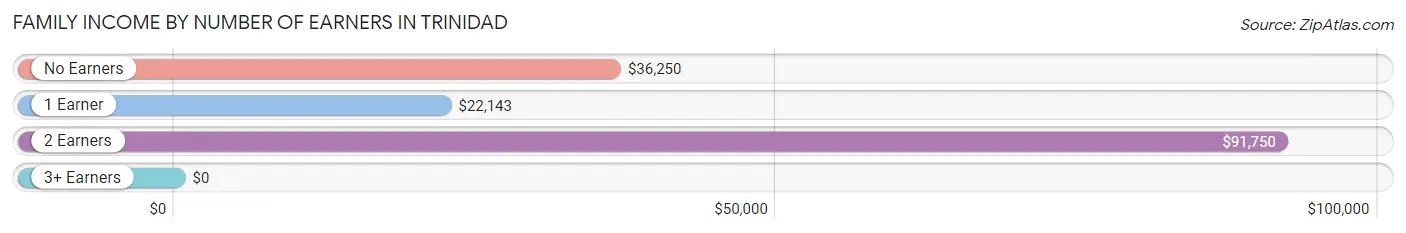
Family Income by Number of Earners in Trinidad
| Number of Earners | # Families | Median Income |
| No Earners | 42 (20.0%) | $36,250 |
| 1 Earner | 74 (35.2%) | $22,143 |
| 2 Earners | 84 (40.0%) | $91,750 |
| 3+ Earners | 10 (4.8%) | $0 |
| Total | 210 (100.0%) | $56,250 |
Household Income in Trinidad
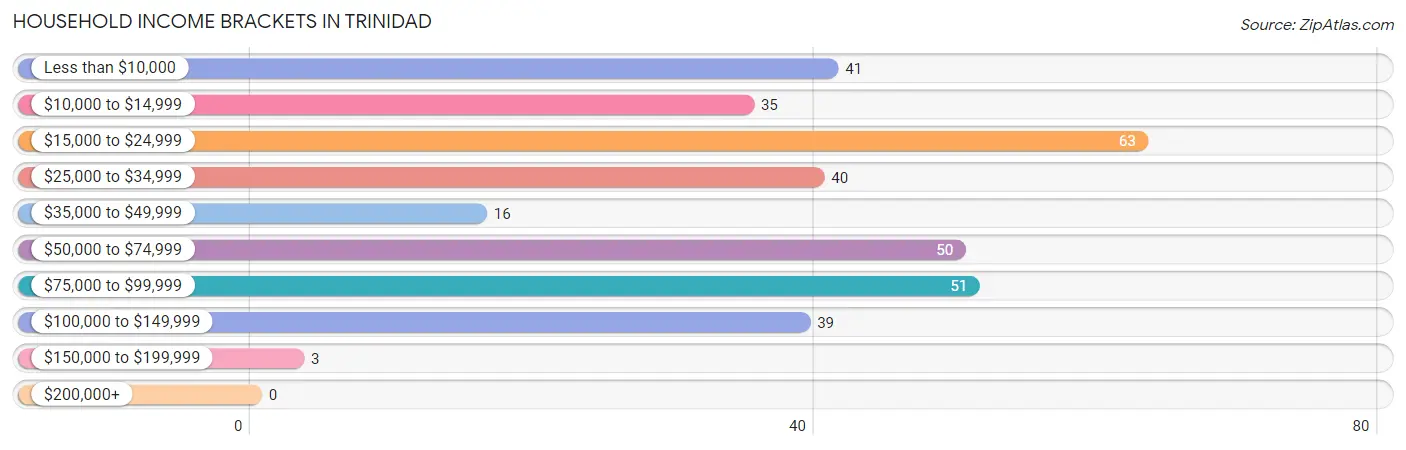
Household Income Brackets in Trinidad
With 63 households falling in the category, the $15,000 to $24,999 income range is the most frequent in Trinidad, accounting for 18.6% of all households.
| Income Bracket | # Households | % Households |
| Less than $10,000 | 41 | 12.1% |
| $10,000 to $14,999 | 35 | 10.4% |
| $15,000 to $24,999 | 63 | 18.6% |
| $25,000 to $34,999 | 40 | 11.8% |
| $35,000 to $49,999 | 16 | 4.7% |
| $50,000 to $74,999 | 50 | 14.8% |
| $75,000 to $99,999 | 51 | 15.1% |
| $100,000 to $149,999 | 39 | 11.5% |
| $150,000 to $199,999 | 3 | 0.9% |
| $200,000+ | 0 | 0.0% |
Household Income by Householder Age in Trinidad
The median household income in Trinidad is $32,143, with the highest median household income of $51,250 found in the 25 to 44 years age bracket for the primary householder. A total of 147 households (43.5%) fall into this category. Meanwhile, the 15 to 24 years age bracket for the primary householder has the lowest median household income of $0, with 2 households (0.6%) in this group.
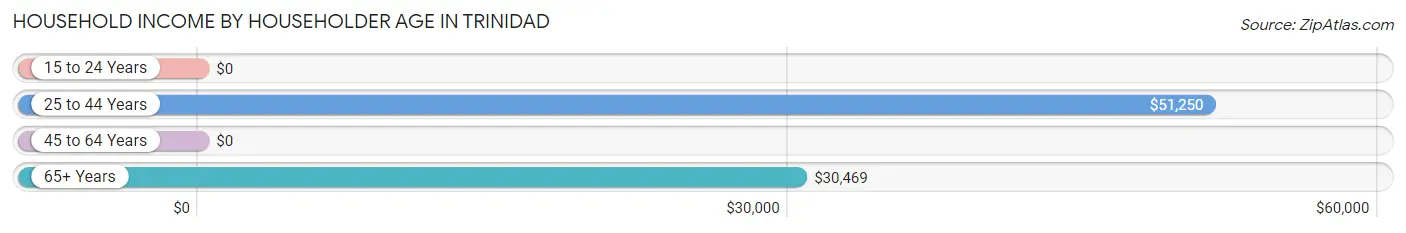
| Income Bracket | # Households | Median Income |
| 15 to 24 Years | 2 (0.6%) | $0 |
| 25 to 44 Years | 147 (43.5%) | $51,250 |
| 45 to 64 Years | 82 (24.3%) | $0 |
| 65+ Years | 107 (31.7%) | $30,469 |
| Total | 338 (100.0%) | $32,143 |
Poverty in Trinidad
Income Below Poverty by Sex and Age in Trinidad
With 18.3% poverty level for males and 33.5% for females among the residents of Trinidad, 25 to 34 year old males and 15 year old females are the most vulnerable to poverty, with 29 males (52.7%) and 4 females (100.0%) in their respective age groups living below the poverty level.
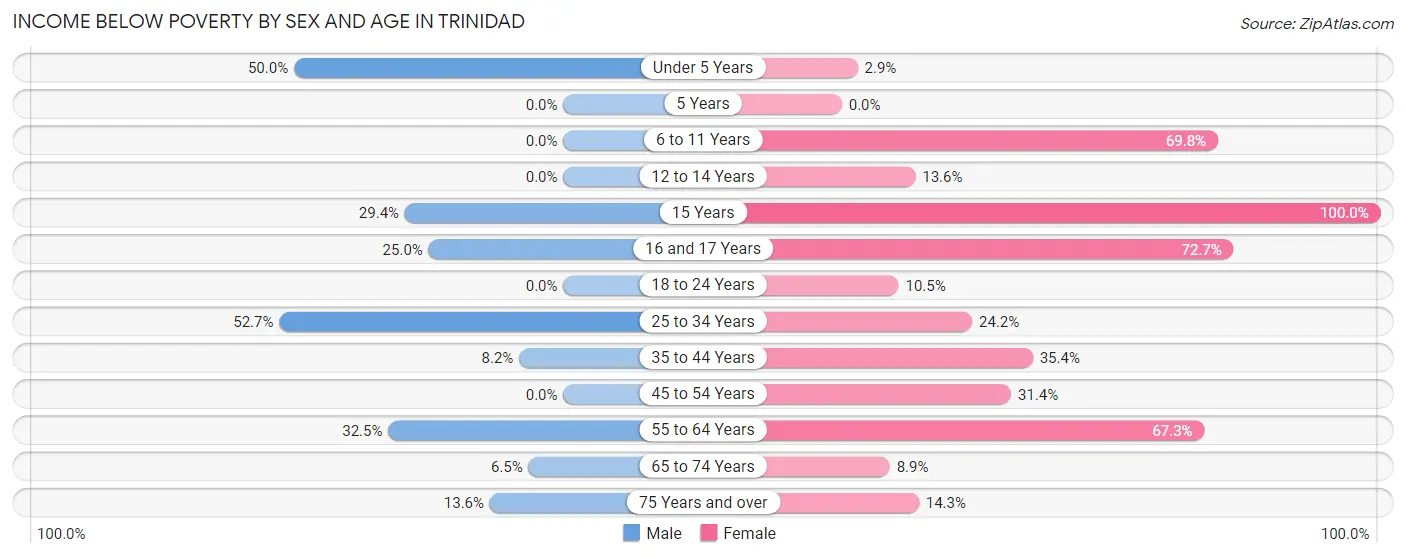
| Age Bracket | Male | Female |
| Under 5 Years | 20 (50.0%) | 1 (2.9%) |
| 5 Years | 0 (0.0%) | 0 (0.0%) |
| 6 to 11 Years | 0 (0.0%) | 37 (69.8%) |
| 12 to 14 Years | 0 (0.0%) | 3 (13.6%) |
| 15 Years | 5 (29.4%) | 4 (100.0%) |
| 16 and 17 Years | 3 (25.0%) | 16 (72.7%) |
| 18 to 24 Years | 0 (0.0%) | 2 (10.5%) |
| 25 to 34 Years | 29 (52.7%) | 15 (24.2%) |
| 35 to 44 Years | 5 (8.2%) | 28 (35.4%) |
| 45 to 54 Years | 0 (0.0%) | 11 (31.4%) |
| 55 to 64 Years | 13 (32.5%) | 35 (67.3%) |
| 65 to 74 Years | 2 (6.5%) | 4 (8.9%) |
| 75 Years and over | 3 (13.6%) | 8 (14.3%) |
| Total | 80 (18.3%) | 164 (33.5%) |
Income Above Poverty by Sex and Age in Trinidad
According to the poverty statistics in Trinidad, males aged 6 to 11 years and females aged 5 years are the age groups that are most secure financially, with 100.0% of males and 100.0% of females in these age groups living above the poverty line.
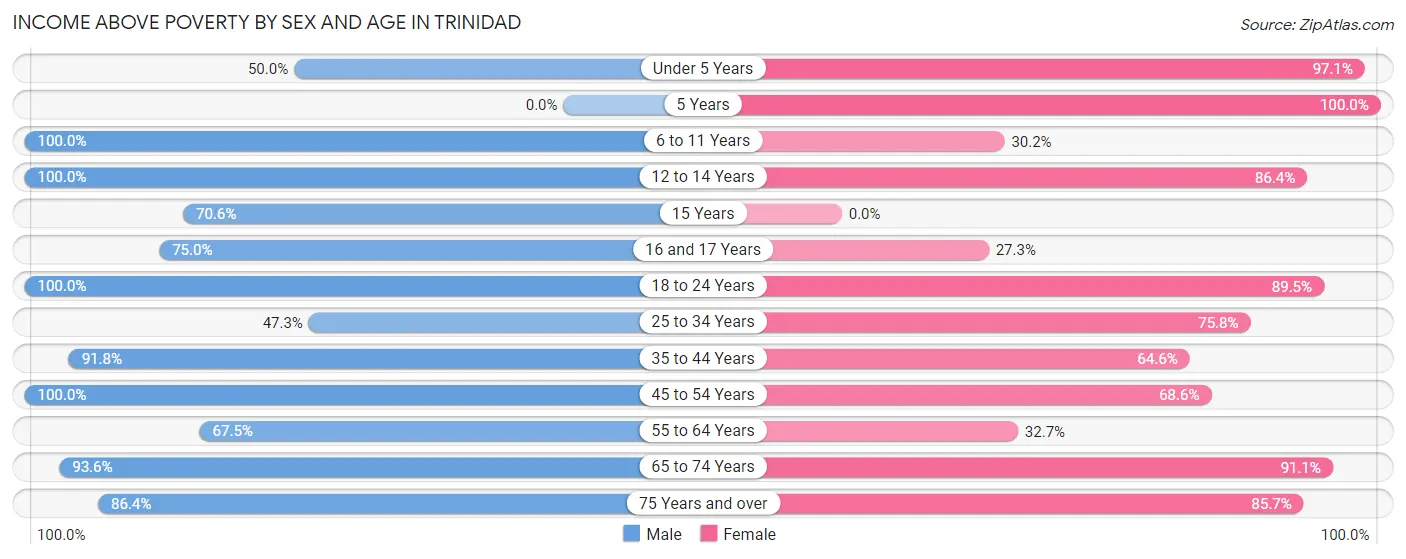
| Age Bracket | Male | Female |
| Under 5 Years | 20 (50.0%) | 33 (97.1%) |
| 5 Years | 0 (0.0%) | 6 (100.0%) |
| 6 to 11 Years | 37 (100.0%) | 16 (30.2%) |
| 12 to 14 Years | 13 (100.0%) | 19 (86.4%) |
| 15 Years | 12 (70.6%) | 0 (0.0%) |
| 16 and 17 Years | 9 (75.0%) | 6 (27.3%) |
| 18 to 24 Years | 79 (100.0%) | 17 (89.5%) |
| 25 to 34 Years | 26 (47.3%) | 47 (75.8%) |
| 35 to 44 Years | 56 (91.8%) | 51 (64.6%) |
| 45 to 54 Years | 30 (100.0%) | 24 (68.6%) |
| 55 to 64 Years | 27 (67.5%) | 17 (32.7%) |
| 65 to 74 Years | 29 (93.5%) | 41 (91.1%) |
| 75 Years and over | 19 (86.4%) | 48 (85.7%) |
| Total | 357 (81.7%) | 325 (66.5%) |
Income Below Poverty Among Married-Couple Families in Trinidad
The poverty statistics for married-couple families in Trinidad show that 12.7% or 20 of the total 158 families live below the poverty line. Families with 1 or 2 children have the highest poverty rate of 36.5%, comprising of 19 families. On the other hand, families with 3 or 4 children have the lowest poverty rate of 0.0%, which includes 0 families.
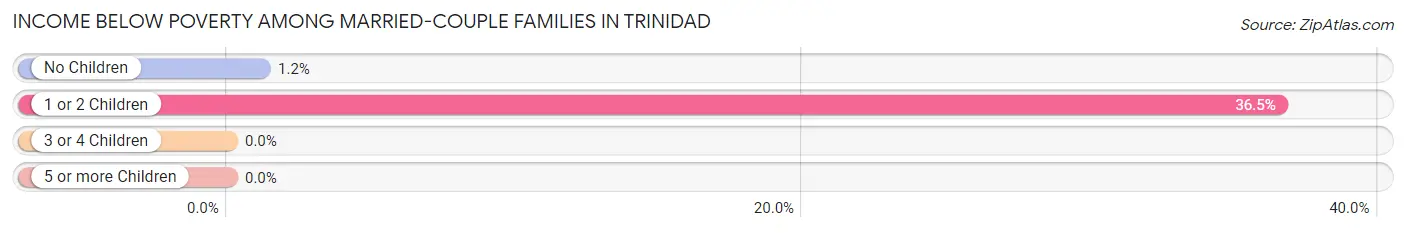
| Children | Above Poverty | Below Poverty |
| No Children | 86 (98.9%) | 1 (1.1%) |
| 1 or 2 Children | 33 (63.5%) | 19 (36.5%) |
| 3 or 4 Children | 19 (100.0%) | 0 (0.0%) |
| 5 or more Children | 0 (0.0%) | 0 (0.0%) |
| Total | 138 (87.3%) | 20 (12.7%) |
Income Below Poverty Among Single-Parent Households in Trinidad
According to the poverty data in Trinidad, 12.5% or 1 single-father households and 68.2% or 30 single-mother households are living below the poverty line. Among single-father households, those with 3 or 4 children have the highest poverty rate, with 1 households (20.0%) experiencing poverty. Likewise, among single-mother households, those with 3 or 4 children have the highest poverty rate, with 16 households (100.0%) falling below the poverty line.
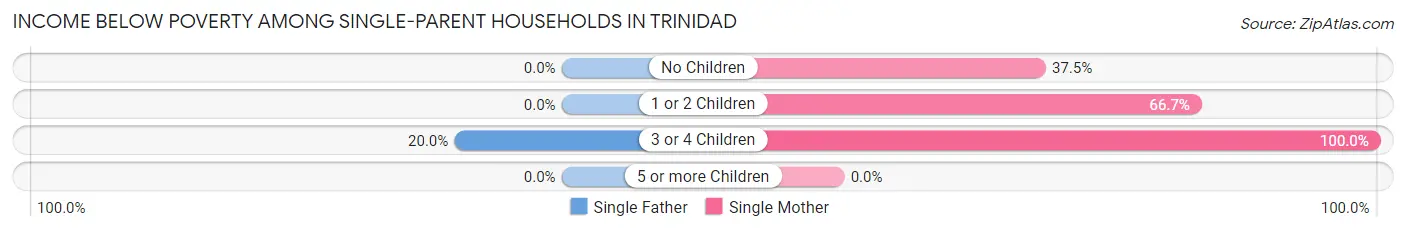
| Children | Single Father | Single Mother |
| No Children | 0 (0.0%) | 6 (37.5%) |
| 1 or 2 Children | 0 (0.0%) | 8 (66.7%) |
| 3 or 4 Children | 1 (20.0%) | 16 (100.0%) |
| 5 or more Children | 0 (0.0%) | 0 (0.0%) |
| Total | 1 (12.5%) | 30 (68.2%) |
Income Below Poverty Among Married-Couple vs Single-Parent Households in Trinidad
The poverty data for Trinidad shows that 20 of the married-couple family households (12.7%) and 31 of the single-parent households (59.6%) are living below the poverty level. Within the married-couple family households, those with 1 or 2 children have the highest poverty rate, with 19 households (36.5%) falling below the poverty line. Among the single-parent households, those with 3 or 4 children have the highest poverty rate, with 17 household (80.9%) living below poverty.
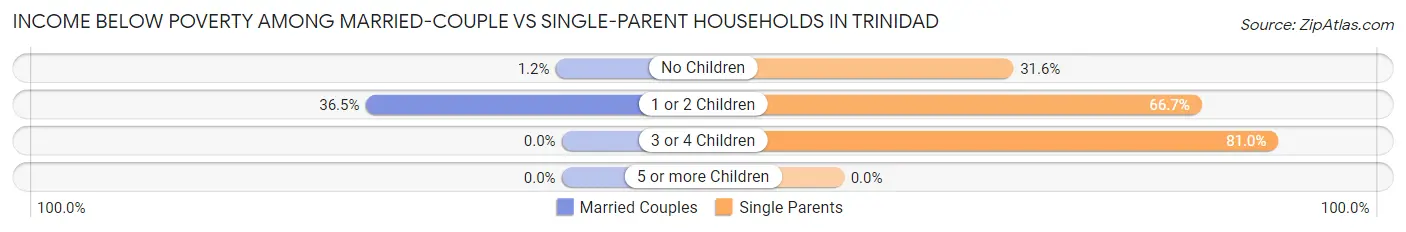
| Children | Married-Couple Families | Single-Parent Households |
| No Children | 1 (1.1%) | 6 (31.6%) |
| 1 or 2 Children | 19 (36.5%) | 8 (66.7%) |
| 3 or 4 Children | 0 (0.0%) | 17 (80.9%) |
| 5 or more Children | 0 (0.0%) | 0 (0.0%) |
| Total | 20 (12.7%) | 31 (59.6%) |
Race in Trinidad
The most populous races in Trinidad are White / Caucasian (561 | 60.1%), Black / African American (315 | 33.8%), and Hispanic or Latino (88 | 9.4%).
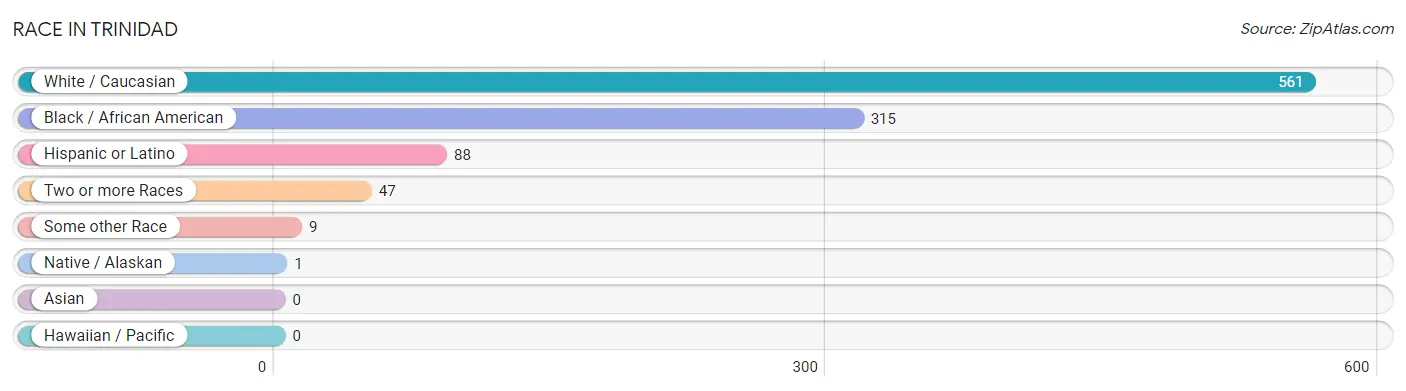
| Race | # Population | % Population |
| Asian | 0 | 0.0% |
| Black / African American | 315 | 33.8% |
| Hawaiian / Pacific | 0 | 0.0% |
| Hispanic or Latino | 88 | 9.4% |
| Native / Alaskan | 1 | 0.1% |
| White / Caucasian | 561 | 60.1% |
| Two or more Races | 47 | 5.0% |
| Some other Race | 9 | 1.0% |
| Total | 933 | 100.0% |
Ancestry in Trinidad
The most populous ancestries reported in Trinidad are Irish (99 | 10.6%), Mexican (88 | 9.4%), English (52 | 5.6%), American (39 | 4.2%), and German (34 | 3.6%), together accounting for 33.4% of all Trinidad residents.
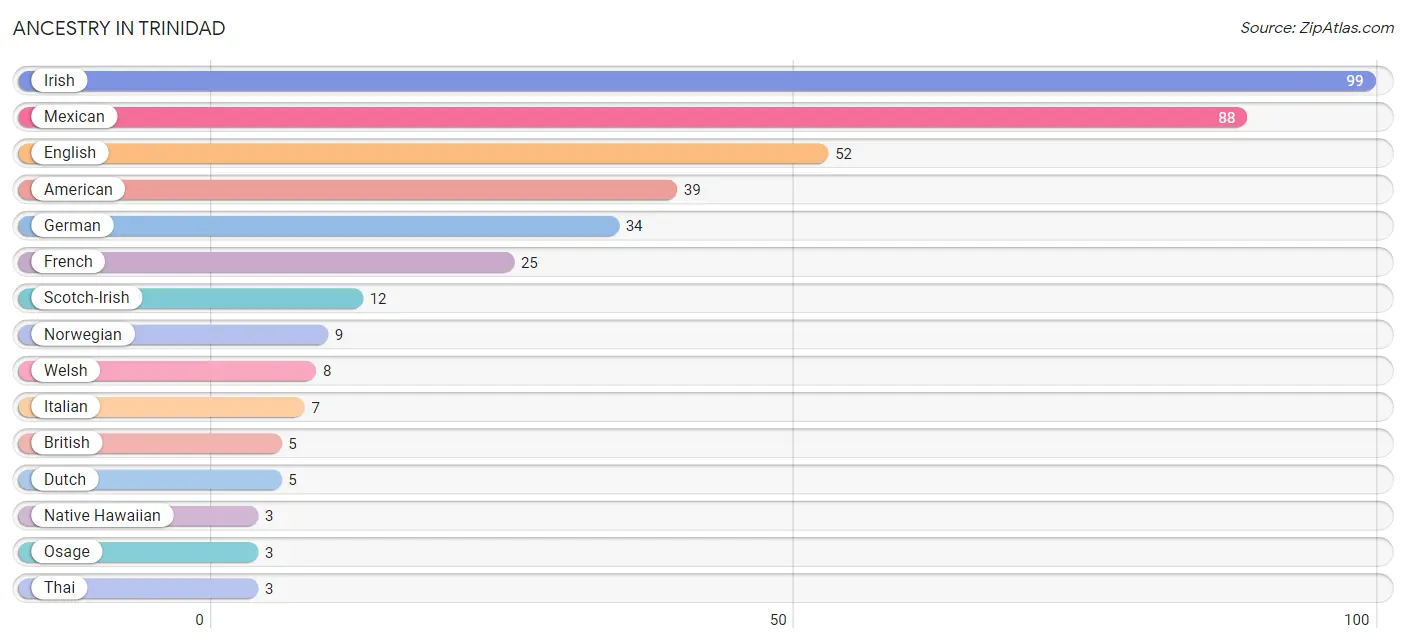
| Ancestry | # Population | % Population |
| American | 39 | 4.2% |
| British | 5 | 0.5% |
| Cherokee | 1 | 0.1% |
| Dutch | 5 | 0.5% |
| English | 52 | 5.6% |
| French | 25 | 2.7% |
| German | 34 | 3.6% |
| Irish | 99 | 10.6% |
| Italian | 7 | 0.7% |
| Mexican | 88 | 9.4% |
| Native Hawaiian | 3 | 0.3% |
| Norwegian | 9 | 1.0% |
| Osage | 3 | 0.3% |
| Scotch-Irish | 12 | 1.3% |
| Thai | 3 | 0.3% |
| Welsh | 8 | 0.9% | View All 16 Rows |
Immigrants in Trinidad
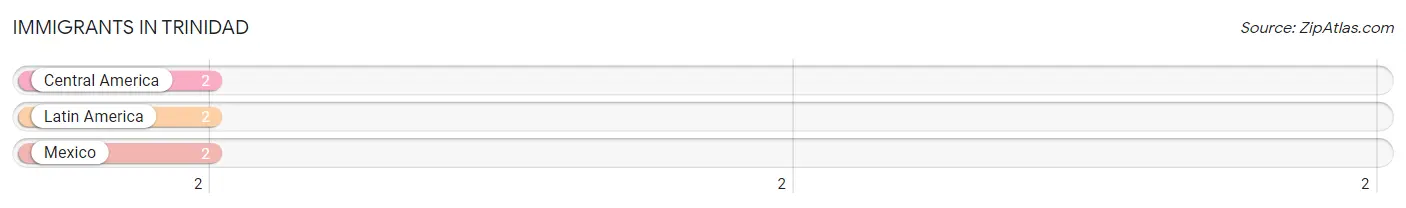
The most numerous immigrant groups reported in Trinidad came from Central America (2 | 0.2%), Latin America (2 | 0.2%), and Mexico (2 | 0.2%), together accounting for 0.6% of all Trinidad residents.
| Immigration Origin | # Population | % Population |
| Central America | 2 | 0.2% |
| Latin America | 2 | 0.2% |
| Mexico | 2 | 0.2% | View All 3 Rows |
Sex and Age in Trinidad
Sex and Age in Trinidad
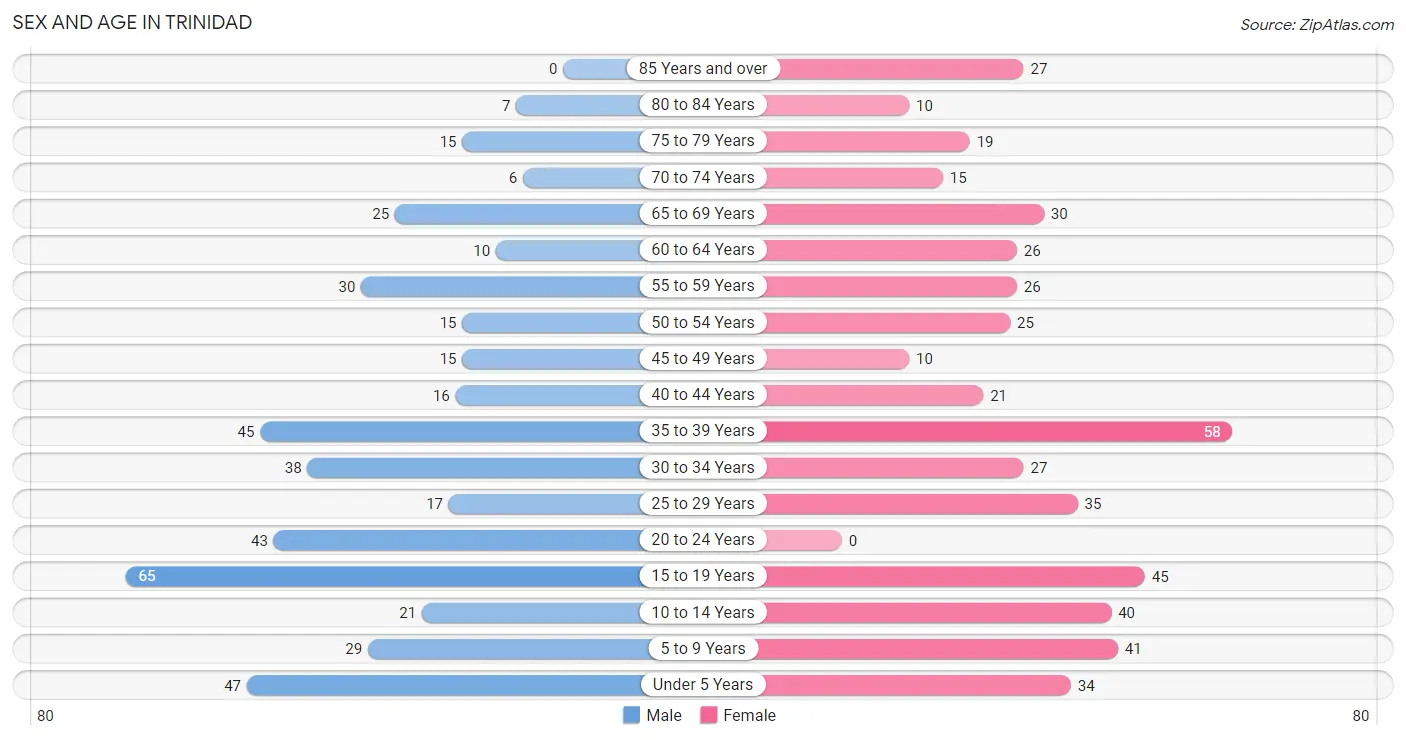
The most populous age groups in Trinidad are 15 to 19 Years (65 | 14.6%) for men and 35 to 39 Years (58 | 11.9%) for women.
| Age Bracket | Male | Female |
| Under 5 Years | 47 (10.6%) | 34 (7.0%) |
| 5 to 9 Years | 29 (6.5%) | 41 (8.4%) |
| 10 to 14 Years | 21 (4.7%) | 40 (8.2%) |
| 15 to 19 Years | 65 (14.6%) | 45 (9.2%) |
| 20 to 24 Years | 43 (9.7%) | 0 (0.0%) |
| 25 to 29 Years | 17 (3.8%) | 35 (7.2%) |
| 30 to 34 Years | 38 (8.6%) | 27 (5.5%) |
| 35 to 39 Years | 45 (10.1%) | 58 (11.9%) |
| 40 to 44 Years | 16 (3.6%) | 21 (4.3%) |
| 45 to 49 Years | 15 (3.4%) | 10 (2.0%) |
| 50 to 54 Years | 15 (3.4%) | 25 (5.1%) |
| 55 to 59 Years | 30 (6.8%) | 26 (5.3%) |
| 60 to 64 Years | 10 (2.2%) | 26 (5.3%) |
| 65 to 69 Years | 25 (5.6%) | 30 (6.1%) |
| 70 to 74 Years | 6 (1.3%) | 15 (3.1%) |
| 75 to 79 Years | 15 (3.4%) | 19 (3.9%) |
| 80 to 84 Years | 7 (1.6%) | 10 (2.0%) |
| 85 Years and over | 0 (0.0%) | 27 (5.5%) |
| Total | 444 (100.0%) | 489 (100.0%) |
Families and Households in Trinidad
Median Family Size in Trinidad
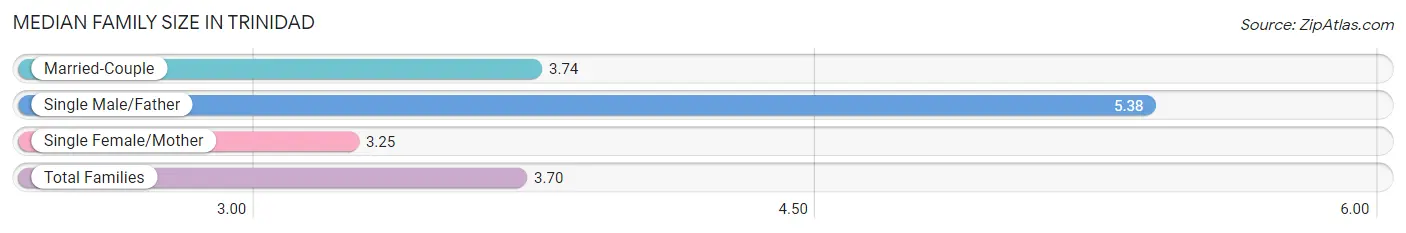
The median family size in Trinidad is 3.70 persons per family, with single male/father families (8 | 3.8%) accounting for the largest median family size of 5.38 persons per family. On the other hand, single female/mother families (44 | 20.9%) represent the smallest median family size with 3.25 persons per family.
| Family Type | # Families | Family Size |
| Married-Couple | 158 (75.2%) | 3.74 |
| Single Male/Father | 8 (3.8%) | 5.38 |
| Single Female/Mother | 44 (20.9%) | 3.25 |
| Total Families | 210 (100.0%) | 3.70 |
Median Household Size in Trinidad
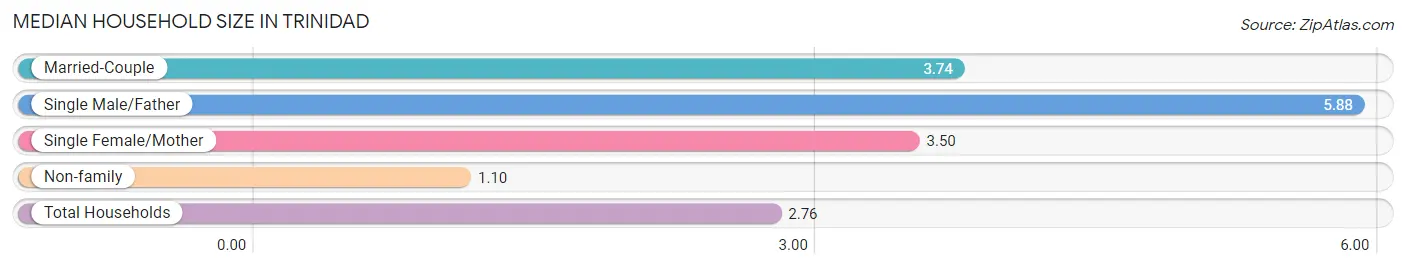
The median household size in Trinidad is 2.76 persons per household, with single male/father households (8 | 2.4%) accounting for the largest median household size of 5.88 persons per household. non-family households (128 | 37.9%) represent the smallest median household size with 1.10 persons per household.
| Household Type | # Households | Household Size |
| Married-Couple | 158 (46.8%) | 3.74 |
| Single Male/Father | 8 (2.4%) | 5.88 |
| Single Female/Mother | 44 (13.0%) | 3.50 |
| Non-family | 128 (37.9%) | 1.10 |
| Total Households | 338 (100.0%) | 2.76 |
Household Size by Marriage Status in Trinidad
Out of a total of 338 households in Trinidad, 210 (62.1%) are family households, while 128 (37.9%) are nonfamily households. The most numerous type of family households are 2-person households, comprising 83, and the most common type of nonfamily households are 1-person households, comprising 112.
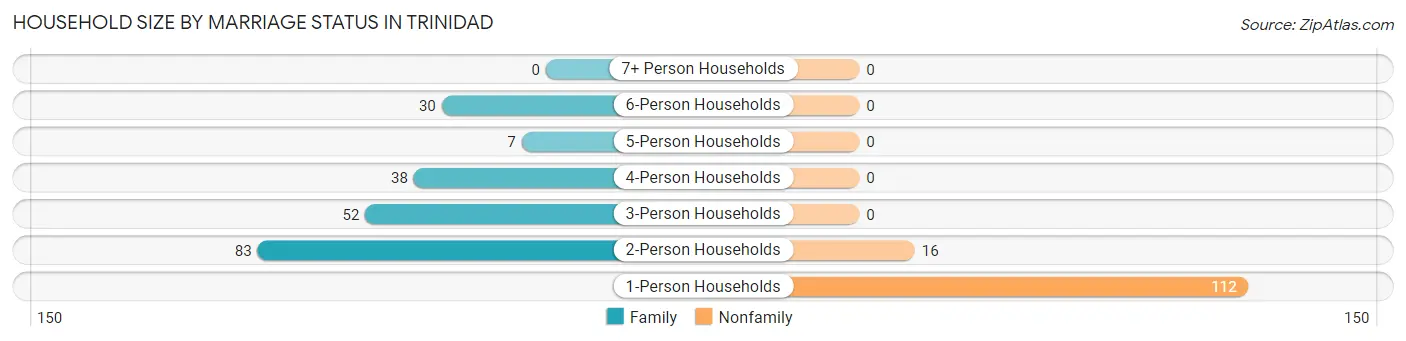
| Household Size | Family Households | Nonfamily Households |
| 1-Person Households | - | 112 (33.1%) |
| 2-Person Households | 83 (24.6%) | 16 (4.7%) |
| 3-Person Households | 52 (15.4%) | 0 (0.0%) |
| 4-Person Households | 38 (11.2%) | 0 (0.0%) |
| 5-Person Households | 7 (2.1%) | 0 (0.0%) |
| 6-Person Households | 30 (8.9%) | 0 (0.0%) |
| 7+ Person Households | 0 (0.0%) | 0 (0.0%) |
| Total | 210 (62.1%) | 128 (37.9%) |
Female Fertility in Trinidad
Fertility by Age in Trinidad
Average fertility rate in Trinidad is 95.0 births per 1,000 women. Women in the age bracket of 20 to 34 years have the highest fertility rate with 194.0 births per 1,000 women. Women in the age bracket of 20 to 34 years acount for 63.2% of all women with births.
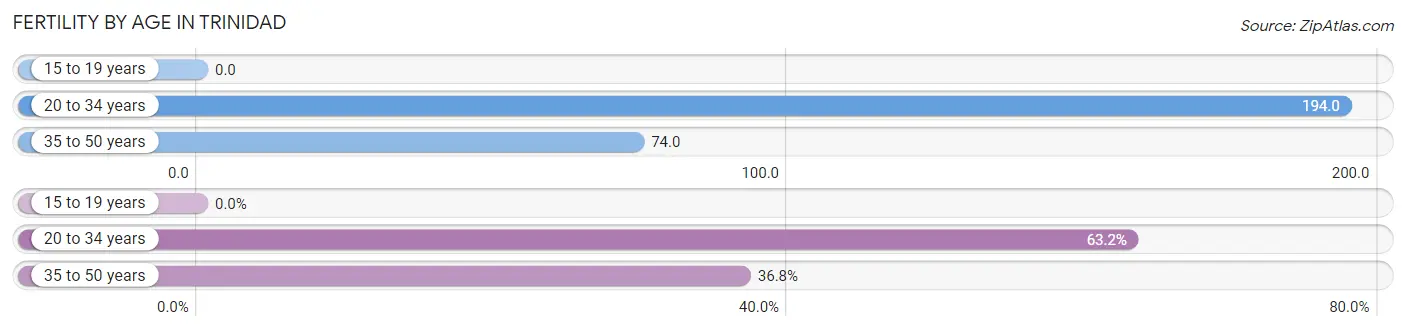
| Age Bracket | Women with Births | Births / 1,000 Women |
| 15 to 19 years | 0 (0.0%) | 0.0 |
| 20 to 34 years | 12 (63.2%) | 194.0 |
| 35 to 50 years | 7 (36.8%) | 74.0 |
| Total | 19 (100.0%) | 95.0 |
Fertility by Age by Marriage Status in Trinidad
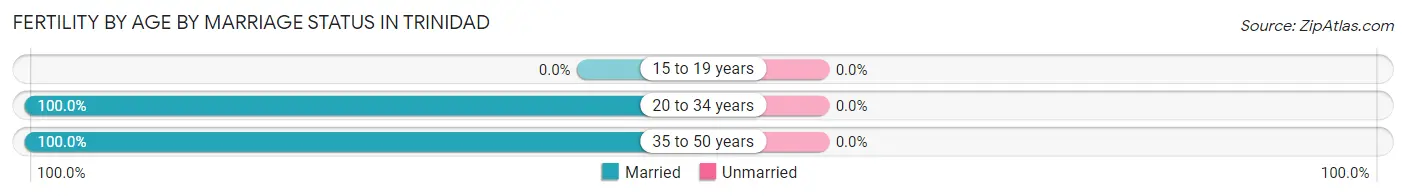
| Age Bracket | Married | Unmarried |
| 15 to 19 years | 0 (0.0%) | 0 (0.0%) |
| 20 to 34 years | 12 (100.0%) | 0 (0.0%) |
| 35 to 50 years | 7 (100.0%) | 0 (0.0%) |
| Total | 19 (100.0%) | 0 (0.0%) |
Fertility by Education in Trinidad
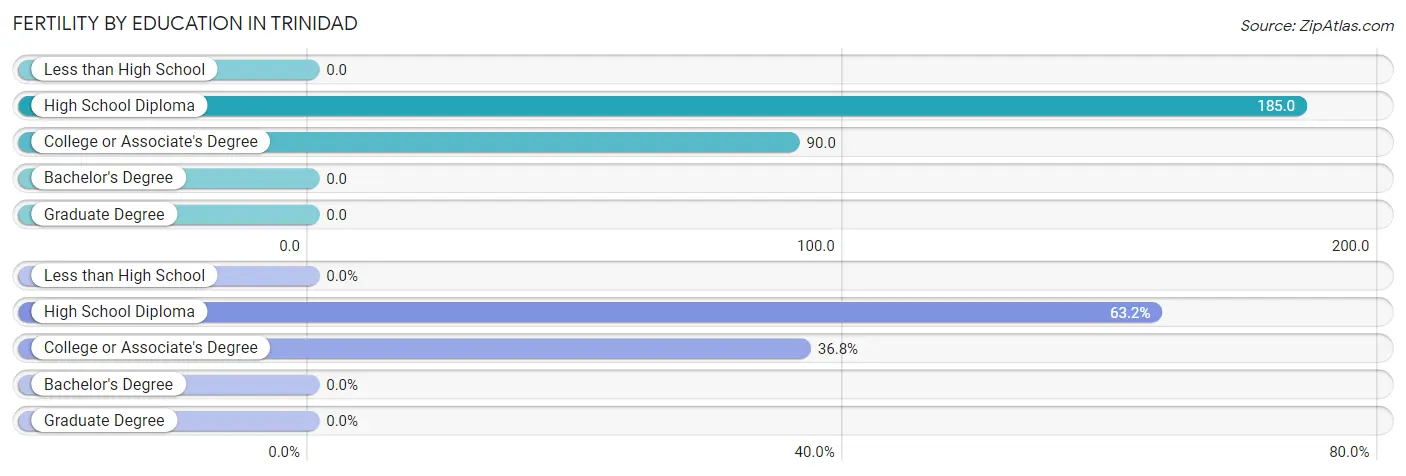
| Educational Attainment | Women with Births | Births / 1,000 Women |
| Less than High School | 0 (0.0%) | 0.0 |
| High School Diploma | 12 (63.2%) | 185.0 |
| College or Associate's Degree | 7 (36.8%) | 90.0 |
| Bachelor's Degree | 0 (0.0%) | 0.0 |
| Graduate Degree | 0 (0.0%) | 0.0 |
| Total | 19 (100.0%) | 95.0 |
Fertility by Education by Marriage Status in Trinidad
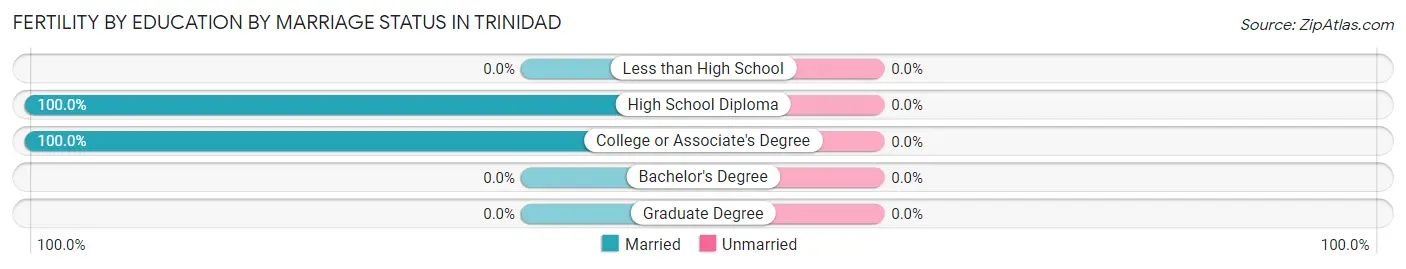
| Educational Attainment | Married | Unmarried |
| Less than High School | 0 (0.0%) | 0 (0.0%) |
| High School Diploma | 12 (100.0%) | 0 (0.0%) |
| College or Associate's Degree | 7 (100.0%) | 0 (0.0%) |
| Bachelor's Degree | 0 (0.0%) | 0 (0.0%) |
| Graduate Degree | 0 (0.0%) | 0 (0.0%) |
| Total | 19 (100.0%) | 0 (0.0%) |
Employment Characteristics in Trinidad
Employment by Class of Employer in Trinidad
Among the 311 employed individuals in Trinidad, private company employees (186 | 59.8%), local government employees (56 | 18.0%), and state government employees (37 | 11.9%) make up the most common classes of employment.
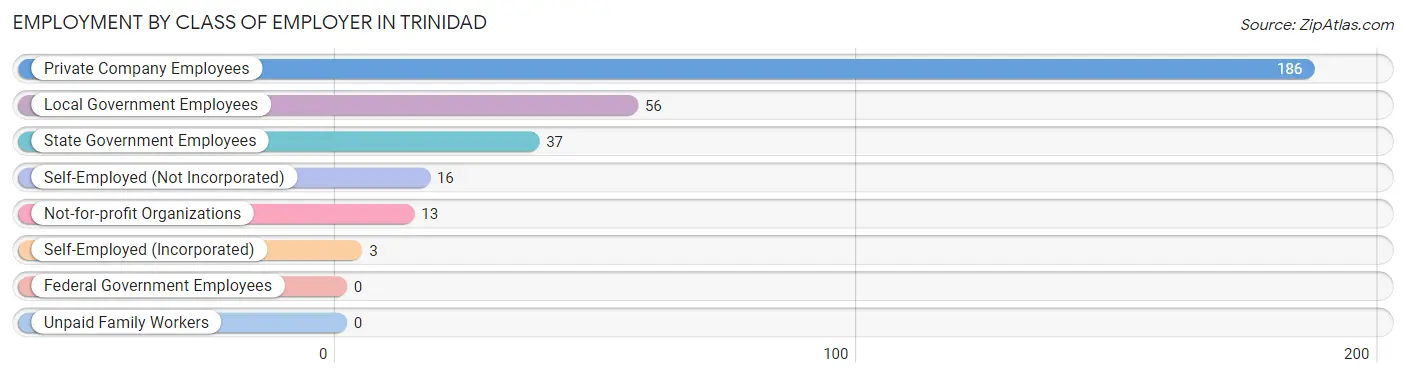
| Employer Class | # Employees | % Employees |
| Private Company Employees | 186 | 59.8% |
| Self-Employed (Incorporated) | 3 | 1.0% |
| Self-Employed (Not Incorporated) | 16 | 5.1% |
| Not-for-profit Organizations | 13 | 4.2% |
| Local Government Employees | 56 | 18.0% |
| State Government Employees | 37 | 11.9% |
| Federal Government Employees | 0 | 0.0% |
| Unpaid Family Workers | 0 | 0.0% |
| Total | 311 | 100.0% |
Employment Status by Age in Trinidad
According to the labor force statistics for Trinidad, out of the total population over 16 years of age (700), 45.7% or 320 individuals are in the labor force, with 2.5% or 8 of them unemployed. The age group with the highest labor force participation rate is 35 to 44 years, with 95.0% or 133 individuals in the labor force. Within the labor force, the 45 to 54 years age range has the highest percentage of unemployed individuals, with 18.6% or 8 of them being unemployed.
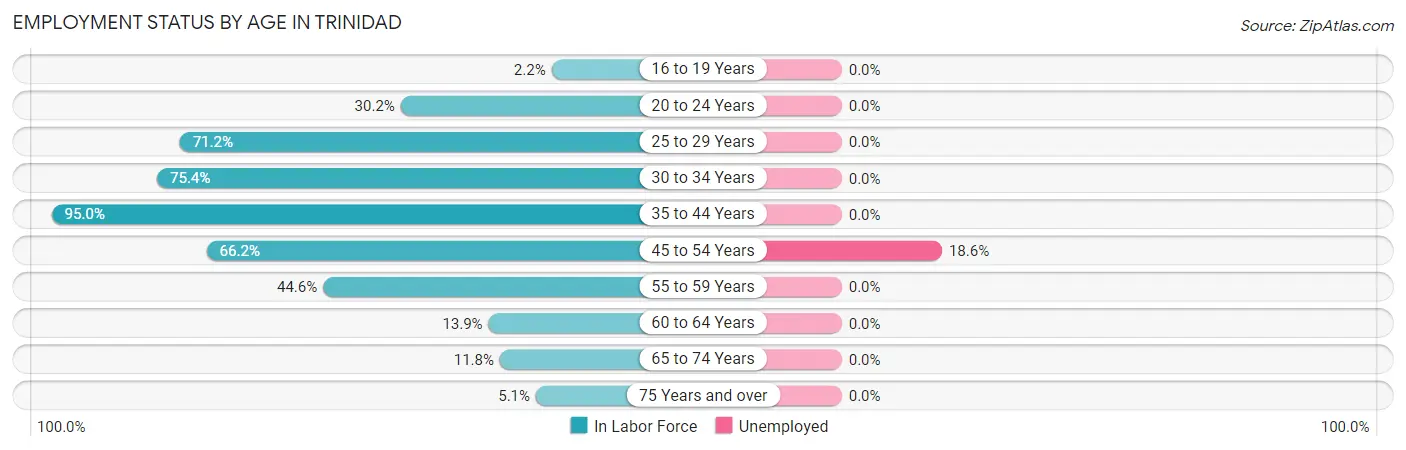
| Age Bracket | In Labor Force | Unemployed |
| 16 to 19 Years | 2 (2.2%) | 0 (0.0%) |
| 20 to 24 Years | 13 (30.2%) | 0 (0.0%) |
| 25 to 29 Years | 37 (71.2%) | 0 (0.0%) |
| 30 to 34 Years | 49 (75.4%) | 0 (0.0%) |
| 35 to 44 Years | 133 (95.0%) | 0 (0.0%) |
| 45 to 54 Years | 43 (66.2%) | 8 (18.6%) |
| 55 to 59 Years | 25 (44.6%) | 0 (0.0%) |
| 60 to 64 Years | 5 (13.9%) | 0 (0.0%) |
| 65 to 74 Years | 9 (11.8%) | 0 (0.0%) |
| 75 Years and over | 4 (5.1%) | 0 (0.0%) |
| Total | 320 (45.7%) | 8 (2.5%) |
Employment Status by Educational Attainment in Trinidad
According to labor force statistics for Trinidad, 70.5% of individuals (292) out of the total population between 25 and 64 years of age (414) are in the labor force, with 2.7% or 8 of them being unemployed. The group with the highest labor force participation rate are those with the educational attainment of bachelor's degree or higher, with 91.1% or 41 individuals in the labor force. Within the labor force, individuals with high school diploma education have the highest percentage of unemployment, with 5.4% or 8 of them being unemployed.
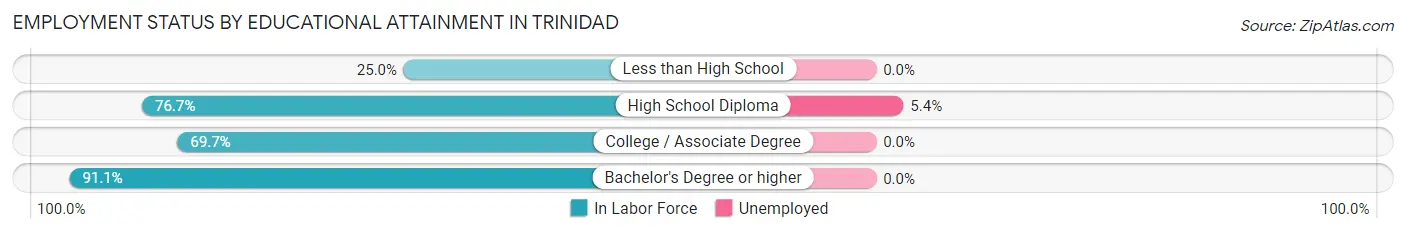
| Educational Attainment | In Labor Force | Unemployed |
| Less than High School | 11 (25.0%) | 0 (0.0%) |
| High School Diploma | 148 (76.7%) | 10 (5.4%) |
| College / Associate Degree | 92 (69.7%) | 0 (0.0%) |
| Bachelor's Degree or higher | 41 (91.1%) | 0 (0.0%) |
| Total | 292 (70.5%) | 11 (2.7%) |
Employment Occupations by Sex in Trinidad
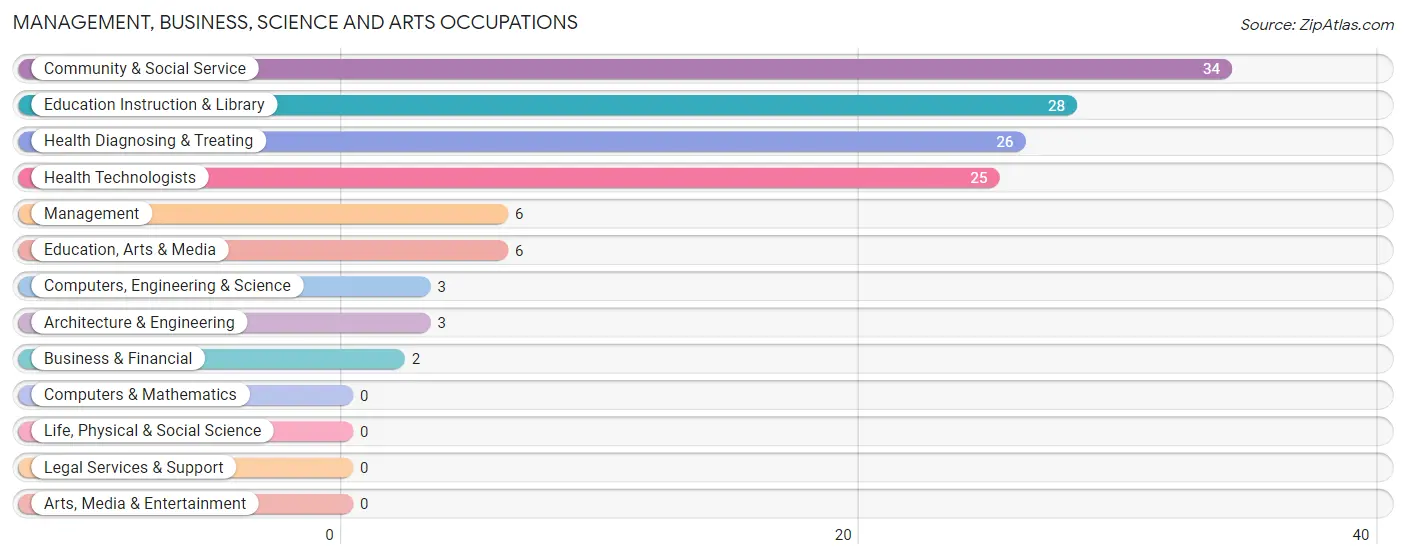
Management, Business, Science and Arts Occupations
The most common Management, Business, Science and Arts occupations in Trinidad are Community & Social Service (34 | 10.9%), Education Instruction & Library (28 | 9.0%), Health Diagnosing & Treating (26 | 8.3%), Health Technologists (25 | 8.0%), and Management (6 | 1.9%).
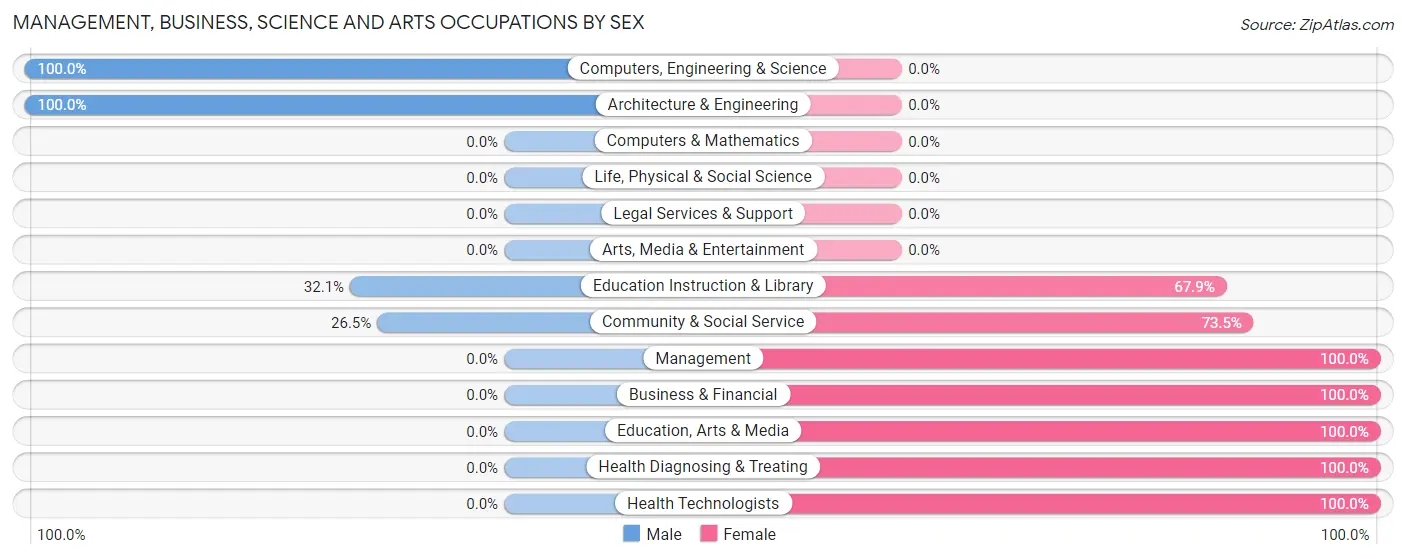
Management, Business, Science and Arts Occupations by Sex
Within the Management, Business, Science and Arts occupations in Trinidad, the most male-oriented occupations are Computers, Engineering & Science (100.0%), Architecture & Engineering (100.0%), and Education Instruction & Library (32.1%), while the most female-oriented occupations are Management (100.0%), Business & Financial (100.0%), and Education, Arts & Media (100.0%).
| Occupation | Male | Female |
| Management | 0 (0.0%) | 6 (100.0%) |
| Business & Financial | 0 (0.0%) | 2 (100.0%) |
| Computers, Engineering & Science | 3 (100.0%) | 0 (0.0%) |
| Computers & Mathematics | 0 (0.0%) | 0 (0.0%) |
| Architecture & Engineering | 3 (100.0%) | 0 (0.0%) |
| Life, Physical & Social Science | 0 (0.0%) | 0 (0.0%) |
| Community & Social Service | 9 (26.5%) | 25 (73.5%) |
| Education, Arts & Media | 0 (0.0%) | 6 (100.0%) |
| Legal Services & Support | 0 (0.0%) | 0 (0.0%) |
| Education Instruction & Library | 9 (32.1%) | 19 (67.9%) |
| Arts, Media & Entertainment | 0 (0.0%) | 0 (0.0%) |
| Health Diagnosing & Treating | 0 (0.0%) | 26 (100.0%) |
| Health Technologists | 0 (0.0%) | 25 (100.0%) |
| Total (Category) | 12 (16.9%) | 59 (83.1%) |
| Total (Overall) | 162 (51.9%) | 150 (48.1%) |
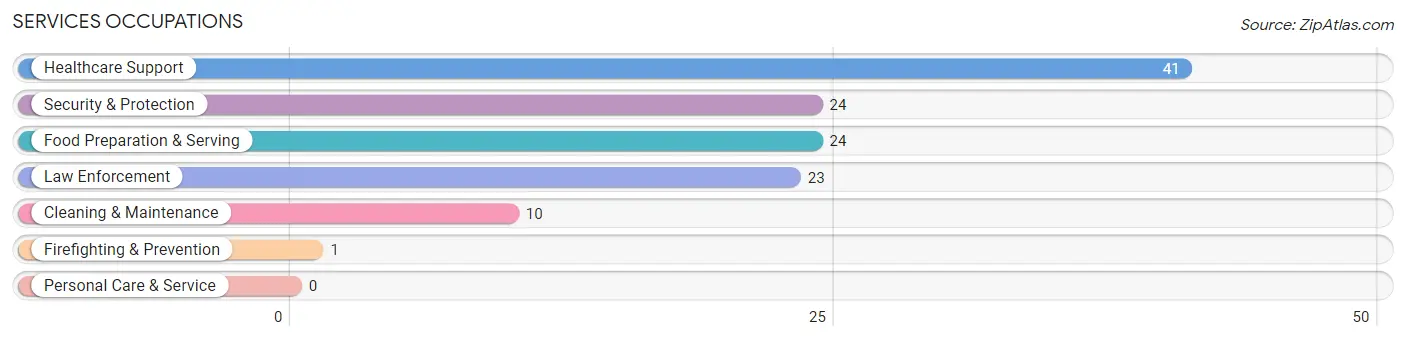
Services Occupations
The most common Services occupations in Trinidad are Healthcare Support (41 | 13.1%), Security & Protection (24 | 7.7%), Food Preparation & Serving (24 | 7.7%), Law Enforcement (23 | 7.4%), and Cleaning & Maintenance (10 | 3.2%).
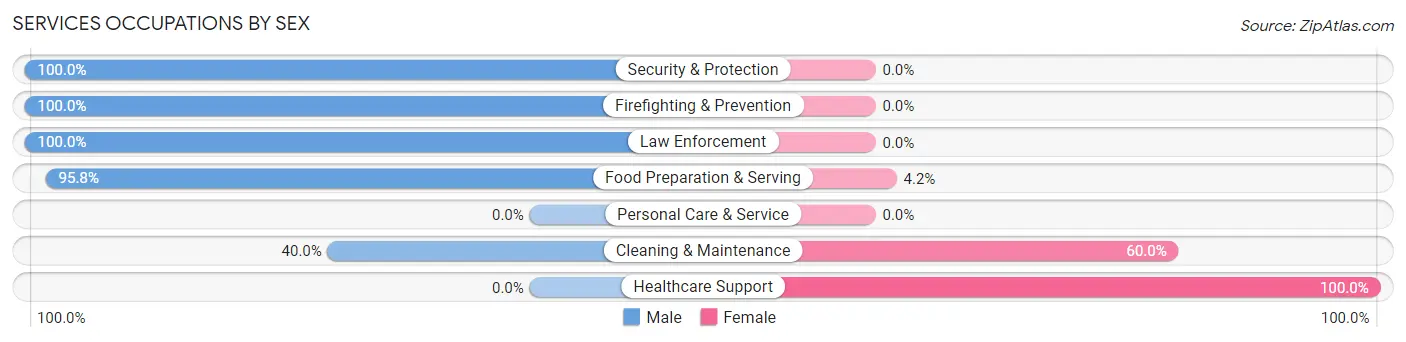
Services Occupations by Sex
Within the Services occupations in Trinidad, the most male-oriented occupations are Security & Protection (100.0%), Firefighting & Prevention (100.0%), and Law Enforcement (100.0%), while the most female-oriented occupations are Healthcare Support (100.0%), Cleaning & Maintenance (60.0%), and Food Preparation & Serving (4.2%).
| Occupation | Male | Female |
| Healthcare Support | 0 (0.0%) | 41 (100.0%) |
| Security & Protection | 24 (100.0%) | 0 (0.0%) |
| Firefighting & Prevention | 1 (100.0%) | 0 (0.0%) |
| Law Enforcement | 23 (100.0%) | 0 (0.0%) |
| Food Preparation & Serving | 23 (95.8%) | 1 (4.2%) |
| Cleaning & Maintenance | 4 (40.0%) | 6 (60.0%) |
| Personal Care & Service | 0 (0.0%) | 0 (0.0%) |
| Total (Category) | 51 (51.5%) | 48 (48.5%) |
| Total (Overall) | 162 (51.9%) | 150 (48.1%) |
Sales and Office Occupations
The most common Sales and Office occupations in Trinidad are Office & Administration (38 | 12.2%), and Sales & Related (5 | 1.6%).
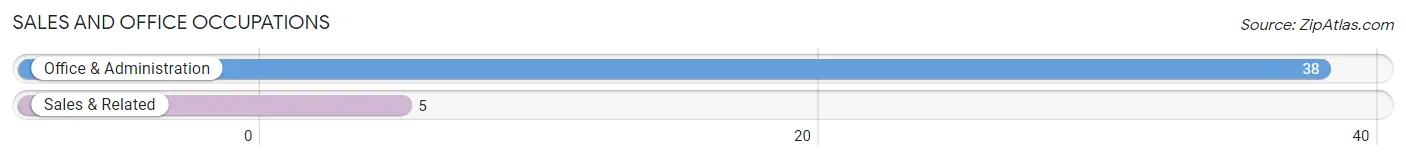
Sales and Office Occupations by Sex
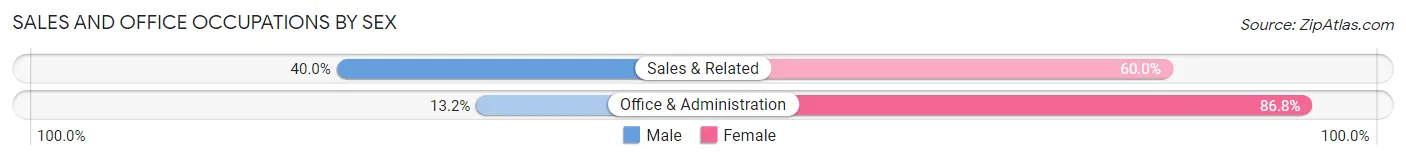
| Occupation | Male | Female |
| Sales & Related | 2 (40.0%) | 3 (60.0%) |
| Office & Administration | 5 (13.2%) | 33 (86.8%) |
| Total (Category) | 7 (16.3%) | 36 (83.7%) |
| Total (Overall) | 162 (51.9%) | 150 (48.1%) |
Natural Resources, Construction and Maintenance Occupations
The most common Natural Resources, Construction and Maintenance occupations in Trinidad are Construction & Extraction (37 | 11.9%), Farming, Fishing & Forestry (5 | 1.6%), and Installation, Maintenance & Repair (5 | 1.6%).
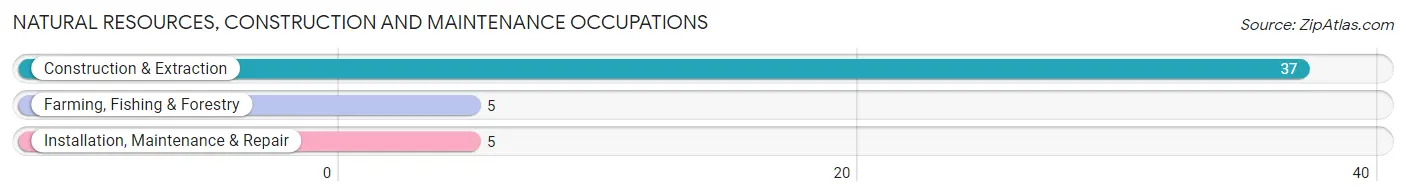
Natural Resources, Construction and Maintenance Occupations by Sex
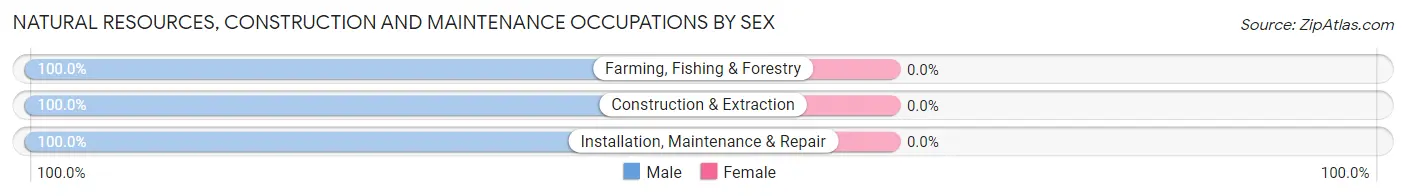
| Occupation | Male | Female |
| Farming, Fishing & Forestry | 5 (100.0%) | 0 (0.0%) |
| Construction & Extraction | 37 (100.0%) | 0 (0.0%) |
| Installation, Maintenance & Repair | 5 (100.0%) | 0 (0.0%) |
| Total (Category) | 47 (100.0%) | 0 (0.0%) |
| Total (Overall) | 162 (51.9%) | 150 (48.1%) |
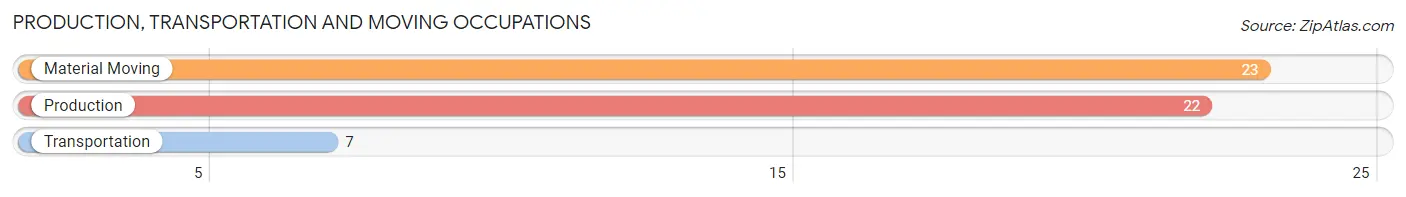
Production, Transportation and Moving Occupations
The most common Production, Transportation and Moving occupations in Trinidad are Material Moving (23 | 7.4%), Production (22 | 7.0%), and Transportation (7 | 2.2%).
Production, Transportation and Moving Occupations by Sex
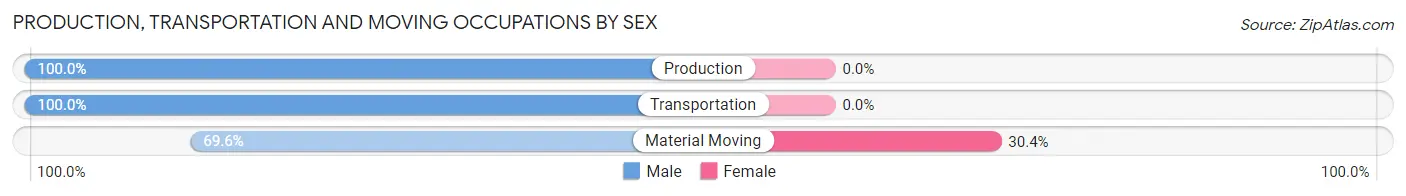
| Occupation | Male | Female |
| Production | 22 (100.0%) | 0 (0.0%) |
| Transportation | 7 (100.0%) | 0 (0.0%) |
| Material Moving | 16 (69.6%) | 7 (30.4%) |
| Total (Category) | 45 (86.5%) | 7 (13.5%) |
| Total (Overall) | 162 (51.9%) | 150 (48.1%) |
Employment Industries by Sex in Trinidad
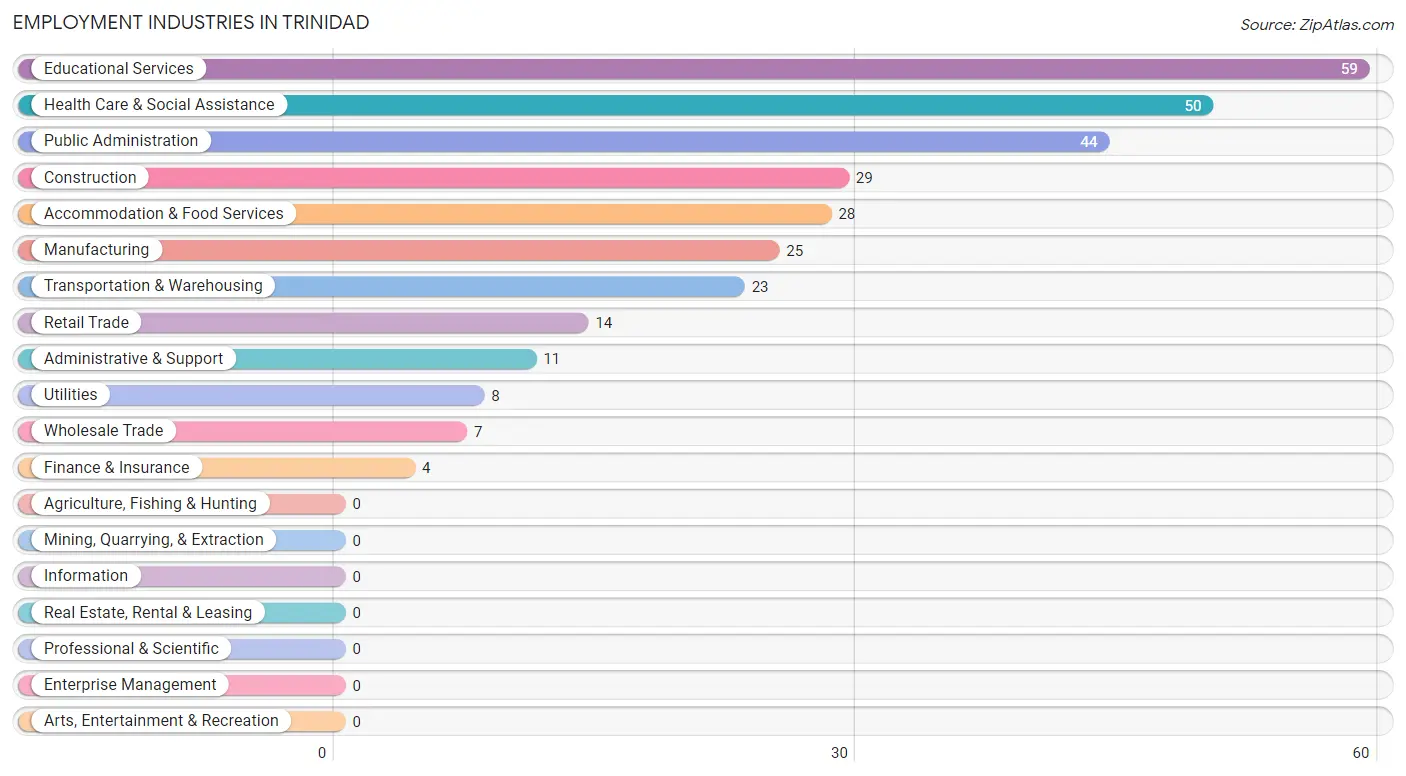
Employment Industries in Trinidad
The major employment industries in Trinidad include Educational Services (59 | 18.9%), Health Care & Social Assistance (50 | 16.0%), Public Administration (44 | 14.1%), Construction (29 | 9.3%), and Accommodation & Food Services (28 | 9.0%).
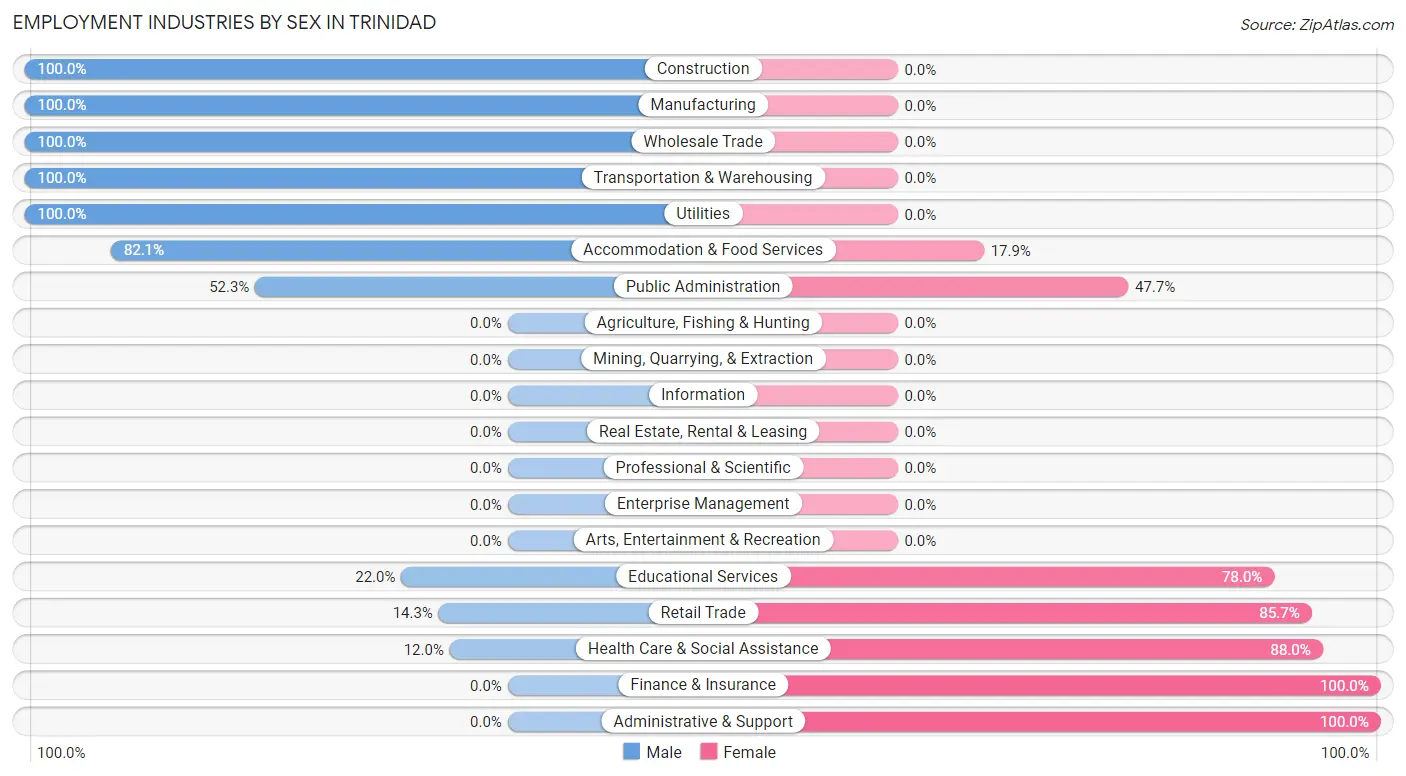
Employment Industries by Sex in Trinidad
The Trinidad industries that see more men than women are Construction (100.0%), Manufacturing (100.0%), and Wholesale Trade (100.0%), whereas the industries that tend to have a higher number of women are Finance & Insurance (100.0%), Administrative & Support (100.0%), and Health Care & Social Assistance (88.0%).
| Industry | Male | Female |
| Agriculture, Fishing & Hunting | 0 (0.0%) | 0 (0.0%) |
| Mining, Quarrying, & Extraction | 0 (0.0%) | 0 (0.0%) |
| Construction | 29 (100.0%) | 0 (0.0%) |
| Manufacturing | 25 (100.0%) | 0 (0.0%) |
| Wholesale Trade | 7 (100.0%) | 0 (0.0%) |
| Retail Trade | 2 (14.3%) | 12 (85.7%) |
| Transportation & Warehousing | 23 (100.0%) | 0 (0.0%) |
| Utilities | 8 (100.0%) | 0 (0.0%) |
| Information | 0 (0.0%) | 0 (0.0%) |
| Finance & Insurance | 0 (0.0%) | 4 (100.0%) |
| Real Estate, Rental & Leasing | 0 (0.0%) | 0 (0.0%) |
| Professional & Scientific | 0 (0.0%) | 0 (0.0%) |
| Enterprise Management | 0 (0.0%) | 0 (0.0%) |
| Administrative & Support | 0 (0.0%) | 11 (100.0%) |
| Educational Services | 13 (22.0%) | 46 (78.0%) |
| Health Care & Social Assistance | 6 (12.0%) | 44 (88.0%) |
| Arts, Entertainment & Recreation | 0 (0.0%) | 0 (0.0%) |
| Accommodation & Food Services | 23 (82.1%) | 5 (17.9%) |
| Public Administration | 23 (52.3%) | 21 (47.7%) |
| Total | 162 (51.9%) | 150 (48.1%) |
Education in Trinidad
School Enrollment in Trinidad
The most common levels of schooling among the 239 students in Trinidad are college / undergraduate (69 | 28.9%), middle school (53 | 22.2%), and high school (39 | 16.3%).
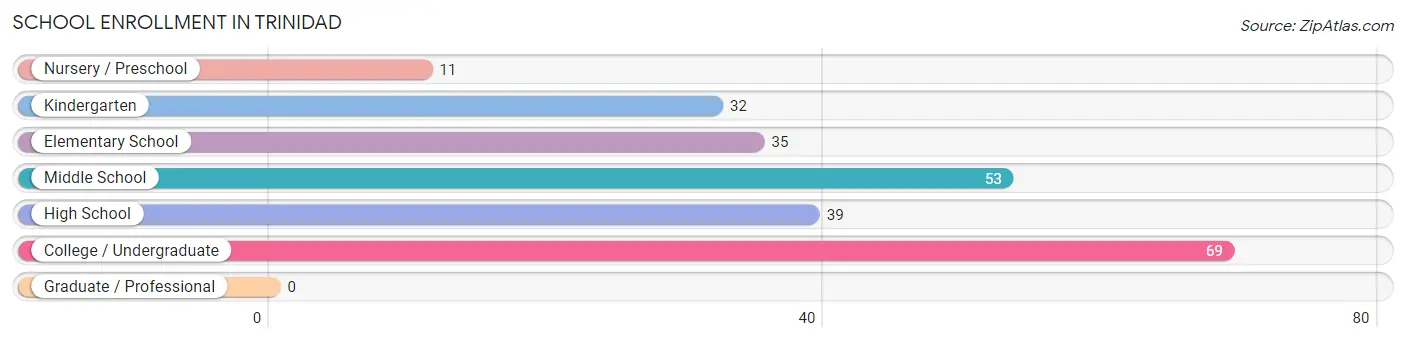
| School Level | # Students | % Students |
| Nursery / Preschool | 11 | 4.6% |
| Kindergarten | 32 | 13.4% |
| Elementary School | 35 | 14.6% |
| Middle School | 53 | 22.2% |
| High School | 39 | 16.3% |
| College / Undergraduate | 69 | 28.9% |
| Graduate / Professional | 0 | 0.0% |
| Total | 239 | 100.0% |
School Enrollment by Age by Funding Source in Trinidad
Out of a total of 239 students who are enrolled in schools in Trinidad, 33 (13.8%) attend a private institution, while the remaining 206 (86.2%) are enrolled in public schools. The age group of 20 to 24 year olds has the highest likelihood of being enrolled in private schools, with 30 (100.0% in the age bracket) enrolled. Conversely, the age group of 5 to 9 year old has the lowest likelihood of being enrolled in a private school, with 70 (100.0% in the age bracket) attending a public institution.
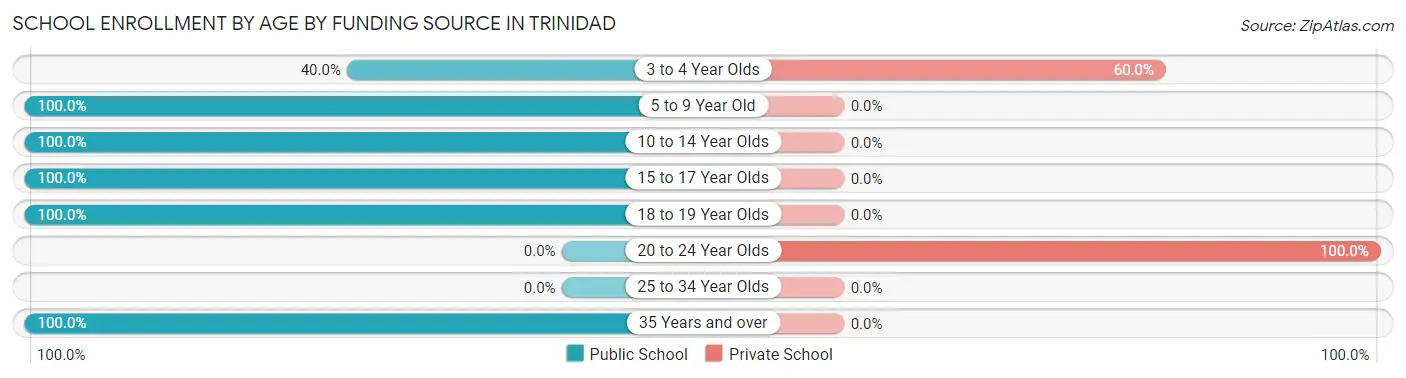
| Age Bracket | Public School | Private School |
| 3 to 4 Year Olds | 2 (40.0%) | 3 (60.0%) |
| 5 to 9 Year Old | 70 (100.0%) | 0 (0.0%) |
| 10 to 14 Year Olds | 61 (100.0%) | 0 (0.0%) |
| 15 to 17 Year Olds | 30 (100.0%) | 0 (0.0%) |
| 18 to 19 Year Olds | 38 (100.0%) | 0 (0.0%) |
| 20 to 24 Year Olds | 0 (0.0%) | 30 (100.0%) |
| 25 to 34 Year Olds | 0 (0.0%) | 0 (0.0%) |
| 35 Years and over | 5 (100.0%) | 0 (0.0%) |
| Total | 206 (86.2%) | 33 (13.8%) |
Educational Attainment by Field of Study in Trinidad
Education (24 | 27.6%), engineering (16 | 18.4%), business (11 | 12.6%), arts & humanities (10 | 11.5%), and bio, nature & agricultural (8 | 9.2%) are the most common fields of study among 87 individuals in Trinidad who have obtained a bachelor's degree or higher.
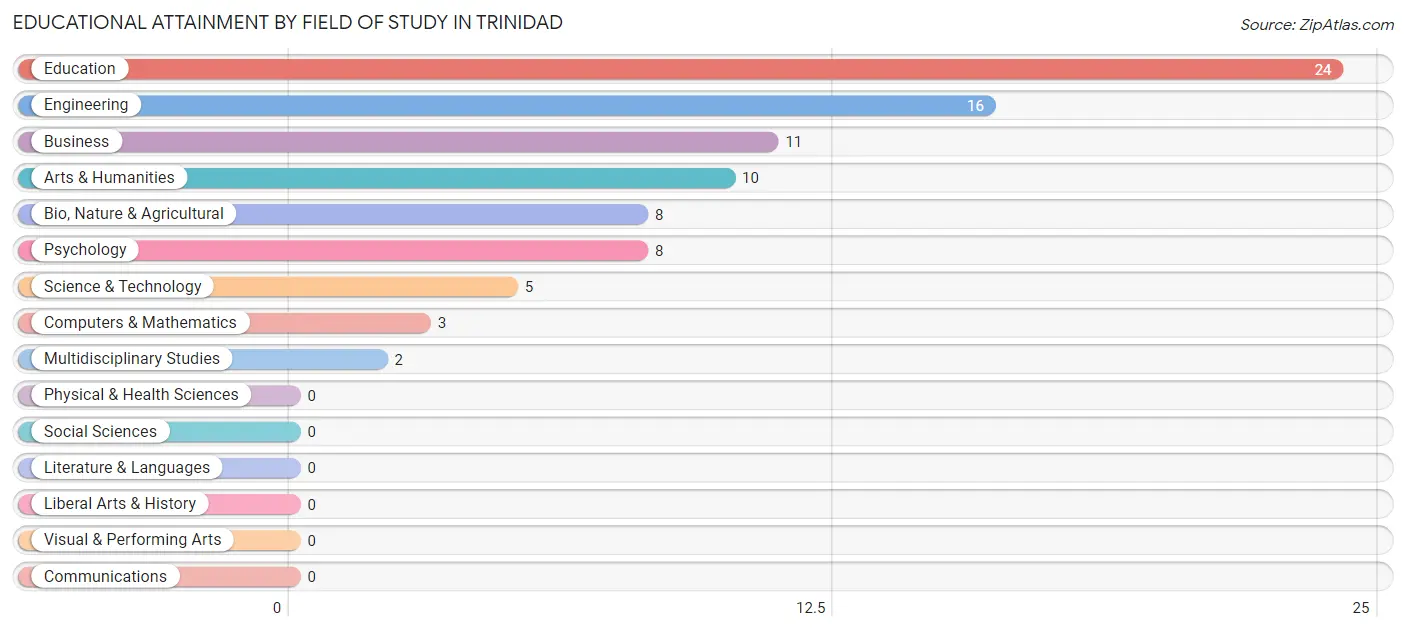
| Field of Study | # Graduates | % Graduates |
| Computers & Mathematics | 3 | 3.5% |
| Bio, Nature & Agricultural | 8 | 9.2% |
| Physical & Health Sciences | 0 | 0.0% |
| Psychology | 8 | 9.2% |
| Social Sciences | 0 | 0.0% |
| Engineering | 16 | 18.4% |
| Multidisciplinary Studies | 2 | 2.3% |
| Science & Technology | 5 | 5.8% |
| Business | 11 | 12.6% |
| Education | 24 | 27.6% |
| Literature & Languages | 0 | 0.0% |
| Liberal Arts & History | 0 | 0.0% |
| Visual & Performing Arts | 0 | 0.0% |
| Communications | 0 | 0.0% |
| Arts & Humanities | 10 | 11.5% |
| Total | 87 | 100.0% |
Transportation & Commute in Trinidad
Vehicle Availability by Sex in Trinidad
The most prevalent vehicle ownership categories in Trinidad are males with 2 vehicles (77, accounting for 47.5%) and females with 2 vehicles (62, making up 51.7%).
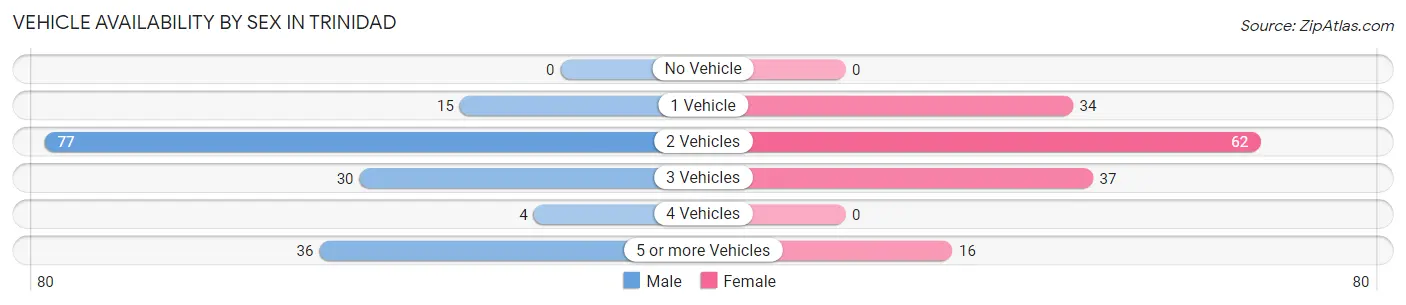
| Vehicles Available | Male | Female |
| No Vehicle | 0 (0.0%) | 0 (0.0%) |
| 1 Vehicle | 15 (9.3%) | 34 (22.8%) |
| 2 Vehicles | 77 (47.5%) | 62 (41.6%) |
| 3 Vehicles | 30 (18.5%) | 37 (24.8%) |
| 4 Vehicles | 4 (2.5%) | 0 (0.0%) |
| 5 or more Vehicles | 36 (22.2%) | 16 (10.7%) |
| Total | 162 (100.0%) | 149 (100.0%) |
Commute Time in Trinidad
The most frequently occuring commute durations in Trinidad are 15 to 19 minutes (71 commuters, 23.7%), 35 to 39 minutes (44 commuters, 14.7%), and 5 to 9 minutes (37 commuters, 12.4%).
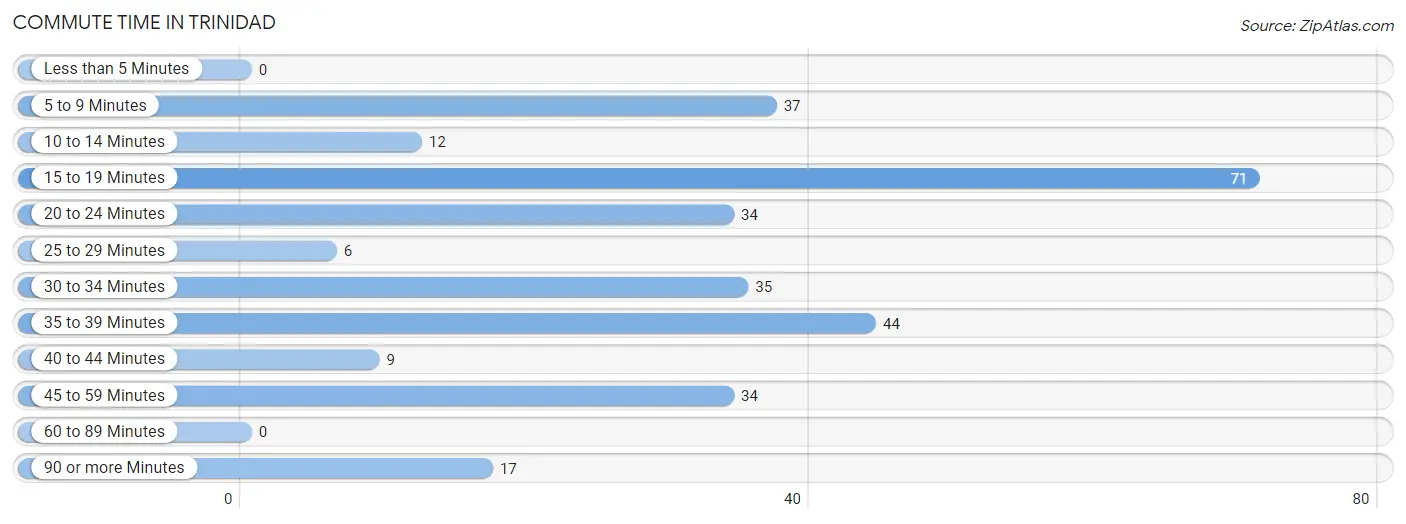
| Commute Time | # Commuters | % Commuters |
| Less than 5 Minutes | 0 | 0.0% |
| 5 to 9 Minutes | 37 | 12.4% |
| 10 to 14 Minutes | 12 | 4.0% |
| 15 to 19 Minutes | 71 | 23.7% |
| 20 to 24 Minutes | 34 | 11.4% |
| 25 to 29 Minutes | 6 | 2.0% |
| 30 to 34 Minutes | 35 | 11.7% |
| 35 to 39 Minutes | 44 | 14.7% |
| 40 to 44 Minutes | 9 | 3.0% |
| 45 to 59 Minutes | 34 | 11.4% |
| 60 to 89 Minutes | 0 | 0.0% |
| 90 or more Minutes | 17 | 5.7% |
Commute Time by Sex in Trinidad
The most common commute times in Trinidad are 35 to 39 minutes (36 commuters, 23.2%) for males and 15 to 19 minutes (50 commuters, 34.7%) for females.
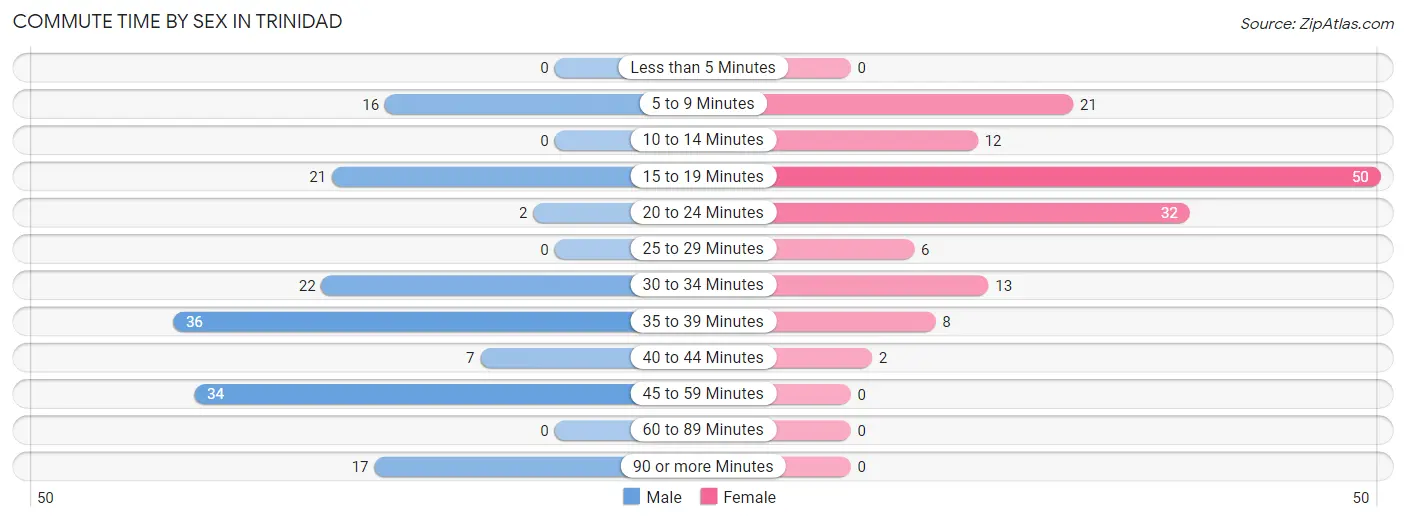
| Commute Time | Male | Female |
| Less than 5 Minutes | 0 (0.0%) | 0 (0.0%) |
| 5 to 9 Minutes | 16 (10.3%) | 21 (14.6%) |
| 10 to 14 Minutes | 0 (0.0%) | 12 (8.3%) |
| 15 to 19 Minutes | 21 (13.6%) | 50 (34.7%) |
| 20 to 24 Minutes | 2 (1.3%) | 32 (22.2%) |
| 25 to 29 Minutes | 0 (0.0%) | 6 (4.2%) |
| 30 to 34 Minutes | 22 (14.2%) | 13 (9.0%) |
| 35 to 39 Minutes | 36 (23.2%) | 8 (5.6%) |
| 40 to 44 Minutes | 7 (4.5%) | 2 (1.4%) |
| 45 to 59 Minutes | 34 (21.9%) | 0 (0.0%) |
| 60 to 89 Minutes | 0 (0.0%) | 0 (0.0%) |
| 90 or more Minutes | 17 (11.0%) | 0 (0.0%) |
Time of Departure to Work by Sex in Trinidad
The most frequent times of departure to work in Trinidad are 5:00 AM to 5:29 AM (38, 24.5%) for males and 7:00 AM to 7:29 AM (48, 33.3%) for females.
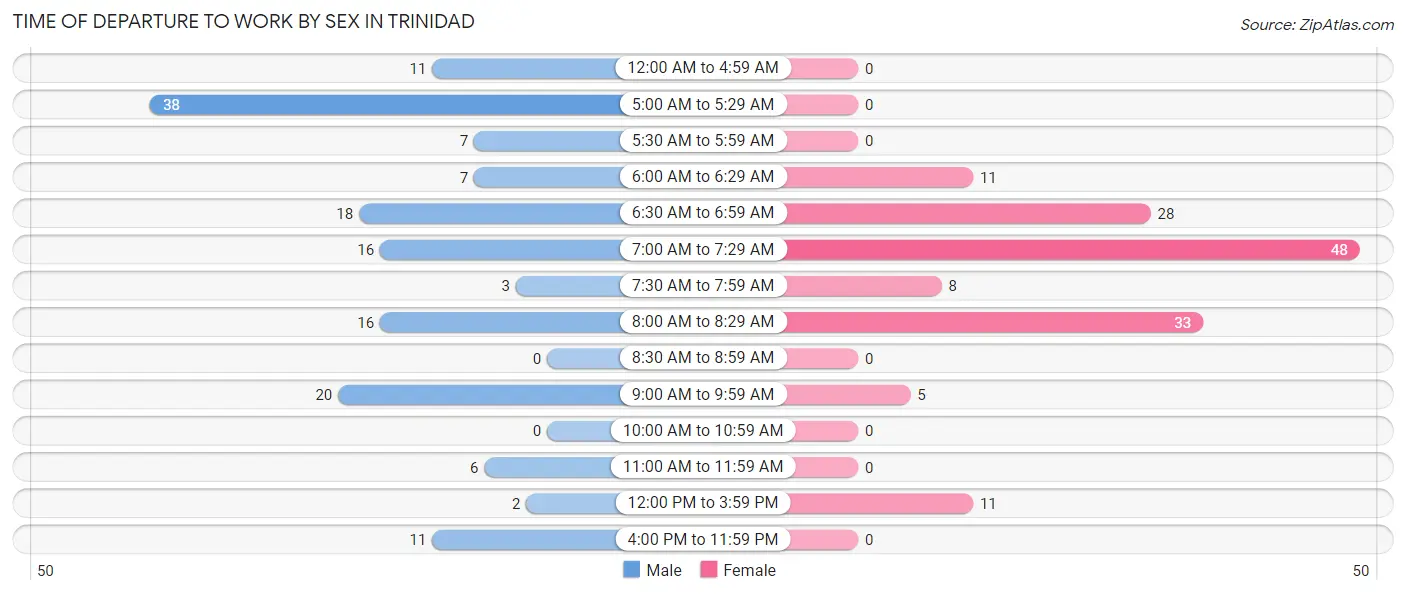
| Time of Departure | Male | Female |
| 12:00 AM to 4:59 AM | 11 (7.1%) | 0 (0.0%) |
| 5:00 AM to 5:29 AM | 38 (24.5%) | 0 (0.0%) |
| 5:30 AM to 5:59 AM | 7 (4.5%) | 0 (0.0%) |
| 6:00 AM to 6:29 AM | 7 (4.5%) | 11 (7.6%) |
| 6:30 AM to 6:59 AM | 18 (11.6%) | 28 (19.4%) |
| 7:00 AM to 7:29 AM | 16 (10.3%) | 48 (33.3%) |
| 7:30 AM to 7:59 AM | 3 (1.9%) | 8 (5.6%) |
| 8:00 AM to 8:29 AM | 16 (10.3%) | 33 (22.9%) |
| 8:30 AM to 8:59 AM | 0 (0.0%) | 0 (0.0%) |
| 9:00 AM to 9:59 AM | 20 (12.9%) | 5 (3.5%) |
| 10:00 AM to 10:59 AM | 0 (0.0%) | 0 (0.0%) |
| 11:00 AM to 11:59 AM | 6 (3.9%) | 0 (0.0%) |
| 12:00 PM to 3:59 PM | 2 (1.3%) | 11 (7.6%) |
| 4:00 PM to 11:59 PM | 11 (7.1%) | 0 (0.0%) |
| Total | 155 (100.0%) | 144 (100.0%) |
Housing Occupancy in Trinidad
Occupancy by Ownership in Trinidad
Of the total 338 dwellings in Trinidad, owner-occupied units account for 217 (64.2%), while renter-occupied units make up 121 (35.8%).
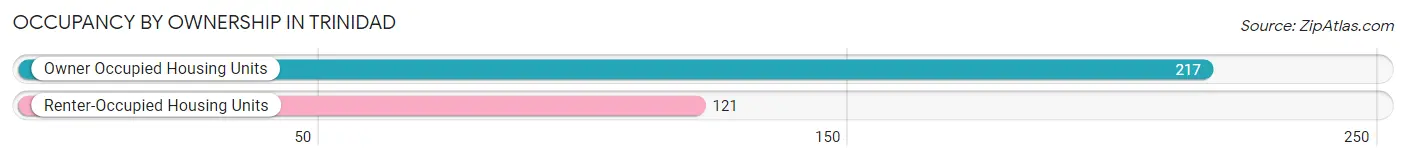
| Occupancy | # Housing Units | % Housing Units |
| Owner Occupied Housing Units | 217 | 64.2% |
| Renter-Occupied Housing Units | 121 | 35.8% |
| Total Occupied Housing Units | 338 | 100.0% |
Occupancy by Household Size in Trinidad
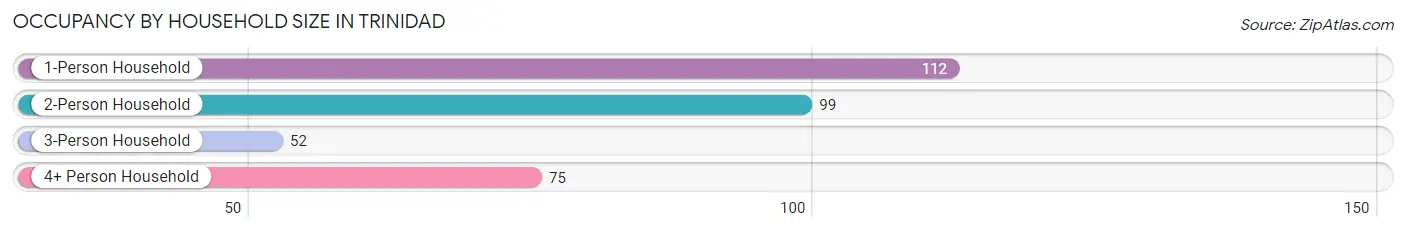
| Household Size | # Housing Units | % Housing Units |
| 1-Person Household | 112 | 33.1% |
| 2-Person Household | 99 | 29.3% |
| 3-Person Household | 52 | 15.4% |
| 4+ Person Household | 75 | 22.2% |
| Total Housing Units | 338 | 100.0% |
Occupancy by Ownership by Household Size in Trinidad
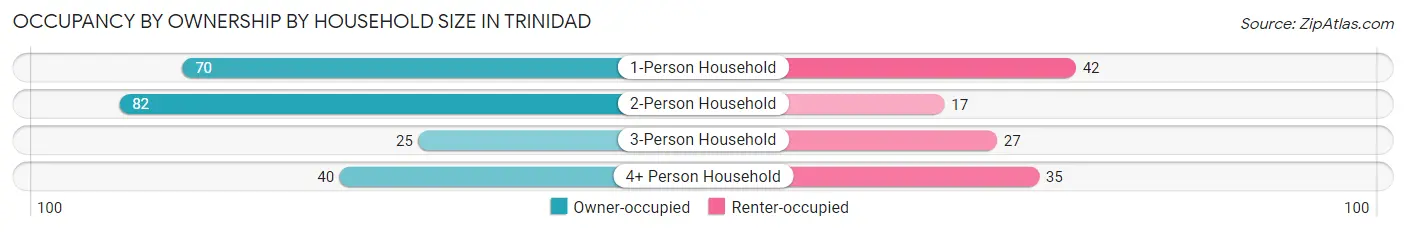
| Household Size | Owner-occupied | Renter-occupied |
| 1-Person Household | 70 (62.5%) | 42 (37.5%) |
| 2-Person Household | 82 (82.8%) | 17 (17.2%) |
| 3-Person Household | 25 (48.1%) | 27 (51.9%) |
| 4+ Person Household | 40 (53.3%) | 35 (46.7%) |
| Total Housing Units | 217 (64.2%) | 121 (35.8%) |
Occupancy by Educational Attainment in Trinidad
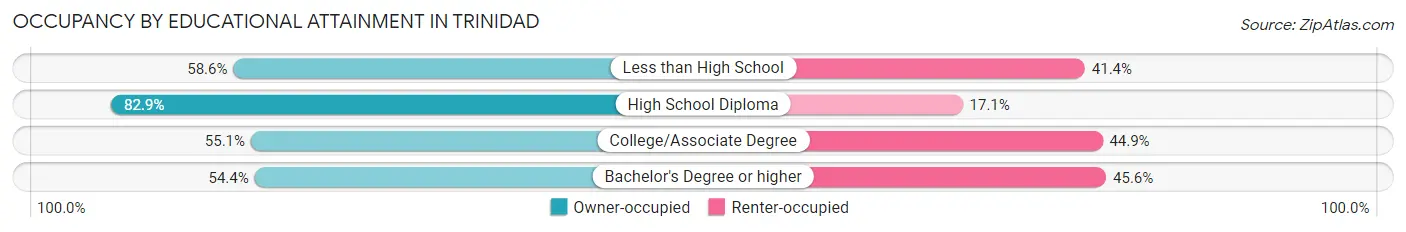
| Household Size | Owner-occupied | Renter-occupied |
| Less than High School | 34 (58.6%) | 24 (41.4%) |
| High School Diploma | 87 (82.9%) | 18 (17.1%) |
| College/Associate Degree | 59 (55.1%) | 48 (44.9%) |
| Bachelor's Degree or higher | 37 (54.4%) | 31 (45.6%) |
Occupancy by Age of Householder in Trinidad
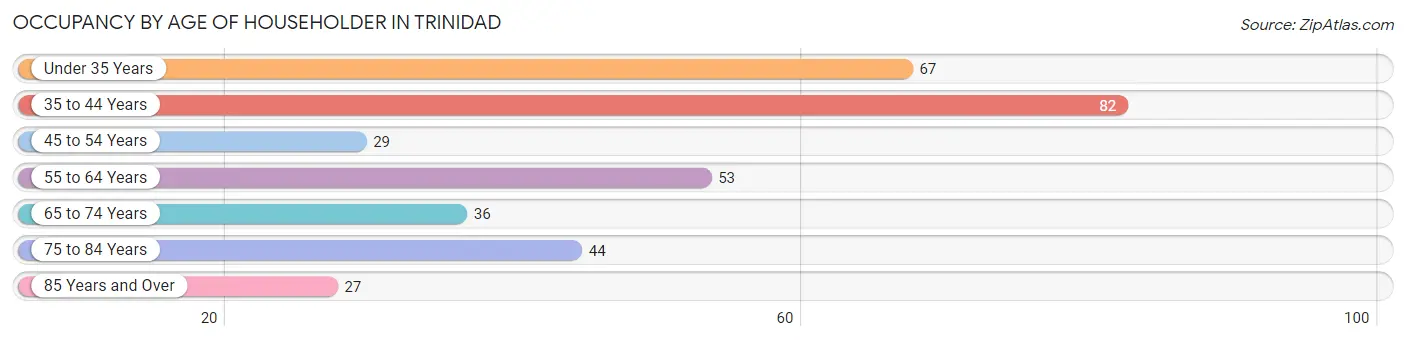
| Age Bracket | # Households | % Households |
| Under 35 Years | 67 | 19.8% |
| 35 to 44 Years | 82 | 24.3% |
| 45 to 54 Years | 29 | 8.6% |
| 55 to 64 Years | 53 | 15.7% |
| 65 to 74 Years | 36 | 10.6% |
| 75 to 84 Years | 44 | 13.0% |
| 85 Years and Over | 27 | 8.0% |
| Total | 338 | 100.0% |
Housing Finances in Trinidad
Median Income by Occupancy in Trinidad
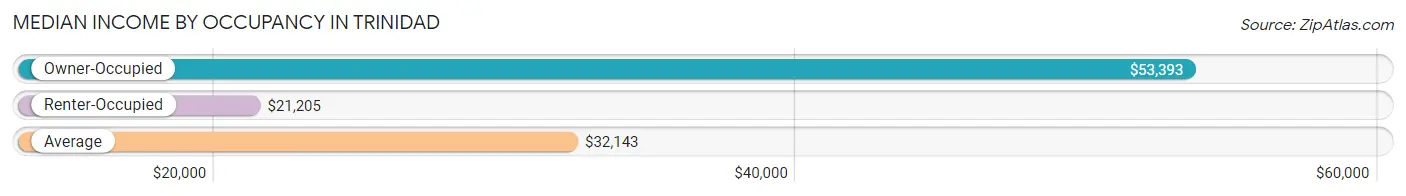
| Occupancy Type | # Households | Median Income |
| Owner-Occupied | 217 (64.2%) | $53,393 |
| Renter-Occupied | 121 (35.8%) | $21,205 |
| Average | 338 (100.0%) | $32,143 |
Occupancy by Householder Income Bracket in Trinidad
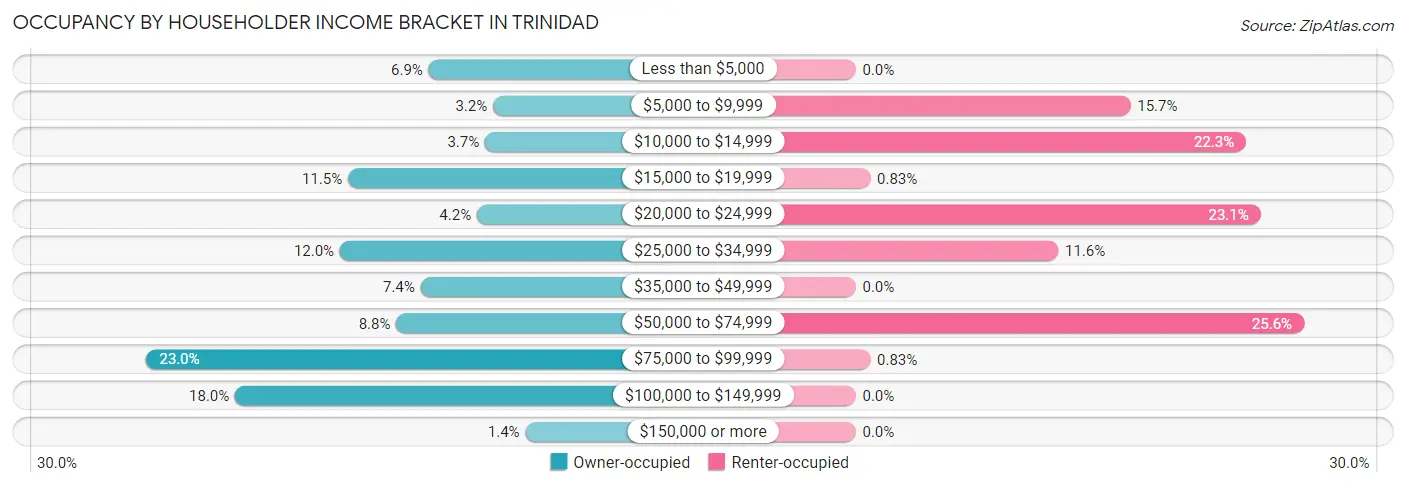
| Income Bracket | Owner-occupied | Renter-occupied |
| Less than $5,000 | 15 (6.9%) | 0 (0.0%) |
| $5,000 to $9,999 | 7 (3.2%) | 19 (15.7%) |
| $10,000 to $14,999 | 8 (3.7%) | 27 (22.3%) |
| $15,000 to $19,999 | 25 (11.5%) | 1 (0.8%) |
| $20,000 to $24,999 | 9 (4.2%) | 28 (23.1%) |
| $25,000 to $34,999 | 26 (12.0%) | 14 (11.6%) |
| $35,000 to $49,999 | 16 (7.4%) | 0 (0.0%) |
| $50,000 to $74,999 | 19 (8.8%) | 31 (25.6%) |
| $75,000 to $99,999 | 50 (23.0%) | 1 (0.8%) |
| $100,000 to $149,999 | 39 (18.0%) | 0 (0.0%) |
| $150,000 or more | 3 (1.4%) | 0 (0.0%) |
| Total | 217 (100.0%) | 121 (100.0%) |
Monthly Housing Cost Tiers in Trinidad
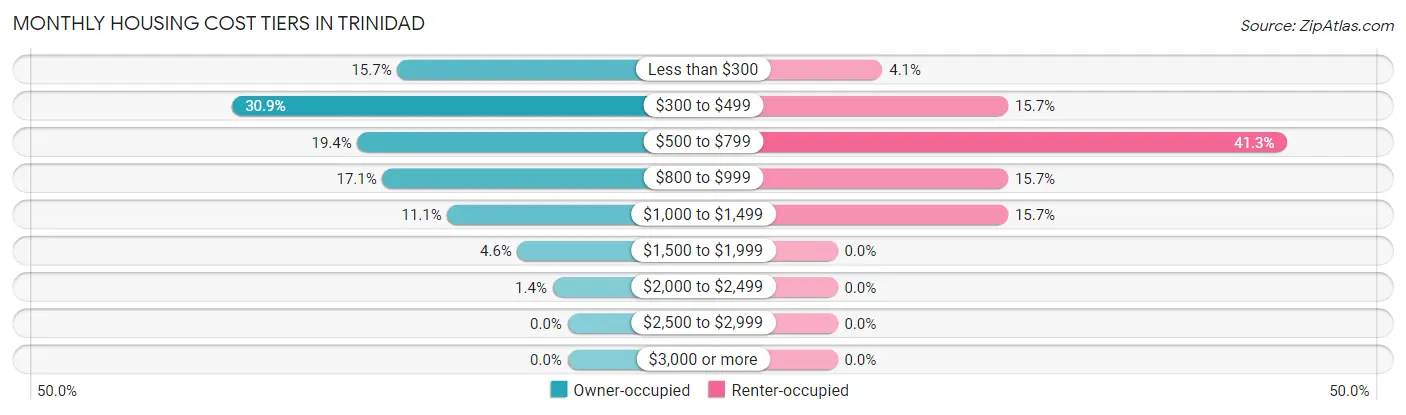
| Monthly Cost | Owner-occupied | Renter-occupied |
| Less than $300 | 34 (15.7%) | 5 (4.1%) |
| $300 to $499 | 67 (30.9%) | 19 (15.7%) |
| $500 to $799 | 42 (19.4%) | 50 (41.3%) |
| $800 to $999 | 37 (17.1%) | 19 (15.7%) |
| $1,000 to $1,499 | 24 (11.1%) | 19 (15.7%) |
| $1,500 to $1,999 | 10 (4.6%) | 0 (0.0%) |
| $2,000 to $2,499 | 3 (1.4%) | 0 (0.0%) |
| $2,500 to $2,999 | 0 (0.0%) | 0 (0.0%) |
| $3,000 or more | 0 (0.0%) | 0 (0.0%) |
| Total | 217 (100.0%) | 121 (100.0%) |
Physical Housing Characteristics in Trinidad
Housing Structures in Trinidad
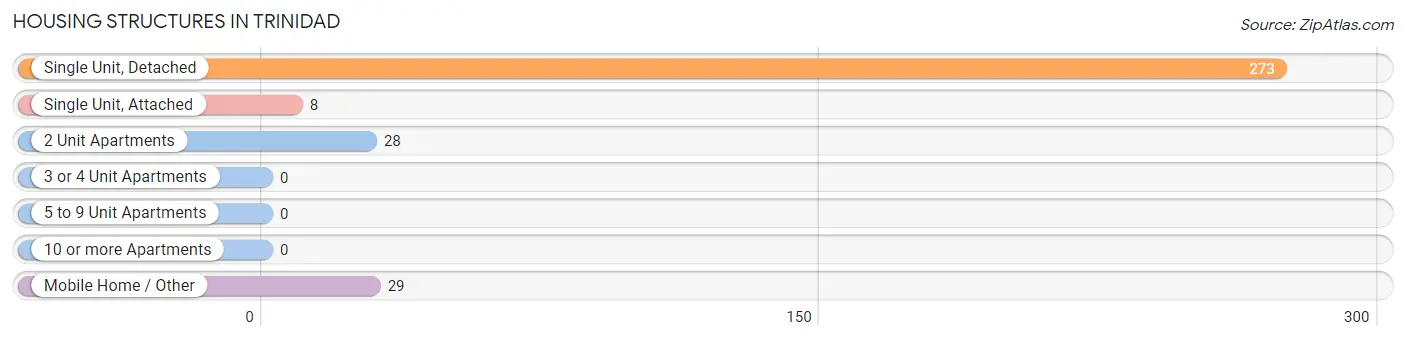
| Structure Type | # Housing Units | % Housing Units |
| Single Unit, Detached | 273 | 80.8% |
| Single Unit, Attached | 8 | 2.4% |
| 2 Unit Apartments | 28 | 8.3% |
| 3 or 4 Unit Apartments | 0 | 0.0% |
| 5 to 9 Unit Apartments | 0 | 0.0% |
| 10 or more Apartments | 0 | 0.0% |
| Mobile Home / Other | 29 | 8.6% |
| Total | 338 | 100.0% |
Housing Structures by Occupancy in Trinidad
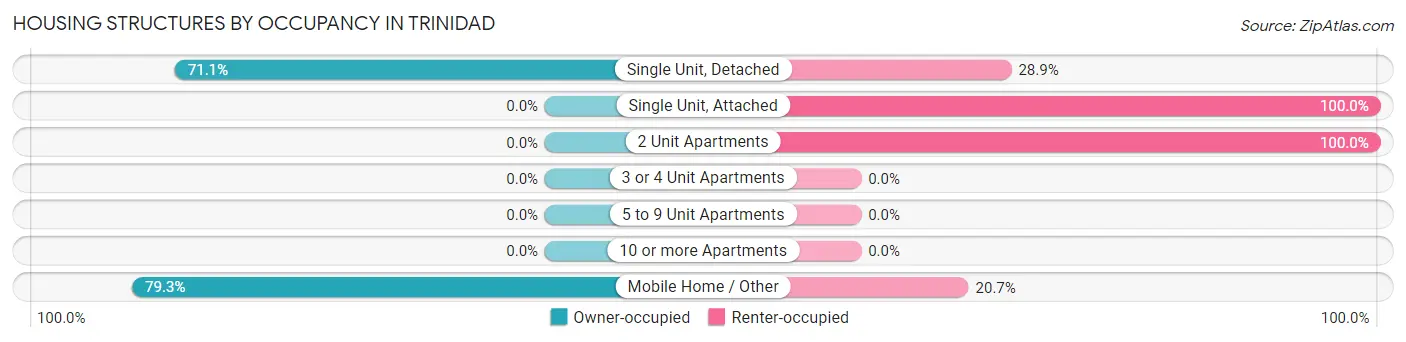
| Structure Type | Owner-occupied | Renter-occupied |
| Single Unit, Detached | 194 (71.1%) | 79 (28.9%) |
| Single Unit, Attached | 0 (0.0%) | 8 (100.0%) |
| 2 Unit Apartments | 0 (0.0%) | 28 (100.0%) |
| 3 or 4 Unit Apartments | 0 (0.0%) | 0 (0.0%) |
| 5 to 9 Unit Apartments | 0 (0.0%) | 0 (0.0%) |
| 10 or more Apartments | 0 (0.0%) | 0 (0.0%) |
| Mobile Home / Other | 23 (79.3%) | 6 (20.7%) |
| Total | 217 (64.2%) | 121 (35.8%) |
Housing Structures by Number of Rooms in Trinidad
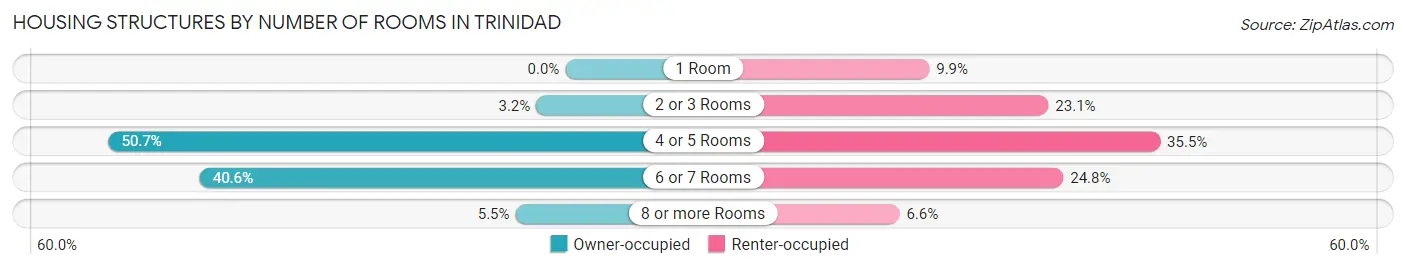
| Number of Rooms | Owner-occupied | Renter-occupied |
| 1 Room | 0 (0.0%) | 12 (9.9%) |
| 2 or 3 Rooms | 7 (3.2%) | 28 (23.1%) |
| 4 or 5 Rooms | 110 (50.7%) | 43 (35.5%) |
| 6 or 7 Rooms | 88 (40.6%) | 30 (24.8%) |
| 8 or more Rooms | 12 (5.5%) | 8 (6.6%) |
| Total | 217 (100.0%) | 121 (100.0%) |
Housing Structure by Heating Type in Trinidad
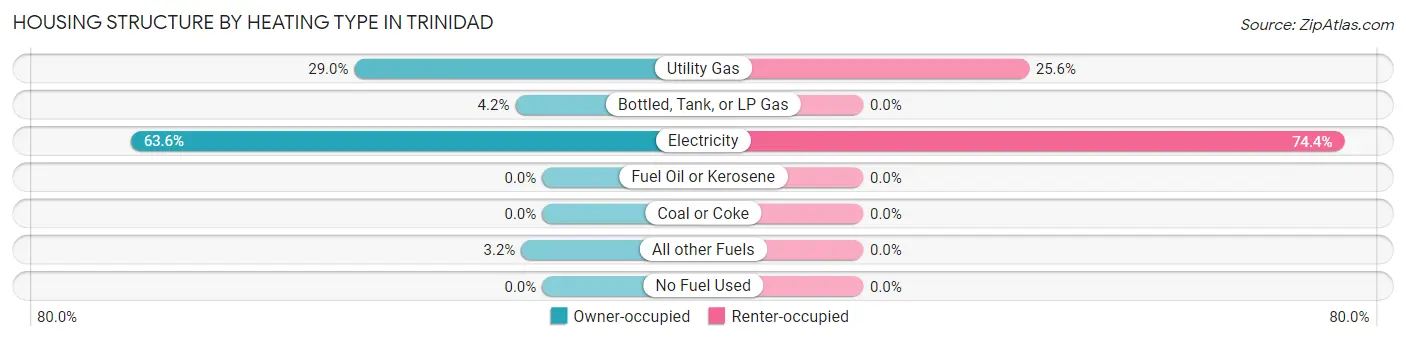
| Heating Type | Owner-occupied | Renter-occupied |
| Utility Gas | 63 (29.0%) | 31 (25.6%) |
| Bottled, Tank, or LP Gas | 9 (4.2%) | 0 (0.0%) |
| Electricity | 138 (63.6%) | 90 (74.4%) |
| Fuel Oil or Kerosene | 0 (0.0%) | 0 (0.0%) |
| Coal or Coke | 0 (0.0%) | 0 (0.0%) |
| All other Fuels | 7 (3.2%) | 0 (0.0%) |
| No Fuel Used | 0 (0.0%) | 0 (0.0%) |
| Total | 217 (100.0%) | 121 (100.0%) |
Household Vehicle Usage in Trinidad
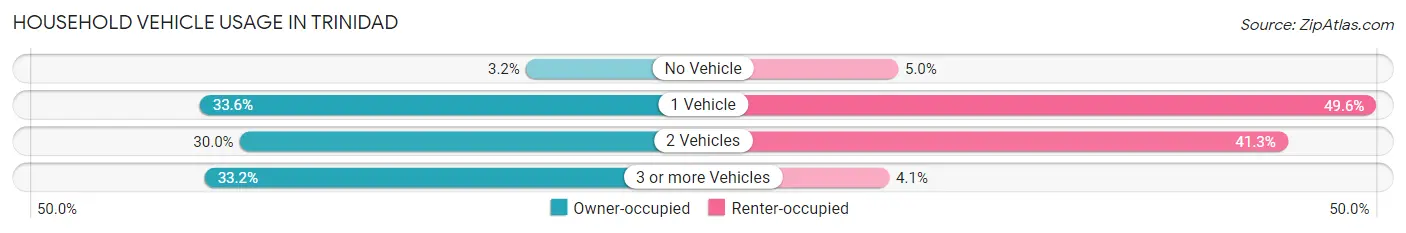
| Vehicles per Household | Owner-occupied | Renter-occupied |
| No Vehicle | 7 (3.2%) | 6 (5.0%) |
| 1 Vehicle | 73 (33.6%) | 60 (49.6%) |
| 2 Vehicles | 65 (29.9%) | 50 (41.3%) |
| 3 or more Vehicles | 72 (33.2%) | 5 (4.1%) |
| Total | 217 (100.0%) | 121 (100.0%) |
Real Estate & Mortgages in Trinidad
Real Estate and Mortgage Overview in Trinidad
| Characteristic | Without Mortgage | With Mortgage |
| Housing Units | 139 | 78 |
| Median Property Value | $78,200 | $147,400 |
| Median Household Income | $29,750 | $1 |
| Monthly Housing Costs | $445 | $0 |
| Real Estate Taxes | $1,100 | $0 |
Property Value by Mortgage Status in Trinidad
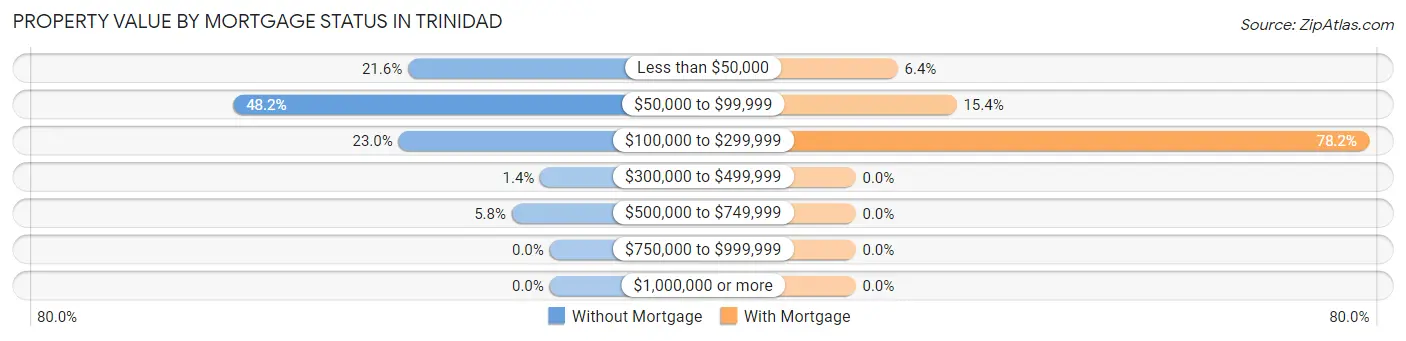
| Property Value | Without Mortgage | With Mortgage |
| Less than $50,000 | 30 (21.6%) | 5 (6.4%) |
| $50,000 to $99,999 | 67 (48.2%) | 12 (15.4%) |
| $100,000 to $299,999 | 32 (23.0%) | 61 (78.2%) |
| $300,000 to $499,999 | 2 (1.4%) | 0 (0.0%) |
| $500,000 to $749,999 | 8 (5.8%) | 0 (0.0%) |
| $750,000 to $999,999 | 0 (0.0%) | 0 (0.0%) |
| $1,000,000 or more | 0 (0.0%) | 0 (0.0%) |
| Total | 139 (100.0%) | 78 (100.0%) |
Household Income by Mortgage Status in Trinidad
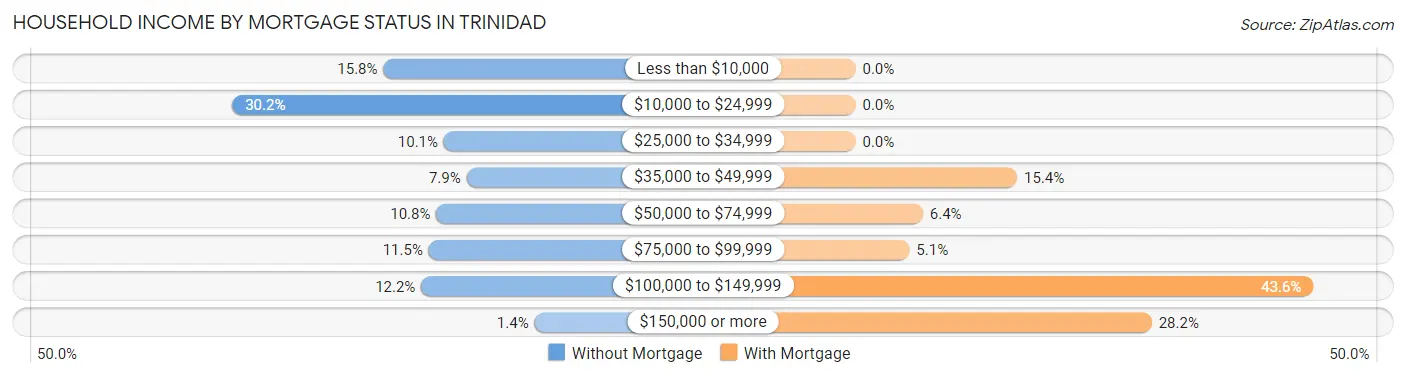
| Household Income | Without Mortgage | With Mortgage |
| Less than $10,000 | 22 (15.8%) | 0 (0.0%) |
| $10,000 to $24,999 | 42 (30.2%) | 0 (0.0%) |
| $25,000 to $34,999 | 14 (10.1%) | 0 (0.0%) |
| $35,000 to $49,999 | 11 (7.9%) | 12 (15.4%) |
| $50,000 to $74,999 | 15 (10.8%) | 5 (6.4%) |
| $75,000 to $99,999 | 16 (11.5%) | 4 (5.1%) |
| $100,000 to $149,999 | 17 (12.2%) | 34 (43.6%) |
| $150,000 or more | 2 (1.4%) | 22 (28.2%) |
| Total | 139 (100.0%) | 78 (100.0%) |
Property Value to Household Income Ratio in Trinidad
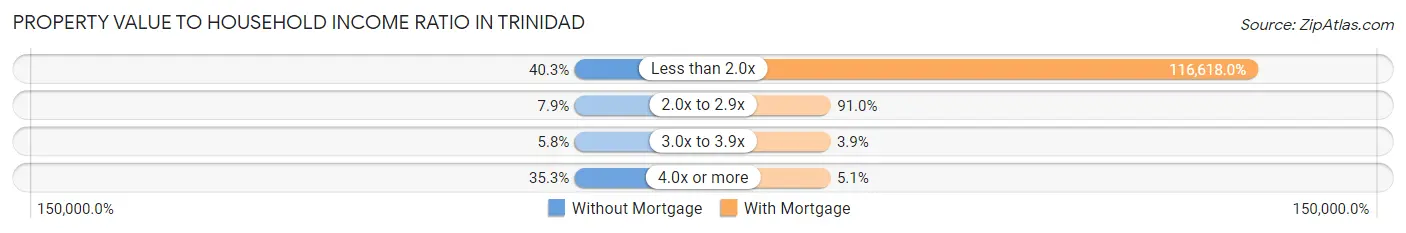
| Value-to-Income Ratio | Without Mortgage | With Mortgage |
| Less than 2.0x | 56 (40.3%) | 90,962 (116,617.9%) |
| 2.0x to 2.9x | 11 (7.9%) | 71 (91.0%) |
| 3.0x to 3.9x | 8 (5.8%) | 3 (3.8%) |
| 4.0x or more | 49 (35.2%) | 4 (5.1%) |
| Total | 139 (100.0%) | 78 (100.0%) |
Real Estate Taxes by Mortgage Status in Trinidad
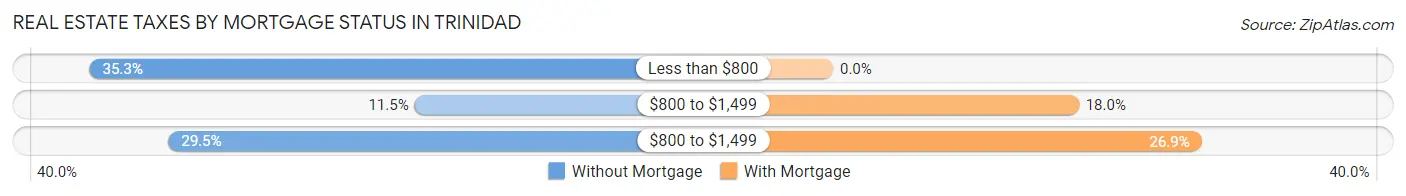
| Property Taxes | Without Mortgage | With Mortgage |
| Less than $800 | 49 (35.2%) | 0 (0.0%) |
| $800 to $1,499 | 16 (11.5%) | 14 (17.9%) |
| $800 to $1,499 | 41 (29.5%) | 21 (26.9%) |
| Total | 139 (100.0%) | 78 (100.0%) |
Health & Disability in Trinidad
Health Insurance Coverage by Age in Trinidad
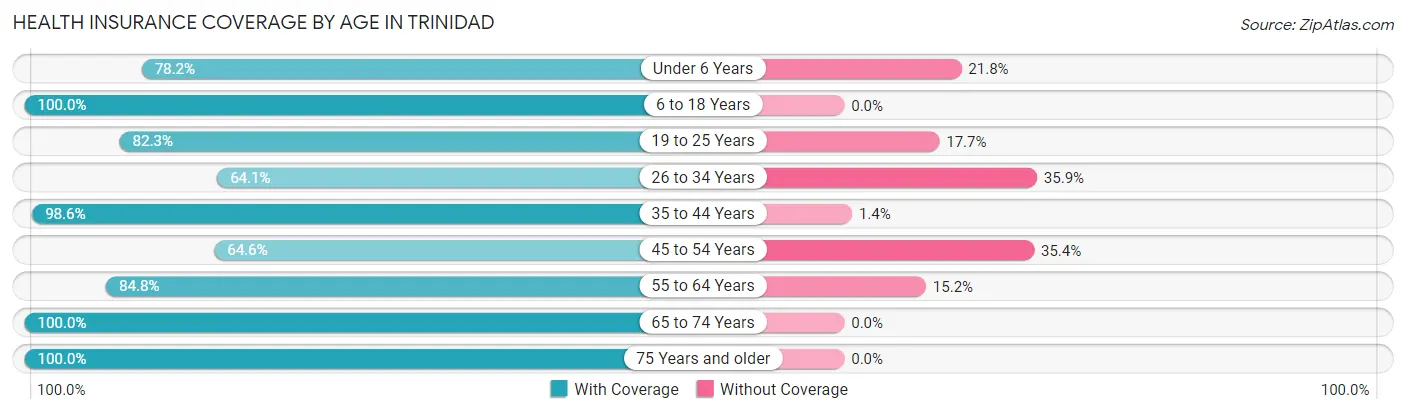
| Age Bracket | With Coverage | Without Coverage |
| Under 6 Years | 68 (78.2%) | 19 (21.8%) |
| 6 to 18 Years | 213 (100.0%) | 0 (0.0%) |
| 19 to 25 Years | 65 (82.3%) | 14 (17.7%) |
| 26 to 34 Years | 66 (64.1%) | 37 (35.9%) |
| 35 to 44 Years | 138 (98.6%) | 2 (1.4%) |
| 45 to 54 Years | 42 (64.6%) | 23 (35.4%) |
| 55 to 64 Years | 78 (84.8%) | 14 (15.2%) |
| 65 to 74 Years | 76 (100.0%) | 0 (0.0%) |
| 75 Years and older | 78 (100.0%) | 0 (0.0%) |
| Total | 824 (88.3%) | 109 (11.7%) |
Health Insurance Coverage by Citizenship Status in Trinidad
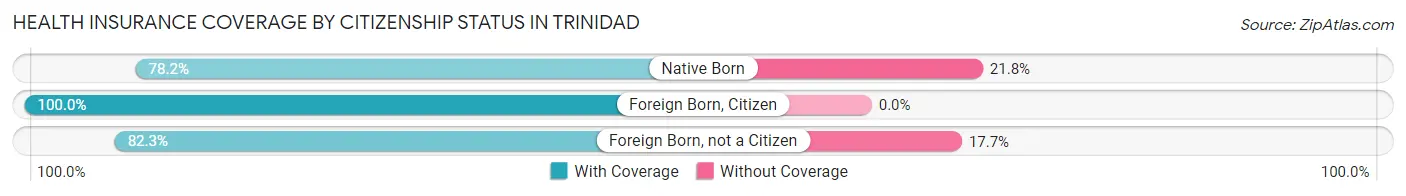
| Citizenship Status | With Coverage | Without Coverage |
| Native Born | 68 (78.2%) | 19 (21.8%) |
| Foreign Born, Citizen | 213 (100.0%) | 0 (0.0%) |
| Foreign Born, not a Citizen | 65 (82.3%) | 14 (17.7%) |
Health Insurance Coverage by Household Income in Trinidad
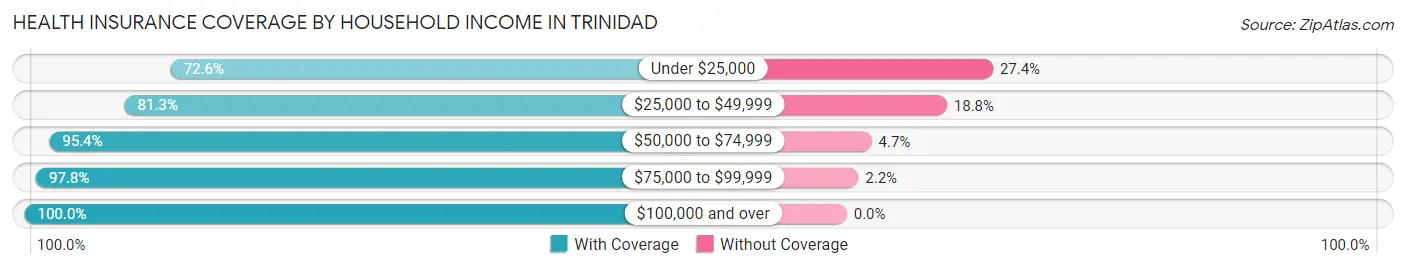
| Household Income | With Coverage | Without Coverage |
| Under $25,000 | 191 (72.6%) | 72 (27.4%) |
| $25,000 to $49,999 | 104 (81.2%) | 24 (18.8%) |
| $50,000 to $74,999 | 205 (95.4%) | 10 (4.6%) |
| $75,000 to $99,999 | 136 (97.8%) | 3 (2.2%) |
| $100,000 and over | 188 (100.0%) | 0 (0.0%) |
Public vs Private Health Insurance Coverage by Age in Trinidad
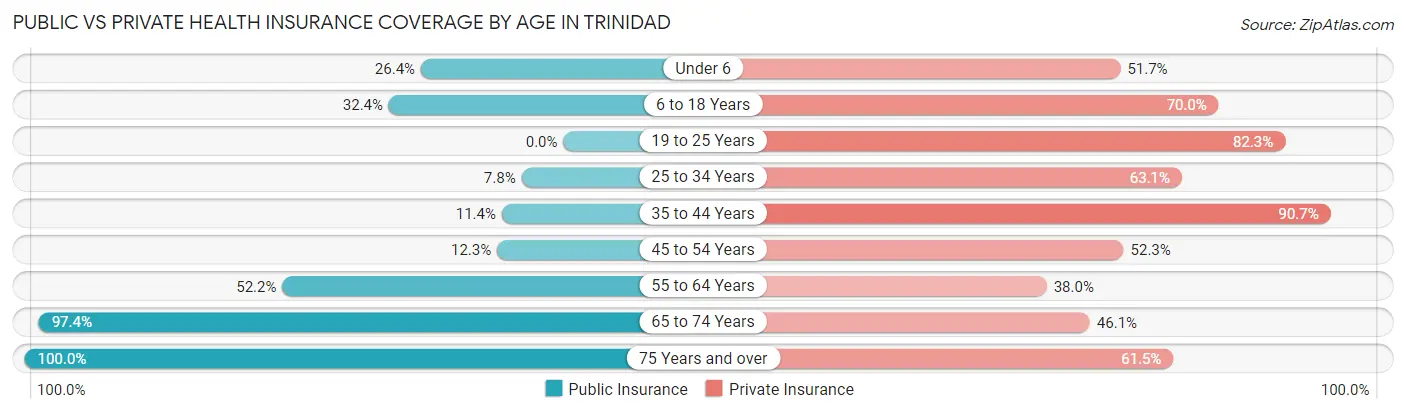
| Age Bracket | Public Insurance | Private Insurance |
| Under 6 | 23 (26.4%) | 45 (51.7%) |
| 6 to 18 Years | 69 (32.4%) | 149 (70.0%) |
| 19 to 25 Years | 0 (0.0%) | 65 (82.3%) |
| 25 to 34 Years | 8 (7.8%) | 65 (63.1%) |
| 35 to 44 Years | 16 (11.4%) | 127 (90.7%) |
| 45 to 54 Years | 8 (12.3%) | 34 (52.3%) |
| 55 to 64 Years | 48 (52.2%) | 35 (38.0%) |
| 65 to 74 Years | 74 (97.4%) | 35 (46.1%) |
| 75 Years and over | 78 (100.0%) | 48 (61.5%) |
| Total | 324 (34.7%) | 603 (64.6%) |
Disability Status by Sex by Age in Trinidad
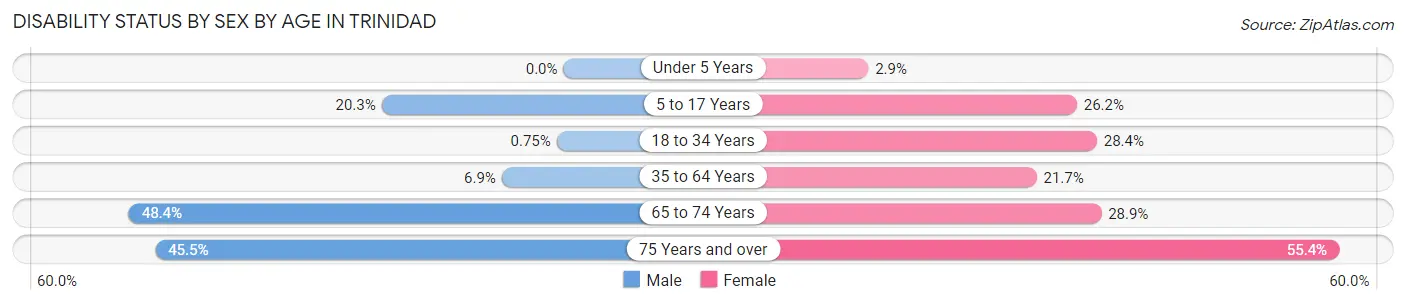
| Age Bracket | Male | Female |
| Under 5 Years | 0 (0.0%) | 1 (2.9%) |
| 5 to 17 Years | 16 (20.3%) | 28 (26.2%) |
| 18 to 34 Years | 1 (0.7%) | 23 (28.4%) |
| 35 to 64 Years | 9 (6.9%) | 36 (21.7%) |
| 65 to 74 Years | 15 (48.4%) | 13 (28.9%) |
| 75 Years and over | 10 (45.5%) | 31 (55.4%) |
Disability Class by Sex by Age in Trinidad
Disability Class: Hearing Difficulty
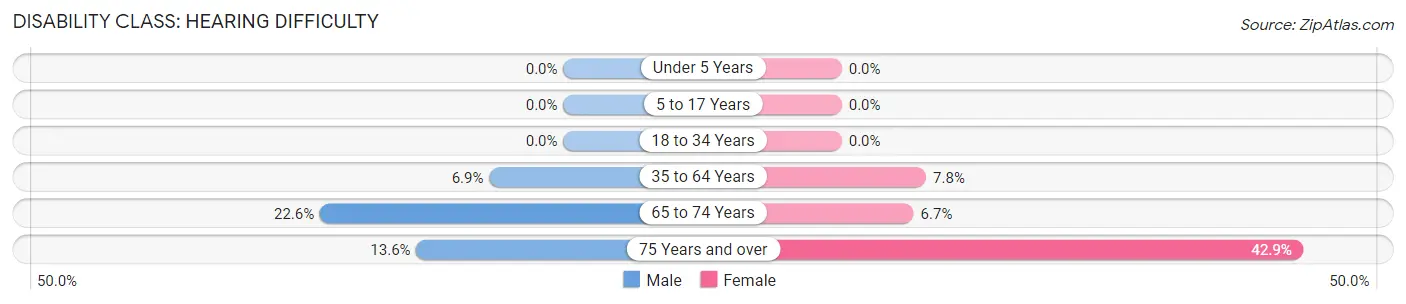
| Age Bracket | Male | Female |
| Under 5 Years | 0 (0.0%) | 0 (0.0%) |
| 5 to 17 Years | 0 (0.0%) | 0 (0.0%) |
| 18 to 34 Years | 0 (0.0%) | 0 (0.0%) |
| 35 to 64 Years | 9 (6.9%) | 13 (7.8%) |
| 65 to 74 Years | 7 (22.6%) | 3 (6.7%) |
| 75 Years and over | 3 (13.6%) | 24 (42.9%) |
Disability Class: Vision Difficulty
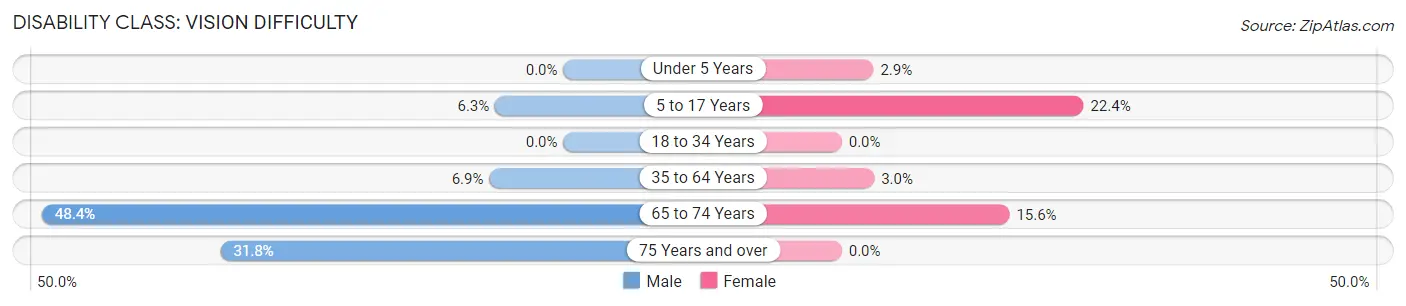
| Age Bracket | Male | Female |
| Under 5 Years | 0 (0.0%) | 1 (2.9%) |
| 5 to 17 Years | 5 (6.3%) | 24 (22.4%) |
| 18 to 34 Years | 0 (0.0%) | 0 (0.0%) |
| 35 to 64 Years | 9 (6.9%) | 5 (3.0%) |
| 65 to 74 Years | 15 (48.4%) | 7 (15.6%) |
| 75 Years and over | 7 (31.8%) | 0 (0.0%) |
Disability Class: Cognitive Difficulty
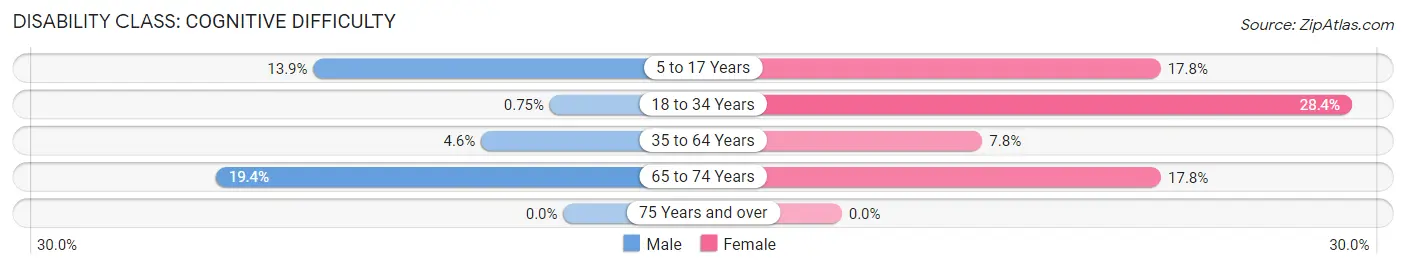
| Age Bracket | Male | Female |
| 5 to 17 Years | 11 (13.9%) | 19 (17.8%) |
| 18 to 34 Years | 1 (0.7%) | 23 (28.4%) |
| 35 to 64 Years | 6 (4.6%) | 13 (7.8%) |
| 65 to 74 Years | 6 (19.4%) | 8 (17.8%) |
| 75 Years and over | 0 (0.0%) | 0 (0.0%) |
Disability Class: Ambulatory Difficulty
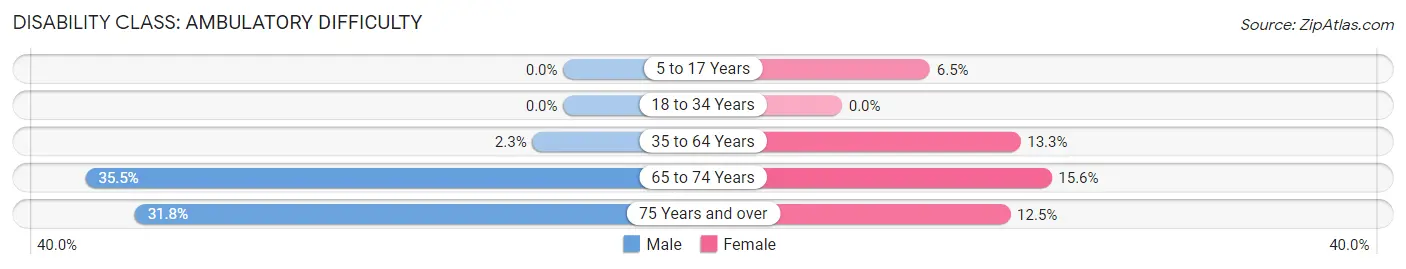
| Age Bracket | Male | Female |
| 5 to 17 Years | 0 (0.0%) | 7 (6.5%) |
| 18 to 34 Years | 0 (0.0%) | 0 (0.0%) |
| 35 to 64 Years | 3 (2.3%) | 22 (13.3%) |
| 65 to 74 Years | 11 (35.5%) | 7 (15.6%) |
| 75 Years and over | 7 (31.8%) | 7 (12.5%) |
Disability Class: Self-Care Difficulty
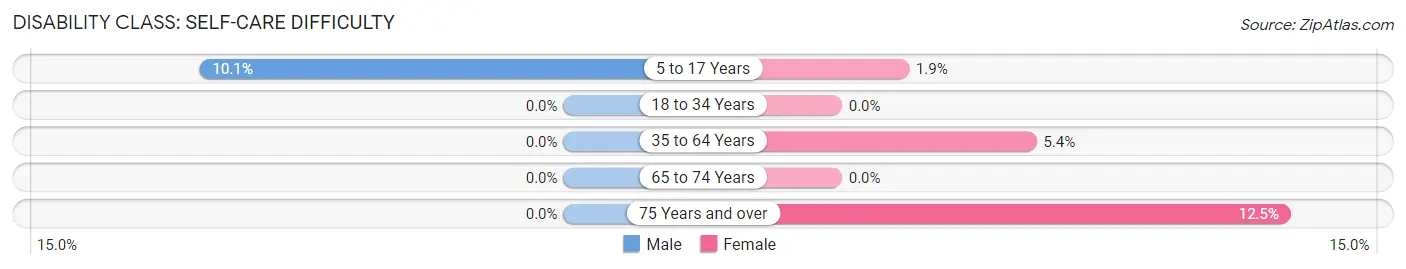
| Age Bracket | Male | Female |
| 5 to 17 Years | 8 (10.1%) | 2 (1.9%) |
| 18 to 34 Years | 0 (0.0%) | 0 (0.0%) |
| 35 to 64 Years | 0 (0.0%) | 9 (5.4%) |
| 65 to 74 Years | 0 (0.0%) | 0 (0.0%) |
| 75 Years and over | 0 (0.0%) | 7 (12.5%) |
Technology Access in Trinidad
Computing Device Access in Trinidad
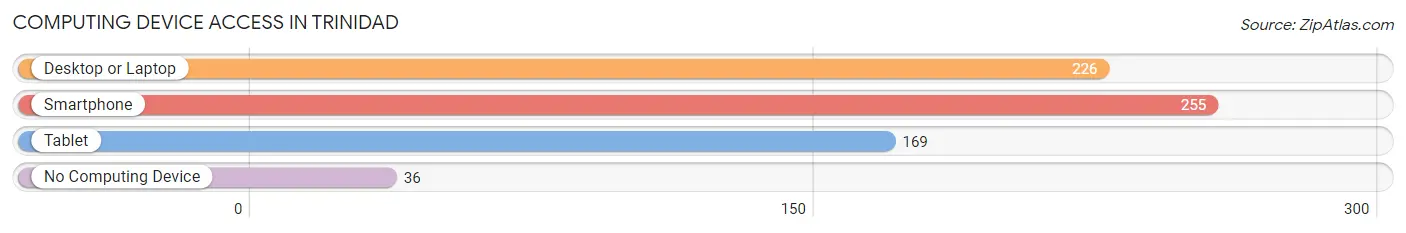
| Device Type | # Households | % Households |
| Desktop or Laptop | 226 | 66.9% |
| Smartphone | 255 | 75.4% |
| Tablet | 169 | 50.0% |
| No Computing Device | 36 | 10.6% |
| Total | 338 | 100.0% |
Internet Access in Trinidad
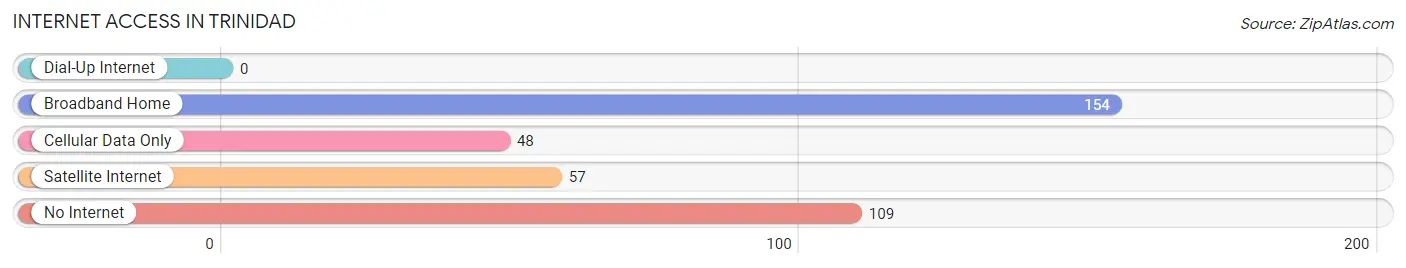
| Internet Type | # Households | % Households |
| Dial-Up Internet | 0 | 0.0% |
| Broadband Home | 154 | 45.6% |
| Cellular Data Only | 48 | 14.2% |
| Satellite Internet | 57 | 16.9% |
| No Internet | 109 | 32.3% |
| Total | 338 | 100.0% |
Trinidad Summary
Trinidad, Texas is a small town located in Henderson County, Texas. It is situated on the banks of the Trinity River, about 75 miles east of Dallas. The town was founded in 1872 and has a population of approximately 1,000 people.
History
Trinidad was founded in 1872 by a group of settlers from the nearby town of Athens. The settlers were looking for a place to settle and start a new life. The town was named after the nearby Trinity River, which was named by Spanish explorers in the late 1700s. The town was originally a farming community, but soon became a trading center for the surrounding area.
In the late 1800s, the town began to grow and prosper. The railroad arrived in 1881, bringing with it new businesses and opportunities. The town was incorporated in 1883 and soon became a hub for the surrounding area.
In the early 1900s, the town began to decline. The railroad was moved to a different location and the town began to suffer from a lack of economic activity. However, in the late 1940s, the town began to experience a resurgence. The town was revitalized by the construction of a new bridge over the Trinity River, which allowed for easier access to the town.
Geography
Trinidad is located in Henderson County, Texas. It is situated on the banks of the Trinity River, about 75 miles east of Dallas. The town is surrounded by rolling hills and is located in a rural area. The town is located in the East Texas region of the state and is part of the Tyler-Longview metropolitan area.
The climate in Trinidad is humid subtropical, with hot summers and mild winters. The average temperature in the summer is around 90 degrees Fahrenheit, while the average temperature in the winter is around 50 degrees Fahrenheit. The town receives an average of 40 inches of rain per year.
Economy
Trinidad’s economy is largely based on agriculture and tourism. The town is home to several farms, which produce a variety of crops, including cotton, corn, soybeans, and wheat. The town is also home to several tourist attractions, including the Trinity River National Wildlife Refuge and the Henderson County Historical Museum.
The town is also home to several small businesses, including restaurants, shops, and other services. The town is also home to a few manufacturing companies, which produce a variety of products, including furniture, clothing, and electronics.
Demographics
As of the 2010 census, the population of Trinidad was 1,000 people. The racial makeup of the town was 95.2% White, 0.7% African American, 0.3% Native American, 0.3% Asian, 0.1% Pacific Islander, and 3.5% from other races. The median household income in the town was $31,250, and the median family income was $37,500.
Conclusion
Trinidad, Texas is a small town located in Henderson County, Texas. It is situated on the banks of the Trinity River, about 75 miles east of Dallas. The town was founded in 1872 and has a population of approximately 1,000 people. The town’s economy is largely based on agriculture and tourism, and it is home to several small businesses. The town is also home to a few manufacturing companies, which produce a variety of products. The racial makeup of the town is 95.2% White, 0.7% African American, 0.3% Native American, 0.3% Asian, 0.1% Pacific Islander, and 3.5% from other races. The median household income in the town was $31,250, and the median family income was $37,500.
Common Questions
What is Per Capita Income in Trinidad?
Per Capita income in Trinidad is $17,950.
What is the Median Family Income in Trinidad?
Median Family Income in Trinidad is $56,250.
What is the Median Household income in Trinidad?
Median Household Income in Trinidad is $32,143.
What is Income or Wage Gap in Trinidad?
Income or Wage Gap in Trinidad is 46.0%.
Women in Trinidad earn 54.0 cents for every dollar earned by a man.
What is Inequality or Gini Index in Trinidad?
Inequality or Gini Index in Trinidad is 0.44.
What is the Total Population of Trinidad?
Total Population of Trinidad is 933.
What is the Total Male Population of Trinidad?
Total Male Population of Trinidad is 444.
What is the Total Female Population of Trinidad?
Total Female Population of Trinidad is 489.
What is the Ratio of Males per 100 Females in Trinidad?
There are 90.80 Males per 100 Females in Trinidad.
What is the Ratio of Females per 100 Males in Trinidad?
There are 110.14 Females per 100 Males in Trinidad.
What is the Median Population Age in Trinidad?
Median Population Age in Trinidad is 34.2 Years.
What is the Average Family Size in Trinidad
Average Family Size in Trinidad is 3.7 People.
What is the Average Household Size in Trinidad
Average Household Size in Trinidad is 2.8 People.
How Large is the Labor Force in Trinidad?
There are 320 People in the Labor Forcein in Trinidad.
What is the Percentage of People in the Labor Force in Trinidad?
45.7% of People are in the Labor Force in Trinidad.
What is the Unemployment Rate in Trinidad?
Unemployment Rate in Trinidad is 2.5%.