Tivoli, TX Map & Demographics
Tivoli Map
Tivoli Overview
$30,734
PER CAPITA INCOME
$64,318
AVG FAMILY INCOME
$63,636
AVG HOUSEHOLD INCOME
35.5%
WAGE / INCOME GAP [ % ]
64.5¢/ $1
WAGE / INCOME GAP [ $ ]
0.29
INEQUALITY / GINI INDEX
628
TOTAL POPULATION
328
MALE POPULATION
300
FEMALE POPULATION
109.33
MALES / 100 FEMALES
91.46
FEMALES / 100 MALES
57.3
MEDIAN AGE
3.8
AVG FAMILY SIZE
2.5
AVG HOUSEHOLD SIZE
328
LABOR FORCE [ PEOPLE ]
58.0%
PERCENT IN LABOR FORCE
23.8%
UNEMPLOYMENT RATE
Tivoli Zip Codes
Tivoli Area Codes
Income in Tivoli
Income Overview in Tivoli
Per Capita Income in Tivoli is $30,734, while median incomes of families and households are $64,318 and $63,636 respectively.
| Characteristic | Number | Measure |
| Per Capita Income | 628 | $30,734 |
| Median Family Income | 134 | $64,318 |
| Mean Family Income | 134 | $73,448 |
| Median Household Income | 248 | $63,636 |
| Mean Household Income | 248 | $68,928 |
| Income Deficit | 134 | $0 |
| Wage / Income Gap (%) | 628 | 35.55% |
| Wage / Income Gap ($) | 628 | 64.45¢ per $1 |
| Gini / Inequality Index | 628 | 0.29 |
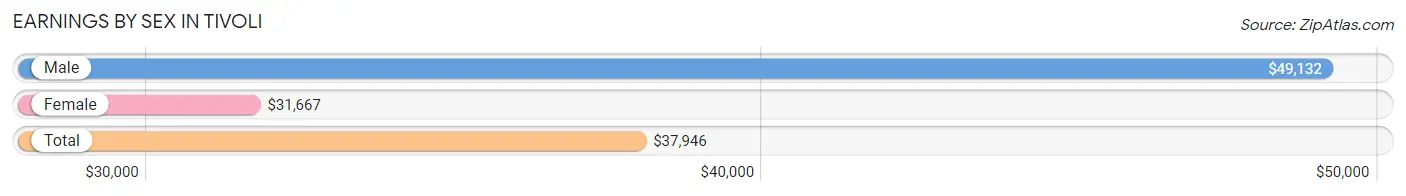
Earnings by Sex in Tivoli
Average Earnings in Tivoli are $37,946, $49,132 for men and $31,667 for women, a difference of 35.5%.
| Sex | Number | Average Earnings |
| Male | 137 (49.1%) | $49,132 |
| Female | 142 (50.9%) | $31,667 |
| Total | 279 (100.0%) | $37,946 |
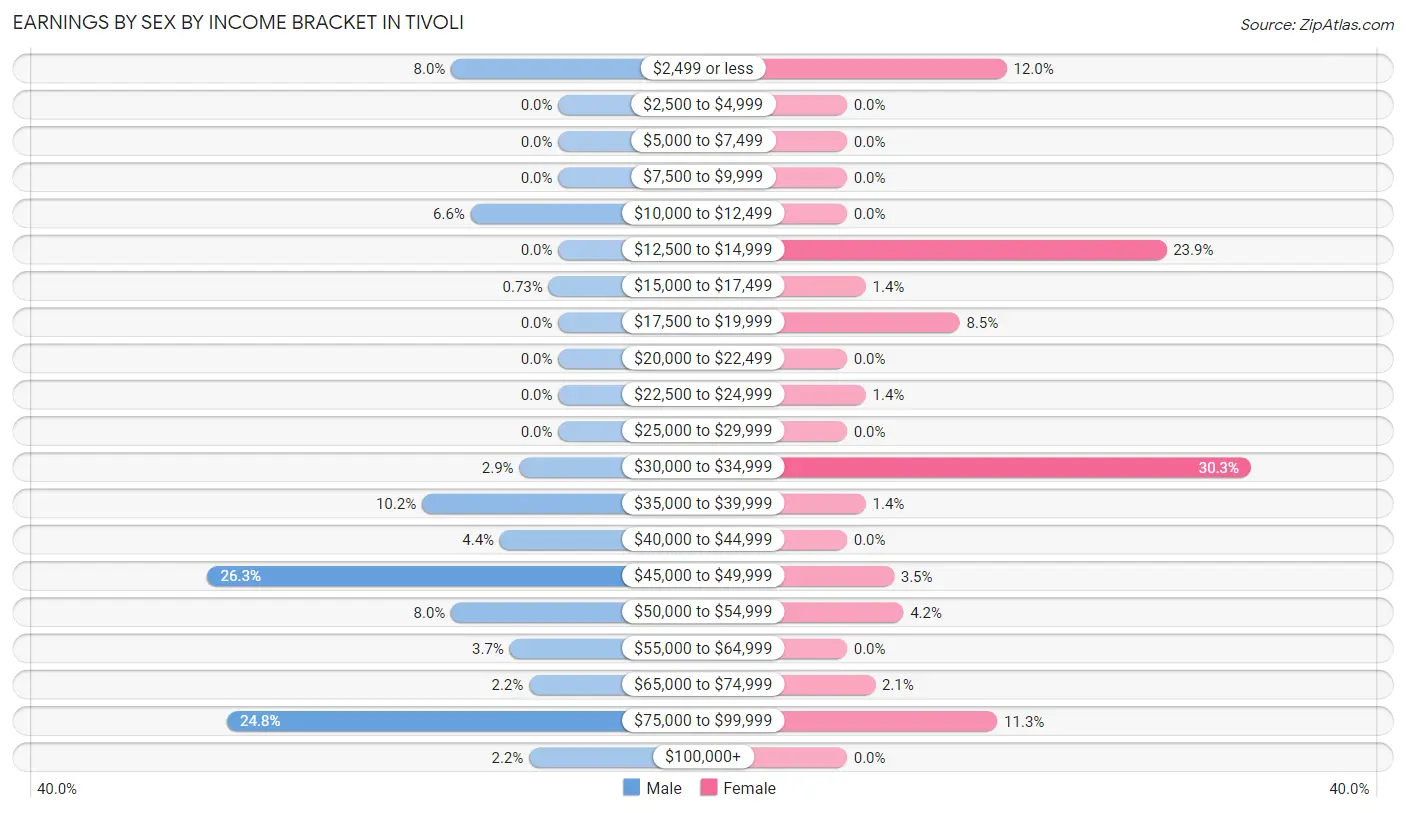
Earnings by Sex by Income Bracket in Tivoli
The most common earnings brackets in Tivoli are $45,000 to $49,999 for men (36 | 26.3%) and $30,000 to $34,999 for women (43 | 30.3%).
| Income | Male | Female |
| $2,499 or less | 11 (8.0%) | 17 (12.0%) |
| $2,500 to $4,999 | 0 (0.0%) | 0 (0.0%) |
| $5,000 to $7,499 | 0 (0.0%) | 0 (0.0%) |
| $7,500 to $9,999 | 0 (0.0%) | 0 (0.0%) |
| $10,000 to $12,499 | 9 (6.6%) | 0 (0.0%) |
| $12,500 to $14,999 | 0 (0.0%) | 34 (23.9%) |
| $15,000 to $17,499 | 1 (0.7%) | 2 (1.4%) |
| $17,500 to $19,999 | 0 (0.0%) | 12 (8.5%) |
| $20,000 to $22,499 | 0 (0.0%) | 0 (0.0%) |
| $22,500 to $24,999 | 0 (0.0%) | 2 (1.4%) |
| $25,000 to $29,999 | 0 (0.0%) | 0 (0.0%) |
| $30,000 to $34,999 | 4 (2.9%) | 43 (30.3%) |
| $35,000 to $39,999 | 14 (10.2%) | 2 (1.4%) |
| $40,000 to $44,999 | 6 (4.4%) | 0 (0.0%) |
| $45,000 to $49,999 | 36 (26.3%) | 5 (3.5%) |
| $50,000 to $54,999 | 11 (8.0%) | 6 (4.2%) |
| $55,000 to $64,999 | 5 (3.6%) | 0 (0.0%) |
| $65,000 to $74,999 | 3 (2.2%) | 3 (2.1%) |
| $75,000 to $99,999 | 34 (24.8%) | 16 (11.3%) |
| $100,000+ | 3 (2.2%) | 0 (0.0%) |
| Total | 137 (100.0%) | 142 (100.0%) |
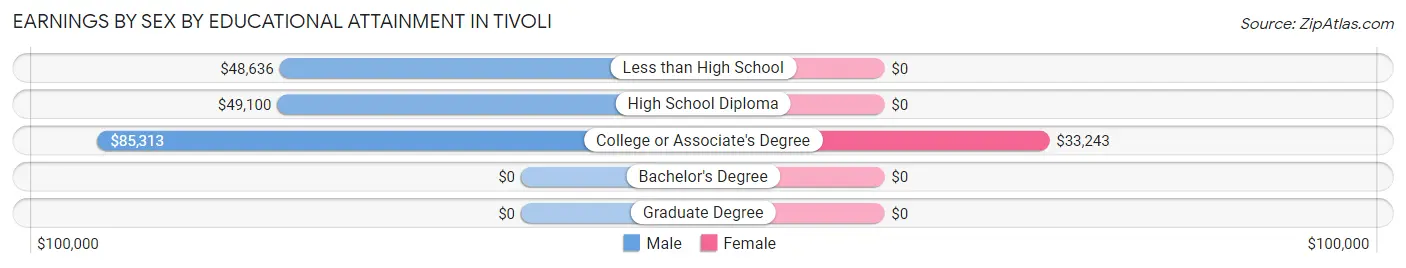
Earnings by Sex by Educational Attainment in Tivoli
Average earnings in Tivoli are $49,236 for men and $31,667 for women, a difference of 35.7%. Men with an educational attainment of college or associate's degree enjoy the highest average annual earnings of $85,313, while those with less than high school education earn the least with $48,636. Women with an educational attainment of college or associate's degree earn the most with the average annual earnings of $33,243, while those with college or associate's degree education have the smallest earnings of $33,243.
| Educational Attainment | Male Income | Female Income |
| Less than High School | $48,636 | $0 |
| High School Diploma | $49,100 | $0 |
| College or Associate's Degree | $85,313 | $33,243 |
| Bachelor's Degree | - | - |
| Graduate Degree | - | - |
| Total | $49,236 | $31,667 |
Family Income in Tivoli
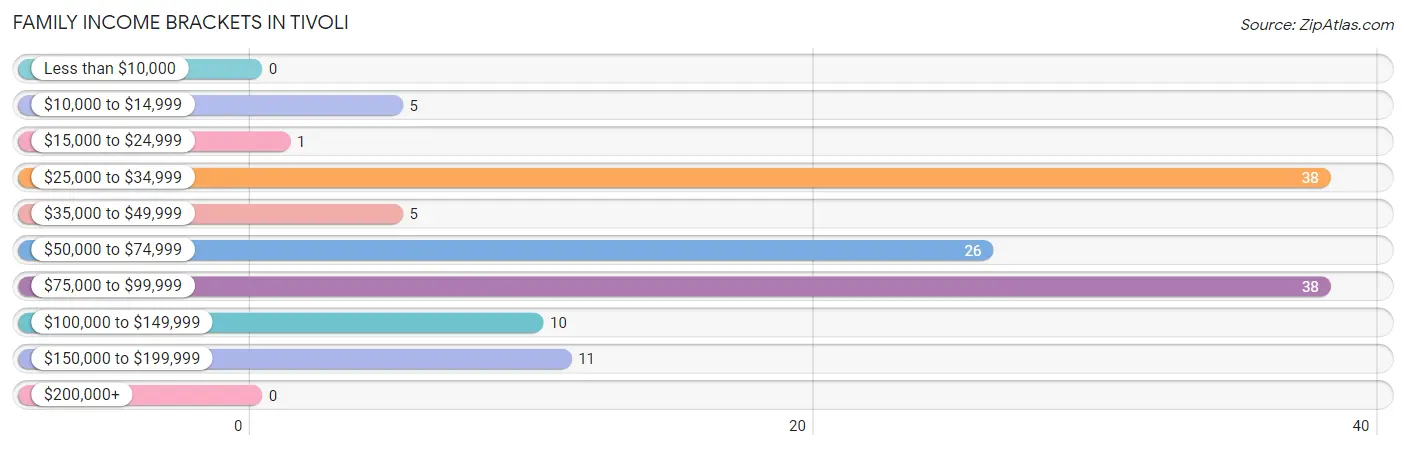
Family Income Brackets in Tivoli
According to the Tivoli family income data, there are 38 families falling into the $25,000 to $34,999 income range, which is the most common income bracket and makes up 28.4% of all families.
| Income Bracket | # Families | % Families |
| Less than $10,000 | 0 | 0.0% |
| $10,000 to $14,999 | 5 | 3.7% |
| $15,000 to $24,999 | 1 | 0.7% |
| $25,000 to $34,999 | 38 | 28.4% |
| $35,000 to $49,999 | 5 | 3.7% |
| $50,000 to $74,999 | 26 | 19.4% |
| $75,000 to $99,999 | 38 | 28.4% |
| $100,000 to $149,999 | 10 | 7.5% |
| $150,000 to $199,999 | 11 | 8.2% |
| $200,000+ | 0 | 0.0% |
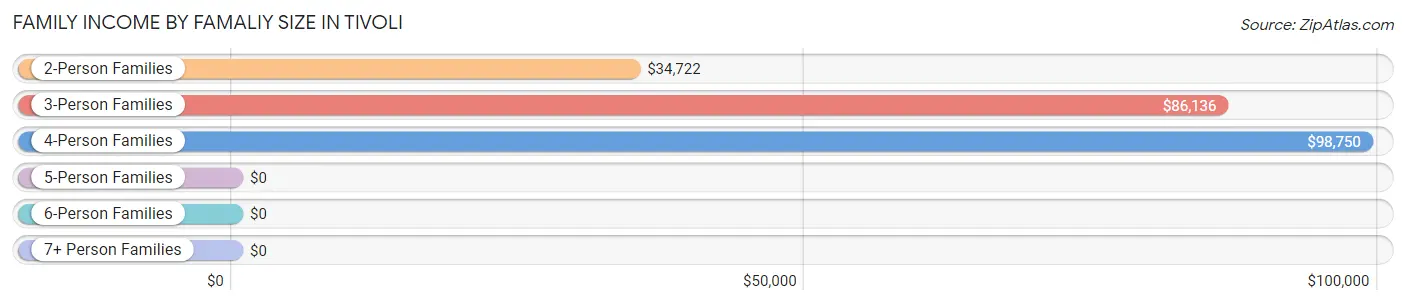
Family Income by Famaliy Size in Tivoli
4-person families (12 | 9.0%) account for the highest median family income in Tivoli with $98,750 per family, while 3-person families (32 | 23.9%) have the highest median income of $28,712 per family member.
| Income Bracket | # Families | Median Income |
| 2-Person Families | 82 (61.2%) | $34,722 |
| 3-Person Families | 32 (23.9%) | $86,136 |
| 4-Person Families | 12 (9.0%) | $98,750 |
| 5-Person Families | 0 (0.0%) | $0 |
| 6-Person Families | 8 (6.0%) | $0 |
| 7+ Person Families | 0 (0.0%) | $0 |
| Total | 134 (100.0%) | $64,318 |
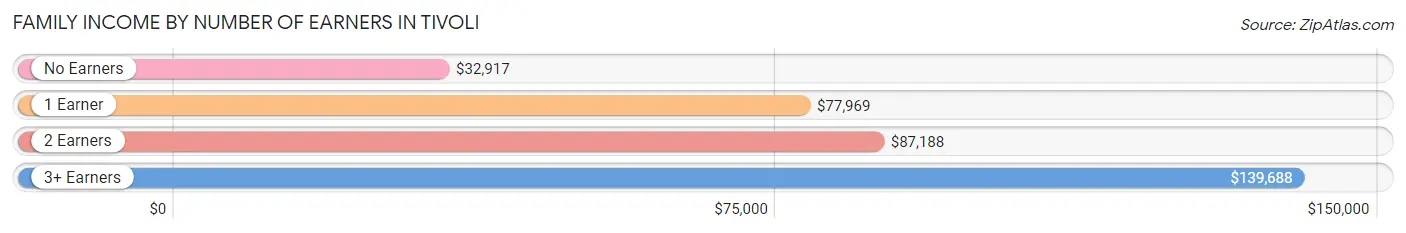
Family Income by Number of Earners in Tivoli
The median family income in Tivoli is $64,318, with families comprising 3+ earners (18) having the highest median family income of $139,688, while families with no earners (46) have the lowest median family income of $32,917, accounting for 13.4% and 34.3% of families, respectively.
| Number of Earners | # Families | Median Income |
| No Earners | 46 (34.3%) | $32,917 |
| 1 Earner | 35 (26.1%) | $77,969 |
| 2 Earners | 35 (26.1%) | $87,188 |
| 3+ Earners | 18 (13.4%) | $139,688 |
| Total | 134 (100.0%) | $64,318 |
Household Income in Tivoli
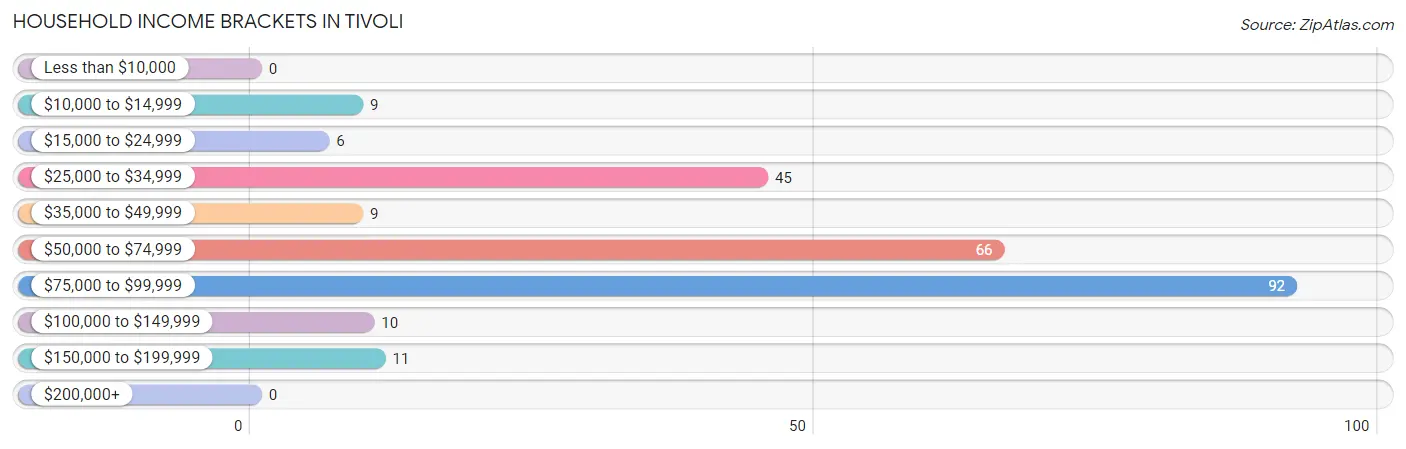
Household Income Brackets in Tivoli
With 92 households falling in the category, the $75,000 to $99,999 income range is the most frequent in Tivoli, accounting for 37.1% of all households.
| Income Bracket | # Households | % Households |
| Less than $10,000 | 0 | 0.0% |
| $10,000 to $14,999 | 9 | 3.6% |
| $15,000 to $24,999 | 6 | 2.4% |
| $25,000 to $34,999 | 45 | 18.1% |
| $35,000 to $49,999 | 9 | 3.6% |
| $50,000 to $74,999 | 66 | 26.6% |
| $75,000 to $99,999 | 92 | 37.1% |
| $100,000 to $149,999 | 10 | 4.0% |
| $150,000 to $199,999 | 11 | 4.4% |
| $200,000+ | 0 | 0.0% |
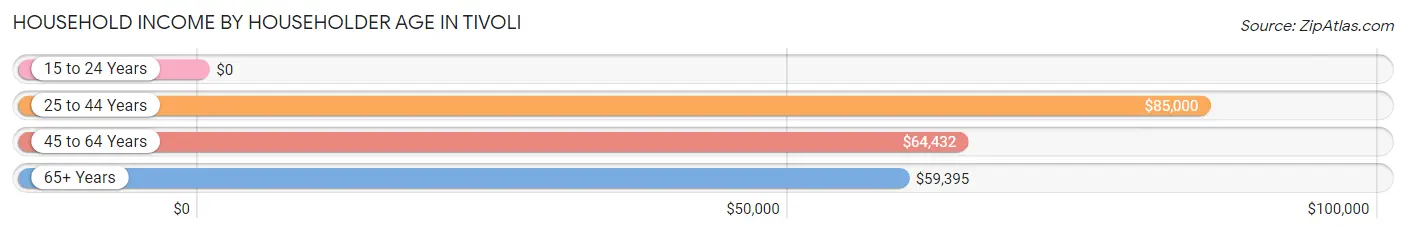
Household Income by Householder Age in Tivoli
The median household income in Tivoli is $63,636, with the highest median household income of $85,000 found in the 25 to 44 years age bracket for the primary householder. A total of 20 households (8.1%) fall into this category.
| Income Bracket | # Households | Median Income |
| 15 to 24 Years | 0 (0.0%) | $0 |
| 25 to 44 Years | 20 (8.1%) | $85,000 |
| 45 to 64 Years | 95 (38.3%) | $64,432 |
| 65+ Years | 133 (53.6%) | $59,395 |
| Total | 248 (100.0%) | $63,636 |
Poverty in Tivoli
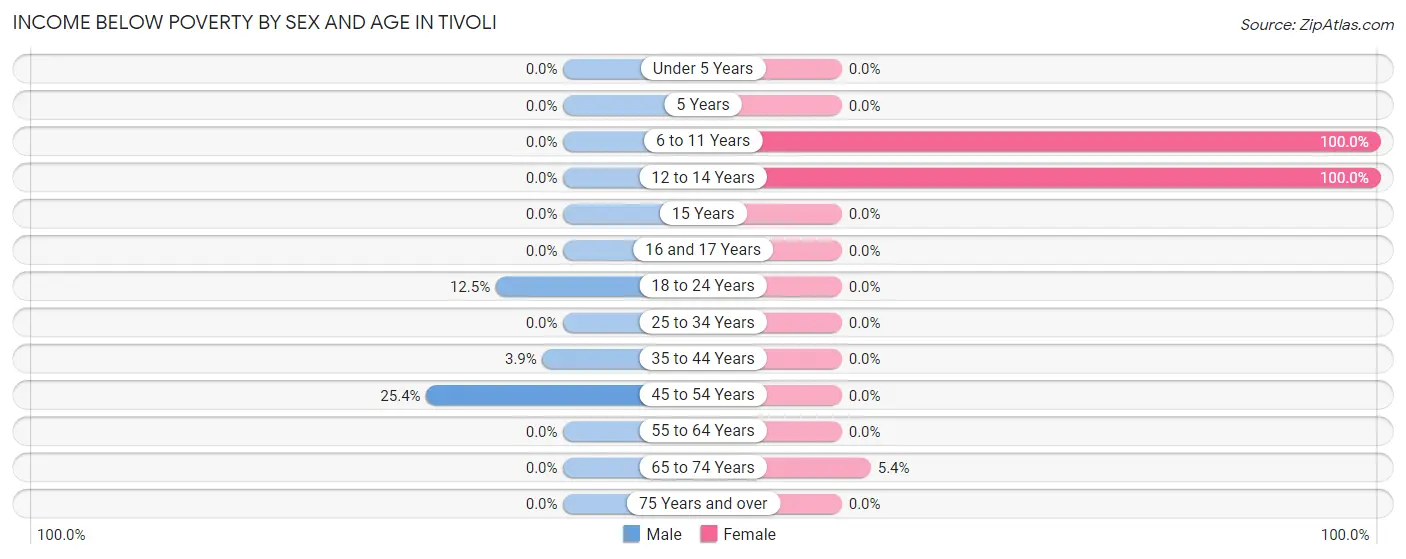
Income Below Poverty by Sex and Age in Tivoli
With 5.5% poverty level for males and 3.7% for females among the residents of Tivoli, 45 to 54 year old males and 6 to 11 year old females are the most vulnerable to poverty, with 15 males (25.4%) and 3 females (100.0%) in their respective age groups living below the poverty level.
| Age Bracket | Male | Female |
| Under 5 Years | 0 (0.0%) | 0 (0.0%) |
| 5 Years | 0 (0.0%) | 0 (0.0%) |
| 6 to 11 Years | 0 (0.0%) | 3 (100.0%) |
| 12 to 14 Years | 0 (0.0%) | 3 (100.0%) |
| 15 Years | 0 (0.0%) | 0 (0.0%) |
| 16 and 17 Years | 0 (0.0%) | 0 (0.0%) |
| 18 to 24 Years | 2 (12.5%) | 0 (0.0%) |
| 25 to 34 Years | 0 (0.0%) | 0 (0.0%) |
| 35 to 44 Years | 1 (3.8%) | 0 (0.0%) |
| 45 to 54 Years | 15 (25.4%) | 0 (0.0%) |
| 55 to 64 Years | 0 (0.0%) | 0 (0.0%) |
| 65 to 74 Years | 0 (0.0%) | 5 (5.4%) |
| 75 Years and over | 0 (0.0%) | 0 (0.0%) |
| Total | 18 (5.5%) | 11 (3.7%) |
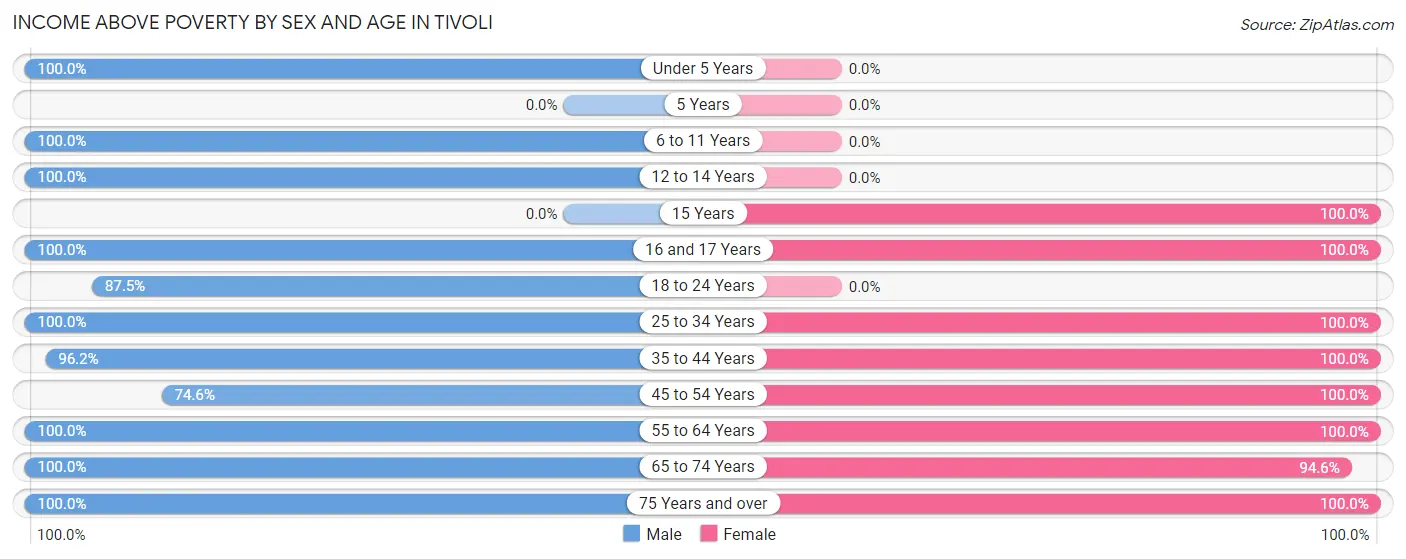
Income Above Poverty by Sex and Age in Tivoli
According to the poverty statistics in Tivoli, males aged under 5 years and females aged 15 years are the age groups that are most secure financially, with 100.0% of males and 100.0% of females in these age groups living above the poverty line.
| Age Bracket | Male | Female |
| Under 5 Years | 31 (100.0%) | 0 (0.0%) |
| 5 Years | 0 (0.0%) | 0 (0.0%) |
| 6 to 11 Years | 5 (100.0%) | 0 (0.0%) |
| 12 to 14 Years | 17 (100.0%) | 0 (0.0%) |
| 15 Years | 0 (0.0%) | 3 (100.0%) |
| 16 and 17 Years | 7 (100.0%) | 11 (100.0%) |
| 18 to 24 Years | 14 (87.5%) | 0 (0.0%) |
| 25 to 34 Years | 13 (100.0%) | 45 (100.0%) |
| 35 to 44 Years | 25 (96.2%) | 46 (100.0%) |
| 45 to 54 Years | 44 (74.6%) | 26 (100.0%) |
| 55 to 64 Years | 67 (100.0%) | 64 (100.0%) |
| 65 to 74 Years | 67 (100.0%) | 88 (94.6%) |
| 75 Years and over | 20 (100.0%) | 6 (100.0%) |
| Total | 310 (94.5%) | 289 (96.3%) |
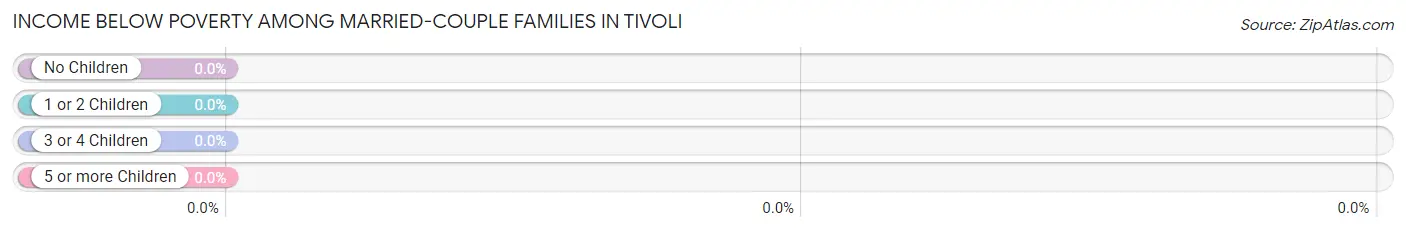
Income Below Poverty Among Married-Couple Families in Tivoli
| Children | Above Poverty | Below Poverty |
| No Children | 78 (100.0%) | 0 (0.0%) |
| 1 or 2 Children | 30 (100.0%) | 0 (0.0%) |
| 3 or 4 Children | 0 (0.0%) | 0 (0.0%) |
| 5 or more Children | 0 (0.0%) | 0 (0.0%) |
| Total | 108 (100.0%) | 0 (0.0%) |
Income Below Poverty Among Single-Parent Households in Tivoli
According to the poverty data in Tivoli, 33.3% or 1 single-father households and 21.7% or 5 single-mother households are living below the poverty line. Among single-father households, those with 1 or 2 children have the highest poverty rate, with 1 households (100.0%) experiencing poverty. Likewise, among single-mother households, those with no children have the highest poverty rate, with 5 households (21.7%) falling below the poverty line.
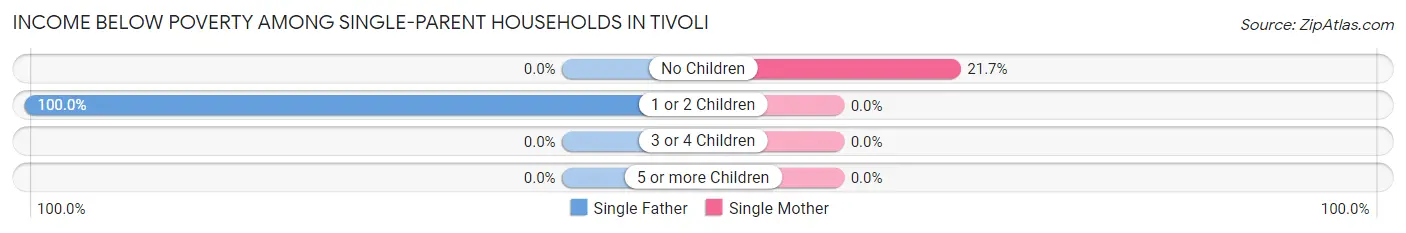
| Children | Single Father | Single Mother |
| No Children | 0 (0.0%) | 5 (21.7%) |
| 1 or 2 Children | 1 (100.0%) | 0 (0.0%) |
| 3 or 4 Children | 0 (0.0%) | 0 (0.0%) |
| 5 or more Children | 0 (0.0%) | 0 (0.0%) |
| Total | 1 (33.3%) | 5 (21.7%) |
Income Below Poverty Among Married-Couple vs Single-Parent Households in Tivoli
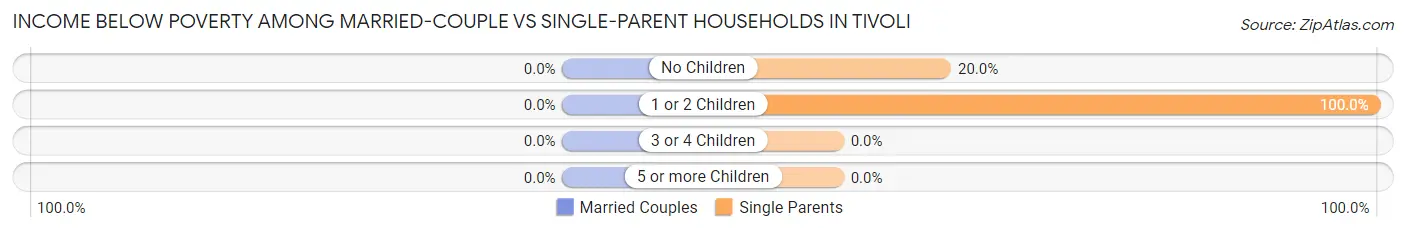
| Children | Married-Couple Families | Single-Parent Households |
| No Children | 0 (0.0%) | 5 (20.0%) |
| 1 or 2 Children | 0 (0.0%) | 1 (100.0%) |
| 3 or 4 Children | 0 (0.0%) | 0 (0.0%) |
| 5 or more Children | 0 (0.0%) | 0 (0.0%) |
| Total | 0 (0.0%) | 6 (23.1%) |
Race in Tivoli
The most populous races in Tivoli are Hispanic or Latino (501 | 79.8%), White / Caucasian (500 | 79.6%), and Two or more Races (86 | 13.7%).
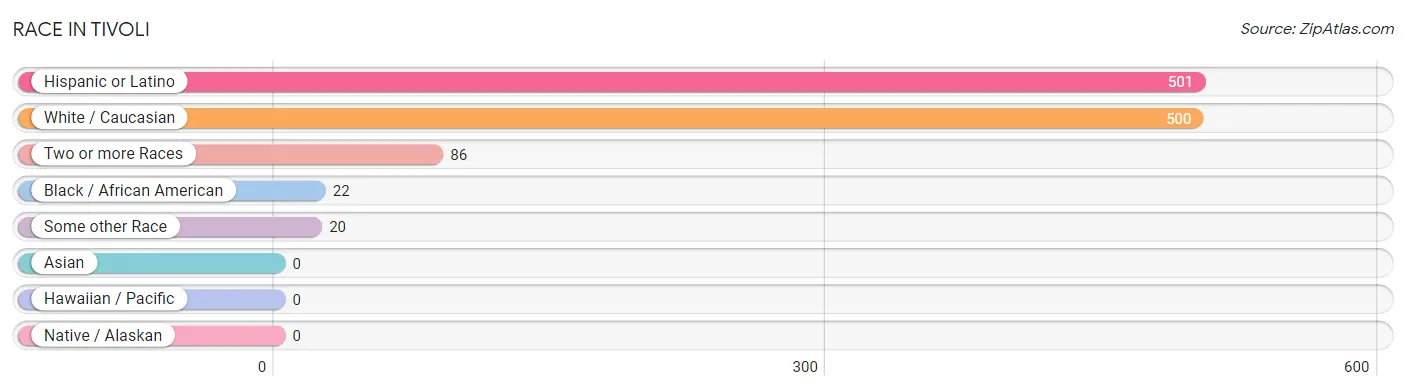
| Race | # Population | % Population |
| Asian | 0 | 0.0% |
| Black / African American | 22 | 3.5% |
| Hawaiian / Pacific | 0 | 0.0% |
| Hispanic or Latino | 501 | 79.8% |
| Native / Alaskan | 0 | 0.0% |
| White / Caucasian | 500 | 79.6% |
| Two or more Races | 86 | 13.7% |
| Some other Race | 20 | 3.2% |
| Total | 628 | 100.0% |
Ancestry in Tivoli
The most populous ancestries reported in Tivoli are Mexican (479 | 76.3%), German (50 | 8.0%), Irish (23 | 3.7%), Central American (22 | 3.5%), and Costa Rican (22 | 3.5%), together accounting for 94.9% of all Tivoli residents.
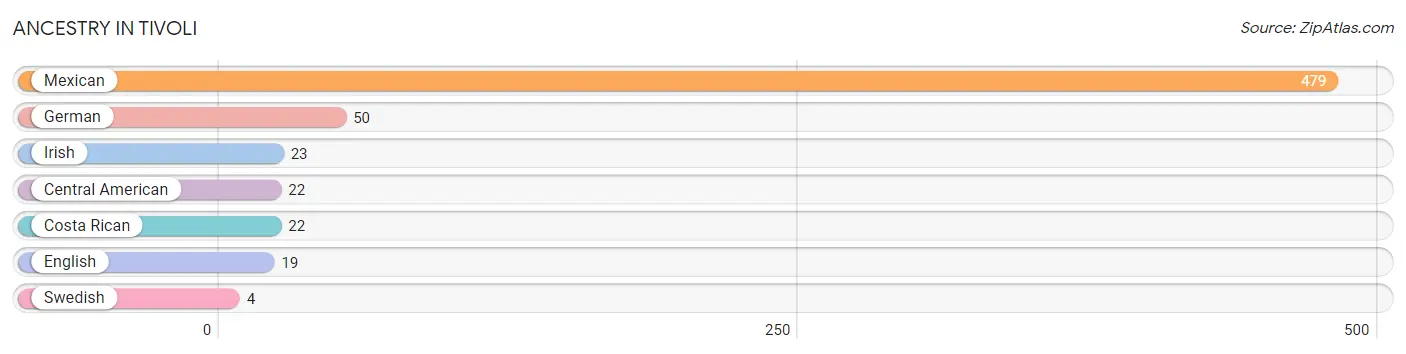
| Ancestry | # Population | % Population |
| Central American | 22 | 3.5% |
| Costa Rican | 22 | 3.5% |
| English | 19 | 3.0% |
| German | 50 | 8.0% |
| Irish | 23 | 3.7% |
| Mexican | 479 | 76.3% |
| Swedish | 4 | 0.6% | View All 7 Rows |
Immigrants in Tivoli
The most numerous immigrant groups reported in Tivoli came from Central America (47 | 7.5%), Latin America (47 | 7.5%), Mexico (25 | 4.0%), Costa Rica (22 | 3.5%), and Belarus (20 | 3.2%), together accounting for 25.6% of all Tivoli residents.
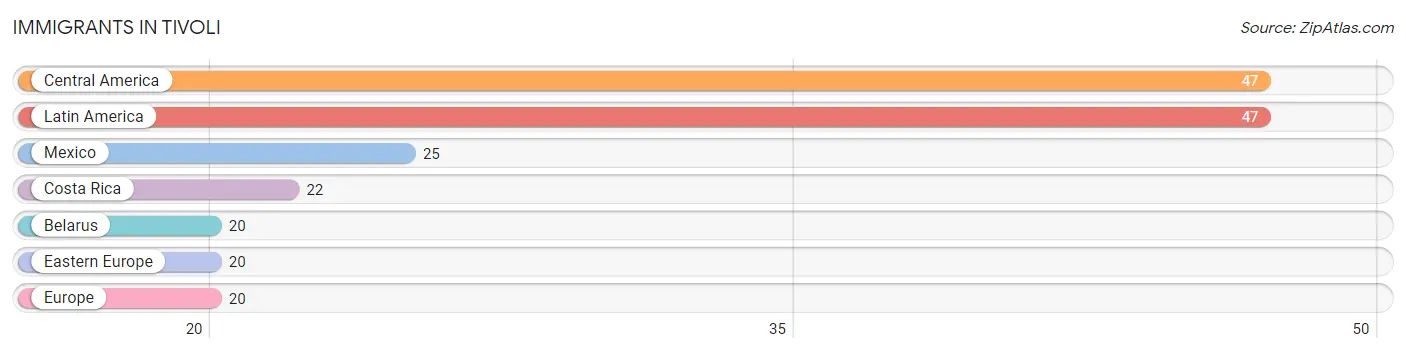
| Immigration Origin | # Population | % Population |
| Belarus | 20 | 3.2% |
| Central America | 47 | 7.5% |
| Costa Rica | 22 | 3.5% |
| Eastern Europe | 20 | 3.2% |
| Europe | 20 | 3.2% |
| Latin America | 47 | 7.5% |
| Mexico | 25 | 4.0% | View All 7 Rows |
Sex and Age in Tivoli
Sex and Age in Tivoli
The most populous age groups in Tivoli are 60 to 64 Years (42 | 12.8%) for men and 65 to 69 Years (68 | 22.7%) for women.
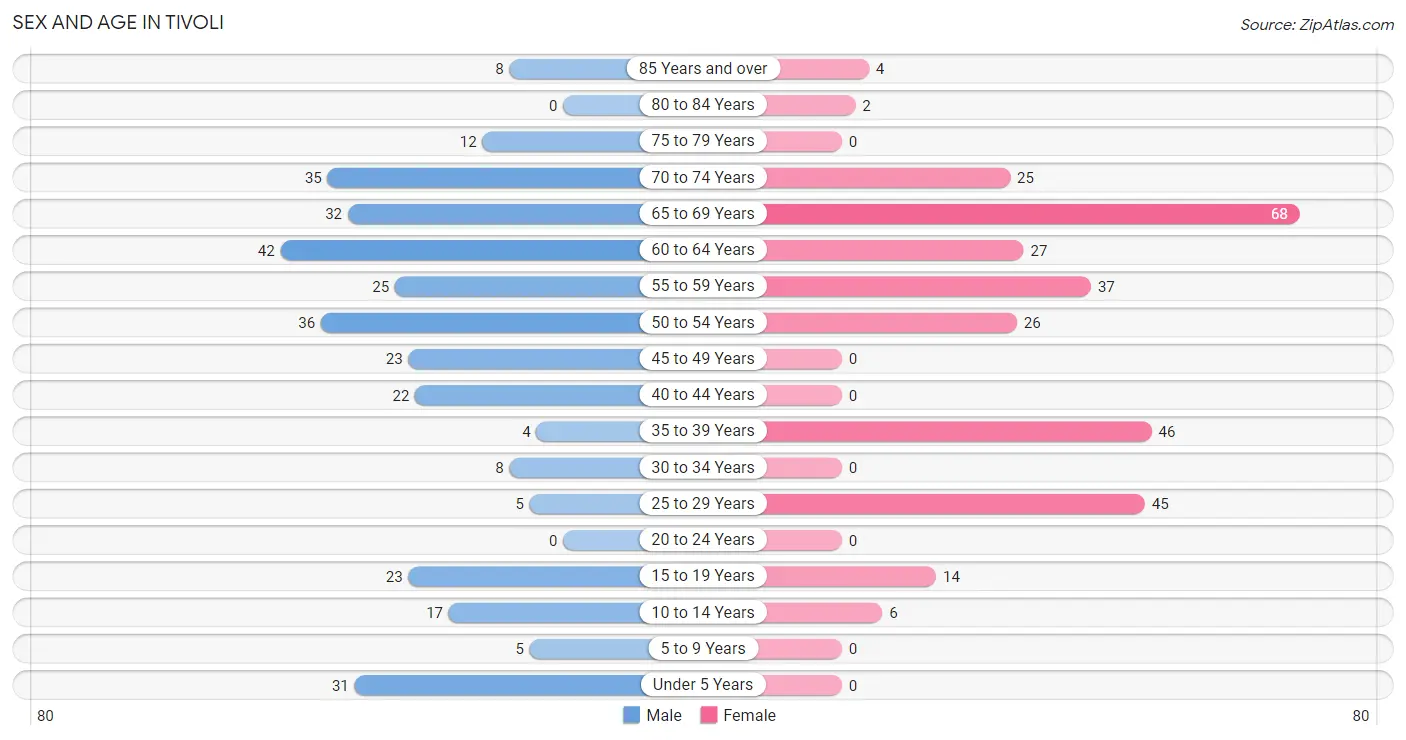
| Age Bracket | Male | Female |
| Under 5 Years | 31 (9.5%) | 0 (0.0%) |
| 5 to 9 Years | 5 (1.5%) | 0 (0.0%) |
| 10 to 14 Years | 17 (5.2%) | 6 (2.0%) |
| 15 to 19 Years | 23 (7.0%) | 14 (4.7%) |
| 20 to 24 Years | 0 (0.0%) | 0 (0.0%) |
| 25 to 29 Years | 5 (1.5%) | 45 (15.0%) |
| 30 to 34 Years | 8 (2.4%) | 0 (0.0%) |
| 35 to 39 Years | 4 (1.2%) | 46 (15.3%) |
| 40 to 44 Years | 22 (6.7%) | 0 (0.0%) |
| 45 to 49 Years | 23 (7.0%) | 0 (0.0%) |
| 50 to 54 Years | 36 (11.0%) | 26 (8.7%) |
| 55 to 59 Years | 25 (7.6%) | 37 (12.3%) |
| 60 to 64 Years | 42 (12.8%) | 27 (9.0%) |
| 65 to 69 Years | 32 (9.8%) | 68 (22.7%) |
| 70 to 74 Years | 35 (10.7%) | 25 (8.3%) |
| 75 to 79 Years | 12 (3.7%) | 0 (0.0%) |
| 80 to 84 Years | 0 (0.0%) | 2 (0.7%) |
| 85 Years and over | 8 (2.4%) | 4 (1.3%) |
| Total | 328 (100.0%) | 300 (100.0%) |
Families and Households in Tivoli
Median Family Size in Tivoli
The median family size in Tivoli is 3.81 persons per family, with single male/father families (3 | 2.2%) accounting for the largest median family size of 8.33 persons per family. On the other hand, single female/mother families (23 | 17.2%) represent the smallest median family size with 2.91 persons per family.
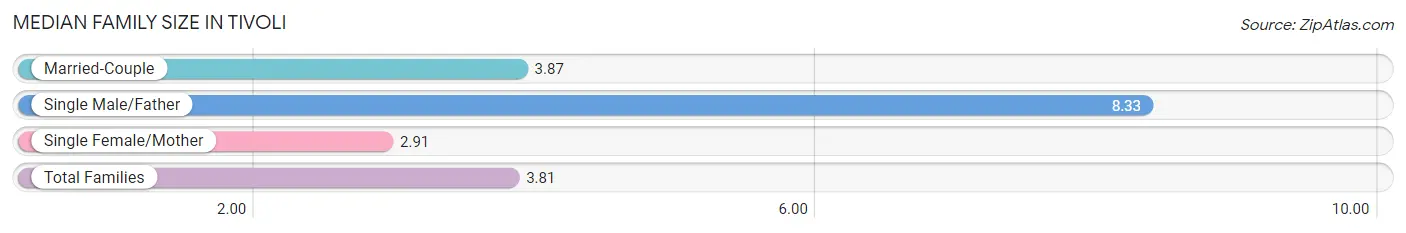
| Family Type | # Families | Family Size |
| Married-Couple | 108 (80.6%) | 3.87 |
| Single Male/Father | 3 (2.2%) | 8.33 |
| Single Female/Mother | 23 (17.2%) | 2.91 |
| Total Families | 134 (100.0%) | 3.81 |
Median Household Size in Tivoli
The median household size in Tivoli is 2.53 persons per household, with single male/father households (3 | 1.2%) accounting for the largest median household size of 8.67 persons per household. non-family households (114 | 46.0%) represent the smallest median household size with 1.03 persons per household.
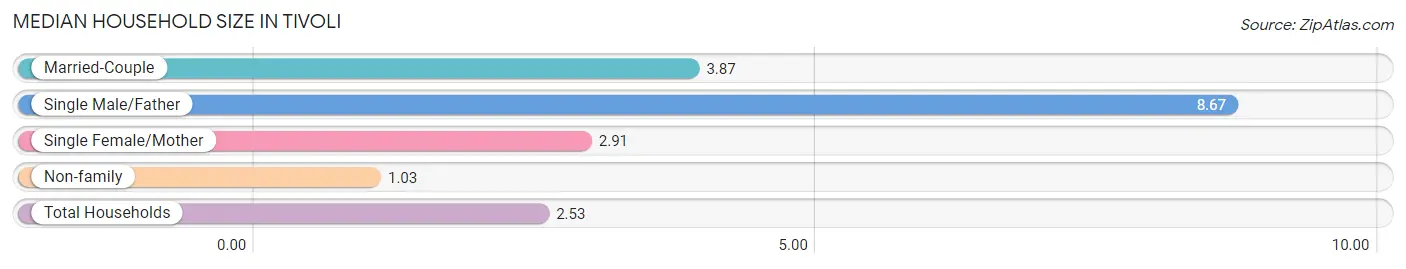
| Household Type | # Households | Household Size |
| Married-Couple | 108 (43.5%) | 3.87 |
| Single Male/Father | 3 (1.2%) | 8.67 |
| Single Female/Mother | 23 (9.3%) | 2.91 |
| Non-family | 114 (46.0%) | 1.03 |
| Total Households | 248 (100.0%) | 2.53 |
Household Size by Marriage Status in Tivoli
Out of a total of 248 households in Tivoli, 134 (54.0%) are family households, while 114 (46.0%) are nonfamily households. The most numerous type of family households are 2-person households, comprising 82, and the most common type of nonfamily households are 1-person households, comprising 110.
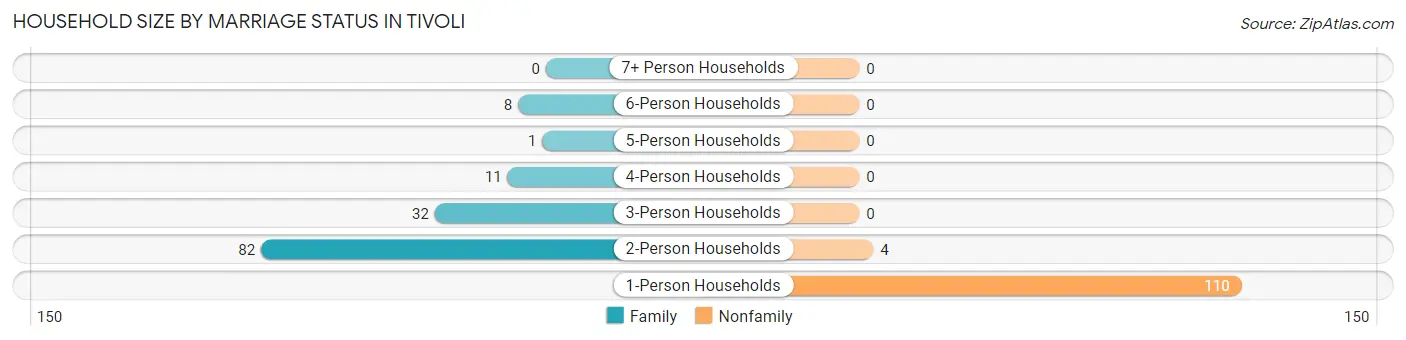
| Household Size | Family Households | Nonfamily Households |
| 1-Person Households | - | 110 (44.4%) |
| 2-Person Households | 82 (33.1%) | 4 (1.6%) |
| 3-Person Households | 32 (12.9%) | 0 (0.0%) |
| 4-Person Households | 11 (4.4%) | 0 (0.0%) |
| 5-Person Households | 1 (0.4%) | 0 (0.0%) |
| 6-Person Households | 8 (3.2%) | 0 (0.0%) |
| 7+ Person Households | 0 (0.0%) | 0 (0.0%) |
| Total | 134 (54.0%) | 114 (46.0%) |
Female Fertility in Tivoli
Fertility by Age in Tivoli
| Age Bracket | Women with Births | Births / 1,000 Women |
| 15 to 19 years | 0 (0.0%) | 0.0 |
| 20 to 34 years | 0 (0.0%) | 0.0 |
| 35 to 50 years | 0 (0.0%) | 0.0 |
| Total | 0 (0.0%) | 0.0 |
Fertility by Age by Marriage Status in Tivoli
| Age Bracket | Married | Unmarried |
| 15 to 19 years | 0 (0.0%) | 0 (0.0%) |
| 20 to 34 years | 0 (0.0%) | 0 (0.0%) |
| 35 to 50 years | 0 (0.0%) | 0 (0.0%) |
| Total | 0 (0.0%) | 0 (0.0%) |
Fertility by Education in Tivoli

| Educational Attainment | Women with Births | Births / 1,000 Women |
| Less than High School | 0 (0.0%) | 0.0 |
| High School Diploma | 0 (0.0%) | 0.0 |
| College or Associate's Degree | 0 (0.0%) | 0.0 |
| Bachelor's Degree | 0 (0.0%) | 0.0 |
| Graduate Degree | 0 (0.0%) | 0.0 |
| Total | 0 (0.0%) | 0.0 |
Fertility by Education by Marriage Status in Tivoli
| Educational Attainment | Married | Unmarried |
| Less than High School | 0 (0.0%) | 0 (0.0%) |
| High School Diploma | 0 (0.0%) | 0 (0.0%) |
| College or Associate's Degree | 0 (0.0%) | 0 (0.0%) |
| Bachelor's Degree | 0 (0.0%) | 0 (0.0%) |
| Graduate Degree | 0 (0.0%) | 0 (0.0%) |
| Total | 0 (0.0%) | 0 (0.0%) |
Employment Characteristics in Tivoli
Employment by Class of Employer in Tivoli
Among the 250 employed individuals in Tivoli, private company employees (178 | 71.2%), local government employees (61 | 24.4%), and federal government employees (8 | 3.2%) make up the most common classes of employment.
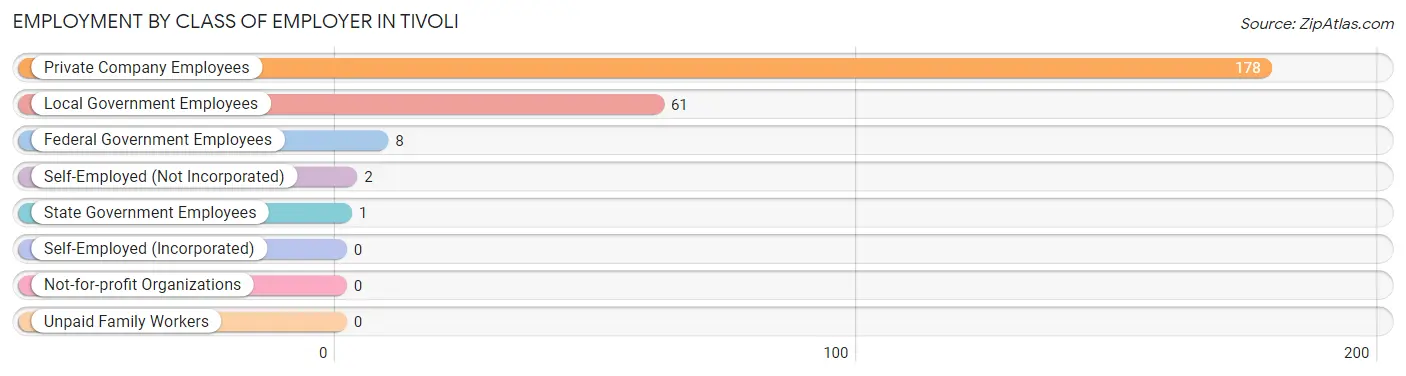
| Employer Class | # Employees | % Employees |
| Private Company Employees | 178 | 71.2% |
| Self-Employed (Incorporated) | 0 | 0.0% |
| Self-Employed (Not Incorporated) | 2 | 0.8% |
| Not-for-profit Organizations | 0 | 0.0% |
| Local Government Employees | 61 | 24.4% |
| State Government Employees | 1 | 0.4% |
| Federal Government Employees | 8 | 3.2% |
| Unpaid Family Workers | 0 | 0.0% |
| Total | 250 | 100.0% |
Employment Status by Age in Tivoli
According to the labor force statistics for Tivoli, out of the total population over 16 years of age (566), 58.0% or 328 individuals are in the labor force, with 23.8% or 78 of them unemployed. The age group with the highest labor force participation rate is 30 to 34 years, with 100.0% or 8 individuals in the labor force. Within the labor force, the 60 to 64 years age range has the highest percentage of unemployed individuals, with 100.0% or 9 of them being unemployed.
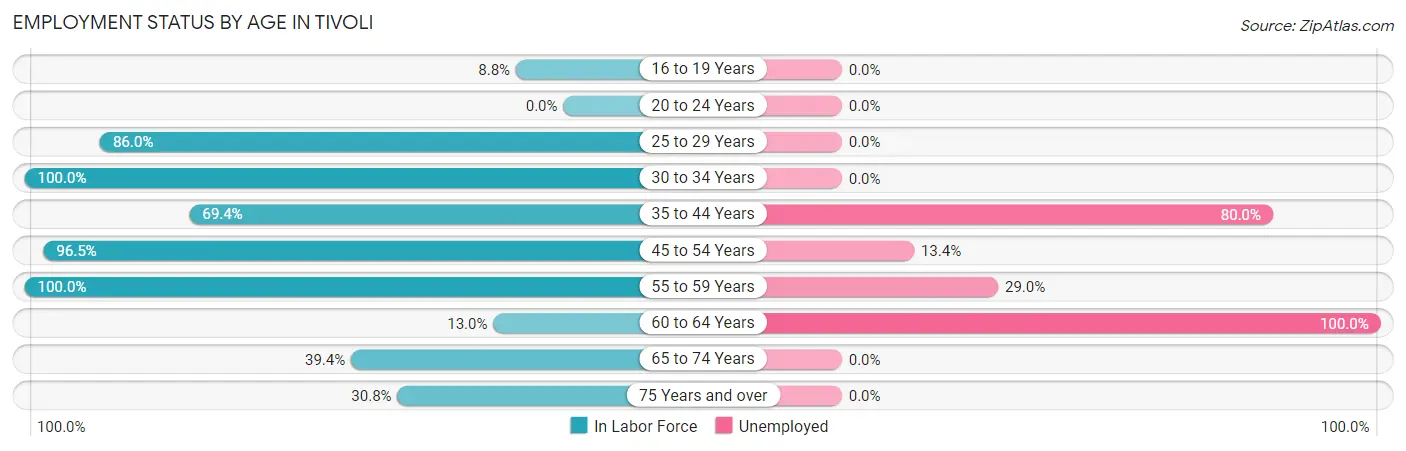
| Age Bracket | In Labor Force | Unemployed |
| 16 to 19 Years | 3 (8.8%) | 0 (0.0%) |
| 20 to 24 Years | 0 (0.0%) | 0 (0.0%) |
| 25 to 29 Years | 43 (86.0%) | 0 (0.0%) |
| 30 to 34 Years | 8 (100.0%) | 0 (0.0%) |
| 35 to 44 Years | 50 (69.4%) | 40 (80.0%) |
| 45 to 54 Years | 82 (96.5%) | 11 (13.4%) |
| 55 to 59 Years | 62 (100.0%) | 18 (29.0%) |
| 60 to 64 Years | 9 (13.0%) | 9 (100.0%) |
| 65 to 74 Years | 63 (39.4%) | 0 (0.0%) |
| 75 Years and over | 8 (30.8%) | 0 (0.0%) |
| Total | 328 (58.0%) | 78 (23.8%) |
Employment Status by Educational Attainment in Tivoli
According to labor force statistics for Tivoli, 73.4% of individuals (254) out of the total population between 25 and 64 years of age (346) are in the labor force, with 30.7% or 78 of them being unemployed. The group with the highest labor force participation rate are those with the educational attainment of college / associate degree, with 100.0% or 62 individuals in the labor force. Within the labor force, individuals with less than high school education have the highest percentage of unemployment, with 61.1% or 33 of them being unemployed.
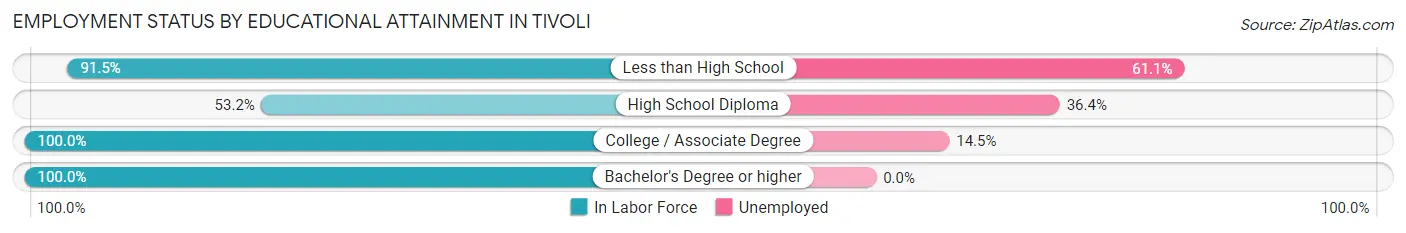
| Educational Attainment | In Labor Force | Unemployed |
| Less than High School | 54 (91.5%) | 36 (61.1%) |
| High School Diploma | 99 (53.2%) | 68 (36.4%) |
| College / Associate Degree | 62 (100.0%) | 9 (14.5%) |
| Bachelor's Degree or higher | 39 (100.0%) | 0 (0.0%) |
| Total | 254 (73.4%) | 106 (30.7%) |
Employment Occupations by Sex in Tivoli
Management, Business, Science and Arts Occupations
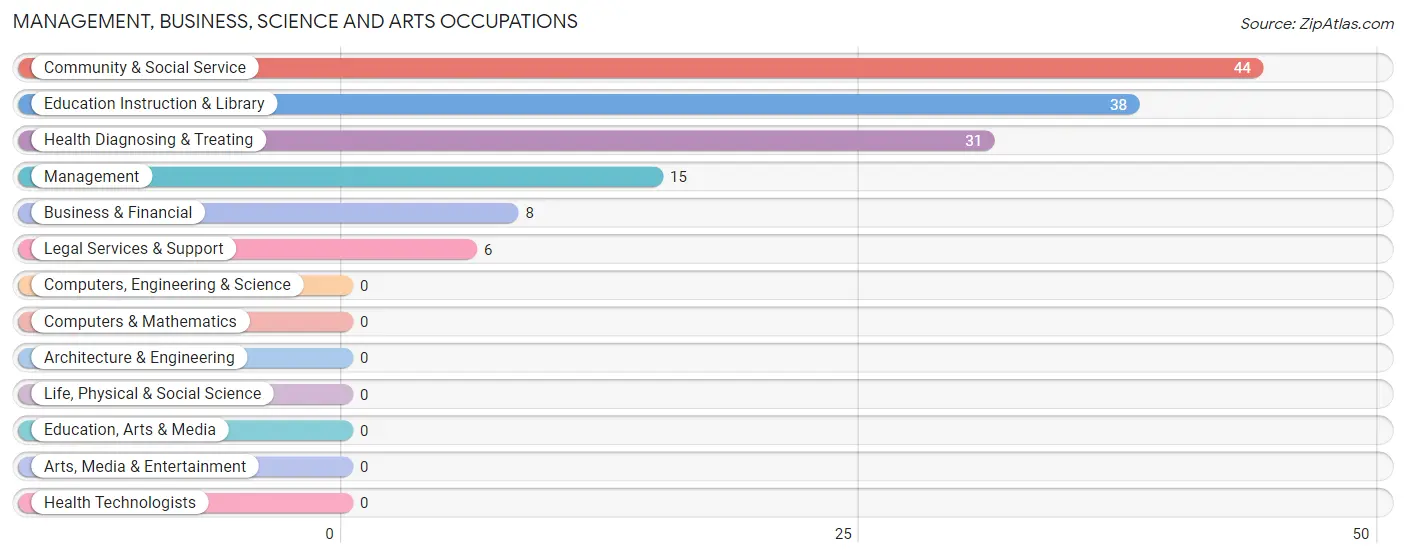
The most common Management, Business, Science and Arts occupations in Tivoli are Community & Social Service (44 | 17.6%), Education Instruction & Library (38 | 15.2%), Health Diagnosing & Treating (31 | 12.4%), Management (15 | 6.0%), and Business & Financial (8 | 3.2%).
Management, Business, Science and Arts Occupations by Sex
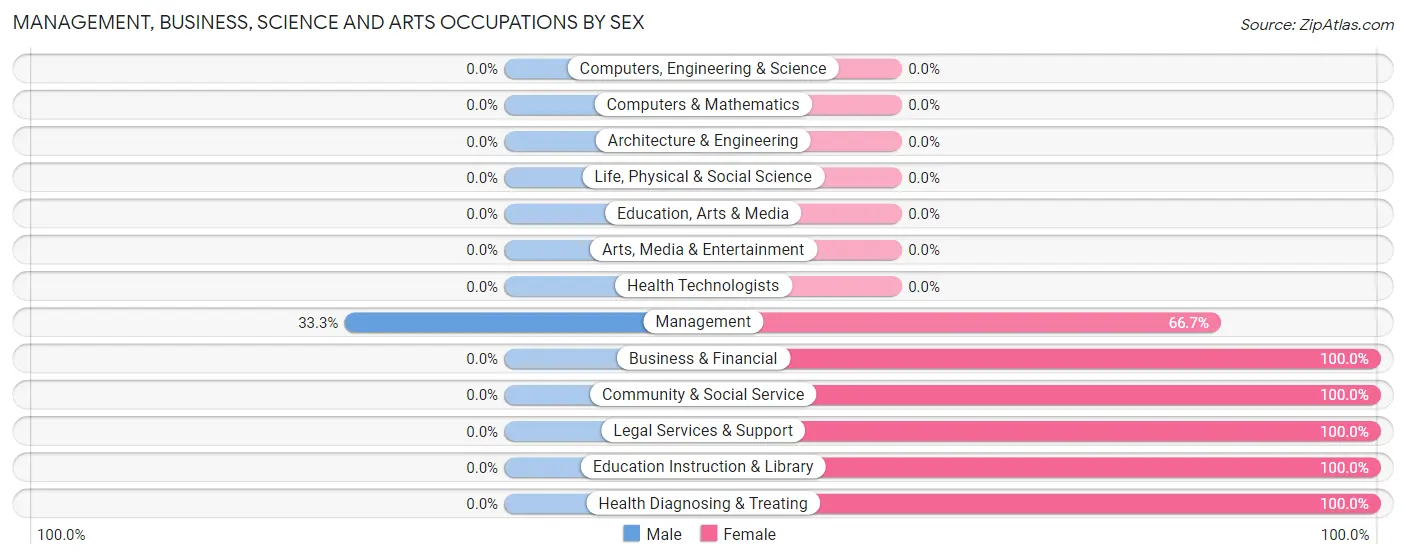
| Occupation | Male | Female |
| Management | 5 (33.3%) | 10 (66.7%) |
| Business & Financial | 0 (0.0%) | 8 (100.0%) |
| Computers, Engineering & Science | 0 (0.0%) | 0 (0.0%) |
| Computers & Mathematics | 0 (0.0%) | 0 (0.0%) |
| Architecture & Engineering | 0 (0.0%) | 0 (0.0%) |
| Life, Physical & Social Science | 0 (0.0%) | 0 (0.0%) |
| Community & Social Service | 0 (0.0%) | 44 (100.0%) |
| Education, Arts & Media | 0 (0.0%) | 0 (0.0%) |
| Legal Services & Support | 0 (0.0%) | 6 (100.0%) |
| Education Instruction & Library | 0 (0.0%) | 38 (100.0%) |
| Arts, Media & Entertainment | 0 (0.0%) | 0 (0.0%) |
| Health Diagnosing & Treating | 0 (0.0%) | 31 (100.0%) |
| Health Technologists | 0 (0.0%) | 0 (0.0%) |
| Total (Category) | 5 (5.1%) | 93 (94.9%) |
| Total (Overall) | 126 (50.4%) | 124 (49.6%) |
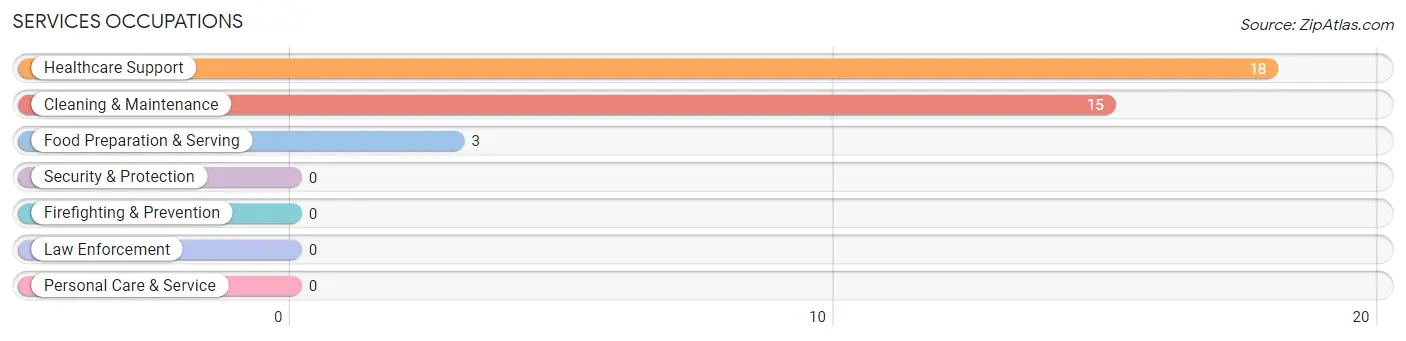
Services Occupations
The most common Services occupations in Tivoli are Healthcare Support (18 | 7.2%), Cleaning & Maintenance (15 | 6.0%), and Food Preparation & Serving (3 | 1.2%).
Services Occupations by Sex
Within the Services occupations in Tivoli, the most male-oriented occupations are Food Preparation & Serving (100.0%), and Cleaning & Maintenance (60.0%), while the most female-oriented occupations are Healthcare Support (100.0%), and Cleaning & Maintenance (40.0%).
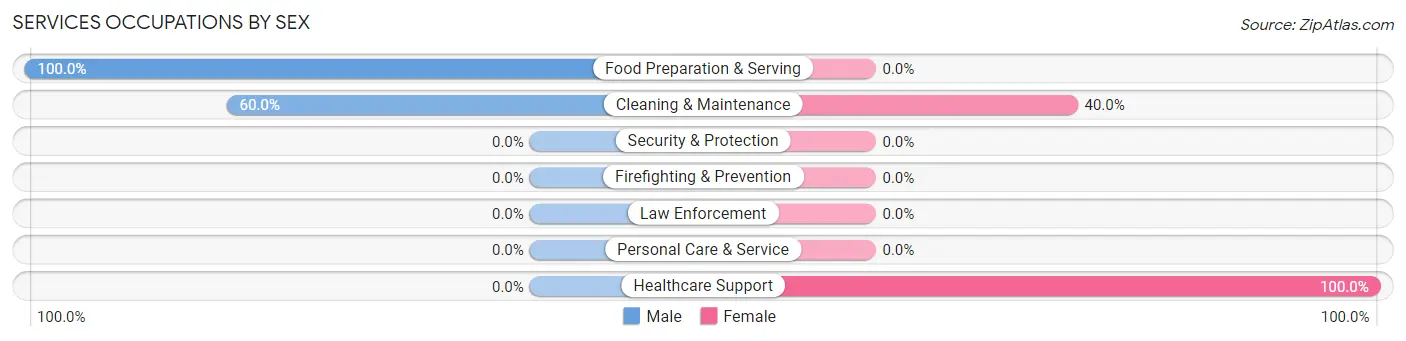
| Occupation | Male | Female |
| Healthcare Support | 0 (0.0%) | 18 (100.0%) |
| Security & Protection | 0 (0.0%) | 0 (0.0%) |
| Firefighting & Prevention | 0 (0.0%) | 0 (0.0%) |
| Law Enforcement | 0 (0.0%) | 0 (0.0%) |
| Food Preparation & Serving | 3 (100.0%) | 0 (0.0%) |
| Cleaning & Maintenance | 9 (60.0%) | 6 (40.0%) |
| Personal Care & Service | 0 (0.0%) | 0 (0.0%) |
| Total (Category) | 12 (33.3%) | 24 (66.7%) |
| Total (Overall) | 126 (50.4%) | 124 (49.6%) |
Sales and Office Occupations
The most common Sales and Office occupations in Tivoli are , and Office & Administration (7 | 2.8%).
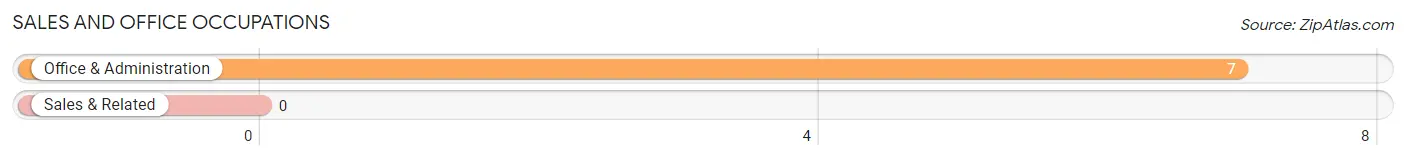
Sales and Office Occupations by Sex
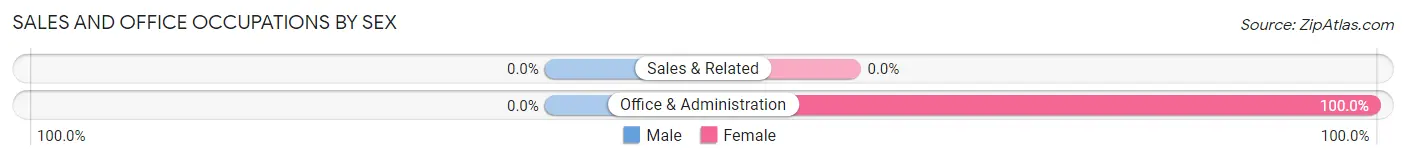
| Occupation | Male | Female |
| Sales & Related | 0 (0.0%) | 0 (0.0%) |
| Office & Administration | 0 (0.0%) | 7 (100.0%) |
| Total (Category) | 0 (0.0%) | 7 (100.0%) |
| Total (Overall) | 126 (50.4%) | 124 (49.6%) |
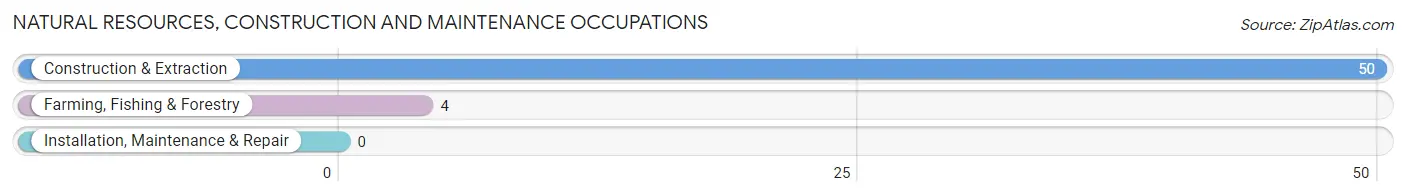
Natural Resources, Construction and Maintenance Occupations
The most common Natural Resources, Construction and Maintenance occupations in Tivoli are Construction & Extraction (50 | 20.0%), and Farming, Fishing & Forestry (4 | 1.6%).
Natural Resources, Construction and Maintenance Occupations by Sex
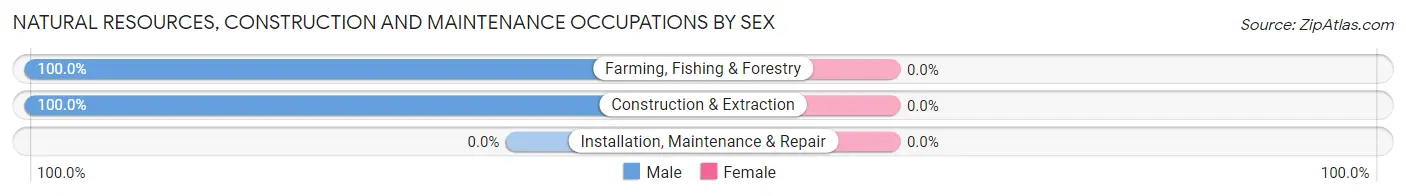
| Occupation | Male | Female |
| Farming, Fishing & Forestry | 4 (100.0%) | 0 (0.0%) |
| Construction & Extraction | 50 (100.0%) | 0 (0.0%) |
| Installation, Maintenance & Repair | 0 (0.0%) | 0 (0.0%) |
| Total (Category) | 54 (100.0%) | 0 (0.0%) |
| Total (Overall) | 126 (50.4%) | 124 (49.6%) |
Production, Transportation and Moving Occupations
The most common Production, Transportation and Moving occupations in Tivoli are Production (47 | 18.8%), and Material Moving (8 | 3.2%).
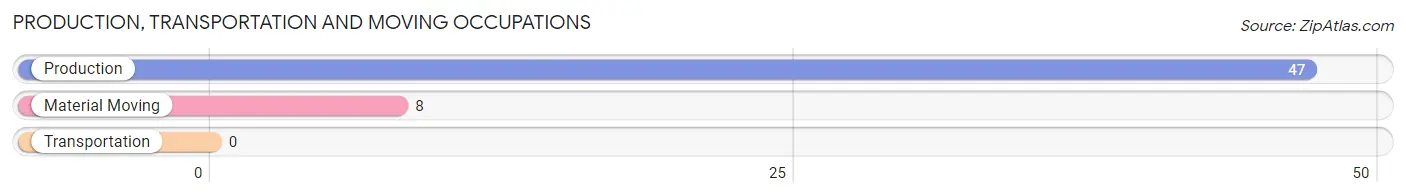
Production, Transportation and Moving Occupations by Sex
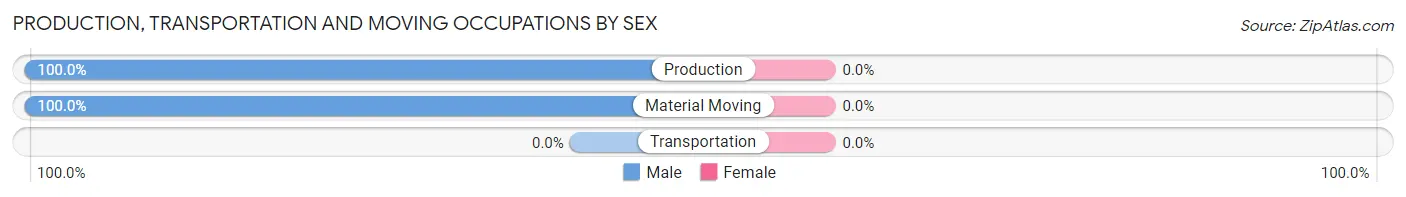
| Occupation | Male | Female |
| Production | 47 (100.0%) | 0 (0.0%) |
| Transportation | 0 (0.0%) | 0 (0.0%) |
| Material Moving | 8 (100.0%) | 0 (0.0%) |
| Total (Category) | 55 (100.0%) | 0 (0.0%) |
| Total (Overall) | 126 (50.4%) | 124 (49.6%) |
Employment Industries by Sex in Tivoli
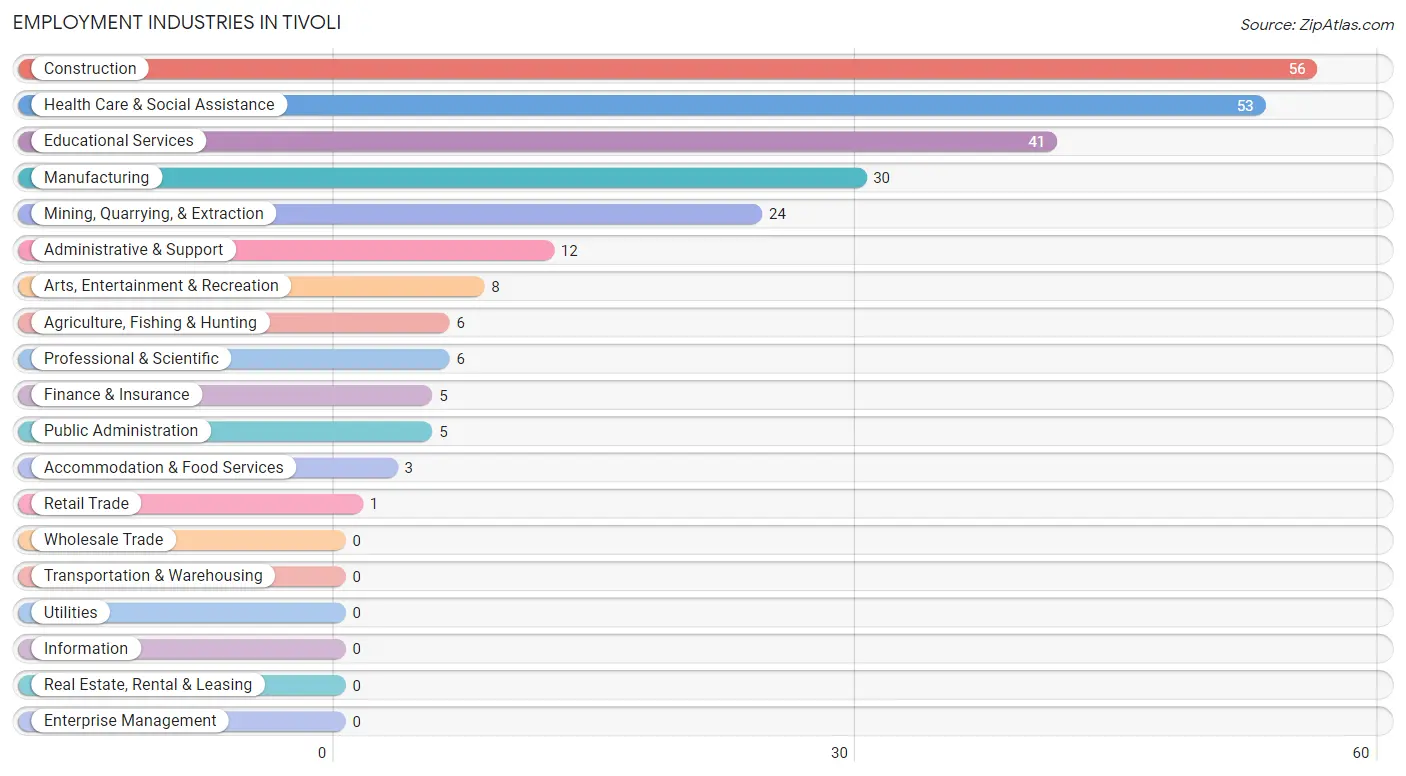
Employment Industries in Tivoli
The major employment industries in Tivoli include Construction (56 | 22.4%), Health Care & Social Assistance (53 | 21.2%), Educational Services (41 | 16.4%), Manufacturing (30 | 12.0%), and Mining, Quarrying, & Extraction (24 | 9.6%).
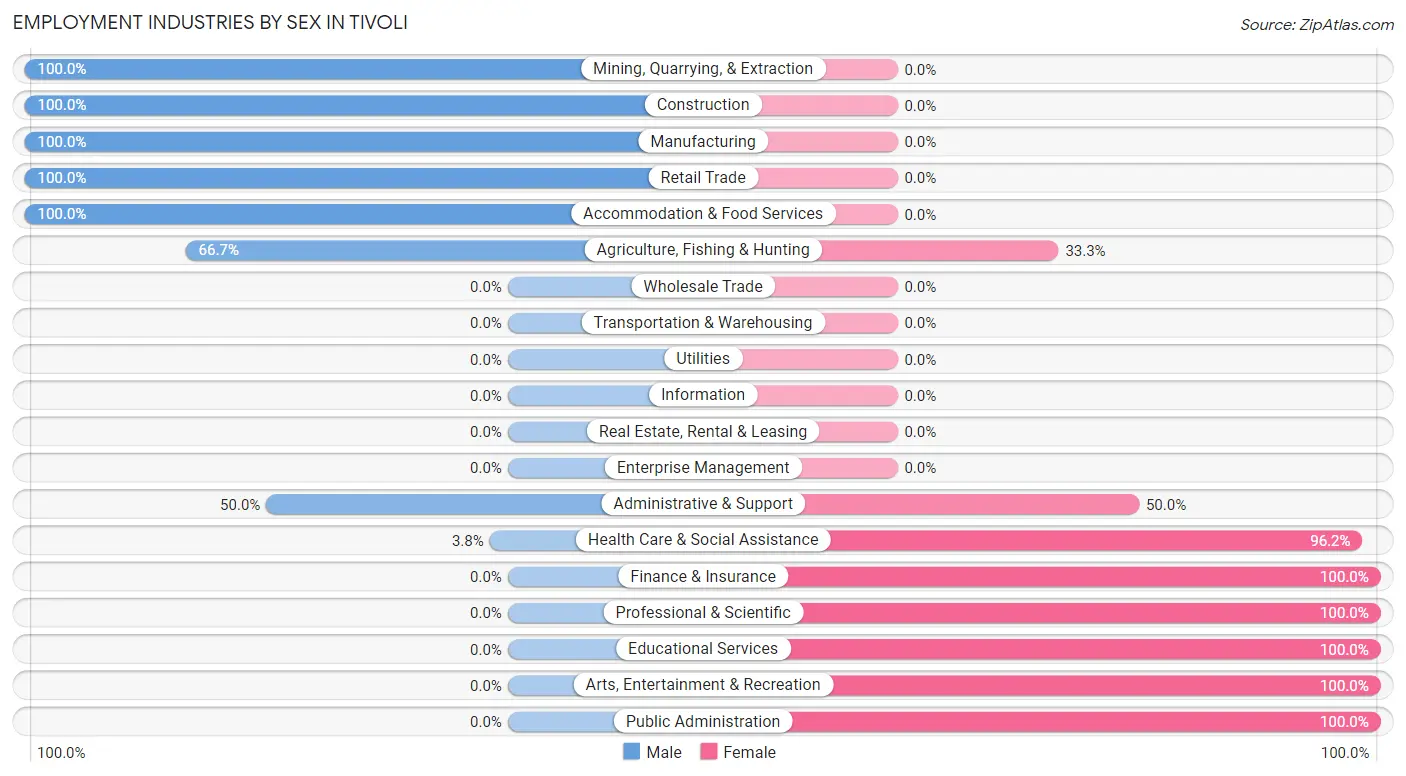
Employment Industries by Sex in Tivoli
The Tivoli industries that see more men than women are Mining, Quarrying, & Extraction (100.0%), Construction (100.0%), and Manufacturing (100.0%), whereas the industries that tend to have a higher number of women are Finance & Insurance (100.0%), Professional & Scientific (100.0%), and Educational Services (100.0%).
| Industry | Male | Female |
| Agriculture, Fishing & Hunting | 4 (66.7%) | 2 (33.3%) |
| Mining, Quarrying, & Extraction | 24 (100.0%) | 0 (0.0%) |
| Construction | 56 (100.0%) | 0 (0.0%) |
| Manufacturing | 30 (100.0%) | 0 (0.0%) |
| Wholesale Trade | 0 (0.0%) | 0 (0.0%) |
| Retail Trade | 1 (100.0%) | 0 (0.0%) |
| Transportation & Warehousing | 0 (0.0%) | 0 (0.0%) |
| Utilities | 0 (0.0%) | 0 (0.0%) |
| Information | 0 (0.0%) | 0 (0.0%) |
| Finance & Insurance | 0 (0.0%) | 5 (100.0%) |
| Real Estate, Rental & Leasing | 0 (0.0%) | 0 (0.0%) |
| Professional & Scientific | 0 (0.0%) | 6 (100.0%) |
| Enterprise Management | 0 (0.0%) | 0 (0.0%) |
| Administrative & Support | 6 (50.0%) | 6 (50.0%) |
| Educational Services | 0 (0.0%) | 41 (100.0%) |
| Health Care & Social Assistance | 2 (3.8%) | 51 (96.2%) |
| Arts, Entertainment & Recreation | 0 (0.0%) | 8 (100.0%) |
| Accommodation & Food Services | 3 (100.0%) | 0 (0.0%) |
| Public Administration | 0 (0.0%) | 5 (100.0%) |
| Total | 126 (50.4%) | 124 (49.6%) |
Education in Tivoli
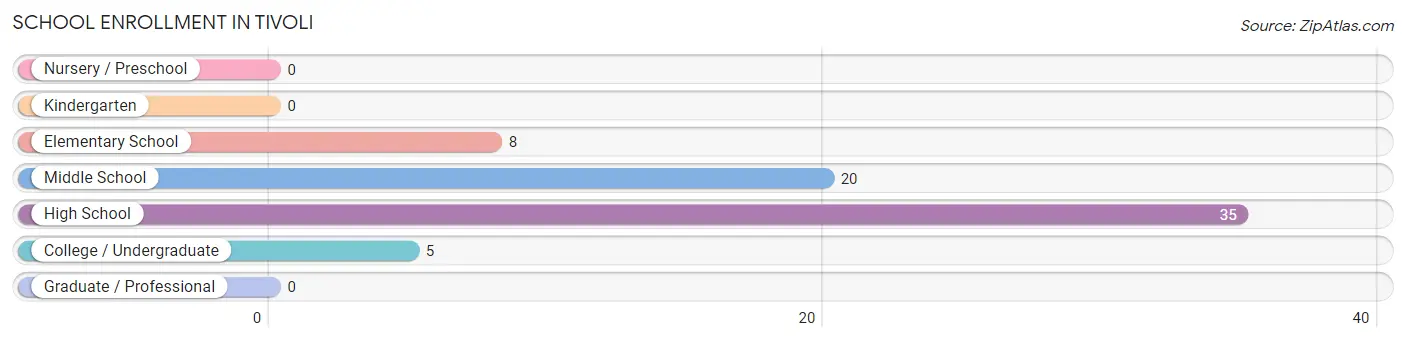
School Enrollment in Tivoli
The most common levels of schooling among the 68 students in Tivoli are high school (35 | 51.5%), middle school (20 | 29.4%), and elementary school (8 | 11.8%).
| School Level | # Students | % Students |
| Nursery / Preschool | 0 | 0.0% |
| Kindergarten | 0 | 0.0% |
| Elementary School | 8 | 11.8% |
| Middle School | 20 | 29.4% |
| High School | 35 | 51.5% |
| College / Undergraduate | 5 | 7.3% |
| Graduate / Professional | 0 | 0.0% |
| Total | 68 | 100.0% |
School Enrollment by Age by Funding Source in Tivoli
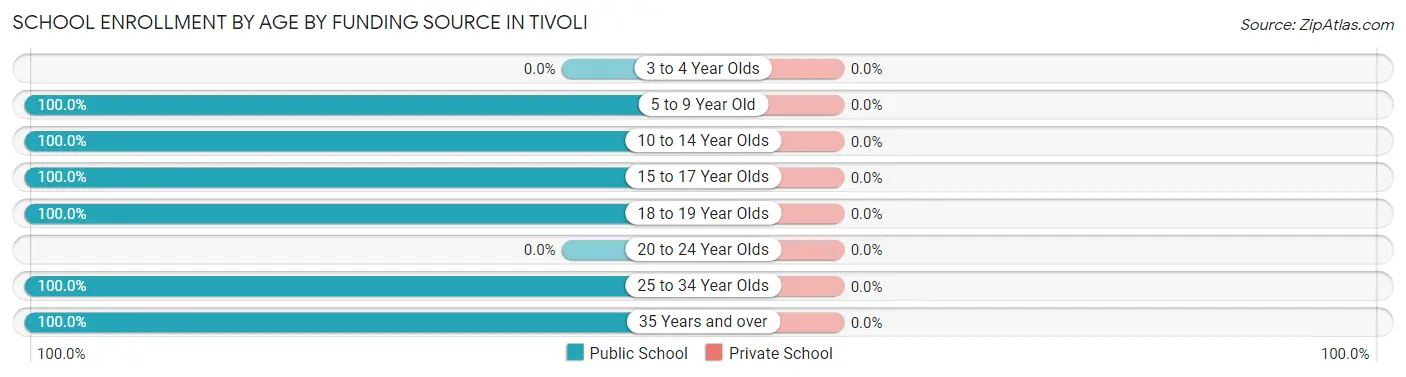
| Age Bracket | Public School | Private School |
| 3 to 4 Year Olds | 0 (0.0%) | 0 (0.0%) |
| 5 to 9 Year Old | 5 (100.0%) | 0 (0.0%) |
| 10 to 14 Year Olds | 23 (100.0%) | 0 (0.0%) |
| 15 to 17 Year Olds | 21 (100.0%) | 0 (0.0%) |
| 18 to 19 Year Olds | 14 (100.0%) | 0 (0.0%) |
| 20 to 24 Year Olds | 0 (0.0%) | 0 (0.0%) |
| 25 to 34 Year Olds | 4 (100.0%) | 0 (0.0%) |
| 35 Years and over | 1 (100.0%) | 0 (0.0%) |
| Total | 68 (100.0%) | 0 (0.0%) |
Educational Attainment by Field of Study in Tivoli
Bio, nature & agricultural (23 | 30.3%), social sciences (20 | 26.3%), business (20 | 26.3%), computers & mathematics (8 | 10.5%), and education (5 | 6.6%) are the most common fields of study among 76 individuals in Tivoli who have obtained a bachelor's degree or higher.
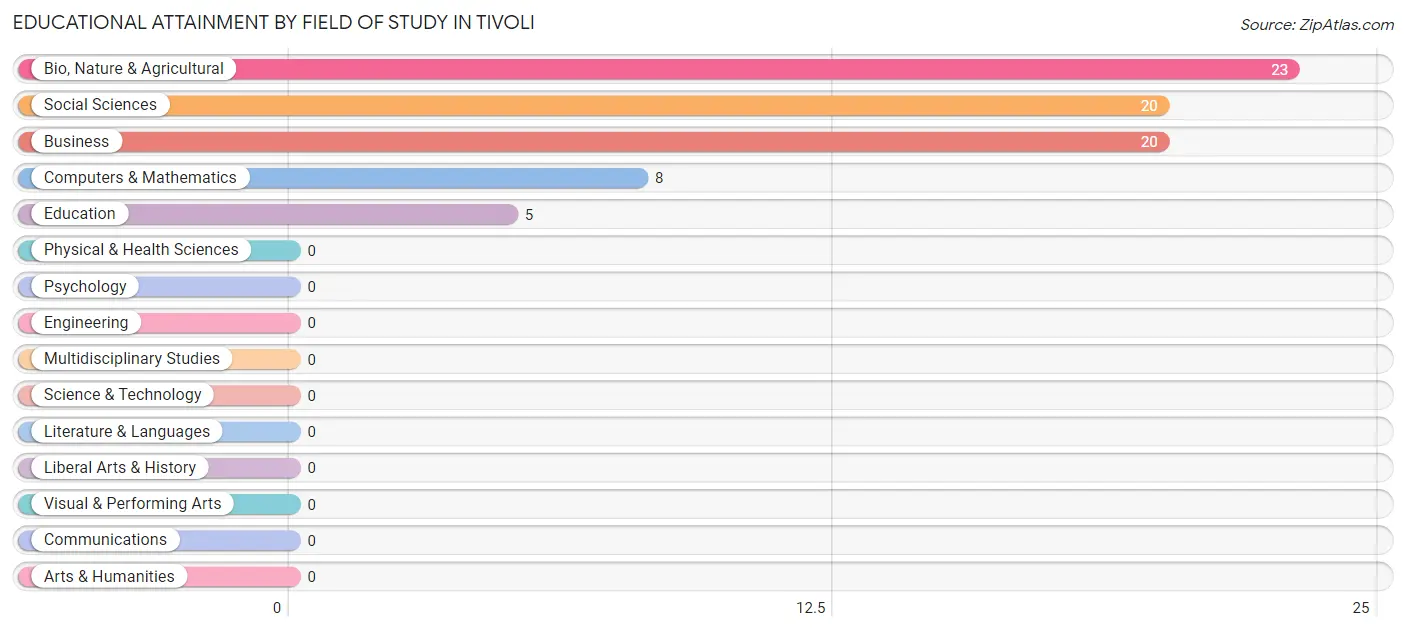
| Field of Study | # Graduates | % Graduates |
| Computers & Mathematics | 8 | 10.5% |
| Bio, Nature & Agricultural | 23 | 30.3% |
| Physical & Health Sciences | 0 | 0.0% |
| Psychology | 0 | 0.0% |
| Social Sciences | 20 | 26.3% |
| Engineering | 0 | 0.0% |
| Multidisciplinary Studies | 0 | 0.0% |
| Science & Technology | 0 | 0.0% |
| Business | 20 | 26.3% |
| Education | 5 | 6.6% |
| Literature & Languages | 0 | 0.0% |
| Liberal Arts & History | 0 | 0.0% |
| Visual & Performing Arts | 0 | 0.0% |
| Communications | 0 | 0.0% |
| Arts & Humanities | 0 | 0.0% |
| Total | 76 | 100.0% |
Transportation & Commute in Tivoli
Vehicle Availability by Sex in Tivoli
The most prevalent vehicle ownership categories in Tivoli are males with 2 vehicles (78, accounting for 61.9%) and females with 2 vehicles (85, making up 62.9%).
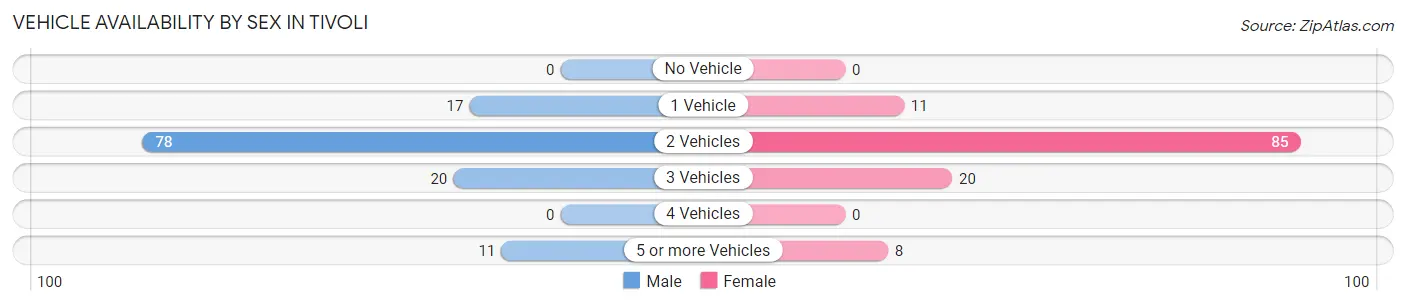
| Vehicles Available | Male | Female |
| No Vehicle | 0 (0.0%) | 0 (0.0%) |
| 1 Vehicle | 17 (13.5%) | 11 (8.9%) |
| 2 Vehicles | 78 (61.9%) | 85 (68.5%) |
| 3 Vehicles | 20 (15.9%) | 20 (16.1%) |
| 4 Vehicles | 0 (0.0%) | 0 (0.0%) |
| 5 or more Vehicles | 11 (8.7%) | 8 (6.5%) |
| Total | 126 (100.0%) | 124 (100.0%) |
Commute Time in Tivoli
The most frequently occuring commute durations in Tivoli are 45 to 59 minutes (77 commuters, 31.0%), 20 to 24 minutes (36 commuters, 14.5%), and 25 to 29 minutes (31 commuters, 12.5%).
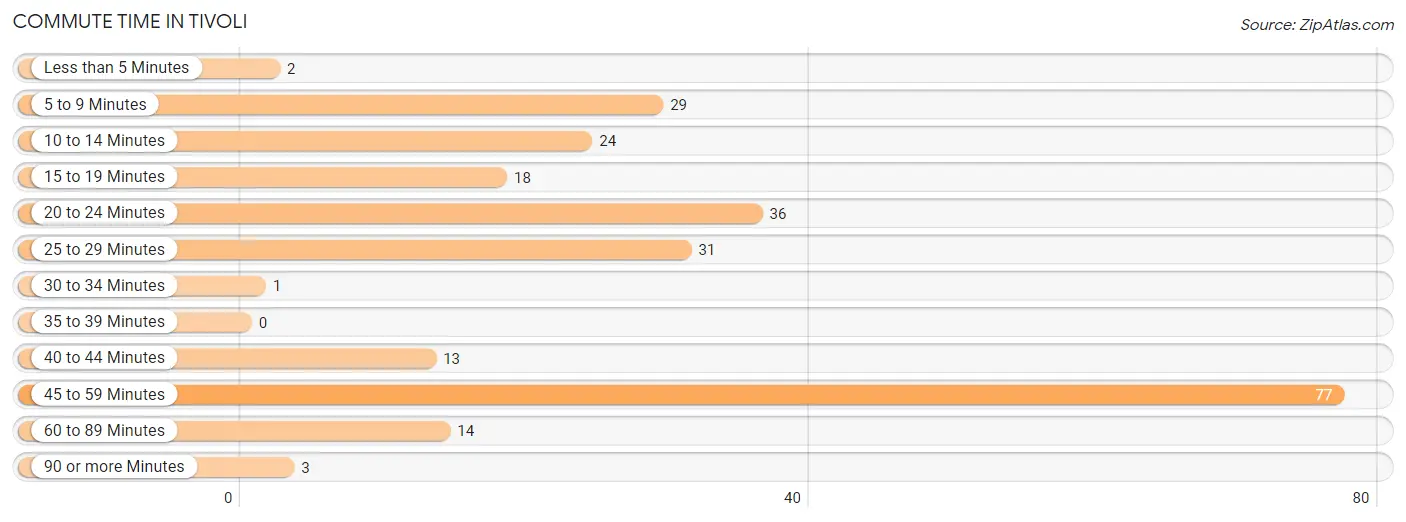
| Commute Time | # Commuters | % Commuters |
| Less than 5 Minutes | 2 | 0.8% |
| 5 to 9 Minutes | 29 | 11.7% |
| 10 to 14 Minutes | 24 | 9.7% |
| 15 to 19 Minutes | 18 | 7.3% |
| 20 to 24 Minutes | 36 | 14.5% |
| 25 to 29 Minutes | 31 | 12.5% |
| 30 to 34 Minutes | 1 | 0.4% |
| 35 to 39 Minutes | 0 | 0.0% |
| 40 to 44 Minutes | 13 | 5.2% |
| 45 to 59 Minutes | 77 | 31.0% |
| 60 to 89 Minutes | 14 | 5.7% |
| 90 or more Minutes | 3 | 1.2% |
Commute Time by Sex in Tivoli
The most common commute times in Tivoli are 20 to 24 minutes (36 commuters, 28.6%) for males and 45 to 59 minutes (53 commuters, 43.4%) for females.
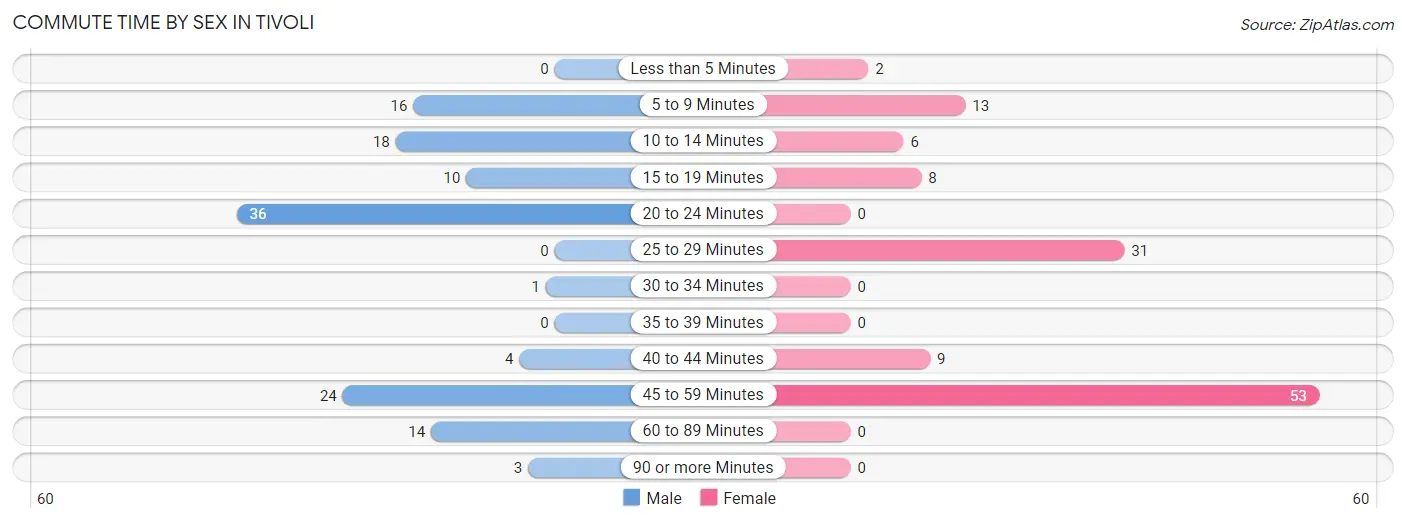
| Commute Time | Male | Female |
| Less than 5 Minutes | 0 (0.0%) | 2 (1.6%) |
| 5 to 9 Minutes | 16 (12.7%) | 13 (10.7%) |
| 10 to 14 Minutes | 18 (14.3%) | 6 (4.9%) |
| 15 to 19 Minutes | 10 (7.9%) | 8 (6.6%) |
| 20 to 24 Minutes | 36 (28.6%) | 0 (0.0%) |
| 25 to 29 Minutes | 0 (0.0%) | 31 (25.4%) |
| 30 to 34 Minutes | 1 (0.8%) | 0 (0.0%) |
| 35 to 39 Minutes | 0 (0.0%) | 0 (0.0%) |
| 40 to 44 Minutes | 4 (3.2%) | 9 (7.4%) |
| 45 to 59 Minutes | 24 (19.1%) | 53 (43.4%) |
| 60 to 89 Minutes | 14 (11.1%) | 0 (0.0%) |
| 90 or more Minutes | 3 (2.4%) | 0 (0.0%) |
Time of Departure to Work by Sex in Tivoli
The most frequent times of departure to work in Tivoli are 12:00 AM to 4:59 AM (55, 43.6%) for males and 9:00 AM to 9:59 AM (31, 25.4%) for females.
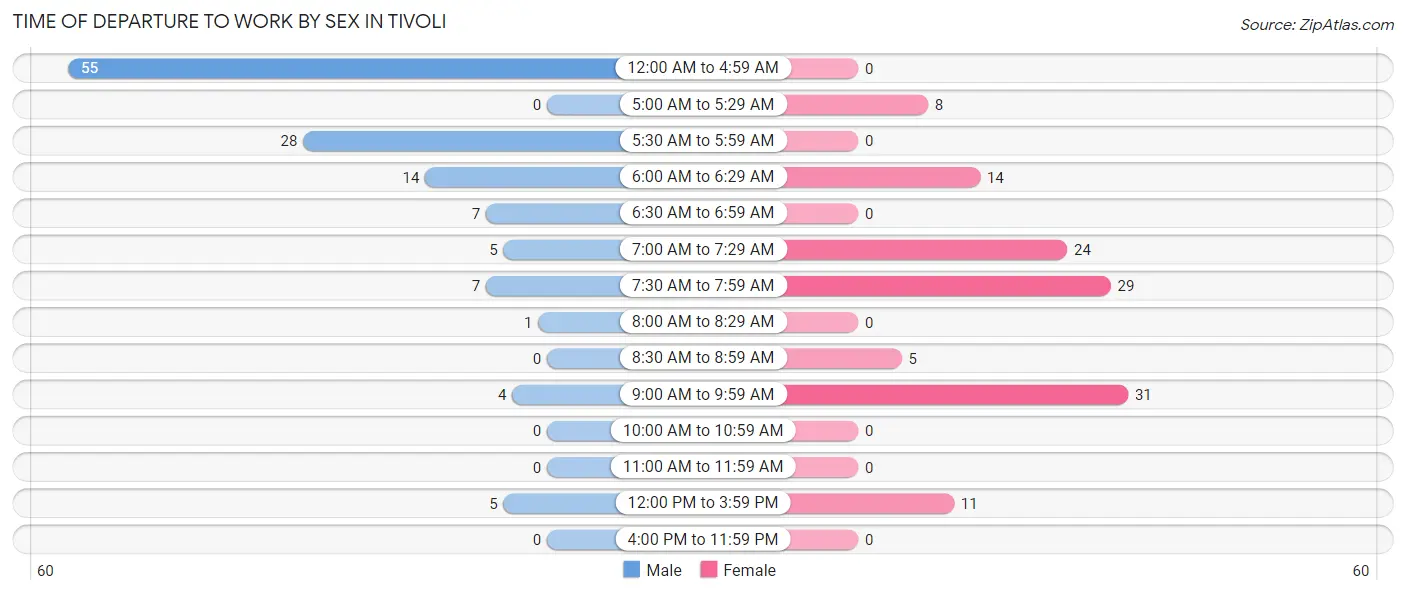
| Time of Departure | Male | Female |
| 12:00 AM to 4:59 AM | 55 (43.6%) | 0 (0.0%) |
| 5:00 AM to 5:29 AM | 0 (0.0%) | 8 (6.6%) |
| 5:30 AM to 5:59 AM | 28 (22.2%) | 0 (0.0%) |
| 6:00 AM to 6:29 AM | 14 (11.1%) | 14 (11.5%) |
| 6:30 AM to 6:59 AM | 7 (5.6%) | 0 (0.0%) |
| 7:00 AM to 7:29 AM | 5 (4.0%) | 24 (19.7%) |
| 7:30 AM to 7:59 AM | 7 (5.6%) | 29 (23.8%) |
| 8:00 AM to 8:29 AM | 1 (0.8%) | 0 (0.0%) |
| 8:30 AM to 8:59 AM | 0 (0.0%) | 5 (4.1%) |
| 9:00 AM to 9:59 AM | 4 (3.2%) | 31 (25.4%) |
| 10:00 AM to 10:59 AM | 0 (0.0%) | 0 (0.0%) |
| 11:00 AM to 11:59 AM | 0 (0.0%) | 0 (0.0%) |
| 12:00 PM to 3:59 PM | 5 (4.0%) | 11 (9.0%) |
| 4:00 PM to 11:59 PM | 0 (0.0%) | 0 (0.0%) |
| Total | 126 (100.0%) | 122 (100.0%) |
Housing Occupancy in Tivoli
Occupancy by Ownership in Tivoli
Of the total 248 dwellings in Tivoli, owner-occupied units account for 216 (87.1%), while renter-occupied units make up 32 (12.9%).
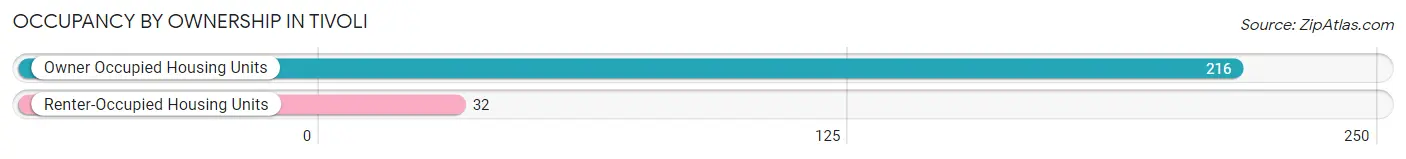
| Occupancy | # Housing Units | % Housing Units |
| Owner Occupied Housing Units | 216 | 87.1% |
| Renter-Occupied Housing Units | 32 | 12.9% |
| Total Occupied Housing Units | 248 | 100.0% |
Occupancy by Household Size in Tivoli
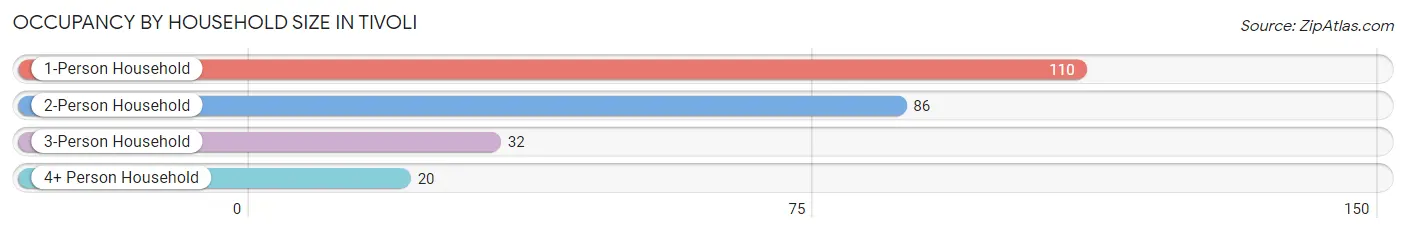
| Household Size | # Housing Units | % Housing Units |
| 1-Person Household | 110 | 44.4% |
| 2-Person Household | 86 | 34.7% |
| 3-Person Household | 32 | 12.9% |
| 4+ Person Household | 20 | 8.1% |
| Total Housing Units | 248 | 100.0% |
Occupancy by Ownership by Household Size in Tivoli
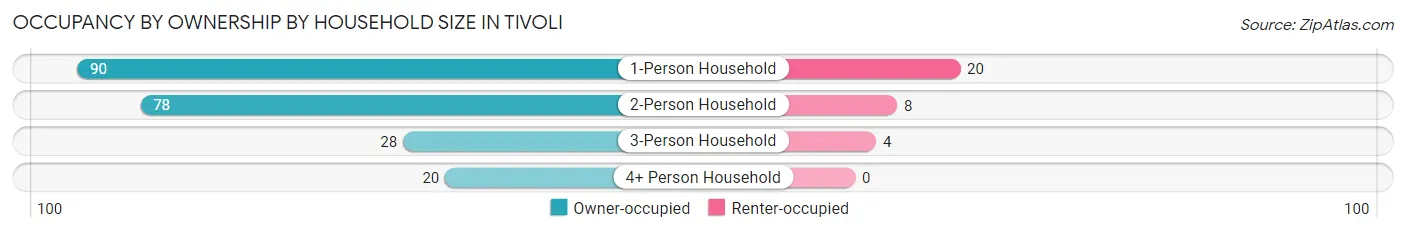
| Household Size | Owner-occupied | Renter-occupied |
| 1-Person Household | 90 (81.8%) | 20 (18.2%) |
| 2-Person Household | 78 (90.7%) | 8 (9.3%) |
| 3-Person Household | 28 (87.5%) | 4 (12.5%) |
| 4+ Person Household | 20 (100.0%) | 0 (0.0%) |
| Total Housing Units | 216 (87.1%) | 32 (12.9%) |
Occupancy by Educational Attainment in Tivoli
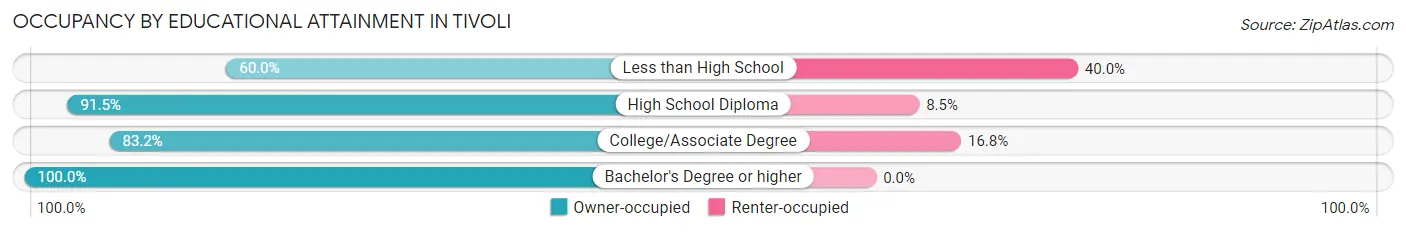
| Household Size | Owner-occupied | Renter-occupied |
| Less than High School | 12 (60.0%) | 8 (40.0%) |
| High School Diploma | 75 (91.5%) | 7 (8.5%) |
| College/Associate Degree | 84 (83.2%) | 17 (16.8%) |
| Bachelor's Degree or higher | 45 (100.0%) | 0 (0.0%) |
Occupancy by Age of Householder in Tivoli
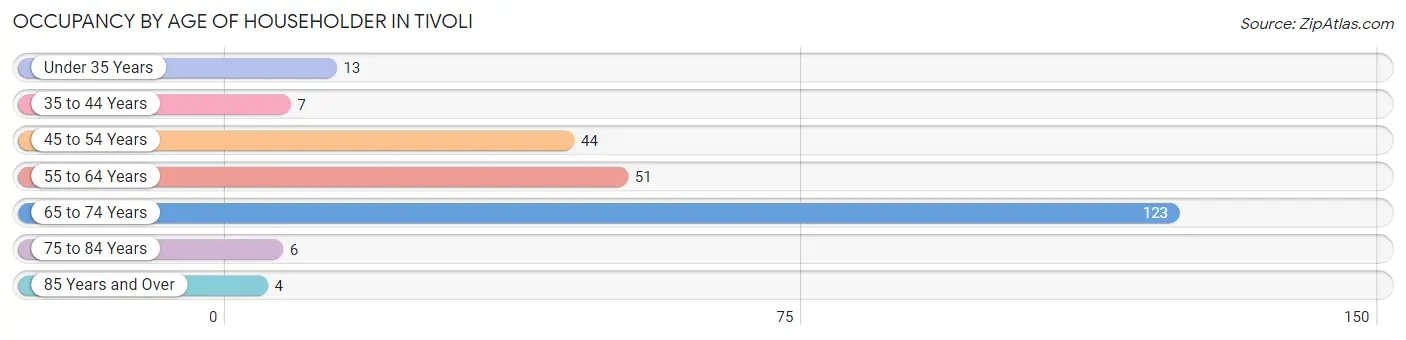
| Age Bracket | # Households | % Households |
| Under 35 Years | 13 | 5.2% |
| 35 to 44 Years | 7 | 2.8% |
| 45 to 54 Years | 44 | 17.7% |
| 55 to 64 Years | 51 | 20.6% |
| 65 to 74 Years | 123 | 49.6% |
| 75 to 84 Years | 6 | 2.4% |
| 85 Years and Over | 4 | 1.6% |
| Total | 248 | 100.0% |
Housing Finances in Tivoli
Median Income by Occupancy in Tivoli
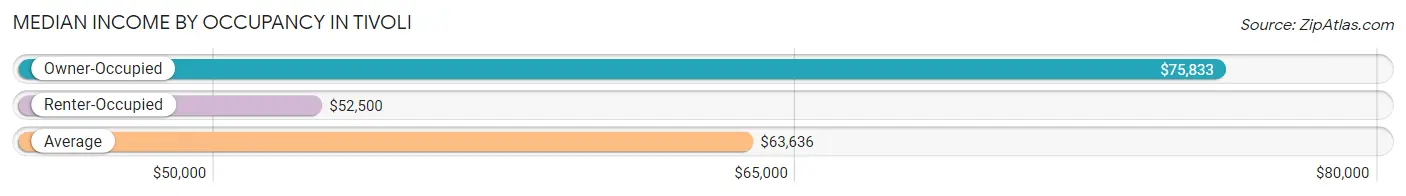
| Occupancy Type | # Households | Median Income |
| Owner-Occupied | 216 (87.1%) | $75,833 |
| Renter-Occupied | 32 (12.9%) | $52,500 |
| Average | 248 (100.0%) | $63,636 |
Occupancy by Householder Income Bracket in Tivoli
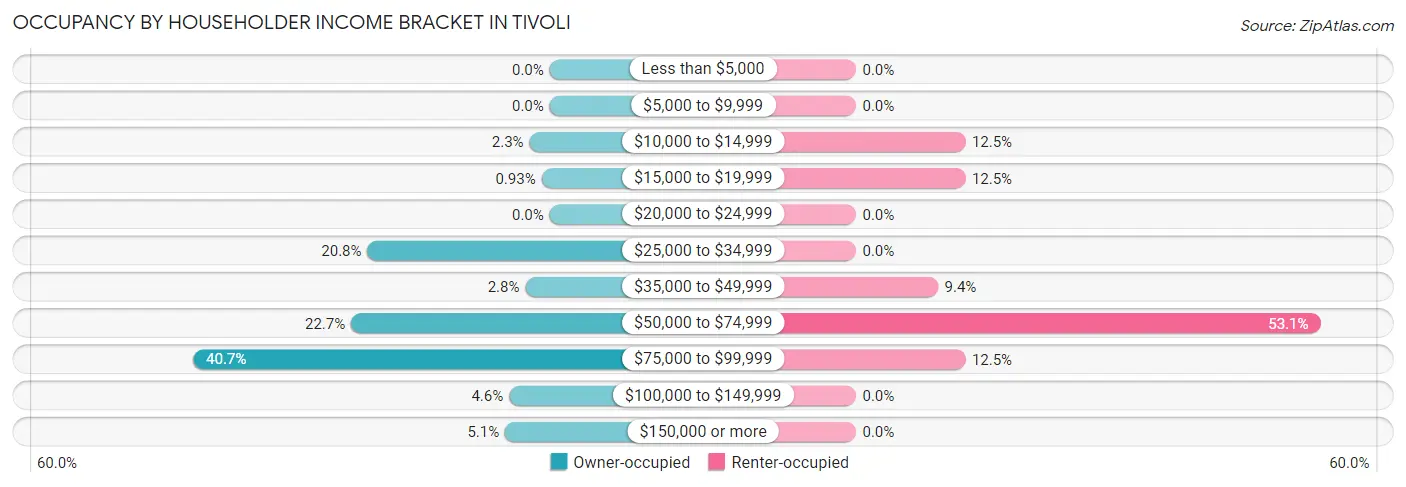
| Income Bracket | Owner-occupied | Renter-occupied |
| Less than $5,000 | 0 (0.0%) | 0 (0.0%) |
| $5,000 to $9,999 | 0 (0.0%) | 0 (0.0%) |
| $10,000 to $14,999 | 5 (2.3%) | 4 (12.5%) |
| $15,000 to $19,999 | 2 (0.9%) | 4 (12.5%) |
| $20,000 to $24,999 | 0 (0.0%) | 0 (0.0%) |
| $25,000 to $34,999 | 45 (20.8%) | 0 (0.0%) |
| $35,000 to $49,999 | 6 (2.8%) | 3 (9.4%) |
| $50,000 to $74,999 | 49 (22.7%) | 17 (53.1%) |
| $75,000 to $99,999 | 88 (40.7%) | 4 (12.5%) |
| $100,000 to $149,999 | 10 (4.6%) | 0 (0.0%) |
| $150,000 or more | 11 (5.1%) | 0 (0.0%) |
| Total | 216 (100.0%) | 32 (100.0%) |
Monthly Housing Cost Tiers in Tivoli
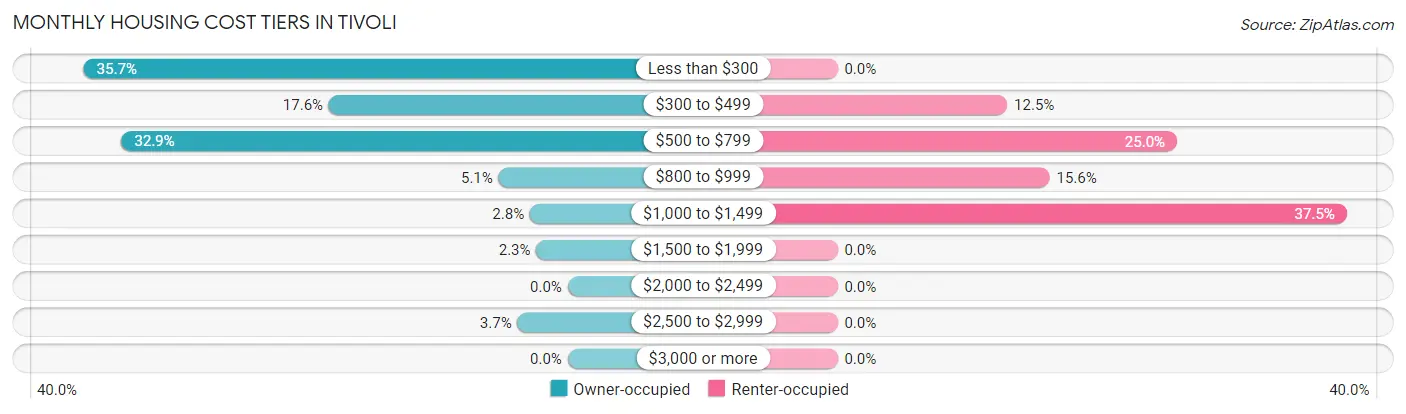
| Monthly Cost | Owner-occupied | Renter-occupied |
| Less than $300 | 77 (35.6%) | 0 (0.0%) |
| $300 to $499 | 38 (17.6%) | 4 (12.5%) |
| $500 to $799 | 71 (32.9%) | 8 (25.0%) |
| $800 to $999 | 11 (5.1%) | 5 (15.6%) |
| $1,000 to $1,499 | 6 (2.8%) | 12 (37.5%) |
| $1,500 to $1,999 | 5 (2.3%) | 0 (0.0%) |
| $2,000 to $2,499 | 0 (0.0%) | 0 (0.0%) |
| $2,500 to $2,999 | 8 (3.7%) | 0 (0.0%) |
| $3,000 or more | 0 (0.0%) | 0 (0.0%) |
| Total | 216 (100.0%) | 32 (100.0%) |
Physical Housing Characteristics in Tivoli
Housing Structures in Tivoli
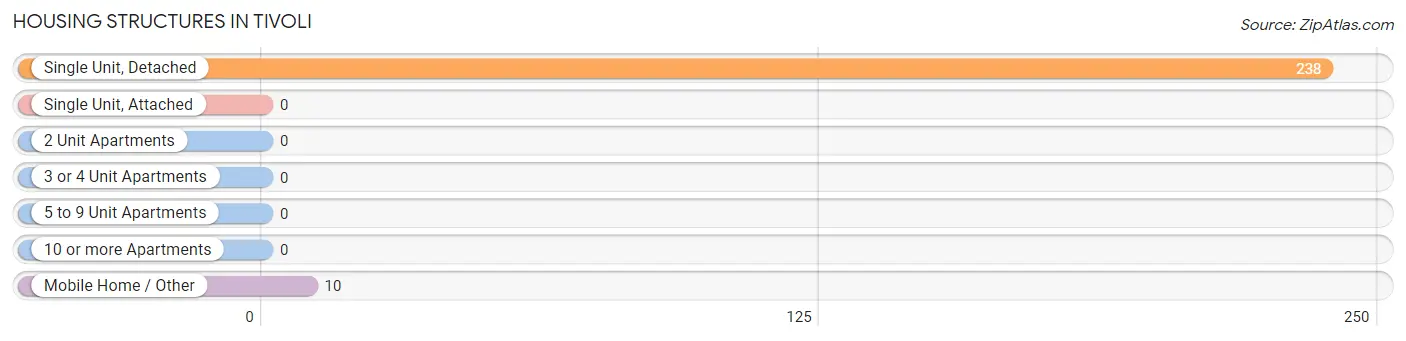
| Structure Type | # Housing Units | % Housing Units |
| Single Unit, Detached | 238 | 96.0% |
| Single Unit, Attached | 0 | 0.0% |
| 2 Unit Apartments | 0 | 0.0% |
| 3 or 4 Unit Apartments | 0 | 0.0% |
| 5 to 9 Unit Apartments | 0 | 0.0% |
| 10 or more Apartments | 0 | 0.0% |
| Mobile Home / Other | 10 | 4.0% |
| Total | 248 | 100.0% |
Housing Structures by Occupancy in Tivoli
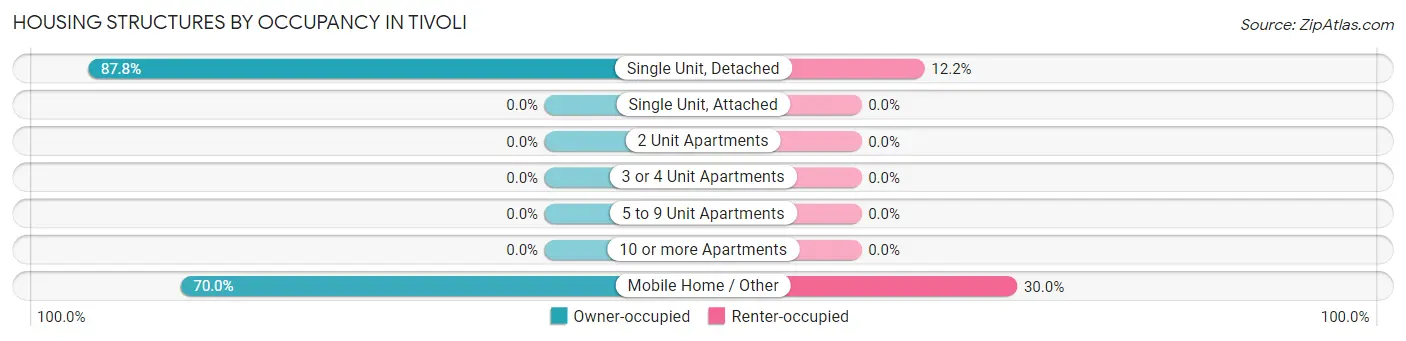
| Structure Type | Owner-occupied | Renter-occupied |
| Single Unit, Detached | 209 (87.8%) | 29 (12.2%) |
| Single Unit, Attached | 0 (0.0%) | 0 (0.0%) |
| 2 Unit Apartments | 0 (0.0%) | 0 (0.0%) |
| 3 or 4 Unit Apartments | 0 (0.0%) | 0 (0.0%) |
| 5 to 9 Unit Apartments | 0 (0.0%) | 0 (0.0%) |
| 10 or more Apartments | 0 (0.0%) | 0 (0.0%) |
| Mobile Home / Other | 7 (70.0%) | 3 (30.0%) |
| Total | 216 (87.1%) | 32 (12.9%) |
Housing Structures by Number of Rooms in Tivoli
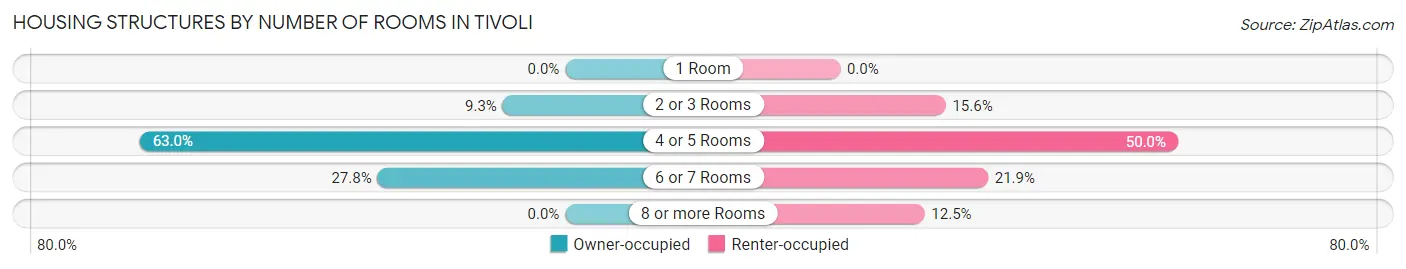
| Number of Rooms | Owner-occupied | Renter-occupied |
| 1 Room | 0 (0.0%) | 0 (0.0%) |
| 2 or 3 Rooms | 20 (9.3%) | 5 (15.6%) |
| 4 or 5 Rooms | 136 (63.0%) | 16 (50.0%) |
| 6 or 7 Rooms | 60 (27.8%) | 7 (21.9%) |
| 8 or more Rooms | 0 (0.0%) | 4 (12.5%) |
| Total | 216 (100.0%) | 32 (100.0%) |
Housing Structure by Heating Type in Tivoli
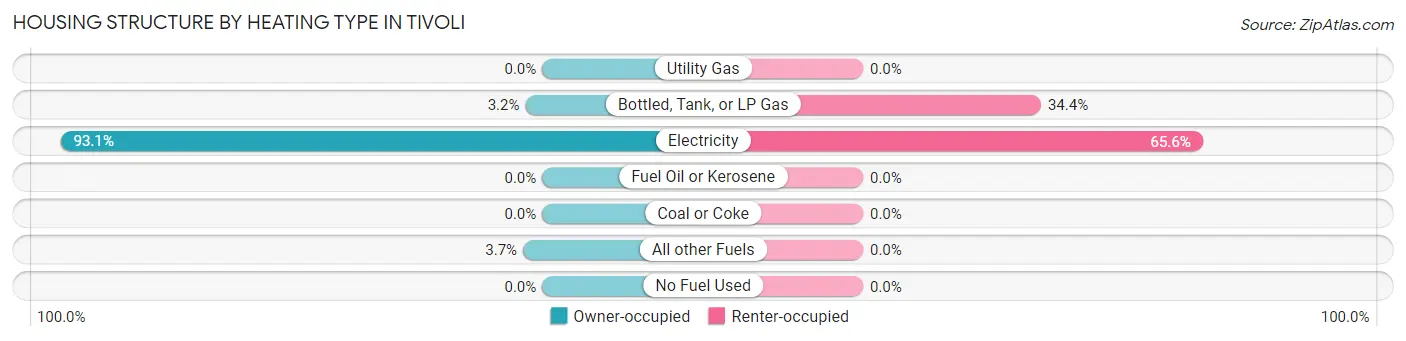
| Heating Type | Owner-occupied | Renter-occupied |
| Utility Gas | 0 (0.0%) | 0 (0.0%) |
| Bottled, Tank, or LP Gas | 7 (3.2%) | 11 (34.4%) |
| Electricity | 201 (93.1%) | 21 (65.6%) |
| Fuel Oil or Kerosene | 0 (0.0%) | 0 (0.0%) |
| Coal or Coke | 0 (0.0%) | 0 (0.0%) |
| All other Fuels | 8 (3.7%) | 0 (0.0%) |
| No Fuel Used | 0 (0.0%) | 0 (0.0%) |
| Total | 216 (100.0%) | 32 (100.0%) |
Household Vehicle Usage in Tivoli
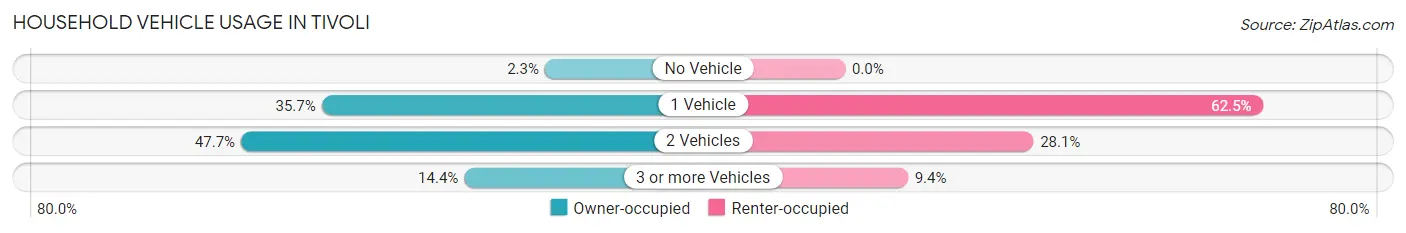
| Vehicles per Household | Owner-occupied | Renter-occupied |
| No Vehicle | 5 (2.3%) | 0 (0.0%) |
| 1 Vehicle | 77 (35.6%) | 20 (62.5%) |
| 2 Vehicles | 103 (47.7%) | 9 (28.1%) |
| 3 or more Vehicles | 31 (14.3%) | 3 (9.4%) |
| Total | 216 (100.0%) | 32 (100.0%) |
Real Estate & Mortgages in Tivoli
Real Estate and Mortgage Overview in Tivoli
| Characteristic | Without Mortgage | With Mortgage |
| Housing Units | 159 | 57 |
| Median Property Value | $51,900 | $0 |
| Median Household Income | $59,234 | $3 |
| Monthly Housing Costs | $310 | $0 |
| Real Estate Taxes | $1,063 | $0 |
Property Value by Mortgage Status in Tivoli
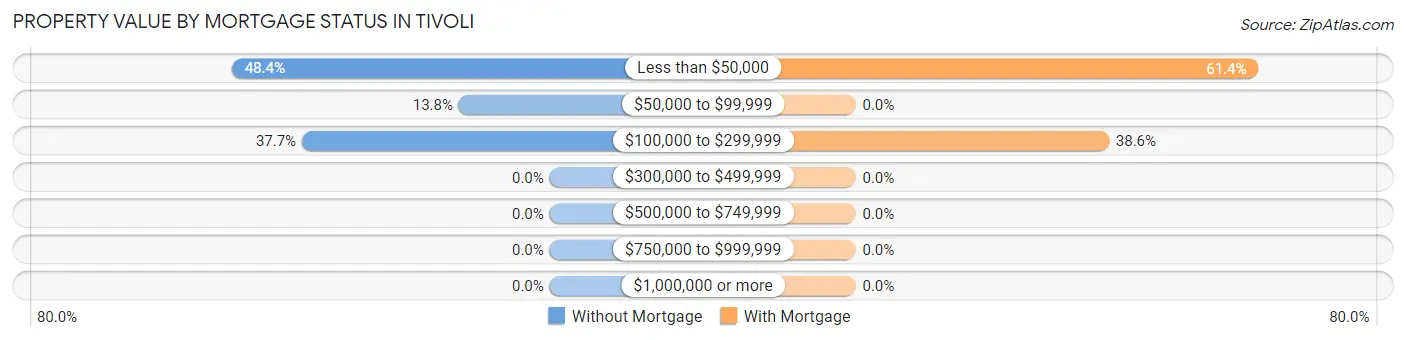
| Property Value | Without Mortgage | With Mortgage |
| Less than $50,000 | 77 (48.4%) | 35 (61.4%) |
| $50,000 to $99,999 | 22 (13.8%) | 0 (0.0%) |
| $100,000 to $299,999 | 60 (37.7%) | 22 (38.6%) |
| $300,000 to $499,999 | 0 (0.0%) | 0 (0.0%) |
| $500,000 to $749,999 | 0 (0.0%) | 0 (0.0%) |
| $750,000 to $999,999 | 0 (0.0%) | 0 (0.0%) |
| $1,000,000 or more | 0 (0.0%) | 0 (0.0%) |
| Total | 159 (100.0%) | 57 (100.0%) |
Household Income by Mortgage Status in Tivoli
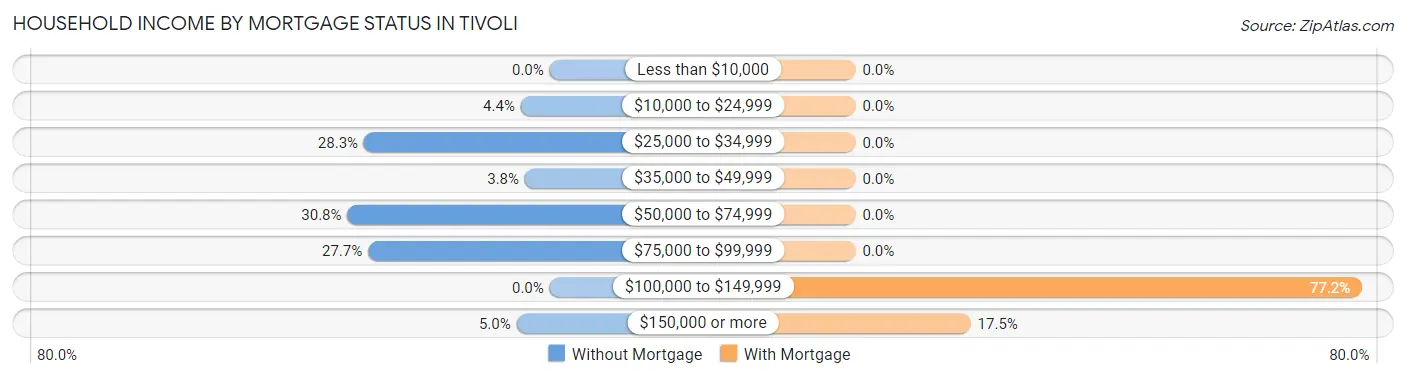
| Household Income | Without Mortgage | With Mortgage |
| Less than $10,000 | 0 (0.0%) | 0 (0.0%) |
| $10,000 to $24,999 | 7 (4.4%) | 0 (0.0%) |
| $25,000 to $34,999 | 45 (28.3%) | 0 (0.0%) |
| $35,000 to $49,999 | 6 (3.8%) | 0 (0.0%) |
| $50,000 to $74,999 | 49 (30.8%) | 0 (0.0%) |
| $75,000 to $99,999 | 44 (27.7%) | 0 (0.0%) |
| $100,000 to $149,999 | 0 (0.0%) | 44 (77.2%) |
| $150,000 or more | 8 (5.0%) | 10 (17.5%) |
| Total | 159 (100.0%) | 57 (100.0%) |
Property Value to Household Income Ratio in Tivoli
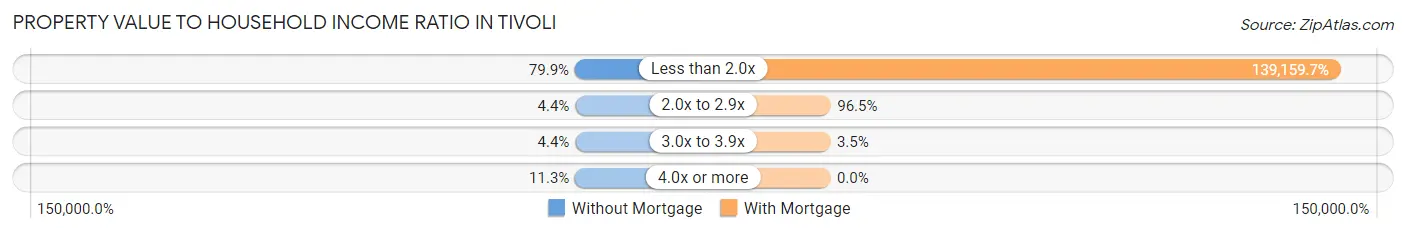
| Value-to-Income Ratio | Without Mortgage | With Mortgage |
| Less than 2.0x | 127 (79.9%) | 79,321 (139,159.7%) |
| 2.0x to 2.9x | 7 (4.4%) | 55 (96.5%) |
| 3.0x to 3.9x | 7 (4.4%) | 2 (3.5%) |
| 4.0x or more | 18 (11.3%) | 0 (0.0%) |
| Total | 159 (100.0%) | 57 (100.0%) |
Real Estate Taxes by Mortgage Status in Tivoli
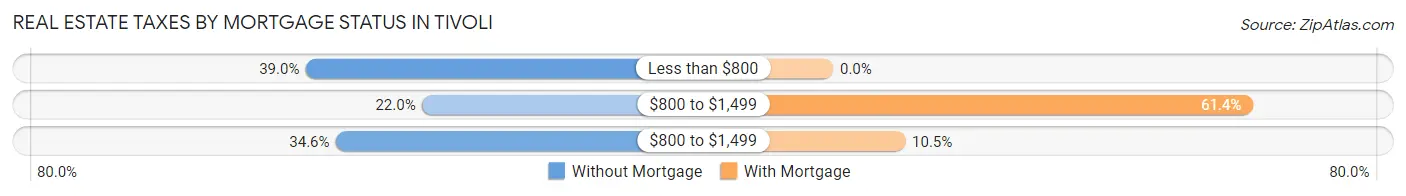
| Property Taxes | Without Mortgage | With Mortgage |
| Less than $800 | 62 (39.0%) | 0 (0.0%) |
| $800 to $1,499 | 35 (22.0%) | 35 (61.4%) |
| $800 to $1,499 | 55 (34.6%) | 6 (10.5%) |
| Total | 159 (100.0%) | 57 (100.0%) |
Health & Disability in Tivoli
Health Insurance Coverage by Age in Tivoli
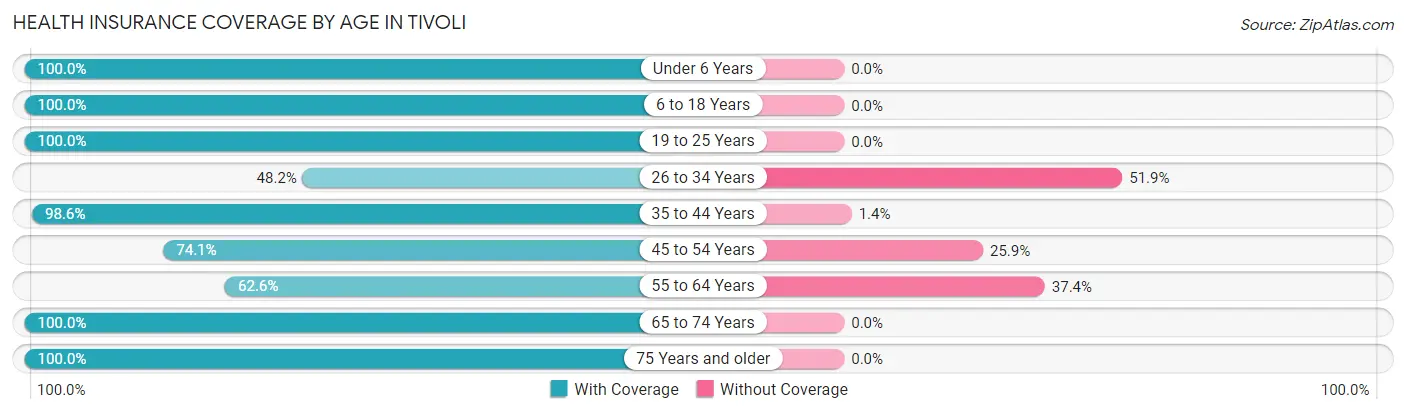
| Age Bracket | With Coverage | Without Coverage |
| Under 6 Years | 31 (100.0%) | 0 (0.0%) |
| 6 to 18 Years | 65 (100.0%) | 0 (0.0%) |
| 19 to 25 Years | 4 (100.0%) | 0 (0.0%) |
| 26 to 34 Years | 26 (48.1%) | 28 (51.8%) |
| 35 to 44 Years | 71 (98.6%) | 1 (1.4%) |
| 45 to 54 Years | 63 (74.1%) | 22 (25.9%) |
| 55 to 64 Years | 82 (62.6%) | 49 (37.4%) |
| 65 to 74 Years | 160 (100.0%) | 0 (0.0%) |
| 75 Years and older | 26 (100.0%) | 0 (0.0%) |
| Total | 528 (84.1%) | 100 (15.9%) |
Health Insurance Coverage by Citizenship Status in Tivoli
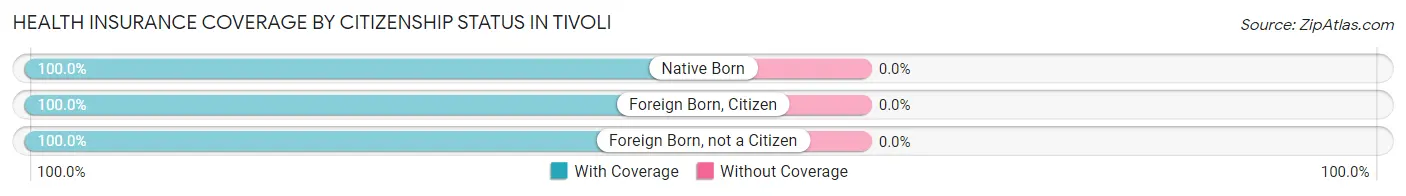
| Citizenship Status | With Coverage | Without Coverage |
| Native Born | 31 (100.0%) | 0 (0.0%) |
| Foreign Born, Citizen | 65 (100.0%) | 0 (0.0%) |
| Foreign Born, not a Citizen | 4 (100.0%) | 0 (0.0%) |
Health Insurance Coverage by Household Income in Tivoli
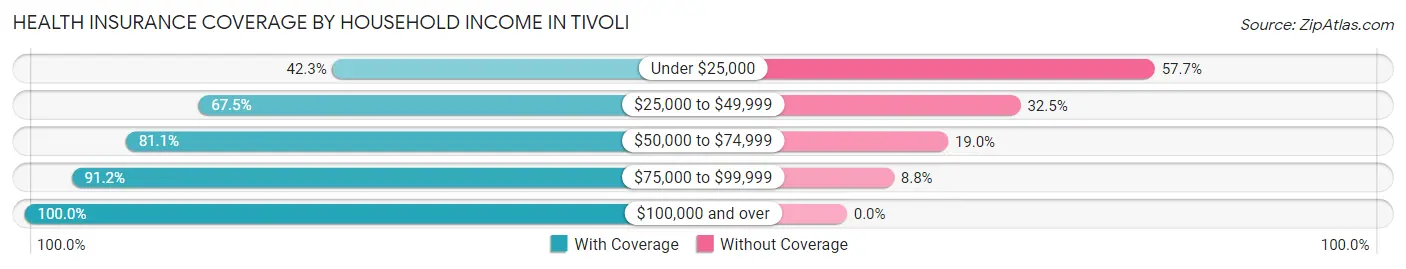
| Household Income | With Coverage | Without Coverage |
| Under $25,000 | 11 (42.3%) | 15 (57.7%) |
| $25,000 to $49,999 | 85 (67.5%) | 41 (32.5%) |
| $50,000 to $74,999 | 124 (81.0%) | 29 (19.0%) |
| $75,000 to $99,999 | 155 (91.2%) | 15 (8.8%) |
| $100,000 and over | 153 (100.0%) | 0 (0.0%) |
Public vs Private Health Insurance Coverage by Age in Tivoli

| Age Bracket | Public Insurance | Private Insurance |
| Under 6 | 12 (38.7%) | 19 (61.3%) |
| 6 to 18 Years | 13 (20.0%) | 52 (80.0%) |
| 19 to 25 Years | 0 (0.0%) | 4 (100.0%) |
| 25 to 34 Years | 0 (0.0%) | 26 (48.1%) |
| 35 to 44 Years | 44 (61.1%) | 27 (37.5%) |
| 45 to 54 Years | 0 (0.0%) | 63 (74.1%) |
| 55 to 64 Years | 33 (25.2%) | 49 (37.4%) |
| 65 to 74 Years | 135 (84.4%) | 76 (47.5%) |
| 75 Years and over | 26 (100.0%) | 12 (46.2%) |
| Total | 263 (41.9%) | 328 (52.2%) |
Disability Status by Sex by Age in Tivoli
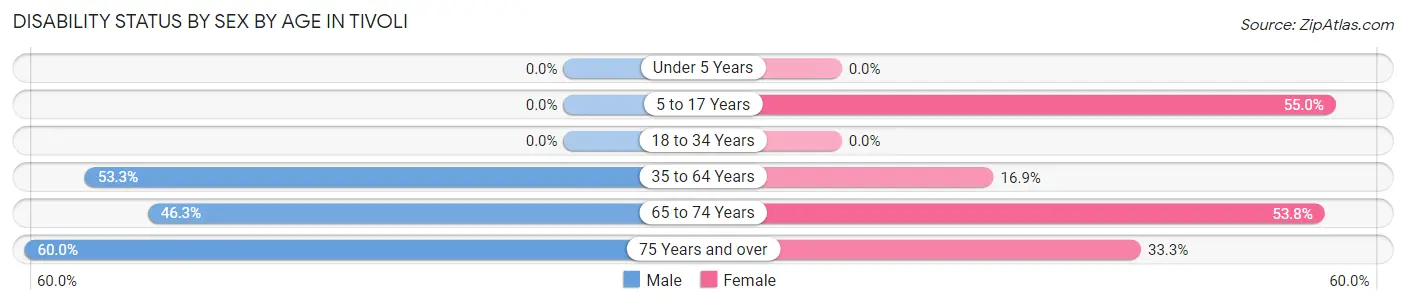
| Age Bracket | Male | Female |
| Under 5 Years | 0 (0.0%) | 0 (0.0%) |
| 5 to 17 Years | 0 (0.0%) | 11 (55.0%) |
| 18 to 34 Years | 0 (0.0%) | 0 (0.0%) |
| 35 to 64 Years | 81 (53.3%) | 23 (16.9%) |
| 65 to 74 Years | 31 (46.3%) | 50 (53.8%) |
| 75 Years and over | 12 (60.0%) | 2 (33.3%) |
Disability Class by Sex by Age in Tivoli
Disability Class: Hearing Difficulty
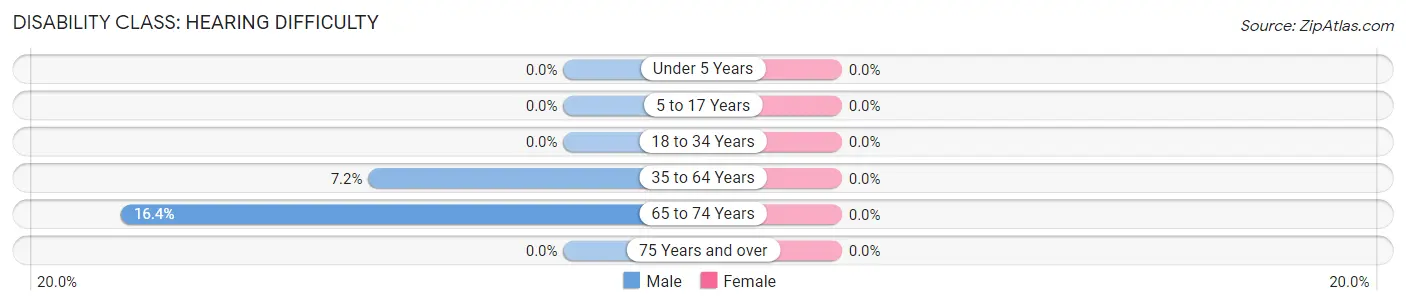
| Age Bracket | Male | Female |
| Under 5 Years | 0 (0.0%) | 0 (0.0%) |
| 5 to 17 Years | 0 (0.0%) | 0 (0.0%) |
| 18 to 34 Years | 0 (0.0%) | 0 (0.0%) |
| 35 to 64 Years | 11 (7.2%) | 0 (0.0%) |
| 65 to 74 Years | 11 (16.4%) | 0 (0.0%) |
| 75 Years and over | 0 (0.0%) | 0 (0.0%) |
Disability Class: Vision Difficulty
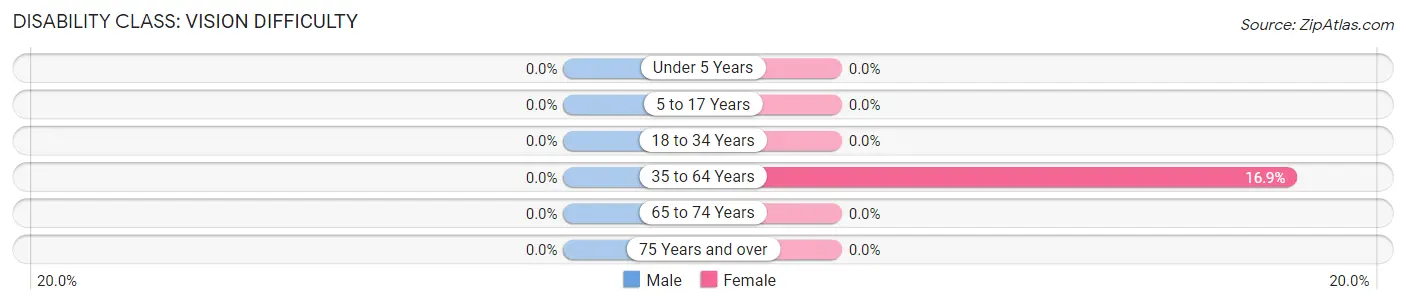
| Age Bracket | Male | Female |
| Under 5 Years | 0 (0.0%) | 0 (0.0%) |
| 5 to 17 Years | 0 (0.0%) | 0 (0.0%) |
| 18 to 34 Years | 0 (0.0%) | 0 (0.0%) |
| 35 to 64 Years | 0 (0.0%) | 23 (16.9%) |
| 65 to 74 Years | 0 (0.0%) | 0 (0.0%) |
| 75 Years and over | 0 (0.0%) | 0 (0.0%) |
Disability Class: Cognitive Difficulty
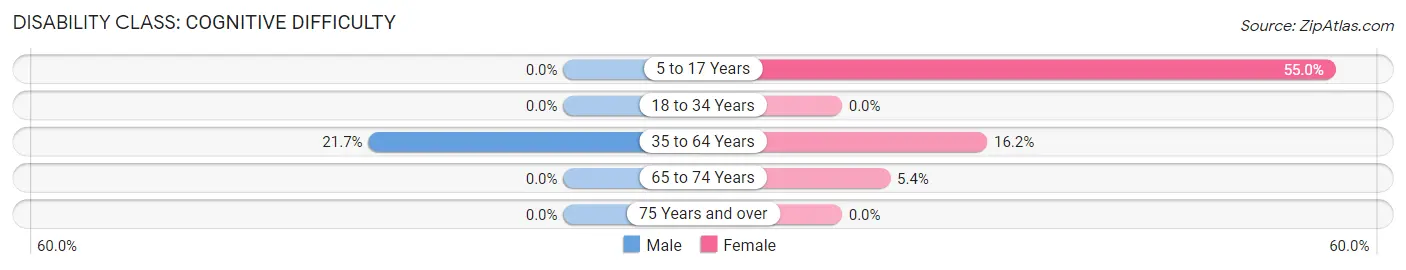
| Age Bracket | Male | Female |
| 5 to 17 Years | 0 (0.0%) | 11 (55.0%) |
| 18 to 34 Years | 0 (0.0%) | 0 (0.0%) |
| 35 to 64 Years | 33 (21.7%) | 22 (16.2%) |
| 65 to 74 Years | 0 (0.0%) | 5 (5.4%) |
| 75 Years and over | 0 (0.0%) | 0 (0.0%) |
Disability Class: Ambulatory Difficulty
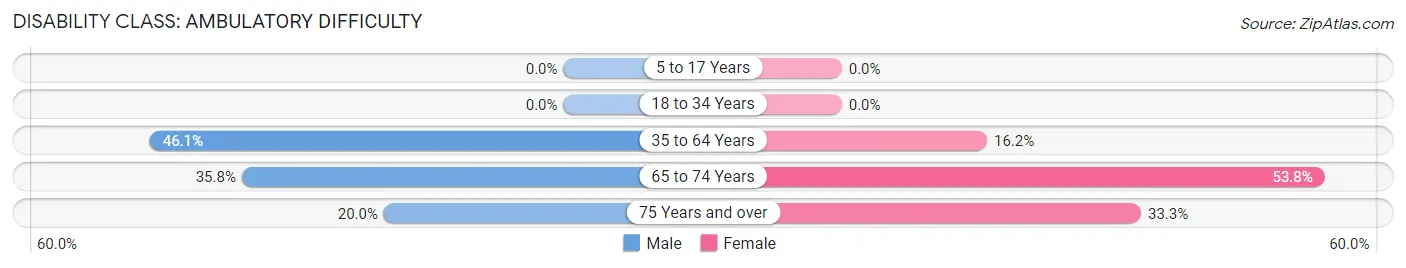
| Age Bracket | Male | Female |
| 5 to 17 Years | 0 (0.0%) | 0 (0.0%) |
| 18 to 34 Years | 0 (0.0%) | 0 (0.0%) |
| 35 to 64 Years | 70 (46.1%) | 22 (16.2%) |
| 65 to 74 Years | 24 (35.8%) | 50 (53.8%) |
| 75 Years and over | 4 (20.0%) | 2 (33.3%) |
Disability Class: Self-Care Difficulty
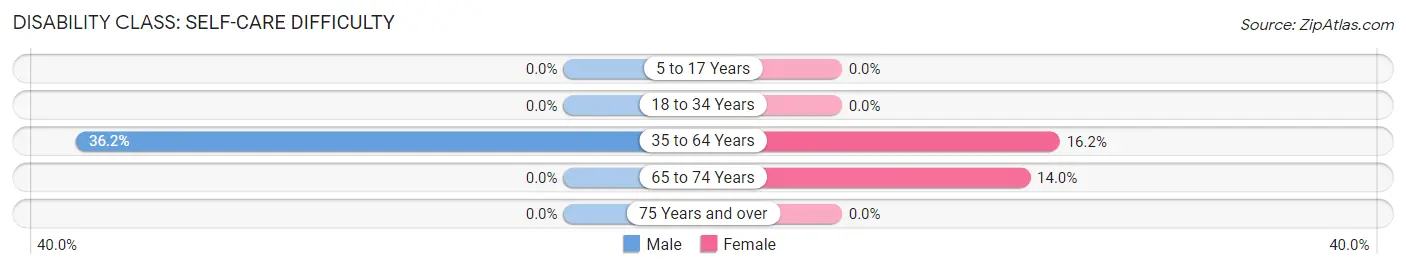
| Age Bracket | Male | Female |
| 5 to 17 Years | 0 (0.0%) | 0 (0.0%) |
| 18 to 34 Years | 0 (0.0%) | 0 (0.0%) |
| 35 to 64 Years | 55 (36.2%) | 22 (16.2%) |
| 65 to 74 Years | 0 (0.0%) | 13 (14.0%) |
| 75 Years and over | 0 (0.0%) | 0 (0.0%) |
Technology Access in Tivoli
Computing Device Access in Tivoli
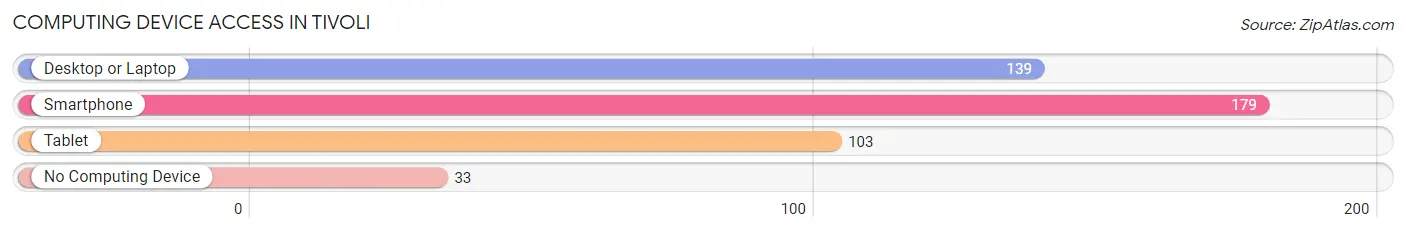
| Device Type | # Households | % Households |
| Desktop or Laptop | 139 | 56.0% |
| Smartphone | 179 | 72.2% |
| Tablet | 103 | 41.5% |
| No Computing Device | 33 | 13.3% |
| Total | 248 | 100.0% |
Internet Access in Tivoli
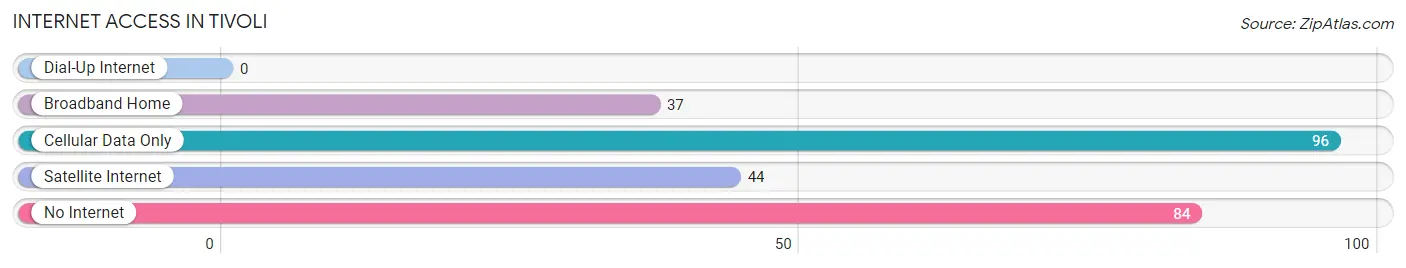
| Internet Type | # Households | % Households |
| Dial-Up Internet | 0 | 0.0% |
| Broadband Home | 37 | 14.9% |
| Cellular Data Only | 96 | 38.7% |
| Satellite Internet | 44 | 17.7% |
| No Internet | 84 | 33.9% |
| Total | 248 | 100.0% |
Tivoli Summary
Tivoli is a small town located in Refugio County, Texas, United States. It is situated on the Gulf Coast, approximately 50 miles southeast of Corpus Christi. The population was estimated to be 545 in the year 2000.
History
Tivoli was founded in 1854 by a group of German immigrants. The town was named after the Italian city of Tivoli, which was the birthplace of one of the settlers. The town was originally a farming community, but it soon became a popular tourist destination due to its proximity to the Gulf Coast.
In the late 19th century, Tivoli was a popular destination for wealthy Texans who wanted to escape the heat of the summer. The town was known for its luxurious hotels and resorts, and it was a popular destination for fishing and hunting.
In the early 20th century, Tivoli was a popular destination for oil prospectors. The town was home to several oil wells, and it was a major center for the oil industry.
Geography
Tivoli is located in Refugio County, Texas, approximately 50 miles southeast of Corpus Christi. The town is situated on the Gulf Coast, and it is surrounded by the Aransas Bay and the Copano Bay. The climate in Tivoli is subtropical, with hot summers and mild winters.
The terrain in Tivoli is mostly flat, with some rolling hills. The town is located on the Gulf Coast, and it is surrounded by wetlands and marshlands.
Economy
The economy of Tivoli is largely based on tourism and the oil industry. The town is home to several oil wells, and it is a major center for the oil industry.
Tourism is also an important part of the economy in Tivoli. The town is a popular destination for fishing and hunting, and it is home to several luxurious hotels and resorts.
Demographics
The population of Tivoli was estimated to be 545 in the year 2000. The racial makeup of the town was 94.3% White, 0.7% African American, 0.2% Native American, 0.2% Asian, 0.2% Pacific Islander, and 4.4% from other races.
The median household income in Tivoli was $30,000 in the year 2000. The per capita income was $14,000. The median age in Tivoli was 37.5 years.
Conclusion
Tivoli is a small town located in Refugio County, Texas, United States. It is situated on the Gulf Coast, approximately 50 miles southeast of Corpus Christi. The population was estimated to be 545 in the year 2000. The economy of Tivoli is largely based on tourism and the oil industry. The racial makeup of the town was 94.3% White, 0.7% African American, 0.2% Native American, 0.2% Asian, 0.2% Pacific Islander, and 4.4% from other races. The median household income in Tivoli was $30,000 in the year 2000. The per capita income was $14,000. The median age in Tivoli was 37.5 years.
Common Questions
What is Per Capita Income in Tivoli?
Per Capita income in Tivoli is $30,734.
What is the Median Family Income in Tivoli?
Median Family Income in Tivoli is $64,318.
What is the Median Household income in Tivoli?
Median Household Income in Tivoli is $63,636.
What is Income or Wage Gap in Tivoli?
Income or Wage Gap in Tivoli is 35.5%.
Women in Tivoli earn 64.5 cents for every dollar earned by a man.
What is Inequality or Gini Index in Tivoli?
Inequality or Gini Index in Tivoli is 0.29.
What is the Total Population of Tivoli?
Total Population of Tivoli is 628.
What is the Total Male Population of Tivoli?
Total Male Population of Tivoli is 328.
What is the Total Female Population of Tivoli?
Total Female Population of Tivoli is 300.
What is the Ratio of Males per 100 Females in Tivoli?
There are 109.33 Males per 100 Females in Tivoli.
What is the Ratio of Females per 100 Males in Tivoli?
There are 91.46 Females per 100 Males in Tivoli.
What is the Median Population Age in Tivoli?
Median Population Age in Tivoli is 57.3 Years.
What is the Average Family Size in Tivoli
Average Family Size in Tivoli is 3.8 People.
What is the Average Household Size in Tivoli
Average Household Size in Tivoli is 2.5 People.
How Large is the Labor Force in Tivoli?
There are 328 People in the Labor Forcein in Tivoli.
What is the Percentage of People in the Labor Force in Tivoli?
58.0% of People are in the Labor Force in Tivoli.
What is the Unemployment Rate in Tivoli?
Unemployment Rate in Tivoli is 23.8%.