Three Rivers, TX Map & Demographics
Three Rivers Map
Three Rivers Overview
$18,882
PER CAPITA INCOME
$43,052
AVG FAMILY INCOME
$41,520
AVG HOUSEHOLD INCOME
53.8%
WAGE / INCOME GAP [ % ]
46.2¢/ $1
WAGE / INCOME GAP [ $ ]
0.40
INEQUALITY / GINI INDEX
1,546
TOTAL POPULATION
673
MALE POPULATION
873
FEMALE POPULATION
77.09
MALES / 100 FEMALES
129.72
FEMALES / 100 MALES
36.4
MEDIAN AGE
3.0
AVG FAMILY SIZE
2.1
AVG HOUSEHOLD SIZE
536
LABOR FORCE [ PEOPLE ]
43.8%
PERCENT IN LABOR FORCE
10.6%
UNEMPLOYMENT RATE
Three Rivers Zip Codes
Three Rivers Area Codes
Income in Three Rivers
Income Overview in Three Rivers
Per Capita Income in Three Rivers is $18,882, while median incomes of families and households are $43,052 and $41,520 respectively.
| Characteristic | Number | Measure |
| Per Capita Income | 1,546 | $18,882 |
| Median Family Income | 409 | $43,052 |
| Mean Family Income | 409 | $49,325 |
| Median Household Income | 723 | $41,520 |
| Mean Household Income | 723 | $45,511 |
| Income Deficit | 409 | $0 |
| Wage / Income Gap (%) | 1,546 | 53.77% |
| Wage / Income Gap ($) | 1,546 | 46.23¢ per $1 |
| Gini / Inequality Index | 1,546 | 0.40 |
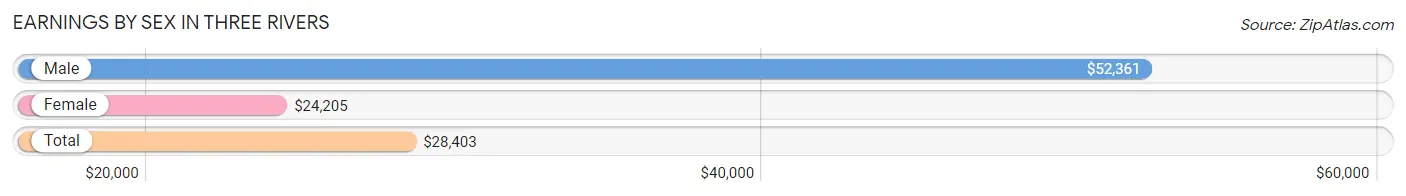
Earnings by Sex in Three Rivers
Average Earnings in Three Rivers are $28,403, $52,361 for men and $24,205 for women, a difference of 53.8%.
| Sex | Number | Average Earnings |
| Male | 297 (57.2%) | $52,361 |
| Female | 222 (42.8%) | $24,205 |
| Total | 519 (100.0%) | $28,403 |
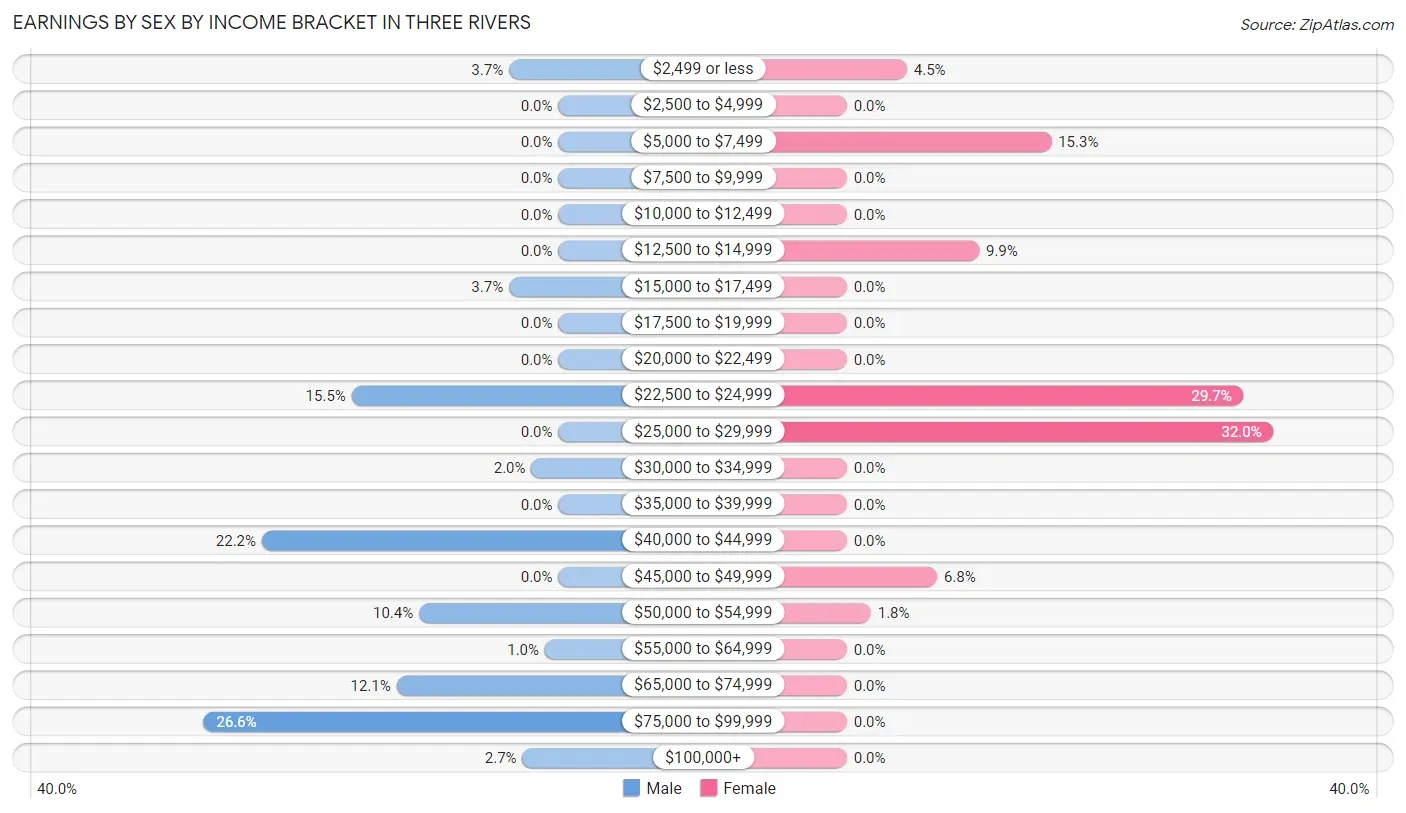
Earnings by Sex by Income Bracket in Three Rivers
The most common earnings brackets in Three Rivers are $75,000 to $99,999 for men (79 | 26.6%) and $25,000 to $29,999 for women (71 | 32.0%).
| Income | Male | Female |
| $2,499 or less | 11 (3.7%) | 10 (4.5%) |
| $2,500 to $4,999 | 0 (0.0%) | 0 (0.0%) |
| $5,000 to $7,499 | 0 (0.0%) | 34 (15.3%) |
| $7,500 to $9,999 | 0 (0.0%) | 0 (0.0%) |
| $10,000 to $12,499 | 0 (0.0%) | 0 (0.0%) |
| $12,500 to $14,999 | 0 (0.0%) | 22 (9.9%) |
| $15,000 to $17,499 | 11 (3.7%) | 0 (0.0%) |
| $17,500 to $19,999 | 0 (0.0%) | 0 (0.0%) |
| $20,000 to $22,499 | 0 (0.0%) | 0 (0.0%) |
| $22,500 to $24,999 | 46 (15.5%) | 66 (29.7%) |
| $25,000 to $29,999 | 0 (0.0%) | 71 (32.0%) |
| $30,000 to $34,999 | 6 (2.0%) | 0 (0.0%) |
| $35,000 to $39,999 | 0 (0.0%) | 0 (0.0%) |
| $40,000 to $44,999 | 66 (22.2%) | 0 (0.0%) |
| $45,000 to $49,999 | 0 (0.0%) | 15 (6.8%) |
| $50,000 to $54,999 | 31 (10.4%) | 4 (1.8%) |
| $55,000 to $64,999 | 3 (1.0%) | 0 (0.0%) |
| $65,000 to $74,999 | 36 (12.1%) | 0 (0.0%) |
| $75,000 to $99,999 | 79 (26.6%) | 0 (0.0%) |
| $100,000+ | 8 (2.7%) | 0 (0.0%) |
| Total | 297 (100.0%) | 222 (100.0%) |
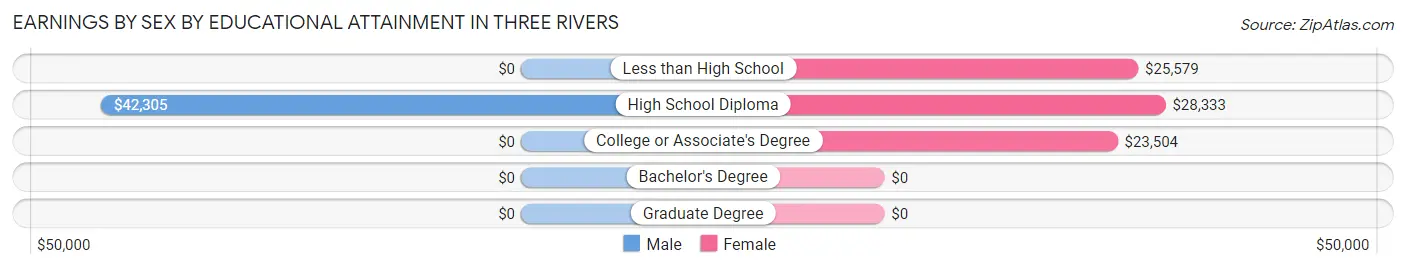
Earnings by Sex by Educational Attainment in Three Rivers
Average earnings in Three Rivers are $52,898 for men and $24,545 for women, a difference of 53.6%. Men with an educational attainment of high school diploma enjoy the highest average annual earnings of $42,305, while those with high school diploma education earn the least with $42,305. Women with an educational attainment of high school diploma earn the most with the average annual earnings of $28,333, while those with college or associate's degree education have the smallest earnings of $23,504.
| Educational Attainment | Male Income | Female Income |
| Less than High School | - | - |
| High School Diploma | $42,305 | $28,333 |
| College or Associate's Degree | - | - |
| Bachelor's Degree | - | - |
| Graduate Degree | - | - |
| Total | $52,898 | $24,545 |
Family Income in Three Rivers
Family Income Brackets in Three Rivers
According to the Three Rivers family income data, there are 82 families falling into the $35,000 to $49,999 income range, which is the most common income bracket and makes up 20.1% of all families.
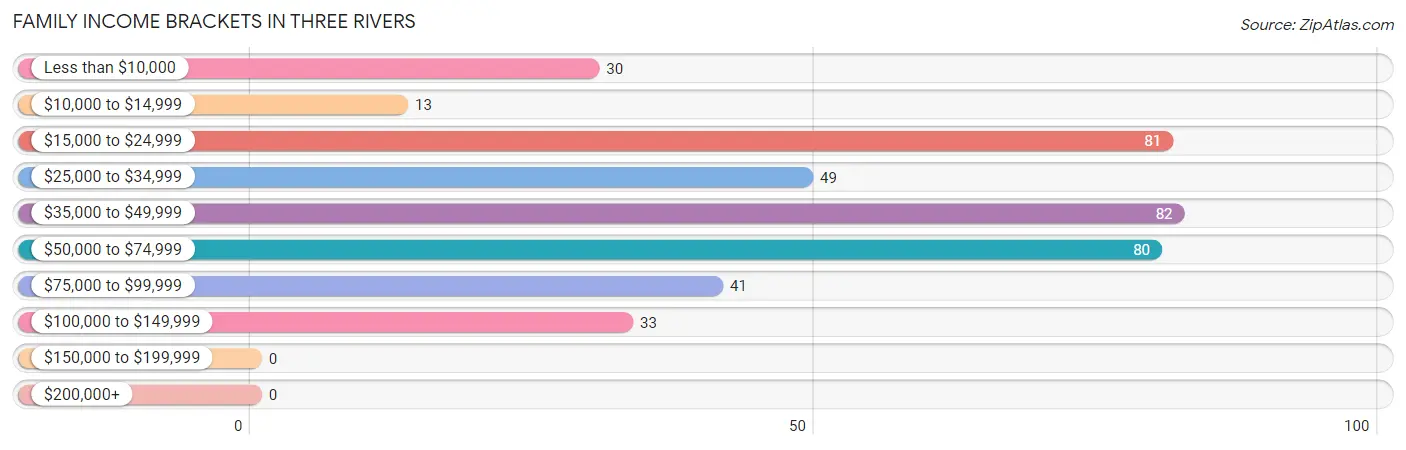
| Income Bracket | # Families | % Families |
| Less than $10,000 | 30 | 7.3% |
| $10,000 to $14,999 | 13 | 3.2% |
| $15,000 to $24,999 | 81 | 19.8% |
| $25,000 to $34,999 | 49 | 12.0% |
| $35,000 to $49,999 | 82 | 20.0% |
| $50,000 to $74,999 | 80 | 19.6% |
| $75,000 to $99,999 | 41 | 10.0% |
| $100,000 to $149,999 | 33 | 8.1% |
| $150,000 to $199,999 | 0 | 0.0% |
| $200,000+ | 0 | 0.0% |
Family Income by Famaliy Size in Three Rivers
3-person families (68 | 16.6%) account for the highest median family income in Three Rivers with $45,735 per family, while 2-person families (201 | 49.1%) have the highest median income of $21,758 per family member.
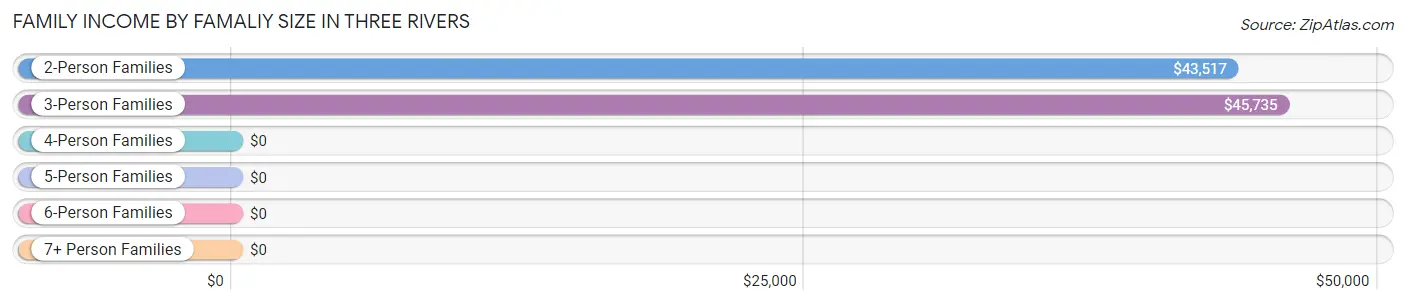
| Income Bracket | # Families | Median Income |
| 2-Person Families | 201 (49.1%) | $43,517 |
| 3-Person Families | 68 (16.6%) | $45,735 |
| 4-Person Families | 73 (17.8%) | $0 |
| 5-Person Families | 67 (16.4%) | $0 |
| 6-Person Families | 0 (0.0%) | $0 |
| 7+ Person Families | 0 (0.0%) | $0 |
| Total | 409 (100.0%) | $43,052 |
Family Income by Number of Earners in Three Rivers
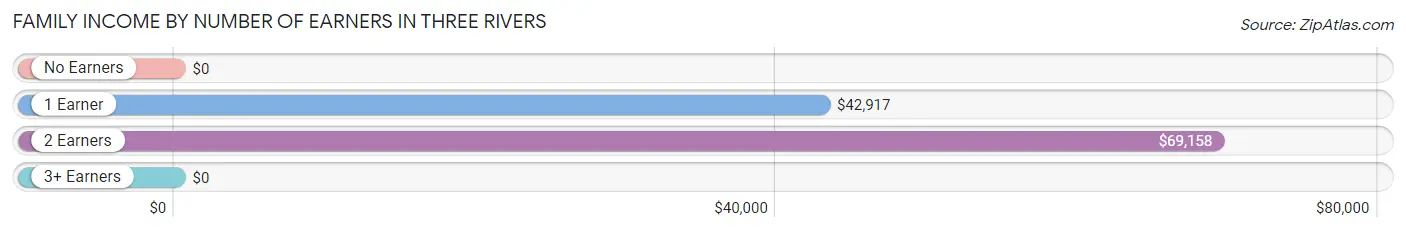
| Number of Earners | # Families | Median Income |
| No Earners | 147 (35.9%) | $0 |
| 1 Earner | 181 (44.3%) | $42,917 |
| 2 Earners | 81 (19.8%) | $69,158 |
| 3+ Earners | 0 (0.0%) | $0 |
| Total | 409 (100.0%) | $43,052 |
Household Income in Three Rivers
Household Income Brackets in Three Rivers
With 172 households falling in the category, the $50,000 to $74,999 income range is the most frequent in Three Rivers, accounting for 23.8% of all households.
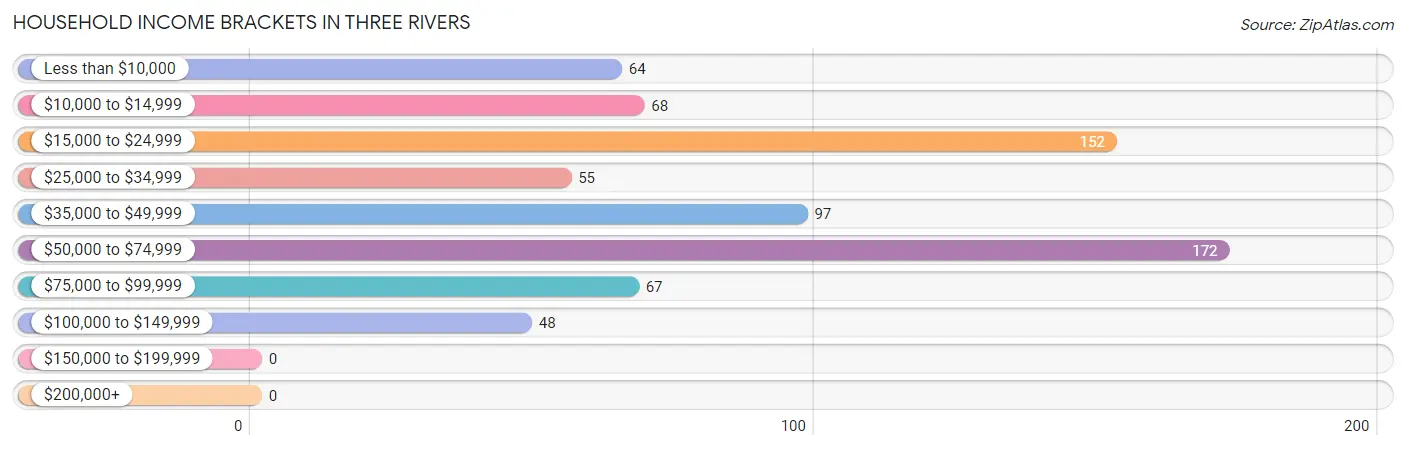
| Income Bracket | # Households | % Households |
| Less than $10,000 | 64 | 8.9% |
| $10,000 to $14,999 | 68 | 9.4% |
| $15,000 to $24,999 | 152 | 21.0% |
| $25,000 to $34,999 | 55 | 7.6% |
| $35,000 to $49,999 | 97 | 13.4% |
| $50,000 to $74,999 | 172 | 23.8% |
| $75,000 to $99,999 | 67 | 9.3% |
| $100,000 to $149,999 | 48 | 6.6% |
| $150,000 to $199,999 | 0 | 0.0% |
| $200,000+ | 0 | 0.0% |
Household Income by Householder Age in Three Rivers
The median household income in Three Rivers is $41,520, with the highest median household income of $68,239 found in the 25 to 44 years age bracket for the primary householder. A total of 215 households (29.7%) fall into this category. Meanwhile, the 15 to 24 years age bracket for the primary householder has the lowest median household income of $0, with 44 households (6.1%) in this group.
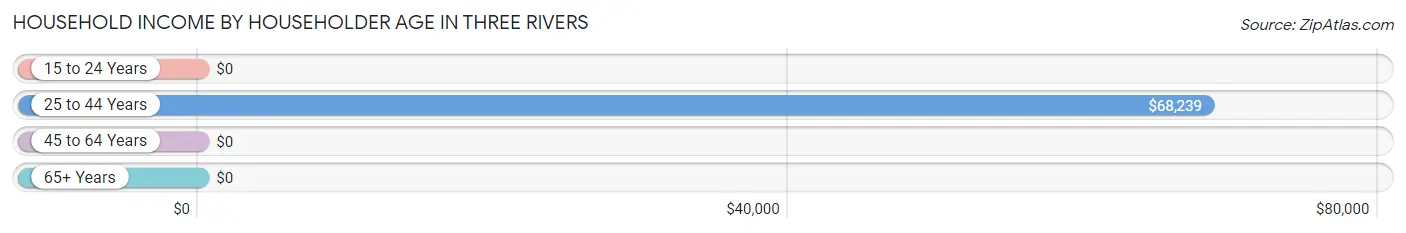
| Income Bracket | # Households | Median Income |
| 15 to 24 Years | 44 (6.1%) | $0 |
| 25 to 44 Years | 215 (29.7%) | $68,239 |
| 45 to 64 Years | 251 (34.7%) | $0 |
| 65+ Years | 213 (29.5%) | $0 |
| Total | 723 (100.0%) | $41,520 |
Poverty in Three Rivers
Income Below Poverty by Sex and Age in Three Rivers
With 32.4% poverty level for males and 37.7% for females among the residents of Three Rivers, 16 and 17 year old males and 16 and 17 year old females are the most vulnerable to poverty, with 28 males (100.0%) and 29 females (69.1%) in their respective age groups living below the poverty level.
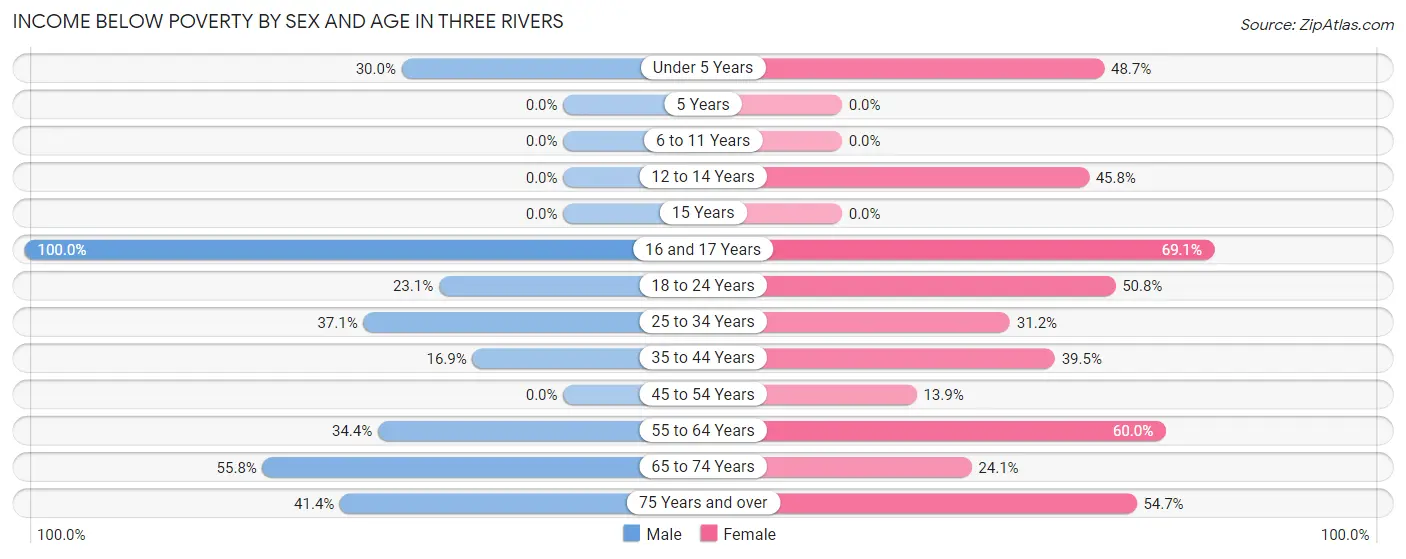
| Age Bracket | Male | Female |
| Under 5 Years | 24 (30.0%) | 55 (48.7%) |
| 5 Years | 0 (0.0%) | 0 (0.0%) |
| 6 to 11 Years | 0 (0.0%) | 0 (0.0%) |
| 12 to 14 Years | 0 (0.0%) | 11 (45.8%) |
| 15 Years | 0 (0.0%) | 0 (0.0%) |
| 16 and 17 Years | 28 (100.0%) | 29 (69.1%) |
| 18 to 24 Years | 9 (23.1%) | 34 (50.7%) |
| 25 to 34 Years | 46 (37.1%) | 39 (31.2%) |
| 35 to 44 Years | 15 (16.9%) | 17 (39.5%) |
| 45 to 54 Years | 0 (0.0%) | 14 (13.9%) |
| 55 to 64 Years | 43 (34.4%) | 63 (60.0%) |
| 65 to 74 Years | 24 (55.8%) | 32 (24.1%) |
| 75 Years and over | 29 (41.4%) | 35 (54.7%) |
| Total | 218 (32.4%) | 329 (37.7%) |
Income Above Poverty by Sex and Age in Three Rivers
According to the poverty statistics in Three Rivers, males aged 12 to 14 years and females aged 5 years are the age groups that are most secure financially, with 100.0% of males and 100.0% of females in these age groups living above the poverty line.
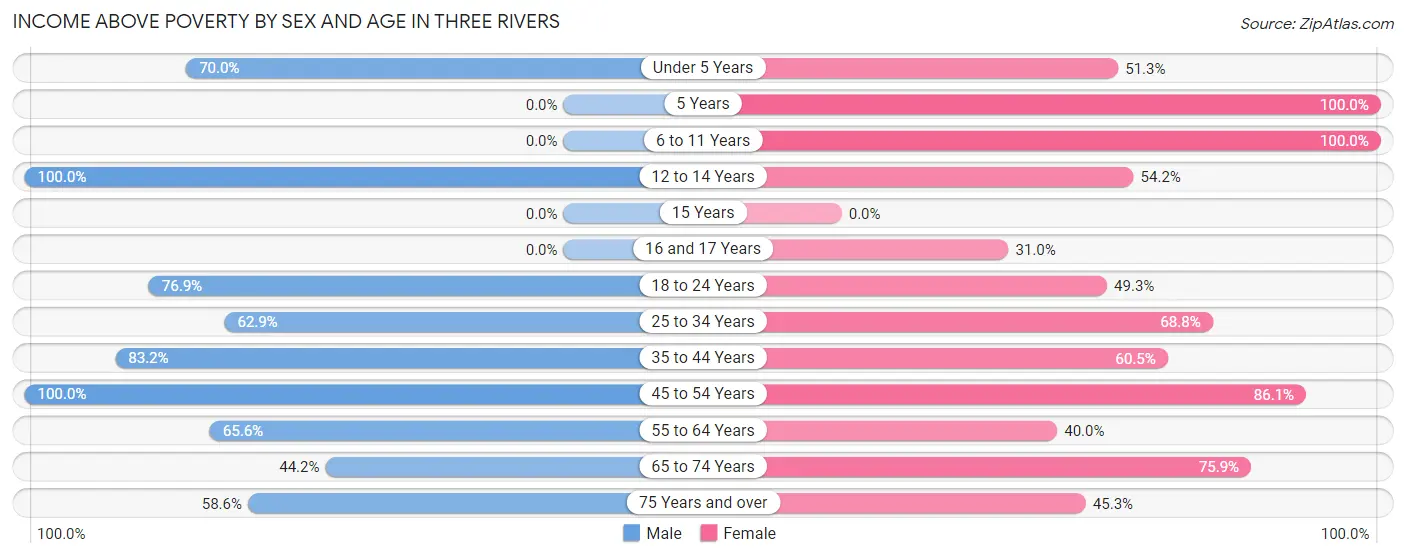
| Age Bracket | Male | Female |
| Under 5 Years | 56 (70.0%) | 58 (51.3%) |
| 5 Years | 0 (0.0%) | 25 (100.0%) |
| 6 to 11 Years | 0 (0.0%) | 31 (100.0%) |
| 12 to 14 Years | 49 (100.0%) | 13 (54.2%) |
| 15 Years | 0 (0.0%) | 0 (0.0%) |
| 16 and 17 Years | 0 (0.0%) | 13 (30.9%) |
| 18 to 24 Years | 30 (76.9%) | 33 (49.2%) |
| 25 to 34 Years | 78 (62.9%) | 86 (68.8%) |
| 35 to 44 Years | 74 (83.2%) | 26 (60.5%) |
| 45 to 54 Years | 26 (100.0%) | 87 (86.1%) |
| 55 to 64 Years | 82 (65.6%) | 42 (40.0%) |
| 65 to 74 Years | 19 (44.2%) | 101 (75.9%) |
| 75 Years and over | 41 (58.6%) | 29 (45.3%) |
| Total | 455 (67.6%) | 544 (62.3%) |
Income Below Poverty Among Married-Couple Families in Three Rivers
The poverty statistics for married-couple families in Three Rivers show that 36.8% or 123 of the total 334 families live below the poverty line. Families with 1 or 2 children have the highest poverty rate of 46.5%, comprising of 66 families. On the other hand, families with 3 or 4 children have the lowest poverty rate of 0.0%, which includes 0 families.
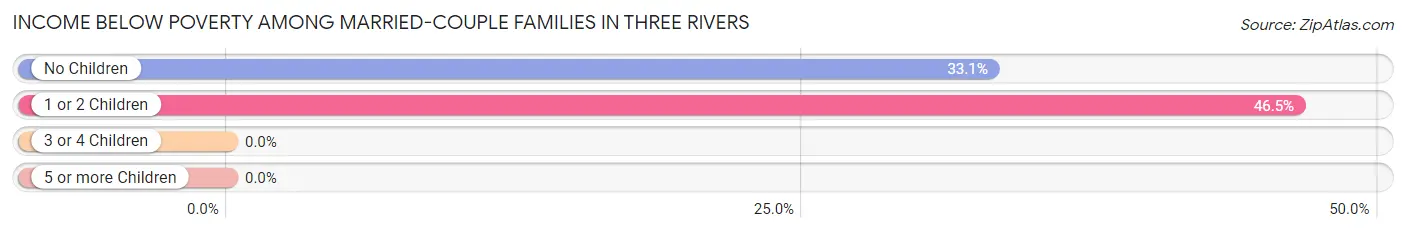
| Children | Above Poverty | Below Poverty |
| No Children | 115 (66.9%) | 57 (33.1%) |
| 1 or 2 Children | 76 (53.5%) | 66 (46.5%) |
| 3 or 4 Children | 20 (100.0%) | 0 (0.0%) |
| 5 or more Children | 0 (0.0%) | 0 (0.0%) |
| Total | 211 (63.2%) | 123 (36.8%) |
Income Below Poverty Among Single-Parent Households in Three Rivers
According to the poverty data in Three Rivers, 47.2% or 17 single-father households and 10.3% or 4 single-mother households are living below the poverty line. Among single-father households, those with 3 or 4 children have the highest poverty rate, with 17 households (100.0%) experiencing poverty. Likewise, among single-mother households, those with no children have the highest poverty rate, with 4 households (40.0%) falling below the poverty line.
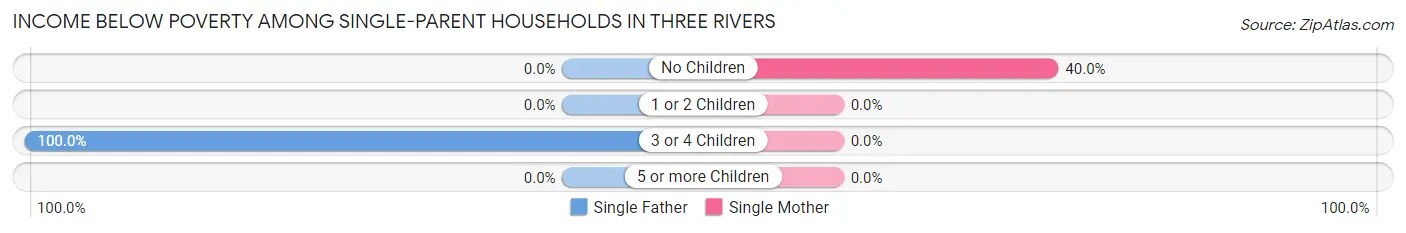
| Children | Single Father | Single Mother |
| No Children | 0 (0.0%) | 4 (40.0%) |
| 1 or 2 Children | 0 (0.0%) | 0 (0.0%) |
| 3 or 4 Children | 17 (100.0%) | 0 (0.0%) |
| 5 or more Children | 0 (0.0%) | 0 (0.0%) |
| Total | 17 (47.2%) | 4 (10.3%) |
Income Below Poverty Among Married-Couple vs Single-Parent Households in Three Rivers
The poverty data for Three Rivers shows that 123 of the married-couple family households (36.8%) and 21 of the single-parent households (28.0%) are living below the poverty level. Within the married-couple family households, those with 1 or 2 children have the highest poverty rate, with 66 households (46.5%) falling below the poverty line. Among the single-parent households, those with 3 or 4 children have the highest poverty rate, with 17 household (100.0%) living below poverty.
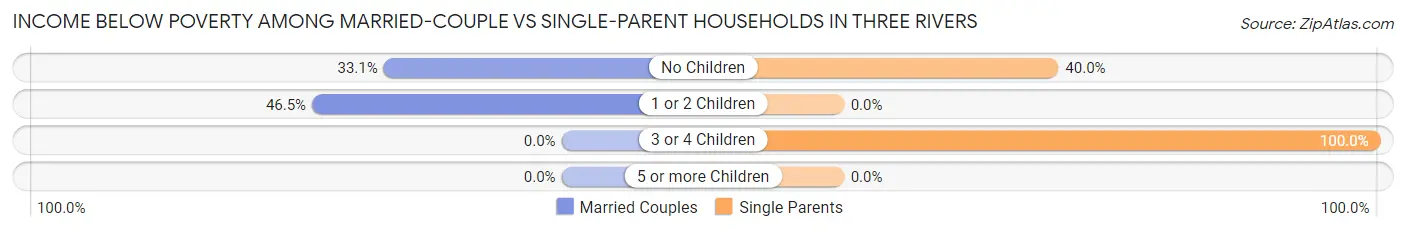
| Children | Married-Couple Families | Single-Parent Households |
| No Children | 57 (33.1%) | 4 (40.0%) |
| 1 or 2 Children | 66 (46.5%) | 0 (0.0%) |
| 3 or 4 Children | 0 (0.0%) | 17 (100.0%) |
| 5 or more Children | 0 (0.0%) | 0 (0.0%) |
| Total | 123 (36.8%) | 21 (28.0%) |
Race in Three Rivers
The most populous races in Three Rivers are White / Caucasian (1,305 | 84.4%), Hispanic or Latino (985 | 63.7%), and Two or more Races (226 | 14.6%).
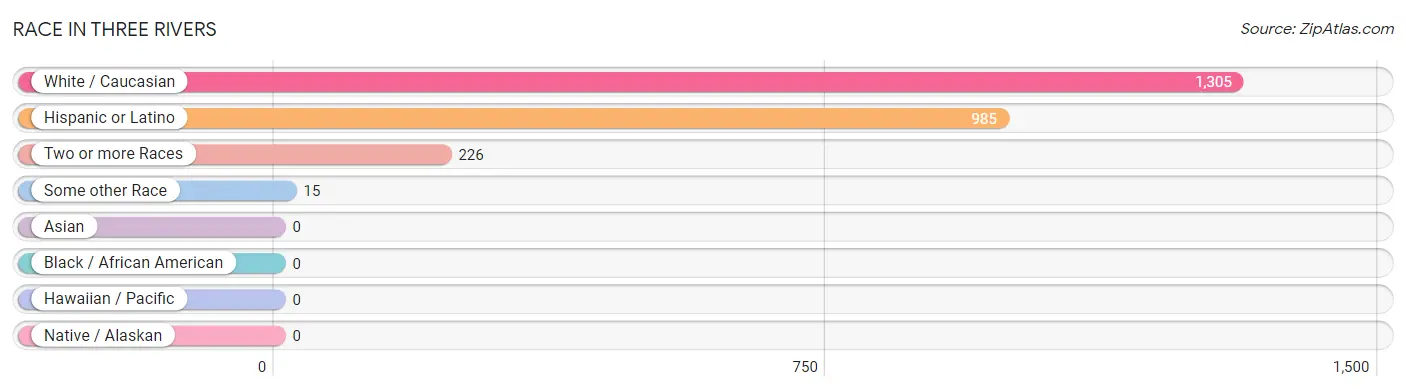
| Race | # Population | % Population |
| Asian | 0 | 0.0% |
| Black / African American | 0 | 0.0% |
| Hawaiian / Pacific | 0 | 0.0% |
| Hispanic or Latino | 985 | 63.7% |
| Native / Alaskan | 0 | 0.0% |
| White / Caucasian | 1,305 | 84.4% |
| Two or more Races | 226 | 14.6% |
| Some other Race | 15 | 1.0% |
| Total | 1,546 | 100.0% |
Ancestry in Three Rivers
The most populous ancestries reported in Three Rivers are Mexican (974 | 63.0%), Irish (133 | 8.6%), Czech (115 | 7.4%), German (113 | 7.3%), and English (39 | 2.5%), together accounting for 88.9% of all Three Rivers residents.
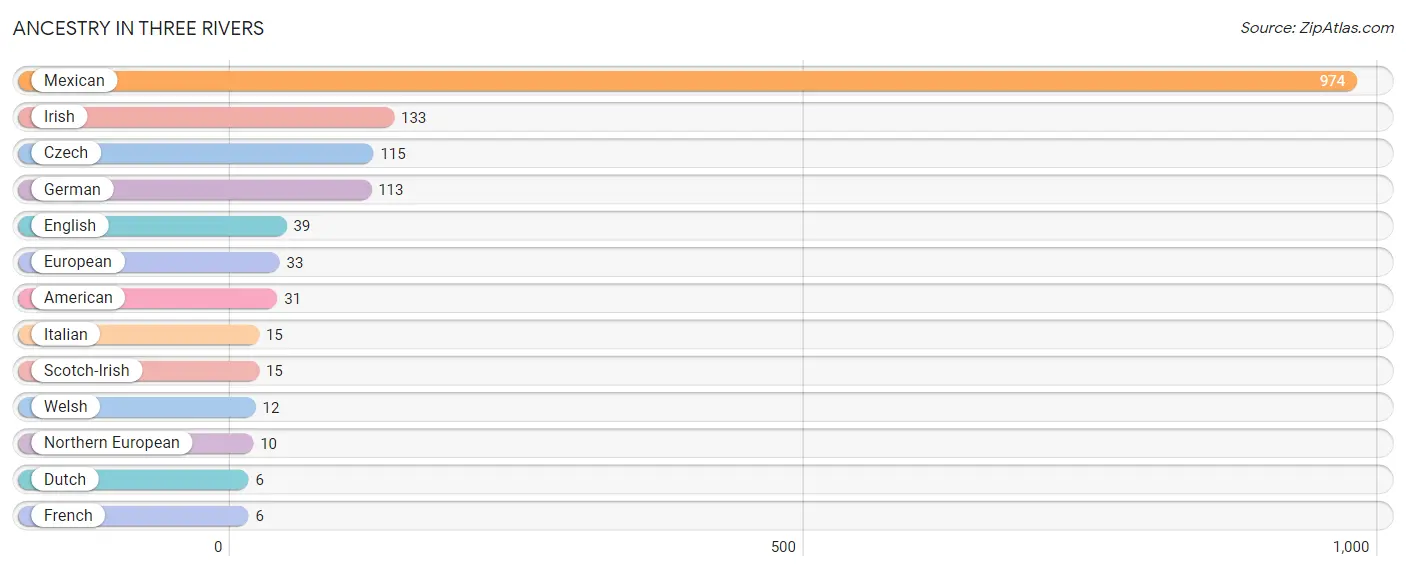
| Ancestry | # Population | % Population |
| American | 31 | 2.0% |
| Czech | 115 | 7.4% |
| Dutch | 6 | 0.4% |
| English | 39 | 2.5% |
| European | 33 | 2.1% |
| French | 6 | 0.4% |
| German | 113 | 7.3% |
| Irish | 133 | 8.6% |
| Italian | 15 | 1.0% |
| Mexican | 974 | 63.0% |
| Northern European | 10 | 0.6% |
| Scotch-Irish | 15 | 1.0% |
| Welsh | 12 | 0.8% | View All 13 Rows |
Immigrants in Three Rivers
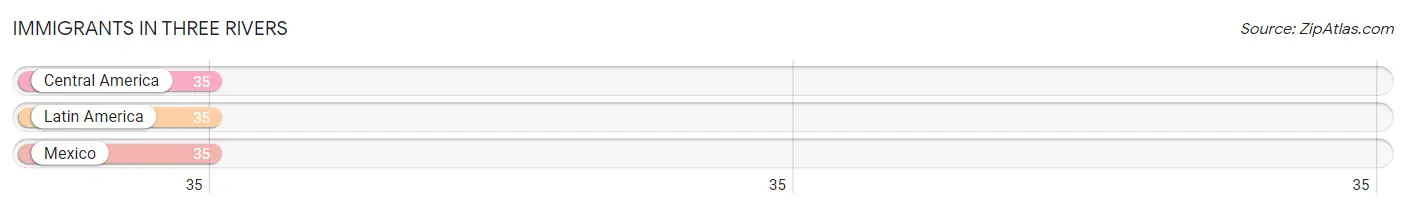
The most numerous immigrant groups reported in Three Rivers came from Central America (35 | 2.3%), Latin America (35 | 2.3%), and Mexico (35 | 2.3%), together accounting for 6.8% of all Three Rivers residents.
| Immigration Origin | # Population | % Population |
| Central America | 35 | 2.3% |
| Latin America | 35 | 2.3% |
| Mexico | 35 | 2.3% | View All 3 Rows |
Sex and Age in Three Rivers
Sex and Age in Three Rivers
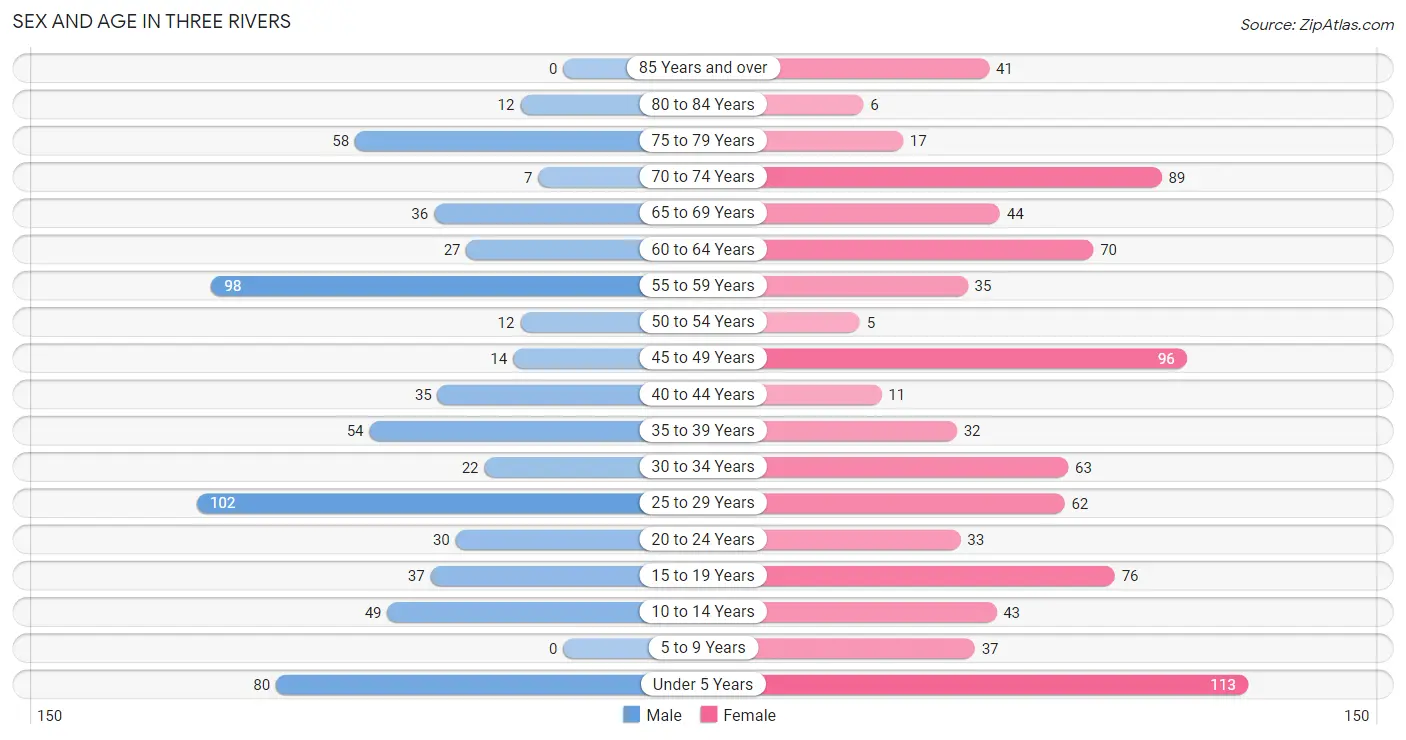
The most populous age groups in Three Rivers are 25 to 29 Years (102 | 15.2%) for men and Under 5 Years (113 | 12.9%) for women.
| Age Bracket | Male | Female |
| Under 5 Years | 80 (11.9%) | 113 (12.9%) |
| 5 to 9 Years | 0 (0.0%) | 37 (4.2%) |
| 10 to 14 Years | 49 (7.3%) | 43 (4.9%) |
| 15 to 19 Years | 37 (5.5%) | 76 (8.7%) |
| 20 to 24 Years | 30 (4.5%) | 33 (3.8%) |
| 25 to 29 Years | 102 (15.2%) | 62 (7.1%) |
| 30 to 34 Years | 22 (3.3%) | 63 (7.2%) |
| 35 to 39 Years | 54 (8.0%) | 32 (3.7%) |
| 40 to 44 Years | 35 (5.2%) | 11 (1.3%) |
| 45 to 49 Years | 14 (2.1%) | 96 (11.0%) |
| 50 to 54 Years | 12 (1.8%) | 5 (0.6%) |
| 55 to 59 Years | 98 (14.6%) | 35 (4.0%) |
| 60 to 64 Years | 27 (4.0%) | 70 (8.0%) |
| 65 to 69 Years | 36 (5.3%) | 44 (5.0%) |
| 70 to 74 Years | 7 (1.0%) | 89 (10.2%) |
| 75 to 79 Years | 58 (8.6%) | 17 (1.9%) |
| 80 to 84 Years | 12 (1.8%) | 6 (0.7%) |
| 85 Years and over | 0 (0.0%) | 41 (4.7%) |
| Total | 673 (100.0%) | 873 (100.0%) |
Families and Households in Three Rivers
Median Family Size in Three Rivers
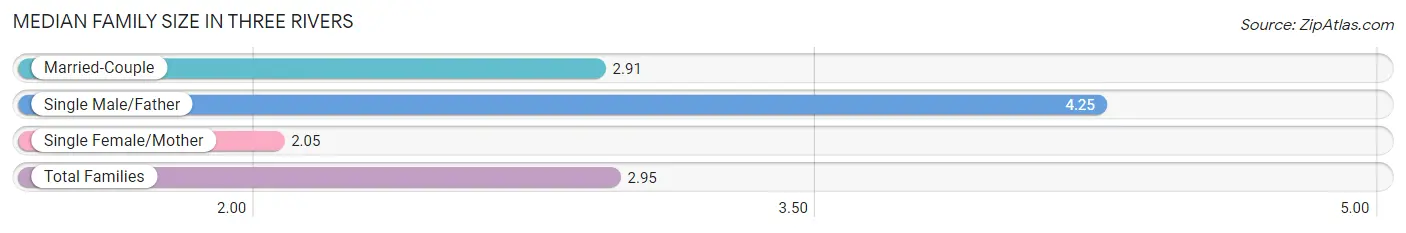
The median family size in Three Rivers is 2.95 persons per family, with single male/father families (36 | 8.8%) accounting for the largest median family size of 4.25 persons per family. On the other hand, single female/mother families (39 | 9.5%) represent the smallest median family size with 2.05 persons per family.
| Family Type | # Families | Family Size |
| Married-Couple | 334 (81.7%) | 2.91 |
| Single Male/Father | 36 (8.8%) | 4.25 |
| Single Female/Mother | 39 (9.5%) | 2.05 |
| Total Families | 409 (100.0%) | 2.95 |
Median Household Size in Three Rivers
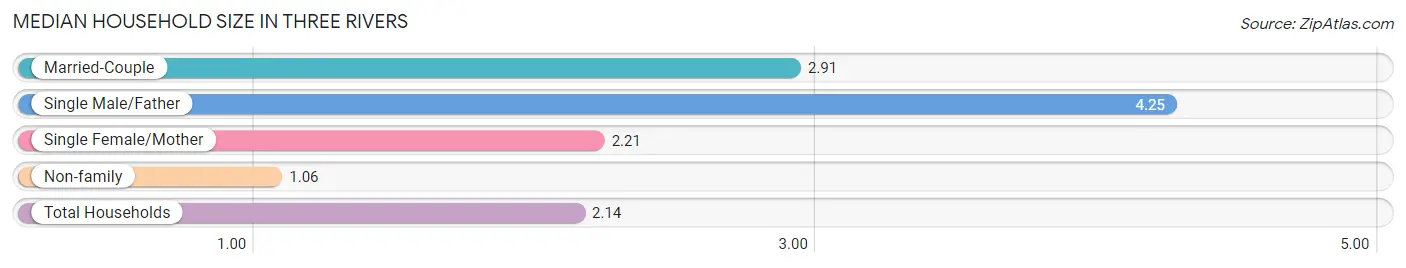
The median household size in Three Rivers is 2.14 persons per household, with single male/father households (36 | 5.0%) accounting for the largest median household size of 4.25 persons per household. non-family households (314 | 43.4%) represent the smallest median household size with 1.06 persons per household.
| Household Type | # Households | Household Size |
| Married-Couple | 334 (46.2%) | 2.91 |
| Single Male/Father | 36 (5.0%) | 4.25 |
| Single Female/Mother | 39 (5.4%) | 2.21 |
| Non-family | 314 (43.4%) | 1.06 |
| Total Households | 723 (100.0%) | 2.14 |
Household Size by Marriage Status in Three Rivers
Out of a total of 723 households in Three Rivers, 409 (56.6%) are family households, while 314 (43.4%) are nonfamily households. The most numerous type of family households are 2-person households, comprising 190, and the most common type of nonfamily households are 1-person households, comprising 233.
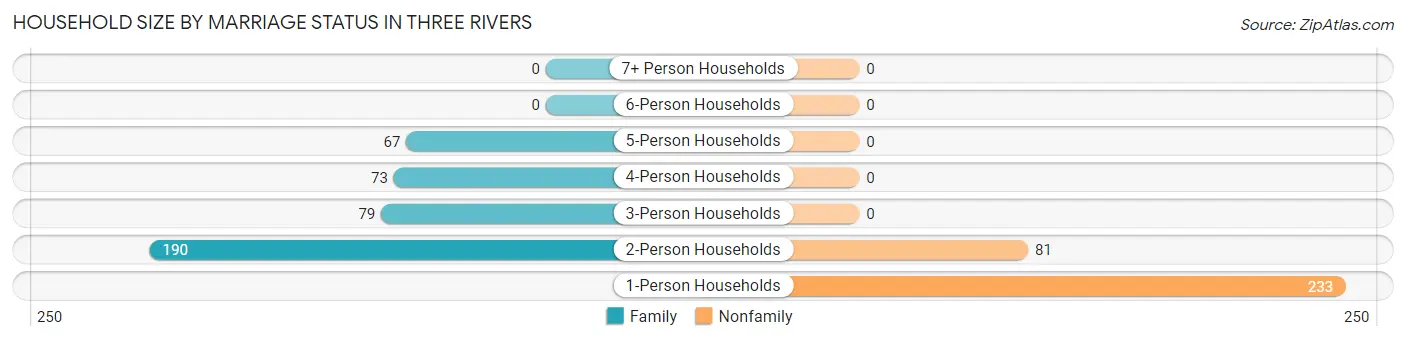
| Household Size | Family Households | Nonfamily Households |
| 1-Person Households | - | 233 (32.2%) |
| 2-Person Households | 190 (26.3%) | 81 (11.2%) |
| 3-Person Households | 79 (10.9%) | 0 (0.0%) |
| 4-Person Households | 73 (10.1%) | 0 (0.0%) |
| 5-Person Households | 67 (9.3%) | 0 (0.0%) |
| 6-Person Households | 0 (0.0%) | 0 (0.0%) |
| 7+ Person Households | 0 (0.0%) | 0 (0.0%) |
| Total | 409 (56.6%) | 314 (43.4%) |
Female Fertility in Three Rivers
Fertility by Age in Three Rivers
Average fertility rate in Three Rivers is 255.0 births per 1,000 women. Women in the age bracket of 20 to 34 years have the highest fertility rate with 487.0 births per 1,000 women. Women in the age bracket of 20 to 34 years acount for 81.0% of all women with births.
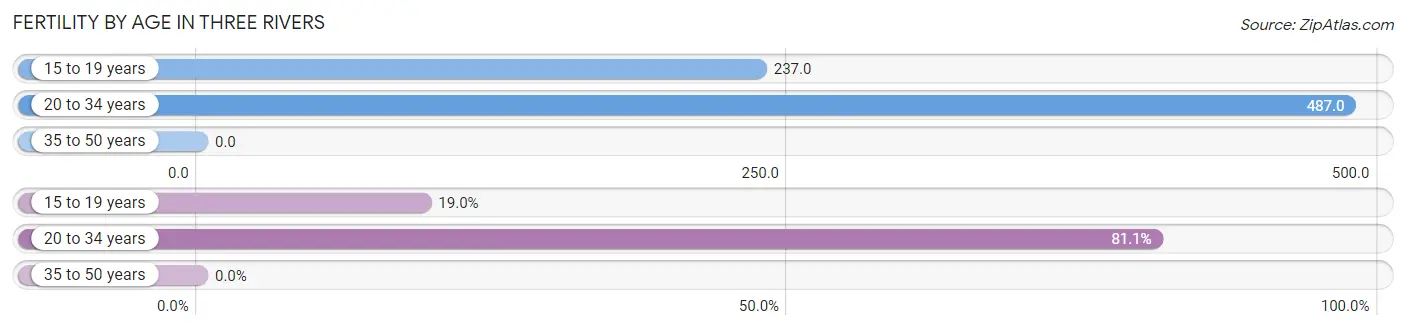
| Age Bracket | Women with Births | Births / 1,000 Women |
| 15 to 19 years | 18 (19.0%) | 237.0 |
| 20 to 34 years | 77 (81.0%) | 487.0 |
| 35 to 50 years | 0 (0.0%) | 0.0 |
| Total | 95 (100.0%) | 255.0 |
Fertility by Age by Marriage Status in Three Rivers
62.1% of women with births (95) in Three Rivers are married. The highest percentage of unmarried women with births falls into 15 to 19 years age bracket with 100.0% of them unmarried at the time of birth, while the lowest percentage of unmarried women with births belong to 20 to 34 years age bracket with 23.4% of them unmarried.
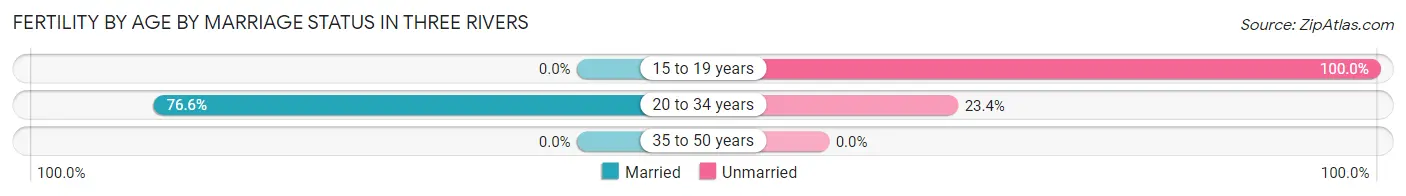
| Age Bracket | Married | Unmarried |
| 15 to 19 years | 0 (0.0%) | 18 (100.0%) |
| 20 to 34 years | 59 (76.6%) | 18 (23.4%) |
| 35 to 50 years | 0 (0.0%) | 0 (0.0%) |
| Total | 59 (62.1%) | 36 (37.9%) |
Fertility by Education in Three Rivers
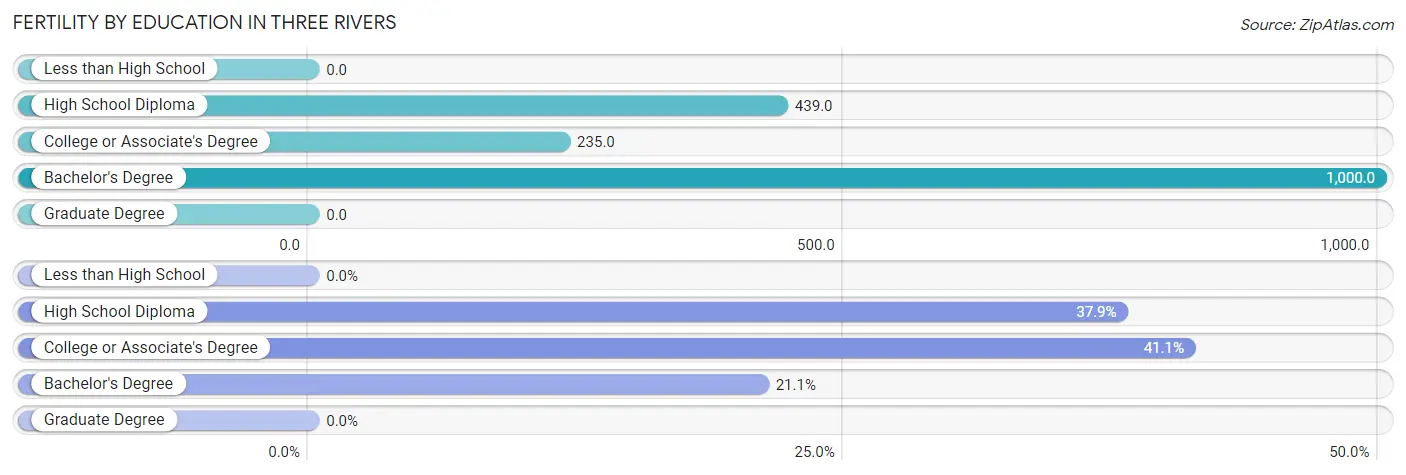
| Educational Attainment | Women with Births | Births / 1,000 Women |
| Less than High School | 0 (0.0%) | 0.0 |
| High School Diploma | 36 (37.9%) | 439.0 |
| College or Associate's Degree | 39 (41.0%) | 235.0 |
| Bachelor's Degree | 20 (21.0%) | 1,000.0 |
| Graduate Degree | 0 (0.0%) | 0.0 |
| Total | 95 (100.0%) | 255.0 |
Fertility by Education by Marriage Status in Three Rivers
37.9% of women with births in Three Rivers are unmarried. Women with the educational attainment of college or associate's degree are most likely to be married with 100.0% of them married at childbirth, while women with the educational attainment of high school diploma are least likely to be married with 100.0% of them unmarried at childbirth.
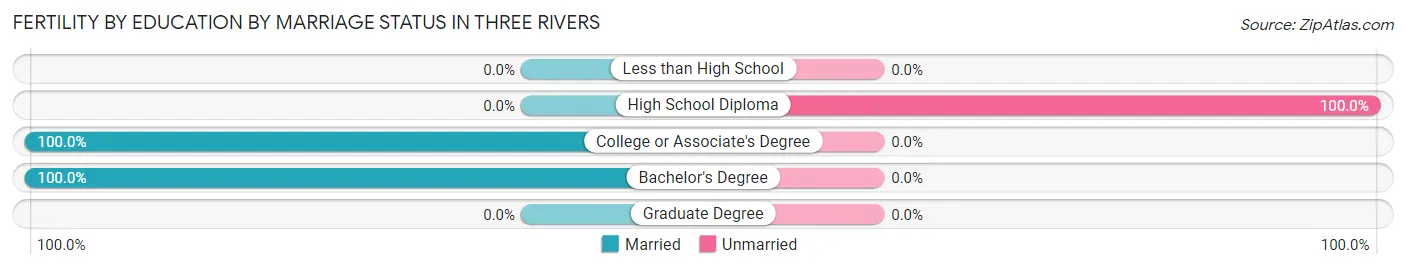
| Educational Attainment | Married | Unmarried |
| Less than High School | 0 (0.0%) | 0 (0.0%) |
| High School Diploma | 0 (0.0%) | 36 (100.0%) |
| College or Associate's Degree | 39 (100.0%) | 0 (0.0%) |
| Bachelor's Degree | 20 (100.0%) | 0 (0.0%) |
| Graduate Degree | 0 (0.0%) | 0 (0.0%) |
| Total | 59 (62.1%) | 36 (37.9%) |
Employment Characteristics in Three Rivers
Employment by Class of Employer in Three Rivers
Among the 479 employed individuals in Three Rivers, private company employees (427 | 89.1%), self-employed (incorporated) (39 | 8.1%), and local government employees (9 | 1.9%) make up the most common classes of employment.
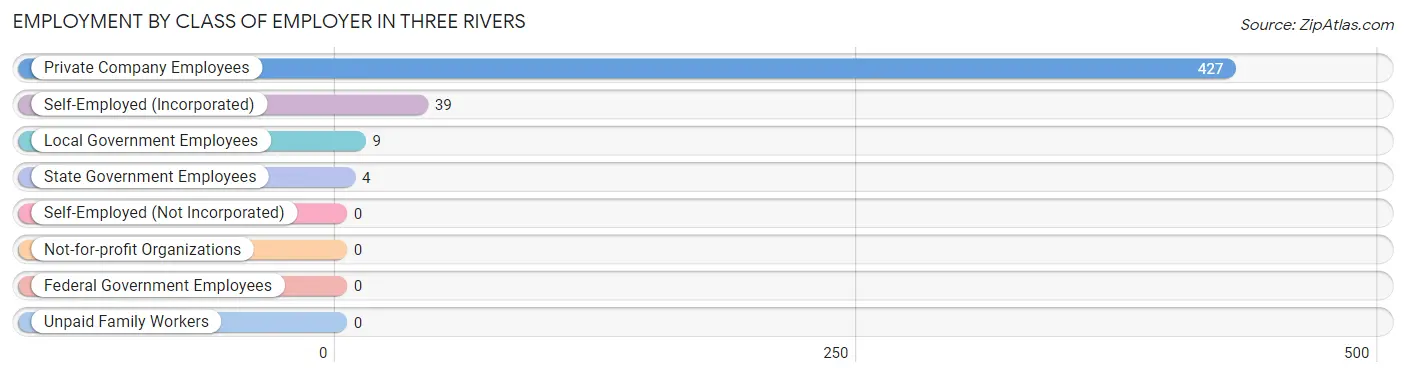
| Employer Class | # Employees | % Employees |
| Private Company Employees | 427 | 89.1% |
| Self-Employed (Incorporated) | 39 | 8.1% |
| Self-Employed (Not Incorporated) | 0 | 0.0% |
| Not-for-profit Organizations | 0 | 0.0% |
| Local Government Employees | 9 | 1.9% |
| State Government Employees | 4 | 0.8% |
| Federal Government Employees | 0 | 0.0% |
| Unpaid Family Workers | 0 | 0.0% |
| Total | 479 | 100.0% |
Employment Status by Age in Three Rivers
According to the labor force statistics for Three Rivers, out of the total population over 16 years of age (1,224), 43.8% or 536 individuals are in the labor force, with 10.6% or 57 of them unemployed. The age group with the highest labor force participation rate is 35 to 44 years, with 80.3% or 106 individuals in the labor force. Within the labor force, the 16 to 19 years age range has the highest percentage of unemployed individuals, with 41.9% or 13 of them being unemployed.
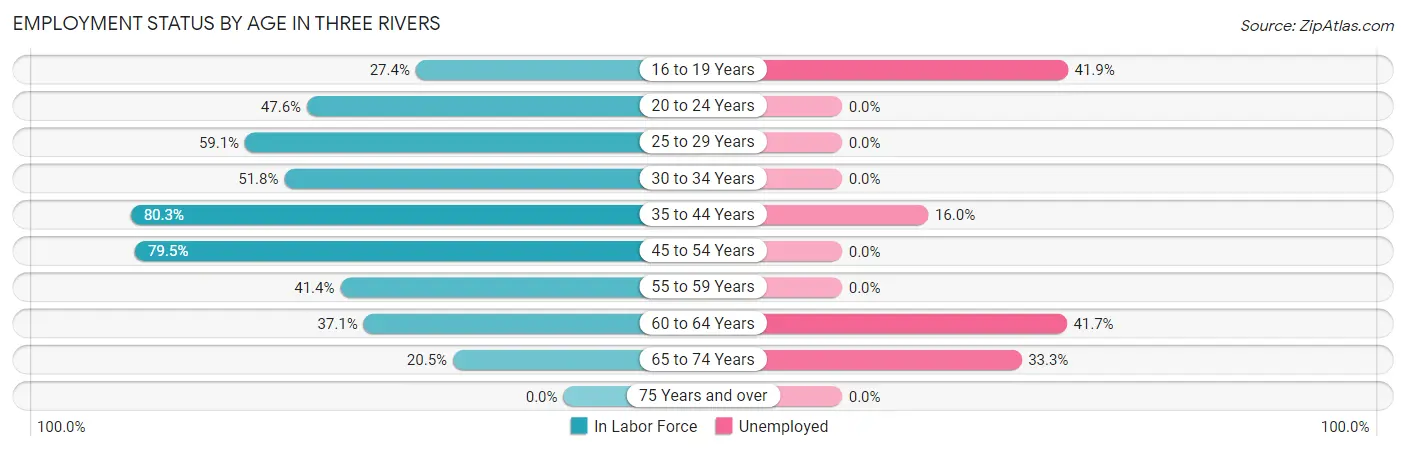
| Age Bracket | In Labor Force | Unemployed |
| 16 to 19 Years | 31 (27.4%) | 13 (41.9%) |
| 20 to 24 Years | 30 (47.6%) | 0 (0.0%) |
| 25 to 29 Years | 97 (59.1%) | 0 (0.0%) |
| 30 to 34 Years | 44 (51.8%) | 0 (0.0%) |
| 35 to 44 Years | 106 (80.3%) | 17 (16.0%) |
| 45 to 54 Years | 101 (79.5%) | 0 (0.0%) |
| 55 to 59 Years | 55 (41.4%) | 0 (0.0%) |
| 60 to 64 Years | 36 (37.1%) | 15 (41.7%) |
| 65 to 74 Years | 36 (20.5%) | 12 (33.3%) |
| 75 Years and over | 0 (0.0%) | 0 (0.0%) |
| Total | 536 (43.8%) | 57 (10.6%) |
Employment Status by Educational Attainment in Three Rivers
According to labor force statistics for Three Rivers, 59.5% of individuals (439) out of the total population between 25 and 64 years of age (738) are in the labor force, with 7.3% or 32 of them being unemployed. The group with the highest labor force participation rate are those with the educational attainment of college / associate degree, with 68.4% or 206 individuals in the labor force. Within the labor force, individuals with high school diploma education have the highest percentage of unemployment, with 20.1% or 32 of them being unemployed.
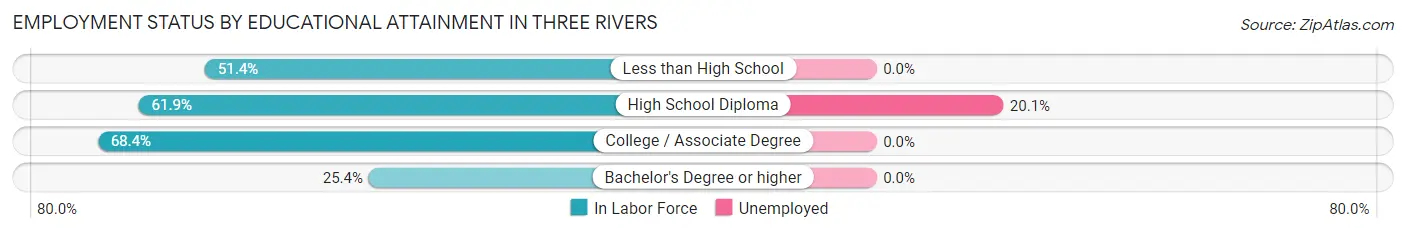
| Educational Attainment | In Labor Force | Unemployed |
| Less than High School | 56 (51.4%) | 0 (0.0%) |
| High School Diploma | 159 (61.9%) | 52 (20.1%) |
| College / Associate Degree | 206 (68.4%) | 0 (0.0%) |
| Bachelor's Degree or higher | 18 (25.4%) | 0 (0.0%) |
| Total | 439 (59.5%) | 54 (7.3%) |
Employment Occupations by Sex in Three Rivers
Management, Business, Science and Arts Occupations
The most common Management, Business, Science and Arts occupations in Three Rivers are Management (29 | 6.0%), Computers, Engineering & Science (19 | 4.0%), and Architecture & Engineering (19 | 4.0%).
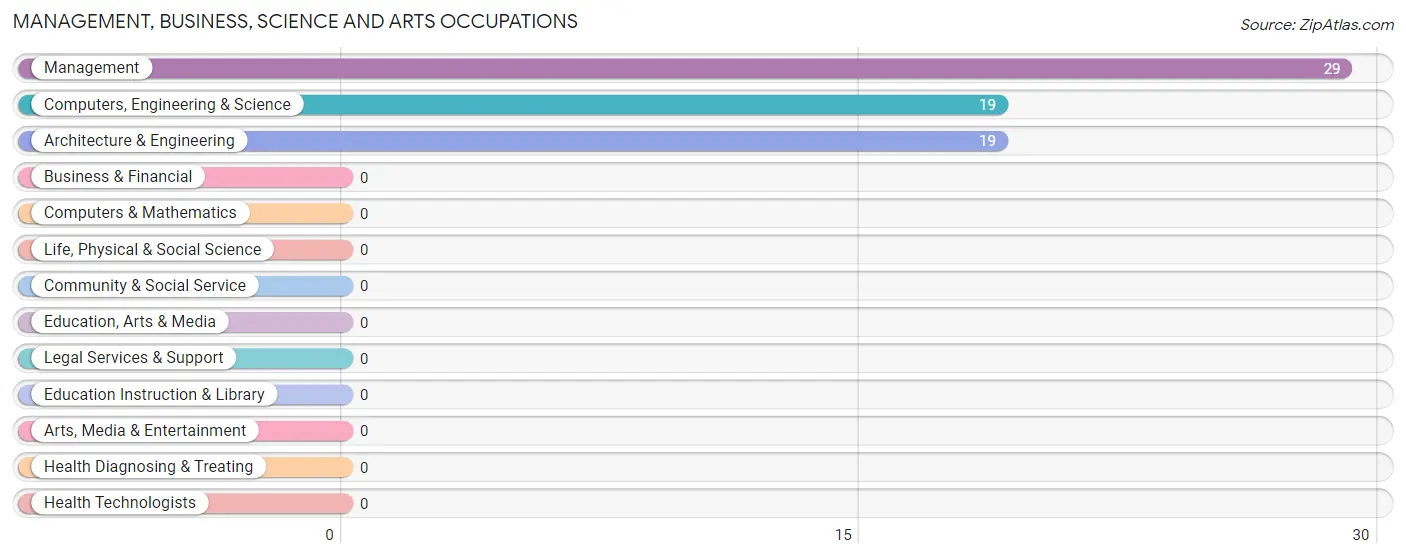
Management, Business, Science and Arts Occupations by Sex
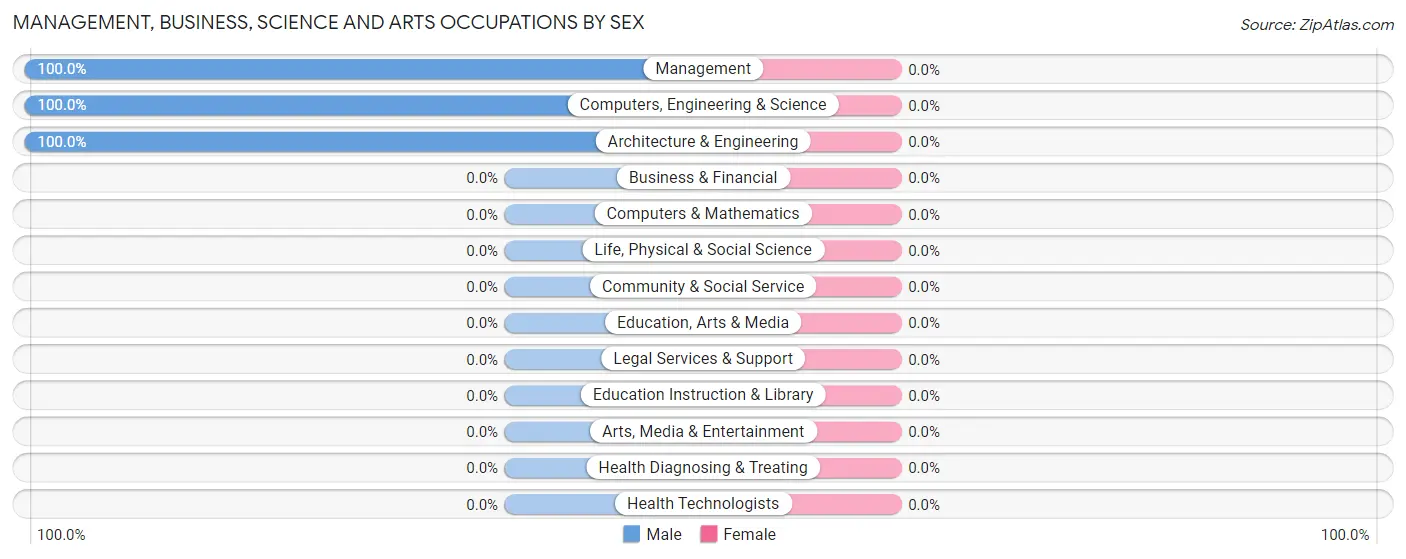
| Occupation | Male | Female |
| Management | 29 (100.0%) | 0 (0.0%) |
| Business & Financial | 0 (0.0%) | 0 (0.0%) |
| Computers, Engineering & Science | 19 (100.0%) | 0 (0.0%) |
| Computers & Mathematics | 0 (0.0%) | 0 (0.0%) |
| Architecture & Engineering | 19 (100.0%) | 0 (0.0%) |
| Life, Physical & Social Science | 0 (0.0%) | 0 (0.0%) |
| Community & Social Service | 0 (0.0%) | 0 (0.0%) |
| Education, Arts & Media | 0 (0.0%) | 0 (0.0%) |
| Legal Services & Support | 0 (0.0%) | 0 (0.0%) |
| Education Instruction & Library | 0 (0.0%) | 0 (0.0%) |
| Arts, Media & Entertainment | 0 (0.0%) | 0 (0.0%) |
| Health Diagnosing & Treating | 0 (0.0%) | 0 (0.0%) |
| Health Technologists | 0 (0.0%) | 0 (0.0%) |
| Total (Category) | 48 (100.0%) | 0 (0.0%) |
| Total (Overall) | 269 (56.2%) | 210 (43.8%) |
Services Occupations
The most common Services occupations in Three Rivers are Healthcare Support (34 | 7.1%), Food Preparation & Serving (17 | 3.5%), and Cleaning & Maintenance (9 | 1.9%).
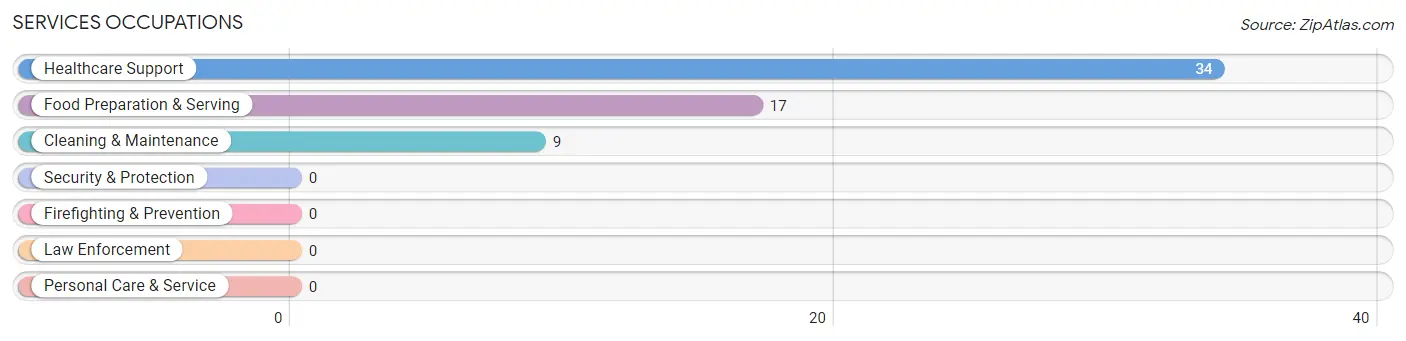
Services Occupations by Sex
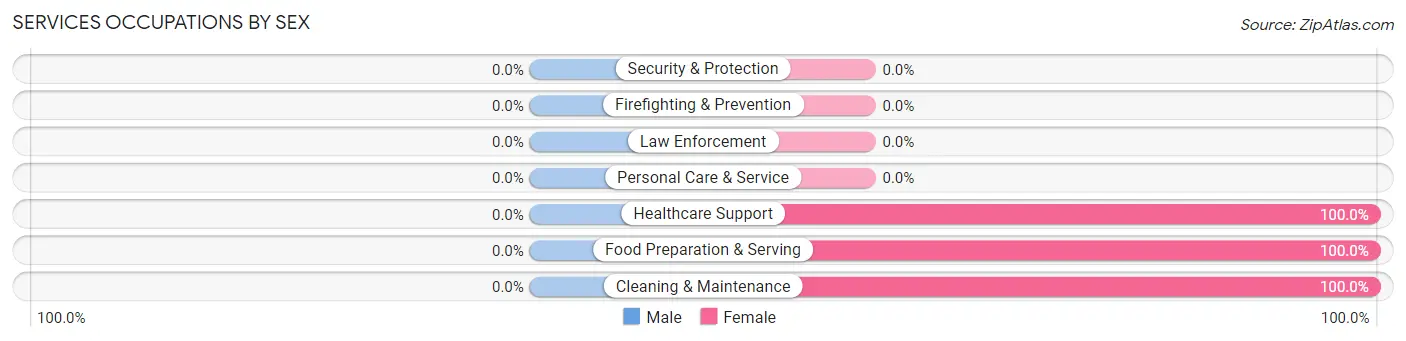
| Occupation | Male | Female |
| Healthcare Support | 0 (0.0%) | 34 (100.0%) |
| Security & Protection | 0 (0.0%) | 0 (0.0%) |
| Firefighting & Prevention | 0 (0.0%) | 0 (0.0%) |
| Law Enforcement | 0 (0.0%) | 0 (0.0%) |
| Food Preparation & Serving | 0 (0.0%) | 17 (100.0%) |
| Cleaning & Maintenance | 0 (0.0%) | 9 (100.0%) |
| Personal Care & Service | 0 (0.0%) | 0 (0.0%) |
| Total (Category) | 0 (0.0%) | 60 (100.0%) |
| Total (Overall) | 269 (56.2%) | 210 (43.8%) |
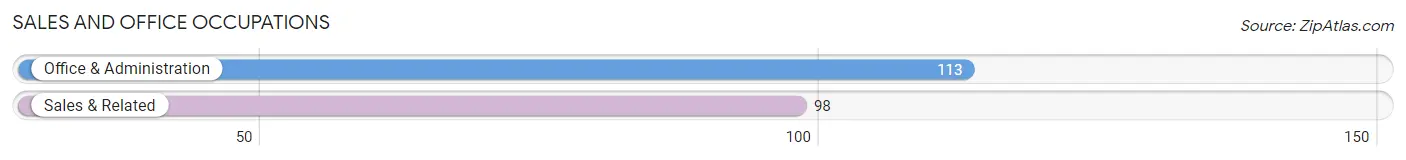
Sales and Office Occupations
The most common Sales and Office occupations in Three Rivers are Office & Administration (113 | 23.6%), and Sales & Related (98 | 20.5%).
Sales and Office Occupations by Sex
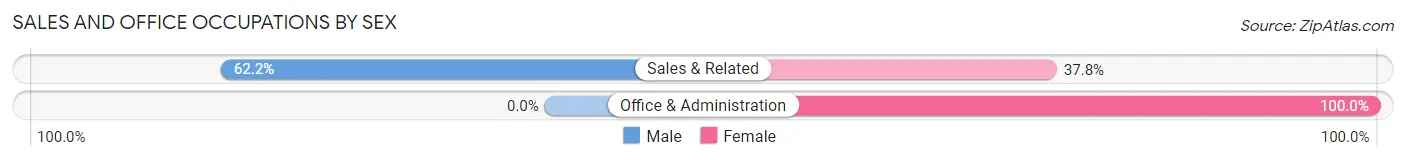
| Occupation | Male | Female |
| Sales & Related | 61 (62.2%) | 37 (37.8%) |
| Office & Administration | 0 (0.0%) | 113 (100.0%) |
| Total (Category) | 61 (28.9%) | 150 (71.1%) |
| Total (Overall) | 269 (56.2%) | 210 (43.8%) |
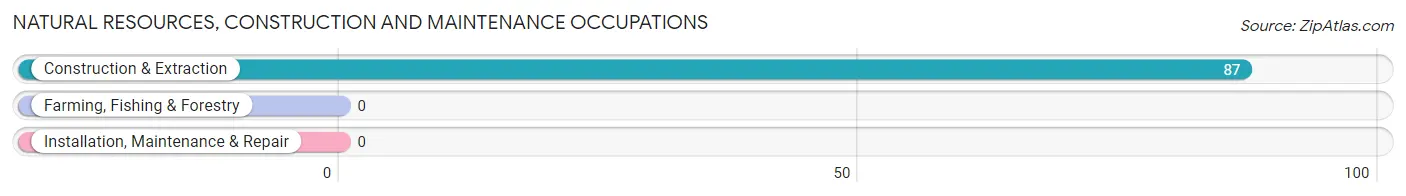
Natural Resources, Construction and Maintenance Occupations
The most common Natural Resources, Construction and Maintenance occupations in Three Rivers are , and Construction & Extraction (87 | 18.2%).
Natural Resources, Construction and Maintenance Occupations by Sex
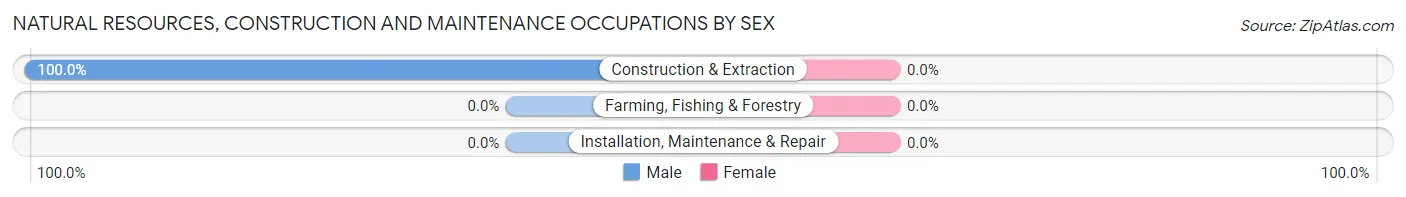
| Occupation | Male | Female |
| Farming, Fishing & Forestry | 0 (0.0%) | 0 (0.0%) |
| Construction & Extraction | 87 (100.0%) | 0 (0.0%) |
| Installation, Maintenance & Repair | 0 (0.0%) | 0 (0.0%) |
| Total (Category) | 87 (100.0%) | 0 (0.0%) |
| Total (Overall) | 269 (56.2%) | 210 (43.8%) |
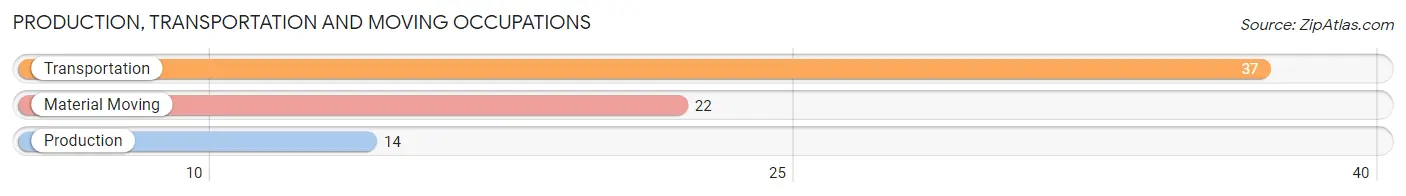
Production, Transportation and Moving Occupations
The most common Production, Transportation and Moving occupations in Three Rivers are Transportation (37 | 7.7%), Material Moving (22 | 4.6%), and Production (14 | 2.9%).
Production, Transportation and Moving Occupations by Sex
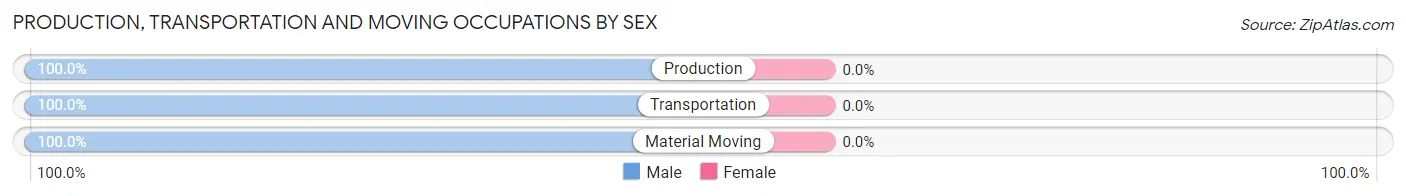
| Occupation | Male | Female |
| Production | 14 (100.0%) | 0 (0.0%) |
| Transportation | 37 (100.0%) | 0 (0.0%) |
| Material Moving | 22 (100.0%) | 0 (0.0%) |
| Total (Category) | 73 (100.0%) | 0 (0.0%) |
| Total (Overall) | 269 (56.2%) | 210 (43.8%) |
Employment Industries by Sex in Three Rivers
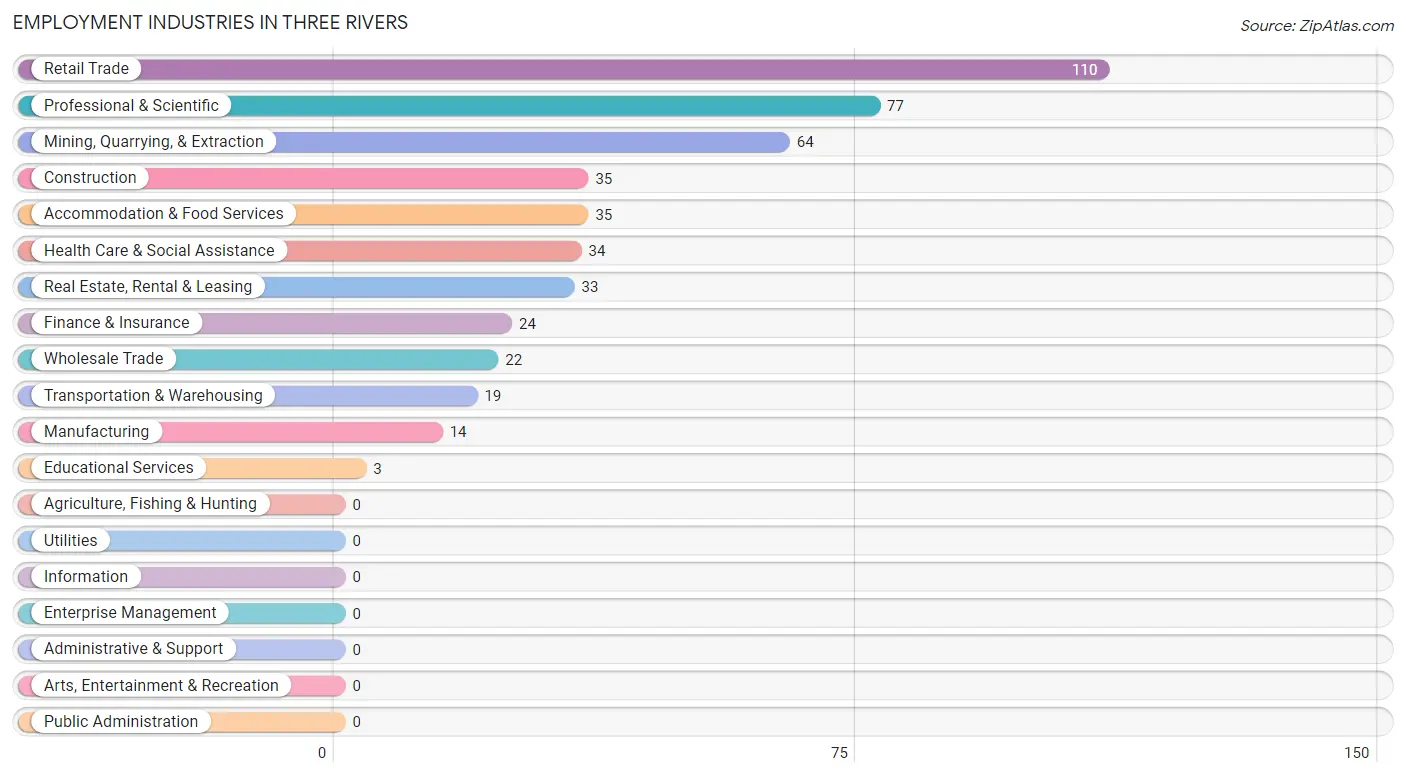
Employment Industries in Three Rivers
The major employment industries in Three Rivers include Retail Trade (110 | 23.0%), Professional & Scientific (77 | 16.1%), Mining, Quarrying, & Extraction (64 | 13.4%), Construction (35 | 7.3%), and Accommodation & Food Services (35 | 7.3%).
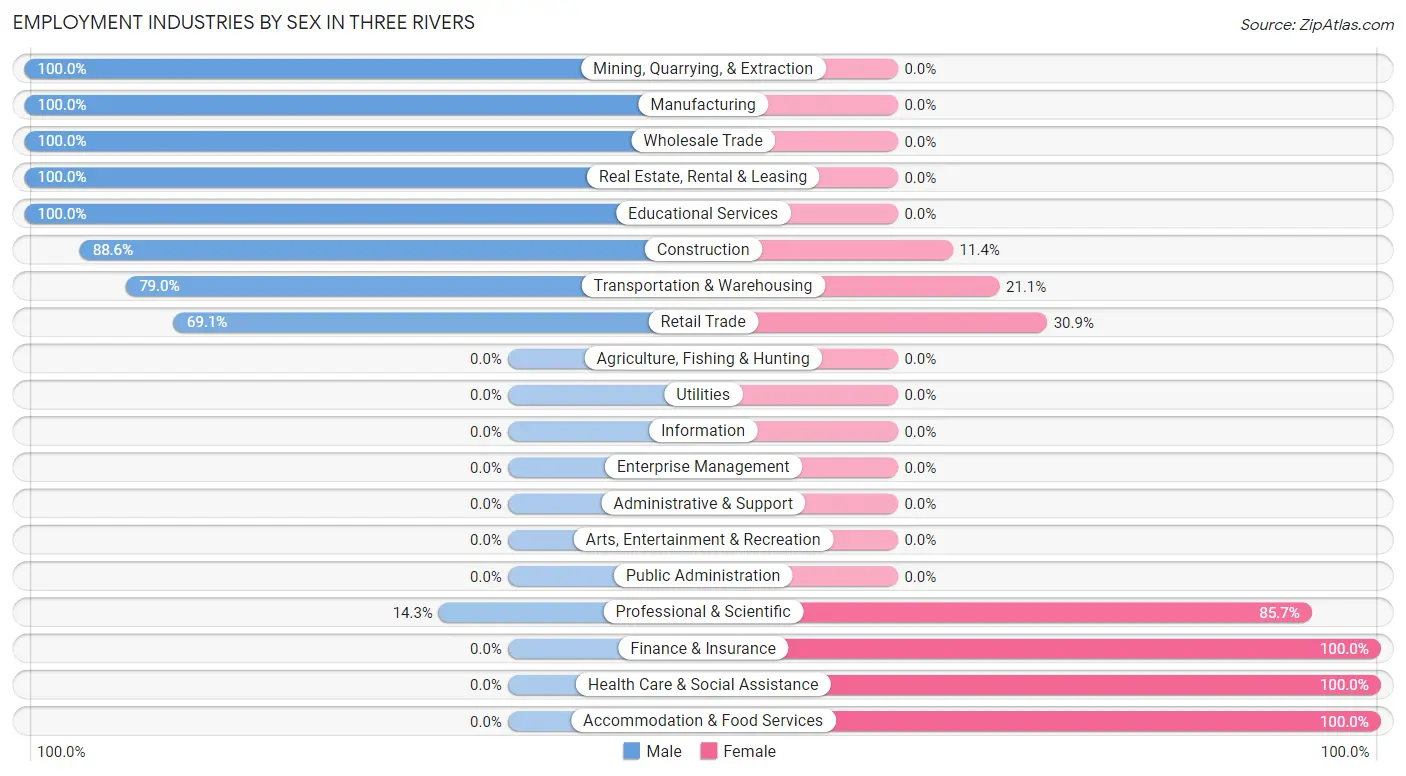
Employment Industries by Sex in Three Rivers
The Three Rivers industries that see more men than women are Mining, Quarrying, & Extraction (100.0%), Manufacturing (100.0%), and Wholesale Trade (100.0%), whereas the industries that tend to have a higher number of women are Finance & Insurance (100.0%), Health Care & Social Assistance (100.0%), and Accommodation & Food Services (100.0%).
| Industry | Male | Female |
| Agriculture, Fishing & Hunting | 0 (0.0%) | 0 (0.0%) |
| Mining, Quarrying, & Extraction | 64 (100.0%) | 0 (0.0%) |
| Construction | 31 (88.6%) | 4 (11.4%) |
| Manufacturing | 14 (100.0%) | 0 (0.0%) |
| Wholesale Trade | 22 (100.0%) | 0 (0.0%) |
| Retail Trade | 76 (69.1%) | 34 (30.9%) |
| Transportation & Warehousing | 15 (78.9%) | 4 (21.0%) |
| Utilities | 0 (0.0%) | 0 (0.0%) |
| Information | 0 (0.0%) | 0 (0.0%) |
| Finance & Insurance | 0 (0.0%) | 24 (100.0%) |
| Real Estate, Rental & Leasing | 33 (100.0%) | 0 (0.0%) |
| Professional & Scientific | 11 (14.3%) | 66 (85.7%) |
| Enterprise Management | 0 (0.0%) | 0 (0.0%) |
| Administrative & Support | 0 (0.0%) | 0 (0.0%) |
| Educational Services | 3 (100.0%) | 0 (0.0%) |
| Health Care & Social Assistance | 0 (0.0%) | 34 (100.0%) |
| Arts, Entertainment & Recreation | 0 (0.0%) | 0 (0.0%) |
| Accommodation & Food Services | 0 (0.0%) | 35 (100.0%) |
| Public Administration | 0 (0.0%) | 0 (0.0%) |
| Total | 269 (56.2%) | 210 (43.8%) |
Education in Three Rivers
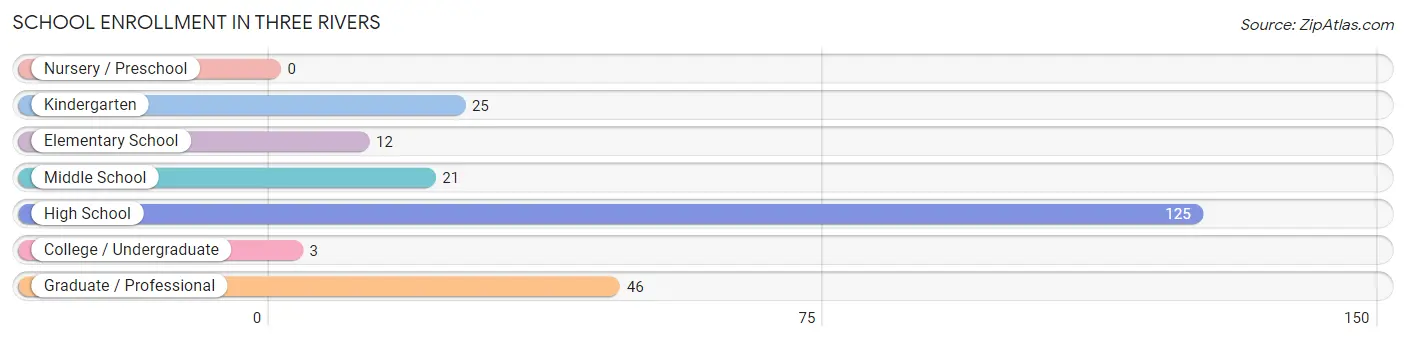
School Enrollment in Three Rivers
The most common levels of schooling among the 232 students in Three Rivers are high school (125 | 53.9%), graduate / professional (46 | 19.8%), and kindergarten (25 | 10.8%).
| School Level | # Students | % Students |
| Nursery / Preschool | 0 | 0.0% |
| Kindergarten | 25 | 10.8% |
| Elementary School | 12 | 5.2% |
| Middle School | 21 | 9.0% |
| High School | 125 | 53.9% |
| College / Undergraduate | 3 | 1.3% |
| Graduate / Professional | 46 | 19.8% |
| Total | 232 | 100.0% |
School Enrollment by Age by Funding Source in Three Rivers
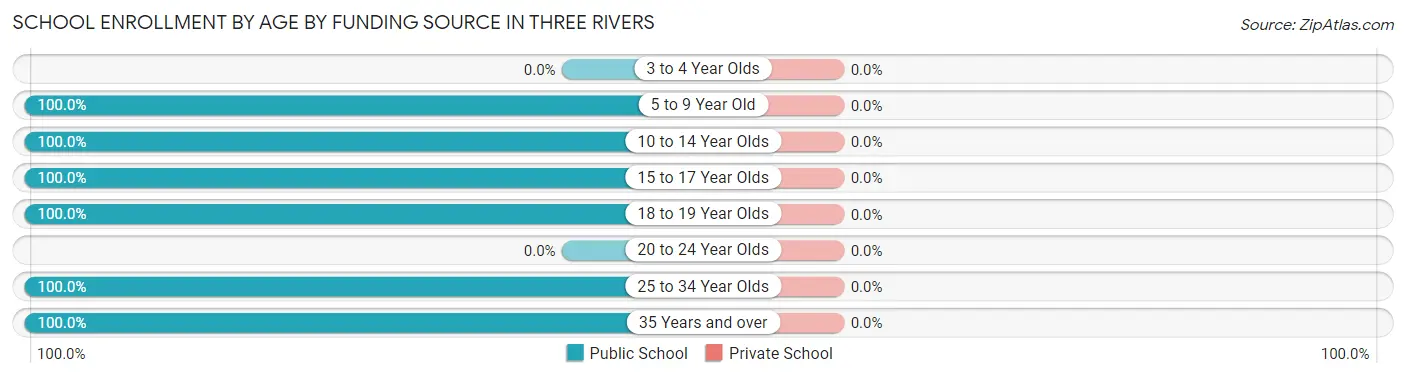
| Age Bracket | Public School | Private School |
| 3 to 4 Year Olds | 0 (0.0%) | 0 (0.0%) |
| 5 to 9 Year Old | 37 (100.0%) | 0 (0.0%) |
| 10 to 14 Year Olds | 62 (100.0%) | 0 (0.0%) |
| 15 to 17 Year Olds | 60 (100.0%) | 0 (0.0%) |
| 18 to 19 Year Olds | 3 (100.0%) | 0 (0.0%) |
| 20 to 24 Year Olds | 0 (0.0%) | 0 (0.0%) |
| 25 to 34 Year Olds | 68 (100.0%) | 0 (0.0%) |
| 35 Years and over | 2 (100.0%) | 0 (0.0%) |
| Total | 232 (100.0%) | 0 (0.0%) |
Educational Attainment by Field of Study in Three Rivers
Liberal arts & history (30 | 28.6%), communications (23 | 21.9%), psychology (22 | 20.9%), education (20 | 19.1%), and business (10 | 9.5%) are the most common fields of study among 105 individuals in Three Rivers who have obtained a bachelor's degree or higher.
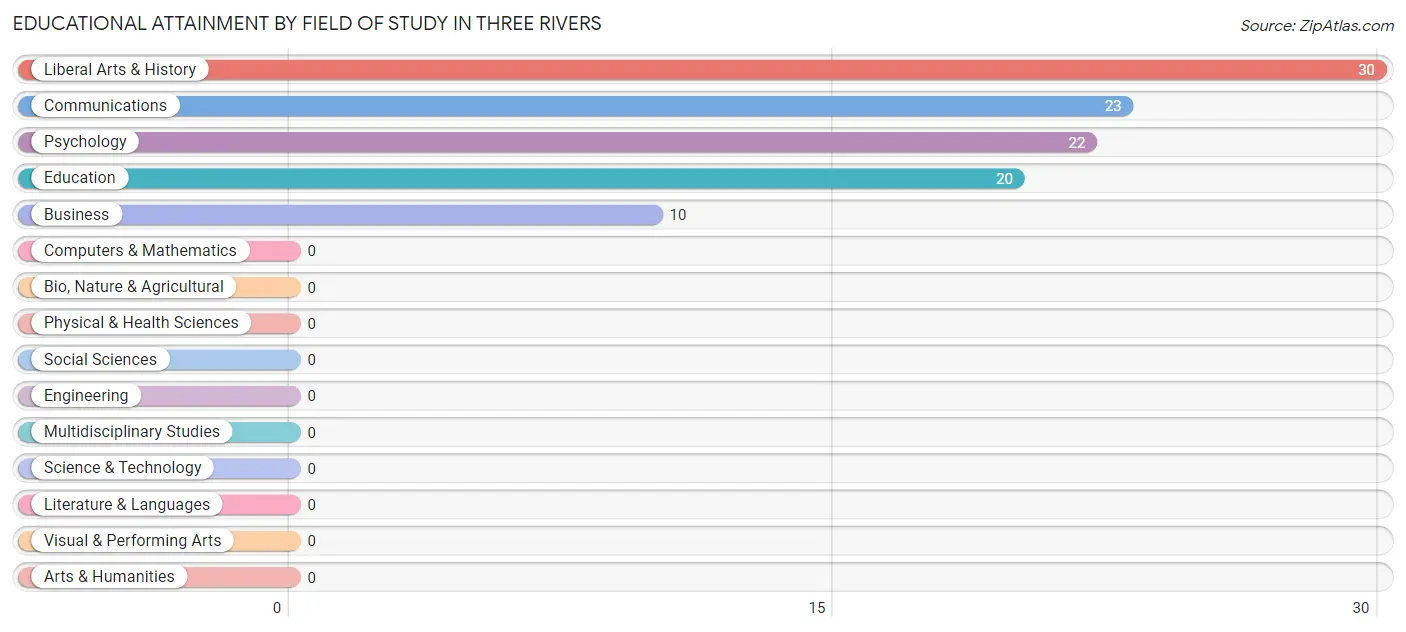
| Field of Study | # Graduates | % Graduates |
| Computers & Mathematics | 0 | 0.0% |
| Bio, Nature & Agricultural | 0 | 0.0% |
| Physical & Health Sciences | 0 | 0.0% |
| Psychology | 22 | 20.9% |
| Social Sciences | 0 | 0.0% |
| Engineering | 0 | 0.0% |
| Multidisciplinary Studies | 0 | 0.0% |
| Science & Technology | 0 | 0.0% |
| Business | 10 | 9.5% |
| Education | 20 | 19.1% |
| Literature & Languages | 0 | 0.0% |
| Liberal Arts & History | 30 | 28.6% |
| Visual & Performing Arts | 0 | 0.0% |
| Communications | 23 | 21.9% |
| Arts & Humanities | 0 | 0.0% |
| Total | 105 | 100.0% |
Transportation & Commute in Three Rivers
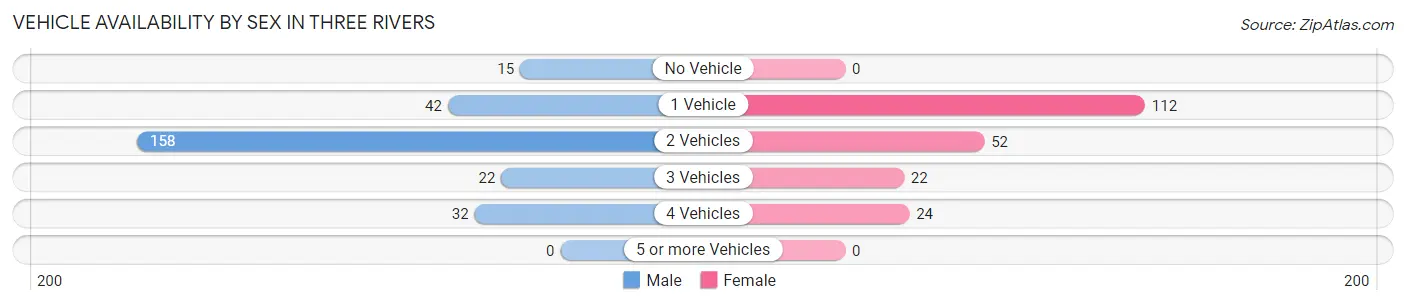
Vehicle Availability by Sex in Three Rivers
The most prevalent vehicle ownership categories in Three Rivers are males with 2 vehicles (158, accounting for 58.7%) and females with 2 vehicles (52, making up 75.2%).
| Vehicles Available | Male | Female |
| No Vehicle | 15 (5.6%) | 0 (0.0%) |
| 1 Vehicle | 42 (15.6%) | 112 (53.3%) |
| 2 Vehicles | 158 (58.7%) | 52 (24.8%) |
| 3 Vehicles | 22 (8.2%) | 22 (10.5%) |
| 4 Vehicles | 32 (11.9%) | 24 (11.4%) |
| 5 or more Vehicles | 0 (0.0%) | 0 (0.0%) |
| Total | 269 (100.0%) | 210 (100.0%) |
Commute Time in Three Rivers
The most frequently occuring commute durations in Three Rivers are 5 to 9 minutes (109 commuters, 26.4%), less than 5 minutes (98 commuters, 23.7%), and 45 to 59 minutes (59 commuters, 14.3%).
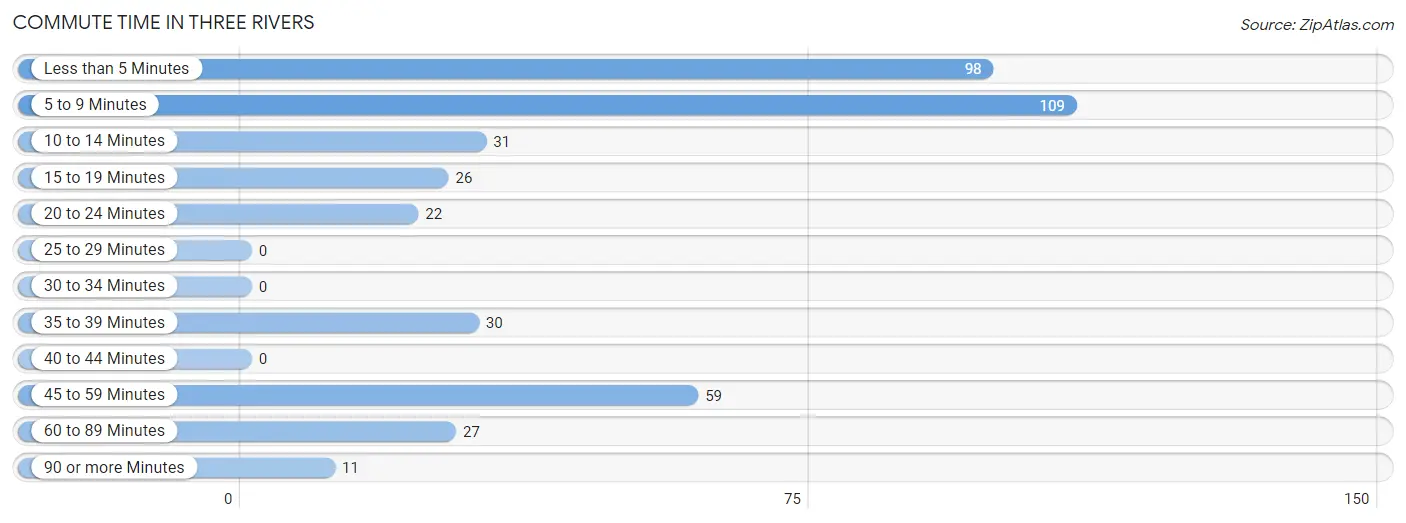
| Commute Time | # Commuters | % Commuters |
| Less than 5 Minutes | 98 | 23.7% |
| 5 to 9 Minutes | 109 | 26.4% |
| 10 to 14 Minutes | 31 | 7.5% |
| 15 to 19 Minutes | 26 | 6.3% |
| 20 to 24 Minutes | 22 | 5.3% |
| 25 to 29 Minutes | 0 | 0.0% |
| 30 to 34 Minutes | 0 | 0.0% |
| 35 to 39 Minutes | 30 | 7.3% |
| 40 to 44 Minutes | 0 | 0.0% |
| 45 to 59 Minutes | 59 | 14.3% |
| 60 to 89 Minutes | 27 | 6.5% |
| 90 or more Minutes | 11 | 2.7% |
Commute Time by Sex in Three Rivers
The most common commute times in Three Rivers are 5 to 9 minutes (90 commuters, 33.5%) for males and less than 5 minutes (80 commuters, 55.6%) for females.
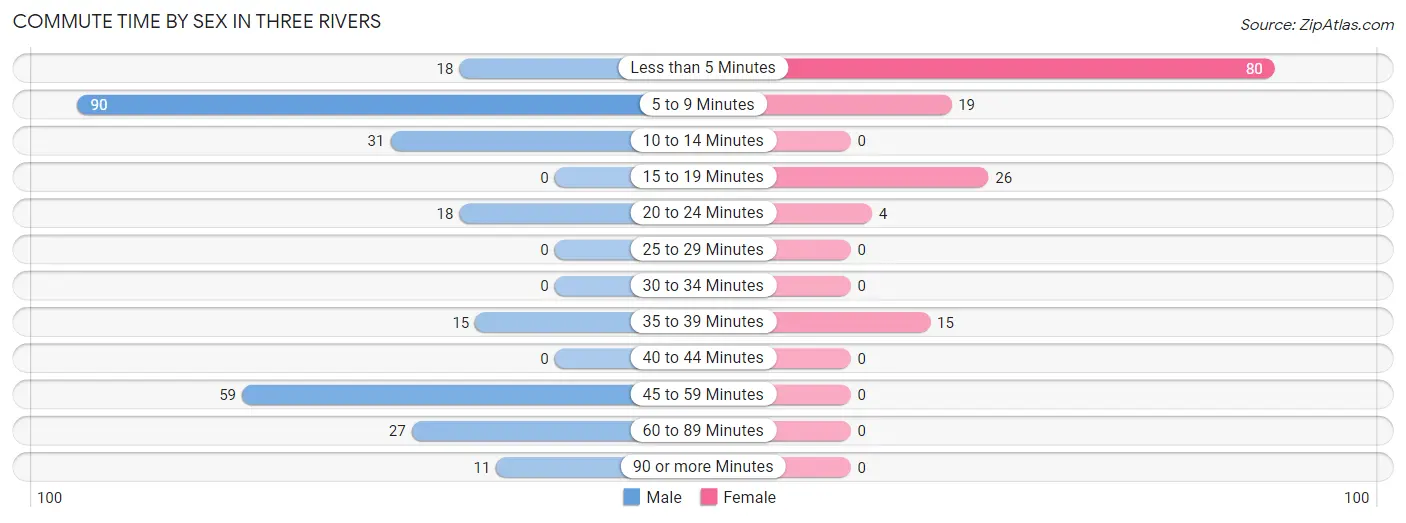
| Commute Time | Male | Female |
| Less than 5 Minutes | 18 (6.7%) | 80 (55.6%) |
| 5 to 9 Minutes | 90 (33.5%) | 19 (13.2%) |
| 10 to 14 Minutes | 31 (11.5%) | 0 (0.0%) |
| 15 to 19 Minutes | 0 (0.0%) | 26 (18.1%) |
| 20 to 24 Minutes | 18 (6.7%) | 4 (2.8%) |
| 25 to 29 Minutes | 0 (0.0%) | 0 (0.0%) |
| 30 to 34 Minutes | 0 (0.0%) | 0 (0.0%) |
| 35 to 39 Minutes | 15 (5.6%) | 15 (10.4%) |
| 40 to 44 Minutes | 0 (0.0%) | 0 (0.0%) |
| 45 to 59 Minutes | 59 (21.9%) | 0 (0.0%) |
| 60 to 89 Minutes | 27 (10.0%) | 0 (0.0%) |
| 90 or more Minutes | 11 (4.1%) | 0 (0.0%) |
Time of Departure to Work by Sex in Three Rivers
The most frequent times of departure to work in Three Rivers are 6:00 AM to 6:29 AM (70, 26.0%) for males and 9:00 AM to 9:59 AM (34, 23.6%) for females.
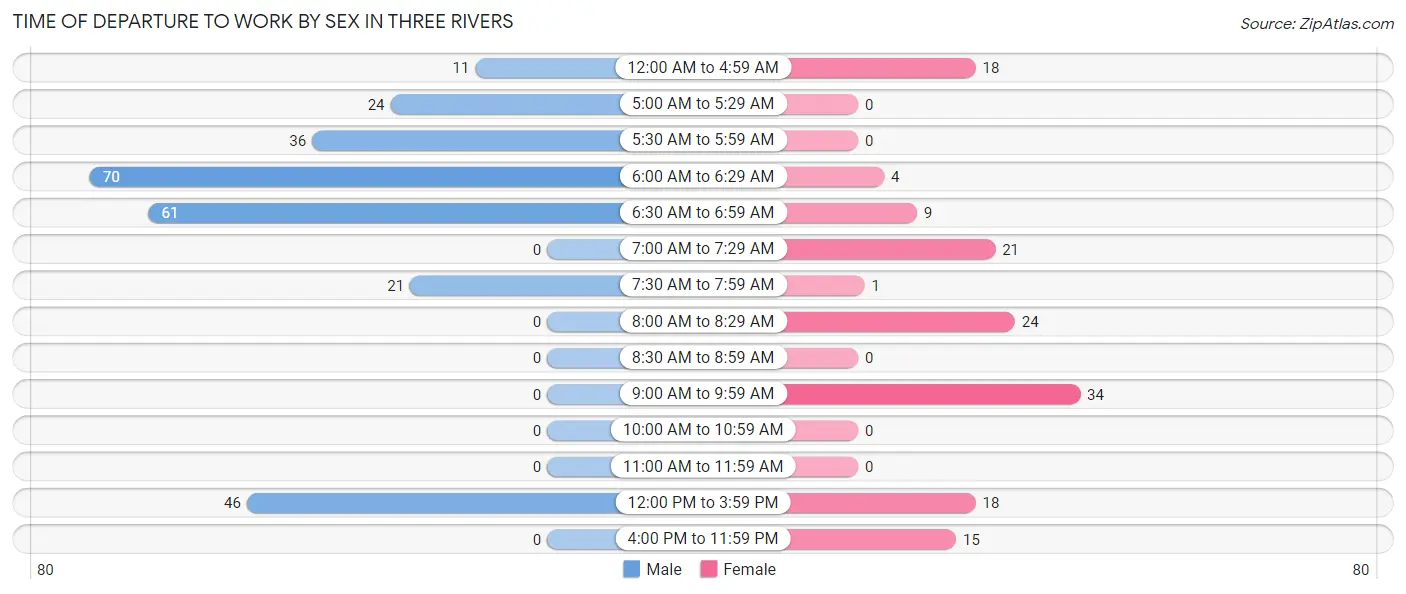
| Time of Departure | Male | Female |
| 12:00 AM to 4:59 AM | 11 (4.1%) | 18 (12.5%) |
| 5:00 AM to 5:29 AM | 24 (8.9%) | 0 (0.0%) |
| 5:30 AM to 5:59 AM | 36 (13.4%) | 0 (0.0%) |
| 6:00 AM to 6:29 AM | 70 (26.0%) | 4 (2.8%) |
| 6:30 AM to 6:59 AM | 61 (22.7%) | 9 (6.2%) |
| 7:00 AM to 7:29 AM | 0 (0.0%) | 21 (14.6%) |
| 7:30 AM to 7:59 AM | 21 (7.8%) | 1 (0.7%) |
| 8:00 AM to 8:29 AM | 0 (0.0%) | 24 (16.7%) |
| 8:30 AM to 8:59 AM | 0 (0.0%) | 0 (0.0%) |
| 9:00 AM to 9:59 AM | 0 (0.0%) | 34 (23.6%) |
| 10:00 AM to 10:59 AM | 0 (0.0%) | 0 (0.0%) |
| 11:00 AM to 11:59 AM | 0 (0.0%) | 0 (0.0%) |
| 12:00 PM to 3:59 PM | 46 (17.1%) | 18 (12.5%) |
| 4:00 PM to 11:59 PM | 0 (0.0%) | 15 (10.4%) |
| Total | 269 (100.0%) | 144 (100.0%) |
Housing Occupancy in Three Rivers
Occupancy by Ownership in Three Rivers
Of the total 723 dwellings in Three Rivers, owner-occupied units account for 399 (55.2%), while renter-occupied units make up 324 (44.8%).
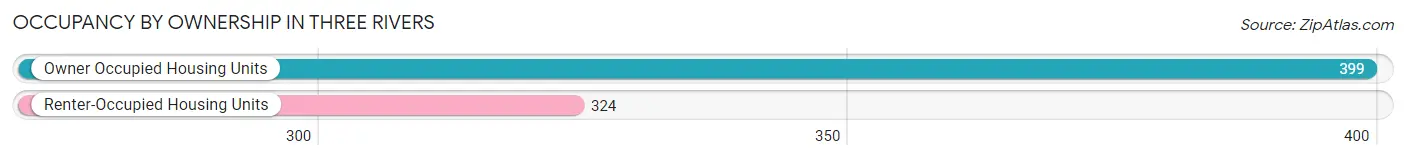
| Occupancy | # Housing Units | % Housing Units |
| Owner Occupied Housing Units | 399 | 55.2% |
| Renter-Occupied Housing Units | 324 | 44.8% |
| Total Occupied Housing Units | 723 | 100.0% |
Occupancy by Household Size in Three Rivers
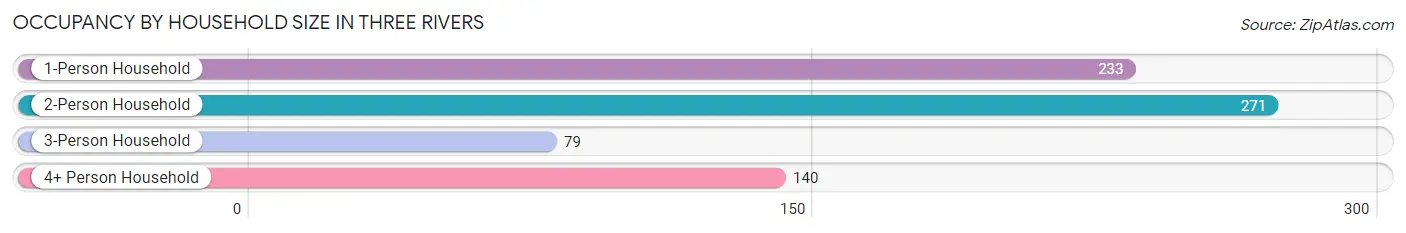
| Household Size | # Housing Units | % Housing Units |
| 1-Person Household | 233 | 32.2% |
| 2-Person Household | 271 | 37.5% |
| 3-Person Household | 79 | 10.9% |
| 4+ Person Household | 140 | 19.4% |
| Total Housing Units | 723 | 100.0% |
Occupancy by Ownership by Household Size in Three Rivers
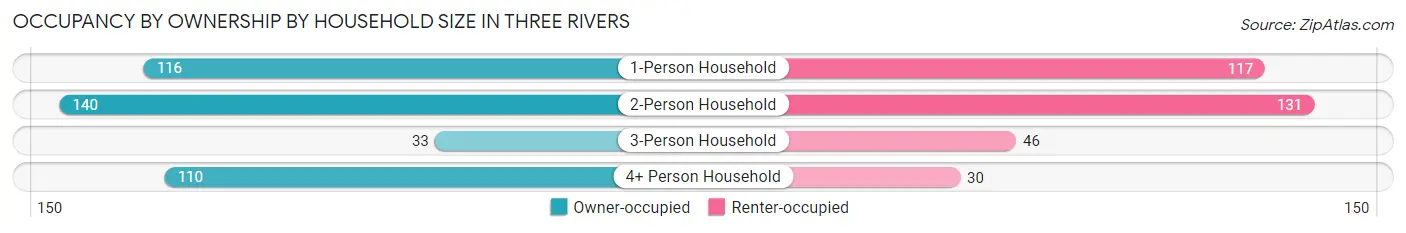
| Household Size | Owner-occupied | Renter-occupied |
| 1-Person Household | 116 (49.8%) | 117 (50.2%) |
| 2-Person Household | 140 (51.7%) | 131 (48.3%) |
| 3-Person Household | 33 (41.8%) | 46 (58.2%) |
| 4+ Person Household | 110 (78.6%) | 30 (21.4%) |
| Total Housing Units | 399 (55.2%) | 324 (44.8%) |
Occupancy by Educational Attainment in Three Rivers
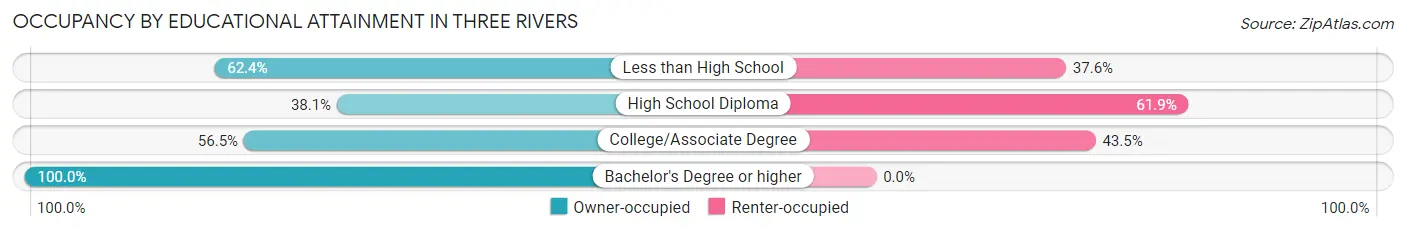
| Household Size | Owner-occupied | Renter-occupied |
| Less than High School | 131 (62.4%) | 79 (37.6%) |
| High School Diploma | 83 (38.1%) | 135 (61.9%) |
| College/Associate Degree | 143 (56.5%) | 110 (43.5%) |
| Bachelor's Degree or higher | 42 (100.0%) | 0 (0.0%) |
Occupancy by Age of Householder in Three Rivers
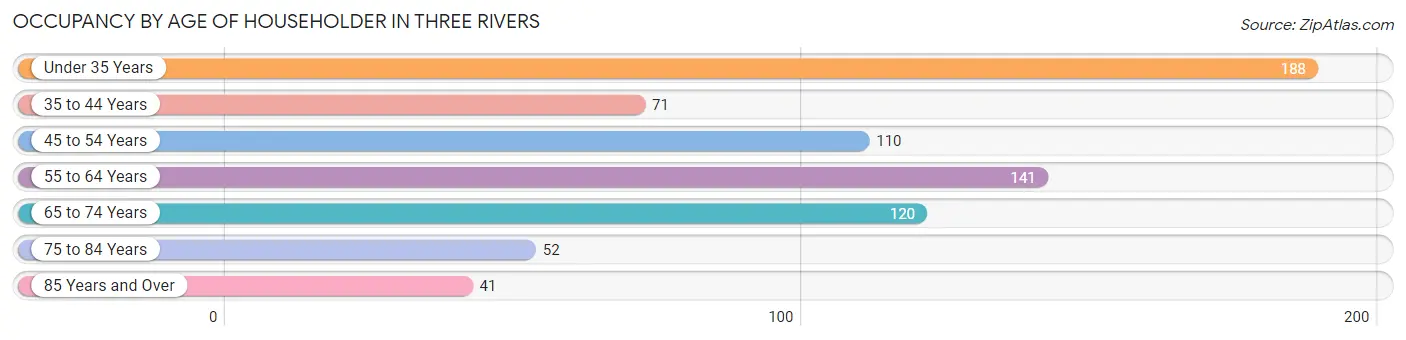
| Age Bracket | # Households | % Households |
| Under 35 Years | 188 | 26.0% |
| 35 to 44 Years | 71 | 9.8% |
| 45 to 54 Years | 110 | 15.2% |
| 55 to 64 Years | 141 | 19.5% |
| 65 to 74 Years | 120 | 16.6% |
| 75 to 84 Years | 52 | 7.2% |
| 85 Years and Over | 41 | 5.7% |
| Total | 723 | 100.0% |
Housing Finances in Three Rivers
Median Income by Occupancy in Three Rivers
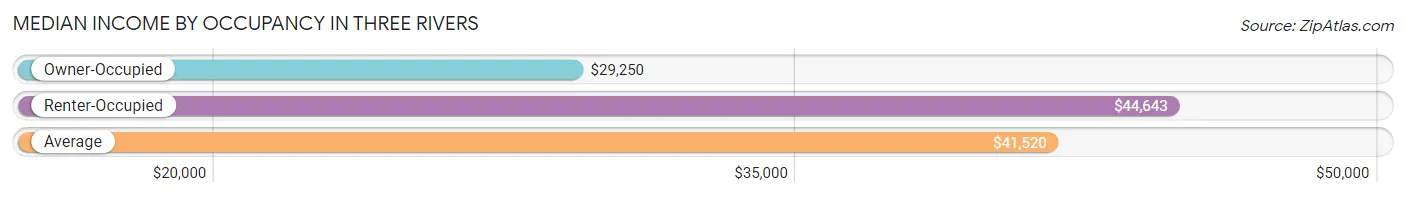
| Occupancy Type | # Households | Median Income |
| Owner-Occupied | 399 (55.2%) | $29,250 |
| Renter-Occupied | 324 (44.8%) | $44,643 |
| Average | 723 (100.0%) | $41,520 |
Occupancy by Householder Income Bracket in Three Rivers
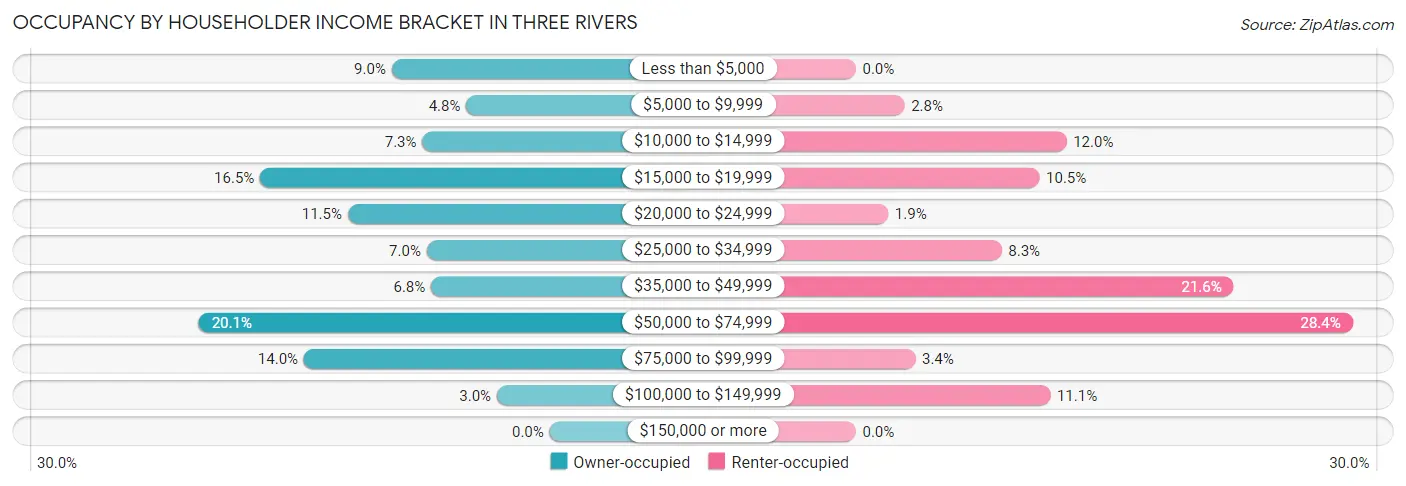
| Income Bracket | Owner-occupied | Renter-occupied |
| Less than $5,000 | 36 (9.0%) | 0 (0.0%) |
| $5,000 to $9,999 | 19 (4.8%) | 9 (2.8%) |
| $10,000 to $14,999 | 29 (7.3%) | 39 (12.0%) |
| $15,000 to $19,999 | 66 (16.5%) | 34 (10.5%) |
| $20,000 to $24,999 | 46 (11.5%) | 6 (1.8%) |
| $25,000 to $34,999 | 28 (7.0%) | 27 (8.3%) |
| $35,000 to $49,999 | 27 (6.8%) | 70 (21.6%) |
| $50,000 to $74,999 | 80 (20.1%) | 92 (28.4%) |
| $75,000 to $99,999 | 56 (14.0%) | 11 (3.4%) |
| $100,000 to $149,999 | 12 (3.0%) | 36 (11.1%) |
| $150,000 or more | 0 (0.0%) | 0 (0.0%) |
| Total | 399 (100.0%) | 324 (100.0%) |
Monthly Housing Cost Tiers in Three Rivers
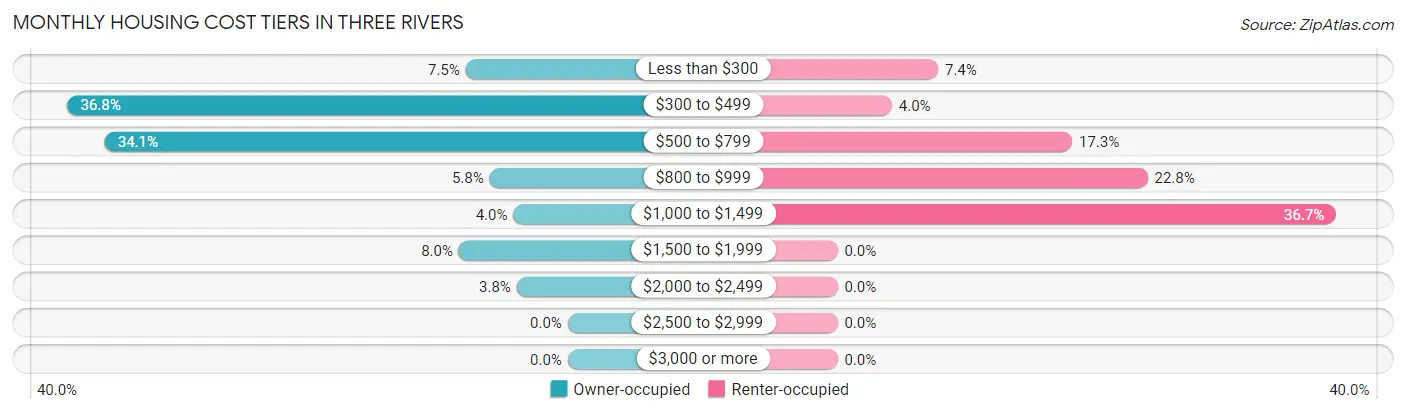
| Monthly Cost | Owner-occupied | Renter-occupied |
| Less than $300 | 30 (7.5%) | 24 (7.4%) |
| $300 to $499 | 147 (36.8%) | 13 (4.0%) |
| $500 to $799 | 136 (34.1%) | 56 (17.3%) |
| $800 to $999 | 23 (5.8%) | 74 (22.8%) |
| $1,000 to $1,499 | 16 (4.0%) | 119 (36.7%) |
| $1,500 to $1,999 | 32 (8.0%) | 0 (0.0%) |
| $2,000 to $2,499 | 15 (3.8%) | 0 (0.0%) |
| $2,500 to $2,999 | 0 (0.0%) | 0 (0.0%) |
| $3,000 or more | 0 (0.0%) | 0 (0.0%) |
| Total | 399 (100.0%) | 324 (100.0%) |
Physical Housing Characteristics in Three Rivers
Housing Structures in Three Rivers
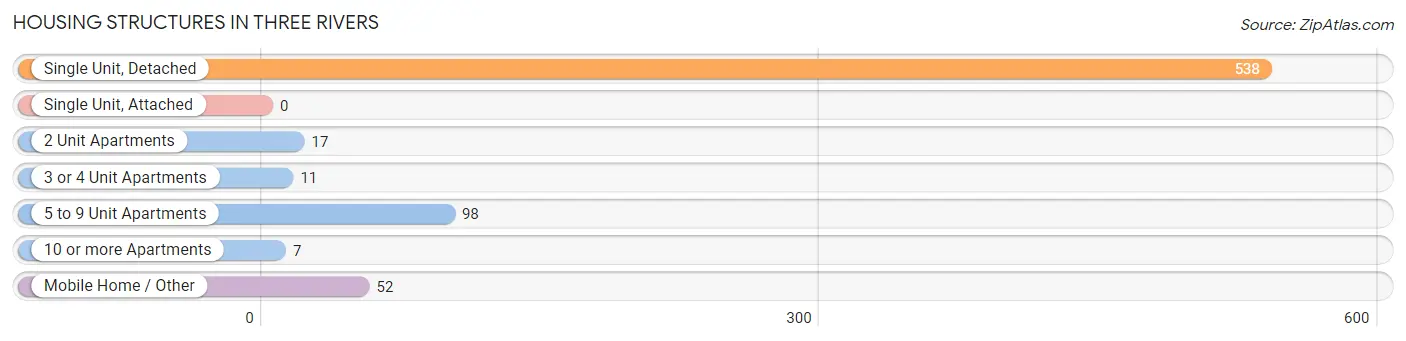
| Structure Type | # Housing Units | % Housing Units |
| Single Unit, Detached | 538 | 74.4% |
| Single Unit, Attached | 0 | 0.0% |
| 2 Unit Apartments | 17 | 2.4% |
| 3 or 4 Unit Apartments | 11 | 1.5% |
| 5 to 9 Unit Apartments | 98 | 13.6% |
| 10 or more Apartments | 7 | 1.0% |
| Mobile Home / Other | 52 | 7.2% |
| Total | 723 | 100.0% |
Housing Structures by Occupancy in Three Rivers
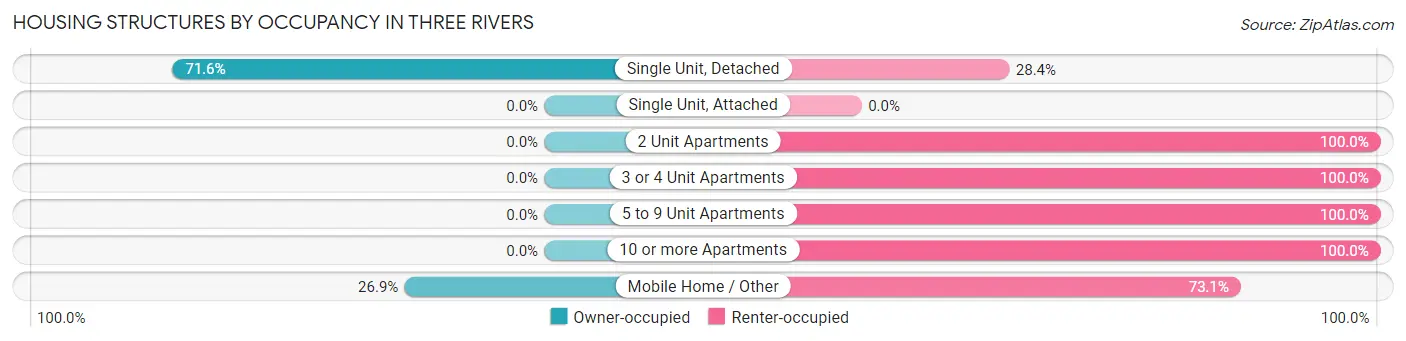
| Structure Type | Owner-occupied | Renter-occupied |
| Single Unit, Detached | 385 (71.6%) | 153 (28.4%) |
| Single Unit, Attached | 0 (0.0%) | 0 (0.0%) |
| 2 Unit Apartments | 0 (0.0%) | 17 (100.0%) |
| 3 or 4 Unit Apartments | 0 (0.0%) | 11 (100.0%) |
| 5 to 9 Unit Apartments | 0 (0.0%) | 98 (100.0%) |
| 10 or more Apartments | 0 (0.0%) | 7 (100.0%) |
| Mobile Home / Other | 14 (26.9%) | 38 (73.1%) |
| Total | 399 (55.2%) | 324 (44.8%) |
Housing Structures by Number of Rooms in Three Rivers
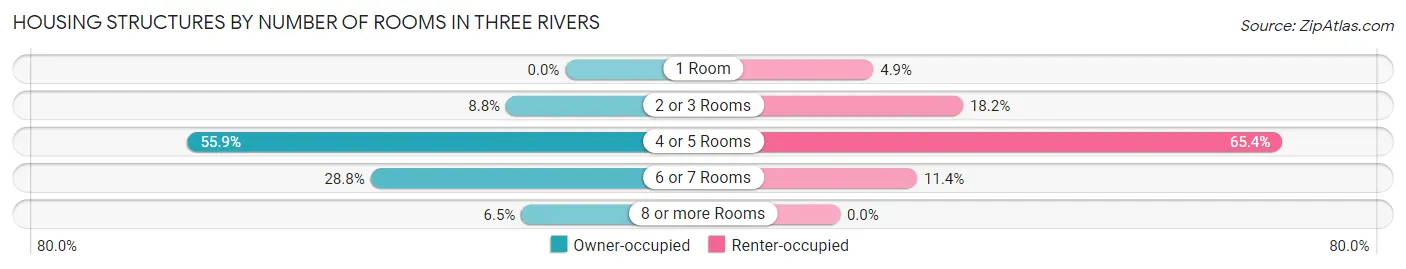
| Number of Rooms | Owner-occupied | Renter-occupied |
| 1 Room | 0 (0.0%) | 16 (4.9%) |
| 2 or 3 Rooms | 35 (8.8%) | 59 (18.2%) |
| 4 or 5 Rooms | 223 (55.9%) | 212 (65.4%) |
| 6 or 7 Rooms | 115 (28.8%) | 37 (11.4%) |
| 8 or more Rooms | 26 (6.5%) | 0 (0.0%) |
| Total | 399 (100.0%) | 324 (100.0%) |
Housing Structure by Heating Type in Three Rivers
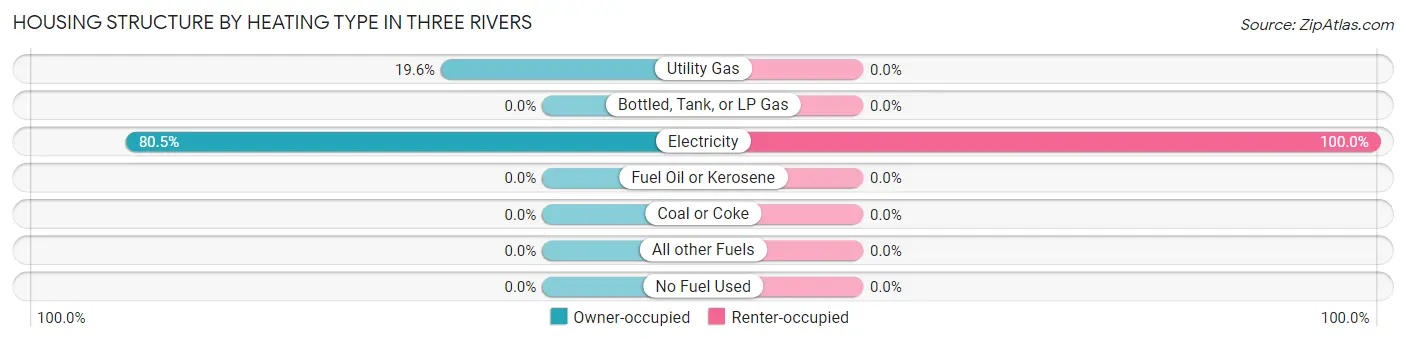
| Heating Type | Owner-occupied | Renter-occupied |
| Utility Gas | 78 (19.6%) | 0 (0.0%) |
| Bottled, Tank, or LP Gas | 0 (0.0%) | 0 (0.0%) |
| Electricity | 321 (80.4%) | 324 (100.0%) |
| Fuel Oil or Kerosene | 0 (0.0%) | 0 (0.0%) |
| Coal or Coke | 0 (0.0%) | 0 (0.0%) |
| All other Fuels | 0 (0.0%) | 0 (0.0%) |
| No Fuel Used | 0 (0.0%) | 0 (0.0%) |
| Total | 399 (100.0%) | 324 (100.0%) |
Household Vehicle Usage in Three Rivers
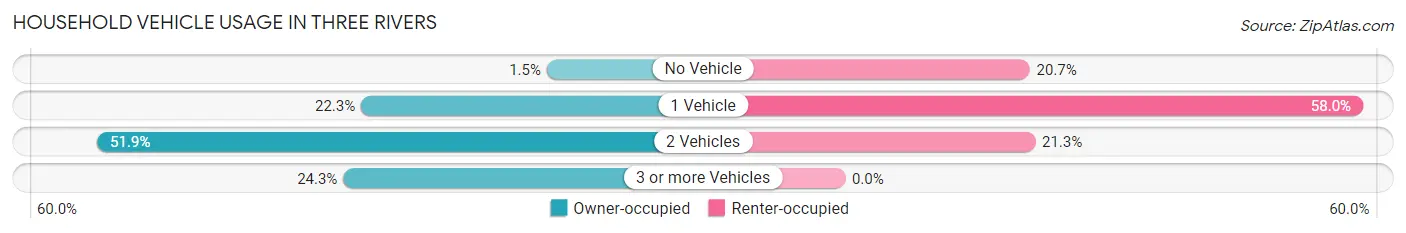
| Vehicles per Household | Owner-occupied | Renter-occupied |
| No Vehicle | 6 (1.5%) | 67 (20.7%) |
| 1 Vehicle | 89 (22.3%) | 188 (58.0%) |
| 2 Vehicles | 207 (51.9%) | 69 (21.3%) |
| 3 or more Vehicles | 97 (24.3%) | 0 (0.0%) |
| Total | 399 (100.0%) | 324 (100.0%) |
Real Estate & Mortgages in Three Rivers
Real Estate and Mortgage Overview in Three Rivers
| Characteristic | Without Mortgage | With Mortgage |
| Housing Units | 309 | 90 |
| Median Property Value | $77,900 | $197,500 |
| Median Household Income | $22,962 | $0 |
| Monthly Housing Costs | $455 | $0 |
| Real Estate Taxes | $731 | $0 |
Property Value by Mortgage Status in Three Rivers
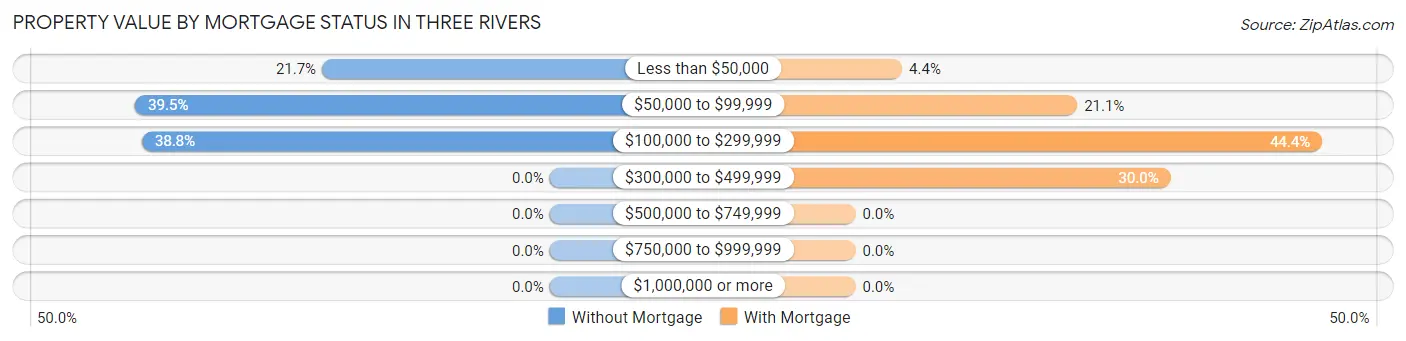
| Property Value | Without Mortgage | With Mortgage |
| Less than $50,000 | 67 (21.7%) | 4 (4.4%) |
| $50,000 to $99,999 | 122 (39.5%) | 19 (21.1%) |
| $100,000 to $299,999 | 120 (38.8%) | 40 (44.4%) |
| $300,000 to $499,999 | 0 (0.0%) | 27 (30.0%) |
| $500,000 to $749,999 | 0 (0.0%) | 0 (0.0%) |
| $750,000 to $999,999 | 0 (0.0%) | 0 (0.0%) |
| $1,000,000 or more | 0 (0.0%) | 0 (0.0%) |
| Total | 309 (100.0%) | 90 (100.0%) |
Household Income by Mortgage Status in Three Rivers
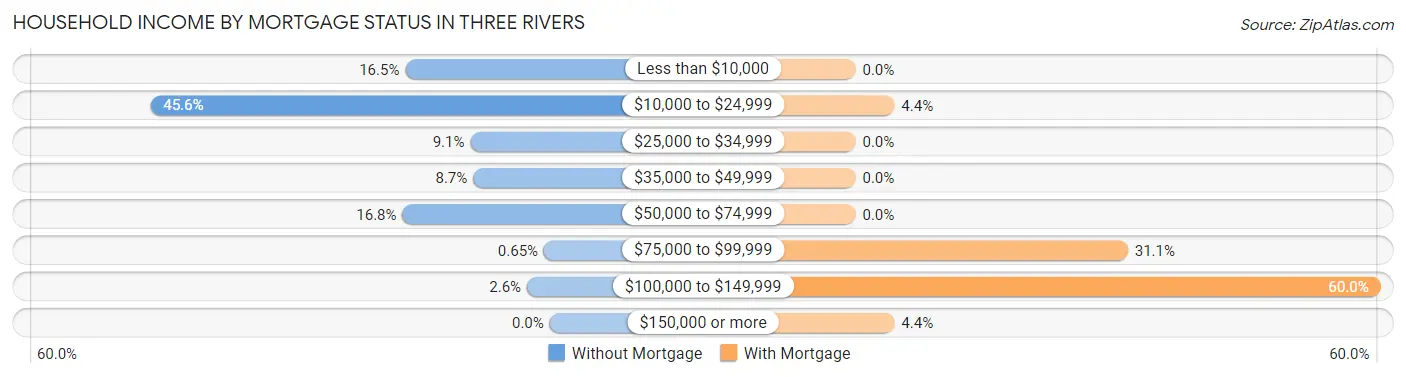
| Household Income | Without Mortgage | With Mortgage |
| Less than $10,000 | 51 (16.5%) | 0 (0.0%) |
| $10,000 to $24,999 | 141 (45.6%) | 4 (4.4%) |
| $25,000 to $34,999 | 28 (9.1%) | 0 (0.0%) |
| $35,000 to $49,999 | 27 (8.7%) | 0 (0.0%) |
| $50,000 to $74,999 | 52 (16.8%) | 0 (0.0%) |
| $75,000 to $99,999 | 2 (0.6%) | 28 (31.1%) |
| $100,000 to $149,999 | 8 (2.6%) | 54 (60.0%) |
| $150,000 or more | 0 (0.0%) | 4 (4.4%) |
| Total | 309 (100.0%) | 90 (100.0%) |
Property Value to Household Income Ratio in Three Rivers
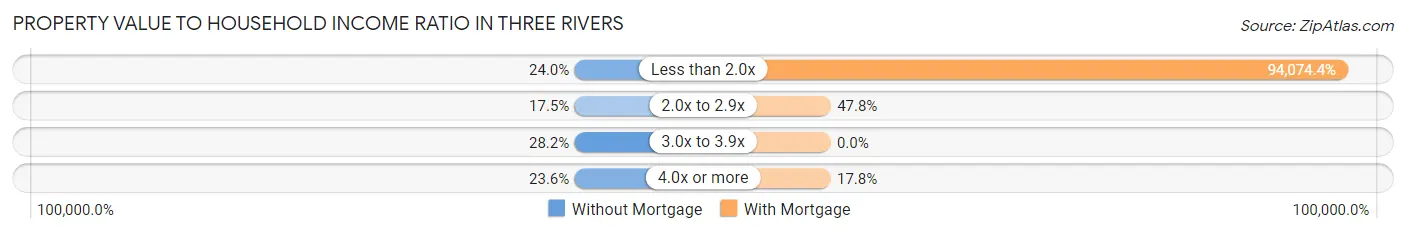
| Value-to-Income Ratio | Without Mortgage | With Mortgage |
| Less than 2.0x | 74 (23.9%) | 84,667 (94,074.4%) |
| 2.0x to 2.9x | 54 (17.5%) | 43 (47.8%) |
| 3.0x to 3.9x | 87 (28.2%) | 0 (0.0%) |
| 4.0x or more | 73 (23.6%) | 16 (17.8%) |
| Total | 309 (100.0%) | 90 (100.0%) |
Real Estate Taxes by Mortgage Status in Three Rivers
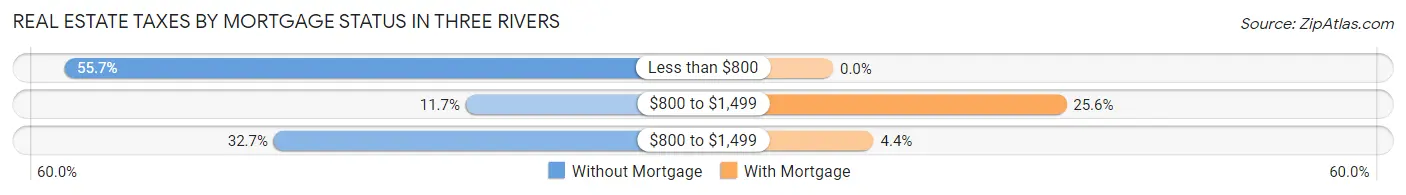
| Property Taxes | Without Mortgage | With Mortgage |
| Less than $800 | 172 (55.7%) | 0 (0.0%) |
| $800 to $1,499 | 36 (11.7%) | 23 (25.6%) |
| $800 to $1,499 | 101 (32.7%) | 4 (4.4%) |
| Total | 309 (100.0%) | 90 (100.0%) |
Health & Disability in Three Rivers
Health Insurance Coverage by Age in Three Rivers
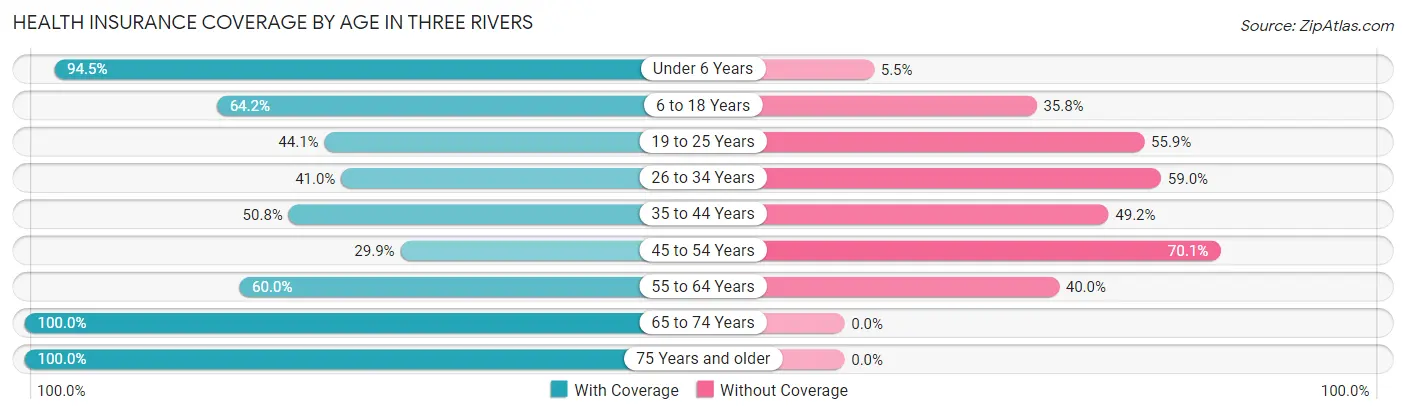
| Age Bracket | With Coverage | Without Coverage |
| Under 6 Years | 206 (94.5%) | 12 (5.5%) |
| 6 to 18 Years | 120 (64.2%) | 67 (35.8%) |
| 19 to 25 Years | 41 (44.1%) | 52 (55.9%) |
| 26 to 34 Years | 102 (41.0%) | 147 (59.0%) |
| 35 to 44 Years | 67 (50.8%) | 65 (49.2%) |
| 45 to 54 Years | 38 (29.9%) | 89 (70.1%) |
| 55 to 64 Years | 138 (60.0%) | 92 (40.0%) |
| 65 to 74 Years | 176 (100.0%) | 0 (0.0%) |
| 75 Years and older | 134 (100.0%) | 0 (0.0%) |
| Total | 1,022 (66.1%) | 524 (33.9%) |
Health Insurance Coverage by Citizenship Status in Three Rivers
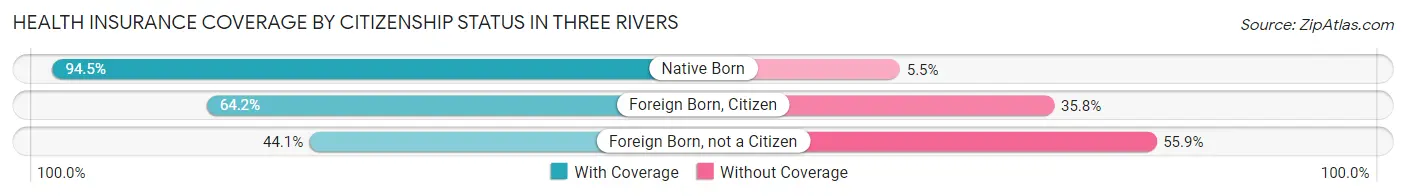
| Citizenship Status | With Coverage | Without Coverage |
| Native Born | 206 (94.5%) | 12 (5.5%) |
| Foreign Born, Citizen | 120 (64.2%) | 67 (35.8%) |
| Foreign Born, not a Citizen | 41 (44.1%) | 52 (55.9%) |
Health Insurance Coverage by Household Income in Three Rivers
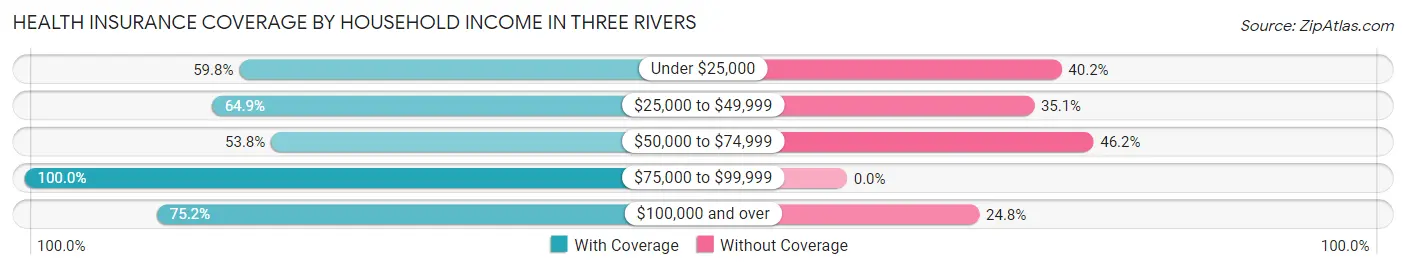
| Household Income | With Coverage | Without Coverage |
| Under $25,000 | 281 (59.8%) | 189 (40.2%) |
| $25,000 to $49,999 | 276 (64.9%) | 149 (35.1%) |
| $50,000 to $74,999 | 183 (53.8%) | 157 (46.2%) |
| $75,000 to $99,999 | 194 (100.0%) | 0 (0.0%) |
| $100,000 and over | 88 (75.2%) | 29 (24.8%) |
Public vs Private Health Insurance Coverage by Age in Three Rivers
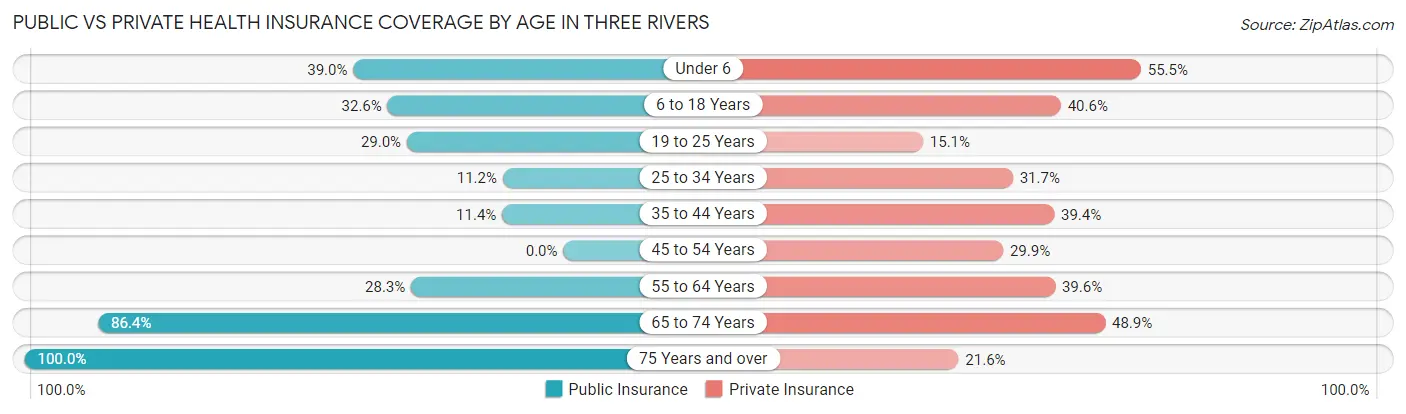
| Age Bracket | Public Insurance | Private Insurance |
| Under 6 | 85 (39.0%) | 121 (55.5%) |
| 6 to 18 Years | 61 (32.6%) | 76 (40.6%) |
| 19 to 25 Years | 27 (29.0%) | 14 (15.0%) |
| 25 to 34 Years | 28 (11.2%) | 79 (31.7%) |
| 35 to 44 Years | 15 (11.4%) | 52 (39.4%) |
| 45 to 54 Years | 0 (0.0%) | 38 (29.9%) |
| 55 to 64 Years | 65 (28.3%) | 91 (39.6%) |
| 65 to 74 Years | 152 (86.4%) | 86 (48.9%) |
| 75 Years and over | 134 (100.0%) | 29 (21.6%) |
| Total | 567 (36.7%) | 586 (37.9%) |
Disability Status by Sex by Age in Three Rivers
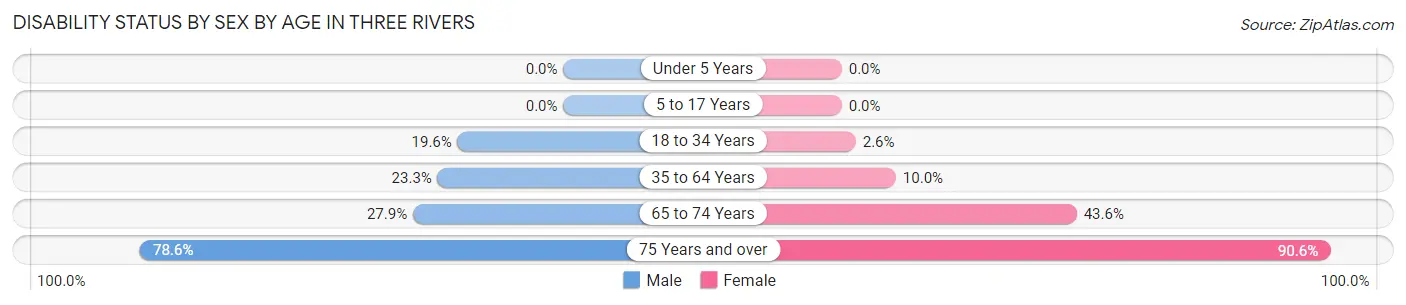
| Age Bracket | Male | Female |
| Under 5 Years | 0 (0.0%) | 0 (0.0%) |
| 5 to 17 Years | 0 (0.0%) | 0 (0.0%) |
| 18 to 34 Years | 32 (19.6%) | 5 (2.6%) |
| 35 to 64 Years | 56 (23.3%) | 25 (10.0%) |
| 65 to 74 Years | 12 (27.9%) | 58 (43.6%) |
| 75 Years and over | 55 (78.6%) | 58 (90.6%) |
Disability Class by Sex by Age in Three Rivers
Disability Class: Hearing Difficulty
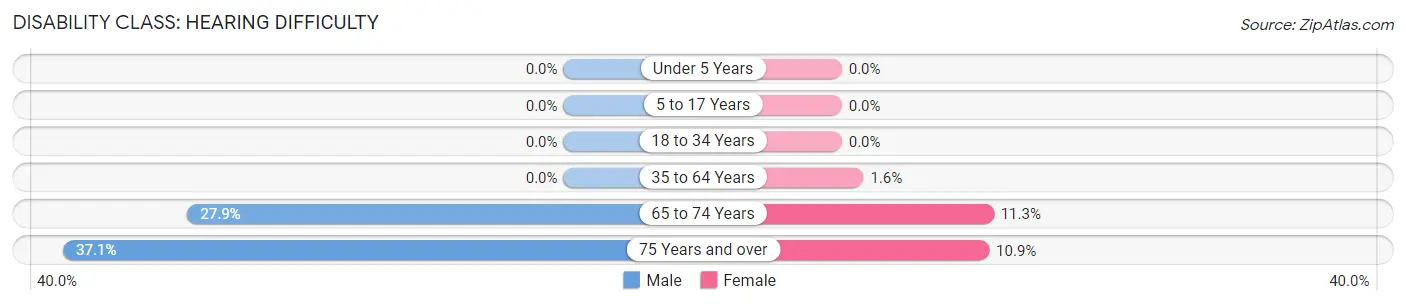
| Age Bracket | Male | Female |
| Under 5 Years | 0 (0.0%) | 0 (0.0%) |
| 5 to 17 Years | 0 (0.0%) | 0 (0.0%) |
| 18 to 34 Years | 0 (0.0%) | 0 (0.0%) |
| 35 to 64 Years | 0 (0.0%) | 4 (1.6%) |
| 65 to 74 Years | 12 (27.9%) | 15 (11.3%) |
| 75 Years and over | 26 (37.1%) | 7 (10.9%) |
Disability Class: Vision Difficulty
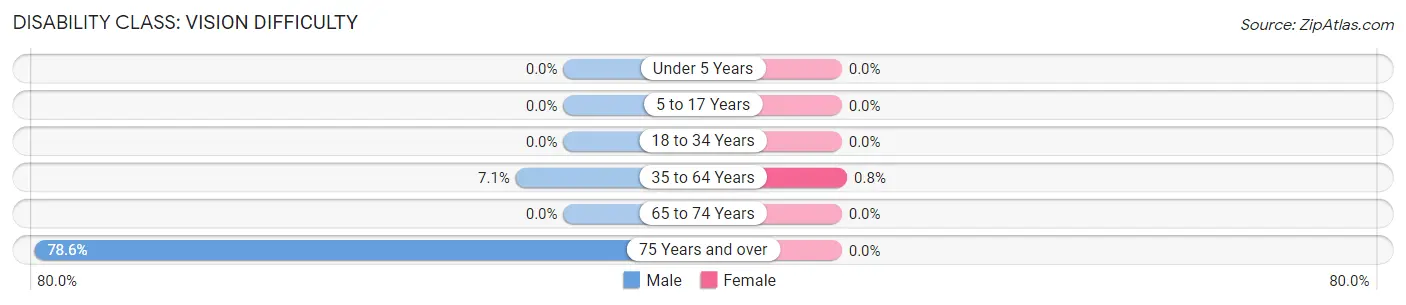
| Age Bracket | Male | Female |
| Under 5 Years | 0 (0.0%) | 0 (0.0%) |
| 5 to 17 Years | 0 (0.0%) | 0 (0.0%) |
| 18 to 34 Years | 0 (0.0%) | 0 (0.0%) |
| 35 to 64 Years | 17 (7.1%) | 2 (0.8%) |
| 65 to 74 Years | 0 (0.0%) | 0 (0.0%) |
| 75 Years and over | 55 (78.6%) | 0 (0.0%) |
Disability Class: Cognitive Difficulty
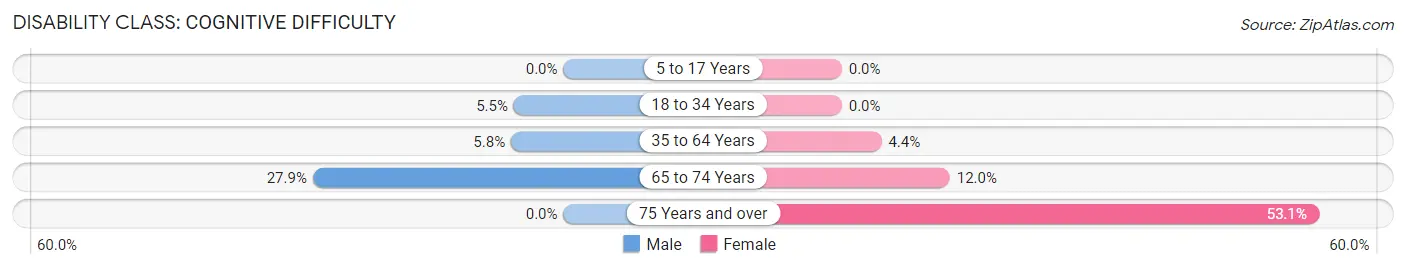
| Age Bracket | Male | Female |
| 5 to 17 Years | 0 (0.0%) | 0 (0.0%) |
| 18 to 34 Years | 9 (5.5%) | 0 (0.0%) |
| 35 to 64 Years | 14 (5.8%) | 11 (4.4%) |
| 65 to 74 Years | 12 (27.9%) | 16 (12.0%) |
| 75 Years and over | 0 (0.0%) | 34 (53.1%) |
Disability Class: Ambulatory Difficulty
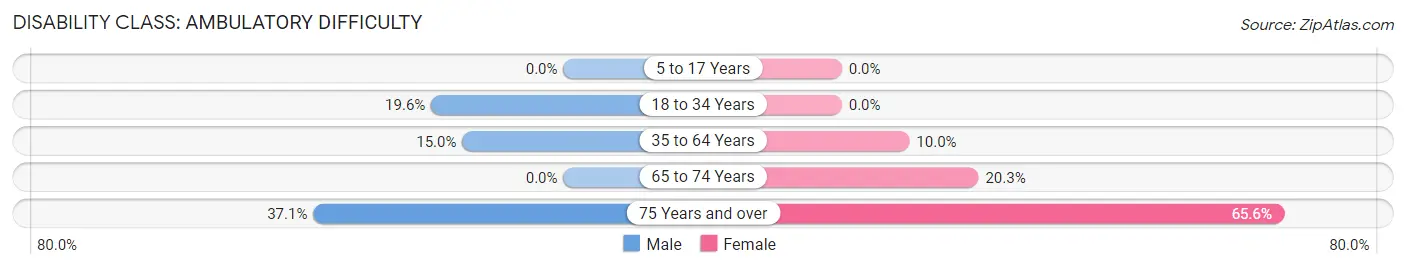
| Age Bracket | Male | Female |
| 5 to 17 Years | 0 (0.0%) | 0 (0.0%) |
| 18 to 34 Years | 32 (19.6%) | 0 (0.0%) |
| 35 to 64 Years | 36 (15.0%) | 25 (10.0%) |
| 65 to 74 Years | 0 (0.0%) | 27 (20.3%) |
| 75 Years and over | 26 (37.1%) | 42 (65.6%) |
Disability Class: Self-Care Difficulty
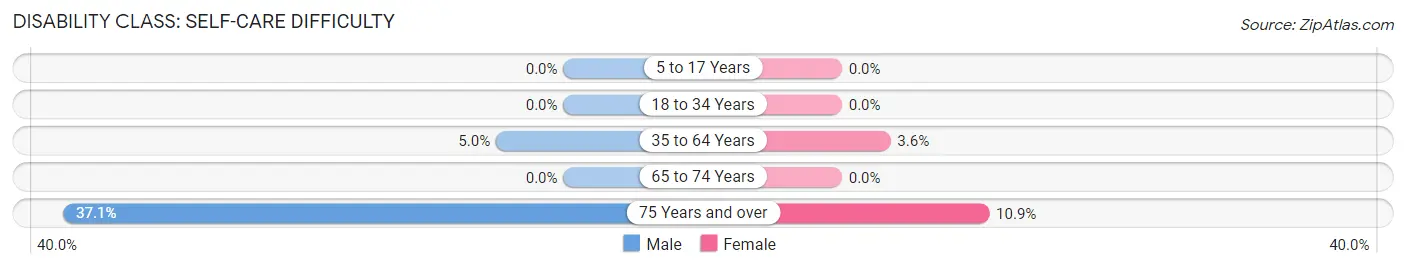
| Age Bracket | Male | Female |
| 5 to 17 Years | 0 (0.0%) | 0 (0.0%) |
| 18 to 34 Years | 0 (0.0%) | 0 (0.0%) |
| 35 to 64 Years | 12 (5.0%) | 9 (3.6%) |
| 65 to 74 Years | 0 (0.0%) | 0 (0.0%) |
| 75 Years and over | 26 (37.1%) | 7 (10.9%) |
Technology Access in Three Rivers
Computing Device Access in Three Rivers
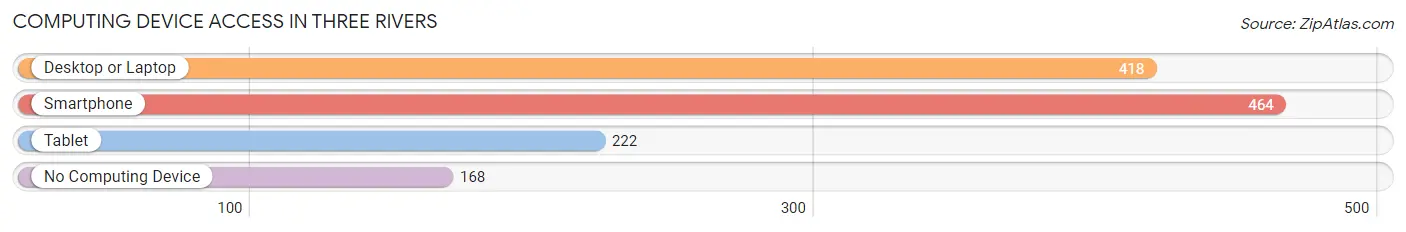
| Device Type | # Households | % Households |
| Desktop or Laptop | 418 | 57.8% |
| Smartphone | 464 | 64.2% |
| Tablet | 222 | 30.7% |
| No Computing Device | 168 | 23.2% |
| Total | 723 | 100.0% |
Internet Access in Three Rivers
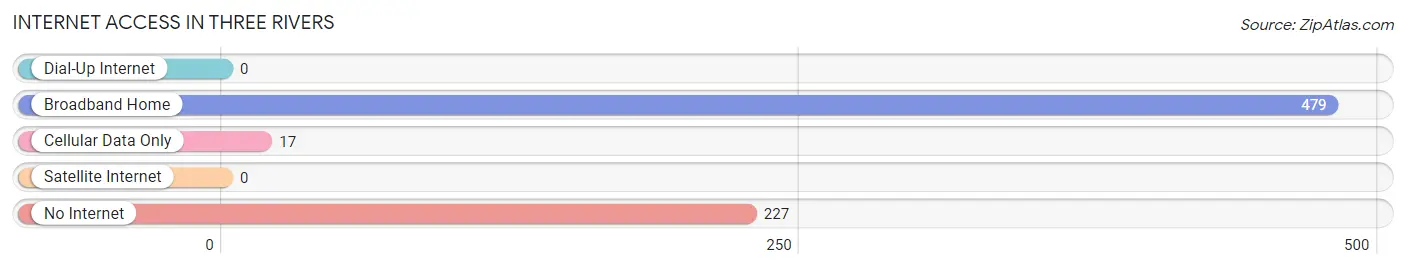
| Internet Type | # Households | % Households |
| Dial-Up Internet | 0 | 0.0% |
| Broadband Home | 479 | 66.2% |
| Cellular Data Only | 17 | 2.4% |
| Satellite Internet | 0 | 0.0% |
| No Internet | 227 | 31.4% |
| Total | 723 | 100.0% |
Three Rivers Summary
Three Rivers is a small town located in Live Oak County, Texas. It is situated on the banks of the Nueces River, approximately 30 miles south of San Antonio. The town was founded in 1876 and has a population of approximately 2,000 people.
History
The area around Three Rivers was first settled by Native Americans, including the Coahuiltecan, Karankawa, and Tonkawa tribes. The first European settlers arrived in the area in the late 1700s, and the town of Three Rivers was officially established in 1876. The town was named for the three rivers that converge in the area: the Nueces, Frio, and Atascosa.
The town was initially a farming and ranching community, but it soon developed into a trading center for the surrounding area. In the early 1900s, the town was home to several businesses, including a cotton gin, a blacksmith shop, and a general store.
In the 1920s, the town began to experience a period of growth and development. The Three Rivers Independent School District was established in 1923, and the town was incorporated in 1925. The town also saw the construction of a new courthouse and a new post office.
In the 1950s, the town experienced a period of decline as many of its businesses closed. However, in the late 1970s, the town began to experience a resurgence. The Three Rivers Historical Museum was established in 1979, and the town was designated a Texas Main Street City in 1984.
Geography
Three Rivers is located in Live Oak County, Texas, approximately 30 miles south of San Antonio. The town is situated on the banks of the Nueces River, and is surrounded by rolling hills and mesquite trees. The town is located at an elevation of approximately 500 feet above sea level.
The climate in Three Rivers is hot and humid in the summer, and mild in the winter. The average annual temperature is around 70 degrees Fahrenheit, and the average annual precipitation is around 30 inches.
Economy
The economy of Three Rivers is largely based on agriculture and tourism. The town is home to several farms and ranches, and is also a popular destination for hunting and fishing.
The town is also home to several small businesses, including restaurants, retail stores, and service providers. The town is also home to a number of manufacturing companies, including a furniture factory and a metal fabrication plant.
Demographics
As of the 2010 census, the population of Three Rivers was 2,039. The racial makeup of the town was 79.3% White, 0.7% African American, 0.3% Native American, 0.2% Asian, 0.1% Pacific Islander, 17.2% from other races, and 2.4% from two or more races. Hispanic or Latino of any race were 33.2% of the population.
The median household income in Three Rivers was $31,250, and the median family income was $37,500. The per capita income was $15,845. About 18.2% of the population was below the poverty line.
The town is served by the Three Rivers Independent School District, which includes two elementary schools, one middle school, and one high school. The town is also home to a branch of the Live Oak County Library.
Common Questions
What is Per Capita Income in Three Rivers?
Per Capita income in Three Rivers is $18,882.
What is the Median Family Income in Three Rivers?
Median Family Income in Three Rivers is $43,052.
What is the Median Household income in Three Rivers?
Median Household Income in Three Rivers is $41,520.
What is Income or Wage Gap in Three Rivers?
Income or Wage Gap in Three Rivers is 53.8%.
Women in Three Rivers earn 46.2 cents for every dollar earned by a man.
What is Inequality or Gini Index in Three Rivers?
Inequality or Gini Index in Three Rivers is 0.40.
What is the Total Population of Three Rivers?
Total Population of Three Rivers is 1,546.
What is the Total Male Population of Three Rivers?
Total Male Population of Three Rivers is 673.
What is the Total Female Population of Three Rivers?
Total Female Population of Three Rivers is 873.
What is the Ratio of Males per 100 Females in Three Rivers?
There are 77.09 Males per 100 Females in Three Rivers.
What is the Ratio of Females per 100 Males in Three Rivers?
There are 129.72 Females per 100 Males in Three Rivers.
What is the Median Population Age in Three Rivers?
Median Population Age in Three Rivers is 36.4 Years.
What is the Average Family Size in Three Rivers
Average Family Size in Three Rivers is 3.0 People.
What is the Average Household Size in Three Rivers
Average Household Size in Three Rivers is 2.1 People.
How Large is the Labor Force in Three Rivers?
There are 536 People in the Labor Forcein in Three Rivers.
What is the Percentage of People in the Labor Force in Three Rivers?
43.8% of People are in the Labor Force in Three Rivers.
What is the Unemployment Rate in Three Rivers?
Unemployment Rate in Three Rivers is 10.6%.