Thorndale, TX Map & Demographics
Thorndale Map
Thorndale Overview
$32,041
PER CAPITA INCOME
$76,920
AVG FAMILY INCOME
$63,581
AVG HOUSEHOLD INCOME
24.4%
WAGE / INCOME GAP [ % ]
75.6¢/ $1
WAGE / INCOME GAP [ $ ]
0.38
INEQUALITY / GINI INDEX
1,415
TOTAL POPULATION
681
MALE POPULATION
734
FEMALE POPULATION
92.78
MALES / 100 FEMALES
107.78
FEMALES / 100 MALES
37.9
MEDIAN AGE
2.9
AVG FAMILY SIZE
2.3
AVG HOUSEHOLD SIZE
757
LABOR FORCE [ PEOPLE ]
64.8%
PERCENT IN LABOR FORCE
1.1%
UNEMPLOYMENT RATE
Thorndale Zip Codes
Thorndale Area Codes
Income in Thorndale
Income Overview in Thorndale
Per Capita Income in Thorndale is $32,041, while median incomes of families and households are $76,920 and $63,581 respectively.
| Characteristic | Number | Measure |
| Per Capita Income | 1,415 | $32,041 |
| Median Family Income | 397 | $76,920 |
| Mean Family Income | 397 | $86,978 |
| Median Household Income | 622 | $63,581 |
| Mean Household Income | 622 | $73,810 |
| Income Deficit | 397 | $0 |
| Wage / Income Gap (%) | 1,415 | 24.43% |
| Wage / Income Gap ($) | 1,415 | 75.57¢ per $1 |
| Gini / Inequality Index | 1,415 | 0.38 |
Earnings by Sex in Thorndale
Average Earnings in Thorndale are $38,583, $41,711 for men and $31,523 for women, a difference of 24.4%.
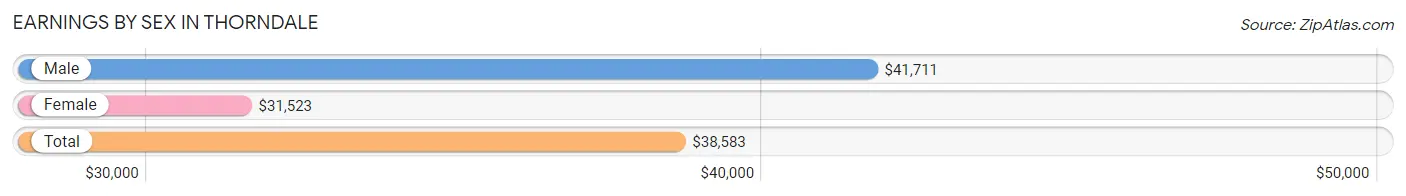
| Sex | Number | Average Earnings |
| Male | 454 (57.3%) | $41,711 |
| Female | 339 (42.7%) | $31,523 |
| Total | 793 (100.0%) | $38,583 |
Earnings by Sex by Income Bracket in Thorndale
The most common earnings brackets in Thorndale are $25,000 to $29,999 for men (86 | 18.9%) and $25,000 to $29,999 for women (91 | 26.8%).
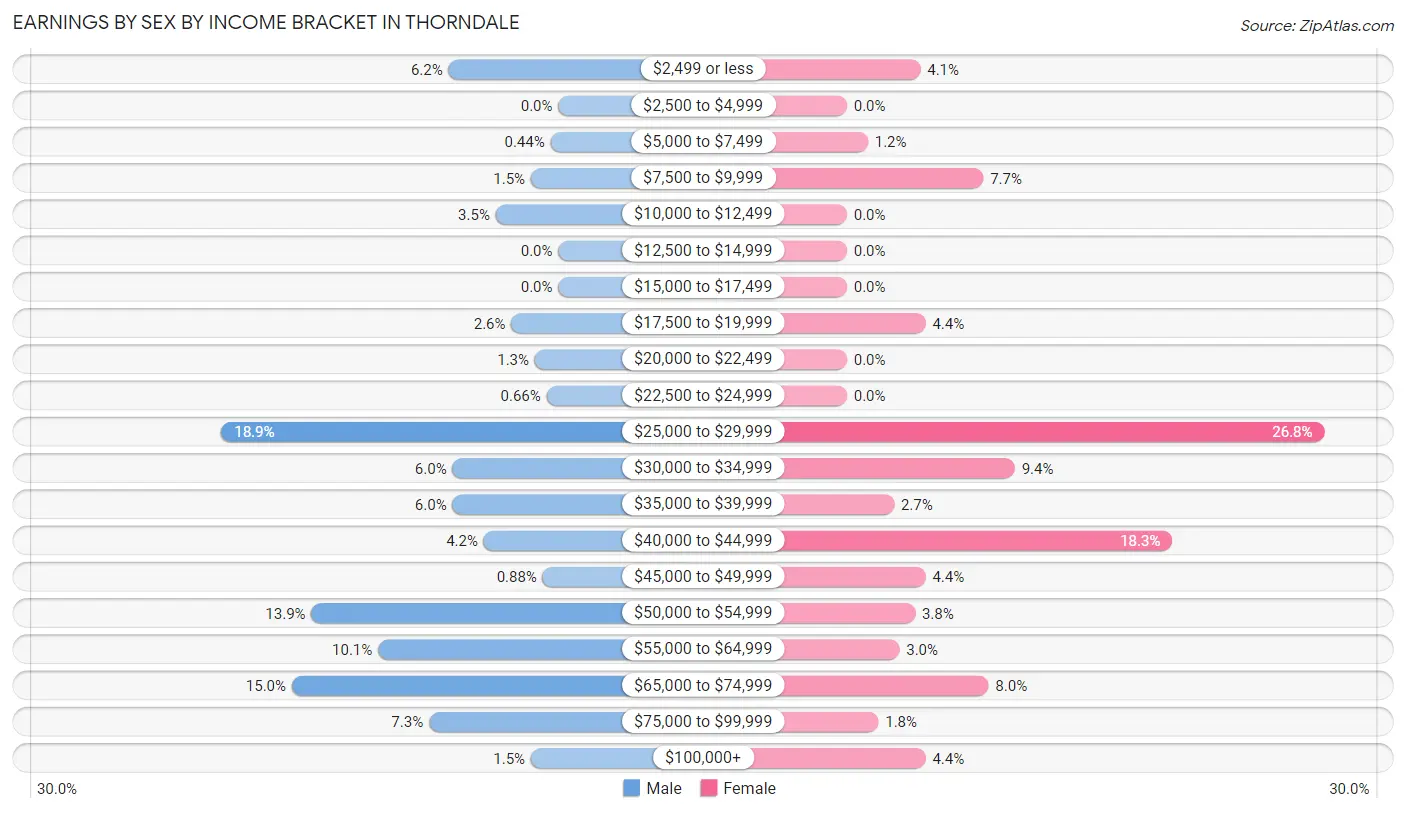
| Income | Male | Female |
| $2,499 or less | 28 (6.2%) | 14 (4.1%) |
| $2,500 to $4,999 | 0 (0.0%) | 0 (0.0%) |
| $5,000 to $7,499 | 2 (0.4%) | 4 (1.2%) |
| $7,500 to $9,999 | 7 (1.5%) | 26 (7.7%) |
| $10,000 to $12,499 | 16 (3.5%) | 0 (0.0%) |
| $12,500 to $14,999 | 0 (0.0%) | 0 (0.0%) |
| $15,000 to $17,499 | 0 (0.0%) | 0 (0.0%) |
| $17,500 to $19,999 | 12 (2.6%) | 15 (4.4%) |
| $20,000 to $22,499 | 6 (1.3%) | 0 (0.0%) |
| $22,500 to $24,999 | 3 (0.7%) | 0 (0.0%) |
| $25,000 to $29,999 | 86 (18.9%) | 91 (26.8%) |
| $30,000 to $34,999 | 27 (5.9%) | 32 (9.4%) |
| $35,000 to $39,999 | 27 (5.9%) | 9 (2.6%) |
| $40,000 to $44,999 | 19 (4.2%) | 62 (18.3%) |
| $45,000 to $49,999 | 4 (0.9%) | 15 (4.4%) |
| $50,000 to $54,999 | 63 (13.9%) | 13 (3.8%) |
| $55,000 to $64,999 | 46 (10.1%) | 10 (2.9%) |
| $65,000 to $74,999 | 68 (15.0%) | 27 (8.0%) |
| $75,000 to $99,999 | 33 (7.3%) | 6 (1.8%) |
| $100,000+ | 7 (1.5%) | 15 (4.4%) |
| Total | 454 (100.0%) | 339 (100.0%) |
Earnings by Sex by Educational Attainment in Thorndale
Average earnings in Thorndale are $50,397 for men and $36,667 for women, a difference of 27.2%. Men with an educational attainment of graduate degree enjoy the highest average annual earnings of $56,522, while those with high school diploma education earn the least with $32,031. Women with an educational attainment of bachelor's degree earn the most with the average annual earnings of $42,237, while those with high school diploma education have the smallest earnings of $30,430.
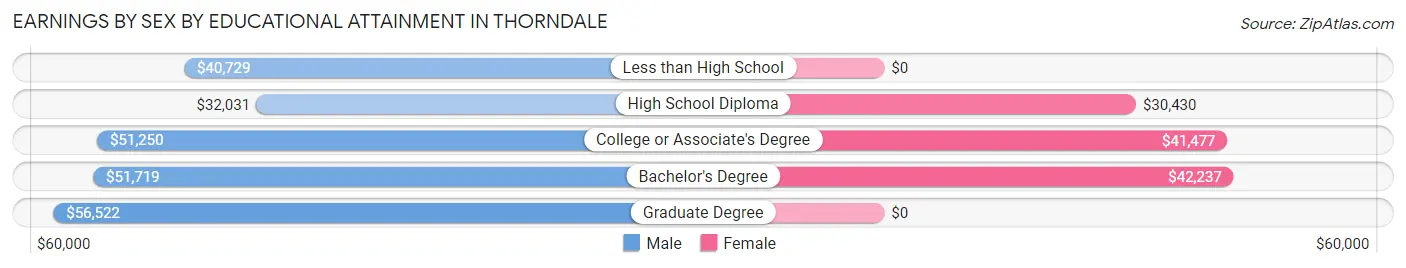
| Educational Attainment | Male Income | Female Income |
| Less than High School | $40,729 | $0 |
| High School Diploma | $32,031 | $30,430 |
| College or Associate's Degree | $51,250 | $41,477 |
| Bachelor's Degree | $51,719 | $42,237 |
| Graduate Degree | $56,522 | $0 |
| Total | $50,397 | $36,667 |
Family Income in Thorndale
Family Income Brackets in Thorndale
According to the Thorndale family income data, there are 107 families falling into the $75,000 to $99,999 income range, which is the most common income bracket and makes up 27.0% of all families.
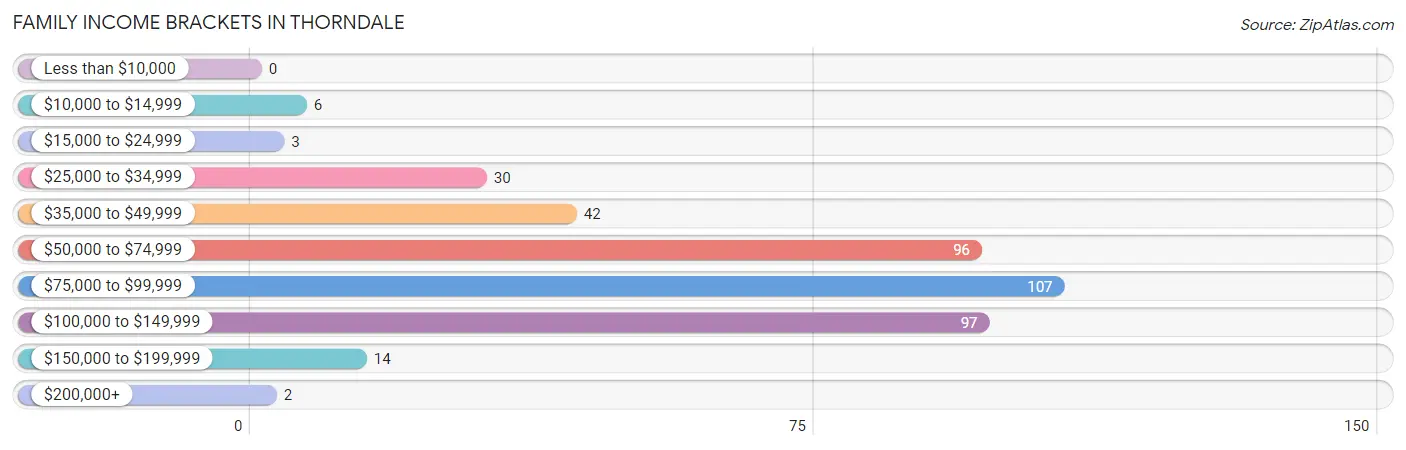
| Income Bracket | # Families | % Families |
| Less than $10,000 | 0 | 0.0% |
| $10,000 to $14,999 | 6 | 1.5% |
| $15,000 to $24,999 | 3 | 0.8% |
| $25,000 to $34,999 | 30 | 7.6% |
| $35,000 to $49,999 | 42 | 10.6% |
| $50,000 to $74,999 | 96 | 24.2% |
| $75,000 to $99,999 | 107 | 27.0% |
| $100,000 to $149,999 | 97 | 24.4% |
| $150,000 to $199,999 | 14 | 3.5% |
| $200,000+ | 2 | 0.5% |
Family Income by Famaliy Size in Thorndale
5-person families (28 | 7.0%) account for the highest median family income in Thorndale with $119,000 per family, while 2-person families (216 | 54.4%) have the highest median income of $33,629 per family member.
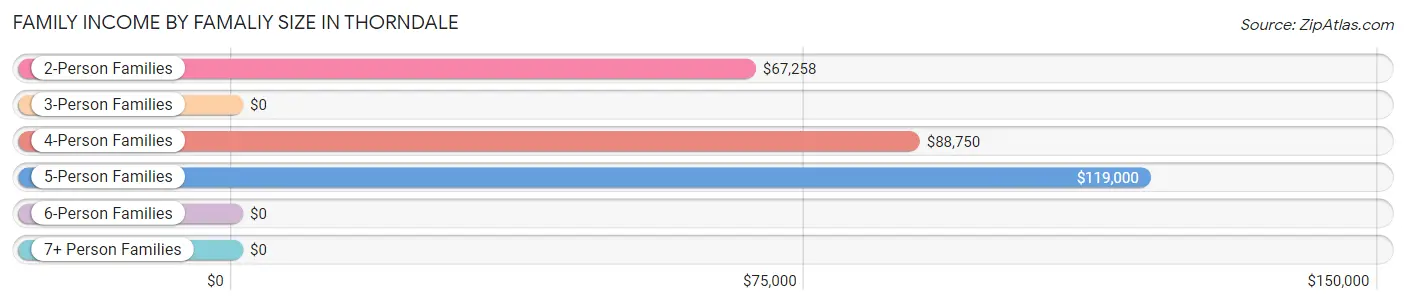
| Income Bracket | # Families | Median Income |
| 2-Person Families | 216 (54.4%) | $67,258 |
| 3-Person Families | 78 (19.7%) | $0 |
| 4-Person Families | 72 (18.1%) | $88,750 |
| 5-Person Families | 28 (7.0%) | $119,000 |
| 6-Person Families | 3 (0.8%) | $0 |
| 7+ Person Families | 0 (0.0%) | $0 |
| Total | 397 (100.0%) | $76,920 |
Family Income by Number of Earners in Thorndale
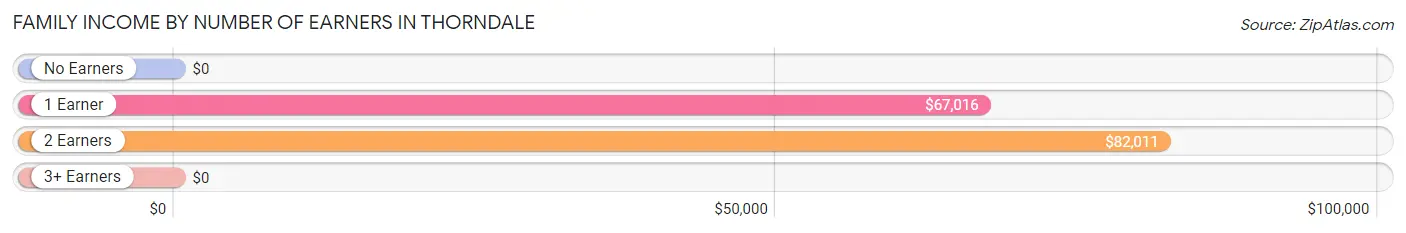
| Number of Earners | # Families | Median Income |
| No Earners | 39 (9.8%) | $0 |
| 1 Earner | 168 (42.3%) | $67,016 |
| 2 Earners | 123 (31.0%) | $82,011 |
| 3+ Earners | 67 (16.9%) | $0 |
| Total | 397 (100.0%) | $76,920 |
Household Income in Thorndale
Household Income Brackets in Thorndale
With 119 households falling in the category, the $75,000 to $99,999 income range is the most frequent in Thorndale, accounting for 19.1% of all households.
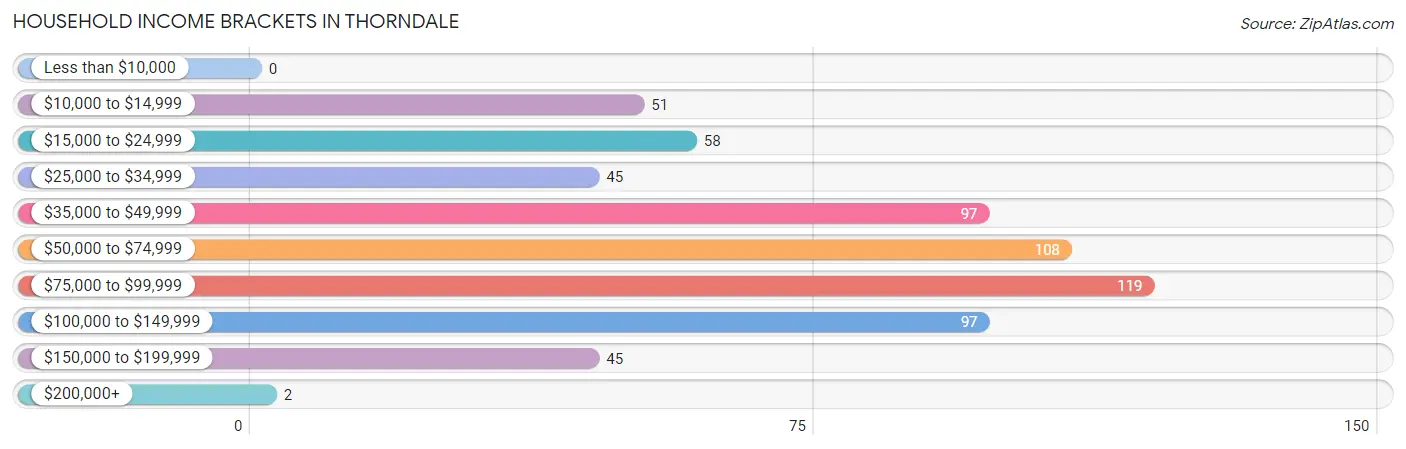
| Income Bracket | # Households | % Households |
| Less than $10,000 | 0 | 0.0% |
| $10,000 to $14,999 | 51 | 8.2% |
| $15,000 to $24,999 | 58 | 9.3% |
| $25,000 to $34,999 | 45 | 7.2% |
| $35,000 to $49,999 | 97 | 15.6% |
| $50,000 to $74,999 | 108 | 17.4% |
| $75,000 to $99,999 | 119 | 19.1% |
| $100,000 to $149,999 | 97 | 15.6% |
| $150,000 to $199,999 | 45 | 7.2% |
| $200,000+ | 2 | 0.3% |
Household Income by Householder Age in Thorndale
The median household income in Thorndale is $63,581, with the highest median household income of $69,079 found in the 45 to 64 years age bracket for the primary householder. A total of 198 households (31.8%) fall into this category. Meanwhile, the 15 to 24 years age bracket for the primary householder has the lowest median household income of $0, with 4 households (0.6%) in this group.
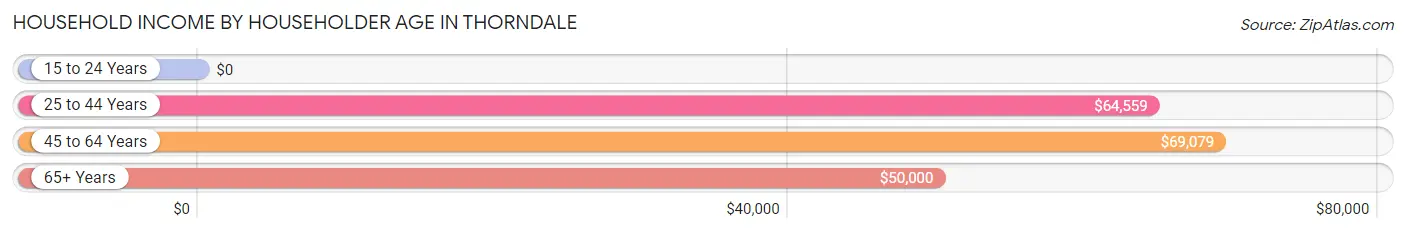
| Income Bracket | # Households | Median Income |
| 15 to 24 Years | 4 (0.6%) | $0 |
| 25 to 44 Years | 252 (40.5%) | $64,559 |
| 45 to 64 Years | 198 (31.8%) | $69,079 |
| 65+ Years | 168 (27.0%) | $50,000 |
| Total | 622 (100.0%) | $63,581 |
Poverty in Thorndale
Income Below Poverty by Sex and Age in Thorndale
With 3.8% poverty level for males and 5.2% for females among the residents of Thorndale, 65 to 74 year old males and 45 to 54 year old females are the most vulnerable to poverty, with 13 males (22.0%) and 27 females (44.3%) in their respective age groups living below the poverty level.
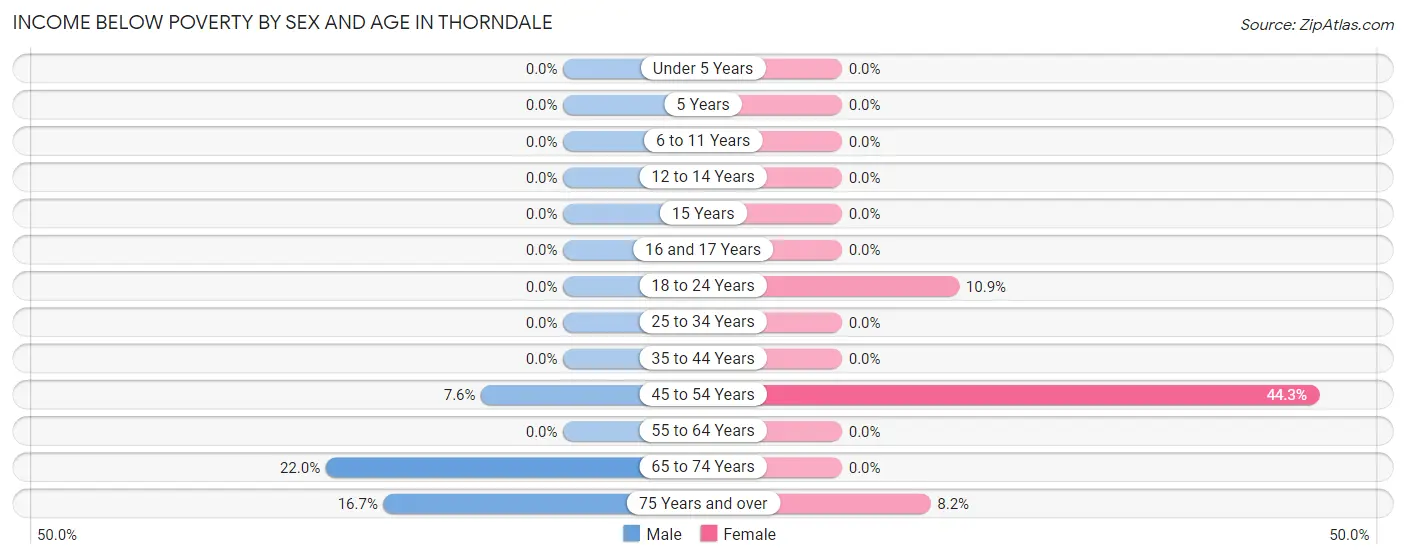
| Age Bracket | Male | Female |
| Under 5 Years | 0 (0.0%) | 0 (0.0%) |
| 5 Years | 0 (0.0%) | 0 (0.0%) |
| 6 to 11 Years | 0 (0.0%) | 0 (0.0%) |
| 12 to 14 Years | 0 (0.0%) | 0 (0.0%) |
| 15 Years | 0 (0.0%) | 0 (0.0%) |
| 16 and 17 Years | 0 (0.0%) | 0 (0.0%) |
| 18 to 24 Years | 0 (0.0%) | 5 (10.9%) |
| 25 to 34 Years | 0 (0.0%) | 0 (0.0%) |
| 35 to 44 Years | 0 (0.0%) | 0 (0.0%) |
| 45 to 54 Years | 7 (7.6%) | 27 (44.3%) |
| 55 to 64 Years | 0 (0.0%) | 0 (0.0%) |
| 65 to 74 Years | 13 (22.0%) | 0 (0.0%) |
| 75 Years and over | 6 (16.7%) | 6 (8.2%) |
| Total | 26 (3.8%) | 38 (5.2%) |
Income Above Poverty by Sex and Age in Thorndale
According to the poverty statistics in Thorndale, males aged under 5 years and females aged under 5 years are the age groups that are most secure financially, with 100.0% of males and 100.0% of females in these age groups living above the poverty line.
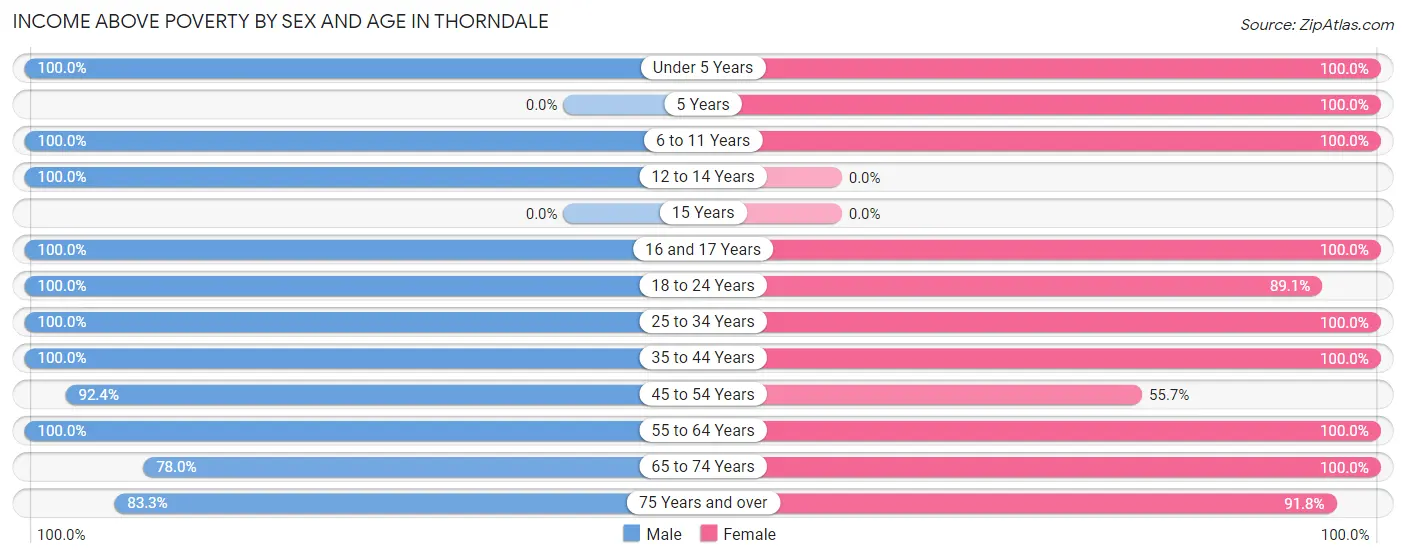
| Age Bracket | Male | Female |
| Under 5 Years | 4 (100.0%) | 77 (100.0%) |
| 5 Years | 0 (0.0%) | 28 (100.0%) |
| 6 to 11 Years | 88 (100.0%) | 18 (100.0%) |
| 12 to 14 Years | 32 (100.0%) | 0 (0.0%) |
| 15 Years | 0 (0.0%) | 0 (0.0%) |
| 16 and 17 Years | 23 (100.0%) | 7 (100.0%) |
| 18 to 24 Years | 17 (100.0%) | 41 (89.1%) |
| 25 to 34 Years | 132 (100.0%) | 120 (100.0%) |
| 35 to 44 Years | 129 (100.0%) | 117 (100.0%) |
| 45 to 54 Years | 85 (92.4%) | 34 (55.7%) |
| 55 to 64 Years | 69 (100.0%) | 125 (100.0%) |
| 65 to 74 Years | 46 (78.0%) | 62 (100.0%) |
| 75 Years and over | 30 (83.3%) | 67 (91.8%) |
| Total | 655 (96.2%) | 696 (94.8%) |
Income Below Poverty Among Married-Couple Families in Thorndale
The poverty statistics for married-couple families in Thorndale show that 2.2% or 6 of the total 271 families live below the poverty line. Families with no children have the highest poverty rate of 3.4%, comprising of 6 families. On the other hand, families with 1 or 2 children have the lowest poverty rate of 0.0%, which includes 0 families.
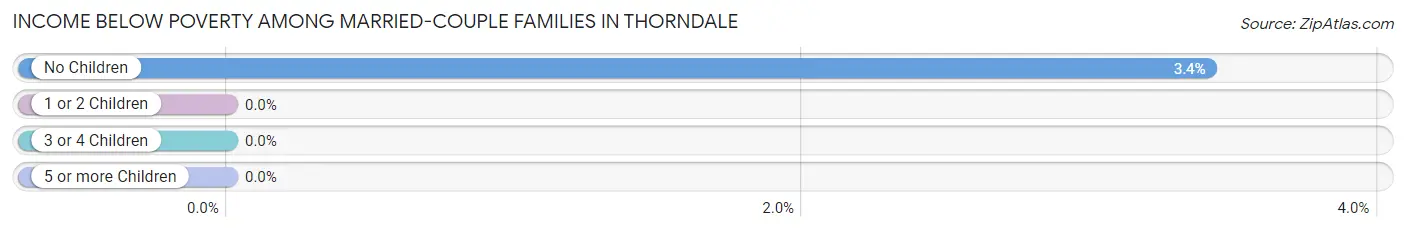
| Children | Above Poverty | Below Poverty |
| No Children | 170 (96.6%) | 6 (3.4%) |
| 1 or 2 Children | 81 (100.0%) | 0 (0.0%) |
| 3 or 4 Children | 14 (100.0%) | 0 (0.0%) |
| 5 or more Children | 0 (0.0%) | 0 (0.0%) |
| Total | 265 (97.8%) | 6 (2.2%) |
Income Below Poverty Among Single-Parent Households in Thorndale
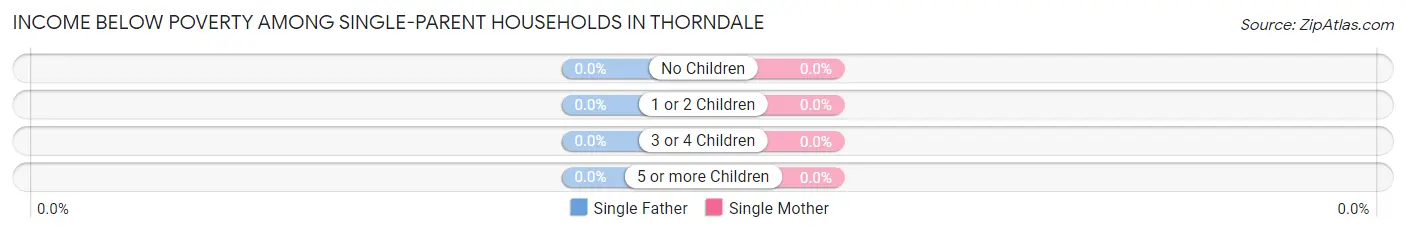
| Children | Single Father | Single Mother |
| No Children | 0 (0.0%) | 0 (0.0%) |
| 1 or 2 Children | 0 (0.0%) | 0 (0.0%) |
| 3 or 4 Children | 0 (0.0%) | 0 (0.0%) |
| 5 or more Children | 0 (0.0%) | 0 (0.0%) |
| Total | 0 (0.0%) | 0 (0.0%) |
Income Below Poverty Among Married-Couple vs Single-Parent Households in Thorndale
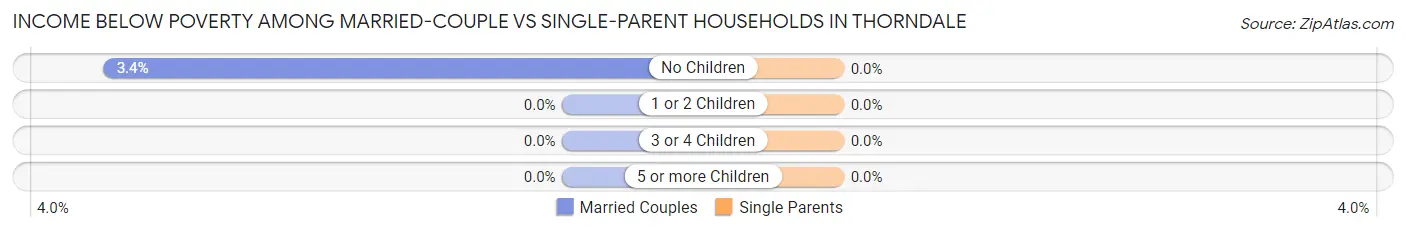
| Children | Married-Couple Families | Single-Parent Households |
| No Children | 6 (3.4%) | 0 (0.0%) |
| 1 or 2 Children | 0 (0.0%) | 0 (0.0%) |
| 3 or 4 Children | 0 (0.0%) | 0 (0.0%) |
| 5 or more Children | 0 (0.0%) | 0 (0.0%) |
| Total | 6 (2.2%) | 0 (0.0%) |
Race in Thorndale
The most populous races in Thorndale are White / Caucasian (1,022 | 72.2%), Hispanic or Latino (437 | 30.9%), and Black / African American (175 | 12.4%).
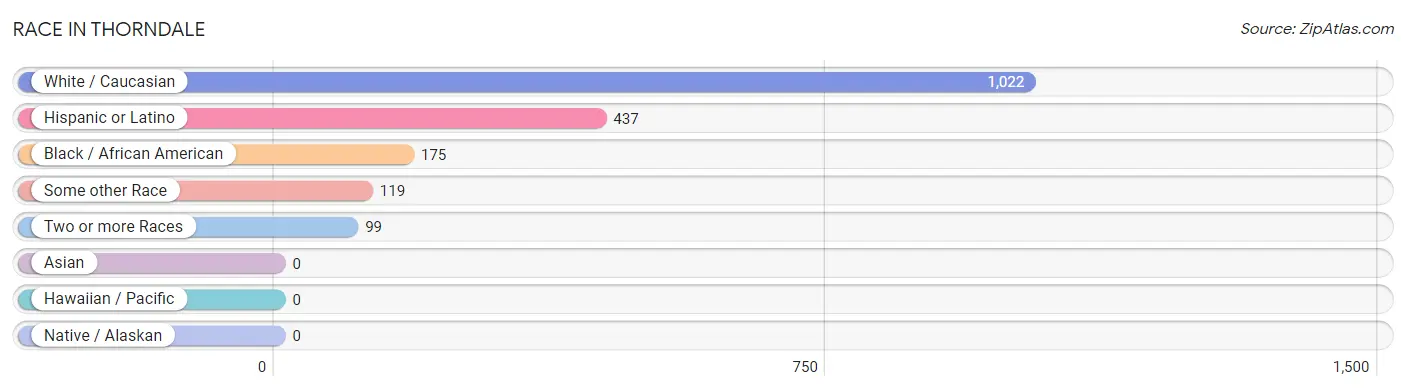
| Race | # Population | % Population |
| Asian | 0 | 0.0% |
| Black / African American | 175 | 12.4% |
| Hawaiian / Pacific | 0 | 0.0% |
| Hispanic or Latino | 437 | 30.9% |
| Native / Alaskan | 0 | 0.0% |
| White / Caucasian | 1,022 | 72.2% |
| Two or more Races | 99 | 7.0% |
| Some other Race | 119 | 8.4% |
| Total | 1,415 | 100.0% |
Ancestry in Thorndale
The most populous ancestries reported in Thorndale are Mexican (392 | 27.7%), German (324 | 22.9%), English (165 | 11.7%), American (111 | 7.8%), and Irish (89 | 6.3%), together accounting for 76.4% of all Thorndale residents.
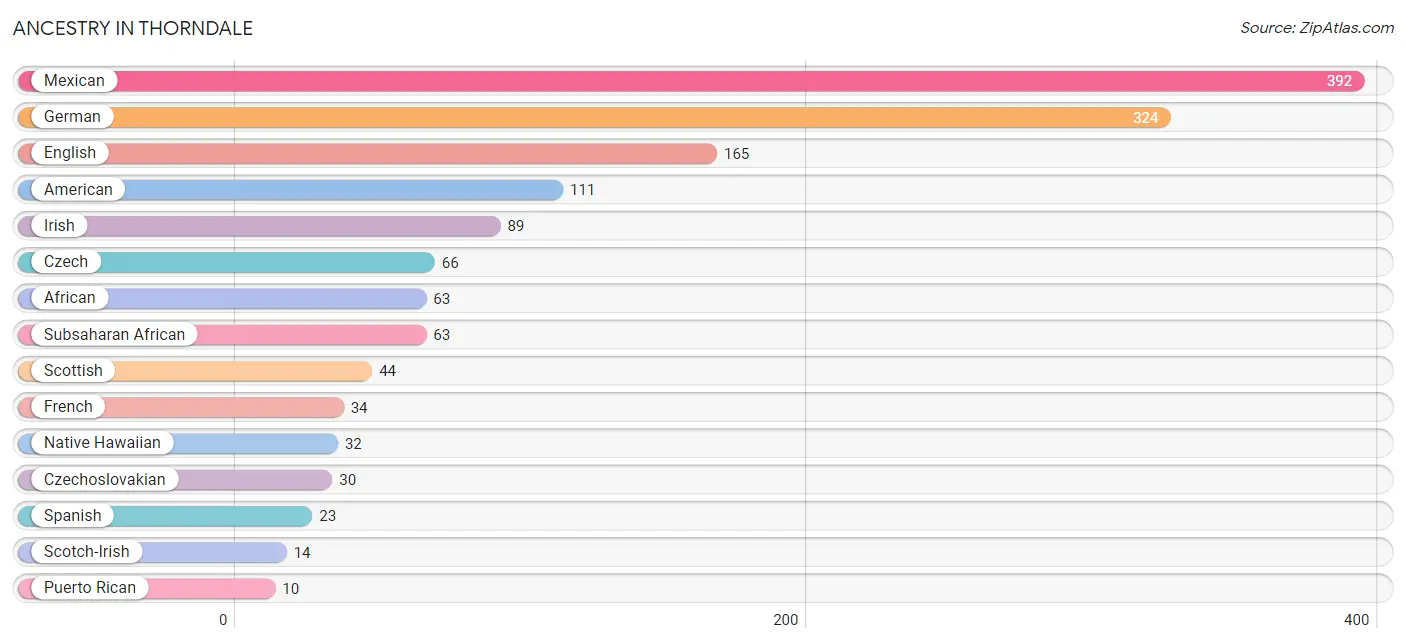
| Ancestry | # Population | % Population |
| African | 63 | 4.4% |
| American | 111 | 7.8% |
| Arab | 2 | 0.1% |
| Bhutanese | 3 | 0.2% |
| Cherokee | 2 | 0.1% |
| Czech | 66 | 4.7% |
| Czechoslovakian | 30 | 2.1% |
| English | 165 | 11.7% |
| European | 6 | 0.4% |
| French | 34 | 2.4% |
| German | 324 | 22.9% |
| Irish | 89 | 6.3% |
| Italian | 3 | 0.2% |
| Lebanese | 2 | 0.1% |
| Mexican | 392 | 27.7% |
| Native Hawaiian | 32 | 2.3% |
| Puerto Rican | 10 | 0.7% |
| Scotch-Irish | 14 | 1.0% |
| Scottish | 44 | 3.1% |
| Spanish | 23 | 1.6% |
| Subsaharan African | 63 | 4.4% | View All 21 Rows |
Immigrants in Thorndale
The most numerous immigrant groups reported in Thorndale came from Central America (42 | 3.0%), Latin America (42 | 3.0%), Mexico (42 | 3.0%), England (5 | 0.4%), and Europe (5 | 0.4%), together accounting for 9.6% of all Thorndale residents.
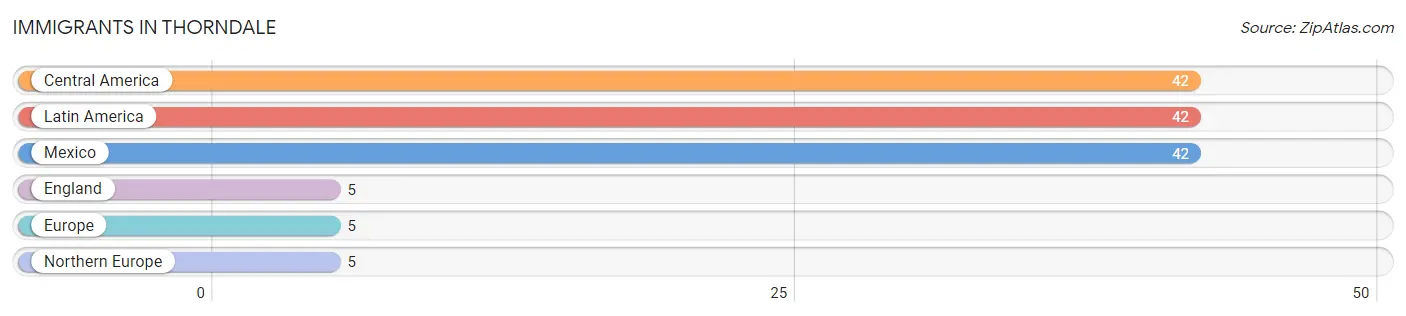
| Immigration Origin | # Population | % Population |
| Central America | 42 | 3.0% |
| England | 5 | 0.4% |
| Europe | 5 | 0.4% |
| Latin America | 42 | 3.0% |
| Mexico | 42 | 3.0% |
| Northern Europe | 5 | 0.4% | View All 6 Rows |
Sex and Age in Thorndale
Sex and Age in Thorndale
The most populous age groups in Thorndale are 35 to 39 Years (106 | 15.6%) for men and 55 to 59 Years (95 | 12.9%) for women.
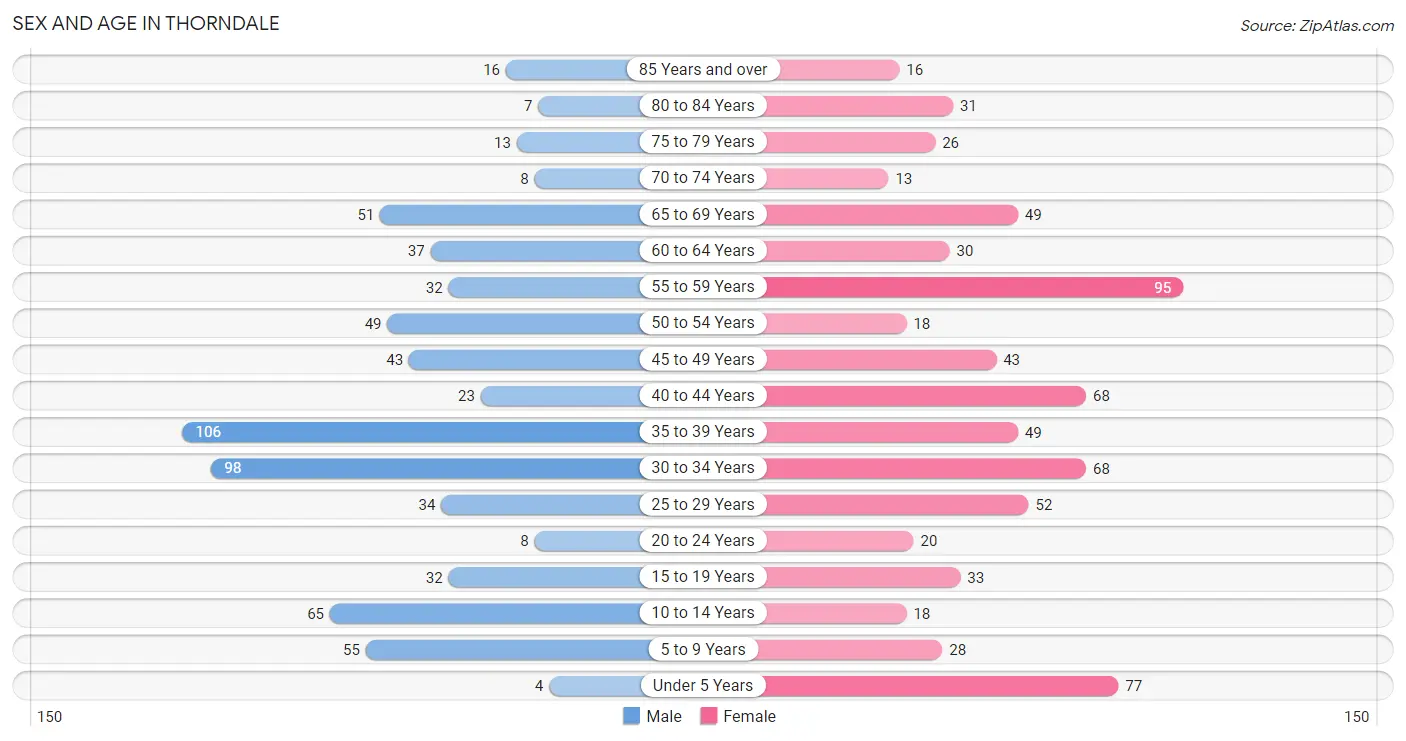
| Age Bracket | Male | Female |
| Under 5 Years | 4 (0.6%) | 77 (10.5%) |
| 5 to 9 Years | 55 (8.1%) | 28 (3.8%) |
| 10 to 14 Years | 65 (9.5%) | 18 (2.5%) |
| 15 to 19 Years | 32 (4.7%) | 33 (4.5%) |
| 20 to 24 Years | 8 (1.2%) | 20 (2.7%) |
| 25 to 29 Years | 34 (5.0%) | 52 (7.1%) |
| 30 to 34 Years | 98 (14.4%) | 68 (9.3%) |
| 35 to 39 Years | 106 (15.6%) | 49 (6.7%) |
| 40 to 44 Years | 23 (3.4%) | 68 (9.3%) |
| 45 to 49 Years | 43 (6.3%) | 43 (5.9%) |
| 50 to 54 Years | 49 (7.2%) | 18 (2.5%) |
| 55 to 59 Years | 32 (4.7%) | 95 (12.9%) |
| 60 to 64 Years | 37 (5.4%) | 30 (4.1%) |
| 65 to 69 Years | 51 (7.5%) | 49 (6.7%) |
| 70 to 74 Years | 8 (1.2%) | 13 (1.8%) |
| 75 to 79 Years | 13 (1.9%) | 26 (3.5%) |
| 80 to 84 Years | 7 (1.0%) | 31 (4.2%) |
| 85 Years and over | 16 (2.4%) | 16 (2.2%) |
| Total | 681 (100.0%) | 734 (100.0%) |
Families and Households in Thorndale
Median Family Size in Thorndale
The median family size in Thorndale is 2.89 persons per family, with married-couple families (271 | 68.3%) accounting for the largest median family size of 3.21 persons per family. On the other hand, single male/father families (37 | 9.3%) represent the smallest median family size with 1.65 persons per family.
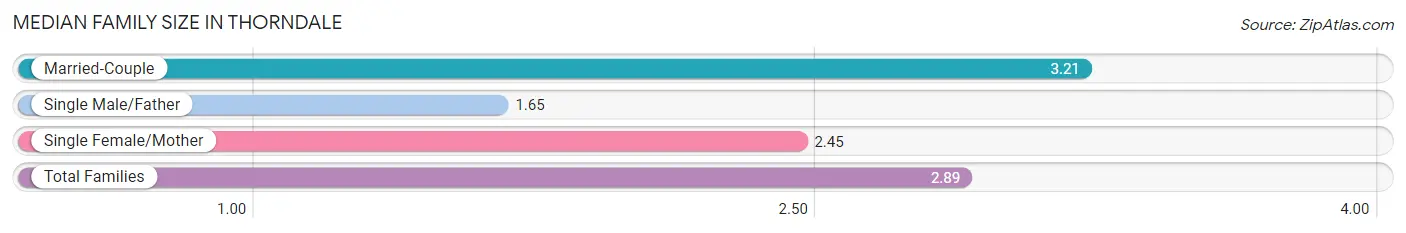
| Family Type | # Families | Family Size |
| Married-Couple | 271 (68.3%) | 3.21 |
| Single Male/Father | 37 (9.3%) | 1.65 |
| Single Female/Mother | 89 (22.4%) | 2.45 |
| Total Families | 397 (100.0%) | 2.89 |
Median Household Size in Thorndale
The median household size in Thorndale is 2.27 persons per household, with married-couple households (271 | 43.6%) accounting for the largest median household size of 3.21 persons per household. non-family households (225 | 36.2%) represent the smallest median household size with 1.07 persons per household.
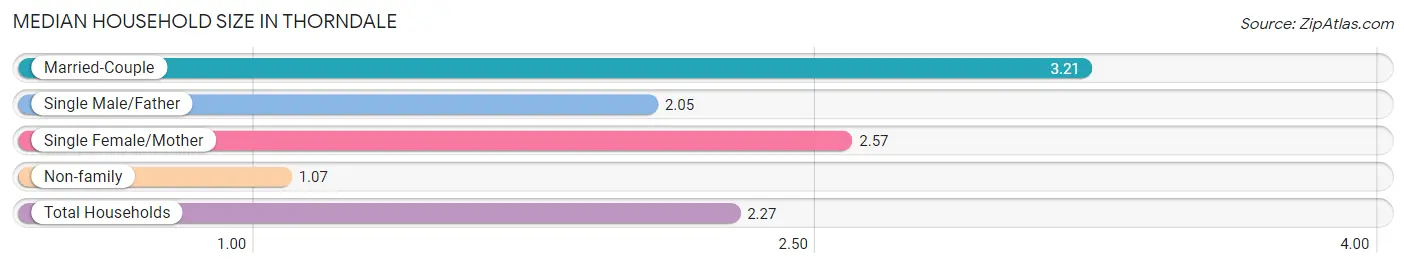
| Household Type | # Households | Household Size |
| Married-Couple | 271 (43.6%) | 3.21 |
| Single Male/Father | 37 (5.9%) | 2.05 |
| Single Female/Mother | 89 (14.3%) | 2.57 |
| Non-family | 225 (36.2%) | 1.07 |
| Total Households | 622 (100.0%) | 2.27 |
Household Size by Marriage Status in Thorndale
Out of a total of 622 households in Thorndale, 397 (63.8%) are family households, while 225 (36.2%) are nonfamily households. The most numerous type of family households are 2-person households, comprising 174, and the most common type of nonfamily households are 1-person households, comprising 211.
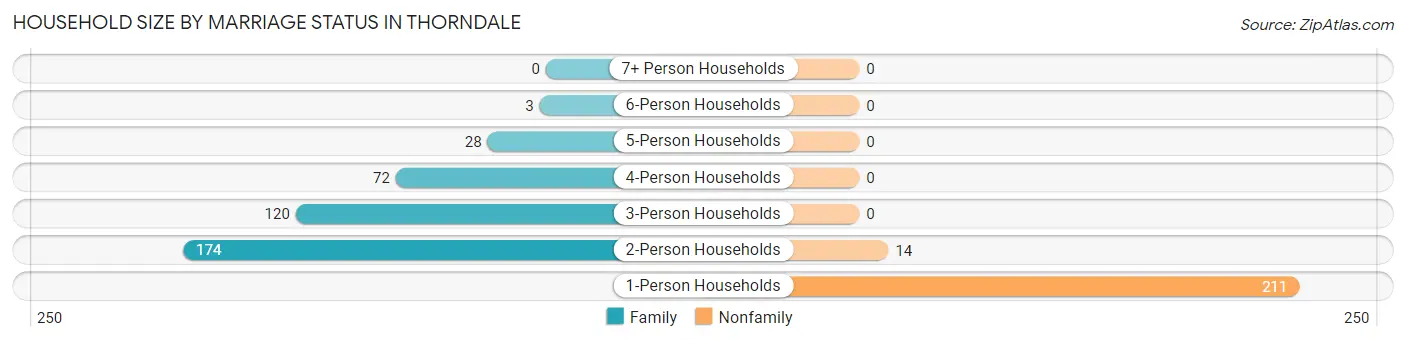
| Household Size | Family Households | Nonfamily Households |
| 1-Person Households | - | 211 (33.9%) |
| 2-Person Households | 174 (28.0%) | 14 (2.2%) |
| 3-Person Households | 120 (19.3%) | 0 (0.0%) |
| 4-Person Households | 72 (11.6%) | 0 (0.0%) |
| 5-Person Households | 28 (4.5%) | 0 (0.0%) |
| 6-Person Households | 3 (0.5%) | 0 (0.0%) |
| 7+ Person Households | 0 (0.0%) | 0 (0.0%) |
| Total | 397 (63.8%) | 225 (36.2%) |
Female Fertility in Thorndale
Fertility by Age in Thorndale
Average fertility rate in Thorndale is 36.0 births per 1,000 women. Women in the age bracket of 20 to 34 years have the highest fertility rate with 86.0 births per 1,000 women. Women in the age bracket of 20 to 34 years acount for 100.0% of all women with births.
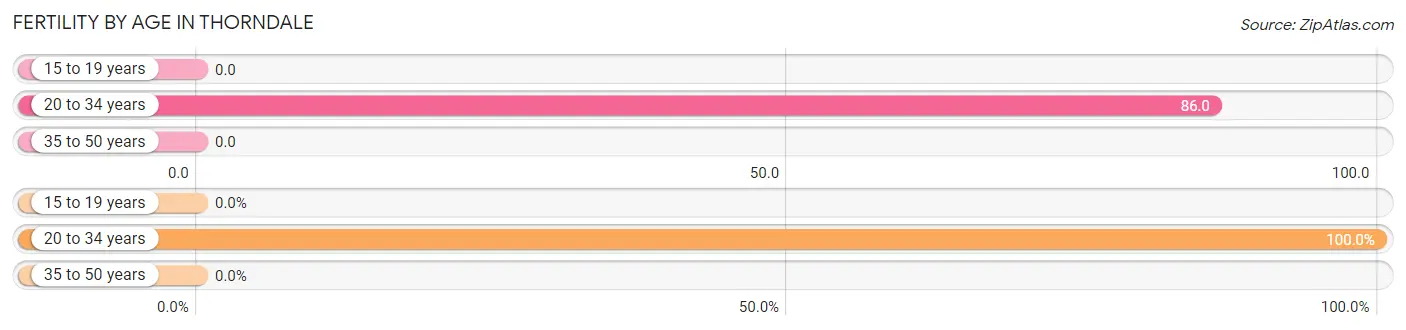
| Age Bracket | Women with Births | Births / 1,000 Women |
| 15 to 19 years | 0 (0.0%) | 0.0 |
| 20 to 34 years | 12 (100.0%) | 86.0 |
| 35 to 50 years | 0 (0.0%) | 0.0 |
| Total | 12 (100.0%) | 36.0 |
Fertility by Age by Marriage Status in Thorndale
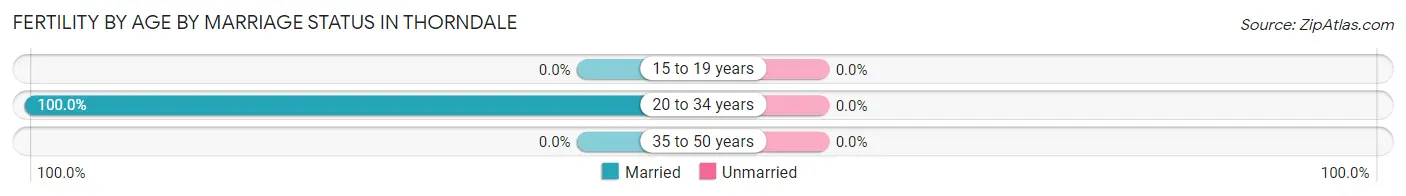
| Age Bracket | Married | Unmarried |
| 15 to 19 years | 0 (0.0%) | 0 (0.0%) |
| 20 to 34 years | 12 (100.0%) | 0 (0.0%) |
| 35 to 50 years | 0 (0.0%) | 0 (0.0%) |
| Total | 12 (100.0%) | 0 (0.0%) |
Fertility by Education in Thorndale
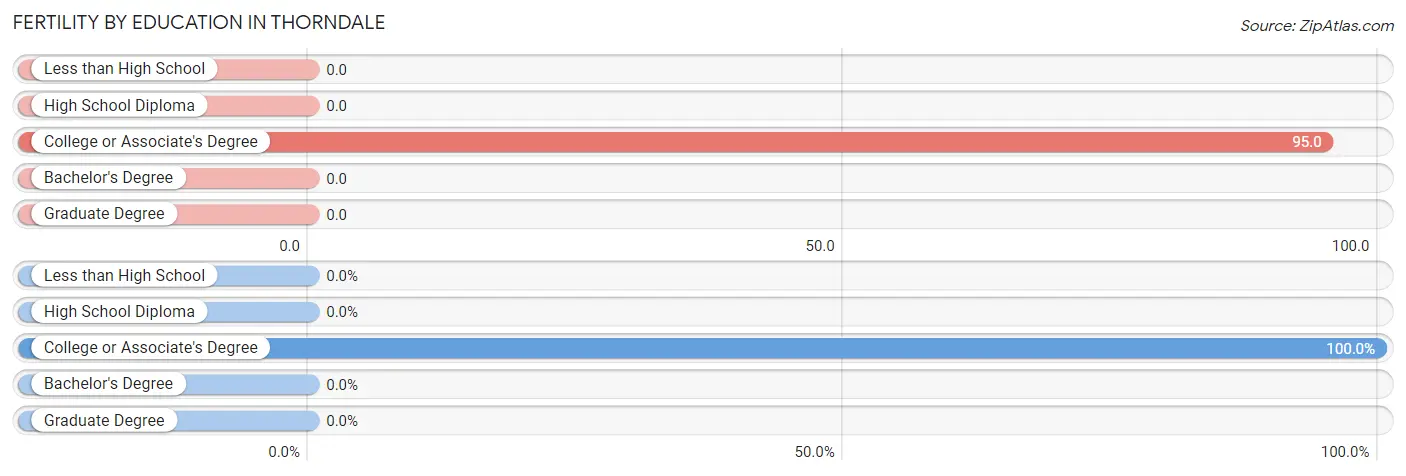
| Educational Attainment | Women with Births | Births / 1,000 Women |
| Less than High School | 0 (0.0%) | 0.0 |
| High School Diploma | 0 (0.0%) | 0.0 |
| College or Associate's Degree | 12 (100.0%) | 95.0 |
| Bachelor's Degree | 0 (0.0%) | 0.0 |
| Graduate Degree | 0 (0.0%) | 0.0 |
| Total | 12 (100.0%) | 36.0 |
Fertility by Education by Marriage Status in Thorndale
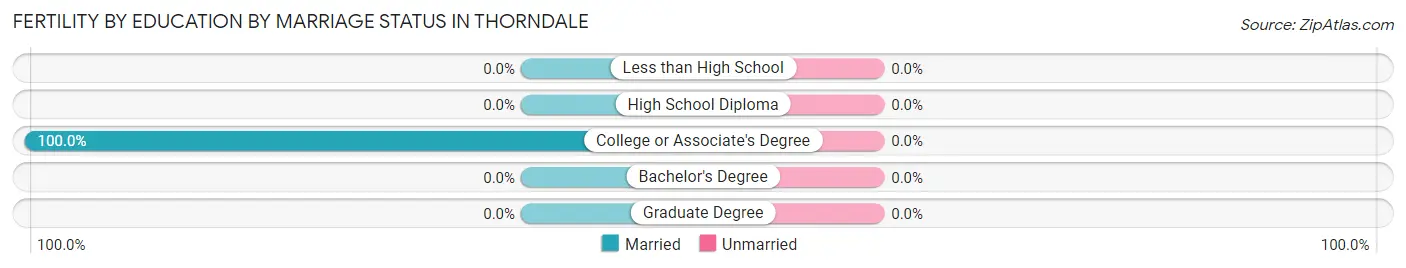
| Educational Attainment | Married | Unmarried |
| Less than High School | 0 (0.0%) | 0 (0.0%) |
| High School Diploma | 0 (0.0%) | 0 (0.0%) |
| College or Associate's Degree | 12 (100.0%) | 0 (0.0%) |
| Bachelor's Degree | 0 (0.0%) | 0 (0.0%) |
| Graduate Degree | 0 (0.0%) | 0 (0.0%) |
| Total | 12 (100.0%) | 0 (0.0%) |
Employment Characteristics in Thorndale
Employment by Class of Employer in Thorndale
Among the 749 employed individuals in Thorndale, private company employees (493 | 65.8%), local government employees (103 | 13.8%), and not-for-profit organizations (89 | 11.9%) make up the most common classes of employment.
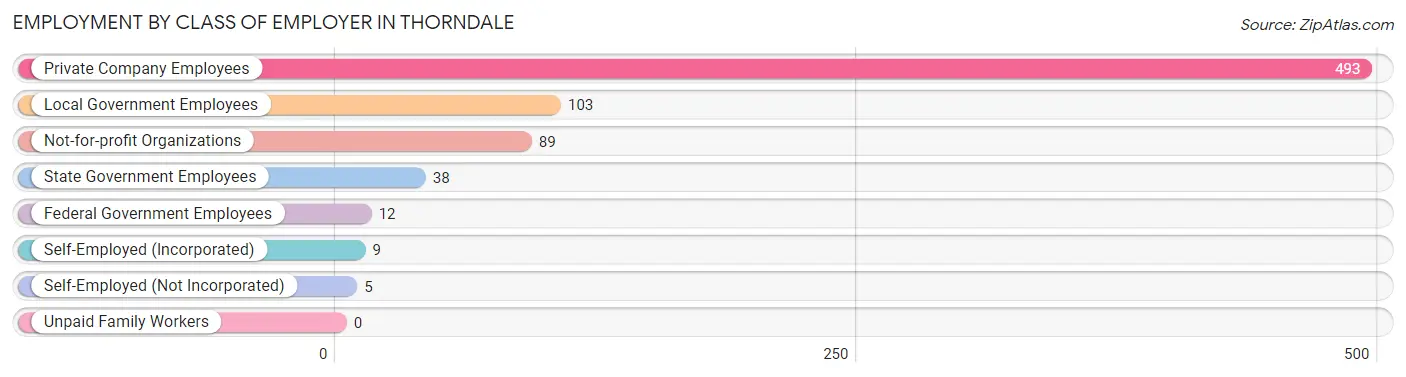
| Employer Class | # Employees | % Employees |
| Private Company Employees | 493 | 65.8% |
| Self-Employed (Incorporated) | 9 | 1.2% |
| Self-Employed (Not Incorporated) | 5 | 0.7% |
| Not-for-profit Organizations | 89 | 11.9% |
| Local Government Employees | 103 | 13.8% |
| State Government Employees | 38 | 5.1% |
| Federal Government Employees | 12 | 1.6% |
| Unpaid Family Workers | 0 | 0.0% |
| Total | 749 | 100.0% |
Employment Status by Age in Thorndale
According to the labor force statistics for Thorndale, out of the total population over 16 years of age (1,168), 64.8% or 757 individuals are in the labor force, with 1.1% or 8 of them unemployed. The age group with the highest labor force participation rate is 20 to 24 years, with 100.0% or 28 individuals in the labor force. Within the labor force, the 16 to 19 years age range has the highest percentage of unemployed individuals, with 23.1% or 6 of them being unemployed.
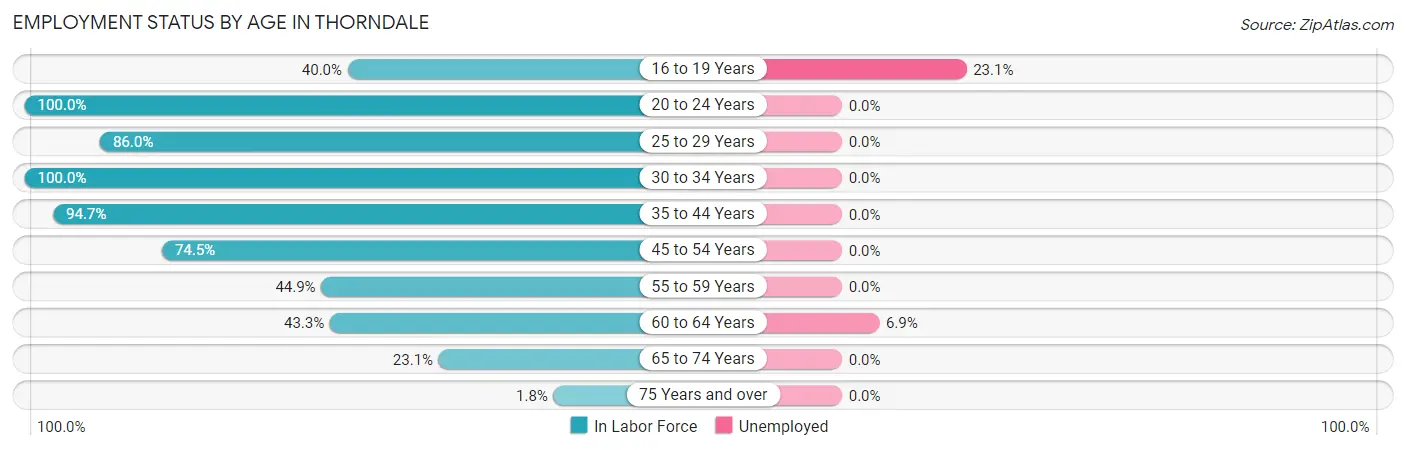
| Age Bracket | In Labor Force | Unemployed |
| 16 to 19 Years | 26 (40.0%) | 6 (23.1%) |
| 20 to 24 Years | 28 (100.0%) | 0 (0.0%) |
| 25 to 29 Years | 74 (86.0%) | 0 (0.0%) |
| 30 to 34 Years | 166 (100.0%) | 0 (0.0%) |
| 35 to 44 Years | 233 (94.7%) | 0 (0.0%) |
| 45 to 54 Years | 114 (74.5%) | 0 (0.0%) |
| 55 to 59 Years | 57 (44.9%) | 0 (0.0%) |
| 60 to 64 Years | 29 (43.3%) | 2 (6.9%) |
| 65 to 74 Years | 28 (23.1%) | 0 (0.0%) |
| 75 Years and over | 2 (1.8%) | 0 (0.0%) |
| Total | 757 (64.8%) | 8 (1.1%) |
Employment Status by Educational Attainment in Thorndale
According to labor force statistics for Thorndale, 79.6% of individuals (673) out of the total population between 25 and 64 years of age (845) are in the labor force, with 0.3% or 2 of them being unemployed. The group with the highest labor force participation rate are those with the educational attainment of bachelor's degree or higher, with 92.7% or 166 individuals in the labor force. Within the labor force, individuals with bachelor's degree or higher education have the highest percentage of unemployment, with 1.2% or 2 of them being unemployed.
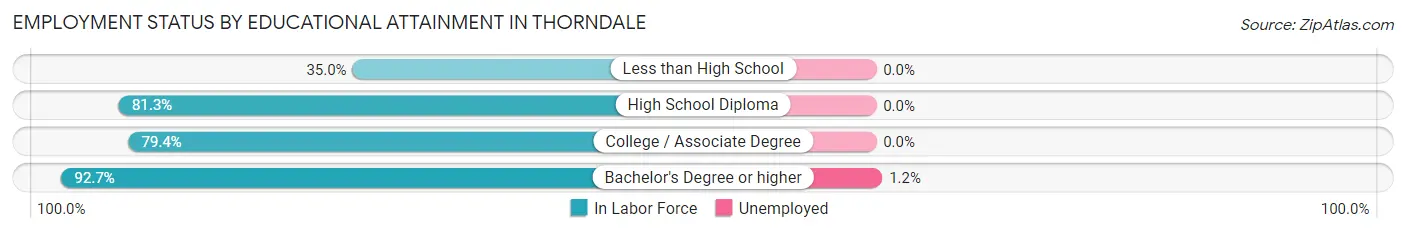
| Educational Attainment | In Labor Force | Unemployed |
| Less than High School | 21 (35.0%) | 0 (0.0%) |
| High School Diploma | 209 (81.3%) | 0 (0.0%) |
| College / Associate Degree | 277 (79.4%) | 0 (0.0%) |
| Bachelor's Degree or higher | 166 (92.7%) | 2 (1.2%) |
| Total | 673 (79.6%) | 3 (0.3%) |
Employment Occupations by Sex in Thorndale
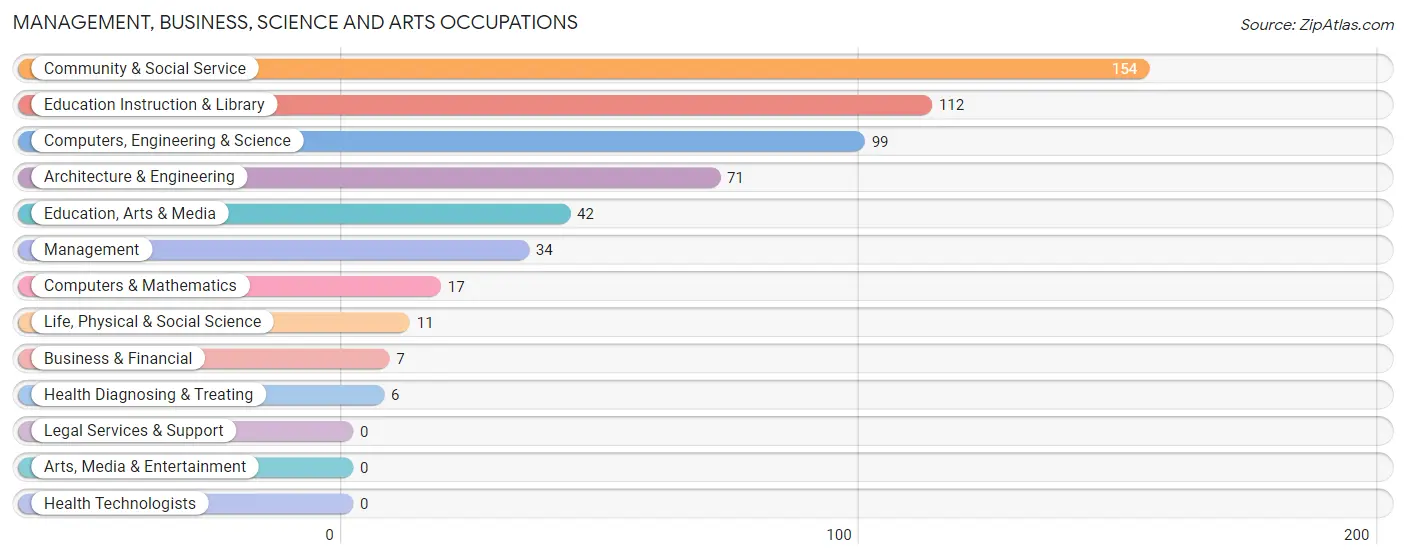
Management, Business, Science and Arts Occupations
The most common Management, Business, Science and Arts occupations in Thorndale are Community & Social Service (154 | 20.6%), Education Instruction & Library (112 | 14.9%), Computers, Engineering & Science (99 | 13.2%), Architecture & Engineering (71 | 9.5%), and Education, Arts & Media (42 | 5.6%).
Management, Business, Science and Arts Occupations by Sex
Within the Management, Business, Science and Arts occupations in Thorndale, the most male-oriented occupations are Architecture & Engineering (100.0%), Life, Physical & Social Science (100.0%), and Computers, Engineering & Science (82.8%), while the most female-oriented occupations are Computers & Mathematics (100.0%), Health Diagnosing & Treating (100.0%), and Education Instruction & Library (76.8%).
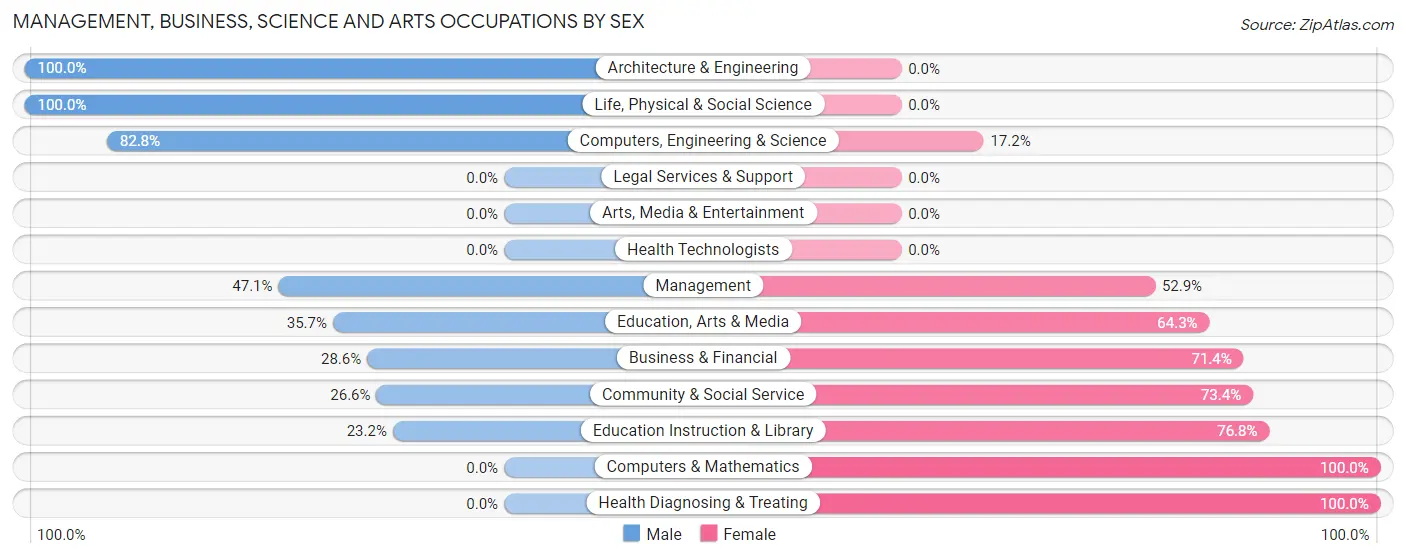
| Occupation | Male | Female |
| Management | 16 (47.1%) | 18 (52.9%) |
| Business & Financial | 2 (28.6%) | 5 (71.4%) |
| Computers, Engineering & Science | 82 (82.8%) | 17 (17.2%) |
| Computers & Mathematics | 0 (0.0%) | 17 (100.0%) |
| Architecture & Engineering | 71 (100.0%) | 0 (0.0%) |
| Life, Physical & Social Science | 11 (100.0%) | 0 (0.0%) |
| Community & Social Service | 41 (26.6%) | 113 (73.4%) |
| Education, Arts & Media | 15 (35.7%) | 27 (64.3%) |
| Legal Services & Support | 0 (0.0%) | 0 (0.0%) |
| Education Instruction & Library | 26 (23.2%) | 86 (76.8%) |
| Arts, Media & Entertainment | 0 (0.0%) | 0 (0.0%) |
| Health Diagnosing & Treating | 0 (0.0%) | 6 (100.0%) |
| Health Technologists | 0 (0.0%) | 0 (0.0%) |
| Total (Category) | 141 (47.0%) | 159 (53.0%) |
| Total (Overall) | 430 (57.4%) | 319 (42.6%) |
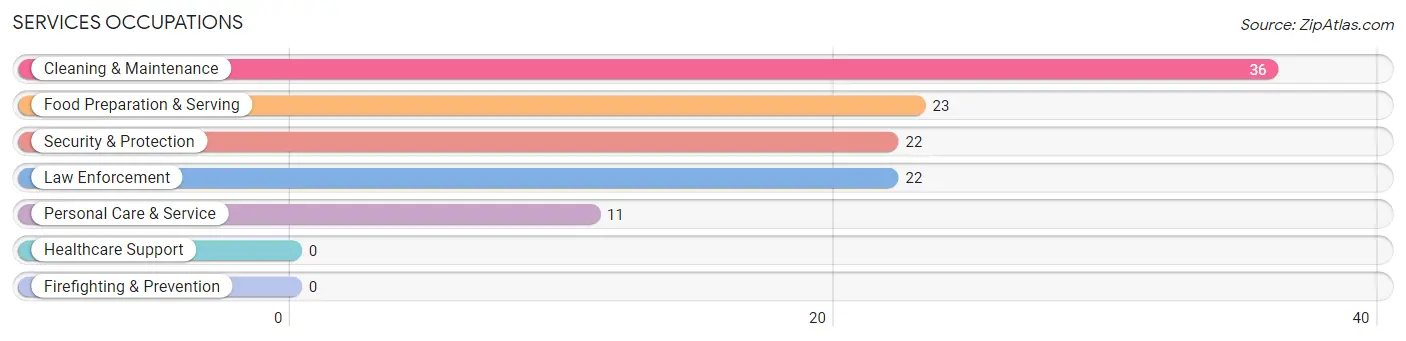
Services Occupations
The most common Services occupations in Thorndale are Cleaning & Maintenance (36 | 4.8%), Food Preparation & Serving (23 | 3.1%), Security & Protection (22 | 2.9%), Law Enforcement (22 | 2.9%), and Personal Care & Service (11 | 1.5%).
Services Occupations by Sex
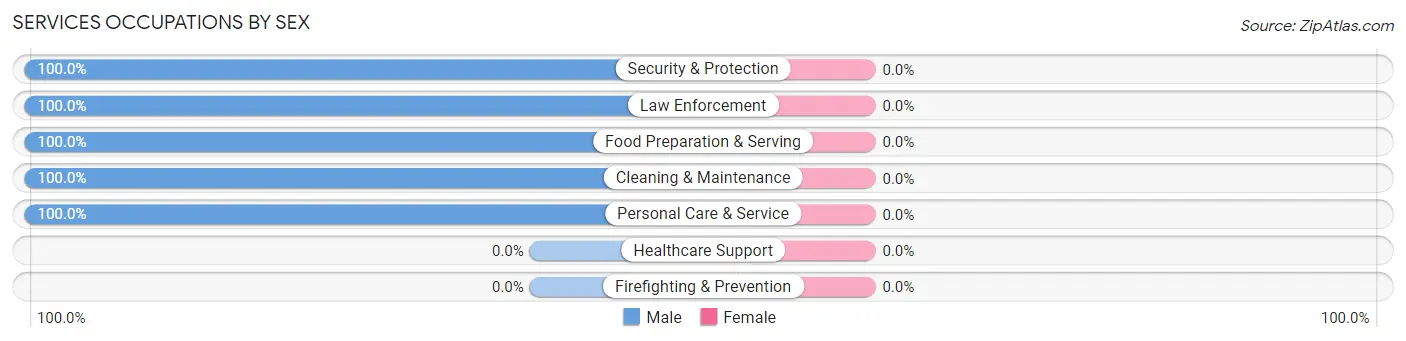
| Occupation | Male | Female |
| Healthcare Support | 0 (0.0%) | 0 (0.0%) |
| Security & Protection | 22 (100.0%) | 0 (0.0%) |
| Firefighting & Prevention | 0 (0.0%) | 0 (0.0%) |
| Law Enforcement | 22 (100.0%) | 0 (0.0%) |
| Food Preparation & Serving | 23 (100.0%) | 0 (0.0%) |
| Cleaning & Maintenance | 36 (100.0%) | 0 (0.0%) |
| Personal Care & Service | 11 (100.0%) | 0 (0.0%) |
| Total (Category) | 92 (100.0%) | 0 (0.0%) |
| Total (Overall) | 430 (57.4%) | 319 (42.6%) |
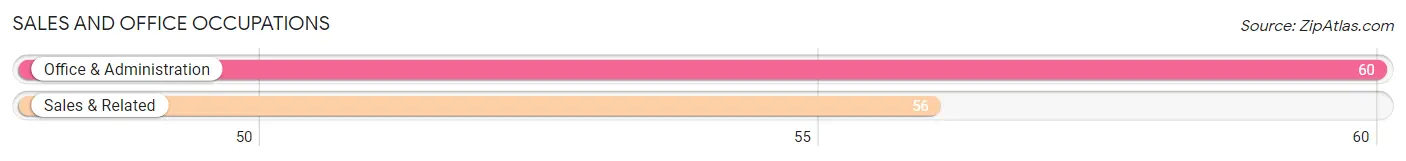
Sales and Office Occupations
The most common Sales and Office occupations in Thorndale are Office & Administration (60 | 8.0%), and Sales & Related (56 | 7.5%).
Sales and Office Occupations by Sex
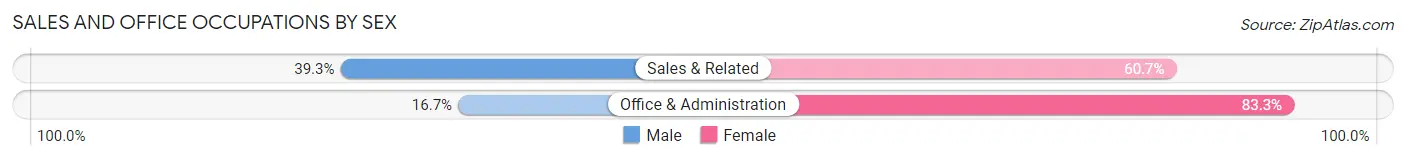
| Occupation | Male | Female |
| Sales & Related | 22 (39.3%) | 34 (60.7%) |
| Office & Administration | 10 (16.7%) | 50 (83.3%) |
| Total (Category) | 32 (27.6%) | 84 (72.4%) |
| Total (Overall) | 430 (57.4%) | 319 (42.6%) |
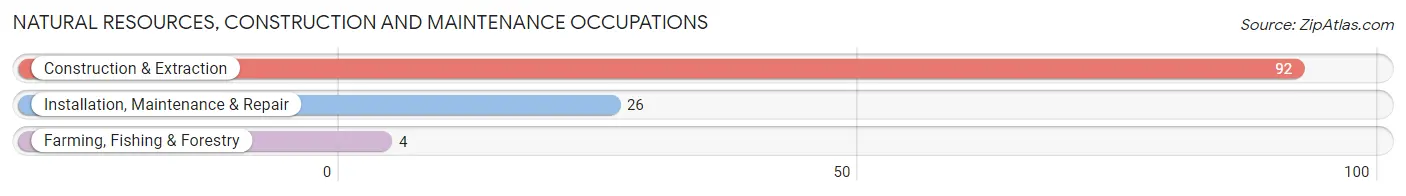
Natural Resources, Construction and Maintenance Occupations
The most common Natural Resources, Construction and Maintenance occupations in Thorndale are Construction & Extraction (92 | 12.3%), Installation, Maintenance & Repair (26 | 3.5%), and Farming, Fishing & Forestry (4 | 0.5%).
Natural Resources, Construction and Maintenance Occupations by Sex
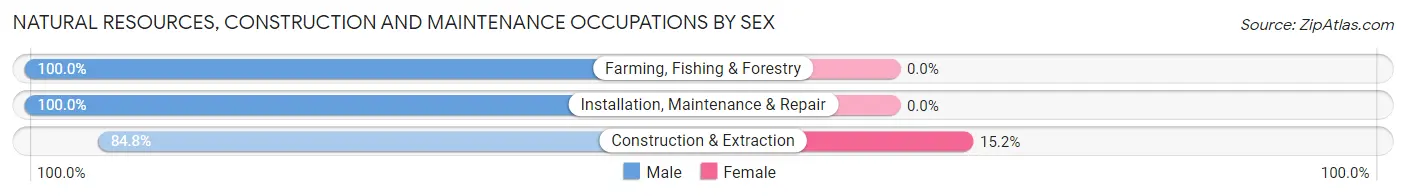
| Occupation | Male | Female |
| Farming, Fishing & Forestry | 4 (100.0%) | 0 (0.0%) |
| Construction & Extraction | 78 (84.8%) | 14 (15.2%) |
| Installation, Maintenance & Repair | 26 (100.0%) | 0 (0.0%) |
| Total (Category) | 108 (88.5%) | 14 (11.5%) |
| Total (Overall) | 430 (57.4%) | 319 (42.6%) |
Production, Transportation and Moving Occupations
The most common Production, Transportation and Moving occupations in Thorndale are Material Moving (58 | 7.7%), Production (41 | 5.5%), and Transportation (20 | 2.7%).
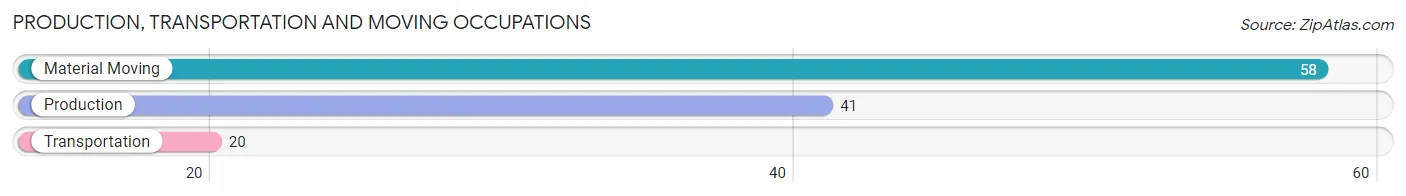
Production, Transportation and Moving Occupations by Sex
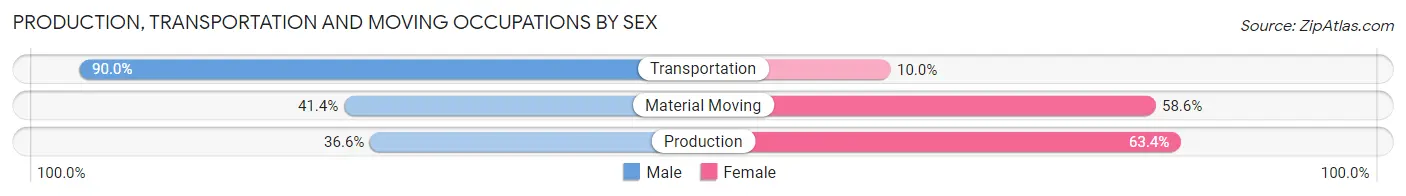
| Occupation | Male | Female |
| Production | 15 (36.6%) | 26 (63.4%) |
| Transportation | 18 (90.0%) | 2 (10.0%) |
| Material Moving | 24 (41.4%) | 34 (58.6%) |
| Total (Category) | 57 (47.9%) | 62 (52.1%) |
| Total (Overall) | 430 (57.4%) | 319 (42.6%) |
Employment Industries by Sex in Thorndale
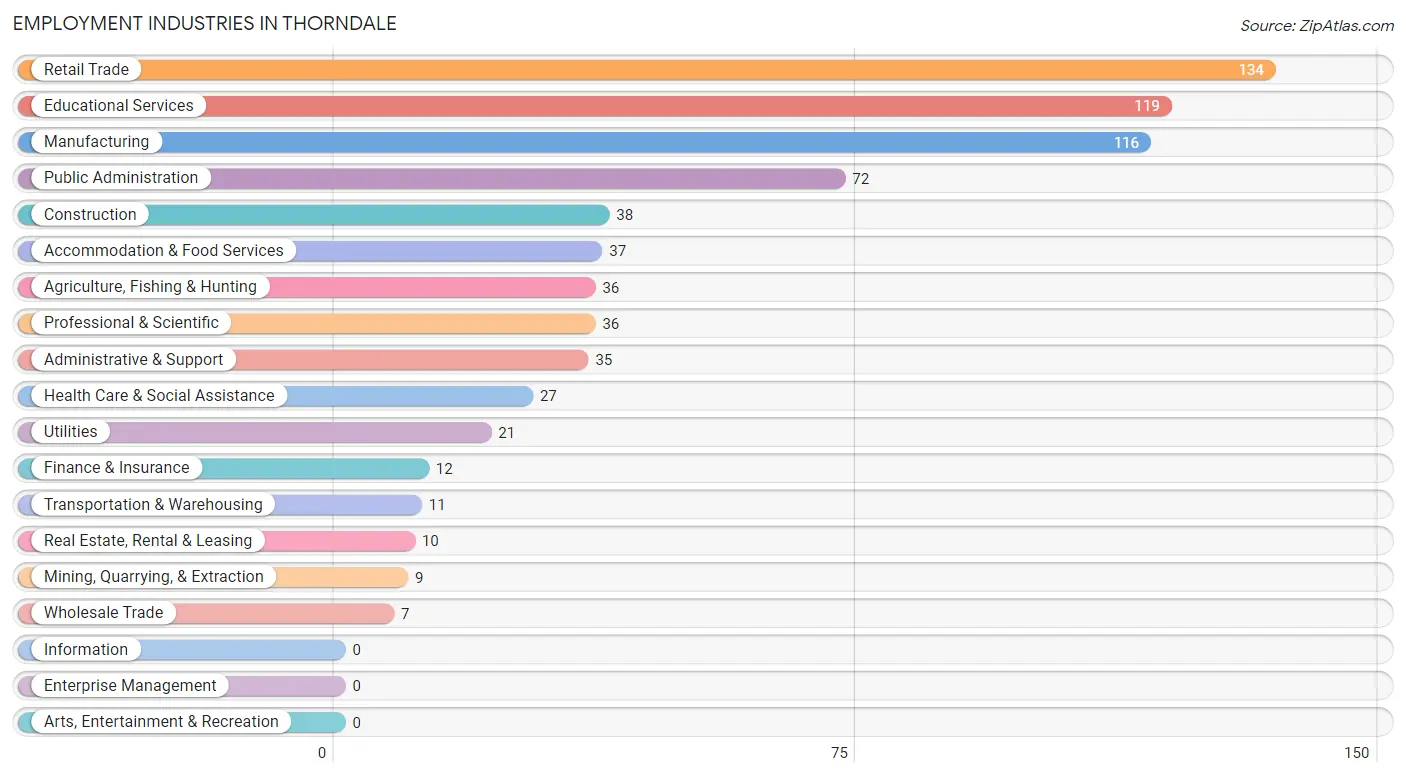
Employment Industries in Thorndale
The major employment industries in Thorndale include Retail Trade (134 | 17.9%), Educational Services (119 | 15.9%), Manufacturing (116 | 15.5%), Public Administration (72 | 9.6%), and Construction (38 | 5.1%).
Employment Industries by Sex in Thorndale
The Thorndale industries that see more men than women are Mining, Quarrying, & Extraction (100.0%), Wholesale Trade (100.0%), and Administrative & Support (100.0%), whereas the industries that tend to have a higher number of women are Finance & Insurance (100.0%), Educational Services (74.8%), and Health Care & Social Assistance (70.4%).
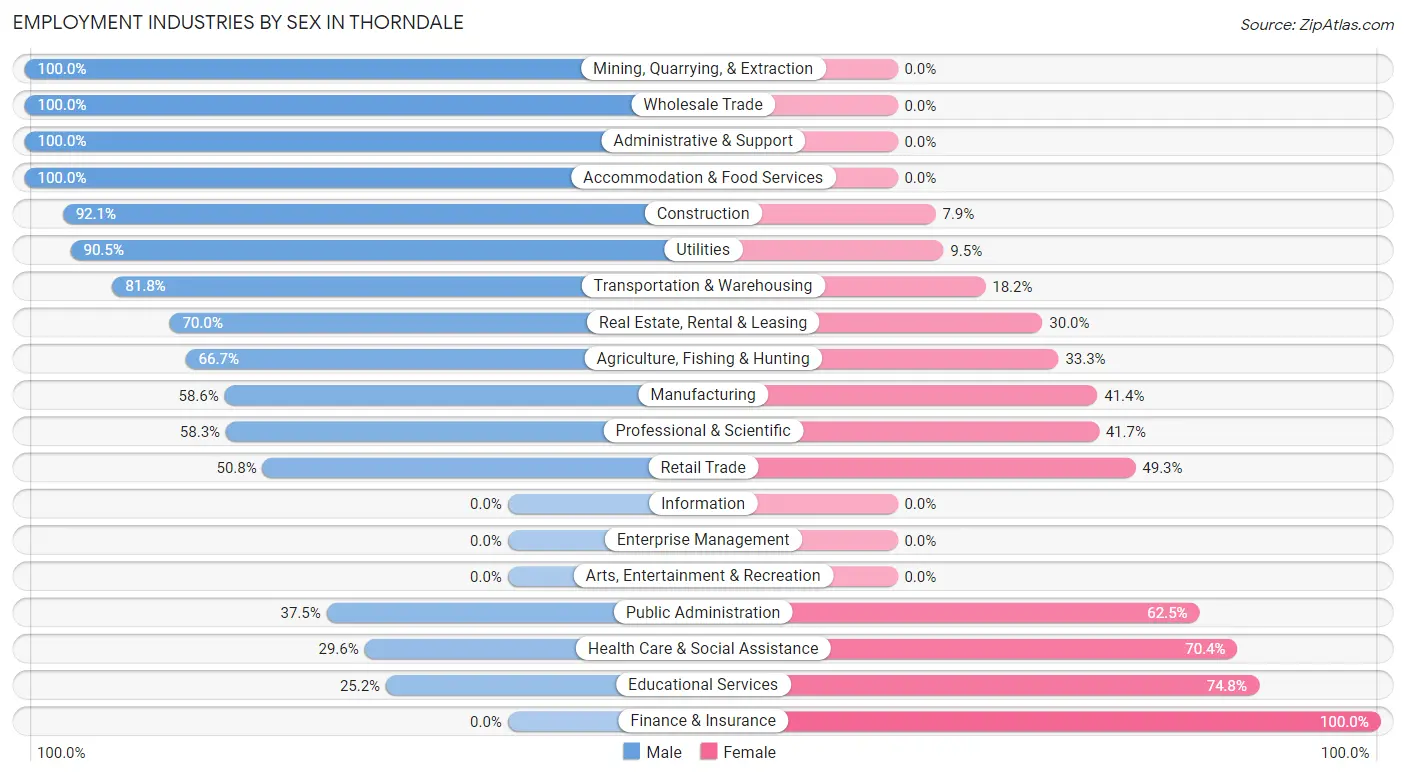
| Industry | Male | Female |
| Agriculture, Fishing & Hunting | 24 (66.7%) | 12 (33.3%) |
| Mining, Quarrying, & Extraction | 9 (100.0%) | 0 (0.0%) |
| Construction | 35 (92.1%) | 3 (7.9%) |
| Manufacturing | 68 (58.6%) | 48 (41.4%) |
| Wholesale Trade | 7 (100.0%) | 0 (0.0%) |
| Retail Trade | 68 (50.7%) | 66 (49.2%) |
| Transportation & Warehousing | 9 (81.8%) | 2 (18.2%) |
| Utilities | 19 (90.5%) | 2 (9.5%) |
| Information | 0 (0.0%) | 0 (0.0%) |
| Finance & Insurance | 0 (0.0%) | 12 (100.0%) |
| Real Estate, Rental & Leasing | 7 (70.0%) | 3 (30.0%) |
| Professional & Scientific | 21 (58.3%) | 15 (41.7%) |
| Enterprise Management | 0 (0.0%) | 0 (0.0%) |
| Administrative & Support | 35 (100.0%) | 0 (0.0%) |
| Educational Services | 30 (25.2%) | 89 (74.8%) |
| Health Care & Social Assistance | 8 (29.6%) | 19 (70.4%) |
| Arts, Entertainment & Recreation | 0 (0.0%) | 0 (0.0%) |
| Accommodation & Food Services | 37 (100.0%) | 0 (0.0%) |
| Public Administration | 27 (37.5%) | 45 (62.5%) |
| Total | 430 (57.4%) | 319 (42.6%) |
Education in Thorndale
School Enrollment in Thorndale
The most common levels of schooling among the 248 students in Thorndale are elementary school (80 | 32.3%), high school (76 | 30.6%), and middle school (38 | 15.3%).
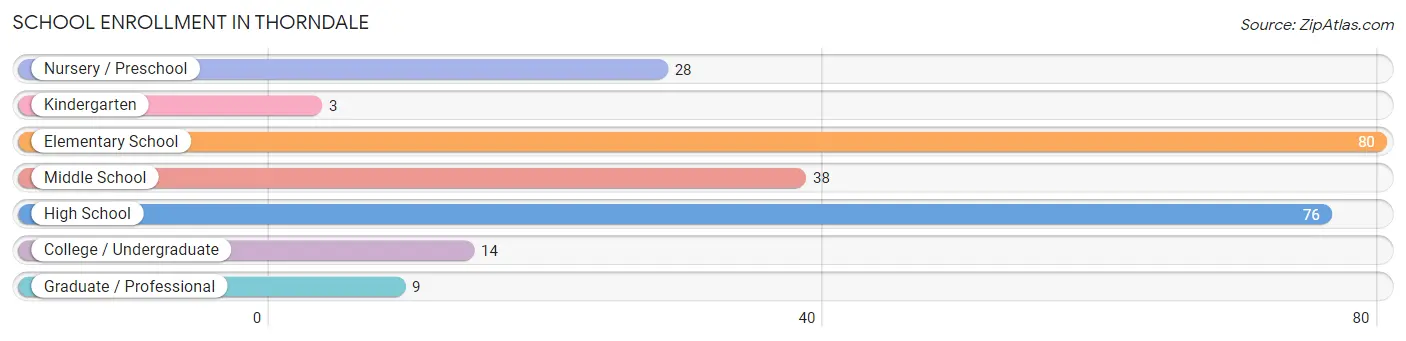
| School Level | # Students | % Students |
| Nursery / Preschool | 28 | 11.3% |
| Kindergarten | 3 | 1.2% |
| Elementary School | 80 | 32.3% |
| Middle School | 38 | 15.3% |
| High School | 76 | 30.6% |
| College / Undergraduate | 14 | 5.7% |
| Graduate / Professional | 9 | 3.6% |
| Total | 248 | 100.0% |
School Enrollment by Age by Funding Source in Thorndale
Out of a total of 248 students who are enrolled in schools in Thorndale, 32 (12.9%) attend a private institution, while the remaining 216 (87.1%) are enrolled in public schools. The age group of 35 years and over has the highest likelihood of being enrolled in private schools, with 11 (55.0% in the age bracket) enrolled. Conversely, the age group of 3 to 4 year olds has the lowest likelihood of being enrolled in a private school, with 3 (100.0% in the age bracket) attending a public institution.
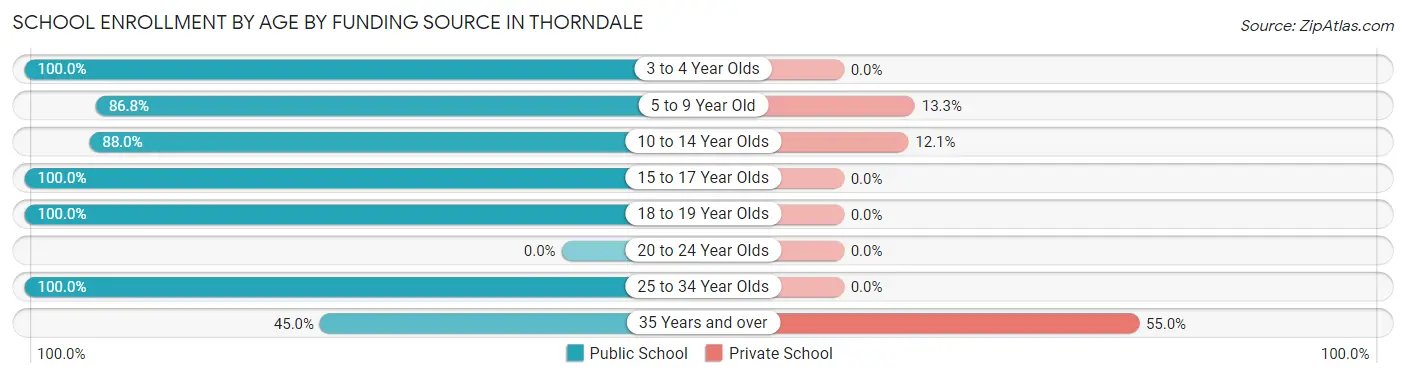
| Age Bracket | Public School | Private School |
| 3 to 4 Year Olds | 3 (100.0%) | 0 (0.0%) |
| 5 to 9 Year Old | 72 (86.8%) | 11 (13.3%) |
| 10 to 14 Year Olds | 73 (87.9%) | 10 (12.0%) |
| 15 to 17 Year Olds | 30 (100.0%) | 0 (0.0%) |
| 18 to 19 Year Olds | 26 (100.0%) | 0 (0.0%) |
| 20 to 24 Year Olds | 0 (0.0%) | 0 (0.0%) |
| 25 to 34 Year Olds | 3 (100.0%) | 0 (0.0%) |
| 35 Years and over | 9 (45.0%) | 11 (55.0%) |
| Total | 216 (87.1%) | 32 (12.9%) |
Educational Attainment by Field of Study in Thorndale
Education (119 | 48.0%), liberal arts & history (42 | 16.9%), business (37 | 14.9%), bio, nature & agricultural (19 | 7.7%), and communications (16 | 6.5%) are the most common fields of study among 248 individuals in Thorndale who have obtained a bachelor's degree or higher.
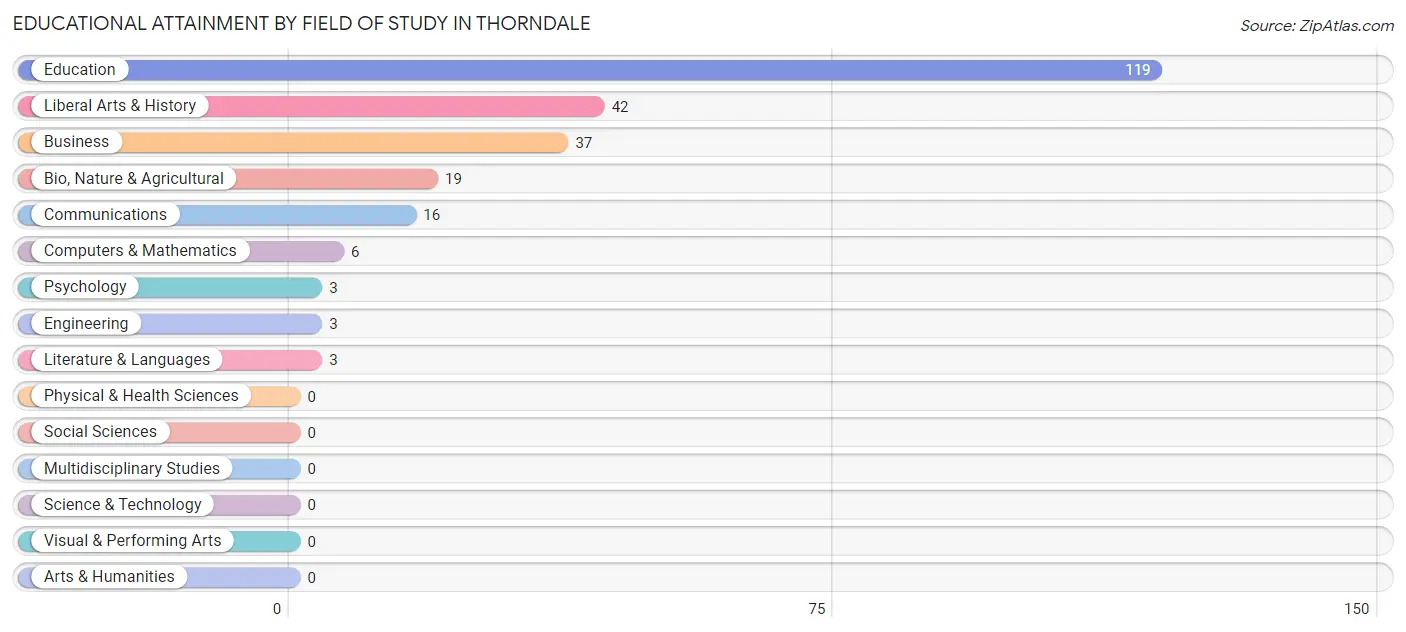
| Field of Study | # Graduates | % Graduates |
| Computers & Mathematics | 6 | 2.4% |
| Bio, Nature & Agricultural | 19 | 7.7% |
| Physical & Health Sciences | 0 | 0.0% |
| Psychology | 3 | 1.2% |
| Social Sciences | 0 | 0.0% |
| Engineering | 3 | 1.2% |
| Multidisciplinary Studies | 0 | 0.0% |
| Science & Technology | 0 | 0.0% |
| Business | 37 | 14.9% |
| Education | 119 | 48.0% |
| Literature & Languages | 3 | 1.2% |
| Liberal Arts & History | 42 | 16.9% |
| Visual & Performing Arts | 0 | 0.0% |
| Communications | 16 | 6.5% |
| Arts & Humanities | 0 | 0.0% |
| Total | 248 | 100.0% |
Transportation & Commute in Thorndale
Vehicle Availability by Sex in Thorndale
The most prevalent vehicle ownership categories in Thorndale are males with 2 vehicles (209, accounting for 48.6%) and females with 2 vehicles (135, making up 65.5%).
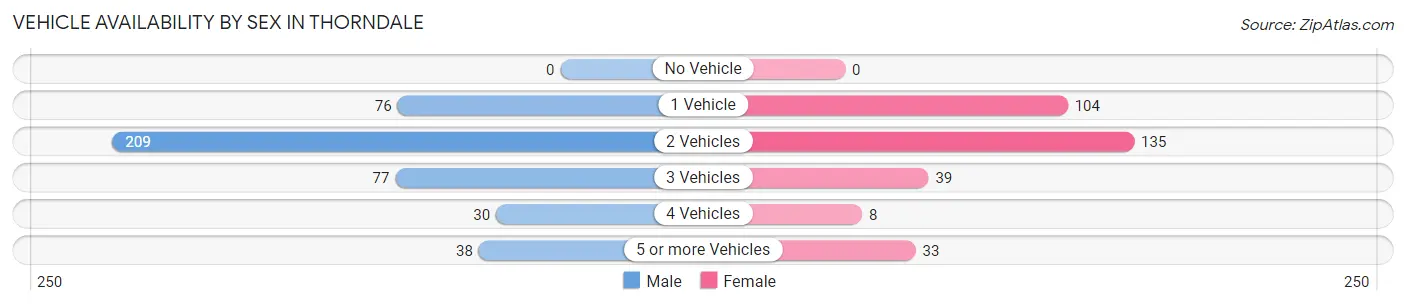
| Vehicles Available | Male | Female |
| No Vehicle | 0 (0.0%) | 0 (0.0%) |
| 1 Vehicle | 76 (17.7%) | 104 (32.6%) |
| 2 Vehicles | 209 (48.6%) | 135 (42.3%) |
| 3 Vehicles | 77 (17.9%) | 39 (12.2%) |
| 4 Vehicles | 30 (7.0%) | 8 (2.5%) |
| 5 or more Vehicles | 38 (8.8%) | 33 (10.3%) |
| Total | 430 (100.0%) | 319 (100.0%) |
Commute Time in Thorndale
The most frequently occuring commute durations in Thorndale are less than 5 minutes (142 commuters, 19.4%), 45 to 59 minutes (123 commuters, 16.8%), and 15 to 19 minutes (108 commuters, 14.7%).
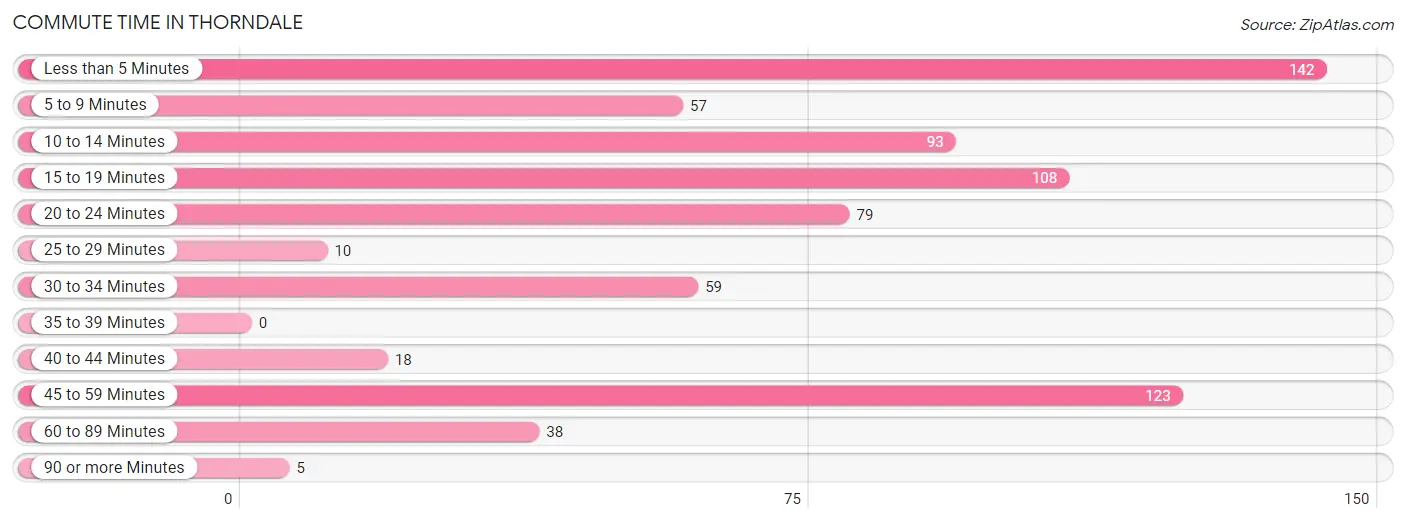
| Commute Time | # Commuters | % Commuters |
| Less than 5 Minutes | 142 | 19.4% |
| 5 to 9 Minutes | 57 | 7.8% |
| 10 to 14 Minutes | 93 | 12.7% |
| 15 to 19 Minutes | 108 | 14.7% |
| 20 to 24 Minutes | 79 | 10.8% |
| 25 to 29 Minutes | 10 | 1.4% |
| 30 to 34 Minutes | 59 | 8.1% |
| 35 to 39 Minutes | 0 | 0.0% |
| 40 to 44 Minutes | 18 | 2.5% |
| 45 to 59 Minutes | 123 | 16.8% |
| 60 to 89 Minutes | 38 | 5.2% |
| 90 or more Minutes | 5 | 0.7% |
Commute Time by Sex in Thorndale
The most common commute times in Thorndale are 10 to 14 minutes (93 commuters, 22.3%) for males and less than 5 minutes (97 commuters, 30.8%) for females.
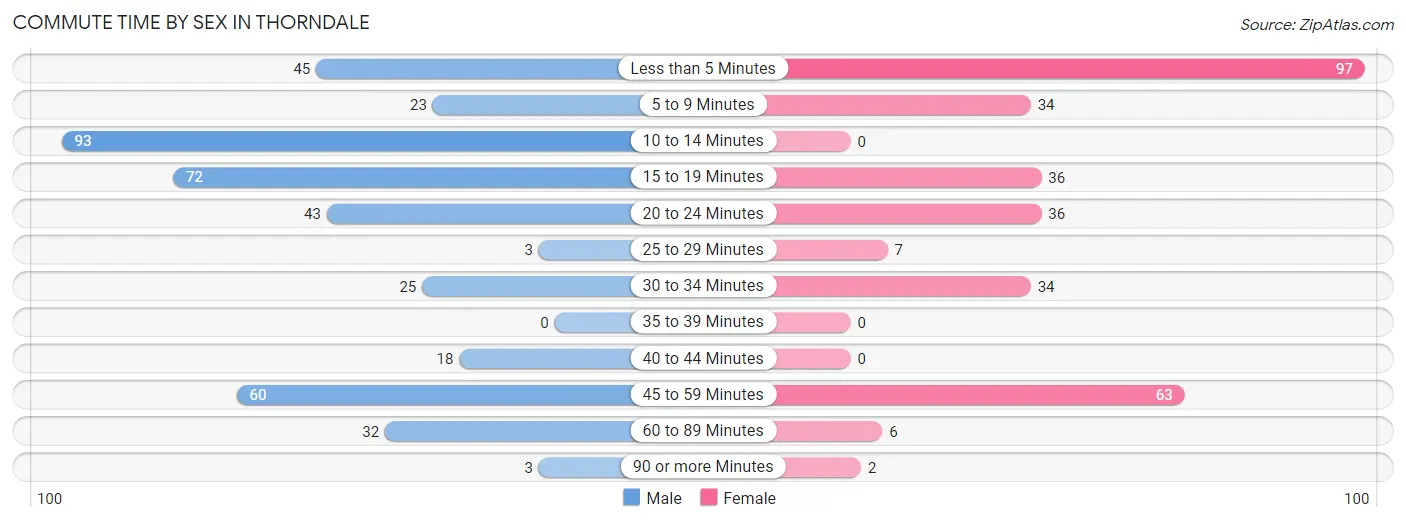
| Commute Time | Male | Female |
| Less than 5 Minutes | 45 (10.8%) | 97 (30.8%) |
| 5 to 9 Minutes | 23 (5.5%) | 34 (10.8%) |
| 10 to 14 Minutes | 93 (22.3%) | 0 (0.0%) |
| 15 to 19 Minutes | 72 (17.3%) | 36 (11.4%) |
| 20 to 24 Minutes | 43 (10.3%) | 36 (11.4%) |
| 25 to 29 Minutes | 3 (0.7%) | 7 (2.2%) |
| 30 to 34 Minutes | 25 (6.0%) | 34 (10.8%) |
| 35 to 39 Minutes | 0 (0.0%) | 0 (0.0%) |
| 40 to 44 Minutes | 18 (4.3%) | 0 (0.0%) |
| 45 to 59 Minutes | 60 (14.4%) | 63 (20.0%) |
| 60 to 89 Minutes | 32 (7.7%) | 6 (1.9%) |
| 90 or more Minutes | 3 (0.7%) | 2 (0.6%) |
Time of Departure to Work by Sex in Thorndale
The most frequent times of departure to work in Thorndale are 6:00 AM to 6:29 AM (76, 18.2%) for males and 7:00 AM to 7:29 AM (89, 28.2%) for females.
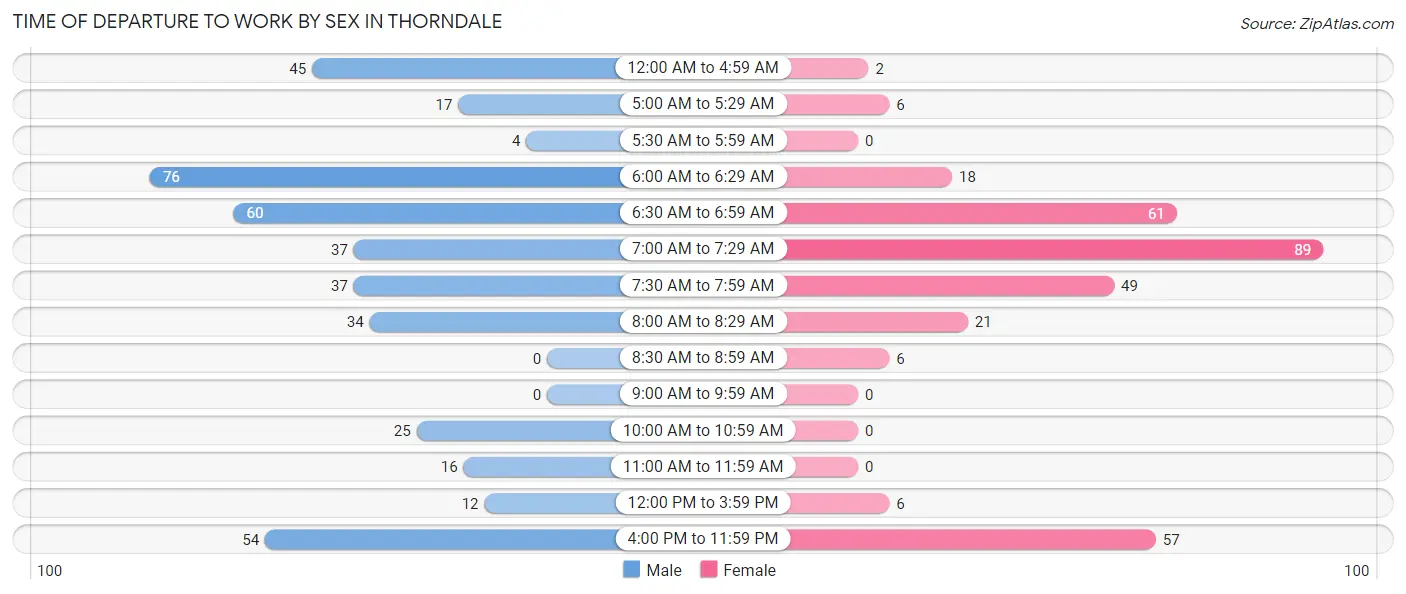
| Time of Departure | Male | Female |
| 12:00 AM to 4:59 AM | 45 (10.8%) | 2 (0.6%) |
| 5:00 AM to 5:29 AM | 17 (4.1%) | 6 (1.9%) |
| 5:30 AM to 5:59 AM | 4 (1.0%) | 0 (0.0%) |
| 6:00 AM to 6:29 AM | 76 (18.2%) | 18 (5.7%) |
| 6:30 AM to 6:59 AM | 60 (14.4%) | 61 (19.4%) |
| 7:00 AM to 7:29 AM | 37 (8.9%) | 89 (28.2%) |
| 7:30 AM to 7:59 AM | 37 (8.9%) | 49 (15.6%) |
| 8:00 AM to 8:29 AM | 34 (8.2%) | 21 (6.7%) |
| 8:30 AM to 8:59 AM | 0 (0.0%) | 6 (1.9%) |
| 9:00 AM to 9:59 AM | 0 (0.0%) | 0 (0.0%) |
| 10:00 AM to 10:59 AM | 25 (6.0%) | 0 (0.0%) |
| 11:00 AM to 11:59 AM | 16 (3.8%) | 0 (0.0%) |
| 12:00 PM to 3:59 PM | 12 (2.9%) | 6 (1.9%) |
| 4:00 PM to 11:59 PM | 54 (13.0%) | 57 (18.1%) |
| Total | 417 (100.0%) | 315 (100.0%) |
Housing Occupancy in Thorndale
Occupancy by Ownership in Thorndale
Of the total 622 dwellings in Thorndale, owner-occupied units account for 431 (69.3%), while renter-occupied units make up 191 (30.7%).
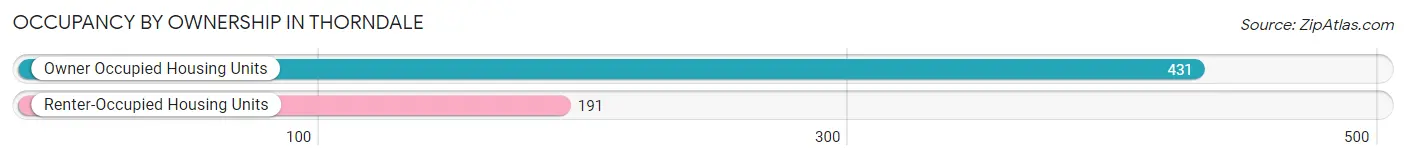
| Occupancy | # Housing Units | % Housing Units |
| Owner Occupied Housing Units | 431 | 69.3% |
| Renter-Occupied Housing Units | 191 | 30.7% |
| Total Occupied Housing Units | 622 | 100.0% |
Occupancy by Household Size in Thorndale
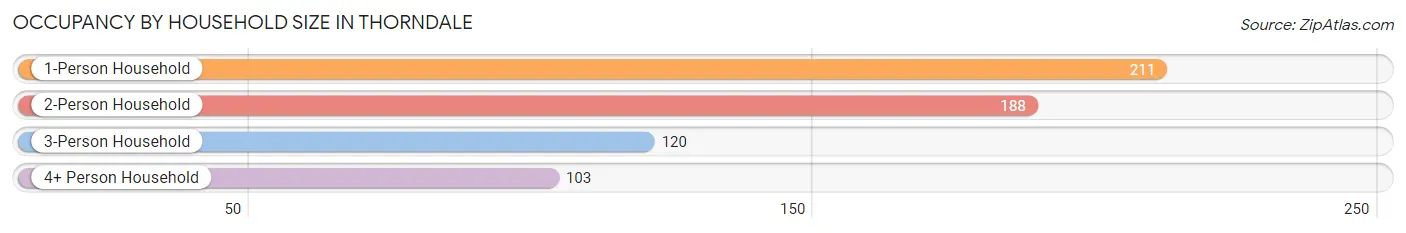
| Household Size | # Housing Units | % Housing Units |
| 1-Person Household | 211 | 33.9% |
| 2-Person Household | 188 | 30.2% |
| 3-Person Household | 120 | 19.3% |
| 4+ Person Household | 103 | 16.6% |
| Total Housing Units | 622 | 100.0% |
Occupancy by Ownership by Household Size in Thorndale
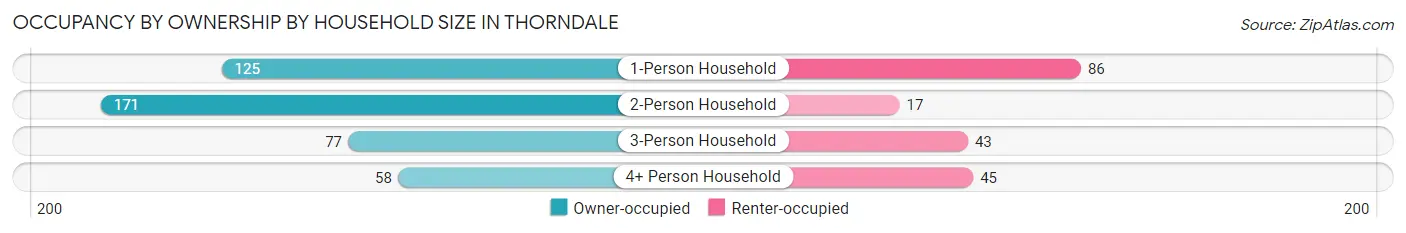
| Household Size | Owner-occupied | Renter-occupied |
| 1-Person Household | 125 (59.2%) | 86 (40.8%) |
| 2-Person Household | 171 (91.0%) | 17 (9.0%) |
| 3-Person Household | 77 (64.2%) | 43 (35.8%) |
| 4+ Person Household | 58 (56.3%) | 45 (43.7%) |
| Total Housing Units | 431 (69.3%) | 191 (30.7%) |
Occupancy by Educational Attainment in Thorndale
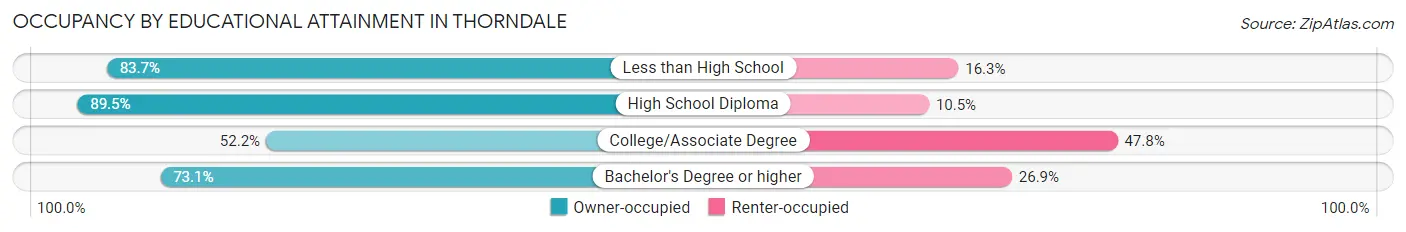
| Household Size | Owner-occupied | Renter-occupied |
| Less than High School | 36 (83.7%) | 7 (16.3%) |
| High School Diploma | 137 (89.5%) | 16 (10.5%) |
| College/Associate Degree | 133 (52.2%) | 122 (47.8%) |
| Bachelor's Degree or higher | 125 (73.1%) | 46 (26.9%) |
Occupancy by Age of Householder in Thorndale
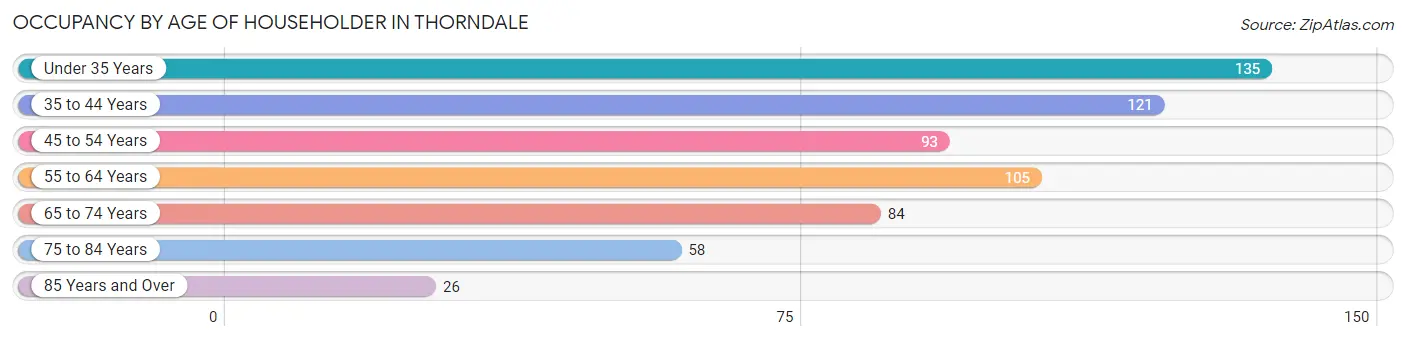
| Age Bracket | # Households | % Households |
| Under 35 Years | 135 | 21.7% |
| 35 to 44 Years | 121 | 19.5% |
| 45 to 54 Years | 93 | 14.9% |
| 55 to 64 Years | 105 | 16.9% |
| 65 to 74 Years | 84 | 13.5% |
| 75 to 84 Years | 58 | 9.3% |
| 85 Years and Over | 26 | 4.2% |
| Total | 622 | 100.0% |
Housing Finances in Thorndale
Median Income by Occupancy in Thorndale
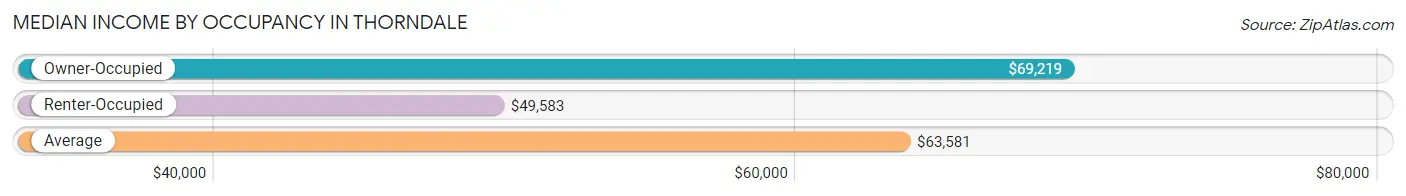
| Occupancy Type | # Households | Median Income |
| Owner-Occupied | 431 (69.3%) | $69,219 |
| Renter-Occupied | 191 (30.7%) | $49,583 |
| Average | 622 (100.0%) | $63,581 |
Occupancy by Householder Income Bracket in Thorndale
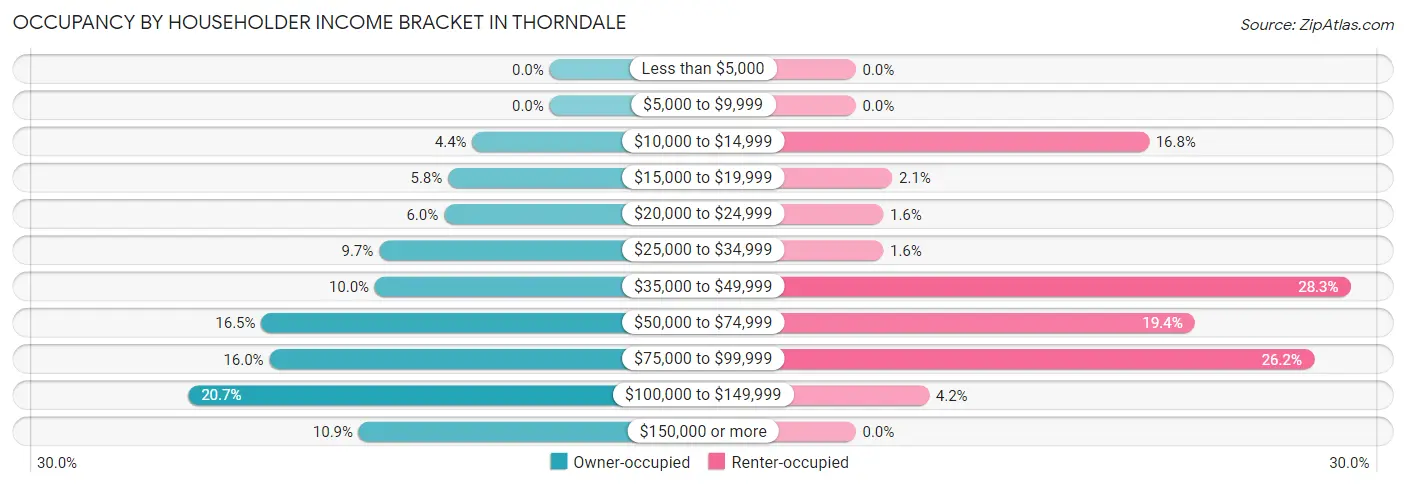
| Income Bracket | Owner-occupied | Renter-occupied |
| Less than $5,000 | 0 (0.0%) | 0 (0.0%) |
| $5,000 to $9,999 | 0 (0.0%) | 0 (0.0%) |
| $10,000 to $14,999 | 19 (4.4%) | 32 (16.8%) |
| $15,000 to $19,999 | 25 (5.8%) | 4 (2.1%) |
| $20,000 to $24,999 | 26 (6.0%) | 3 (1.6%) |
| $25,000 to $34,999 | 42 (9.7%) | 3 (1.6%) |
| $35,000 to $49,999 | 43 (10.0%) | 54 (28.3%) |
| $50,000 to $74,999 | 71 (16.5%) | 37 (19.4%) |
| $75,000 to $99,999 | 69 (16.0%) | 50 (26.2%) |
| $100,000 to $149,999 | 89 (20.6%) | 8 (4.2%) |
| $150,000 or more | 47 (10.9%) | 0 (0.0%) |
| Total | 431 (100.0%) | 191 (100.0%) |
Monthly Housing Cost Tiers in Thorndale
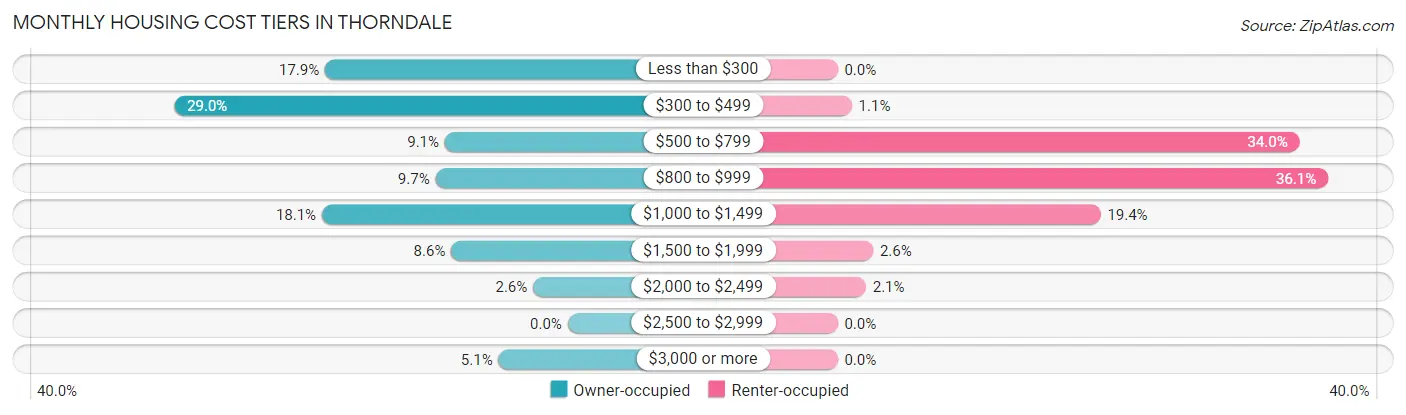
| Monthly Cost | Owner-occupied | Renter-occupied |
| Less than $300 | 77 (17.9%) | 0 (0.0%) |
| $300 to $499 | 125 (29.0%) | 2 (1.1%) |
| $500 to $799 | 39 (9.0%) | 65 (34.0%) |
| $800 to $999 | 42 (9.7%) | 69 (36.1%) |
| $1,000 to $1,499 | 78 (18.1%) | 37 (19.4%) |
| $1,500 to $1,999 | 37 (8.6%) | 5 (2.6%) |
| $2,000 to $2,499 | 11 (2.5%) | 4 (2.1%) |
| $2,500 to $2,999 | 0 (0.0%) | 0 (0.0%) |
| $3,000 or more | 22 (5.1%) | 0 (0.0%) |
| Total | 431 (100.0%) | 191 (100.0%) |
Physical Housing Characteristics in Thorndale
Housing Structures in Thorndale
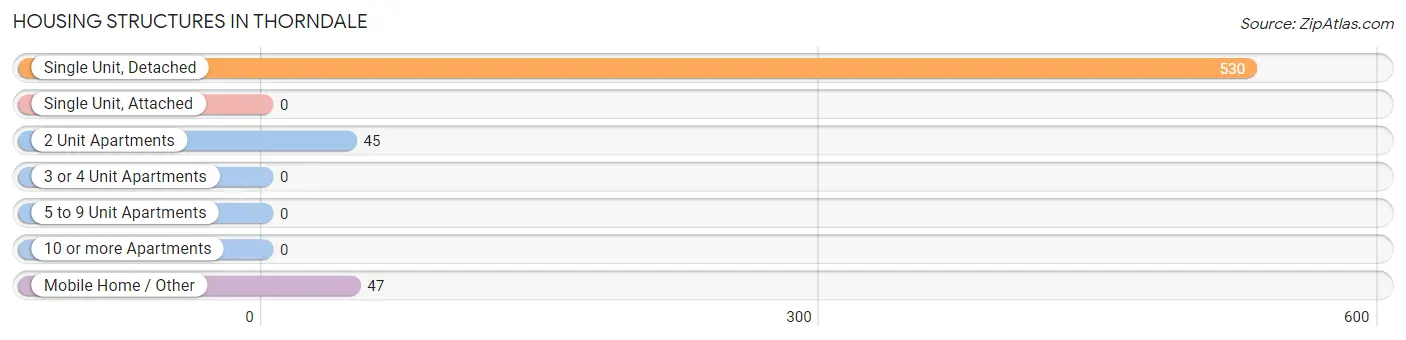
| Structure Type | # Housing Units | % Housing Units |
| Single Unit, Detached | 530 | 85.2% |
| Single Unit, Attached | 0 | 0.0% |
| 2 Unit Apartments | 45 | 7.2% |
| 3 or 4 Unit Apartments | 0 | 0.0% |
| 5 to 9 Unit Apartments | 0 | 0.0% |
| 10 or more Apartments | 0 | 0.0% |
| Mobile Home / Other | 47 | 7.6% |
| Total | 622 | 100.0% |
Housing Structures by Occupancy in Thorndale
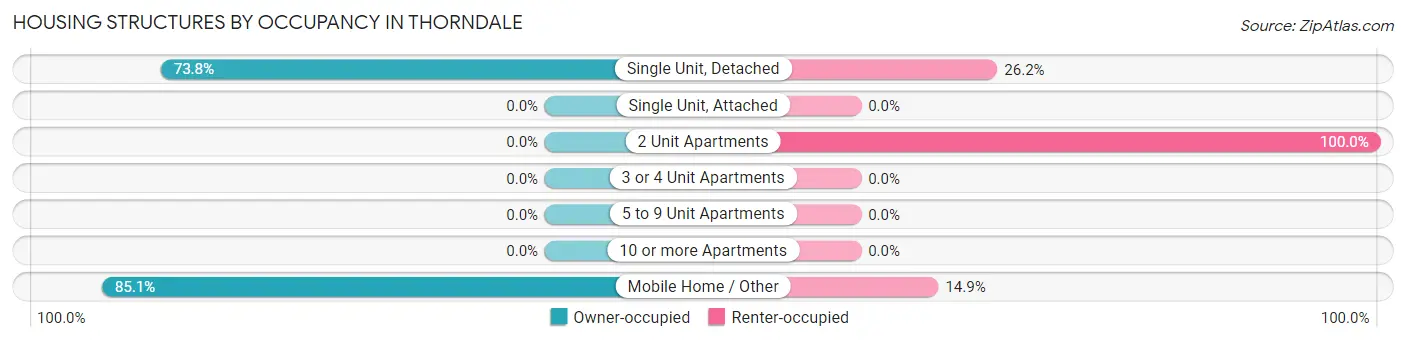
| Structure Type | Owner-occupied | Renter-occupied |
| Single Unit, Detached | 391 (73.8%) | 139 (26.2%) |
| Single Unit, Attached | 0 (0.0%) | 0 (0.0%) |
| 2 Unit Apartments | 0 (0.0%) | 45 (100.0%) |
| 3 or 4 Unit Apartments | 0 (0.0%) | 0 (0.0%) |
| 5 to 9 Unit Apartments | 0 (0.0%) | 0 (0.0%) |
| 10 or more Apartments | 0 (0.0%) | 0 (0.0%) |
| Mobile Home / Other | 40 (85.1%) | 7 (14.9%) |
| Total | 431 (69.3%) | 191 (30.7%) |
Housing Structures by Number of Rooms in Thorndale
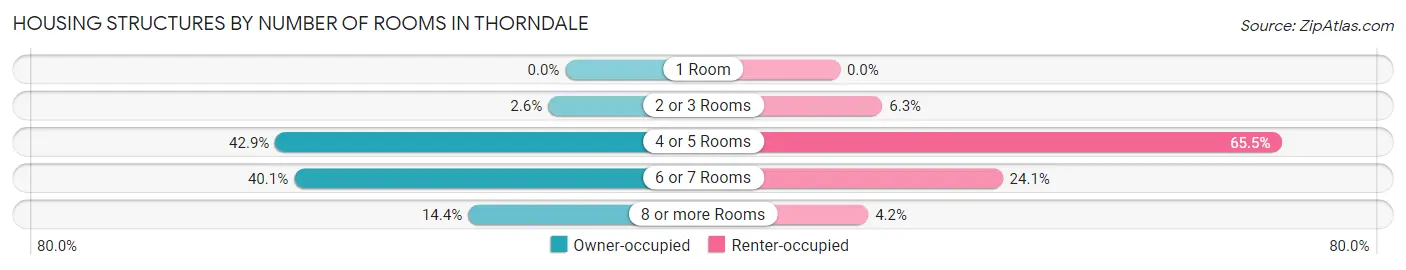
| Number of Rooms | Owner-occupied | Renter-occupied |
| 1 Room | 0 (0.0%) | 0 (0.0%) |
| 2 or 3 Rooms | 11 (2.5%) | 12 (6.3%) |
| 4 or 5 Rooms | 185 (42.9%) | 125 (65.4%) |
| 6 or 7 Rooms | 173 (40.1%) | 46 (24.1%) |
| 8 or more Rooms | 62 (14.4%) | 8 (4.2%) |
| Total | 431 (100.0%) | 191 (100.0%) |
Housing Structure by Heating Type in Thorndale
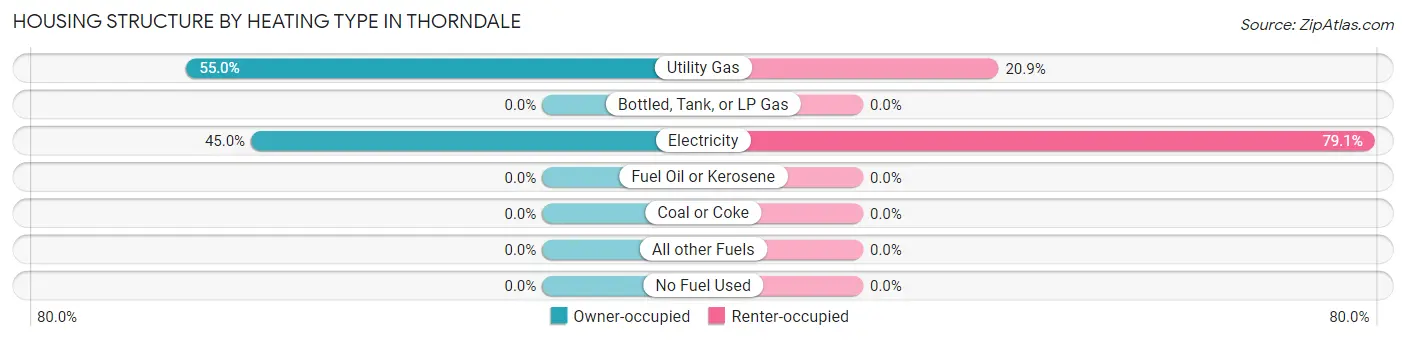
| Heating Type | Owner-occupied | Renter-occupied |
| Utility Gas | 237 (55.0%) | 40 (20.9%) |
| Bottled, Tank, or LP Gas | 0 (0.0%) | 0 (0.0%) |
| Electricity | 194 (45.0%) | 151 (79.1%) |
| Fuel Oil or Kerosene | 0 (0.0%) | 0 (0.0%) |
| Coal or Coke | 0 (0.0%) | 0 (0.0%) |
| All other Fuels | 0 (0.0%) | 0 (0.0%) |
| No Fuel Used | 0 (0.0%) | 0 (0.0%) |
| Total | 431 (100.0%) | 191 (100.0%) |
Household Vehicle Usage in Thorndale
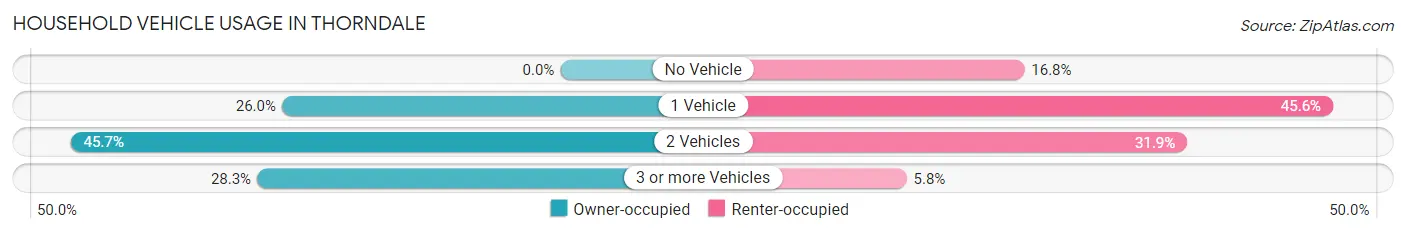
| Vehicles per Household | Owner-occupied | Renter-occupied |
| No Vehicle | 0 (0.0%) | 32 (16.8%) |
| 1 Vehicle | 112 (26.0%) | 87 (45.6%) |
| 2 Vehicles | 197 (45.7%) | 61 (31.9%) |
| 3 or more Vehicles | 122 (28.3%) | 11 (5.8%) |
| Total | 431 (100.0%) | 191 (100.0%) |
Real Estate & Mortgages in Thorndale
Real Estate and Mortgage Overview in Thorndale
| Characteristic | Without Mortgage | With Mortgage |
| Housing Units | 282 | 149 |
| Median Property Value | $93,300 | $211,600 |
| Median Household Income | $46,786 | $41 |
| Monthly Housing Costs | $388 | $22 |
| Real Estate Taxes | $847 | $0 |
Property Value by Mortgage Status in Thorndale
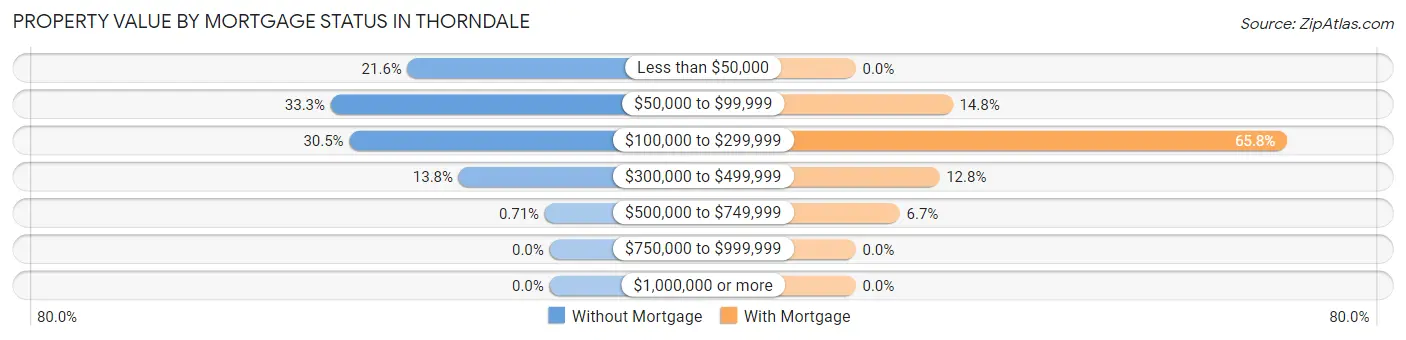
| Property Value | Without Mortgage | With Mortgage |
| Less than $50,000 | 61 (21.6%) | 0 (0.0%) |
| $50,000 to $99,999 | 94 (33.3%) | 22 (14.8%) |
| $100,000 to $299,999 | 86 (30.5%) | 98 (65.8%) |
| $300,000 to $499,999 | 39 (13.8%) | 19 (12.8%) |
| $500,000 to $749,999 | 2 (0.7%) | 10 (6.7%) |
| $750,000 to $999,999 | 0 (0.0%) | 0 (0.0%) |
| $1,000,000 or more | 0 (0.0%) | 0 (0.0%) |
| Total | 282 (100.0%) | 149 (100.0%) |
Household Income by Mortgage Status in Thorndale
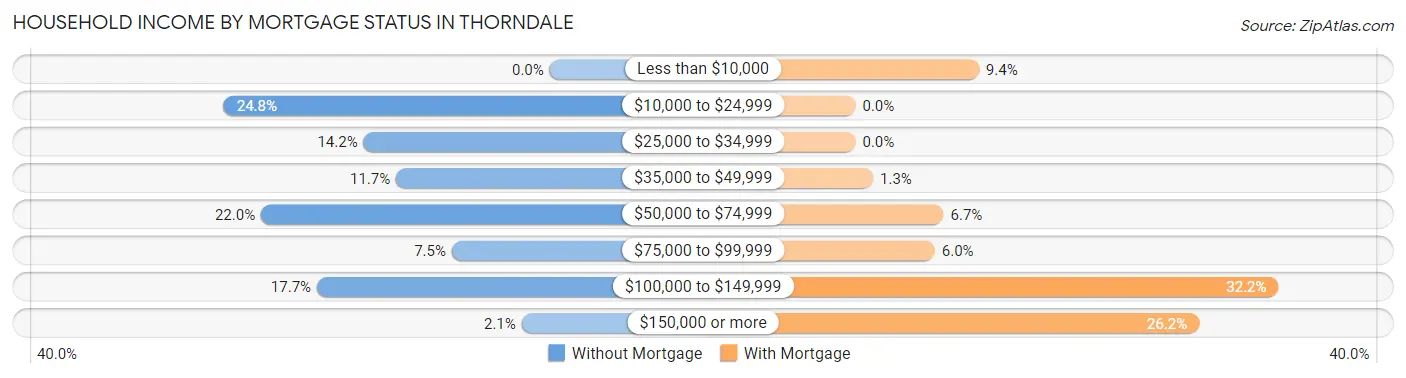
| Household Income | Without Mortgage | With Mortgage |
| Less than $10,000 | 0 (0.0%) | 14 (9.4%) |
| $10,000 to $24,999 | 70 (24.8%) | 0 (0.0%) |
| $25,000 to $34,999 | 40 (14.2%) | 0 (0.0%) |
| $35,000 to $49,999 | 33 (11.7%) | 2 (1.3%) |
| $50,000 to $74,999 | 62 (22.0%) | 10 (6.7%) |
| $75,000 to $99,999 | 21 (7.4%) | 9 (6.0%) |
| $100,000 to $149,999 | 50 (17.7%) | 48 (32.2%) |
| $150,000 or more | 6 (2.1%) | 39 (26.2%) |
| Total | 282 (100.0%) | 149 (100.0%) |
Property Value to Household Income Ratio in Thorndale
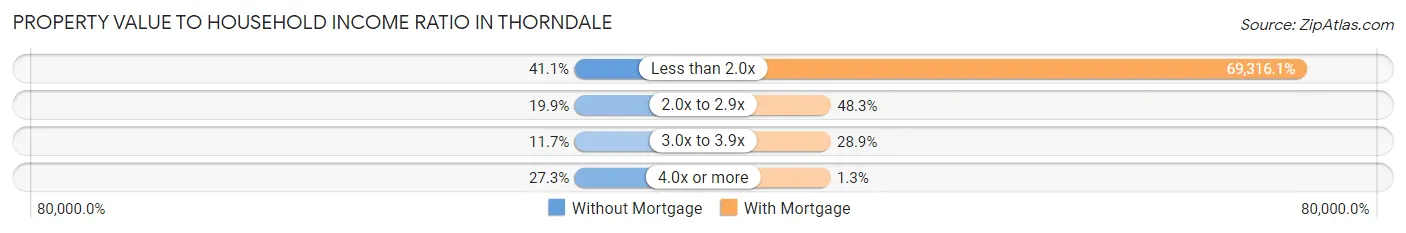
| Value-to-Income Ratio | Without Mortgage | With Mortgage |
| Less than 2.0x | 116 (41.1%) | 103,281 (69,316.1%) |
| 2.0x to 2.9x | 56 (19.9%) | 72 (48.3%) |
| 3.0x to 3.9x | 33 (11.7%) | 43 (28.9%) |
| 4.0x or more | 77 (27.3%) | 2 (1.3%) |
| Total | 282 (100.0%) | 149 (100.0%) |
Real Estate Taxes by Mortgage Status in Thorndale
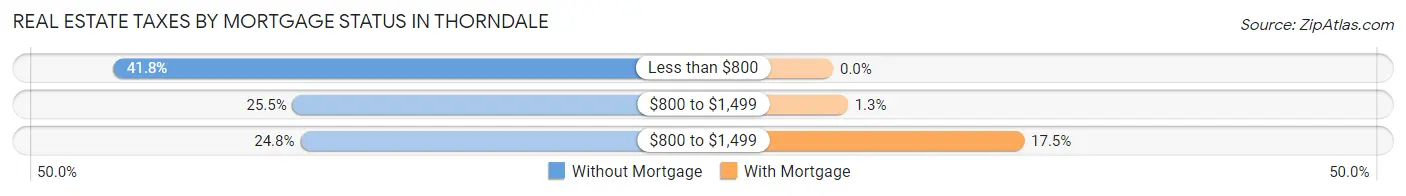
| Property Taxes | Without Mortgage | With Mortgage |
| Less than $800 | 118 (41.8%) | 0 (0.0%) |
| $800 to $1,499 | 72 (25.5%) | 2 (1.3%) |
| $800 to $1,499 | 70 (24.8%) | 26 (17.4%) |
| Total | 282 (100.0%) | 149 (100.0%) |
Health & Disability in Thorndale
Health Insurance Coverage by Age in Thorndale
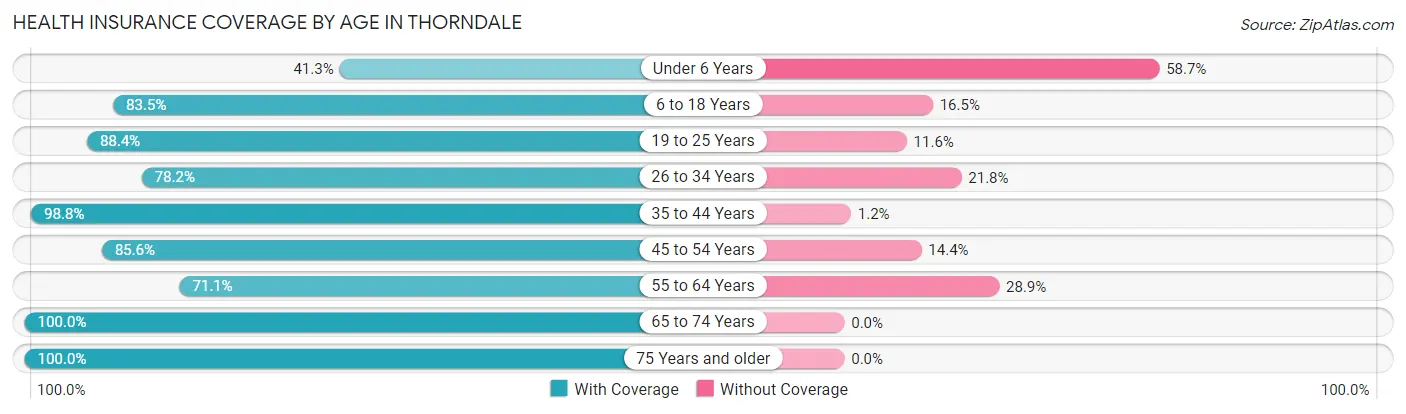
| Age Bracket | With Coverage | Without Coverage |
| Under 6 Years | 45 (41.3%) | 64 (58.7%) |
| 6 to 18 Years | 157 (83.5%) | 31 (16.5%) |
| 19 to 25 Years | 38 (88.4%) | 5 (11.6%) |
| 26 to 34 Years | 197 (78.2%) | 55 (21.8%) |
| 35 to 44 Years | 243 (98.8%) | 3 (1.2%) |
| 45 to 54 Years | 131 (85.6%) | 22 (14.4%) |
| 55 to 64 Years | 138 (71.1%) | 56 (28.9%) |
| 65 to 74 Years | 121 (100.0%) | 0 (0.0%) |
| 75 Years and older | 109 (100.0%) | 0 (0.0%) |
| Total | 1,179 (83.3%) | 236 (16.7%) |
Health Insurance Coverage by Citizenship Status in Thorndale
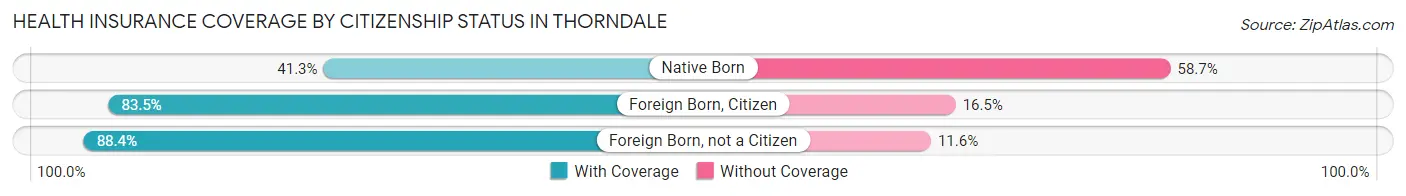
| Citizenship Status | With Coverage | Without Coverage |
| Native Born | 45 (41.3%) | 64 (58.7%) |
| Foreign Born, Citizen | 157 (83.5%) | 31 (16.5%) |
| Foreign Born, not a Citizen | 38 (88.4%) | 5 (11.6%) |
Health Insurance Coverage by Household Income in Thorndale
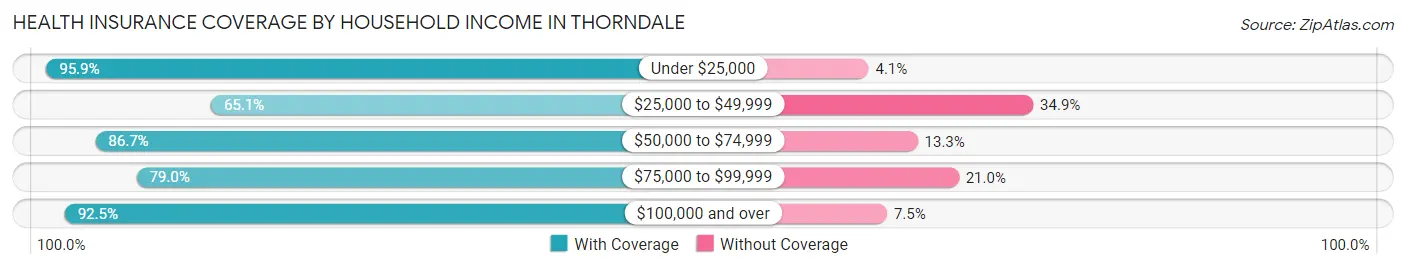
| Household Income | With Coverage | Without Coverage |
| Under $25,000 | 118 (95.9%) | 5 (4.1%) |
| $25,000 to $49,999 | 164 (65.1%) | 88 (34.9%) |
| $50,000 to $74,999 | 183 (86.7%) | 28 (13.3%) |
| $75,000 to $99,999 | 309 (79.0%) | 82 (21.0%) |
| $100,000 and over | 405 (92.5%) | 33 (7.5%) |
Public vs Private Health Insurance Coverage by Age in Thorndale
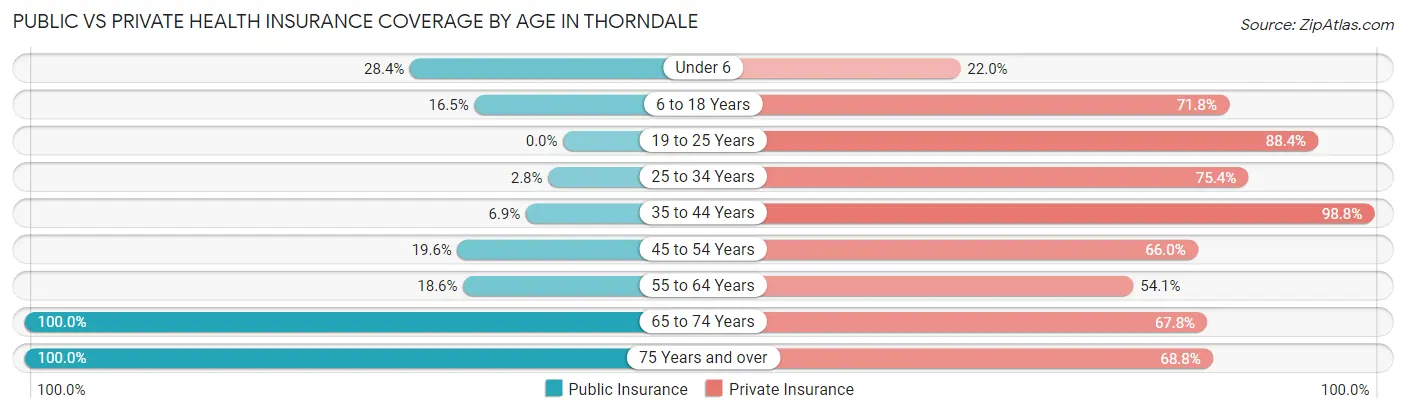
| Age Bracket | Public Insurance | Private Insurance |
| Under 6 | 31 (28.4%) | 24 (22.0%) |
| 6 to 18 Years | 31 (16.5%) | 135 (71.8%) |
| 19 to 25 Years | 0 (0.0%) | 38 (88.4%) |
| 25 to 34 Years | 7 (2.8%) | 190 (75.4%) |
| 35 to 44 Years | 17 (6.9%) | 243 (98.8%) |
| 45 to 54 Years | 30 (19.6%) | 101 (66.0%) |
| 55 to 64 Years | 36 (18.6%) | 105 (54.1%) |
| 65 to 74 Years | 121 (100.0%) | 82 (67.8%) |
| 75 Years and over | 109 (100.0%) | 75 (68.8%) |
| Total | 382 (27.0%) | 993 (70.2%) |
Disability Status by Sex by Age in Thorndale
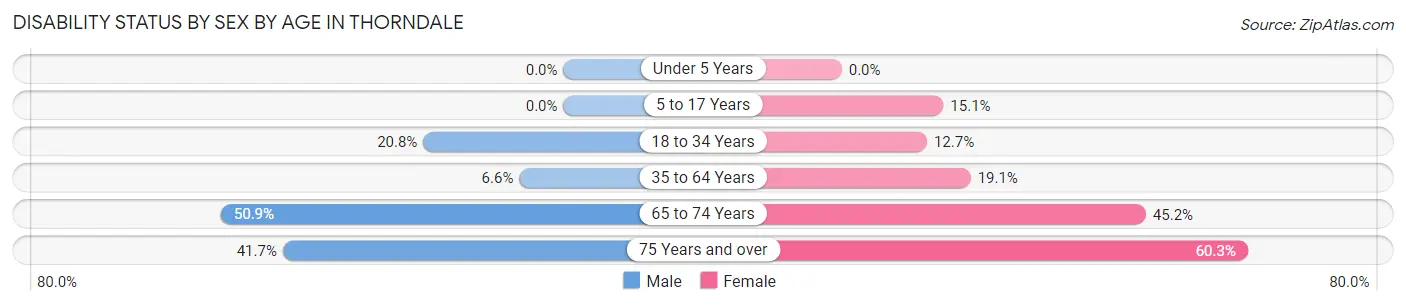
| Age Bracket | Male | Female |
| Under 5 Years | 0 (0.0%) | 0 (0.0%) |
| 5 to 17 Years | 0 (0.0%) | 8 (15.1%) |
| 18 to 34 Years | 31 (20.8%) | 21 (12.7%) |
| 35 to 64 Years | 19 (6.6%) | 58 (19.1%) |
| 65 to 74 Years | 30 (50.8%) | 28 (45.2%) |
| 75 Years and over | 15 (41.7%) | 44 (60.3%) |
Disability Class by Sex by Age in Thorndale
Disability Class: Hearing Difficulty
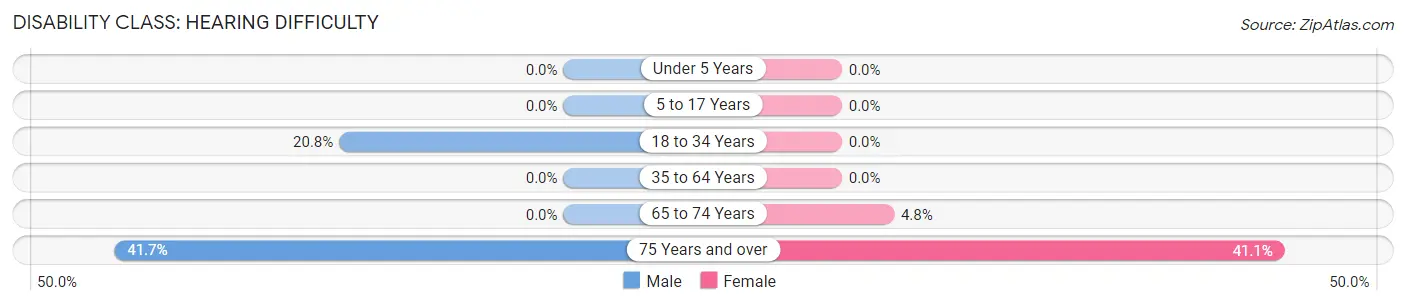
| Age Bracket | Male | Female |
| Under 5 Years | 0 (0.0%) | 0 (0.0%) |
| 5 to 17 Years | 0 (0.0%) | 0 (0.0%) |
| 18 to 34 Years | 31 (20.8%) | 0 (0.0%) |
| 35 to 64 Years | 0 (0.0%) | 0 (0.0%) |
| 65 to 74 Years | 0 (0.0%) | 3 (4.8%) |
| 75 Years and over | 15 (41.7%) | 30 (41.1%) |
Disability Class: Vision Difficulty
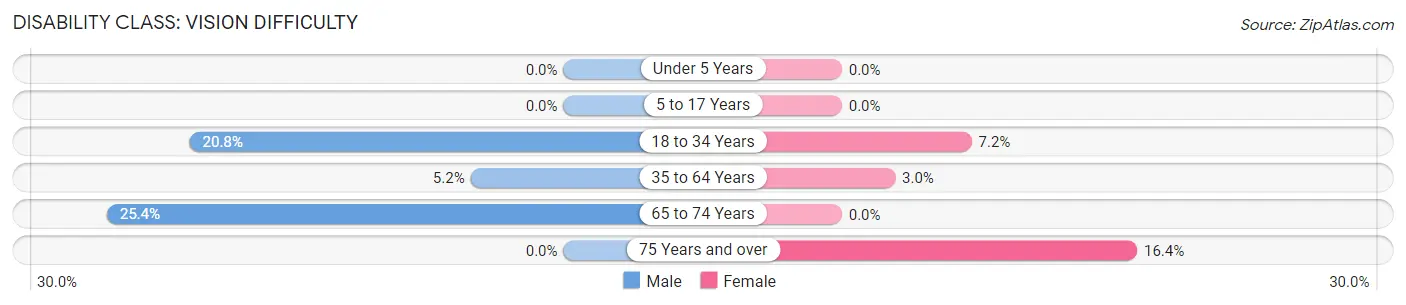
| Age Bracket | Male | Female |
| Under 5 Years | 0 (0.0%) | 0 (0.0%) |
| 5 to 17 Years | 0 (0.0%) | 0 (0.0%) |
| 18 to 34 Years | 31 (20.8%) | 12 (7.2%) |
| 35 to 64 Years | 15 (5.2%) | 9 (3.0%) |
| 65 to 74 Years | 15 (25.4%) | 0 (0.0%) |
| 75 Years and over | 0 (0.0%) | 12 (16.4%) |
Disability Class: Cognitive Difficulty
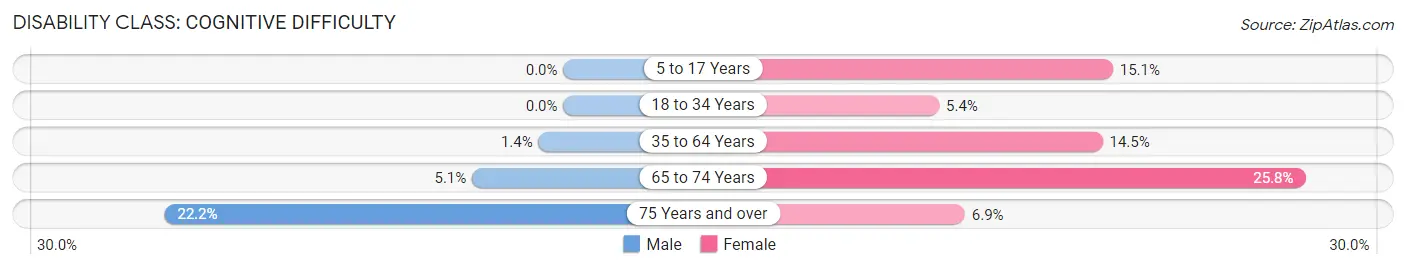
| Age Bracket | Male | Female |
| 5 to 17 Years | 0 (0.0%) | 8 (15.1%) |
| 18 to 34 Years | 0 (0.0%) | 9 (5.4%) |
| 35 to 64 Years | 4 (1.4%) | 44 (14.5%) |
| 65 to 74 Years | 3 (5.1%) | 16 (25.8%) |
| 75 Years and over | 8 (22.2%) | 5 (6.9%) |
Disability Class: Ambulatory Difficulty
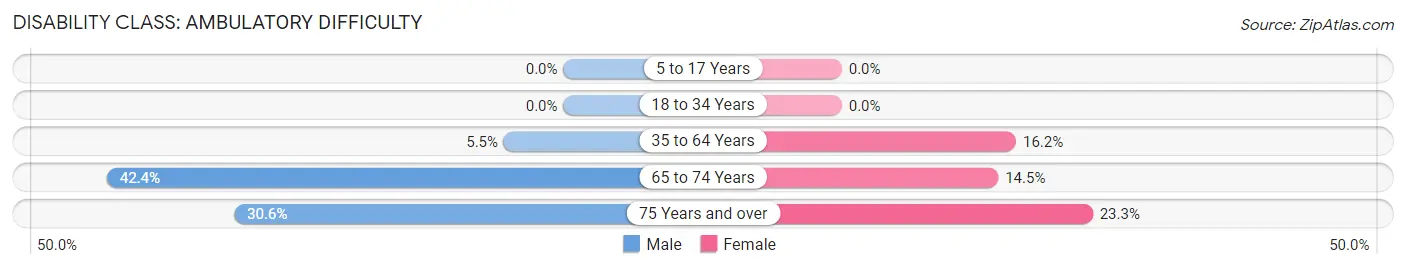
| Age Bracket | Male | Female |
| 5 to 17 Years | 0 (0.0%) | 0 (0.0%) |
| 18 to 34 Years | 0 (0.0%) | 0 (0.0%) |
| 35 to 64 Years | 16 (5.5%) | 49 (16.2%) |
| 65 to 74 Years | 25 (42.4%) | 9 (14.5%) |
| 75 Years and over | 11 (30.6%) | 17 (23.3%) |
Disability Class: Self-Care Difficulty
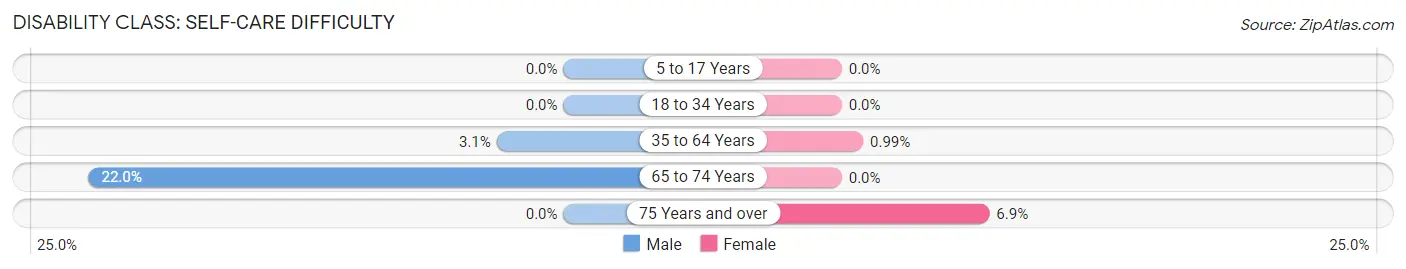
| Age Bracket | Male | Female |
| 5 to 17 Years | 0 (0.0%) | 0 (0.0%) |
| 18 to 34 Years | 0 (0.0%) | 0 (0.0%) |
| 35 to 64 Years | 9 (3.1%) | 3 (1.0%) |
| 65 to 74 Years | 13 (22.0%) | 0 (0.0%) |
| 75 Years and over | 0 (0.0%) | 5 (6.9%) |
Technology Access in Thorndale
Computing Device Access in Thorndale
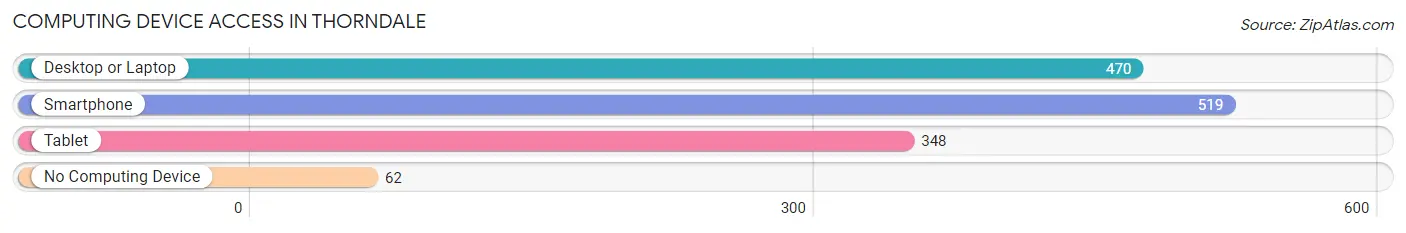
| Device Type | # Households | % Households |
| Desktop or Laptop | 470 | 75.6% |
| Smartphone | 519 | 83.4% |
| Tablet | 348 | 55.9% |
| No Computing Device | 62 | 10.0% |
| Total | 622 | 100.0% |
Internet Access in Thorndale
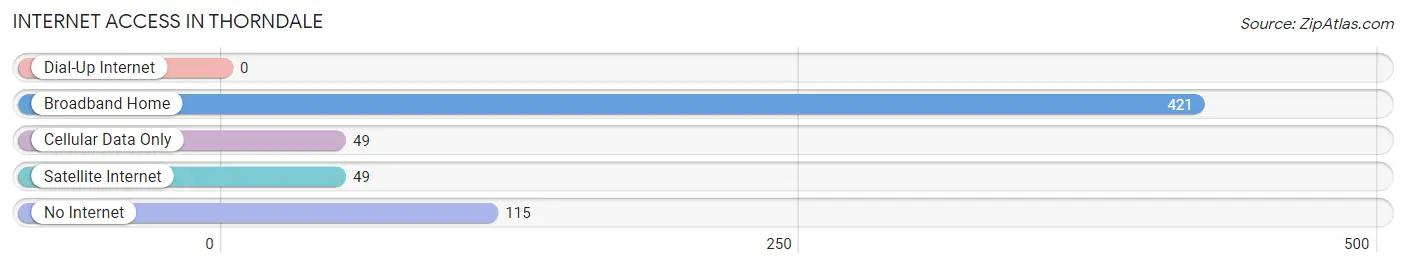
| Internet Type | # Households | % Households |
| Dial-Up Internet | 0 | 0.0% |
| Broadband Home | 421 | 67.7% |
| Cellular Data Only | 49 | 7.9% |
| Satellite Internet | 49 | 7.9% |
| No Internet | 115 | 18.5% |
| Total | 622 | 100.0% |
Thorndale Summary
Thorndale, Texas is a small town located in Milam County, Texas, United States. It is situated about 50 miles northeast of Austin and is part of the Killeen-Temple-Fort Hood Metropolitan Statistical Area. The population of Thorndale was 1,336 at the 2010 census.
History
Thorndale was founded in 1873 by a group of settlers from Thorndale, Pennsylvania. The town was named after the Pennsylvania town, and the settlers brought with them the same name. The town was originally located on the banks of the Little River, but was moved to its current location in 1876 when the railroad was built.
The town was incorporated in 1882 and quickly became a thriving agricultural center. Cotton, corn, and wheat were the main crops grown in the area. The town also had a number of businesses, including a bank, a hotel, a blacksmith shop, and a general store.
In the early 1900s, Thorndale began to experience a decline in population as many of the settlers moved away to larger cities. However, the town was able to remain a viable community due to its proximity to Austin and the surrounding area.
Geography
Thorndale is located at 30°45'25" North, 97°10'25" West (30.756944, -97.173611). It is situated in the Blackland Prairie region of Central Texas. The town is located on the Little River, which is a tributary of the Brazos River.
The town has a total area of 1.2 square miles, all of which is land. The terrain is mostly flat, with some rolling hills.
Economy
The economy of Thorndale is largely based on agriculture. Cotton, corn, and wheat are the main crops grown in the area. The town also has a number of businesses, including a bank, a hotel, a blacksmith shop, and a general store.
The town is also home to a number of manufacturing companies, including a furniture factory, a plastics factory, and a metal fabrication plant.
Demographics
As of the 2010 census, there were 1,336 people, 486 households, and 339 families residing in Thorndale. The population density was 1,097.7 people per square mile. The racial makeup of the town was 81.2% White, 11.7% African American, 0.2% Native American, 0.2% Asian, 0.1% Pacific Islander, 5.2% from other races, and 1.6% from two or more races. Hispanic or Latino of any race were 11.7% of the population.
The median income for a household in Thorndale was $37,500, and the median income for a family was $45,000. The per capita income for the town was $17,845. About 16.2% of families and 19.2% of the population were below the poverty line, including 25.2% of those under age 18 and 11.2% of those age 65 or over.
Common Questions
What is Per Capita Income in Thorndale?
Per Capita income in Thorndale is $32,041.
What is the Median Family Income in Thorndale?
Median Family Income in Thorndale is $76,920.
What is the Median Household income in Thorndale?
Median Household Income in Thorndale is $63,581.
What is Income or Wage Gap in Thorndale?
Income or Wage Gap in Thorndale is 24.4%.
Women in Thorndale earn 75.6 cents for every dollar earned by a man.
What is Inequality or Gini Index in Thorndale?
Inequality or Gini Index in Thorndale is 0.38.
What is the Total Population of Thorndale?
Total Population of Thorndale is 1,415.
What is the Total Male Population of Thorndale?
Total Male Population of Thorndale is 681.
What is the Total Female Population of Thorndale?
Total Female Population of Thorndale is 734.
What is the Ratio of Males per 100 Females in Thorndale?
There are 92.78 Males per 100 Females in Thorndale.
What is the Ratio of Females per 100 Males in Thorndale?
There are 107.78 Females per 100 Males in Thorndale.
What is the Median Population Age in Thorndale?
Median Population Age in Thorndale is 37.9 Years.
What is the Average Family Size in Thorndale
Average Family Size in Thorndale is 2.9 People.
What is the Average Household Size in Thorndale
Average Household Size in Thorndale is 2.3 People.
How Large is the Labor Force in Thorndale?
There are 757 People in the Labor Forcein in Thorndale.
What is the Percentage of People in the Labor Force in Thorndale?
64.8% of People are in the Labor Force in Thorndale.
What is the Unemployment Rate in Thorndale?
Unemployment Rate in Thorndale is 1.1%.