Sunray, TX Map & Demographics
Sunray Map
Sunray Overview
$28,907
PER CAPITA INCOME
$57,857
AVG FAMILY INCOME
$54,609
AVG HOUSEHOLD INCOME
28.0%
WAGE / INCOME GAP [ % ]
72.0¢/ $1
WAGE / INCOME GAP [ $ ]
$11,343
FAMILY INCOME DEFICIT
0.46
INEQUALITY / GINI INDEX
2,717
TOTAL POPULATION
1,322
MALE POPULATION
1,395
FEMALE POPULATION
94.77
MALES / 100 FEMALES
105.52
FEMALES / 100 MALES
34.7
MEDIAN AGE
3.2
AVG FAMILY SIZE
2.7
AVG HOUSEHOLD SIZE
1,293
LABOR FORCE [ PEOPLE ]
64.7%
PERCENT IN LABOR FORCE
3.9%
UNEMPLOYMENT RATE
Sunray Zip Codes
Sunray Area Codes
Income in Sunray
Income Overview in Sunray
Per Capita Income in Sunray is $28,907, while median incomes of families and households are $57,857 and $54,609 respectively.
| Characteristic | Number | Measure |
| Per Capita Income | 2,717 | $28,907 |
| Median Family Income | 750 | $57,857 |
| Mean Family Income | 750 | $87,656 |
| Median Household Income | 1,006 | $54,609 |
| Mean Household Income | 1,006 | $76,893 |
| Income Deficit | 750 | $11,343 |
| Wage / Income Gap (%) | 2,717 | 28.02% |
| Wage / Income Gap ($) | 2,717 | 71.98¢ per $1 |
| Gini / Inequality Index | 2,717 | 0.46 |
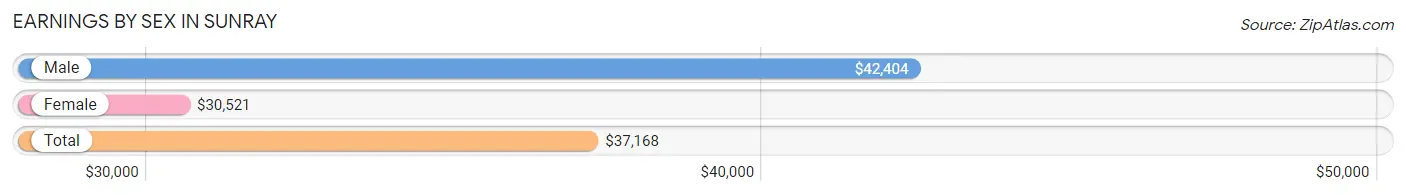
Earnings by Sex in Sunray
Average Earnings in Sunray are $37,168, $42,404 for men and $30,521 for women, a difference of 28.0%.
| Sex | Number | Average Earnings |
| Male | 841 (63.7%) | $42,404 |
| Female | 480 (36.3%) | $30,521 |
| Total | 1,321 (100.0%) | $37,168 |
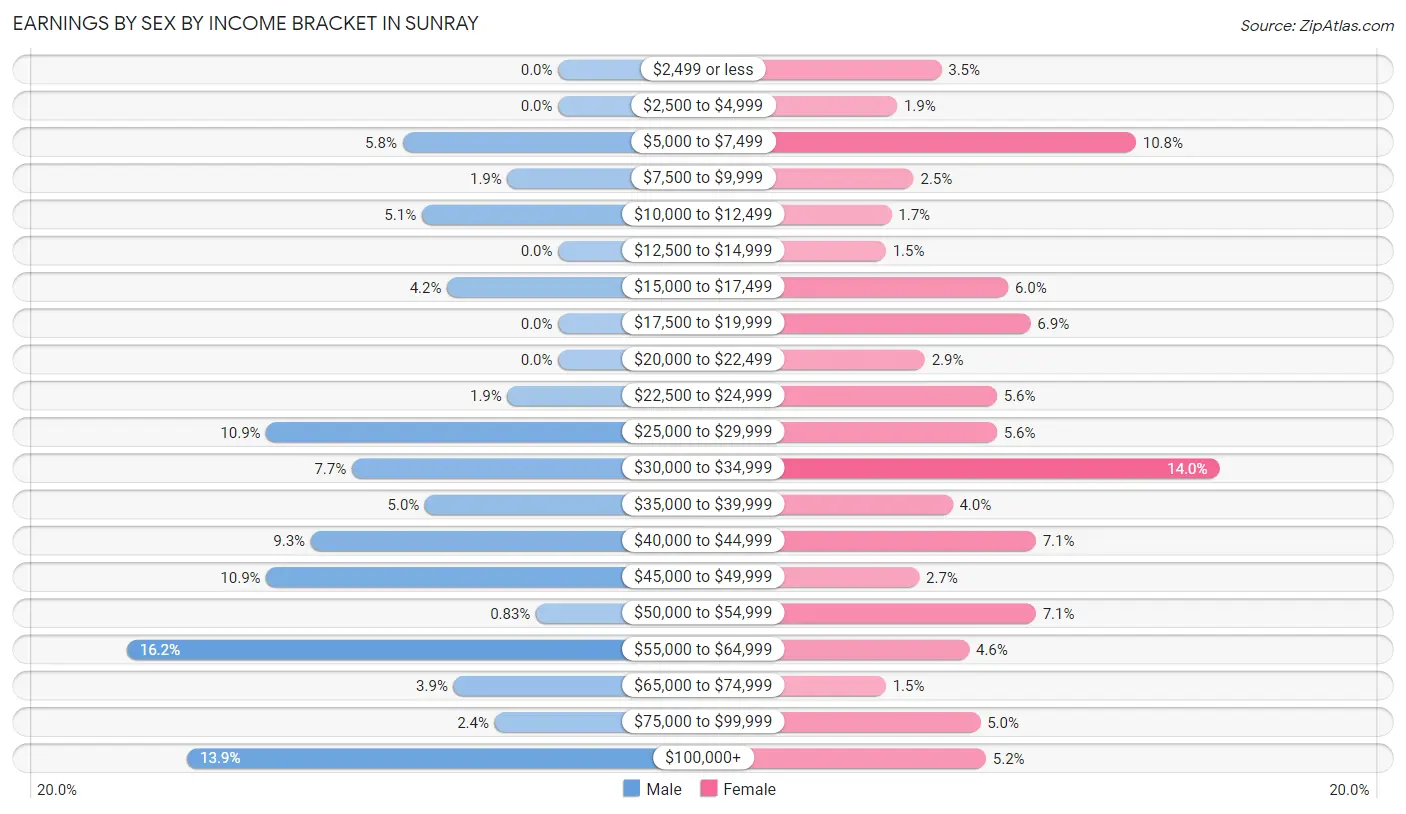
Earnings by Sex by Income Bracket in Sunray
The most common earnings brackets in Sunray are $55,000 to $64,999 for men (136 | 16.2%) and $30,000 to $34,999 for women (67 | 14.0%).
| Income | Male | Female |
| $2,499 or less | 0 (0.0%) | 17 (3.5%) |
| $2,500 to $4,999 | 0 (0.0%) | 9 (1.9%) |
| $5,000 to $7,499 | 49 (5.8%) | 52 (10.8%) |
| $7,500 to $9,999 | 16 (1.9%) | 12 (2.5%) |
| $10,000 to $12,499 | 43 (5.1%) | 8 (1.7%) |
| $12,500 to $14,999 | 0 (0.0%) | 7 (1.5%) |
| $15,000 to $17,499 | 35 (4.2%) | 29 (6.0%) |
| $17,500 to $19,999 | 0 (0.0%) | 33 (6.9%) |
| $20,000 to $22,499 | 0 (0.0%) | 14 (2.9%) |
| $22,500 to $24,999 | 16 (1.9%) | 27 (5.6%) |
| $25,000 to $29,999 | 92 (10.9%) | 27 (5.6%) |
| $30,000 to $34,999 | 65 (7.7%) | 67 (14.0%) |
| $35,000 to $39,999 | 42 (5.0%) | 19 (4.0%) |
| $40,000 to $44,999 | 78 (9.3%) | 34 (7.1%) |
| $45,000 to $49,999 | 92 (10.9%) | 13 (2.7%) |
| $50,000 to $54,999 | 7 (0.8%) | 34 (7.1%) |
| $55,000 to $64,999 | 136 (16.2%) | 22 (4.6%) |
| $65,000 to $74,999 | 33 (3.9%) | 7 (1.5%) |
| $75,000 to $99,999 | 20 (2.4%) | 24 (5.0%) |
| $100,000+ | 117 (13.9%) | 25 (5.2%) |
| Total | 841 (100.0%) | 480 (100.0%) |
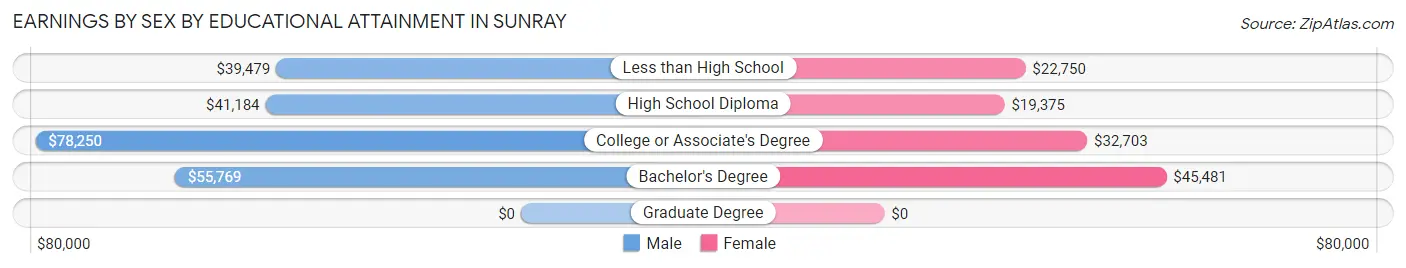
Earnings by Sex by Educational Attainment in Sunray
Average earnings in Sunray are $45,828 for men and $33,169 for women, a difference of 27.6%. Men with an educational attainment of college or associate's degree enjoy the highest average annual earnings of $78,250, while those with less than high school education earn the least with $39,479. Women with an educational attainment of bachelor's degree earn the most with the average annual earnings of $45,481, while those with high school diploma education have the smallest earnings of $19,375.
| Educational Attainment | Male Income | Female Income |
| Less than High School | $39,479 | $22,750 |
| High School Diploma | $41,184 | $19,375 |
| College or Associate's Degree | $78,250 | $32,703 |
| Bachelor's Degree | $55,769 | $45,481 |
| Graduate Degree | - | - |
| Total | $45,828 | $33,169 |
Family Income in Sunray
Family Income Brackets in Sunray
According to the Sunray family income data, there are 182 families falling into the $50,000 to $74,999 income range, which is the most common income bracket and makes up 24.3% of all families. Conversely, the $10,000 to $14,999 income bracket is the least frequent group with only 7 families (0.9%) belonging to this category.
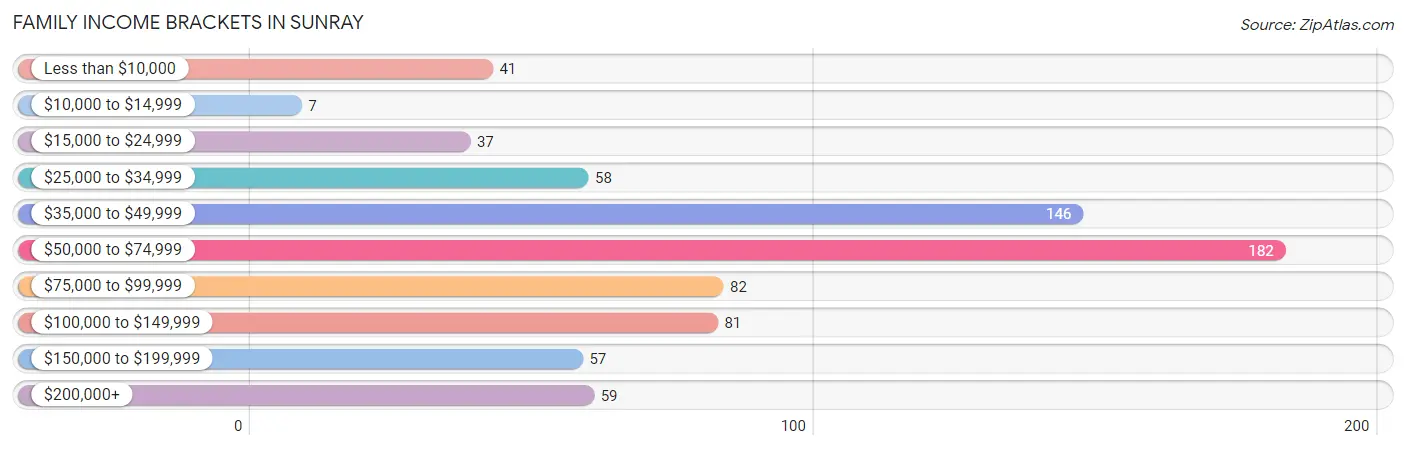
| Income Bracket | # Families | % Families |
| Less than $10,000 | 41 | 5.5% |
| $10,000 to $14,999 | 7 | 0.9% |
| $15,000 to $24,999 | 37 | 4.9% |
| $25,000 to $34,999 | 58 | 7.7% |
| $35,000 to $49,999 | 146 | 19.5% |
| $50,000 to $74,999 | 182 | 24.3% |
| $75,000 to $99,999 | 82 | 10.9% |
| $100,000 to $149,999 | 81 | 10.8% |
| $150,000 to $199,999 | 57 | 7.6% |
| $200,000+ | 59 | 7.9% |
Family Income by Famaliy Size in Sunray
2-person families (239 | 31.9%) account for the highest median family income in Sunray with $74,583 per family, while 2-person families (239 | 31.9%) have the highest median income of $37,292 per family member.
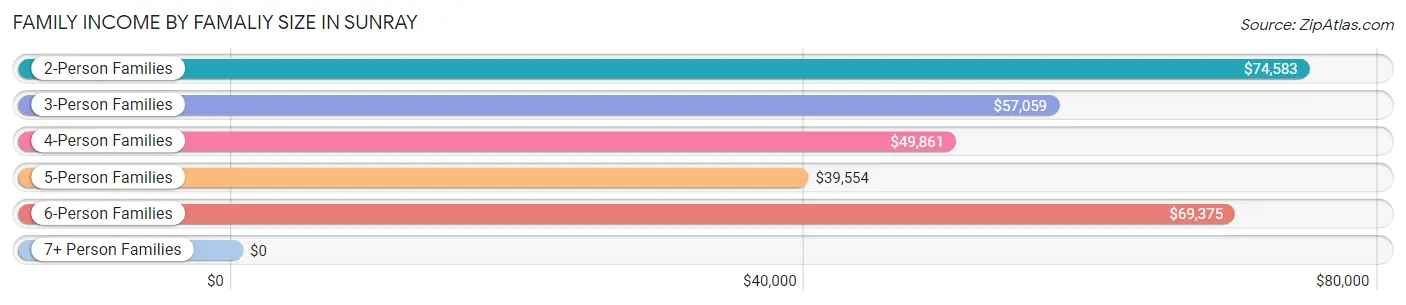
| Income Bracket | # Families | Median Income |
| 2-Person Families | 239 (31.9%) | $74,583 |
| 3-Person Families | 132 (17.6%) | $57,059 |
| 4-Person Families | 233 (31.1%) | $49,861 |
| 5-Person Families | 128 (17.1%) | $39,554 |
| 6-Person Families | 18 (2.4%) | $69,375 |
| 7+ Person Families | 0 (0.0%) | $0 |
| Total | 750 (100.0%) | $57,857 |
Family Income by Number of Earners in Sunray
The median family income in Sunray is $57,857, with families comprising 2 earners (257) having the highest median family income of $83,250, while families with 1 earner (390) have the lowest median family income of $46,071, accounting for 34.3% and 52.0% of families, respectively.
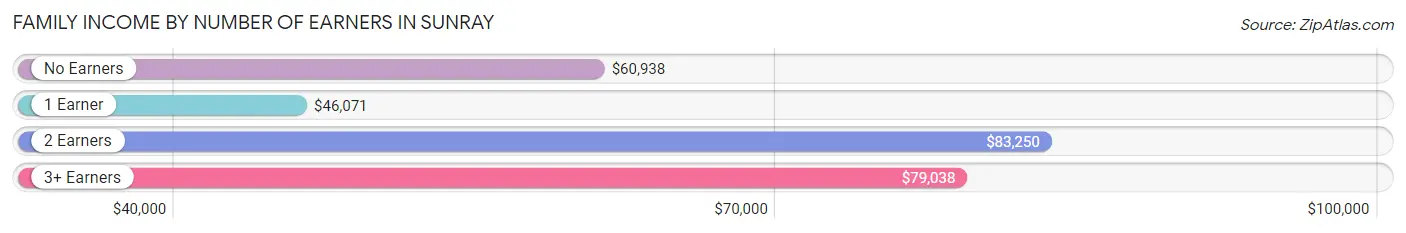
| Number of Earners | # Families | Median Income |
| No Earners | 25 (3.3%) | $60,938 |
| 1 Earner | 390 (52.0%) | $46,071 |
| 2 Earners | 257 (34.3%) | $83,250 |
| 3+ Earners | 78 (10.4%) | $79,038 |
| Total | 750 (100.0%) | $57,857 |
Household Income in Sunray
Household Income Brackets in Sunray
With 231 households falling in the category, the $50,000 to $74,999 income range is the most frequent in Sunray, accounting for 23.0% of all households. In contrast, only 39 households (3.9%) fall into the $10,000 to $14,999 income bracket, making it the least populous group.
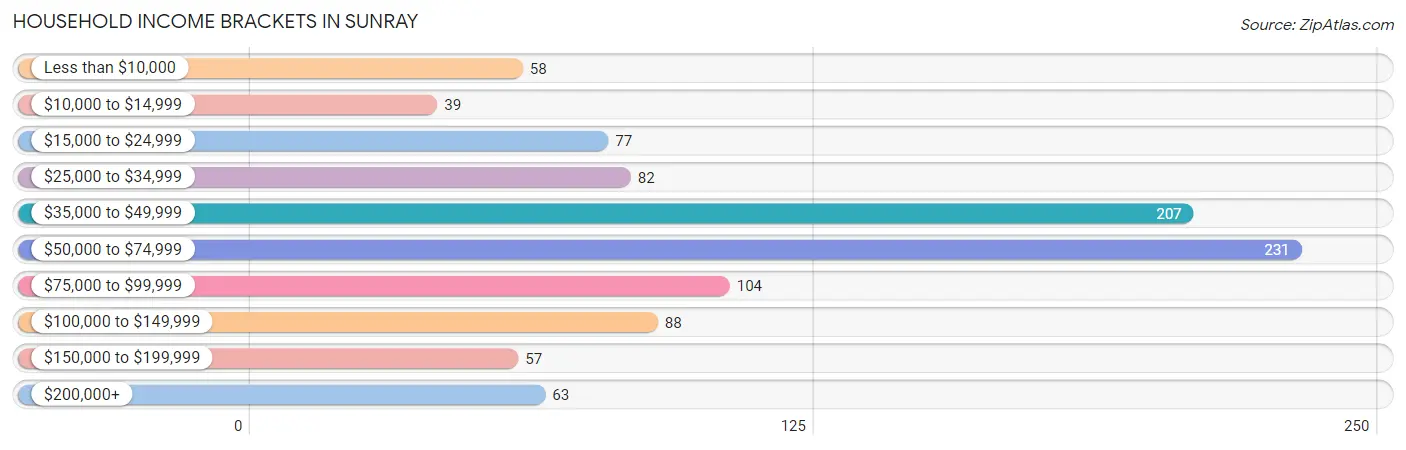
| Income Bracket | # Households | % Households |
| Less than $10,000 | 58 | 5.8% |
| $10,000 to $14,999 | 39 | 3.9% |
| $15,000 to $24,999 | 77 | 7.7% |
| $25,000 to $34,999 | 82 | 8.2% |
| $35,000 to $49,999 | 207 | 20.6% |
| $50,000 to $74,999 | 231 | 23.0% |
| $75,000 to $99,999 | 104 | 10.3% |
| $100,000 to $149,999 | 88 | 8.7% |
| $150,000 to $199,999 | 57 | 5.7% |
| $200,000+ | 63 | 6.3% |
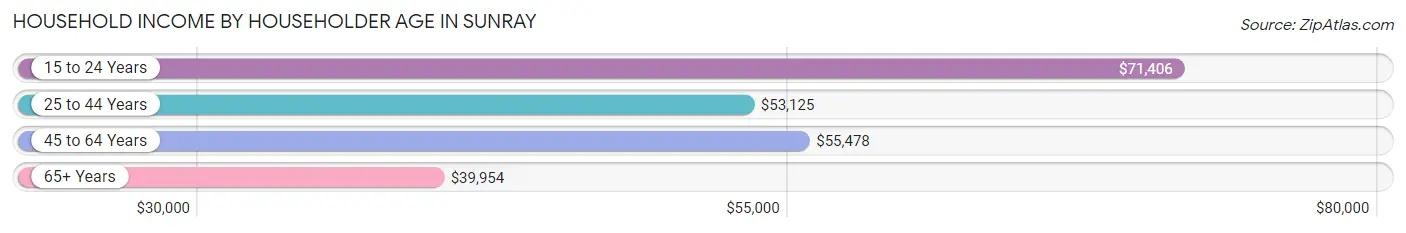
Household Income by Householder Age in Sunray
The median household income in Sunray is $54,609, with the highest median household income of $71,406 found in the 15 to 24 years age bracket for the primary householder. A total of 30 households (3.0%) fall into this category. Meanwhile, the 65+ years age bracket for the primary householder has the lowest median household income of $39,954, with 161 households (16.0%) in this group.
| Income Bracket | # Households | Median Income |
| 15 to 24 Years | 30 (3.0%) | $71,406 |
| 25 to 44 Years | 382 (38.0%) | $53,125 |
| 45 to 64 Years | 433 (43.0%) | $55,478 |
| 65+ Years | 161 (16.0%) | $39,954 |
| Total | 1,006 (100.0%) | $54,609 |
Poverty in Sunray
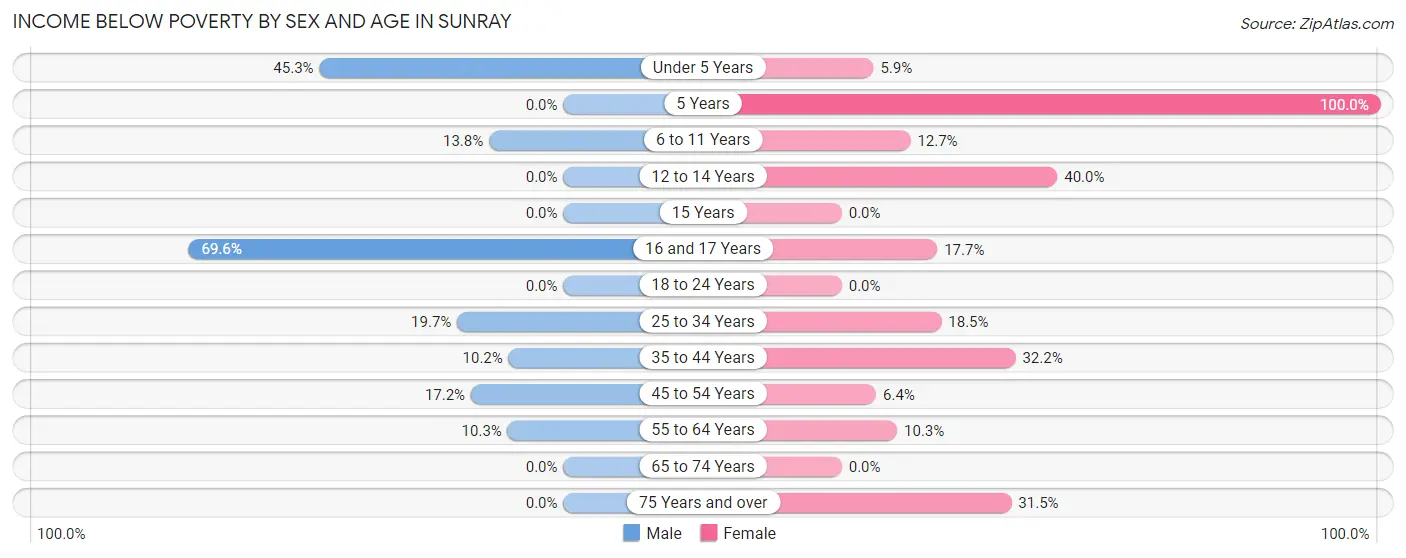
Income Below Poverty by Sex and Age in Sunray
With 14.8% poverty level for males and 16.3% for females among the residents of Sunray, 16 and 17 year old males and 5 year old females are the most vulnerable to poverty, with 16 males (69.6%) and 13 females (100.0%) in their respective age groups living below the poverty level.
| Age Bracket | Male | Female |
| Under 5 Years | 48 (45.3%) | 8 (5.9%) |
| 5 Years | 0 (0.0%) | 13 (100.0%) |
| 6 to 11 Years | 16 (13.8%) | 20 (12.7%) |
| 12 to 14 Years | 0 (0.0%) | 30 (40.0%) |
| 15 Years | 0 (0.0%) | 0 (0.0%) |
| 16 and 17 Years | 16 (69.6%) | 17 (17.7%) |
| 18 to 24 Years | 0 (0.0%) | 0 (0.0%) |
| 25 to 34 Years | 41 (19.7%) | 34 (18.5%) |
| 35 to 44 Years | 19 (10.2%) | 59 (32.2%) |
| 45 to 54 Years | 41 (17.2%) | 14 (6.4%) |
| 55 to 64 Years | 15 (10.3%) | 15 (10.3%) |
| 65 to 74 Years | 0 (0.0%) | 0 (0.0%) |
| 75 Years and over | 0 (0.0%) | 17 (31.5%) |
| Total | 196 (14.8%) | 227 (16.3%) |
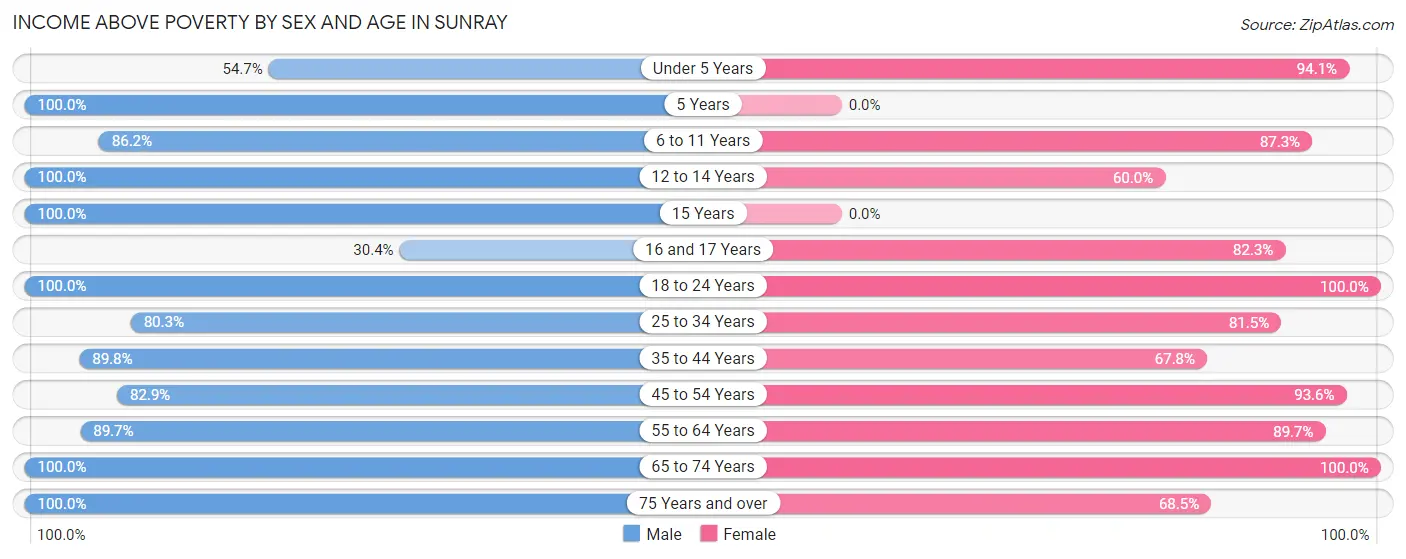
Income Above Poverty by Sex and Age in Sunray
According to the poverty statistics in Sunray, males aged 5 years and females aged 18 to 24 years are the age groups that are most secure financially, with 100.0% of males and 100.0% of females in these age groups living above the poverty line.
| Age Bracket | Male | Female |
| Under 5 Years | 58 (54.7%) | 128 (94.1%) |
| 5 Years | 11 (100.0%) | 0 (0.0%) |
| 6 to 11 Years | 100 (86.2%) | 137 (87.3%) |
| 12 to 14 Years | 96 (100.0%) | 45 (60.0%) |
| 15 Years | 9 (100.0%) | 0 (0.0%) |
| 16 and 17 Years | 7 (30.4%) | 79 (82.3%) |
| 18 to 24 Years | 117 (100.0%) | 28 (100.0%) |
| 25 to 34 Years | 167 (80.3%) | 150 (81.5%) |
| 35 to 44 Years | 168 (89.8%) | 124 (67.8%) |
| 45 to 54 Years | 198 (82.9%) | 206 (93.6%) |
| 55 to 64 Years | 130 (89.7%) | 131 (89.7%) |
| 65 to 74 Years | 33 (100.0%) | 103 (100.0%) |
| 75 Years and over | 32 (100.0%) | 37 (68.5%) |
| Total | 1,126 (85.2%) | 1,168 (83.7%) |
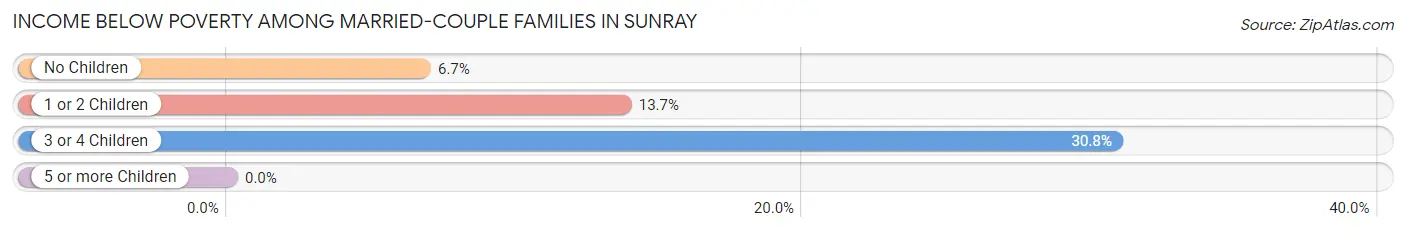
Income Below Poverty Among Married-Couple Families in Sunray
The poverty statistics for married-couple families in Sunray show that 14.3% or 93 of the total 649 families live below the poverty line. Families with 3 or 4 children have the highest poverty rate of 30.8%, comprising of 41 families. On the other hand, families with no children have the lowest poverty rate of 6.7%, which includes 18 families.
| Children | Above Poverty | Below Poverty |
| No Children | 250 (93.3%) | 18 (6.7%) |
| 1 or 2 Children | 214 (86.3%) | 34 (13.7%) |
| 3 or 4 Children | 92 (69.2%) | 41 (30.8%) |
| 5 or more Children | 0 (0.0%) | 0 (0.0%) |
| Total | 556 (85.7%) | 93 (14.3%) |
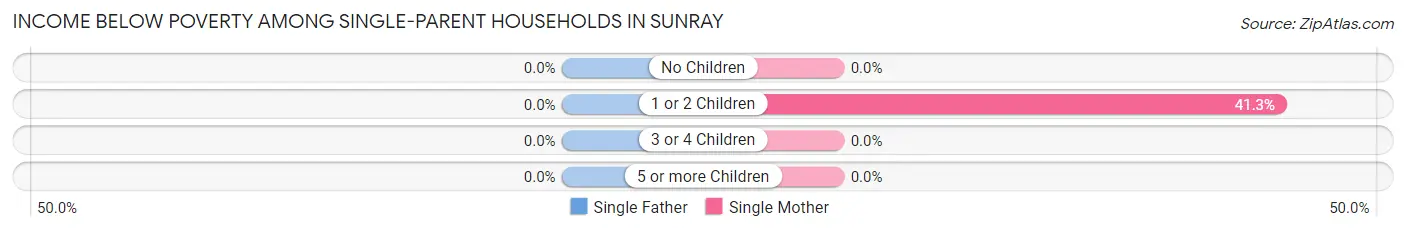
Income Below Poverty Among Single-Parent Households in Sunray
| Children | Single Father | Single Mother |
| No Children | 0 (0.0%) | 0 (0.0%) |
| 1 or 2 Children | 0 (0.0%) | 26 (41.3%) |
| 3 or 4 Children | 0 (0.0%) | 0 (0.0%) |
| 5 or more Children | 0 (0.0%) | 0 (0.0%) |
| Total | 0 (0.0%) | 26 (37.7%) |
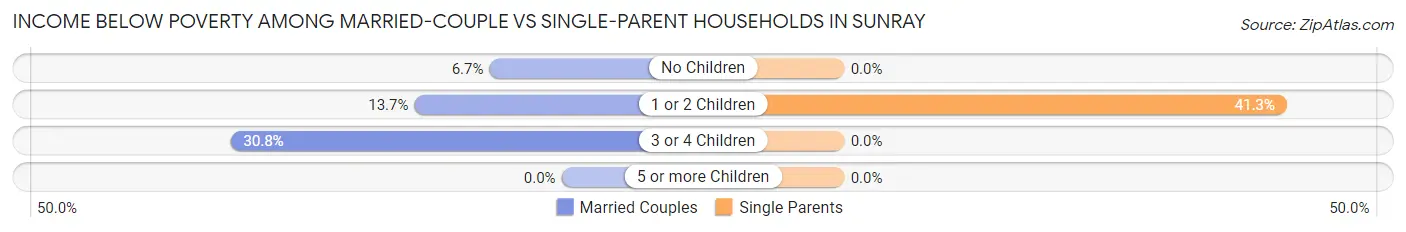
Income Below Poverty Among Married-Couple vs Single-Parent Households in Sunray
The poverty data for Sunray shows that 93 of the married-couple family households (14.3%) and 26 of the single-parent households (25.7%) are living below the poverty level. Within the married-couple family households, those with 3 or 4 children have the highest poverty rate, with 41 households (30.8%) falling below the poverty line. Among the single-parent households, those with 1 or 2 children have the highest poverty rate, with 26 household (41.3%) living below poverty.
| Children | Married-Couple Families | Single-Parent Households |
| No Children | 18 (6.7%) | 0 (0.0%) |
| 1 or 2 Children | 34 (13.7%) | 26 (41.3%) |
| 3 or 4 Children | 41 (30.8%) | 0 (0.0%) |
| 5 or more Children | 0 (0.0%) | 0 (0.0%) |
| Total | 93 (14.3%) | 26 (25.7%) |
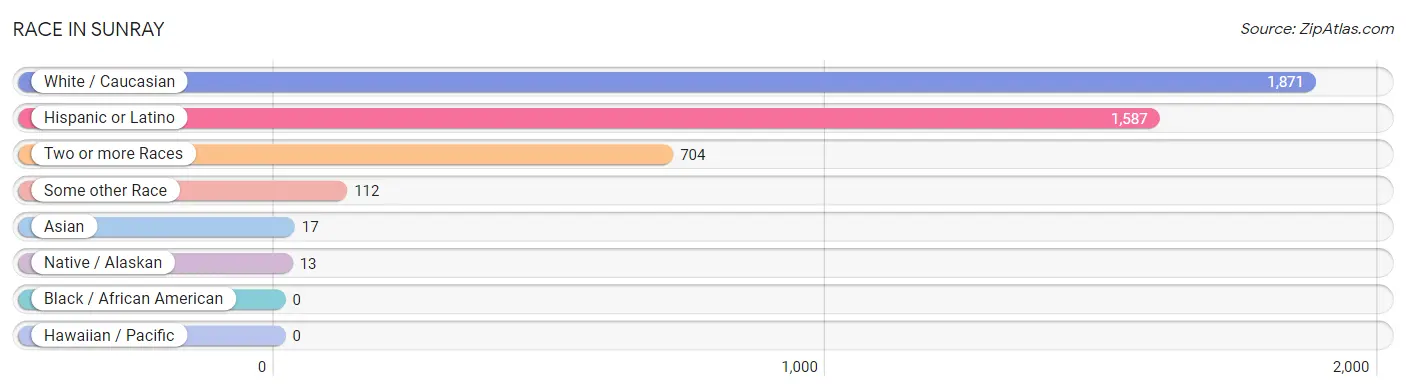
Race in Sunray
The most populous races in Sunray are White / Caucasian (1,871 | 68.9%), Hispanic or Latino (1,587 | 58.4%), and Two or more Races (704 | 25.9%).
| Race | # Population | % Population |
| Asian | 17 | 0.6% |
| Black / African American | 0 | 0.0% |
| Hawaiian / Pacific | 0 | 0.0% |
| Hispanic or Latino | 1,587 | 58.4% |
| Native / Alaskan | 13 | 0.5% |
| White / Caucasian | 1,871 | 68.9% |
| Two or more Races | 704 | 25.9% |
| Some other Race | 112 | 4.1% |
| Total | 2,717 | 100.0% |
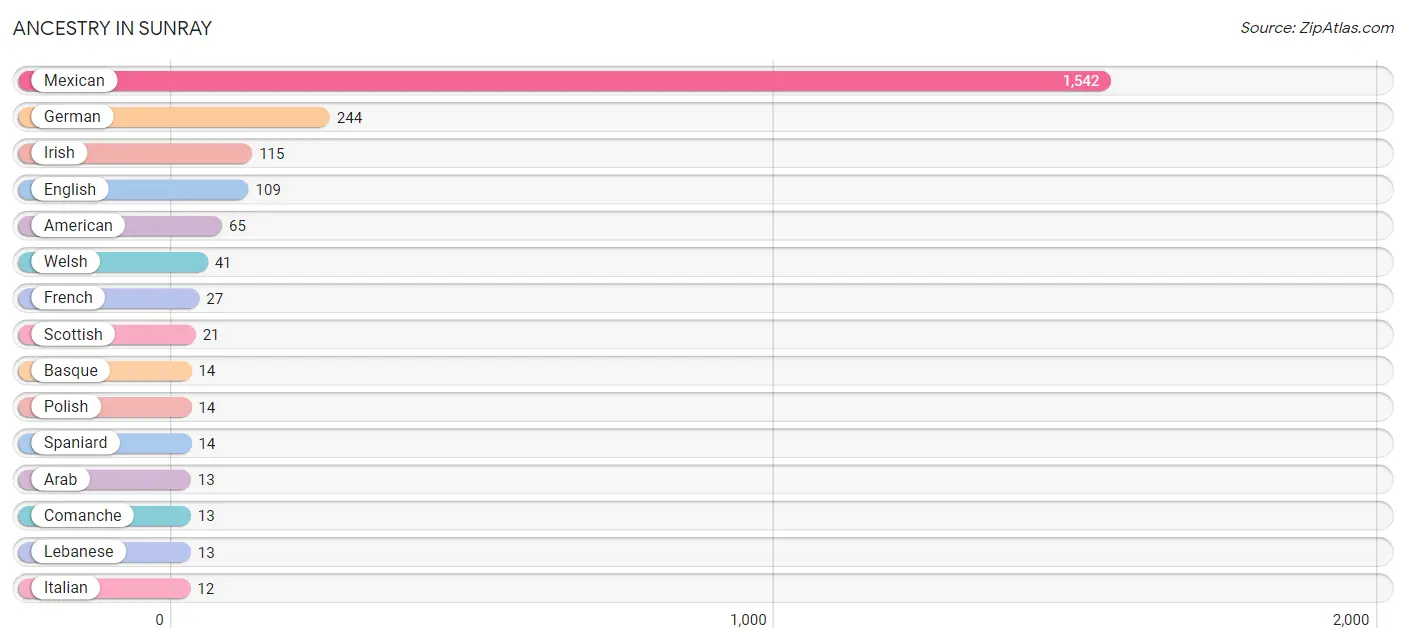
Ancestry in Sunray
The most populous ancestries reported in Sunray are Mexican (1,542 | 56.8%), German (244 | 9.0%), Irish (115 | 4.2%), English (109 | 4.0%), and American (65 | 2.4%), together accounting for 76.4% of all Sunray residents.
| Ancestry | # Population | % Population |
| American | 65 | 2.4% |
| Arab | 13 | 0.5% |
| Basque | 14 | 0.5% |
| Comanche | 13 | 0.5% |
| Creek | 6 | 0.2% |
| Czech | 8 | 0.3% |
| Danish | 6 | 0.2% |
| Dutch | 7 | 0.3% |
| English | 109 | 4.0% |
| French | 27 | 1.0% |
| French Canadian | 6 | 0.2% |
| German | 244 | 9.0% |
| Irish | 115 | 4.2% |
| Italian | 12 | 0.4% |
| Korean | 10 | 0.4% |
| Lebanese | 13 | 0.5% |
| Mexican | 1,542 | 56.8% |
| Norwegian | 6 | 0.2% |
| Polish | 14 | 0.5% |
| Scottish | 21 | 0.8% |
| Spaniard | 14 | 0.5% |
| Thai | 7 | 0.3% |
| Welsh | 41 | 1.5% | View All 23 Rows |
Immigrants in Sunray
The most numerous immigrant groups reported in Sunray came from Central America (774 | 28.5%), Latin America (774 | 28.5%), Mexico (774 | 28.5%), Asia (17 | 0.6%), and Philippines (10 | 0.4%), together accounting for 86.5% of all Sunray residents.
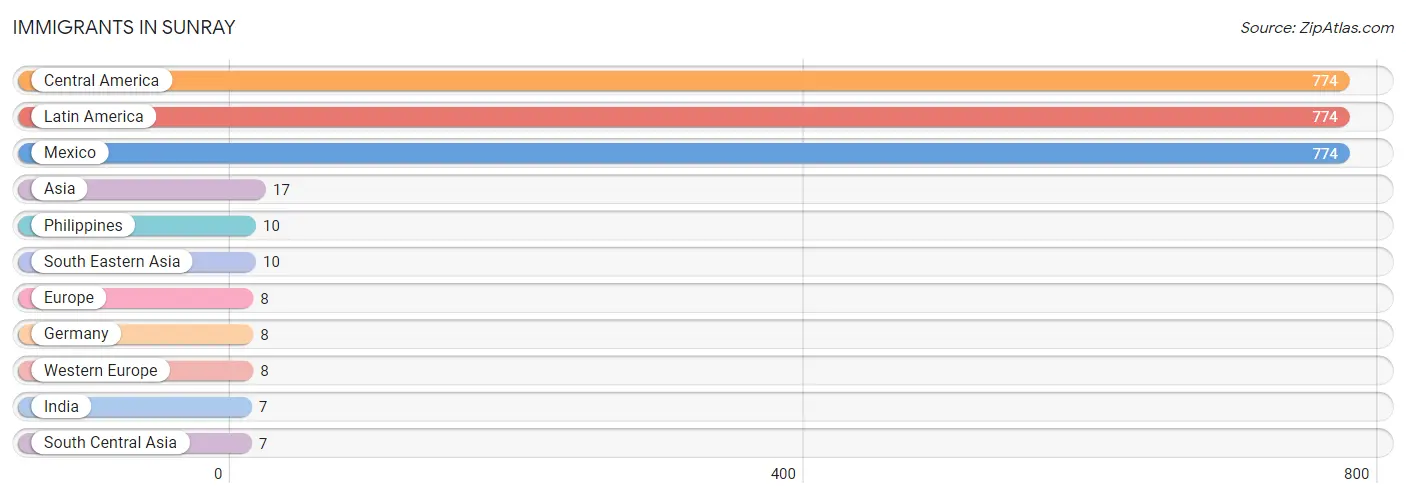
| Immigration Origin | # Population | % Population |
| Asia | 17 | 0.6% |
| Central America | 774 | 28.5% |
| Europe | 8 | 0.3% |
| Germany | 8 | 0.3% |
| India | 7 | 0.3% |
| Latin America | 774 | 28.5% |
| Mexico | 774 | 28.5% |
| Philippines | 10 | 0.4% |
| South Central Asia | 7 | 0.3% |
| South Eastern Asia | 10 | 0.4% |
| Western Europe | 8 | 0.3% | View All 11 Rows |
Sex and Age in Sunray
Sex and Age in Sunray
The most populous age groups in Sunray are 50 to 54 Years (142 | 10.7%) for men and 50 to 54 Years (180 | 12.9%) for women.
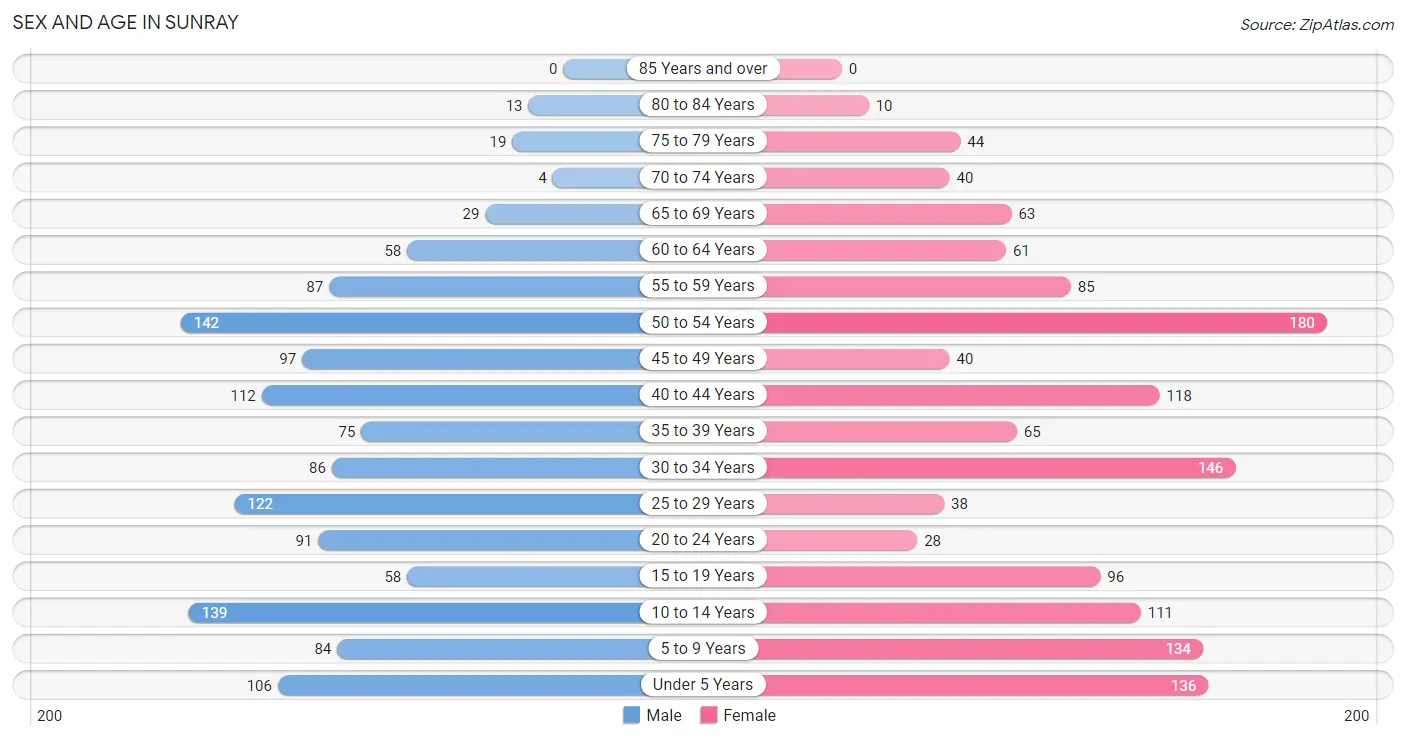
| Age Bracket | Male | Female |
| Under 5 Years | 106 (8.0%) | 136 (9.8%) |
| 5 to 9 Years | 84 (6.4%) | 134 (9.6%) |
| 10 to 14 Years | 139 (10.5%) | 111 (8.0%) |
| 15 to 19 Years | 58 (4.4%) | 96 (6.9%) |
| 20 to 24 Years | 91 (6.9%) | 28 (2.0%) |
| 25 to 29 Years | 122 (9.2%) | 38 (2.7%) |
| 30 to 34 Years | 86 (6.5%) | 146 (10.5%) |
| 35 to 39 Years | 75 (5.7%) | 65 (4.7%) |
| 40 to 44 Years | 112 (8.5%) | 118 (8.5%) |
| 45 to 49 Years | 97 (7.3%) | 40 (2.9%) |
| 50 to 54 Years | 142 (10.7%) | 180 (12.9%) |
| 55 to 59 Years | 87 (6.6%) | 85 (6.1%) |
| 60 to 64 Years | 58 (4.4%) | 61 (4.4%) |
| 65 to 69 Years | 29 (2.2%) | 63 (4.5%) |
| 70 to 74 Years | 4 (0.3%) | 40 (2.9%) |
| 75 to 79 Years | 19 (1.4%) | 44 (3.2%) |
| 80 to 84 Years | 13 (1.0%) | 10 (0.7%) |
| 85 Years and over | 0 (0.0%) | 0 (0.0%) |
| Total | 1,322 (100.0%) | 1,395 (100.0%) |
Families and Households in Sunray
Median Family Size in Sunray
The median family size in Sunray is 3.23 persons per family, with single male/father families (32 | 4.3%) accounting for the largest median family size of 4.06 persons per family. On the other hand, single female/mother families (69 | 9.2%) represent the smallest median family size with 2.97 persons per family.
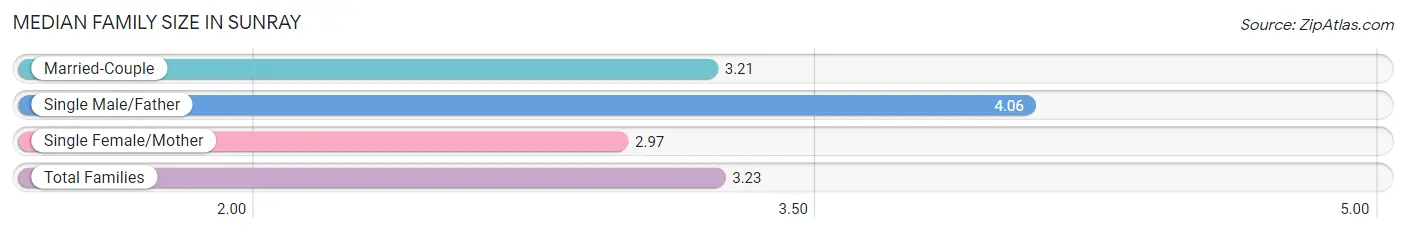
| Family Type | # Families | Family Size |
| Married-Couple | 649 (86.5%) | 3.21 |
| Single Male/Father | 32 (4.3%) | 4.06 |
| Single Female/Mother | 69 (9.2%) | 2.97 |
| Total Families | 750 (100.0%) | 3.23 |
Median Household Size in Sunray
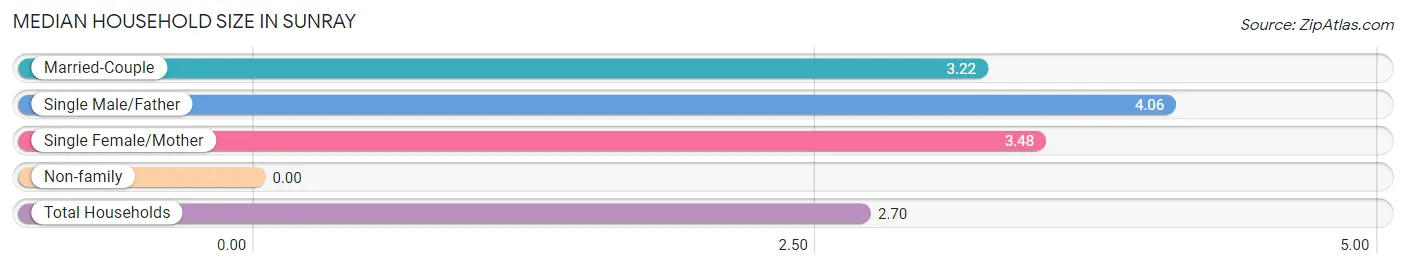
| Household Type | # Households | Household Size |
| Married-Couple | 649 (64.5%) | 3.22 |
| Single Male/Father | 32 (3.2%) | 4.06 |
| Single Female/Mother | 69 (6.9%) | 3.48 |
| Non-family | 256 (25.5%) | - |
| Total Households | 1,006 (100.0%) | 2.70 |
Household Size by Marriage Status in Sunray
Out of a total of 1,006 households in Sunray, 750 (74.6%) are family households, while 256 (25.5%) are nonfamily households. The most numerous type of family households are 4-person households, comprising 231, and the most common type of nonfamily households are 1-person households, comprising 256.
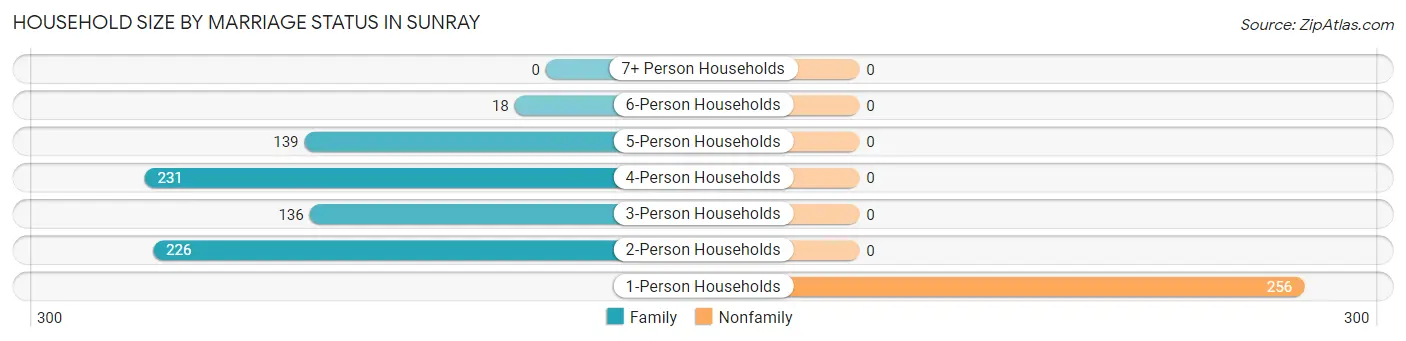
| Household Size | Family Households | Nonfamily Households |
| 1-Person Households | - | 256 (25.5%) |
| 2-Person Households | 226 (22.5%) | 0 (0.0%) |
| 3-Person Households | 136 (13.5%) | 0 (0.0%) |
| 4-Person Households | 231 (23.0%) | 0 (0.0%) |
| 5-Person Households | 139 (13.8%) | 0 (0.0%) |
| 6-Person Households | 18 (1.8%) | 0 (0.0%) |
| 7+ Person Households | 0 (0.0%) | 0 (0.0%) |
| Total | 750 (74.6%) | 256 (25.5%) |
Female Fertility in Sunray
Fertility by Age in Sunray
Average fertility rate in Sunray is 45.0 births per 1,000 women. Women in the age bracket of 20 to 34 years have the highest fertility rate with 118.0 births per 1,000 women. Women in the age bracket of 20 to 34 years acount for 100.0% of all women with births.
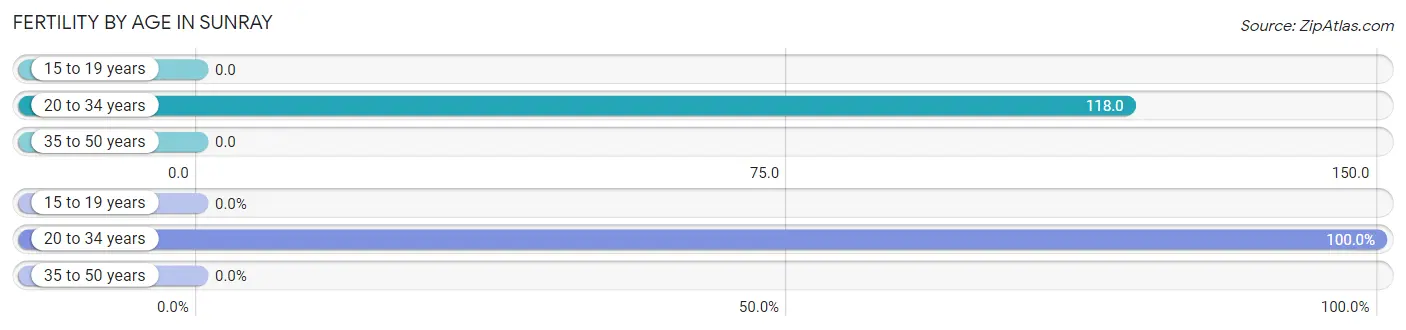
| Age Bracket | Women with Births | Births / 1,000 Women |
| 15 to 19 years | 0 (0.0%) | 0.0 |
| 20 to 34 years | 25 (100.0%) | 118.0 |
| 35 to 50 years | 0 (0.0%) | 0.0 |
| Total | 25 (100.0%) | 45.0 |
Fertility by Age by Marriage Status in Sunray
76.0% of women with births (25) in Sunray are married. The highest percentage of unmarried women with births falls into 20 to 34 years age bracket with 24.0% of them unmarried at the time of birth, while the lowest percentage of unmarried women with births belong to 20 to 34 years age bracket with 24.0% of them unmarried.
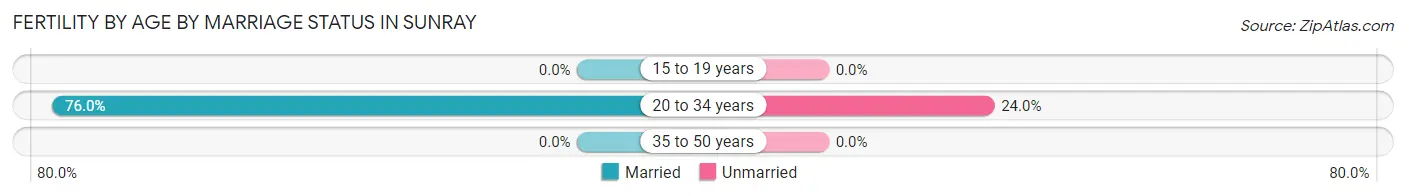
| Age Bracket | Married | Unmarried |
| 15 to 19 years | 0 (0.0%) | 0 (0.0%) |
| 20 to 34 years | 19 (76.0%) | 6 (24.0%) |
| 35 to 50 years | 0 (0.0%) | 0 (0.0%) |
| Total | 19 (76.0%) | 6 (24.0%) |
Fertility by Education in Sunray
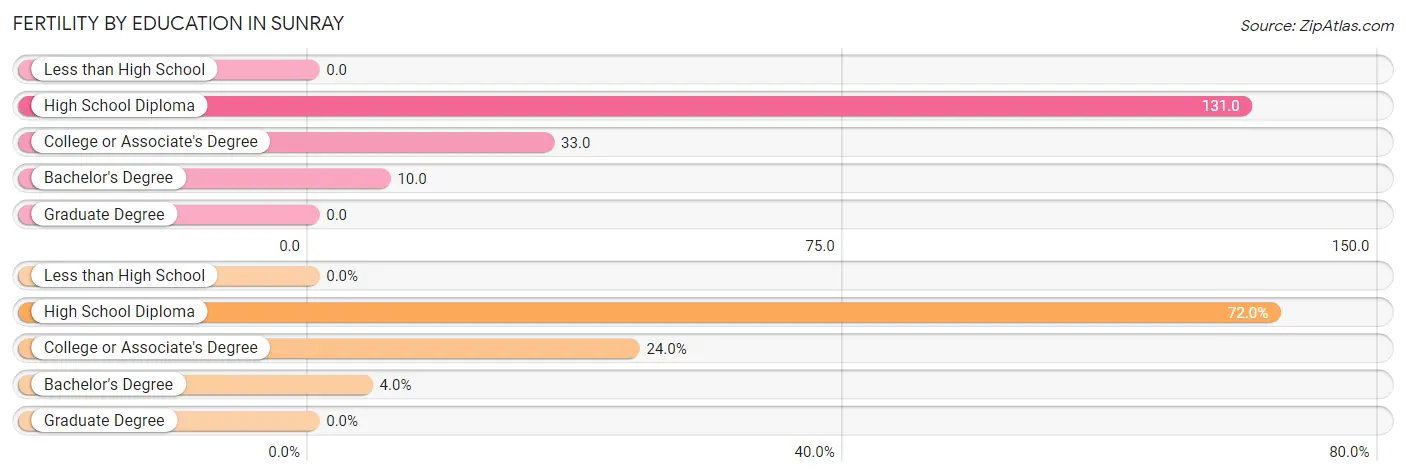
| Educational Attainment | Women with Births | Births / 1,000 Women |
| Less than High School | 0 (0.0%) | 0.0 |
| High School Diploma | 18 (72.0%) | 131.0 |
| College or Associate's Degree | 6 (24.0%) | 33.0 |
| Bachelor's Degree | 1 (4.0%) | 10.0 |
| Graduate Degree | 0 (0.0%) | 0.0 |
| Total | 25 (100.0%) | 45.0 |
Fertility by Education by Marriage Status in Sunray
24.0% of women with births in Sunray are unmarried. Women with the educational attainment of high school diploma are most likely to be married with 100.0% of them married at childbirth, while women with the educational attainment of college or associate's degree are least likely to be married with 100.0% of them unmarried at childbirth.
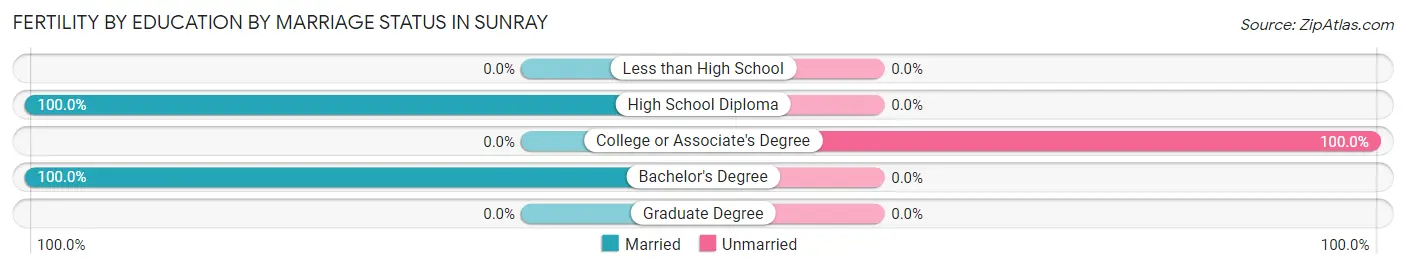
| Educational Attainment | Married | Unmarried |
| Less than High School | 0 (0.0%) | 0 (0.0%) |
| High School Diploma | 18 (100.0%) | 0 (0.0%) |
| College or Associate's Degree | 0 (0.0%) | 6 (100.0%) |
| Bachelor's Degree | 1 (100.0%) | 0 (0.0%) |
| Graduate Degree | 0 (0.0%) | 0 (0.0%) |
| Total | 19 (76.0%) | 6 (24.0%) |
Employment Characteristics in Sunray
Employment by Class of Employer in Sunray
Among the 1,233 employed individuals in Sunray, private company employees (865 | 70.2%), local government employees (143 | 11.6%), and self-employed (incorporated) (66 | 5.3%) make up the most common classes of employment.
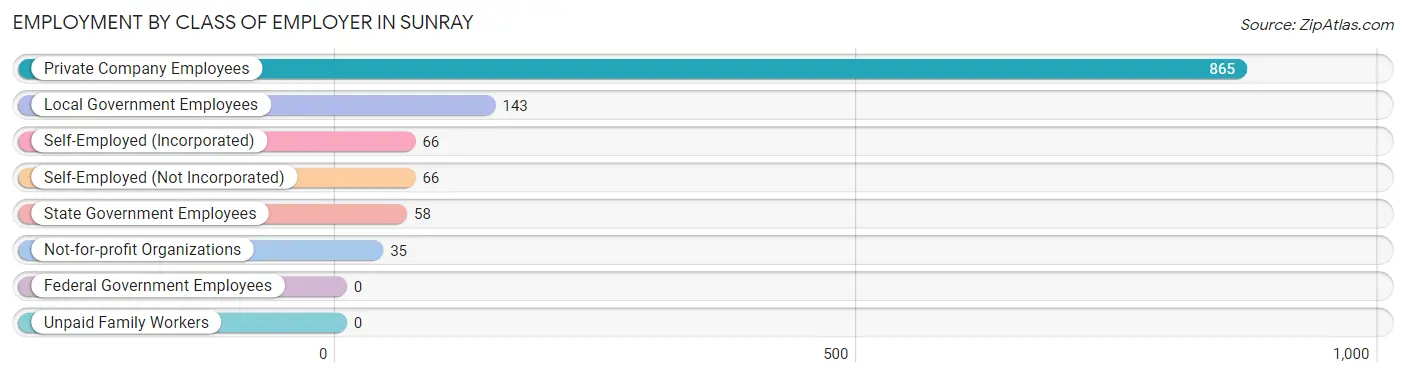
| Employer Class | # Employees | % Employees |
| Private Company Employees | 865 | 70.2% |
| Self-Employed (Incorporated) | 66 | 5.3% |
| Self-Employed (Not Incorporated) | 66 | 5.3% |
| Not-for-profit Organizations | 35 | 2.8% |
| Local Government Employees | 143 | 11.6% |
| State Government Employees | 58 | 4.7% |
| Federal Government Employees | 0 | 0.0% |
| Unpaid Family Workers | 0 | 0.0% |
| Total | 1,233 | 100.0% |
Employment Status by Age in Sunray
According to the labor force statistics for Sunray, out of the total population over 16 years of age (1,998), 64.7% or 1,293 individuals are in the labor force, with 3.9% or 50 of them unemployed. The age group with the highest labor force participation rate is 20 to 24 years, with 100.0% or 119 individuals in the labor force. Within the labor force, the 16 to 19 years age range has the highest percentage of unemployed individuals, with 65.4% or 17 of them being unemployed.
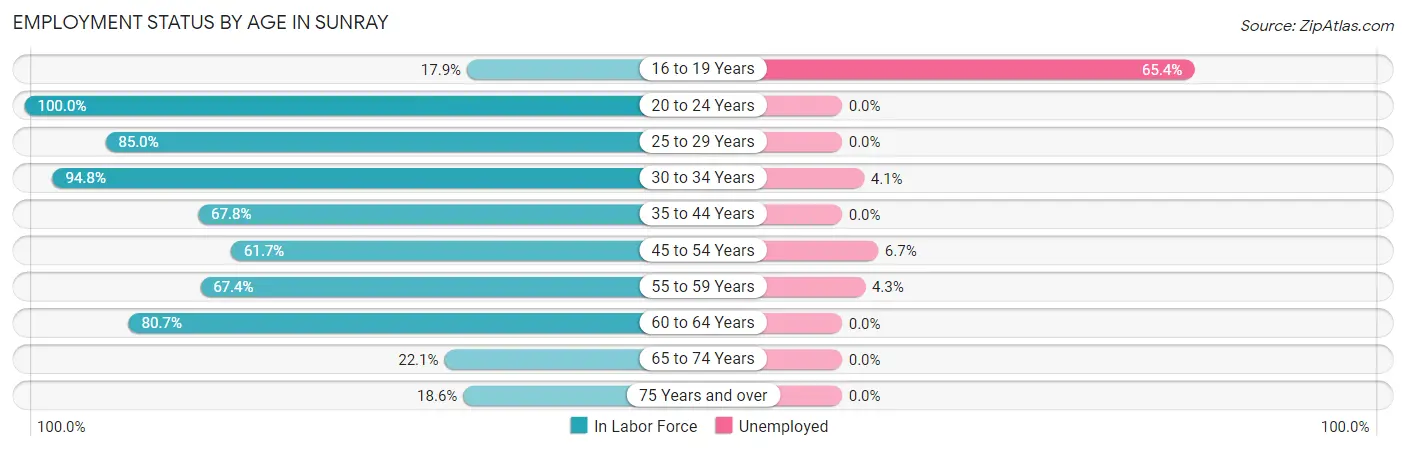
| Age Bracket | In Labor Force | Unemployed |
| 16 to 19 Years | 26 (17.9%) | 17 (65.4%) |
| 20 to 24 Years | 119 (100.0%) | 0 (0.0%) |
| 25 to 29 Years | 136 (85.0%) | 0 (0.0%) |
| 30 to 34 Years | 220 (94.8%) | 9 (4.1%) |
| 35 to 44 Years | 251 (67.8%) | 0 (0.0%) |
| 45 to 54 Years | 283 (61.7%) | 19 (6.7%) |
| 55 to 59 Years | 116 (67.4%) | 5 (4.3%) |
| 60 to 64 Years | 96 (80.7%) | 0 (0.0%) |
| 65 to 74 Years | 30 (22.1%) | 0 (0.0%) |
| 75 Years and over | 16 (18.6%) | 0 (0.0%) |
| Total | 1,293 (64.7%) | 50 (3.9%) |
Employment Status by Educational Attainment in Sunray
According to labor force statistics for Sunray, 72.9% of individuals (1,102) out of the total population between 25 and 64 years of age (1,512) are in the labor force, with 3.0% or 33 of them being unemployed. The group with the highest labor force participation rate are those with the educational attainment of college / associate degree, with 85.0% or 294 individuals in the labor force. Within the labor force, individuals with college / associate degree education have the highest percentage of unemployment, with 6.5% or 19 of them being unemployed.
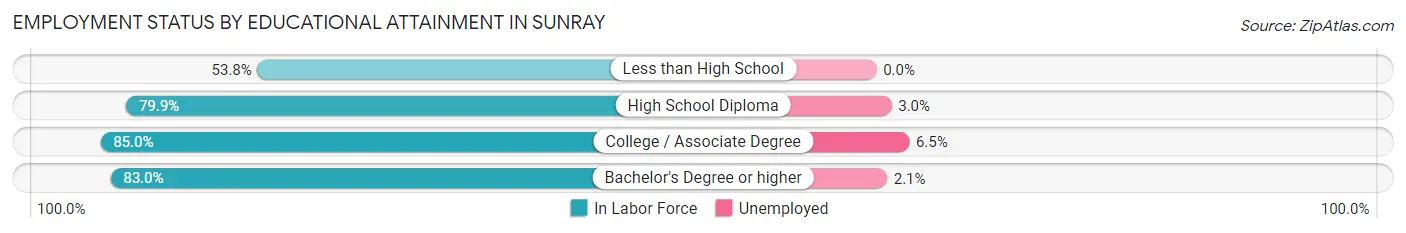
| Educational Attainment | In Labor Force | Unemployed |
| Less than High School | 274 (53.8%) | 0 (0.0%) |
| High School Diploma | 299 (79.9%) | 11 (3.0%) |
| College / Associate Degree | 294 (85.0%) | 22 (6.5%) |
| Bachelor's Degree or higher | 235 (83.0%) | 6 (2.1%) |
| Total | 1,102 (72.9%) | 45 (3.0%) |
Employment Occupations by Sex in Sunray
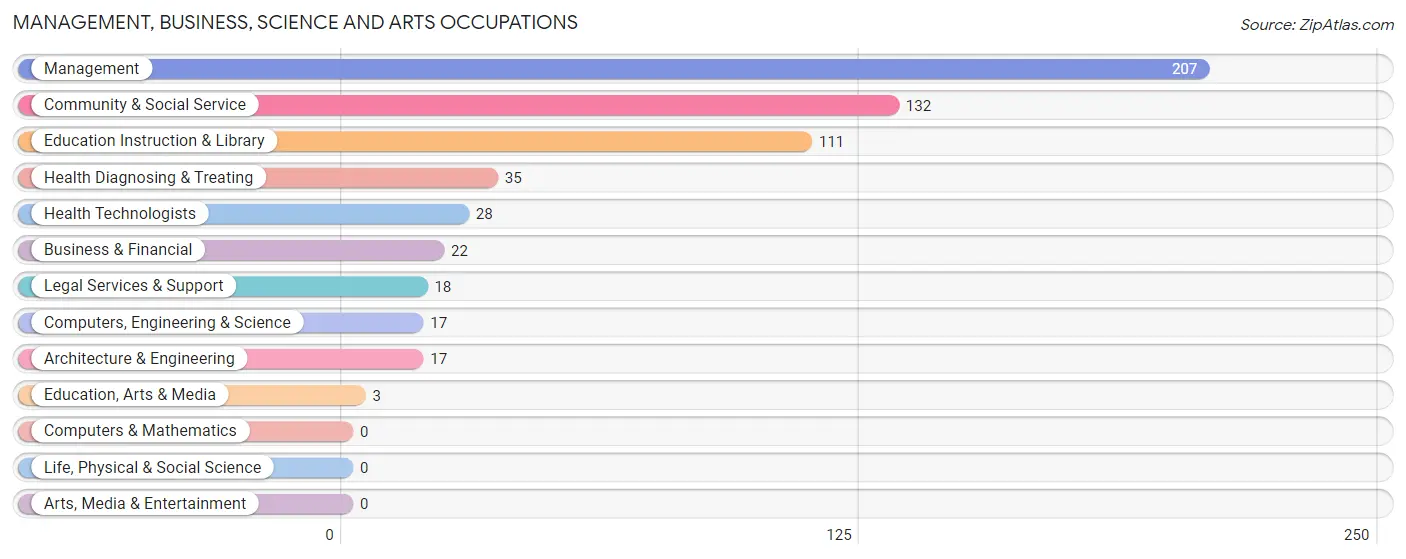
Management, Business, Science and Arts Occupations
The most common Management, Business, Science and Arts occupations in Sunray are Management (207 | 16.7%), Community & Social Service (132 | 10.6%), Education Instruction & Library (111 | 8.9%), Health Diagnosing & Treating (35 | 2.8%), and Health Technologists (28 | 2.2%).
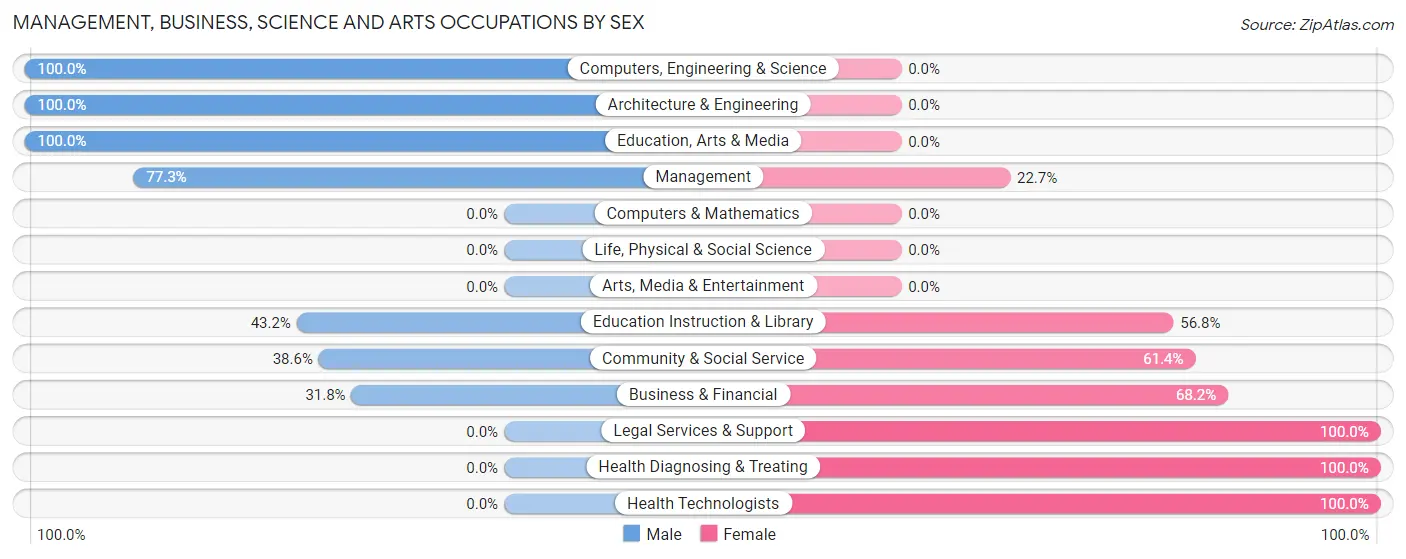
Management, Business, Science and Arts Occupations by Sex
Within the Management, Business, Science and Arts occupations in Sunray, the most male-oriented occupations are Computers, Engineering & Science (100.0%), Architecture & Engineering (100.0%), and Education, Arts & Media (100.0%), while the most female-oriented occupations are Legal Services & Support (100.0%), Health Diagnosing & Treating (100.0%), and Health Technologists (100.0%).
| Occupation | Male | Female |
| Management | 160 (77.3%) | 47 (22.7%) |
| Business & Financial | 7 (31.8%) | 15 (68.2%) |
| Computers, Engineering & Science | 17 (100.0%) | 0 (0.0%) |
| Computers & Mathematics | 0 (0.0%) | 0 (0.0%) |
| Architecture & Engineering | 17 (100.0%) | 0 (0.0%) |
| Life, Physical & Social Science | 0 (0.0%) | 0 (0.0%) |
| Community & Social Service | 51 (38.6%) | 81 (61.4%) |
| Education, Arts & Media | 3 (100.0%) | 0 (0.0%) |
| Legal Services & Support | 0 (0.0%) | 18 (100.0%) |
| Education Instruction & Library | 48 (43.2%) | 63 (56.8%) |
| Arts, Media & Entertainment | 0 (0.0%) | 0 (0.0%) |
| Health Diagnosing & Treating | 0 (0.0%) | 35 (100.0%) |
| Health Technologists | 0 (0.0%) | 28 (100.0%) |
| Total (Category) | 235 (56.9%) | 178 (43.1%) |
| Total (Overall) | 815 (65.6%) | 428 (34.4%) |
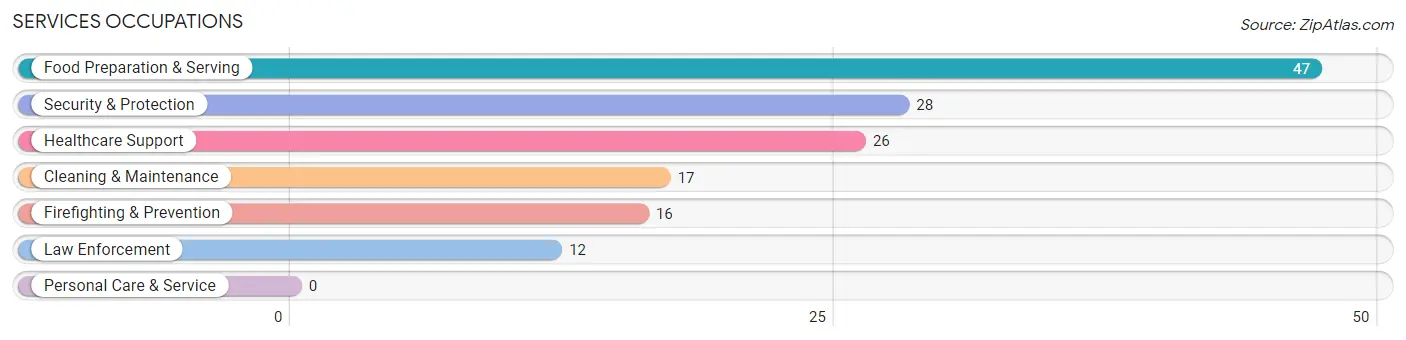
Services Occupations
The most common Services occupations in Sunray are Food Preparation & Serving (47 | 3.8%), Security & Protection (28 | 2.2%), Healthcare Support (26 | 2.1%), Cleaning & Maintenance (17 | 1.4%), and Firefighting & Prevention (16 | 1.3%).
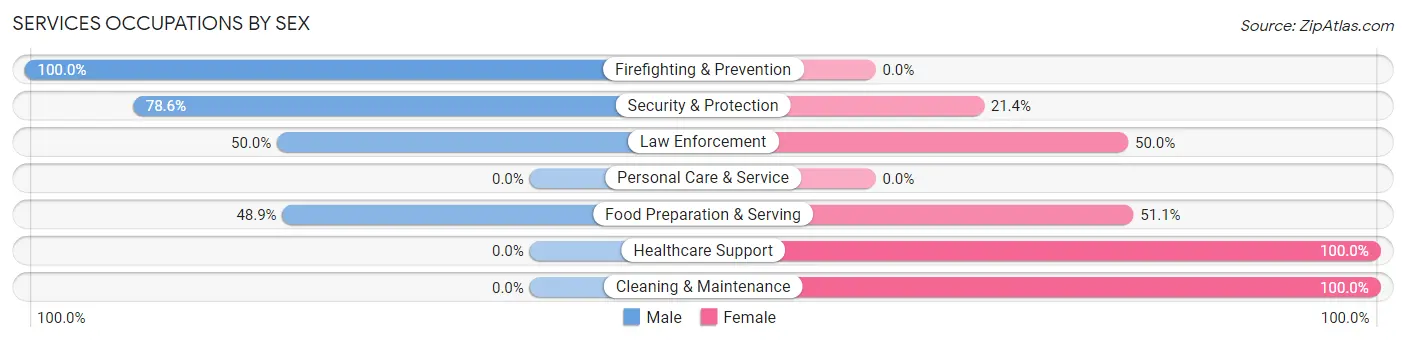
Services Occupations by Sex
Within the Services occupations in Sunray, the most male-oriented occupations are Firefighting & Prevention (100.0%), Security & Protection (78.6%), and Law Enforcement (50.0%), while the most female-oriented occupations are Healthcare Support (100.0%), Cleaning & Maintenance (100.0%), and Food Preparation & Serving (51.1%).
| Occupation | Male | Female |
| Healthcare Support | 0 (0.0%) | 26 (100.0%) |
| Security & Protection | 22 (78.6%) | 6 (21.4%) |
| Firefighting & Prevention | 16 (100.0%) | 0 (0.0%) |
| Law Enforcement | 6 (50.0%) | 6 (50.0%) |
| Food Preparation & Serving | 23 (48.9%) | 24 (51.1%) |
| Cleaning & Maintenance | 0 (0.0%) | 17 (100.0%) |
| Personal Care & Service | 0 (0.0%) | 0 (0.0%) |
| Total (Category) | 45 (38.1%) | 73 (61.9%) |
| Total (Overall) | 815 (65.6%) | 428 (34.4%) |
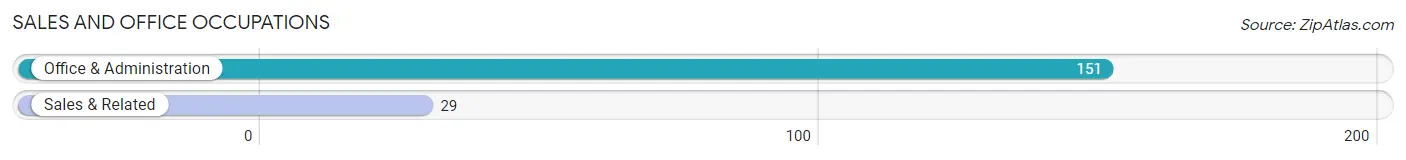
Sales and Office Occupations
The most common Sales and Office occupations in Sunray are Office & Administration (151 | 12.1%), and Sales & Related (29 | 2.3%).
Sales and Office Occupations by Sex
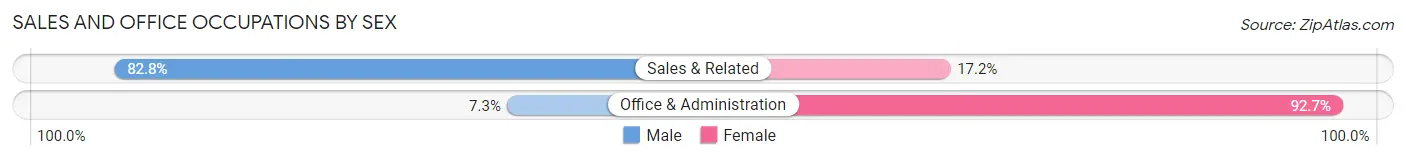
| Occupation | Male | Female |
| Sales & Related | 24 (82.8%) | 5 (17.2%) |
| Office & Administration | 11 (7.3%) | 140 (92.7%) |
| Total (Category) | 35 (19.4%) | 145 (80.6%) |
| Total (Overall) | 815 (65.6%) | 428 (34.4%) |
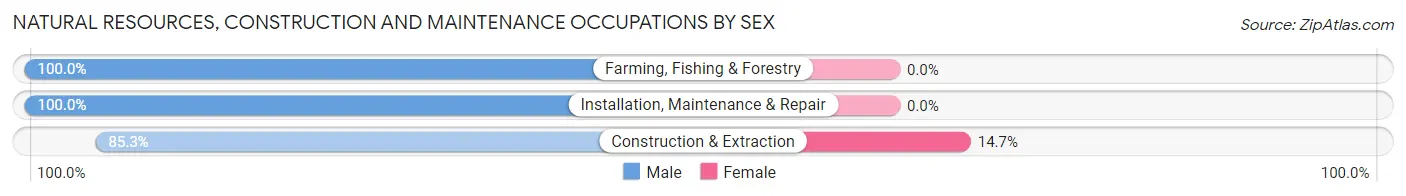
Natural Resources, Construction and Maintenance Occupations
The most common Natural Resources, Construction and Maintenance occupations in Sunray are Farming, Fishing & Forestry (144 | 11.6%), Construction & Extraction (95 | 7.6%), and Installation, Maintenance & Repair (71 | 5.7%).

Natural Resources, Construction and Maintenance Occupations by Sex
| Occupation | Male | Female |
| Farming, Fishing & Forestry | 144 (100.0%) | 0 (0.0%) |
| Construction & Extraction | 81 (85.3%) | 14 (14.7%) |
| Installation, Maintenance & Repair | 71 (100.0%) | 0 (0.0%) |
| Total (Category) | 296 (95.5%) | 14 (4.5%) |
| Total (Overall) | 815 (65.6%) | 428 (34.4%) |
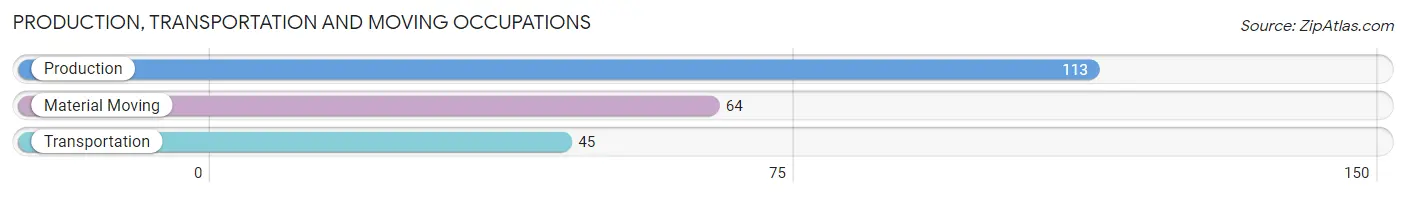
Production, Transportation and Moving Occupations
The most common Production, Transportation and Moving occupations in Sunray are Production (113 | 9.1%), Material Moving (64 | 5.1%), and Transportation (45 | 3.6%).
Production, Transportation and Moving Occupations by Sex
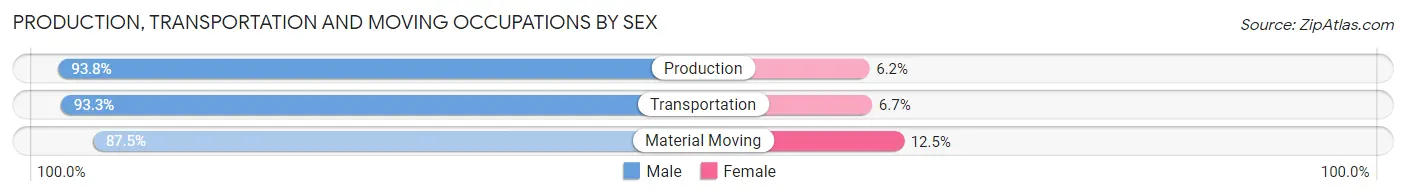
| Occupation | Male | Female |
| Production | 106 (93.8%) | 7 (6.2%) |
| Transportation | 42 (93.3%) | 3 (6.7%) |
| Material Moving | 56 (87.5%) | 8 (12.5%) |
| Total (Category) | 204 (91.9%) | 18 (8.1%) |
| Total (Overall) | 815 (65.6%) | 428 (34.4%) |
Employment Industries by Sex in Sunray
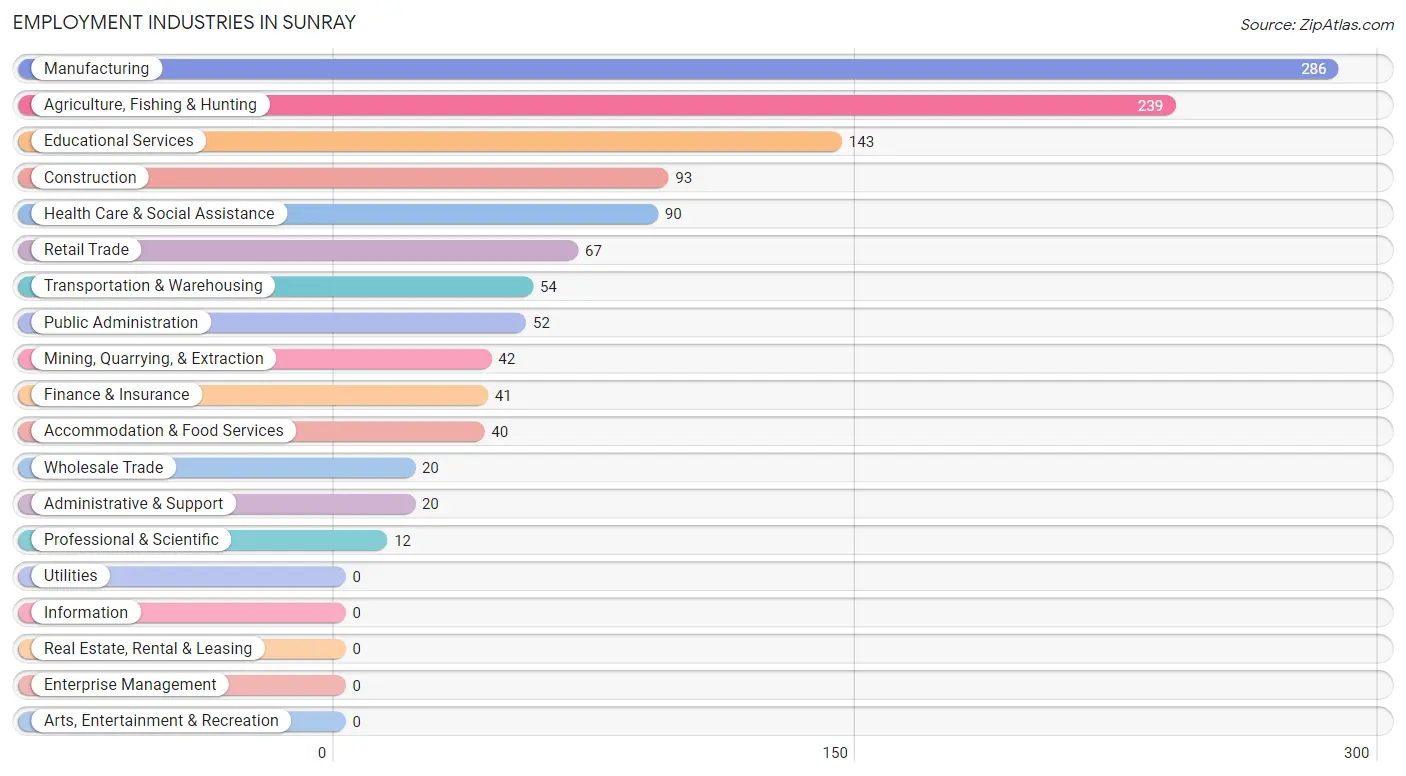
Employment Industries in Sunray
The major employment industries in Sunray include Manufacturing (286 | 23.0%), Agriculture, Fishing & Hunting (239 | 19.2%), Educational Services (143 | 11.5%), Construction (93 | 7.5%), and Health Care & Social Assistance (90 | 7.2%).
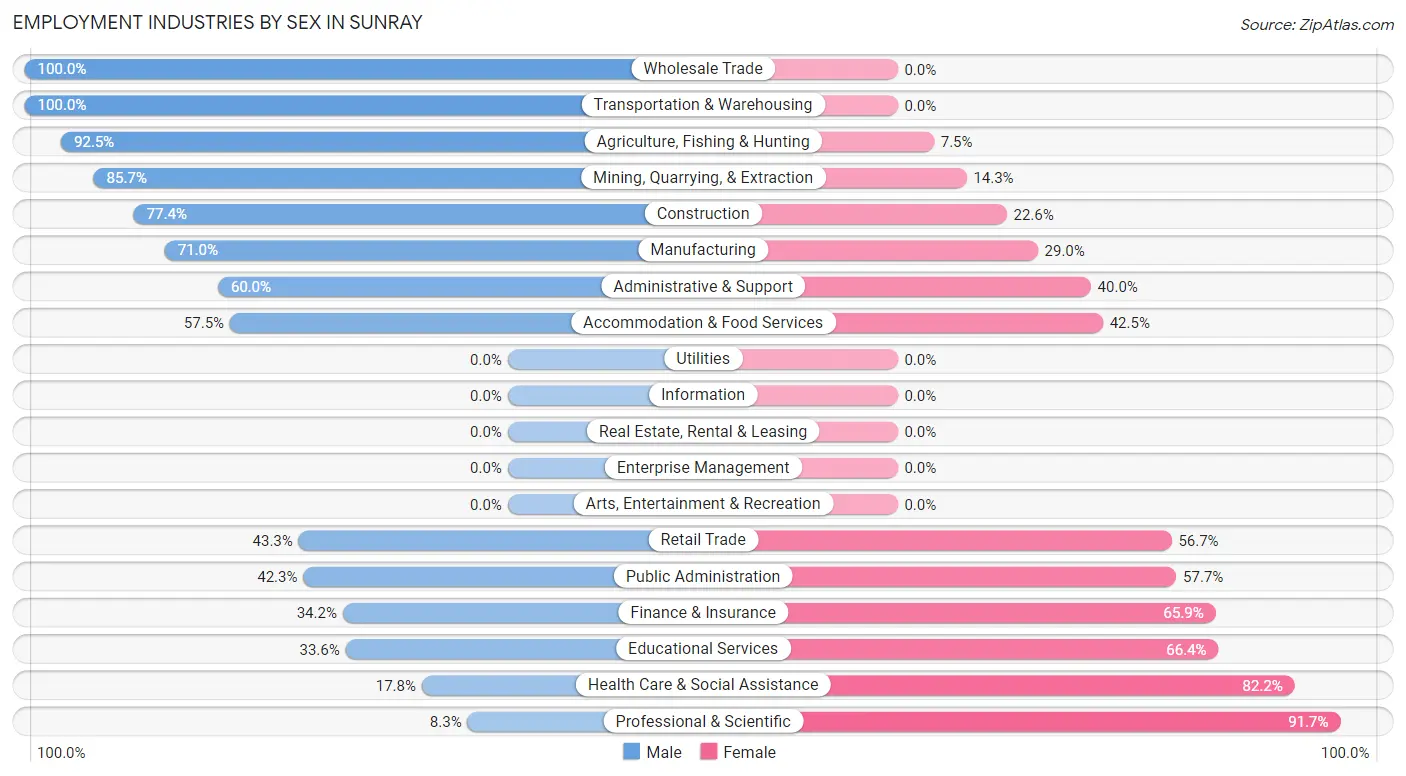
Employment Industries by Sex in Sunray
The Sunray industries that see more men than women are Wholesale Trade (100.0%), Transportation & Warehousing (100.0%), and Agriculture, Fishing & Hunting (92.5%), whereas the industries that tend to have a higher number of women are Professional & Scientific (91.7%), Health Care & Social Assistance (82.2%), and Educational Services (66.4%).
| Industry | Male | Female |
| Agriculture, Fishing & Hunting | 221 (92.5%) | 18 (7.5%) |
| Mining, Quarrying, & Extraction | 36 (85.7%) | 6 (14.3%) |
| Construction | 72 (77.4%) | 21 (22.6%) |
| Manufacturing | 203 (71.0%) | 83 (29.0%) |
| Wholesale Trade | 20 (100.0%) | 0 (0.0%) |
| Retail Trade | 29 (43.3%) | 38 (56.7%) |
| Transportation & Warehousing | 54 (100.0%) | 0 (0.0%) |
| Utilities | 0 (0.0%) | 0 (0.0%) |
| Information | 0 (0.0%) | 0 (0.0%) |
| Finance & Insurance | 14 (34.2%) | 27 (65.8%) |
| Real Estate, Rental & Leasing | 0 (0.0%) | 0 (0.0%) |
| Professional & Scientific | 1 (8.3%) | 11 (91.7%) |
| Enterprise Management | 0 (0.0%) | 0 (0.0%) |
| Administrative & Support | 12 (60.0%) | 8 (40.0%) |
| Educational Services | 48 (33.6%) | 95 (66.4%) |
| Health Care & Social Assistance | 16 (17.8%) | 74 (82.2%) |
| Arts, Entertainment & Recreation | 0 (0.0%) | 0 (0.0%) |
| Accommodation & Food Services | 23 (57.5%) | 17 (42.5%) |
| Public Administration | 22 (42.3%) | 30 (57.7%) |
| Total | 815 (65.6%) | 428 (34.4%) |
Education in Sunray
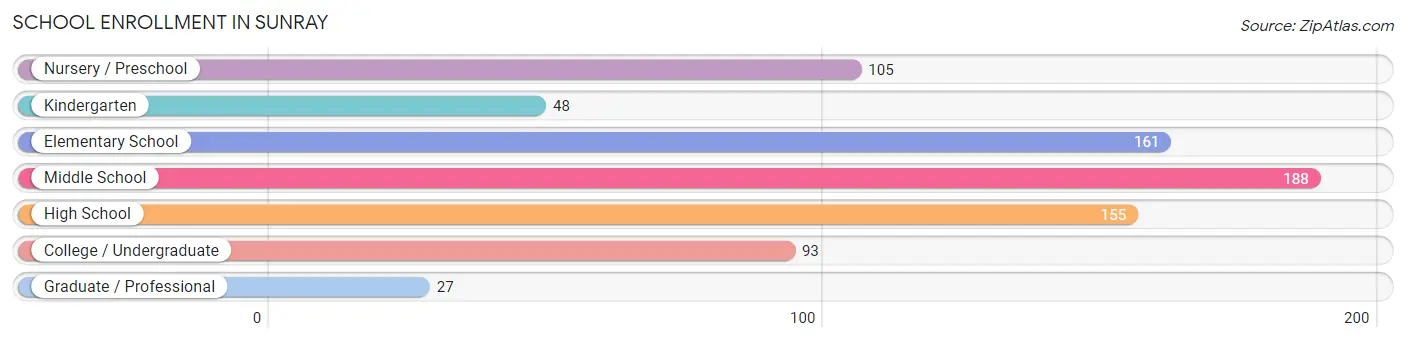
School Enrollment in Sunray
The most common levels of schooling among the 777 students in Sunray are middle school (188 | 24.2%), elementary school (161 | 20.7%), and high school (155 | 20.0%).
| School Level | # Students | % Students |
| Nursery / Preschool | 105 | 13.5% |
| Kindergarten | 48 | 6.2% |
| Elementary School | 161 | 20.7% |
| Middle School | 188 | 24.2% |
| High School | 155 | 20.0% |
| College / Undergraduate | 93 | 12.0% |
| Graduate / Professional | 27 | 3.5% |
| Total | 777 | 100.0% |
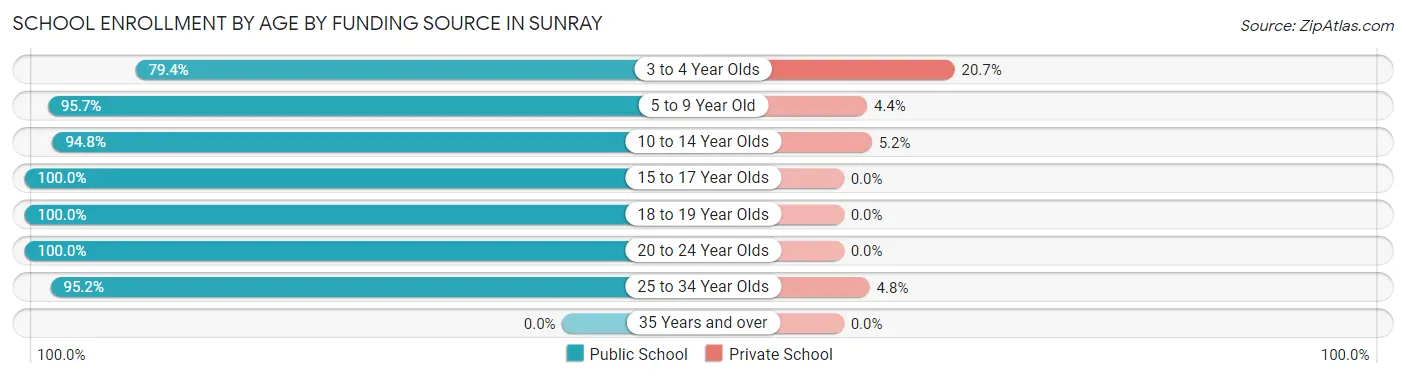
School Enrollment by Age by Funding Source in Sunray
Out of a total of 777 students who are enrolled in schools in Sunray, 43 (5.5%) attend a private institution, while the remaining 734 (94.5%) are enrolled in public schools. The age group of 3 to 4 year olds has the highest likelihood of being enrolled in private schools, with 19 (20.6% in the age bracket) enrolled. Conversely, the age group of 15 to 17 year olds has the lowest likelihood of being enrolled in a private school, with 128 (100.0% in the age bracket) attending a public institution.
| Age Bracket | Public School | Private School |
| 3 to 4 Year Olds | 73 (79.3%) | 19 (20.6%) |
| 5 to 9 Year Old | 198 (95.7%) | 9 (4.3%) |
| 10 to 14 Year Olds | 218 (94.8%) | 12 (5.2%) |
| 15 to 17 Year Olds | 128 (100.0%) | 0 (0.0%) |
| 18 to 19 Year Olds | 9 (100.0%) | 0 (0.0%) |
| 20 to 24 Year Olds | 49 (100.0%) | 0 (0.0%) |
| 25 to 34 Year Olds | 59 (95.2%) | 3 (4.8%) |
| 35 Years and over | 0 (0.0%) | 0 (0.0%) |
| Total | 734 (94.5%) | 43 (5.5%) |
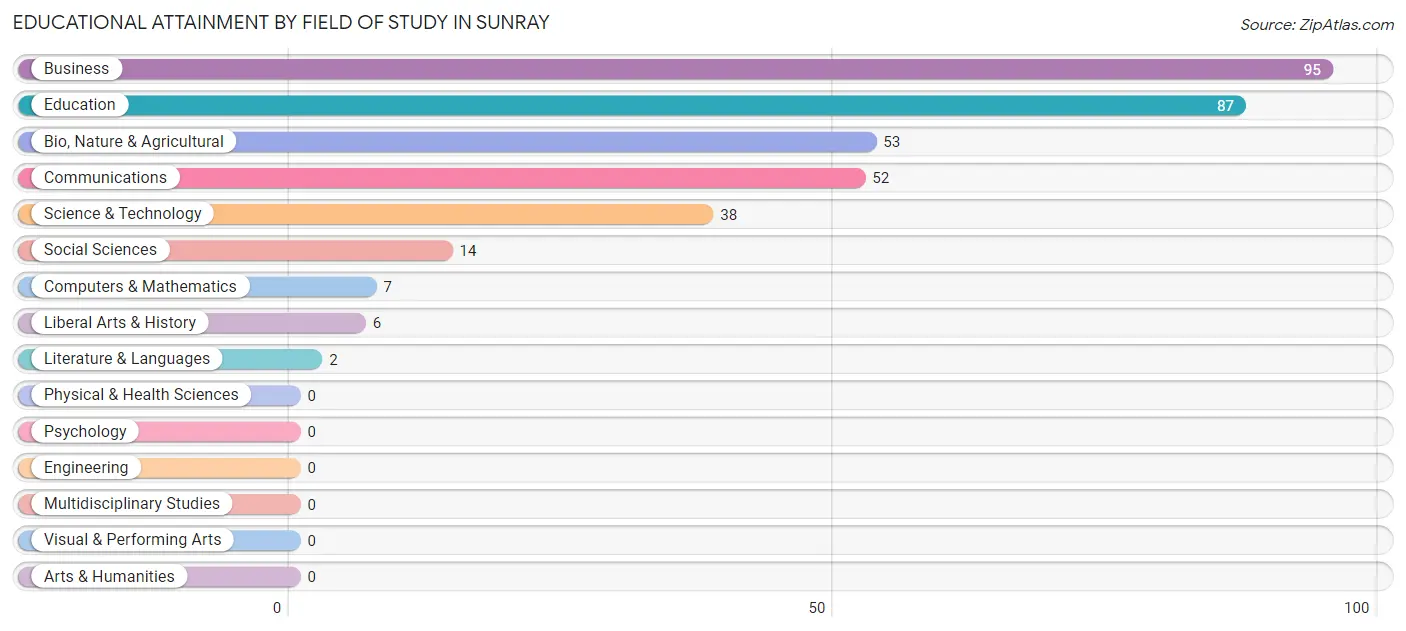
Educational Attainment by Field of Study in Sunray
Business (95 | 26.8%), education (87 | 24.6%), bio, nature & agricultural (53 | 15.0%), communications (52 | 14.7%), and science & technology (38 | 10.7%) are the most common fields of study among 354 individuals in Sunray who have obtained a bachelor's degree or higher.
| Field of Study | # Graduates | % Graduates |
| Computers & Mathematics | 7 | 2.0% |
| Bio, Nature & Agricultural | 53 | 15.0% |
| Physical & Health Sciences | 0 | 0.0% |
| Psychology | 0 | 0.0% |
| Social Sciences | 14 | 4.0% |
| Engineering | 0 | 0.0% |
| Multidisciplinary Studies | 0 | 0.0% |
| Science & Technology | 38 | 10.7% |
| Business | 95 | 26.8% |
| Education | 87 | 24.6% |
| Literature & Languages | 2 | 0.6% |
| Liberal Arts & History | 6 | 1.7% |
| Visual & Performing Arts | 0 | 0.0% |
| Communications | 52 | 14.7% |
| Arts & Humanities | 0 | 0.0% |
| Total | 354 | 100.0% |
Transportation & Commute in Sunray
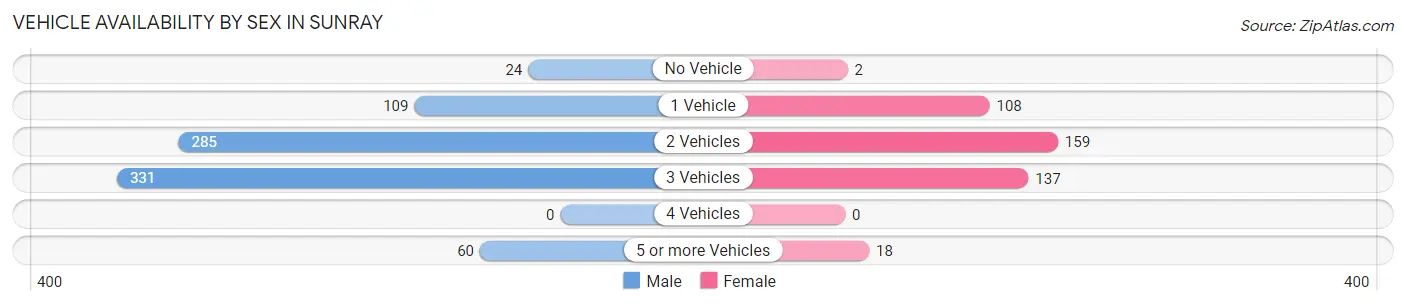
Vehicle Availability by Sex in Sunray
The most prevalent vehicle ownership categories in Sunray are males with 3 vehicles (331, accounting for 40.9%) and females with 3 vehicles (137, making up 78.1%).
| Vehicles Available | Male | Female |
| No Vehicle | 24 (3.0%) | 2 (0.5%) |
| 1 Vehicle | 109 (13.5%) | 108 (25.5%) |
| 2 Vehicles | 285 (35.2%) | 159 (37.5%) |
| 3 Vehicles | 331 (40.9%) | 137 (32.3%) |
| 4 Vehicles | 0 (0.0%) | 0 (0.0%) |
| 5 or more Vehicles | 60 (7.4%) | 18 (4.3%) |
| Total | 809 (100.0%) | 424 (100.0%) |
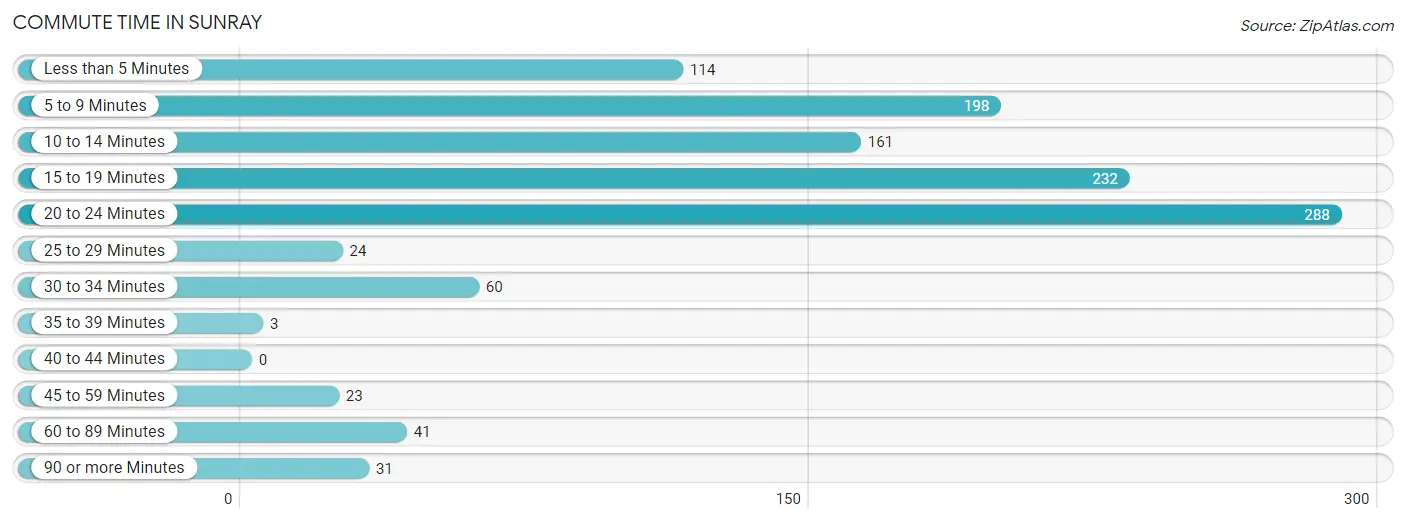
Commute Time in Sunray
The most frequently occuring commute durations in Sunray are 20 to 24 minutes (288 commuters, 24.5%), 15 to 19 minutes (232 commuters, 19.7%), and 5 to 9 minutes (198 commuters, 16.9%).
| Commute Time | # Commuters | % Commuters |
| Less than 5 Minutes | 114 | 9.7% |
| 5 to 9 Minutes | 198 | 16.9% |
| 10 to 14 Minutes | 161 | 13.7% |
| 15 to 19 Minutes | 232 | 19.7% |
| 20 to 24 Minutes | 288 | 24.5% |
| 25 to 29 Minutes | 24 | 2.0% |
| 30 to 34 Minutes | 60 | 5.1% |
| 35 to 39 Minutes | 3 | 0.3% |
| 40 to 44 Minutes | 0 | 0.0% |
| 45 to 59 Minutes | 23 | 2.0% |
| 60 to 89 Minutes | 41 | 3.5% |
| 90 or more Minutes | 31 | 2.6% |
Commute Time by Sex in Sunray
The most common commute times in Sunray are 20 to 24 minutes (244 commuters, 30.6%) for males and 5 to 9 minutes (84 commuters, 22.2%) for females.
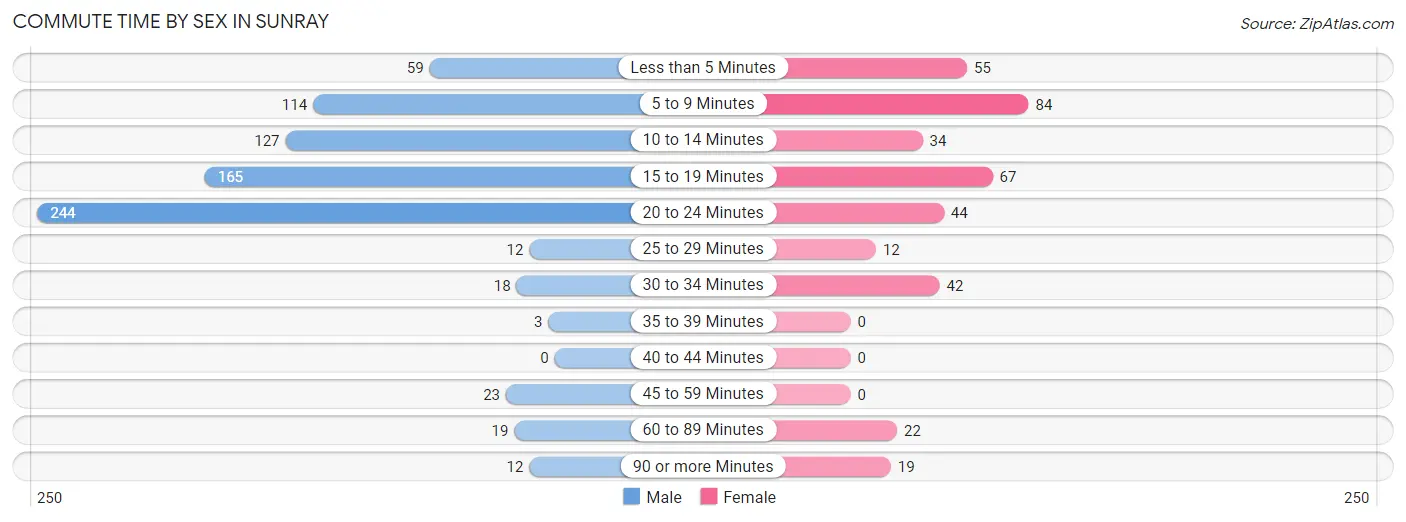
| Commute Time | Male | Female |
| Less than 5 Minutes | 59 (7.4%) | 55 (14.5%) |
| 5 to 9 Minutes | 114 (14.3%) | 84 (22.2%) |
| 10 to 14 Minutes | 127 (16.0%) | 34 (9.0%) |
| 15 to 19 Minutes | 165 (20.7%) | 67 (17.7%) |
| 20 to 24 Minutes | 244 (30.6%) | 44 (11.6%) |
| 25 to 29 Minutes | 12 (1.5%) | 12 (3.2%) |
| 30 to 34 Minutes | 18 (2.3%) | 42 (11.1%) |
| 35 to 39 Minutes | 3 (0.4%) | 0 (0.0%) |
| 40 to 44 Minutes | 0 (0.0%) | 0 (0.0%) |
| 45 to 59 Minutes | 23 (2.9%) | 0 (0.0%) |
| 60 to 89 Minutes | 19 (2.4%) | 22 (5.8%) |
| 90 or more Minutes | 12 (1.5%) | 19 (5.0%) |
Time of Departure to Work by Sex in Sunray
The most frequent times of departure to work in Sunray are 7:00 AM to 7:29 AM (159, 20.0%) for males and 7:30 AM to 7:59 AM (117, 30.9%) for females.
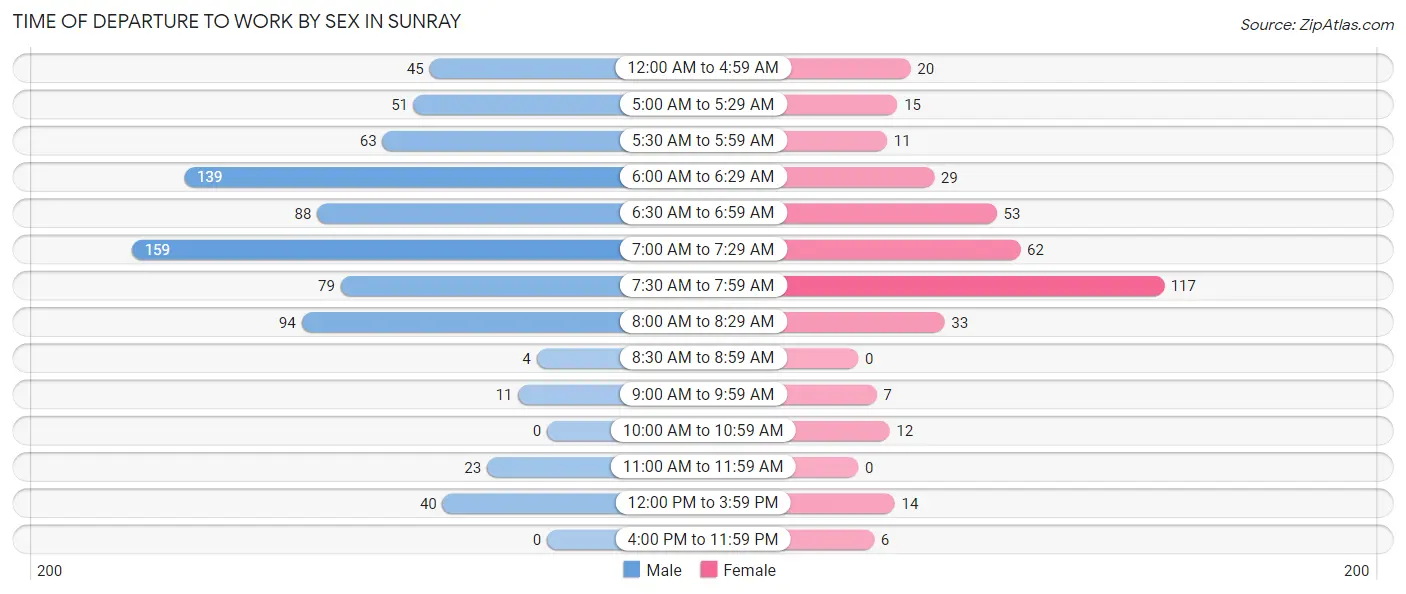
| Time of Departure | Male | Female |
| 12:00 AM to 4:59 AM | 45 (5.7%) | 20 (5.3%) |
| 5:00 AM to 5:29 AM | 51 (6.4%) | 15 (4.0%) |
| 5:30 AM to 5:59 AM | 63 (7.9%) | 11 (2.9%) |
| 6:00 AM to 6:29 AM | 139 (17.5%) | 29 (7.6%) |
| 6:30 AM to 6:59 AM | 88 (11.1%) | 53 (14.0%) |
| 7:00 AM to 7:29 AM | 159 (20.0%) | 62 (16.4%) |
| 7:30 AM to 7:59 AM | 79 (9.9%) | 117 (30.9%) |
| 8:00 AM to 8:29 AM | 94 (11.8%) | 33 (8.7%) |
| 8:30 AM to 8:59 AM | 4 (0.5%) | 0 (0.0%) |
| 9:00 AM to 9:59 AM | 11 (1.4%) | 7 (1.8%) |
| 10:00 AM to 10:59 AM | 0 (0.0%) | 12 (3.2%) |
| 11:00 AM to 11:59 AM | 23 (2.9%) | 0 (0.0%) |
| 12:00 PM to 3:59 PM | 40 (5.0%) | 14 (3.7%) |
| 4:00 PM to 11:59 PM | 0 (0.0%) | 6 (1.6%) |
| Total | 796 (100.0%) | 379 (100.0%) |
Housing Occupancy in Sunray
Occupancy by Ownership in Sunray
Of the total 1,006 dwellings in Sunray, owner-occupied units account for 788 (78.3%), while renter-occupied units make up 218 (21.7%).
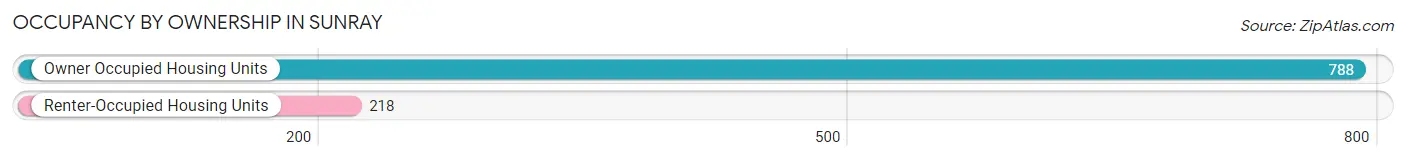
| Occupancy | # Housing Units | % Housing Units |
| Owner Occupied Housing Units | 788 | 78.3% |
| Renter-Occupied Housing Units | 218 | 21.7% |
| Total Occupied Housing Units | 1,006 | 100.0% |
Occupancy by Household Size in Sunray
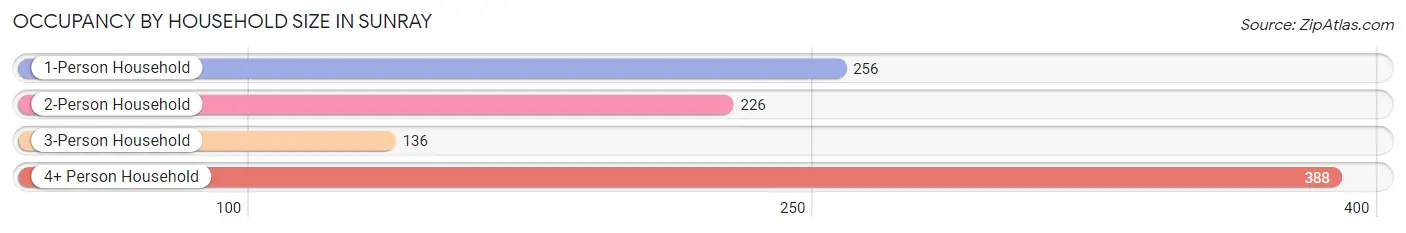
| Household Size | # Housing Units | % Housing Units |
| 1-Person Household | 256 | 25.5% |
| 2-Person Household | 226 | 22.5% |
| 3-Person Household | 136 | 13.5% |
| 4+ Person Household | 388 | 38.6% |
| Total Housing Units | 1,006 | 100.0% |
Occupancy by Ownership by Household Size in Sunray
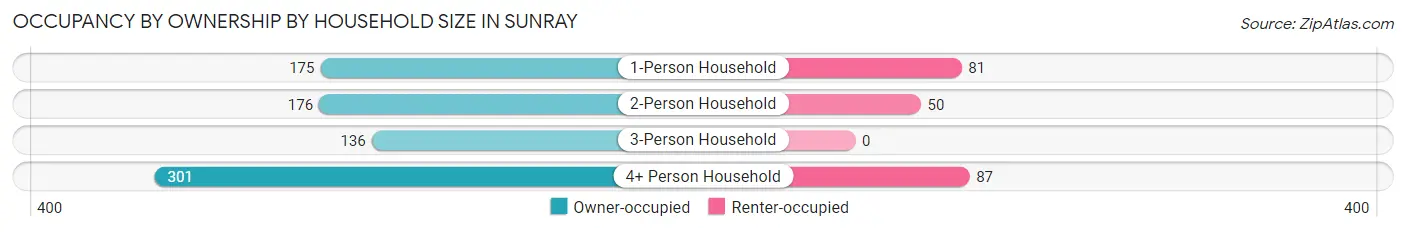
| Household Size | Owner-occupied | Renter-occupied |
| 1-Person Household | 175 (68.4%) | 81 (31.6%) |
| 2-Person Household | 176 (77.9%) | 50 (22.1%) |
| 3-Person Household | 136 (100.0%) | 0 (0.0%) |
| 4+ Person Household | 301 (77.6%) | 87 (22.4%) |
| Total Housing Units | 788 (78.3%) | 218 (21.7%) |
Occupancy by Educational Attainment in Sunray
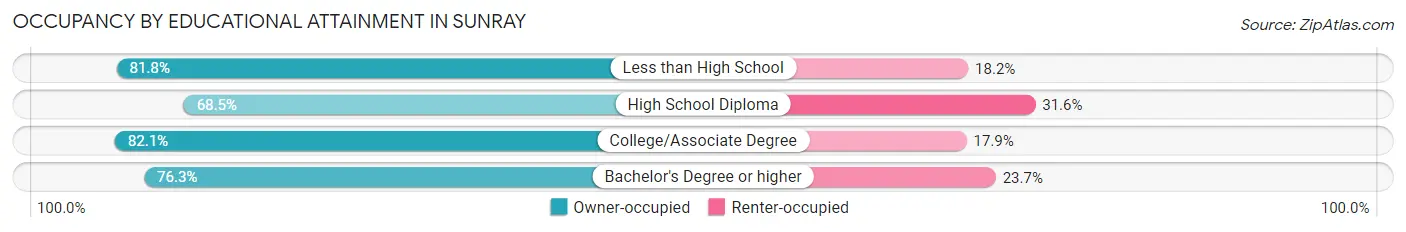
| Household Size | Owner-occupied | Renter-occupied |
| Less than High School | 269 (81.8%) | 60 (18.2%) |
| High School Diploma | 128 (68.4%) | 59 (31.6%) |
| College/Associate Degree | 243 (82.1%) | 53 (17.9%) |
| Bachelor's Degree or higher | 148 (76.3%) | 46 (23.7%) |
Occupancy by Age of Householder in Sunray
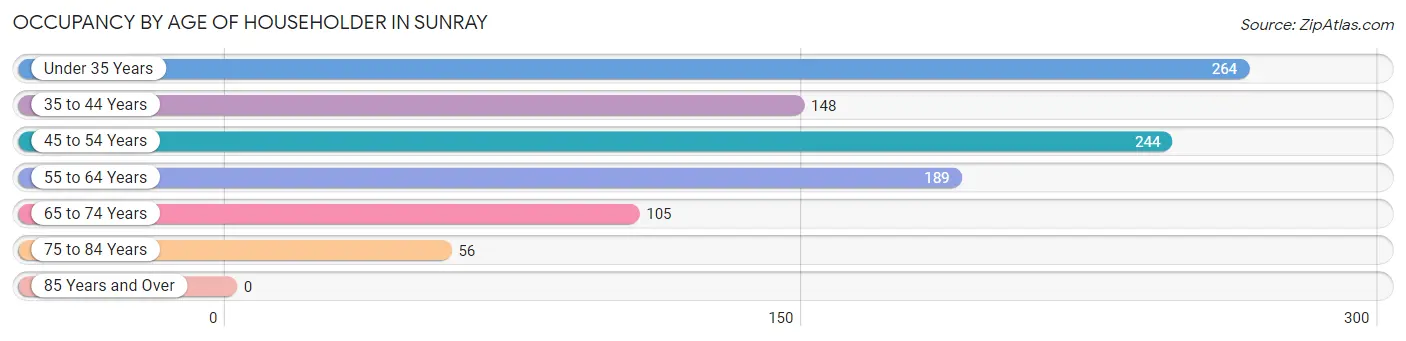
| Age Bracket | # Households | % Households |
| Under 35 Years | 264 | 26.2% |
| 35 to 44 Years | 148 | 14.7% |
| 45 to 54 Years | 244 | 24.2% |
| 55 to 64 Years | 189 | 18.8% |
| 65 to 74 Years | 105 | 10.4% |
| 75 to 84 Years | 56 | 5.6% |
| 85 Years and Over | 0 | 0.0% |
| Total | 1,006 | 100.0% |
Housing Finances in Sunray
Median Income by Occupancy in Sunray
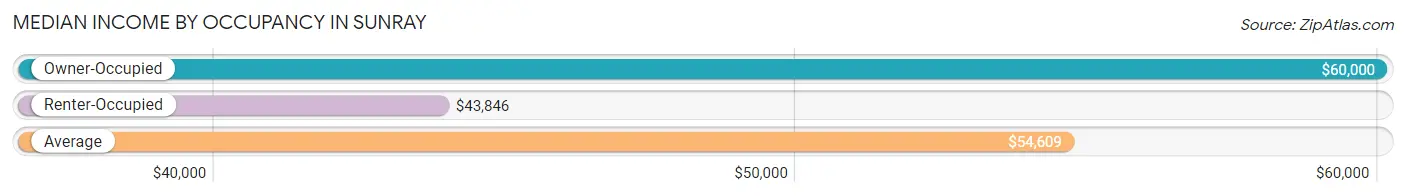
| Occupancy Type | # Households | Median Income |
| Owner-Occupied | 788 (78.3%) | $60,000 |
| Renter-Occupied | 218 (21.7%) | $43,846 |
| Average | 1,006 (100.0%) | $54,609 |
Occupancy by Householder Income Bracket in Sunray
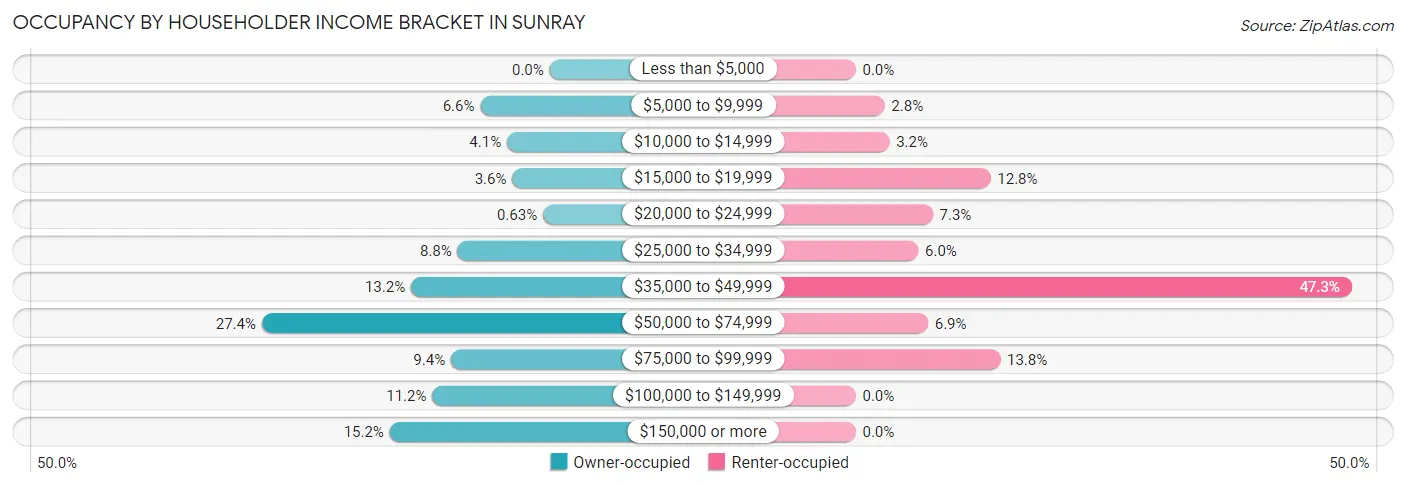
| Income Bracket | Owner-occupied | Renter-occupied |
| Less than $5,000 | 0 (0.0%) | 0 (0.0%) |
| $5,000 to $9,999 | 52 (6.6%) | 6 (2.8%) |
| $10,000 to $14,999 | 32 (4.1%) | 7 (3.2%) |
| $15,000 to $19,999 | 28 (3.5%) | 28 (12.8%) |
| $20,000 to $24,999 | 5 (0.6%) | 16 (7.3%) |
| $25,000 to $34,999 | 69 (8.8%) | 13 (6.0%) |
| $35,000 to $49,999 | 104 (13.2%) | 103 (47.2%) |
| $50,000 to $74,999 | 216 (27.4%) | 15 (6.9%) |
| $75,000 to $99,999 | 74 (9.4%) | 30 (13.8%) |
| $100,000 to $149,999 | 88 (11.2%) | 0 (0.0%) |
| $150,000 or more | 120 (15.2%) | 0 (0.0%) |
| Total | 788 (100.0%) | 218 (100.0%) |
Monthly Housing Cost Tiers in Sunray
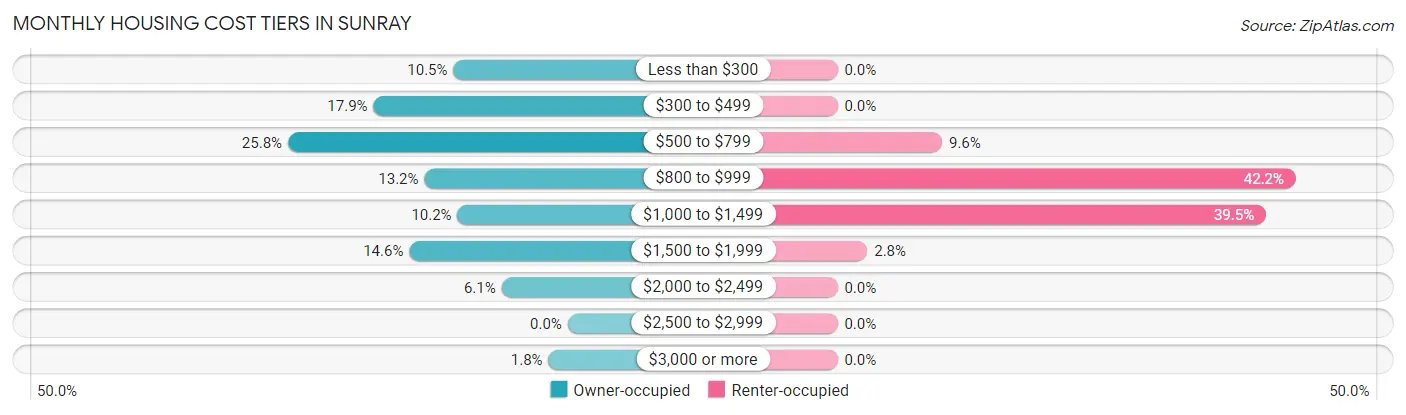
| Monthly Cost | Owner-occupied | Renter-occupied |
| Less than $300 | 83 (10.5%) | 0 (0.0%) |
| $300 to $499 | 141 (17.9%) | 0 (0.0%) |
| $500 to $799 | 203 (25.8%) | 21 (9.6%) |
| $800 to $999 | 104 (13.2%) | 92 (42.2%) |
| $1,000 to $1,499 | 80 (10.2%) | 86 (39.5%) |
| $1,500 to $1,999 | 115 (14.6%) | 6 (2.8%) |
| $2,000 to $2,499 | 48 (6.1%) | 0 (0.0%) |
| $2,500 to $2,999 | 0 (0.0%) | 0 (0.0%) |
| $3,000 or more | 14 (1.8%) | 0 (0.0%) |
| Total | 788 (100.0%) | 218 (100.0%) |
Physical Housing Characteristics in Sunray
Housing Structures in Sunray
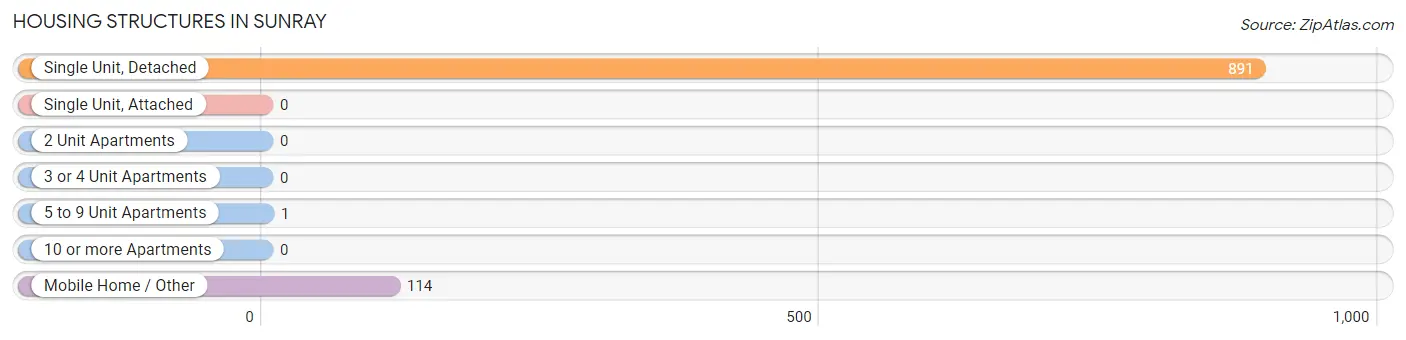
| Structure Type | # Housing Units | % Housing Units |
| Single Unit, Detached | 891 | 88.6% |
| Single Unit, Attached | 0 | 0.0% |
| 2 Unit Apartments | 0 | 0.0% |
| 3 or 4 Unit Apartments | 0 | 0.0% |
| 5 to 9 Unit Apartments | 1 | 0.1% |
| 10 or more Apartments | 0 | 0.0% |
| Mobile Home / Other | 114 | 11.3% |
| Total | 1,006 | 100.0% |
Housing Structures by Occupancy in Sunray
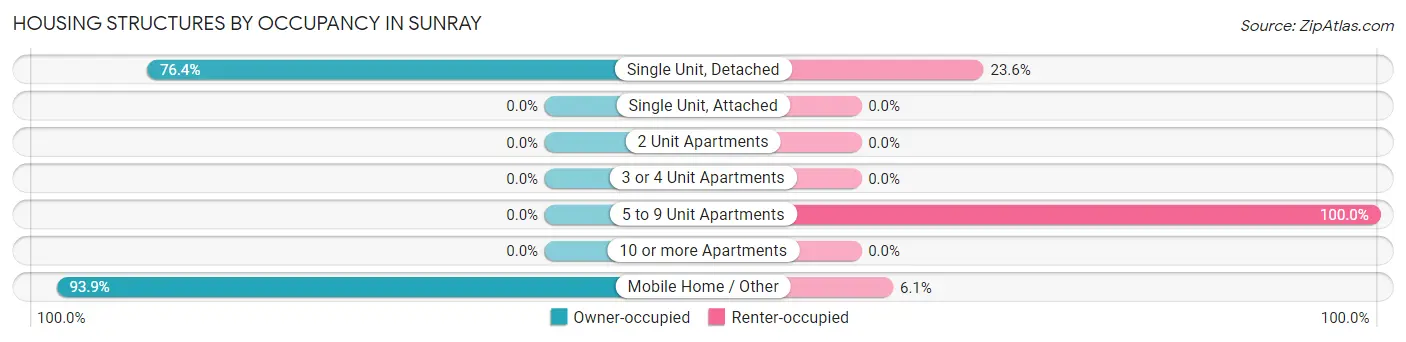
| Structure Type | Owner-occupied | Renter-occupied |
| Single Unit, Detached | 681 (76.4%) | 210 (23.6%) |
| Single Unit, Attached | 0 (0.0%) | 0 (0.0%) |
| 2 Unit Apartments | 0 (0.0%) | 0 (0.0%) |
| 3 or 4 Unit Apartments | 0 (0.0%) | 0 (0.0%) |
| 5 to 9 Unit Apartments | 0 (0.0%) | 1 (100.0%) |
| 10 or more Apartments | 0 (0.0%) | 0 (0.0%) |
| Mobile Home / Other | 107 (93.9%) | 7 (6.1%) |
| Total | 788 (78.3%) | 218 (21.7%) |
Housing Structures by Number of Rooms in Sunray
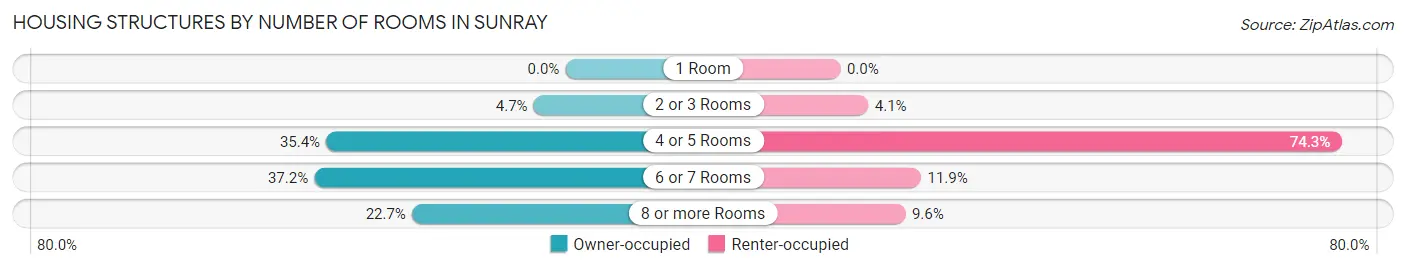
| Number of Rooms | Owner-occupied | Renter-occupied |
| 1 Room | 0 (0.0%) | 0 (0.0%) |
| 2 or 3 Rooms | 37 (4.7%) | 9 (4.1%) |
| 4 or 5 Rooms | 279 (35.4%) | 162 (74.3%) |
| 6 or 7 Rooms | 293 (37.2%) | 26 (11.9%) |
| 8 or more Rooms | 179 (22.7%) | 21 (9.6%) |
| Total | 788 (100.0%) | 218 (100.0%) |
Housing Structure by Heating Type in Sunray
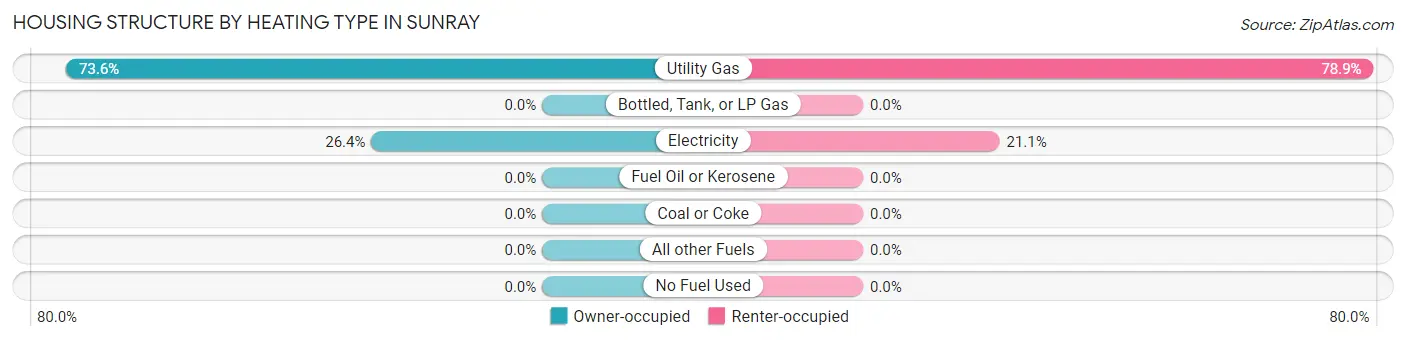
| Heating Type | Owner-occupied | Renter-occupied |
| Utility Gas | 580 (73.6%) | 172 (78.9%) |
| Bottled, Tank, or LP Gas | 0 (0.0%) | 0 (0.0%) |
| Electricity | 208 (26.4%) | 46 (21.1%) |
| Fuel Oil or Kerosene | 0 (0.0%) | 0 (0.0%) |
| Coal or Coke | 0 (0.0%) | 0 (0.0%) |
| All other Fuels | 0 (0.0%) | 0 (0.0%) |
| No Fuel Used | 0 (0.0%) | 0 (0.0%) |
| Total | 788 (100.0%) | 218 (100.0%) |
Household Vehicle Usage in Sunray
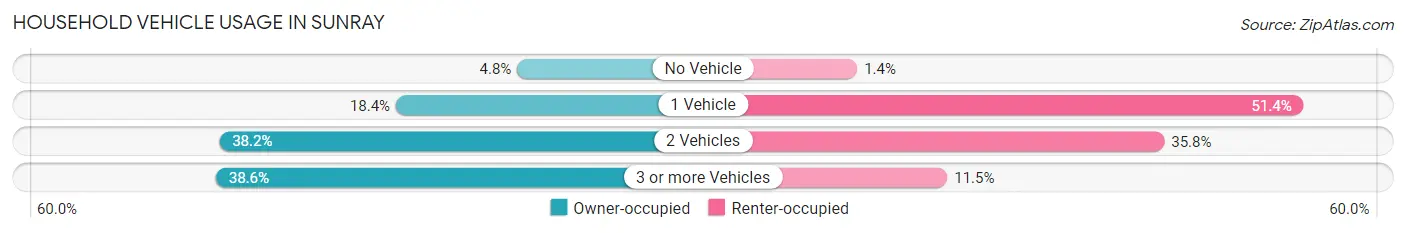
| Vehicles per Household | Owner-occupied | Renter-occupied |
| No Vehicle | 38 (4.8%) | 3 (1.4%) |
| 1 Vehicle | 145 (18.4%) | 112 (51.4%) |
| 2 Vehicles | 301 (38.2%) | 78 (35.8%) |
| 3 or more Vehicles | 304 (38.6%) | 25 (11.5%) |
| Total | 788 (100.0%) | 218 (100.0%) |
Real Estate & Mortgages in Sunray
Real Estate and Mortgage Overview in Sunray
| Characteristic | Without Mortgage | With Mortgage |
| Housing Units | 484 | 304 |
| Median Property Value | $91,900 | $152,800 |
| Median Household Income | $56,667 | $58 |
| Monthly Housing Costs | $521 | $14 |
| Real Estate Taxes | $1,355 | $34 |
Property Value by Mortgage Status in Sunray
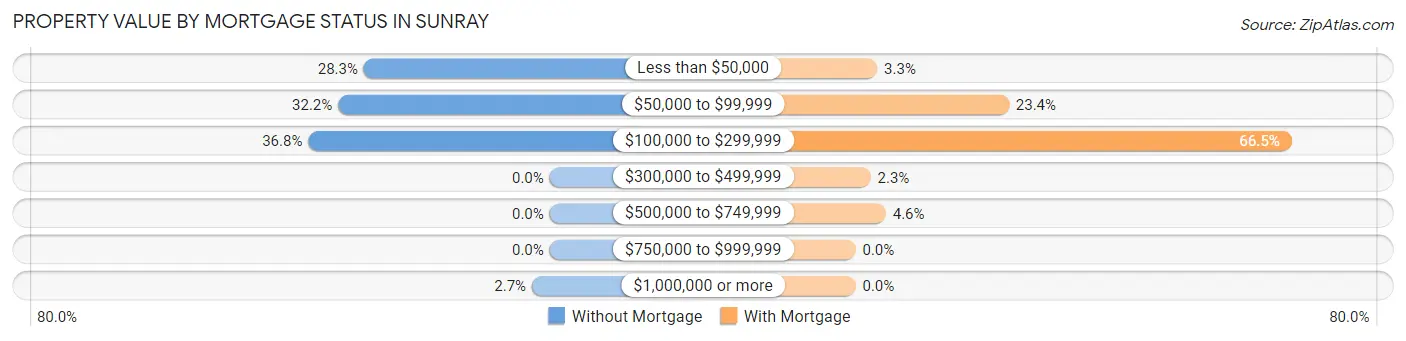
| Property Value | Without Mortgage | With Mortgage |
| Less than $50,000 | 137 (28.3%) | 10 (3.3%) |
| $50,000 to $99,999 | 156 (32.2%) | 71 (23.4%) |
| $100,000 to $299,999 | 178 (36.8%) | 202 (66.4%) |
| $300,000 to $499,999 | 0 (0.0%) | 7 (2.3%) |
| $500,000 to $749,999 | 0 (0.0%) | 14 (4.6%) |
| $750,000 to $999,999 | 0 (0.0%) | 0 (0.0%) |
| $1,000,000 or more | 13 (2.7%) | 0 (0.0%) |
| Total | 484 (100.0%) | 304 (100.0%) |
Household Income by Mortgage Status in Sunray
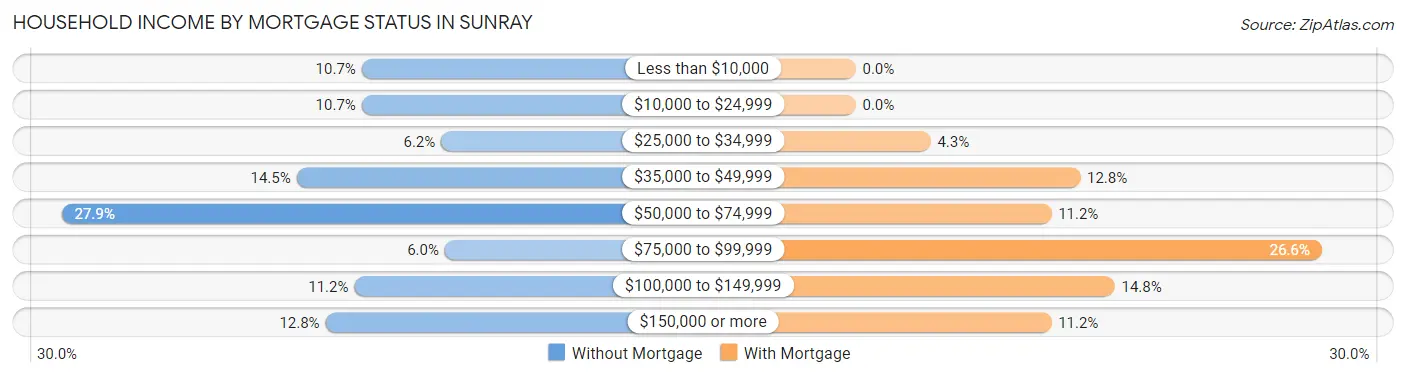
| Household Income | Without Mortgage | With Mortgage |
| Less than $10,000 | 52 (10.7%) | 0 (0.0%) |
| $10,000 to $24,999 | 52 (10.7%) | 0 (0.0%) |
| $25,000 to $34,999 | 30 (6.2%) | 13 (4.3%) |
| $35,000 to $49,999 | 70 (14.5%) | 39 (12.8%) |
| $50,000 to $74,999 | 135 (27.9%) | 34 (11.2%) |
| $75,000 to $99,999 | 29 (6.0%) | 81 (26.6%) |
| $100,000 to $149,999 | 54 (11.2%) | 45 (14.8%) |
| $150,000 or more | 62 (12.8%) | 34 (11.2%) |
| Total | 484 (100.0%) | 304 (100.0%) |
Property Value to Household Income Ratio in Sunray
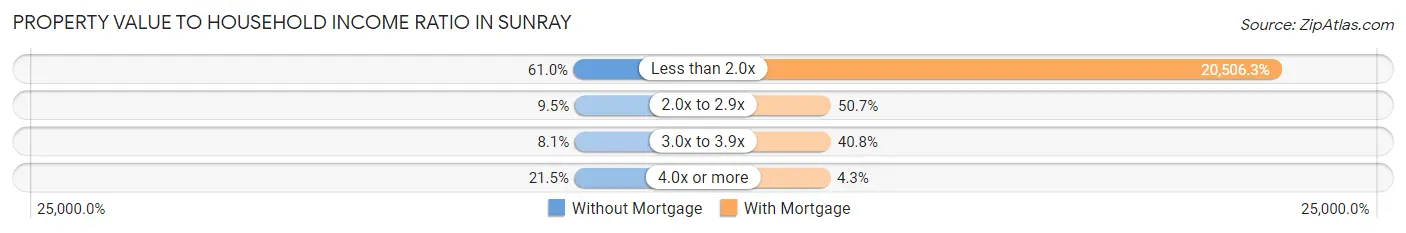
| Value-to-Income Ratio | Without Mortgage | With Mortgage |
| Less than 2.0x | 295 (61.0%) | 62,339 (20,506.2%) |
| 2.0x to 2.9x | 46 (9.5%) | 154 (50.7%) |
| 3.0x to 3.9x | 39 (8.1%) | 124 (40.8%) |
| 4.0x or more | 104 (21.5%) | 13 (4.3%) |
| Total | 484 (100.0%) | 304 (100.0%) |
Real Estate Taxes by Mortgage Status in Sunray
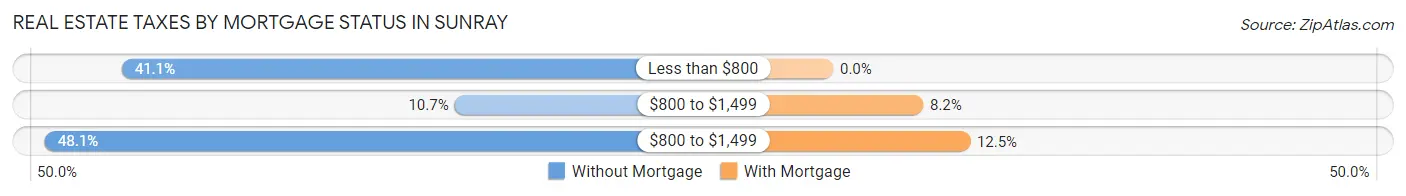
| Property Taxes | Without Mortgage | With Mortgage |
| Less than $800 | 199 (41.1%) | 0 (0.0%) |
| $800 to $1,499 | 52 (10.7%) | 25 (8.2%) |
| $800 to $1,499 | 233 (48.1%) | 38 (12.5%) |
| Total | 484 (100.0%) | 304 (100.0%) |
Health & Disability in Sunray
Health Insurance Coverage by Age in Sunray
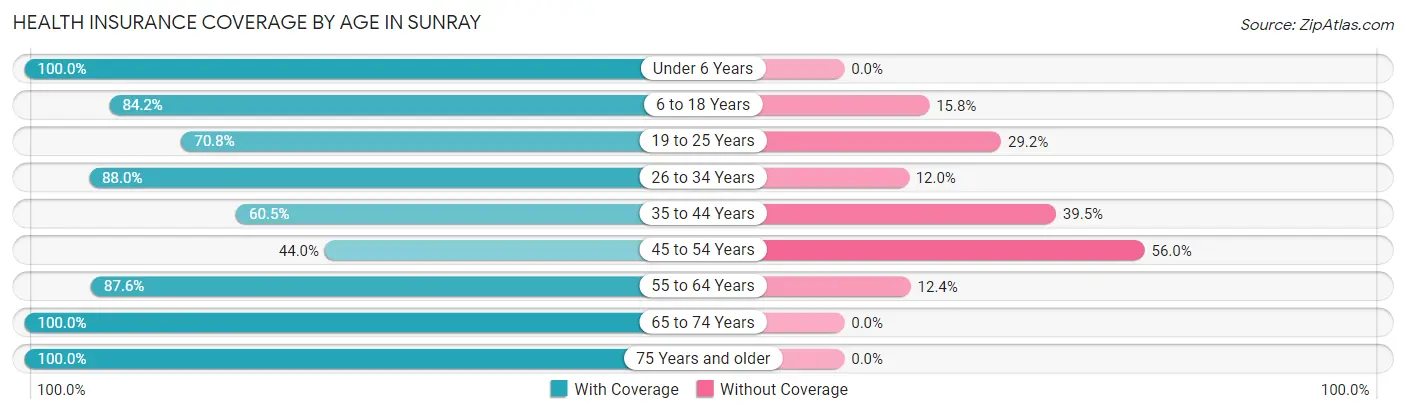
| Age Bracket | With Coverage | Without Coverage |
| Under 6 Years | 266 (100.0%) | 0 (0.0%) |
| 6 to 18 Years | 489 (84.2%) | 92 (15.8%) |
| 19 to 25 Years | 138 (70.8%) | 57 (29.2%) |
| 26 to 34 Years | 293 (88.0%) | 40 (12.0%) |
| 35 to 44 Years | 224 (60.5%) | 146 (39.5%) |
| 45 to 54 Years | 202 (44.0%) | 257 (56.0%) |
| 55 to 64 Years | 255 (87.6%) | 36 (12.4%) |
| 65 to 74 Years | 136 (100.0%) | 0 (0.0%) |
| 75 Years and older | 86 (100.0%) | 0 (0.0%) |
| Total | 2,089 (76.9%) | 628 (23.1%) |
Health Insurance Coverage by Citizenship Status in Sunray
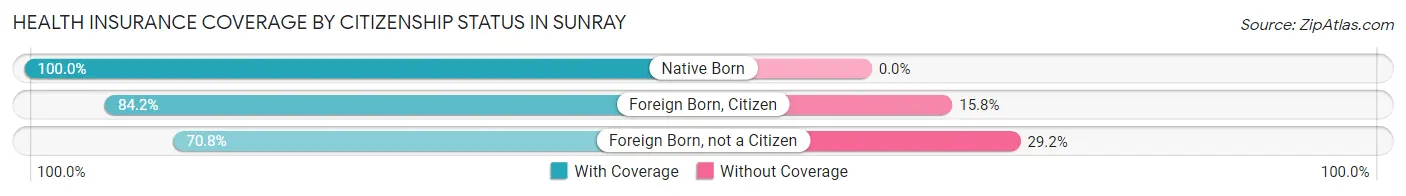
| Citizenship Status | With Coverage | Without Coverage |
| Native Born | 266 (100.0%) | 0 (0.0%) |
| Foreign Born, Citizen | 489 (84.2%) | 92 (15.8%) |
| Foreign Born, not a Citizen | 138 (70.8%) | 57 (29.2%) |
Health Insurance Coverage by Household Income in Sunray
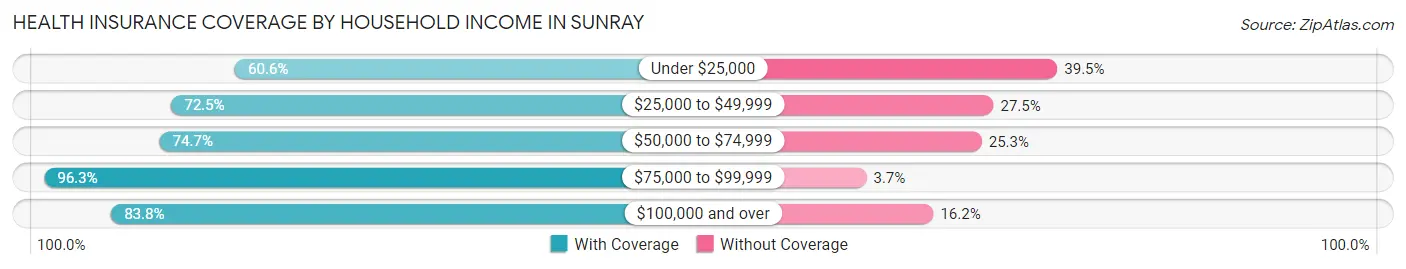
| Household Income | With Coverage | Without Coverage |
| Under $25,000 | 198 (60.6%) | 129 (39.5%) |
| $25,000 to $49,999 | 575 (72.5%) | 218 (27.5%) |
| $50,000 to $74,999 | 514 (74.7%) | 174 (25.3%) |
| $75,000 to $99,999 | 312 (96.3%) | 12 (3.7%) |
| $100,000 and over | 490 (83.8%) | 95 (16.2%) |
Public vs Private Health Insurance Coverage by Age in Sunray
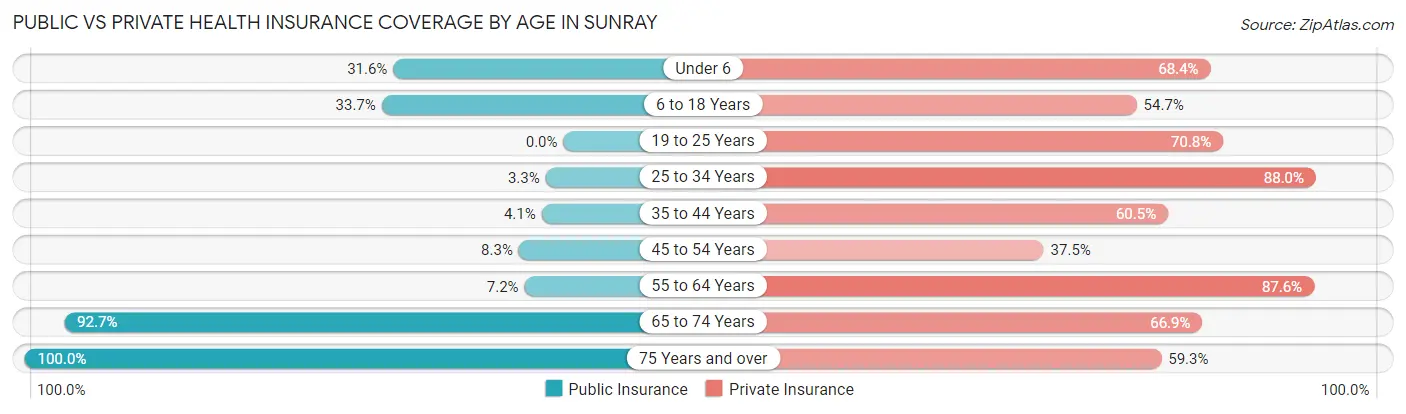
| Age Bracket | Public Insurance | Private Insurance |
| Under 6 | 84 (31.6%) | 182 (68.4%) |
| 6 to 18 Years | 196 (33.7%) | 318 (54.7%) |
| 19 to 25 Years | 0 (0.0%) | 138 (70.8%) |
| 25 to 34 Years | 11 (3.3%) | 293 (88.0%) |
| 35 to 44 Years | 15 (4.1%) | 224 (60.5%) |
| 45 to 54 Years | 38 (8.3%) | 172 (37.5%) |
| 55 to 64 Years | 21 (7.2%) | 255 (87.6%) |
| 65 to 74 Years | 126 (92.6%) | 91 (66.9%) |
| 75 Years and over | 86 (100.0%) | 51 (59.3%) |
| Total | 577 (21.2%) | 1,724 (63.4%) |
Disability Status by Sex by Age in Sunray
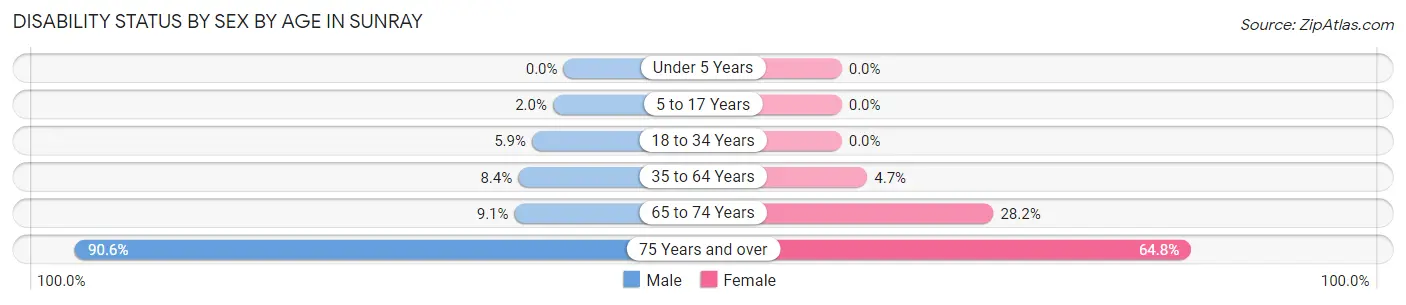
| Age Bracket | Male | Female |
| Under 5 Years | 0 (0.0%) | 0 (0.0%) |
| 5 to 17 Years | 5 (2.0%) | 0 (0.0%) |
| 18 to 34 Years | 19 (5.9%) | 0 (0.0%) |
| 35 to 64 Years | 48 (8.4%) | 26 (4.7%) |
| 65 to 74 Years | 3 (9.1%) | 29 (28.2%) |
| 75 Years and over | 29 (90.6%) | 35 (64.8%) |
Disability Class by Sex by Age in Sunray
Disability Class: Hearing Difficulty
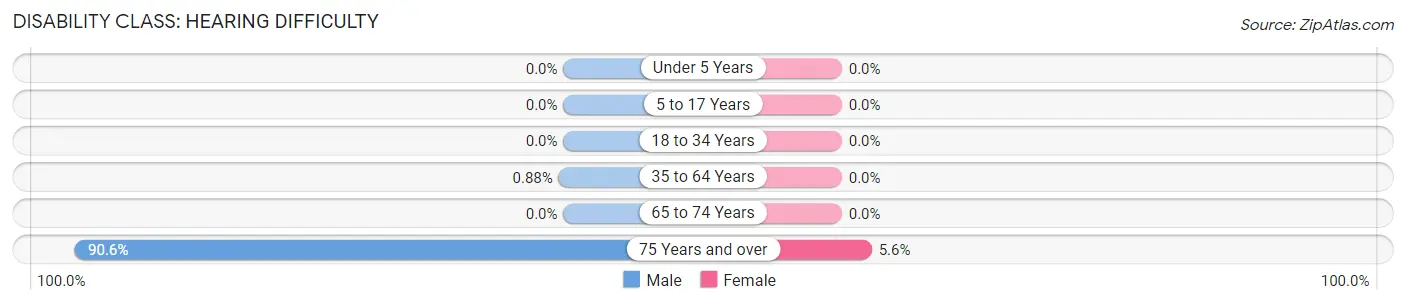
| Age Bracket | Male | Female |
| Under 5 Years | 0 (0.0%) | 0 (0.0%) |
| 5 to 17 Years | 0 (0.0%) | 0 (0.0%) |
| 18 to 34 Years | 0 (0.0%) | 0 (0.0%) |
| 35 to 64 Years | 5 (0.9%) | 0 (0.0%) |
| 65 to 74 Years | 0 (0.0%) | 0 (0.0%) |
| 75 Years and over | 29 (90.6%) | 3 (5.6%) |
Disability Class: Vision Difficulty
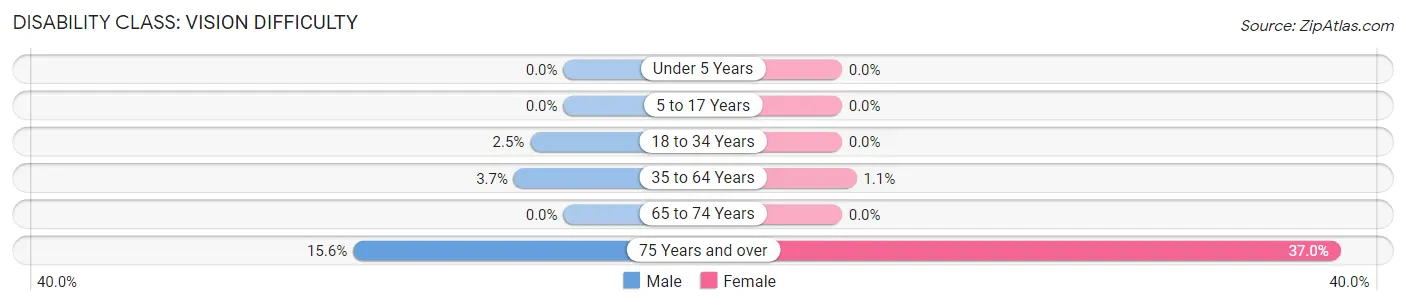
| Age Bracket | Male | Female |
| Under 5 Years | 0 (0.0%) | 0 (0.0%) |
| 5 to 17 Years | 0 (0.0%) | 0 (0.0%) |
| 18 to 34 Years | 8 (2.5%) | 0 (0.0%) |
| 35 to 64 Years | 21 (3.7%) | 6 (1.1%) |
| 65 to 74 Years | 0 (0.0%) | 0 (0.0%) |
| 75 Years and over | 5 (15.6%) | 20 (37.0%) |
Disability Class: Cognitive Difficulty
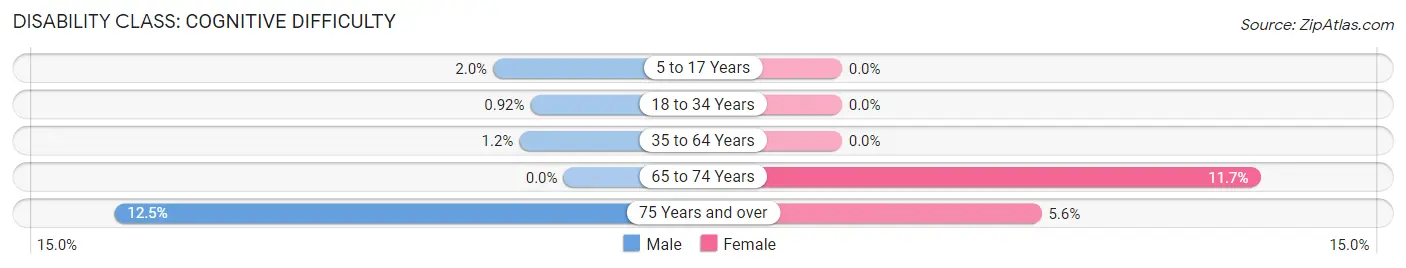
| Age Bracket | Male | Female |
| 5 to 17 Years | 5 (2.0%) | 0 (0.0%) |
| 18 to 34 Years | 3 (0.9%) | 0 (0.0%) |
| 35 to 64 Years | 7 (1.2%) | 0 (0.0%) |
| 65 to 74 Years | 0 (0.0%) | 12 (11.7%) |
| 75 Years and over | 4 (12.5%) | 3 (5.6%) |
Disability Class: Ambulatory Difficulty
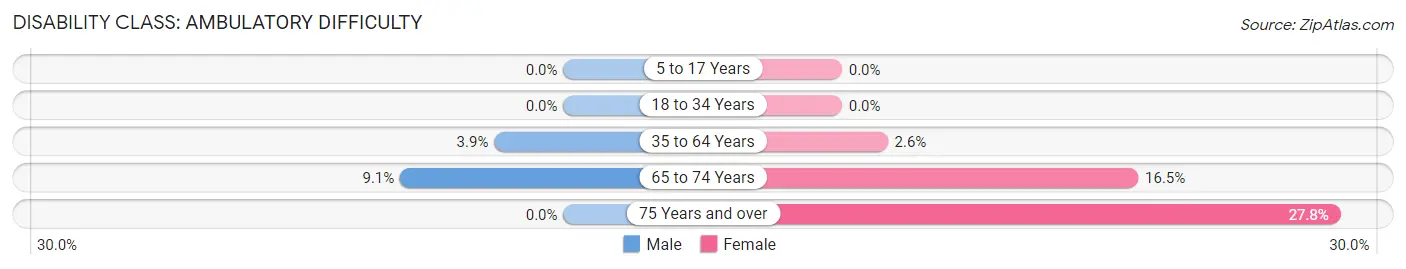
| Age Bracket | Male | Female |
| 5 to 17 Years | 0 (0.0%) | 0 (0.0%) |
| 18 to 34 Years | 0 (0.0%) | 0 (0.0%) |
| 35 to 64 Years | 22 (3.8%) | 14 (2.5%) |
| 65 to 74 Years | 3 (9.1%) | 17 (16.5%) |
| 75 Years and over | 0 (0.0%) | 15 (27.8%) |
Disability Class: Self-Care Difficulty
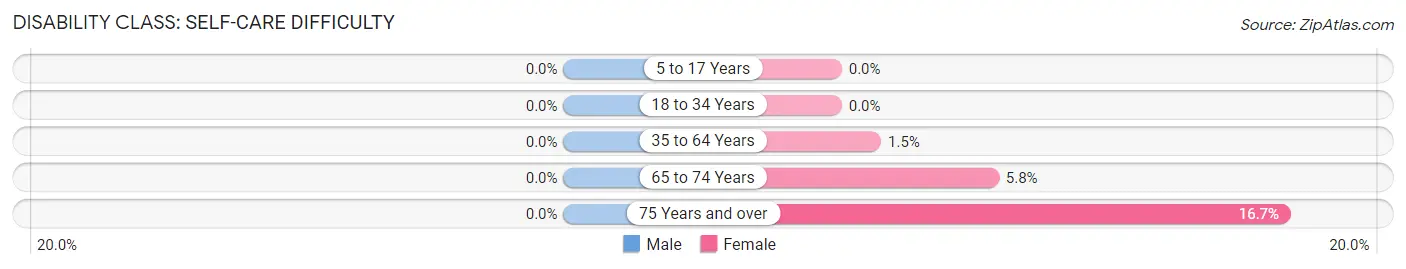
| Age Bracket | Male | Female |
| 5 to 17 Years | 0 (0.0%) | 0 (0.0%) |
| 18 to 34 Years | 0 (0.0%) | 0 (0.0%) |
| 35 to 64 Years | 0 (0.0%) | 8 (1.5%) |
| 65 to 74 Years | 0 (0.0%) | 6 (5.8%) |
| 75 Years and over | 0 (0.0%) | 9 (16.7%) |
Technology Access in Sunray
Computing Device Access in Sunray
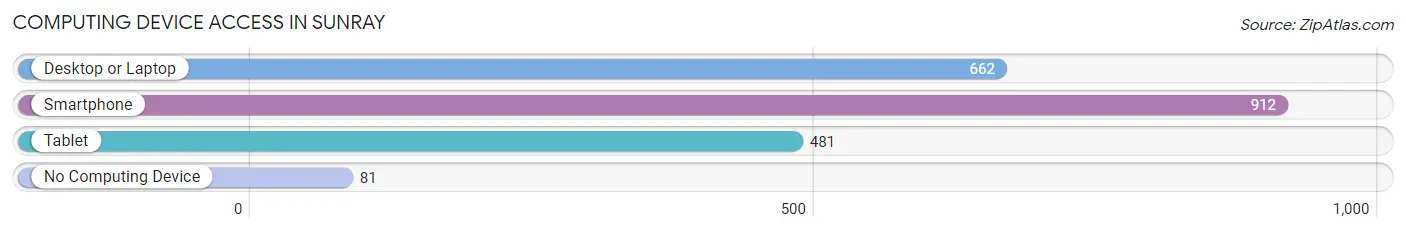
| Device Type | # Households | % Households |
| Desktop or Laptop | 662 | 65.8% |
| Smartphone | 912 | 90.7% |
| Tablet | 481 | 47.8% |
| No Computing Device | 81 | 8.1% |
| Total | 1,006 | 100.0% |
Internet Access in Sunray
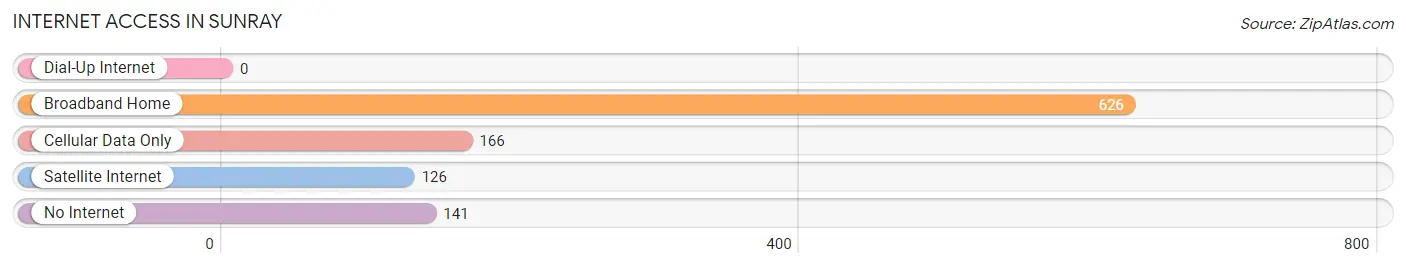
| Internet Type | # Households | % Households |
| Dial-Up Internet | 0 | 0.0% |
| Broadband Home | 626 | 62.2% |
| Cellular Data Only | 166 | 16.5% |
| Satellite Internet | 126 | 12.5% |
| No Internet | 141 | 14.0% |
| Total | 1,006 | 100.0% |
Sunray Summary
Sunray, Texas is a small town located in the northern part of the state, in Moore County. It is situated about 25 miles northeast of Amarillo and is part of the Amarillo Metropolitan Statistical Area. The town was founded in 1909 and has a population of 1,845 as of the 2010 census.
Geography
Sunray is located at 35°30'25" North, 101°45'45" West (35.506944, -101.762500). It is situated in the northern part of the Texas Panhandle, in Moore County. The town is located on the western edge of the Llano Estacado, a large plateau that covers much of the western part of the state. The elevation of Sunray is 3,541 feet (1,079 m).
The town is located in a semi-arid climate, with hot summers and cold winters. The average annual temperature is 63°F (17°C), and the average annual precipitation is 17.5 inches (444 mm).
Economy
Sunray's economy is largely based on agriculture and oil and gas production. The town is home to several large agricultural operations, including a large cattle ranch and a large cotton farm. The town is also home to several oil and gas production companies, including Sunray Oil and Gas, which is the largest employer in the town.
The town also has a small retail sector, with several small stores and restaurants. The town is also home to a small manufacturing sector, with several small factories producing a variety of products.
Demographics
As of the 2010 census, Sunray had a population of 1,845. The racial makeup of the town was 94.3% White, 0.3% African American, 0.3% Native American, 0.2% Asian, 0.1% Pacific Islander, 3.3% from other races, and 1.4% from two or more races. Hispanic or Latino of any race were 8.2% of the population.
The median income for a household in Sunray was $37,917, and the median income for a family was $45,625. The per capita income for the town was $17,917. About 11.2% of families and 14.2% of the population were below the poverty line, including 18.2% of those under age 18 and 8.3% of those age 65 or over.
Sunray is served by the Sunray Independent School District, which consists of three schools: Sunray Elementary School, Sunray Middle School, and Sunray High School. The town is also home to a branch of Amarillo College.
Sunray is served by the Sunray Volunteer Fire Department, which provides fire protection and emergency medical services to the town. The town is also served by the Moore County Sheriff's Office, which provides law enforcement services to the town.
Common Questions
What is Per Capita Income in Sunray?
Per Capita income in Sunray is $28,907.
What is the Median Family Income in Sunray?
Median Family Income in Sunray is $57,857.
What is the Median Household income in Sunray?
Median Household Income in Sunray is $54,609.
What is Income or Wage Gap in Sunray?
Income or Wage Gap in Sunray is 28.0%.
Women in Sunray earn 72.0 cents for every dollar earned by a man.
What is Family Income Deficit in Sunray?
Family Income Deficit in Sunray is $11,343.
Families that are below poverty line in Sunray earn $11,343 less on average than the poverty threshold level.
What is Inequality or Gini Index in Sunray?
Inequality or Gini Index in Sunray is 0.46.
What is the Total Population of Sunray?
Total Population of Sunray is 2,717.
What is the Total Male Population of Sunray?
Total Male Population of Sunray is 1,322.
What is the Total Female Population of Sunray?
Total Female Population of Sunray is 1,395.
What is the Ratio of Males per 100 Females in Sunray?
There are 94.77 Males per 100 Females in Sunray.
What is the Ratio of Females per 100 Males in Sunray?
There are 105.52 Females per 100 Males in Sunray.
What is the Median Population Age in Sunray?
Median Population Age in Sunray is 34.7 Years.
What is the Average Family Size in Sunray
Average Family Size in Sunray is 3.2 People.
What is the Average Household Size in Sunray
Average Household Size in Sunray is 2.7 People.
How Large is the Labor Force in Sunray?
There are 1,293 People in the Labor Forcein in Sunray.
What is the Percentage of People in the Labor Force in Sunray?
64.7% of People are in the Labor Force in Sunray.
What is the Unemployment Rate in Sunray?
Unemployment Rate in Sunray is 3.9%.