Stratford, TX Map & Demographics
Stratford Map
Stratford Overview
$32,573
PER CAPITA INCOME
$54,712
AVG FAMILY INCOME
$51,036
AVG HOUSEHOLD INCOME
38.5%
WAGE / INCOME GAP [ % ]
61.5¢/ $1
WAGE / INCOME GAP [ $ ]
0.47
INEQUALITY / GINI INDEX
1,251
TOTAL POPULATION
549
MALE POPULATION
702
FEMALE POPULATION
78.21
MALES / 100 FEMALES
127.87
FEMALES / 100 MALES
38.4
MEDIAN AGE
3.0
AVG FAMILY SIZE
2.5
AVG HOUSEHOLD SIZE
630
LABOR FORCE [ PEOPLE ]
64.3%
PERCENT IN LABOR FORCE
2.5%
UNEMPLOYMENT RATE
Stratford Zip Codes
Stratford Area Codes
Income in Stratford
Income Overview in Stratford
Per Capita Income in Stratford is $32,573, while median incomes of families and households are $54,712 and $51,036 respectively.
| Characteristic | Number | Measure |
| Per Capita Income | 1,251 | $32,573 |
| Median Family Income | 365 | $54,712 |
| Mean Family Income | 365 | $92,788 |
| Median Household Income | 481 | $51,036 |
| Mean Household Income | 481 | $81,928 |
| Income Deficit | 365 | $0 |
| Wage / Income Gap (%) | 1,251 | 38.47% |
| Wage / Income Gap ($) | 1,251 | 61.53¢ per $1 |
| Gini / Inequality Index | 1,251 | 0.47 |
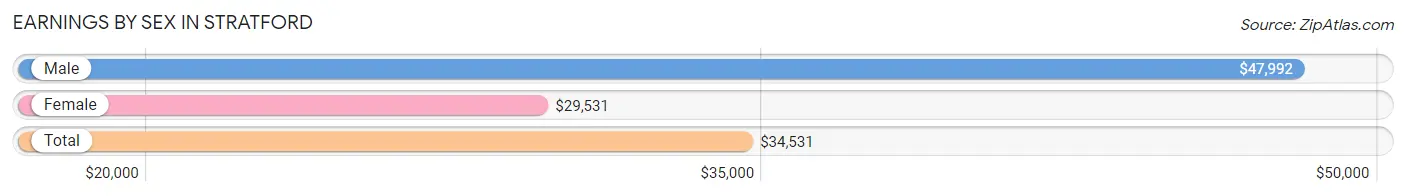
Earnings by Sex in Stratford
Average Earnings in Stratford are $34,531, $47,992 for men and $29,531 for women, a difference of 38.5%.
| Sex | Number | Average Earnings |
| Male | 341 (54.1%) | $47,992 |
| Female | 289 (45.9%) | $29,531 |
| Total | 630 (100.0%) | $34,531 |
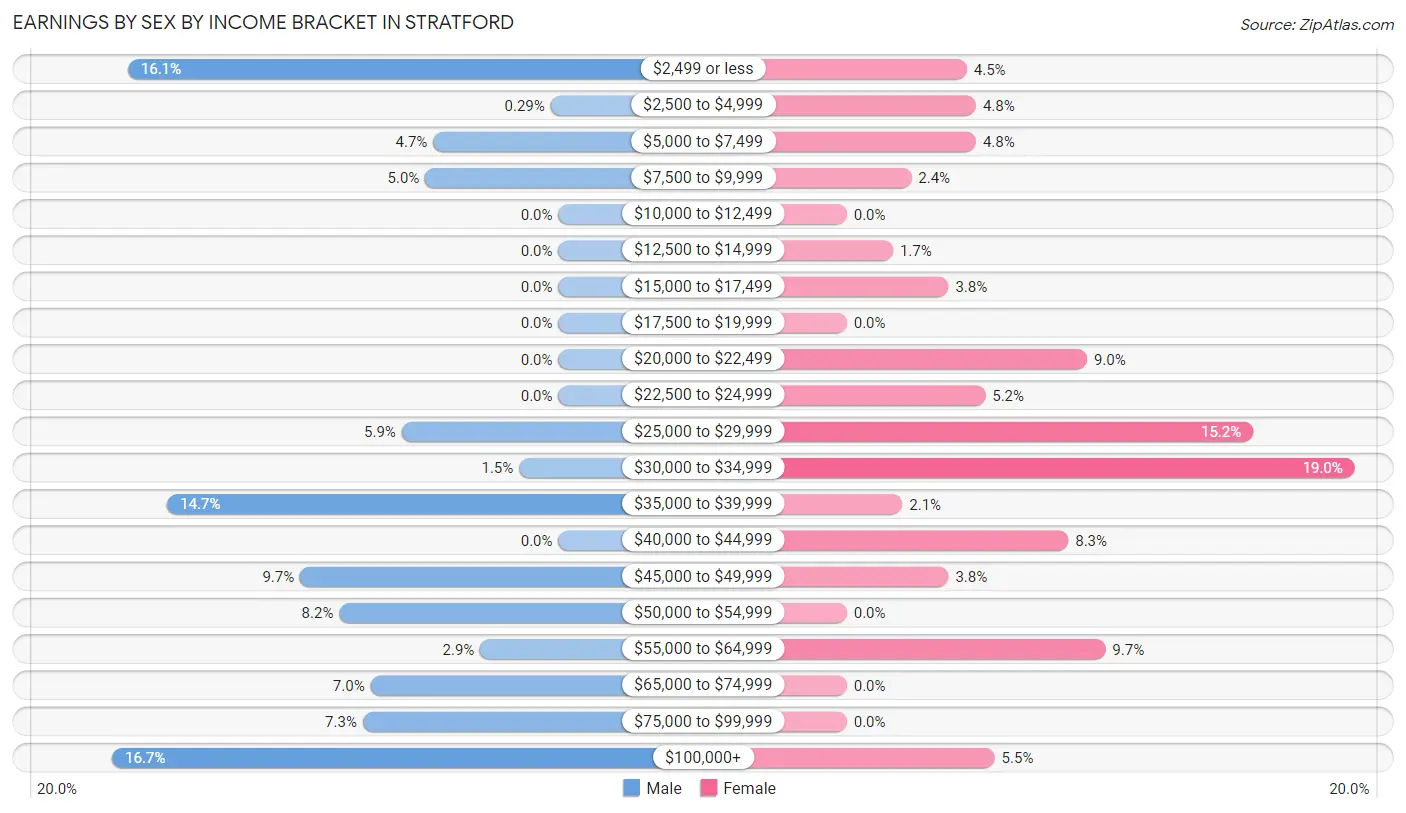
Earnings by Sex by Income Bracket in Stratford
The most common earnings brackets in Stratford are $100,000+ for men (57 | 16.7%) and $30,000 to $34,999 for women (55 | 19.0%).
| Income | Male | Female |
| $2,499 or less | 55 (16.1%) | 13 (4.5%) |
| $2,500 to $4,999 | 1 (0.3%) | 14 (4.8%) |
| $5,000 to $7,499 | 16 (4.7%) | 14 (4.8%) |
| $7,500 to $9,999 | 17 (5.0%) | 7 (2.4%) |
| $10,000 to $12,499 | 0 (0.0%) | 0 (0.0%) |
| $12,500 to $14,999 | 0 (0.0%) | 5 (1.7%) |
| $15,000 to $17,499 | 0 (0.0%) | 11 (3.8%) |
| $17,500 to $19,999 | 0 (0.0%) | 0 (0.0%) |
| $20,000 to $22,499 | 0 (0.0%) | 26 (9.0%) |
| $22,500 to $24,999 | 0 (0.0%) | 15 (5.2%) |
| $25,000 to $29,999 | 20 (5.9%) | 44 (15.2%) |
| $30,000 to $34,999 | 5 (1.5%) | 55 (19.0%) |
| $35,000 to $39,999 | 50 (14.7%) | 6 (2.1%) |
| $40,000 to $44,999 | 0 (0.0%) | 24 (8.3%) |
| $45,000 to $49,999 | 33 (9.7%) | 11 (3.8%) |
| $50,000 to $54,999 | 28 (8.2%) | 0 (0.0%) |
| $55,000 to $64,999 | 10 (2.9%) | 28 (9.7%) |
| $65,000 to $74,999 | 24 (7.0%) | 0 (0.0%) |
| $75,000 to $99,999 | 25 (7.3%) | 0 (0.0%) |
| $100,000+ | 57 (16.7%) | 16 (5.5%) |
| Total | 341 (100.0%) | 289 (100.0%) |
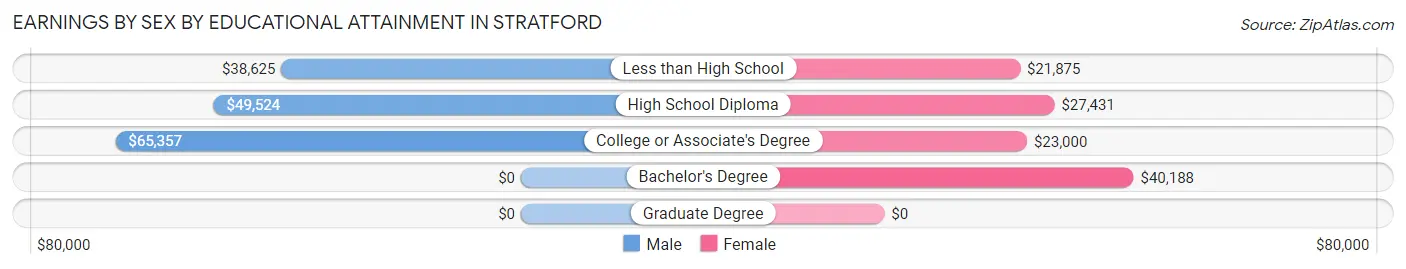
Earnings by Sex by Educational Attainment in Stratford
Average earnings in Stratford are $49,394 for men and $28,958 for women, a difference of 41.4%. Men with an educational attainment of college or associate's degree enjoy the highest average annual earnings of $65,357, while those with less than high school education earn the least with $38,625. Women with an educational attainment of bachelor's degree earn the most with the average annual earnings of $40,188, while those with less than high school education have the smallest earnings of $21,875.
| Educational Attainment | Male Income | Female Income |
| Less than High School | $38,625 | $21,875 |
| High School Diploma | $49,524 | $27,431 |
| College or Associate's Degree | $65,357 | $23,000 |
| Bachelor's Degree | - | - |
| Graduate Degree | - | - |
| Total | $49,394 | $28,958 |
Family Income in Stratford
Family Income Brackets in Stratford
According to the Stratford family income data, there are 76 families falling into the $50,000 to $74,999 income range, which is the most common income bracket and makes up 20.8% of all families.
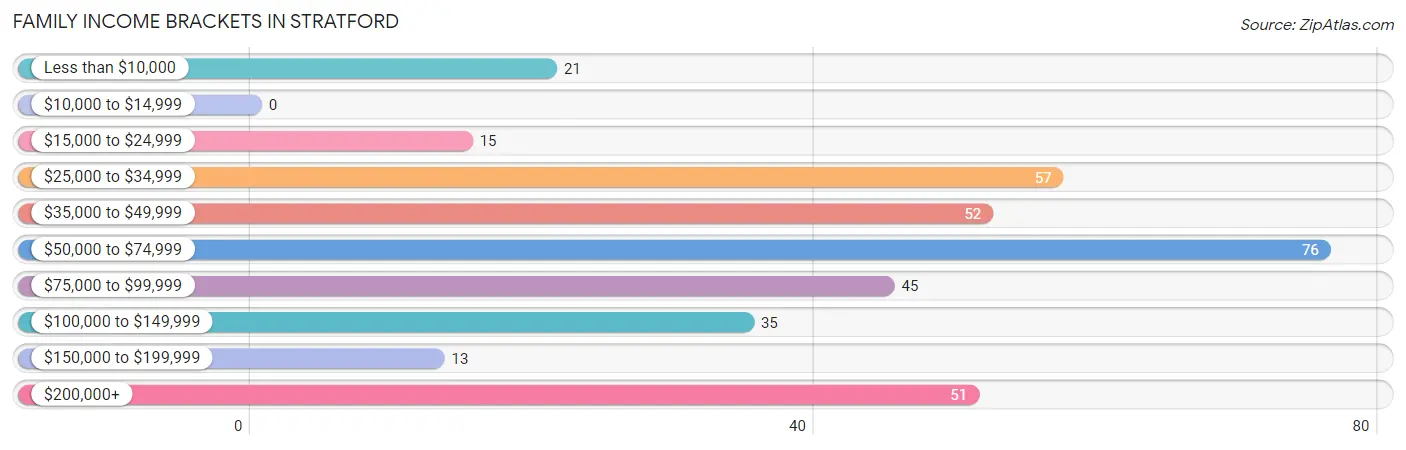
| Income Bracket | # Families | % Families |
| Less than $10,000 | 21 | 5.8% |
| $10,000 to $14,999 | 0 | 0.0% |
| $15,000 to $24,999 | 15 | 4.1% |
| $25,000 to $34,999 | 57 | 15.6% |
| $35,000 to $49,999 | 52 | 14.2% |
| $50,000 to $74,999 | 76 | 20.8% |
| $75,000 to $99,999 | 45 | 12.3% |
| $100,000 to $149,999 | 35 | 9.6% |
| $150,000 to $199,999 | 13 | 3.6% |
| $200,000+ | 51 | 14.0% |
Family Income by Famaliy Size in Stratford
4-person families (87 | 23.8%) account for the highest median family income in Stratford with $75,750 per family, while 2-person families (162 | 44.4%) have the highest median income of $25,288 per family member.
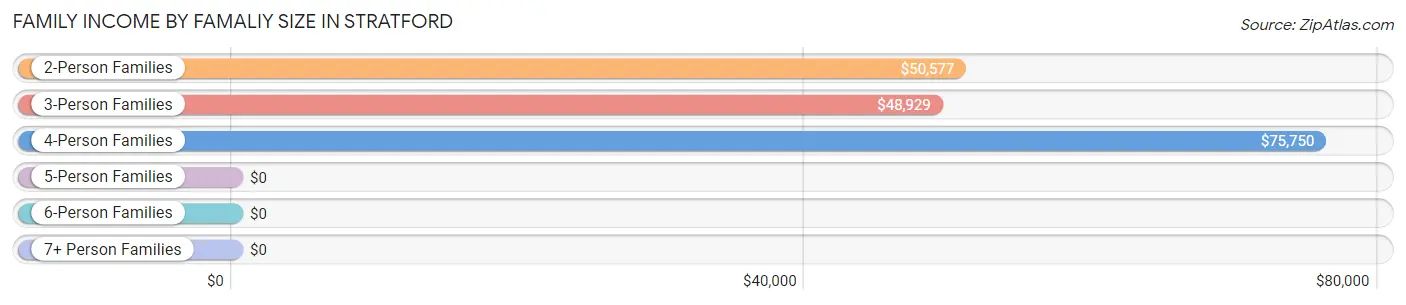
| Income Bracket | # Families | Median Income |
| 2-Person Families | 162 (44.4%) | $50,577 |
| 3-Person Families | 98 (26.9%) | $48,929 |
| 4-Person Families | 87 (23.8%) | $75,750 |
| 5-Person Families | 18 (4.9%) | $0 |
| 6-Person Families | 0 (0.0%) | $0 |
| 7+ Person Families | 0 (0.0%) | $0 |
| Total | 365 (100.0%) | $54,712 |
Family Income by Number of Earners in Stratford
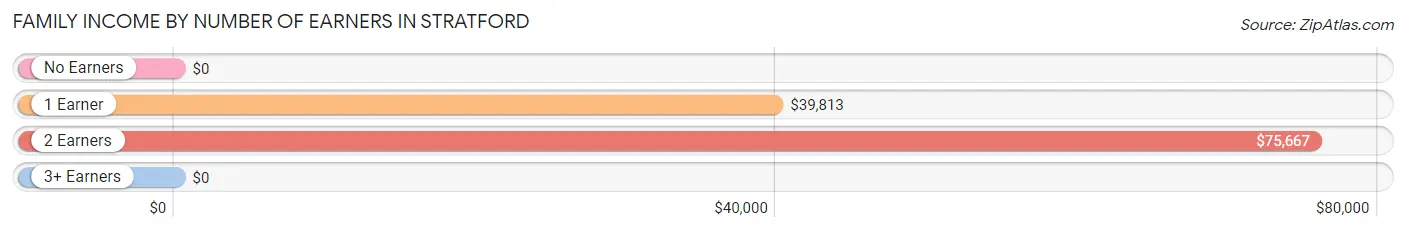
| Number of Earners | # Families | Median Income |
| No Earners | 50 (13.7%) | $0 |
| 1 Earner | 119 (32.6%) | $39,813 |
| 2 Earners | 174 (47.7%) | $75,667 |
| 3+ Earners | 22 (6.0%) | $0 |
| Total | 365 (100.0%) | $54,712 |
Household Income in Stratford
Household Income Brackets in Stratford
With 92 households falling in the category, the $50,000 to $74,999 income range is the most frequent in Stratford, accounting for 19.1% of all households. In contrast, only 9 households (1.9%) fall into the $10,000 to $14,999 income bracket, making it the least populous group.
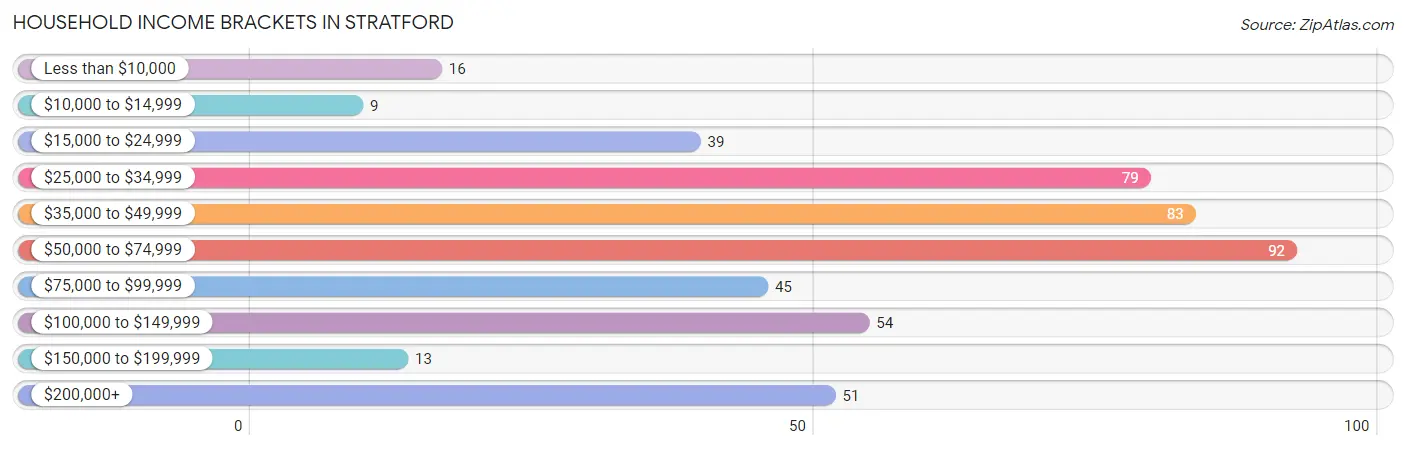
| Income Bracket | # Households | % Households |
| Less than $10,000 | 16 | 3.3% |
| $10,000 to $14,999 | 9 | 1.9% |
| $15,000 to $24,999 | 39 | 8.1% |
| $25,000 to $34,999 | 79 | 16.4% |
| $35,000 to $49,999 | 83 | 17.3% |
| $50,000 to $74,999 | 92 | 19.1% |
| $75,000 to $99,999 | 45 | 9.4% |
| $100,000 to $149,999 | 54 | 11.2% |
| $150,000 to $199,999 | 13 | 2.7% |
| $200,000+ | 51 | 10.6% |
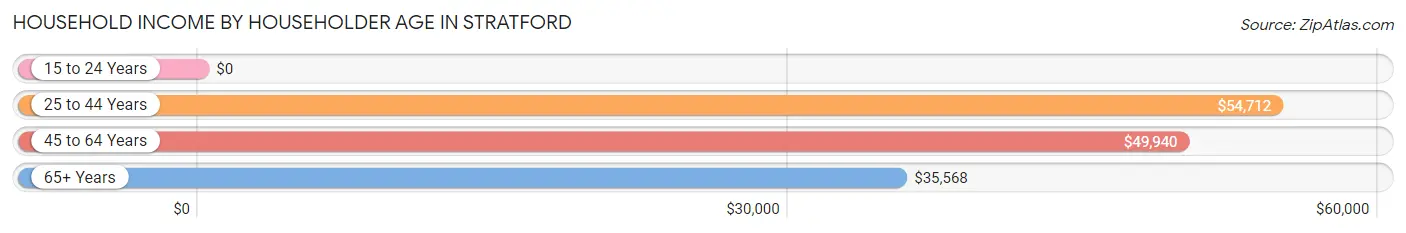
Household Income by Householder Age in Stratford
The median household income in Stratford is $51,036, with the highest median household income of $54,712 found in the 25 to 44 years age bracket for the primary householder. A total of 167 households (34.7%) fall into this category.
| Income Bracket | # Households | Median Income |
| 15 to 24 Years | 0 (0.0%) | $0 |
| 25 to 44 Years | 167 (34.7%) | $54,712 |
| 45 to 64 Years | 169 (35.1%) | $49,940 |
| 65+ Years | 145 (30.1%) | $35,568 |
| Total | 481 (100.0%) | $51,036 |
Poverty in Stratford
Income Below Poverty by Sex and Age in Stratford
With 11.7% poverty level for males and 11.9% for females among the residents of Stratford, 25 to 34 year old males and 6 to 11 year old females are the most vulnerable to poverty, with 17 males (31.5%) and 10 females (38.5%) in their respective age groups living below the poverty level.
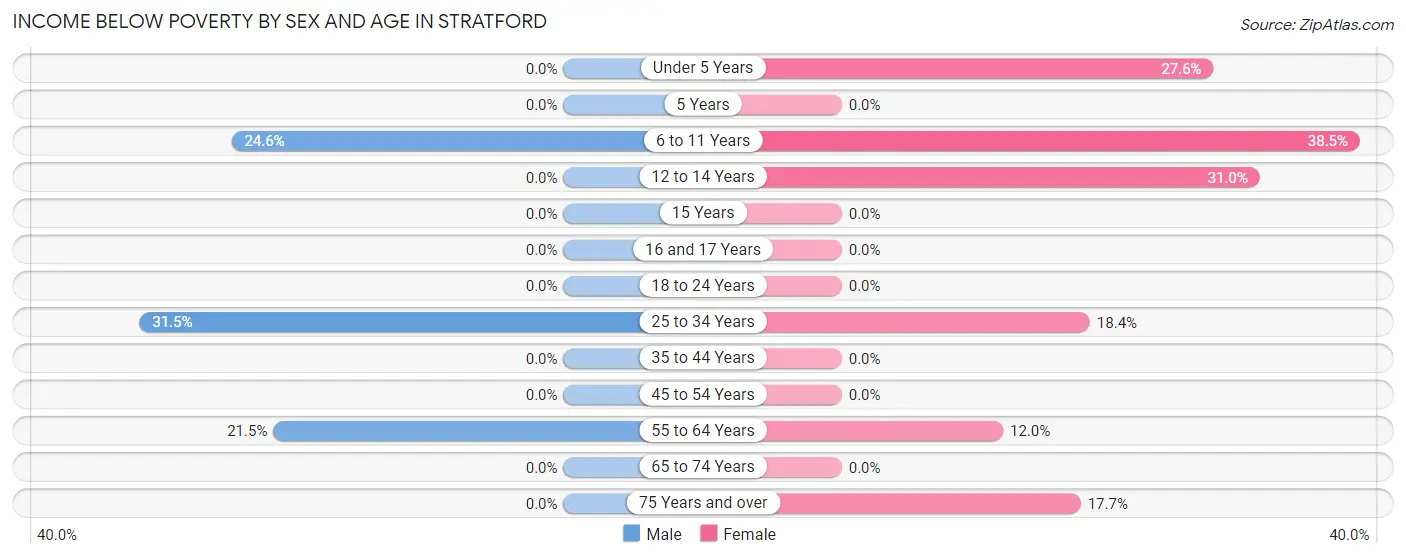
| Age Bracket | Male | Female |
| Under 5 Years | 0 (0.0%) | 24 (27.6%) |
| 5 Years | 0 (0.0%) | 0 (0.0%) |
| 6 to 11 Years | 17 (24.6%) | 10 (38.5%) |
| 12 to 14 Years | 0 (0.0%) | 9 (31.0%) |
| 15 Years | 0 (0.0%) | 0 (0.0%) |
| 16 and 17 Years | 0 (0.0%) | 0 (0.0%) |
| 18 to 24 Years | 0 (0.0%) | 0 (0.0%) |
| 25 to 34 Years | 17 (31.5%) | 14 (18.4%) |
| 35 to 44 Years | 0 (0.0%) | 0 (0.0%) |
| 45 to 54 Years | 0 (0.0%) | 0 (0.0%) |
| 55 to 64 Years | 28 (21.5%) | 14 (12.0%) |
| 65 to 74 Years | 0 (0.0%) | 0 (0.0%) |
| 75 Years and over | 0 (0.0%) | 11 (17.7%) |
| Total | 62 (11.7%) | 82 (11.9%) |
Income Above Poverty by Sex and Age in Stratford
According to the poverty statistics in Stratford, males aged 12 to 14 years and females aged 5 years are the age groups that are most secure financially, with 100.0% of males and 100.0% of females in these age groups living above the poverty line.
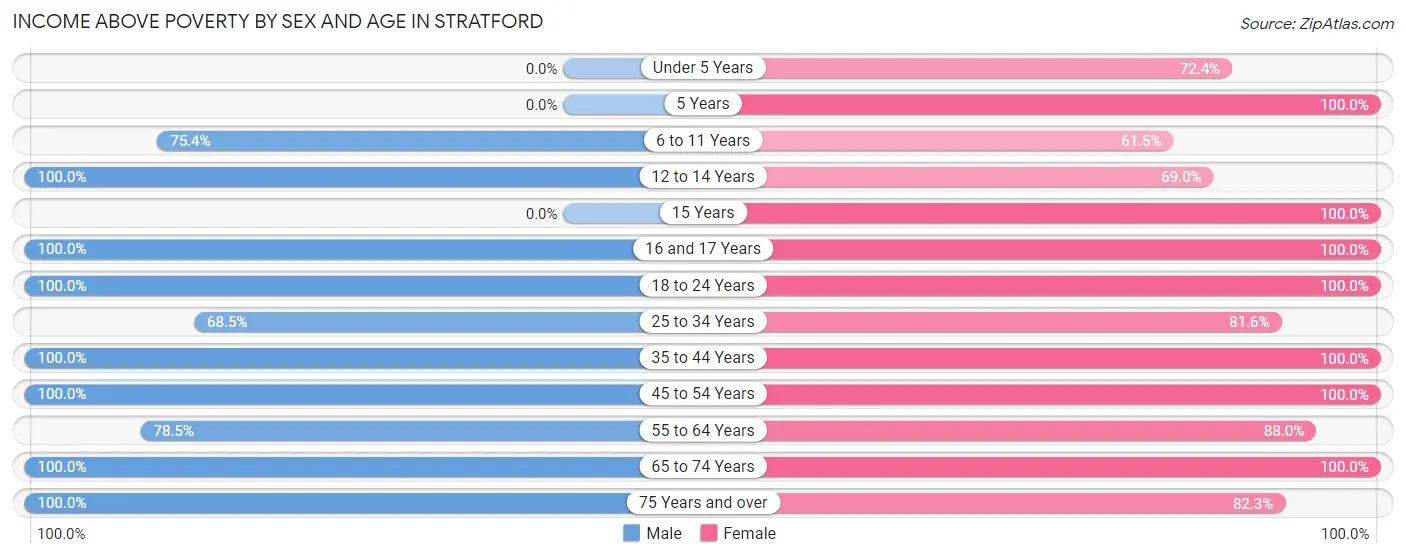
| Age Bracket | Male | Female |
| Under 5 Years | 0 (0.0%) | 63 (72.4%) |
| 5 Years | 0 (0.0%) | 13 (100.0%) |
| 6 to 11 Years | 52 (75.4%) | 16 (61.5%) |
| 12 to 14 Years | 17 (100.0%) | 20 (69.0%) |
| 15 Years | 0 (0.0%) | 30 (100.0%) |
| 16 and 17 Years | 9 (100.0%) | 27 (100.0%) |
| 18 to 24 Years | 49 (100.0%) | 52 (100.0%) |
| 25 to 34 Years | 37 (68.5%) | 62 (81.6%) |
| 35 to 44 Years | 66 (100.0%) | 74 (100.0%) |
| 45 to 54 Years | 50 (100.0%) | 12 (100.0%) |
| 55 to 64 Years | 102 (78.5%) | 103 (88.0%) |
| 65 to 74 Years | 39 (100.0%) | 82 (100.0%) |
| 75 Years and over | 47 (100.0%) | 51 (82.3%) |
| Total | 468 (88.3%) | 605 (88.1%) |
Income Below Poverty Among Married-Couple Families in Stratford
The poverty statistics for married-couple families in Stratford show that 5.0% or 14 of the total 282 families live below the poverty line. Families with no children have the highest poverty rate of 9.1%, comprising of 14 families. On the other hand, families with 1 or 2 children have the lowest poverty rate of 0.0%, which includes 0 families.
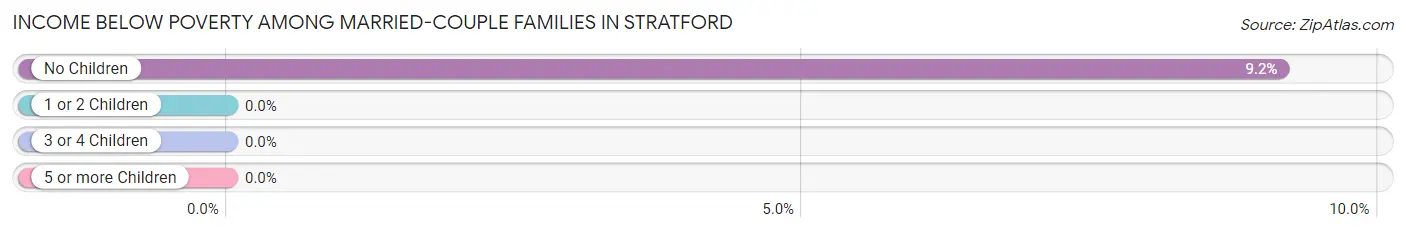
| Children | Above Poverty | Below Poverty |
| No Children | 139 (90.8%) | 14 (9.1%) |
| 1 or 2 Children | 129 (100.0%) | 0 (0.0%) |
| 3 or 4 Children | 0 (0.0%) | 0 (0.0%) |
| 5 or more Children | 0 (0.0%) | 0 (0.0%) |
| Total | 268 (95.0%) | 14 (5.0%) |
Income Below Poverty Among Single-Parent Households in Stratford
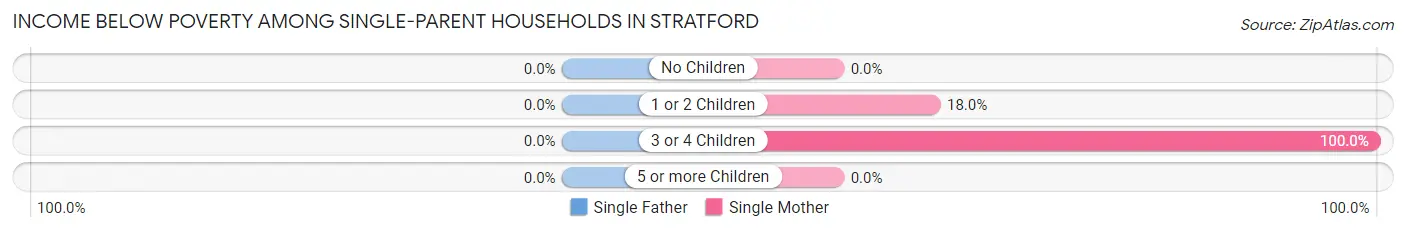
| Children | Single Father | Single Mother |
| No Children | 0 (0.0%) | 0 (0.0%) |
| 1 or 2 Children | 0 (0.0%) | 7 (17.9%) |
| 3 or 4 Children | 0 (0.0%) | 7 (100.0%) |
| 5 or more Children | 0 (0.0%) | 0 (0.0%) |
| Total | 0 (0.0%) | 14 (22.6%) |
Income Below Poverty Among Married-Couple vs Single-Parent Households in Stratford
The poverty data for Stratford shows that 14 of the married-couple family households (5.0%) and 14 of the single-parent households (16.9%) are living below the poverty level. Within the married-couple family households, those with no children have the highest poverty rate, with 14 households (9.1%) falling below the poverty line. Among the single-parent households, those with 3 or 4 children have the highest poverty rate, with 7 household (100.0%) living below poverty.
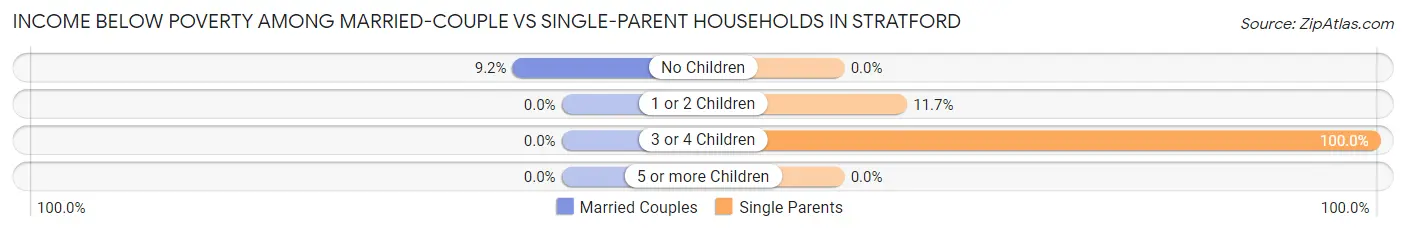
| Children | Married-Couple Families | Single-Parent Households |
| No Children | 14 (9.1%) | 0 (0.0%) |
| 1 or 2 Children | 0 (0.0%) | 7 (11.7%) |
| 3 or 4 Children | 0 (0.0%) | 7 (100.0%) |
| 5 or more Children | 0 (0.0%) | 0 (0.0%) |
| Total | 14 (5.0%) | 14 (16.9%) |
Race in Stratford
The most populous races in Stratford are White / Caucasian (888 | 71.0%), Hispanic or Latino (537 | 42.9%), and Some other Race (183 | 14.6%).
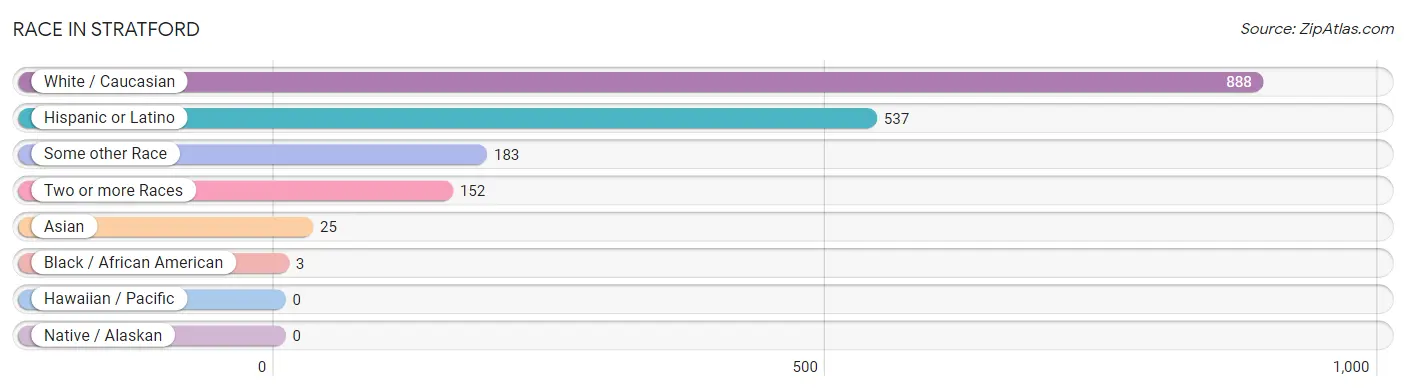
| Race | # Population | % Population |
| Asian | 25 | 2.0% |
| Black / African American | 3 | 0.2% |
| Hawaiian / Pacific | 0 | 0.0% |
| Hispanic or Latino | 537 | 42.9% |
| Native / Alaskan | 0 | 0.0% |
| White / Caucasian | 888 | 71.0% |
| Two or more Races | 152 | 12.1% |
| Some other Race | 183 | 14.6% |
| Total | 1,251 | 100.0% |
Ancestry in Stratford
The most populous ancestries reported in Stratford are Mexican (461 | 36.8%), German (158 | 12.6%), Irish (106 | 8.5%), English (91 | 7.3%), and American (88 | 7.0%), together accounting for 72.3% of all Stratford residents.
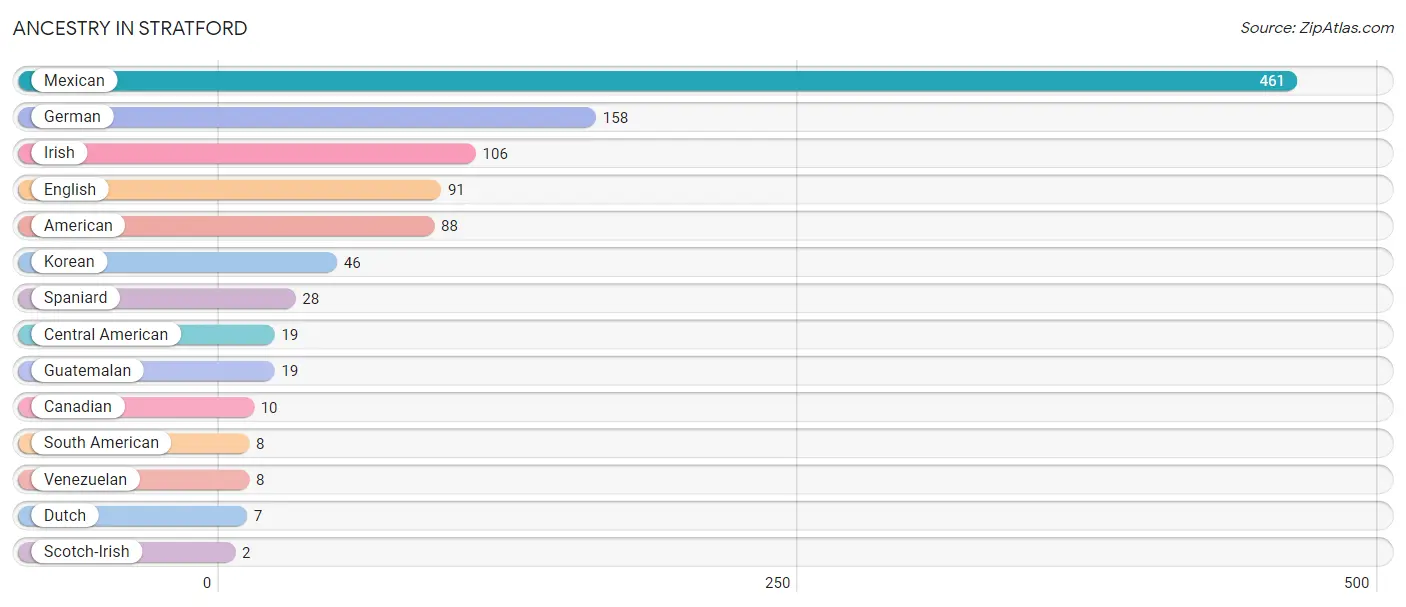
| Ancestry | # Population | % Population |
| American | 88 | 7.0% |
| Canadian | 10 | 0.8% |
| Central American | 19 | 1.5% |
| Dutch | 7 | 0.6% |
| English | 91 | 7.3% |
| German | 158 | 12.6% |
| Guatemalan | 19 | 1.5% |
| Irish | 106 | 8.5% |
| Korean | 46 | 3.7% |
| Mexican | 461 | 36.8% |
| Scotch-Irish | 2 | 0.2% |
| South American | 8 | 0.6% |
| Spaniard | 28 | 2.2% |
| Venezuelan | 8 | 0.6% | View All 14 Rows |
Immigrants in Stratford
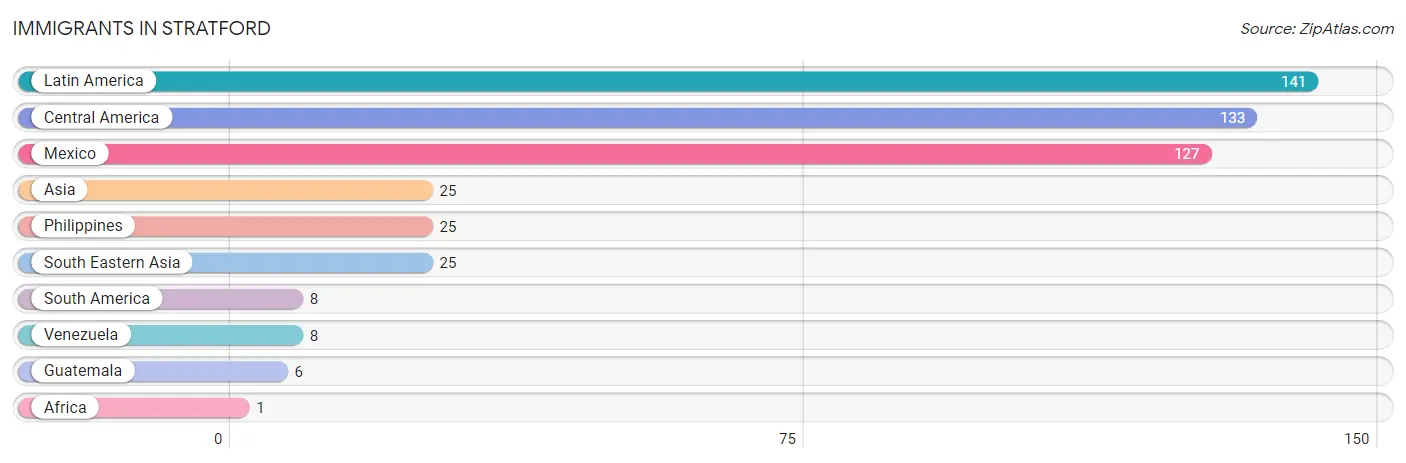
The most numerous immigrant groups reported in Stratford came from Latin America (141 | 11.3%), Central America (133 | 10.6%), Mexico (127 | 10.2%), Asia (25 | 2.0%), and Philippines (25 | 2.0%), together accounting for 36.1% of all Stratford residents.
| Immigration Origin | # Population | % Population |
| Africa | 1 | 0.1% |
| Asia | 25 | 2.0% |
| Central America | 133 | 10.6% |
| Guatemala | 6 | 0.5% |
| Latin America | 141 | 11.3% |
| Mexico | 127 | 10.2% |
| Philippines | 25 | 2.0% |
| South America | 8 | 0.6% |
| South Eastern Asia | 25 | 2.0% |
| Venezuela | 8 | 0.6% | View All 10 Rows |
Sex and Age in Stratford
Sex and Age in Stratford
The most populous age groups in Stratford are 60 to 64 Years (101 | 18.4%) for men and Under 5 Years (87 | 12.4%) for women.
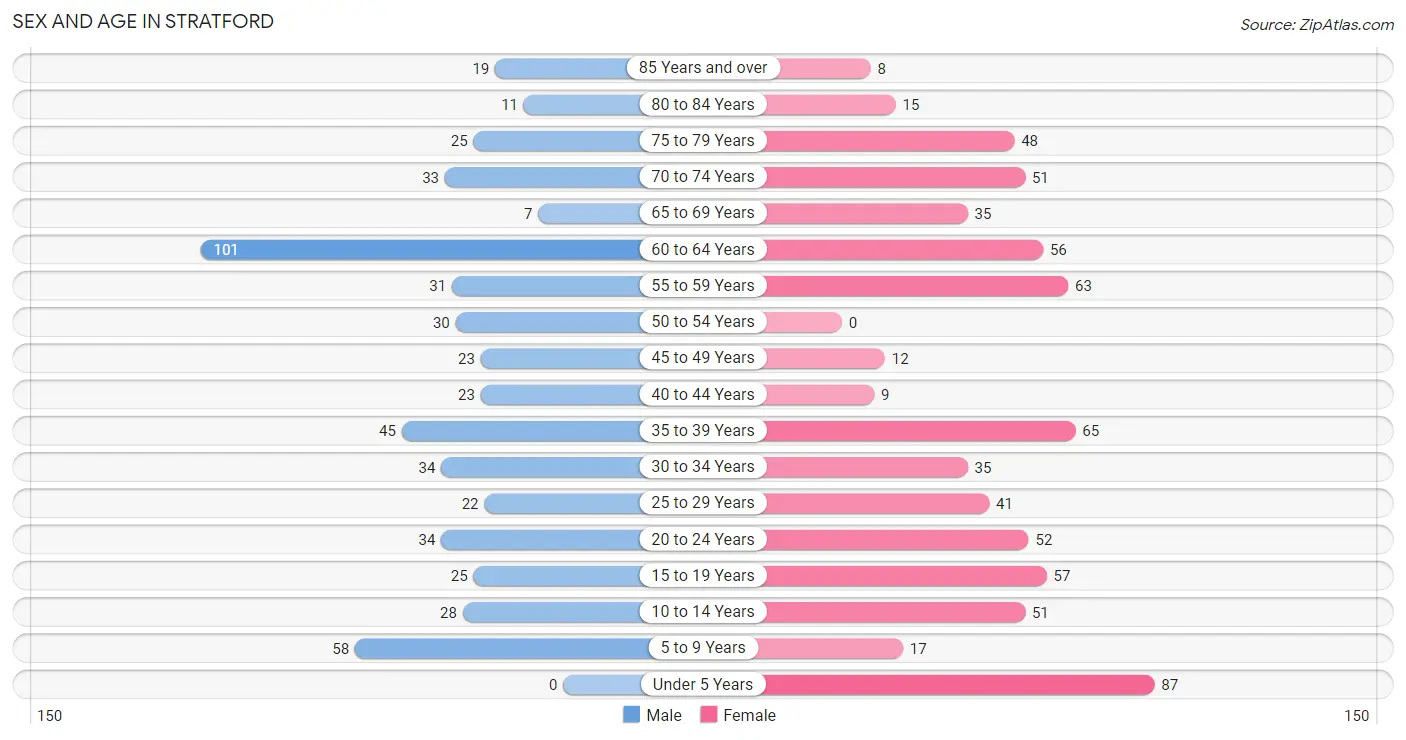
| Age Bracket | Male | Female |
| Under 5 Years | 0 (0.0%) | 87 (12.4%) |
| 5 to 9 Years | 58 (10.6%) | 17 (2.4%) |
| 10 to 14 Years | 28 (5.1%) | 51 (7.3%) |
| 15 to 19 Years | 25 (4.5%) | 57 (8.1%) |
| 20 to 24 Years | 34 (6.2%) | 52 (7.4%) |
| 25 to 29 Years | 22 (4.0%) | 41 (5.8%) |
| 30 to 34 Years | 34 (6.2%) | 35 (5.0%) |
| 35 to 39 Years | 45 (8.2%) | 65 (9.3%) |
| 40 to 44 Years | 23 (4.2%) | 9 (1.3%) |
| 45 to 49 Years | 23 (4.2%) | 12 (1.7%) |
| 50 to 54 Years | 30 (5.5%) | 0 (0.0%) |
| 55 to 59 Years | 31 (5.7%) | 63 (9.0%) |
| 60 to 64 Years | 101 (18.4%) | 56 (8.0%) |
| 65 to 69 Years | 7 (1.3%) | 35 (5.0%) |
| 70 to 74 Years | 33 (6.0%) | 51 (7.3%) |
| 75 to 79 Years | 25 (4.5%) | 48 (6.8%) |
| 80 to 84 Years | 11 (2.0%) | 15 (2.1%) |
| 85 Years and over | 19 (3.5%) | 8 (1.1%) |
| Total | 549 (100.0%) | 702 (100.0%) |
Families and Households in Stratford
Median Family Size in Stratford
The median family size in Stratford is 2.98 persons per family, with single female/mother families (62 | 17.0%) accounting for the largest median family size of 3.1 persons per family. On the other hand, single male/father families (21 | 5.8%) represent the smallest median family size with 2.71 persons per family.
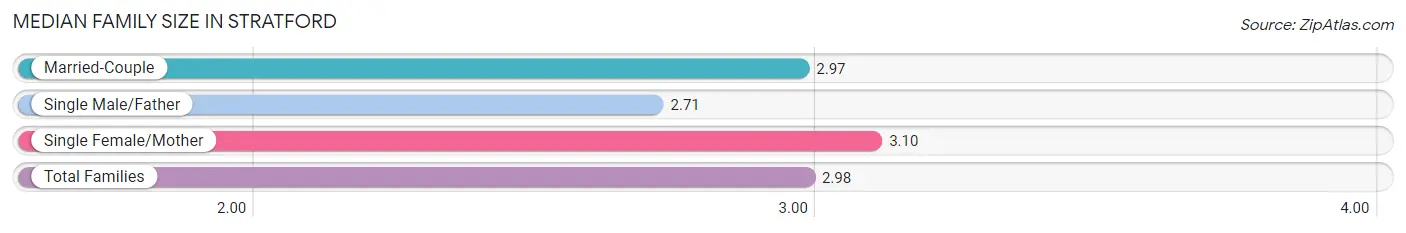
| Family Type | # Families | Family Size |
| Married-Couple | 282 (77.3%) | 2.97 |
| Single Male/Father | 21 (5.8%) | 2.71 |
| Single Female/Mother | 62 (17.0%) | 3.10 |
| Total Families | 365 (100.0%) | 2.98 |
Median Household Size in Stratford
The median household size in Stratford is 2.53 persons per household, with single female/mother households (62 | 12.9%) accounting for the largest median household size of 3.19 persons per household. non-family households (116 | 24.1%) represent the smallest median household size with 1.07 persons per household.
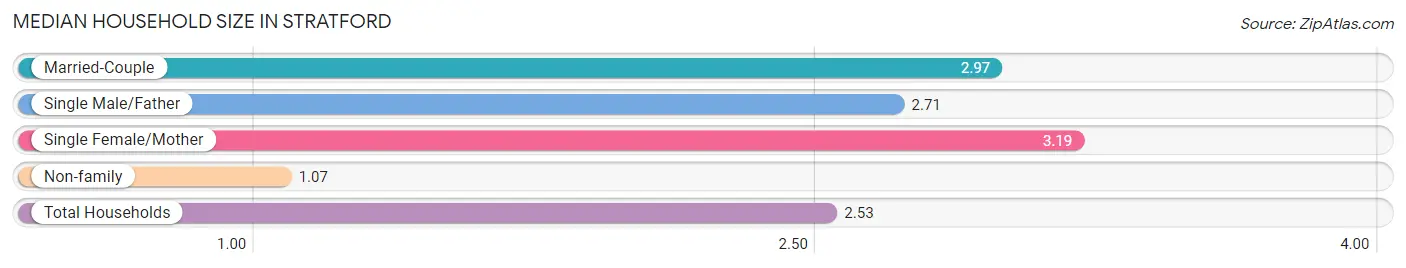
| Household Type | # Households | Household Size |
| Married-Couple | 282 (58.6%) | 2.97 |
| Single Male/Father | 21 (4.4%) | 2.71 |
| Single Female/Mother | 62 (12.9%) | 3.19 |
| Non-family | 116 (24.1%) | 1.07 |
| Total Households | 481 (100.0%) | 2.53 |
Household Size by Marriage Status in Stratford
Out of a total of 481 households in Stratford, 365 (75.9%) are family households, while 116 (24.1%) are nonfamily households. The most numerous type of family households are 2-person households, comprising 155, and the most common type of nonfamily households are 1-person households, comprising 99.
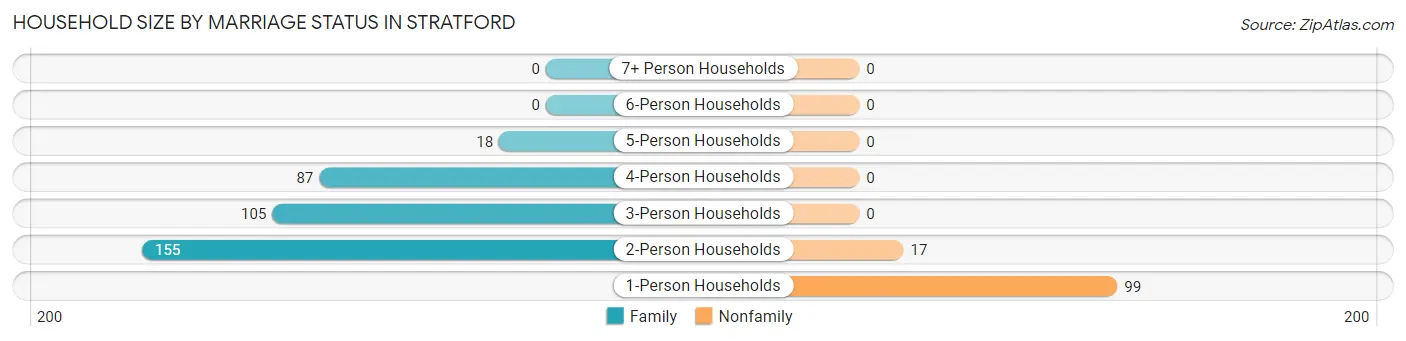
| Household Size | Family Households | Nonfamily Households |
| 1-Person Households | - | 99 (20.6%) |
| 2-Person Households | 155 (32.2%) | 17 (3.5%) |
| 3-Person Households | 105 (21.8%) | 0 (0.0%) |
| 4-Person Households | 87 (18.1%) | 0 (0.0%) |
| 5-Person Households | 18 (3.7%) | 0 (0.0%) |
| 6-Person Households | 0 (0.0%) | 0 (0.0%) |
| 7+ Person Households | 0 (0.0%) | 0 (0.0%) |
| Total | 365 (75.9%) | 116 (24.1%) |
Female Fertility in Stratford
Fertility by Age in Stratford
Average fertility rate in Stratford is 15.0 births per 1,000 women. Women in the age bracket of 20 to 34 years have the highest fertility rate with 31.0 births per 1,000 women. Women in the age bracket of 20 to 34 years acount for 100.0% of all women with births.
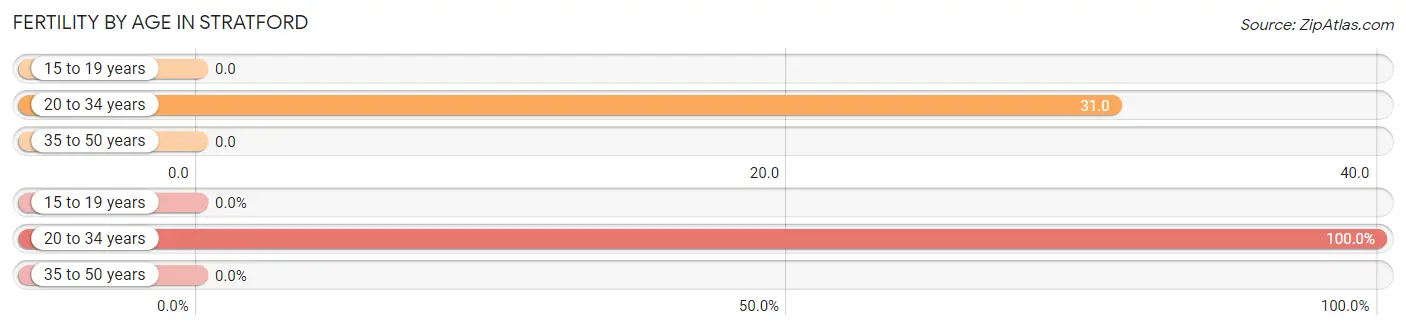
| Age Bracket | Women with Births | Births / 1,000 Women |
| 15 to 19 years | 0 (0.0%) | 0.0 |
| 20 to 34 years | 4 (100.0%) | 31.0 |
| 35 to 50 years | 0 (0.0%) | 0.0 |
| Total | 4 (100.0%) | 15.0 |
Fertility by Age by Marriage Status in Stratford
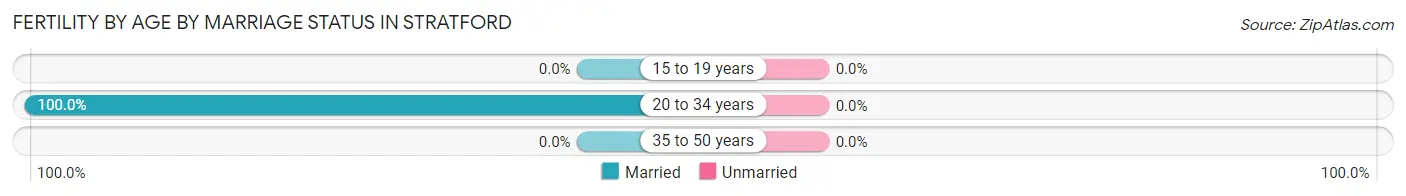
| Age Bracket | Married | Unmarried |
| 15 to 19 years | 0 (0.0%) | 0 (0.0%) |
| 20 to 34 years | 4 (100.0%) | 0 (0.0%) |
| 35 to 50 years | 0 (0.0%) | 0 (0.0%) |
| Total | 4 (100.0%) | 0 (0.0%) |
Fertility by Education in Stratford
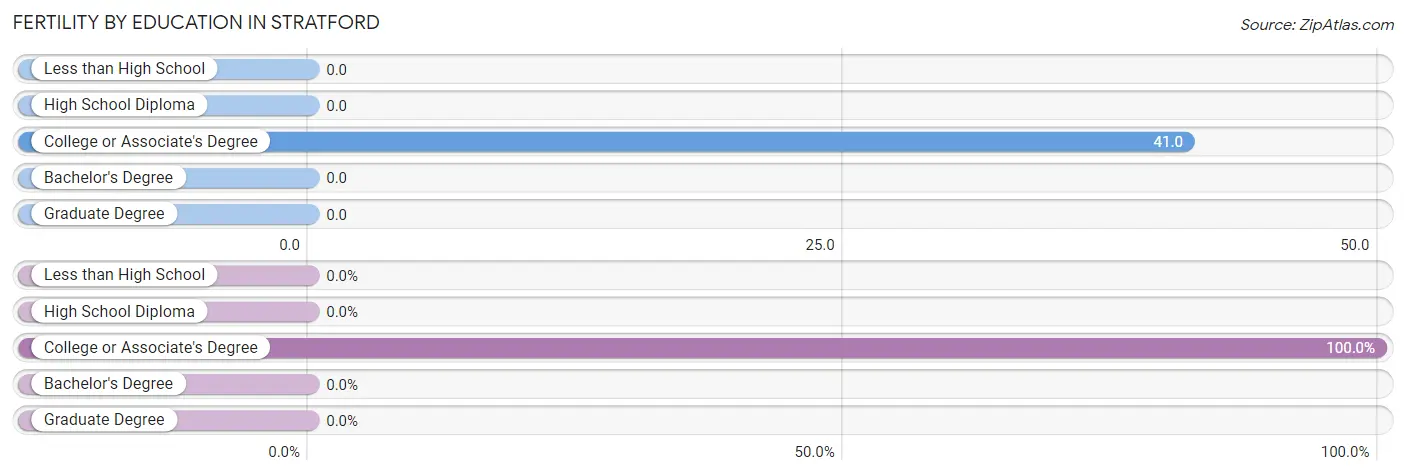
| Educational Attainment | Women with Births | Births / 1,000 Women |
| Less than High School | 0 (0.0%) | 0.0 |
| High School Diploma | 0 (0.0%) | 0.0 |
| College or Associate's Degree | 4 (100.0%) | 41.0 |
| Bachelor's Degree | 0 (0.0%) | 0.0 |
| Graduate Degree | 0 (0.0%) | 0.0 |
| Total | 4 (100.0%) | 15.0 |
Fertility by Education by Marriage Status in Stratford
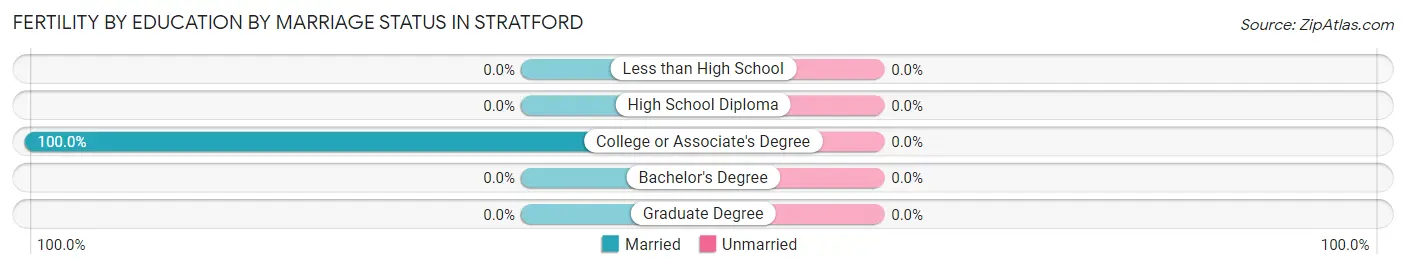
| Educational Attainment | Married | Unmarried |
| Less than High School | 0 (0.0%) | 0 (0.0%) |
| High School Diploma | 0 (0.0%) | 0 (0.0%) |
| College or Associate's Degree | 4 (100.0%) | 0 (0.0%) |
| Bachelor's Degree | 0 (0.0%) | 0 (0.0%) |
| Graduate Degree | 0 (0.0%) | 0 (0.0%) |
| Total | 4 (100.0%) | 0 (0.0%) |
Employment Characteristics in Stratford
Employment by Class of Employer in Stratford
Among the 600 employed individuals in Stratford, private company employees (301 | 50.2%), self-employed (not incorporated) (120 | 20.0%), and local government employees (100 | 16.7%) make up the most common classes of employment.
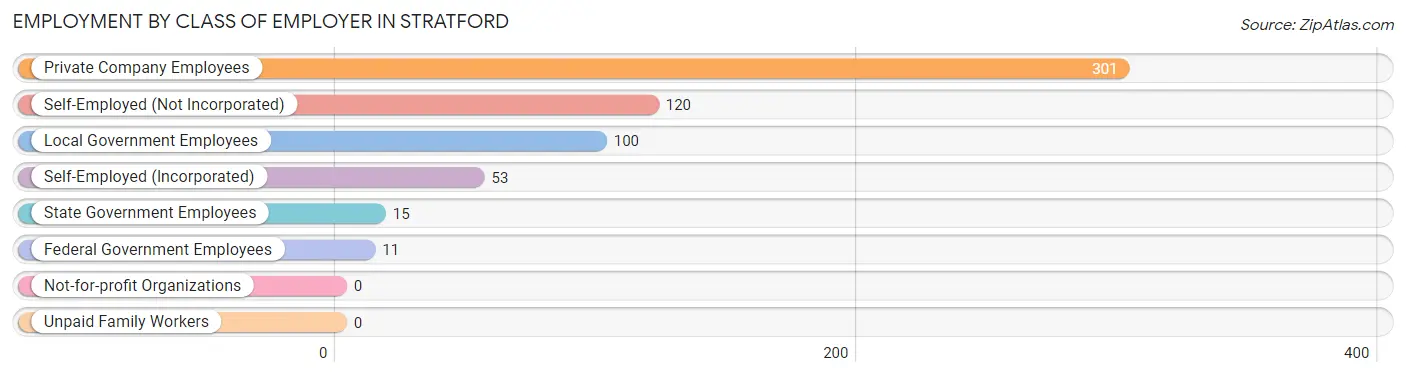
| Employer Class | # Employees | % Employees |
| Private Company Employees | 301 | 50.2% |
| Self-Employed (Incorporated) | 53 | 8.8% |
| Self-Employed (Not Incorporated) | 120 | 20.0% |
| Not-for-profit Organizations | 0 | 0.0% |
| Local Government Employees | 100 | 16.7% |
| State Government Employees | 15 | 2.5% |
| Federal Government Employees | 11 | 1.8% |
| Unpaid Family Workers | 0 | 0.0% |
| Total | 600 | 100.0% |
Employment Status by Age in Stratford
According to the labor force statistics for Stratford, out of the total population over 16 years of age (980), 64.3% or 630 individuals are in the labor force, with 2.5% or 16 of them unemployed. The age group with the highest labor force participation rate is 55 to 59 years, with 100.0% or 94 individuals in the labor force. Within the labor force, the 16 to 19 years age range has the highest percentage of unemployed individuals, with 50.0% or 16 of them being unemployed.
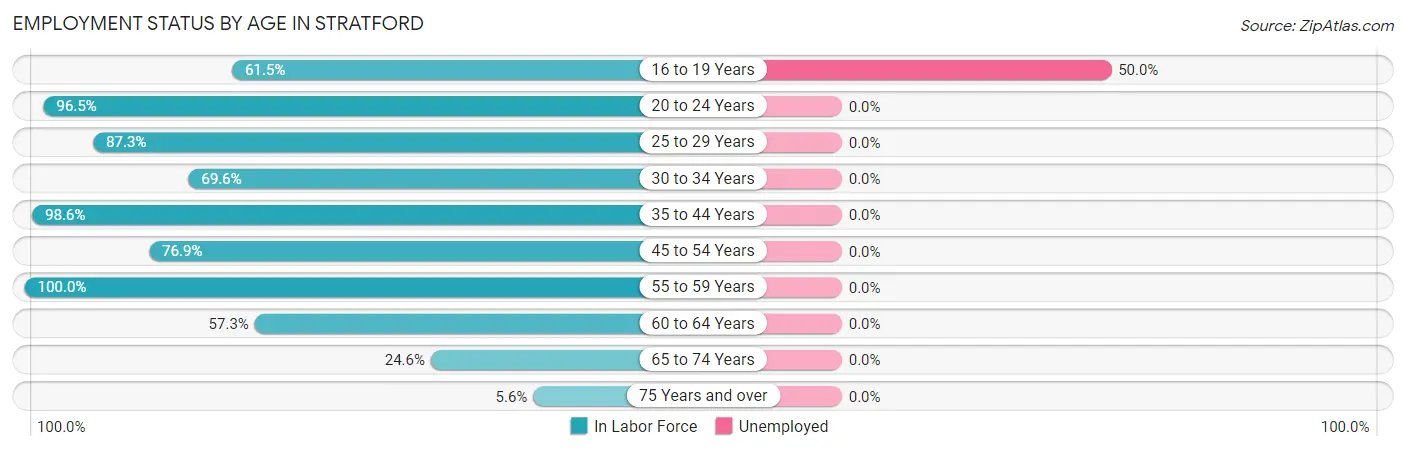
| Age Bracket | In Labor Force | Unemployed |
| 16 to 19 Years | 32 (61.5%) | 16 (50.0%) |
| 20 to 24 Years | 83 (96.5%) | 0 (0.0%) |
| 25 to 29 Years | 55 (87.3%) | 0 (0.0%) |
| 30 to 34 Years | 48 (69.6%) | 0 (0.0%) |
| 35 to 44 Years | 140 (98.6%) | 0 (0.0%) |
| 45 to 54 Years | 50 (76.9%) | 0 (0.0%) |
| 55 to 59 Years | 94 (100.0%) | 0 (0.0%) |
| 60 to 64 Years | 90 (57.3%) | 0 (0.0%) |
| 65 to 74 Years | 31 (24.6%) | 0 (0.0%) |
| 75 Years and over | 7 (5.6%) | 0 (0.0%) |
| Total | 630 (64.3%) | 16 (2.5%) |
Employment Status by Educational Attainment in Stratford
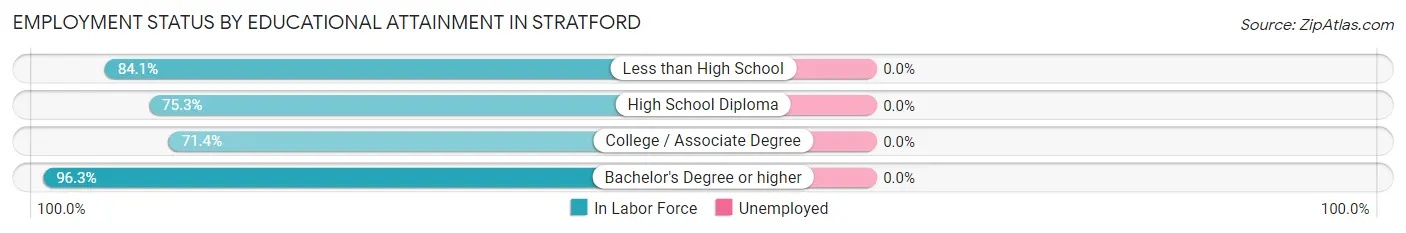
| Educational Attainment | In Labor Force | Unemployed |
| Less than High School | 127 (84.1%) | 0 (0.0%) |
| High School Diploma | 64 (75.3%) | 0 (0.0%) |
| College / Associate Degree | 157 (71.4%) | 0 (0.0%) |
| Bachelor's Degree or higher | 129 (96.3%) | 0 (0.0%) |
| Total | 477 (80.8%) | 0 (0.0%) |
Employment Occupations by Sex in Stratford
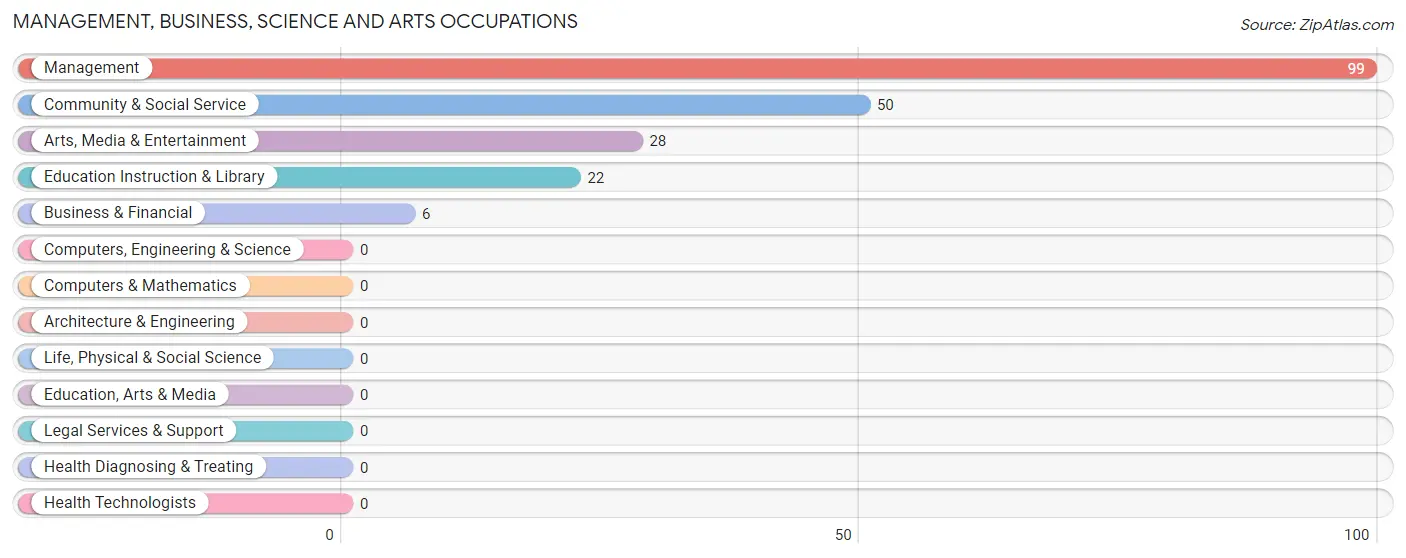
Management, Business, Science and Arts Occupations
The most common Management, Business, Science and Arts occupations in Stratford are Management (99 | 16.1%), Community & Social Service (50 | 8.1%), Arts, Media & Entertainment (28 | 4.6%), Education Instruction & Library (22 | 3.6%), and Business & Financial (6 | 1.0%).
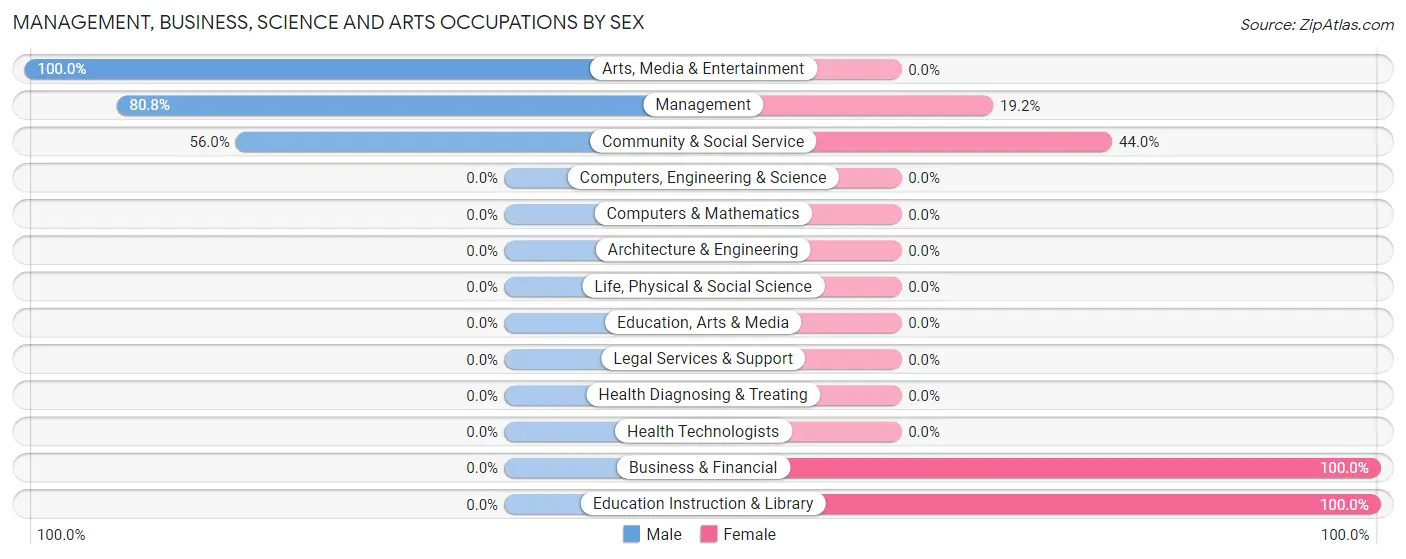
Management, Business, Science and Arts Occupations by Sex
Within the Management, Business, Science and Arts occupations in Stratford, the most male-oriented occupations are Arts, Media & Entertainment (100.0%), Management (80.8%), and Community & Social Service (56.0%), while the most female-oriented occupations are Business & Financial (100.0%), Education Instruction & Library (100.0%), and Community & Social Service (44.0%).
| Occupation | Male | Female |
| Management | 80 (80.8%) | 19 (19.2%) |
| Business & Financial | 0 (0.0%) | 6 (100.0%) |
| Computers, Engineering & Science | 0 (0.0%) | 0 (0.0%) |
| Computers & Mathematics | 0 (0.0%) | 0 (0.0%) |
| Architecture & Engineering | 0 (0.0%) | 0 (0.0%) |
| Life, Physical & Social Science | 0 (0.0%) | 0 (0.0%) |
| Community & Social Service | 28 (56.0%) | 22 (44.0%) |
| Education, Arts & Media | 0 (0.0%) | 0 (0.0%) |
| Legal Services & Support | 0 (0.0%) | 0 (0.0%) |
| Education Instruction & Library | 0 (0.0%) | 22 (100.0%) |
| Arts, Media & Entertainment | 28 (100.0%) | 0 (0.0%) |
| Health Diagnosing & Treating | 0 (0.0%) | 0 (0.0%) |
| Health Technologists | 0 (0.0%) | 0 (0.0%) |
| Total (Category) | 108 (69.7%) | 47 (30.3%) |
| Total (Overall) | 340 (55.4%) | 274 (44.6%) |
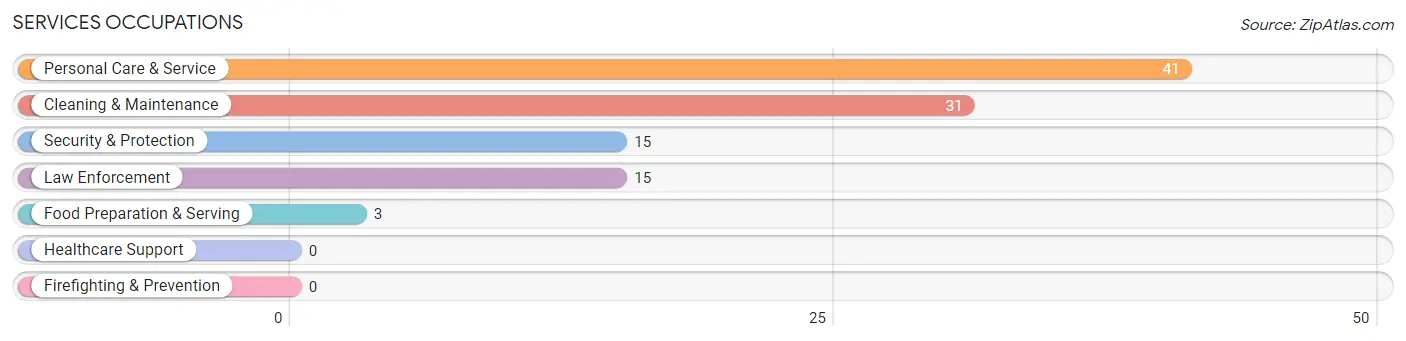
Services Occupations
The most common Services occupations in Stratford are Personal Care & Service (41 | 6.7%), Cleaning & Maintenance (31 | 5.1%), Security & Protection (15 | 2.4%), Law Enforcement (15 | 2.4%), and Food Preparation & Serving (3 | 0.5%).
Services Occupations by Sex
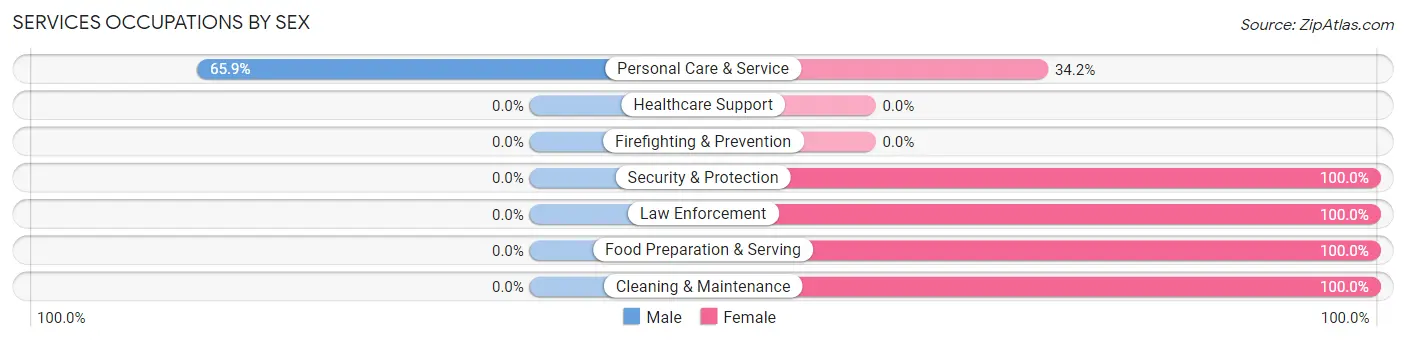
| Occupation | Male | Female |
| Healthcare Support | 0 (0.0%) | 0 (0.0%) |
| Security & Protection | 0 (0.0%) | 15 (100.0%) |
| Firefighting & Prevention | 0 (0.0%) | 0 (0.0%) |
| Law Enforcement | 0 (0.0%) | 15 (100.0%) |
| Food Preparation & Serving | 0 (0.0%) | 3 (100.0%) |
| Cleaning & Maintenance | 0 (0.0%) | 31 (100.0%) |
| Personal Care & Service | 27 (65.8%) | 14 (34.2%) |
| Total (Category) | 27 (30.0%) | 63 (70.0%) |
| Total (Overall) | 340 (55.4%) | 274 (44.6%) |
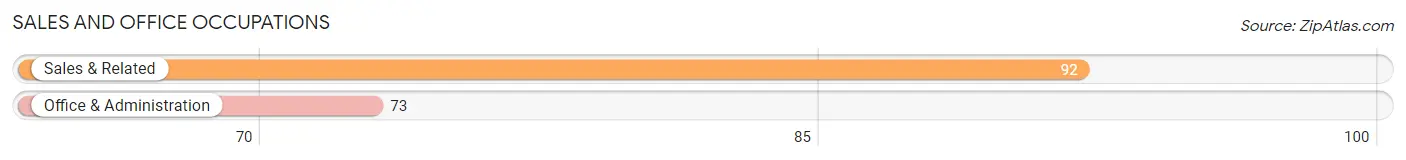
Sales and Office Occupations
The most common Sales and Office occupations in Stratford are Sales & Related (92 | 15.0%), and Office & Administration (73 | 11.9%).
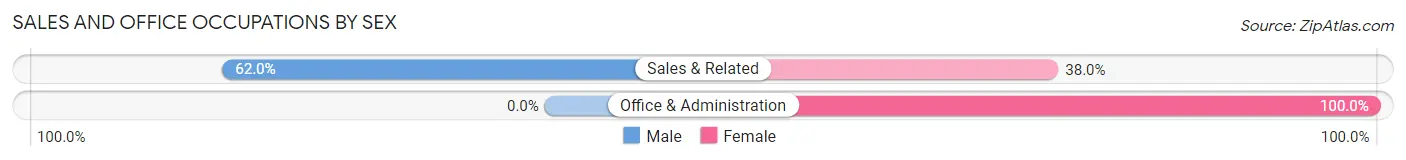
Sales and Office Occupations by Sex
| Occupation | Male | Female |
| Sales & Related | 57 (62.0%) | 35 (38.0%) |
| Office & Administration | 0 (0.0%) | 73 (100.0%) |
| Total (Category) | 57 (34.5%) | 108 (65.4%) |
| Total (Overall) | 340 (55.4%) | 274 (44.6%) |
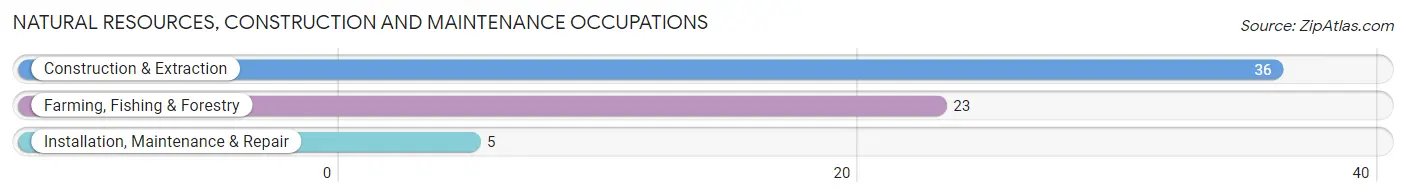
Natural Resources, Construction and Maintenance Occupations
The most common Natural Resources, Construction and Maintenance occupations in Stratford are Construction & Extraction (36 | 5.9%), Farming, Fishing & Forestry (23 | 3.7%), and Installation, Maintenance & Repair (5 | 0.8%).
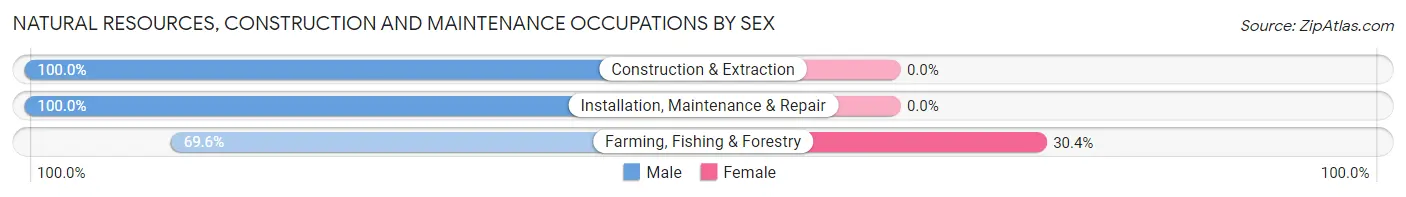
Natural Resources, Construction and Maintenance Occupations by Sex
| Occupation | Male | Female |
| Farming, Fishing & Forestry | 16 (69.6%) | 7 (30.4%) |
| Construction & Extraction | 36 (100.0%) | 0 (0.0%) |
| Installation, Maintenance & Repair | 5 (100.0%) | 0 (0.0%) |
| Total (Category) | 57 (89.1%) | 7 (10.9%) |
| Total (Overall) | 340 (55.4%) | 274 (44.6%) |
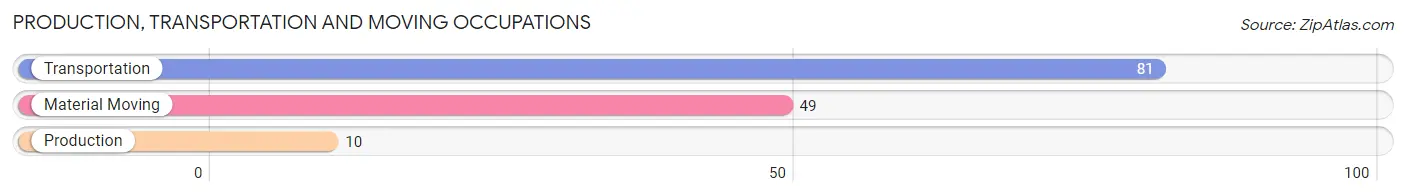
Production, Transportation and Moving Occupations
The most common Production, Transportation and Moving occupations in Stratford are Transportation (81 | 13.2%), Material Moving (49 | 8.0%), and Production (10 | 1.6%).
Production, Transportation and Moving Occupations by Sex
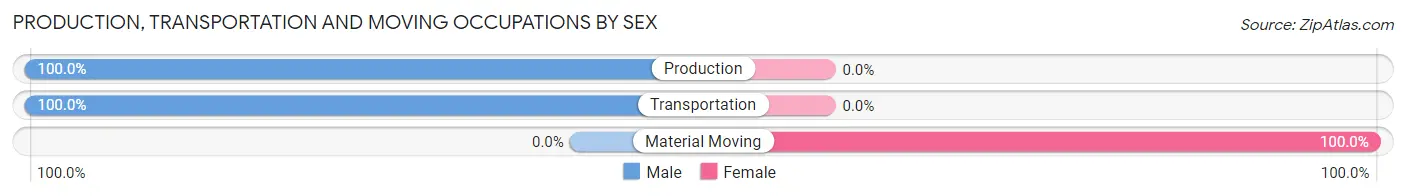
| Occupation | Male | Female |
| Production | 10 (100.0%) | 0 (0.0%) |
| Transportation | 81 (100.0%) | 0 (0.0%) |
| Material Moving | 0 (0.0%) | 49 (100.0%) |
| Total (Category) | 91 (65.0%) | 49 (35.0%) |
| Total (Overall) | 340 (55.4%) | 274 (44.6%) |
Employment Industries by Sex in Stratford
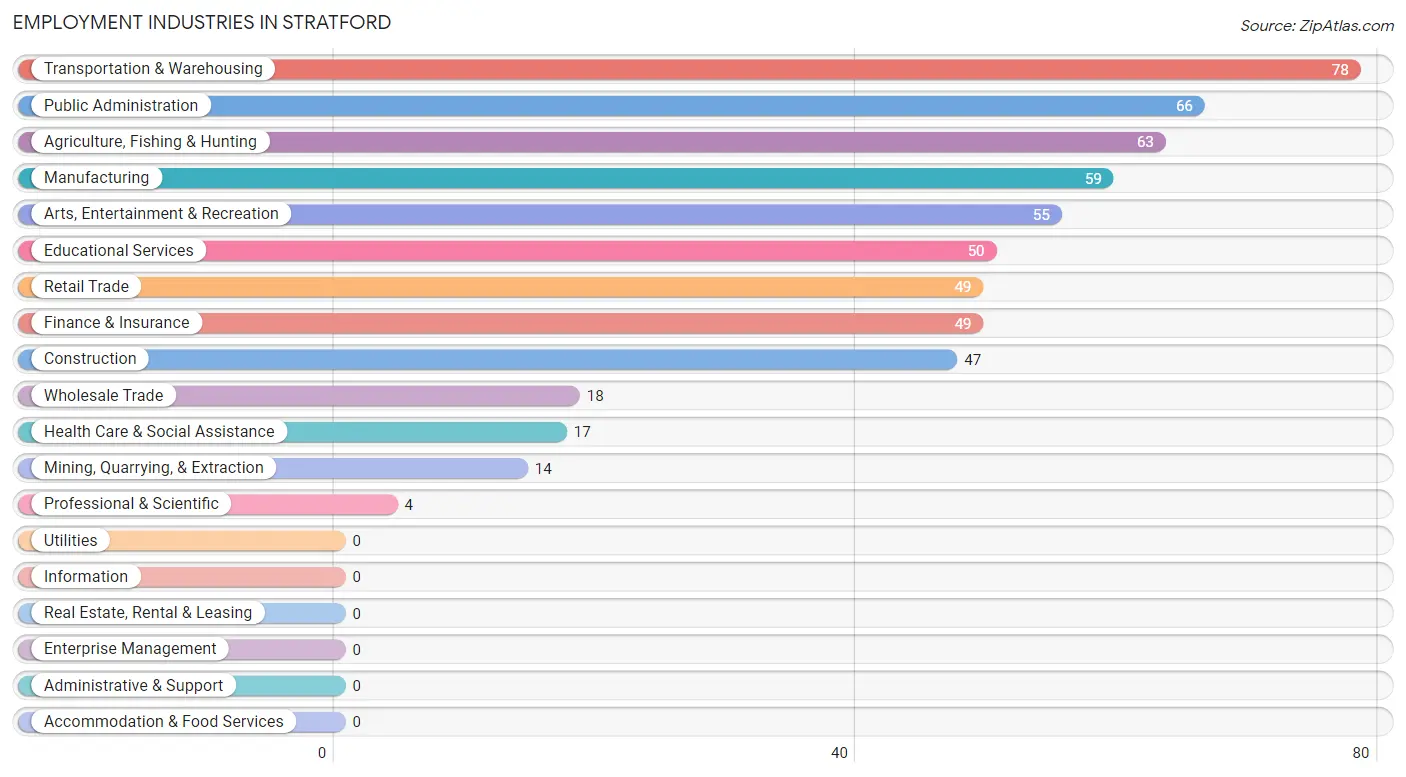
Employment Industries in Stratford
The major employment industries in Stratford include Transportation & Warehousing (78 | 12.7%), Public Administration (66 | 10.7%), Agriculture, Fishing & Hunting (63 | 10.3%), Manufacturing (59 | 9.6%), and Arts, Entertainment & Recreation (55 | 9.0%).
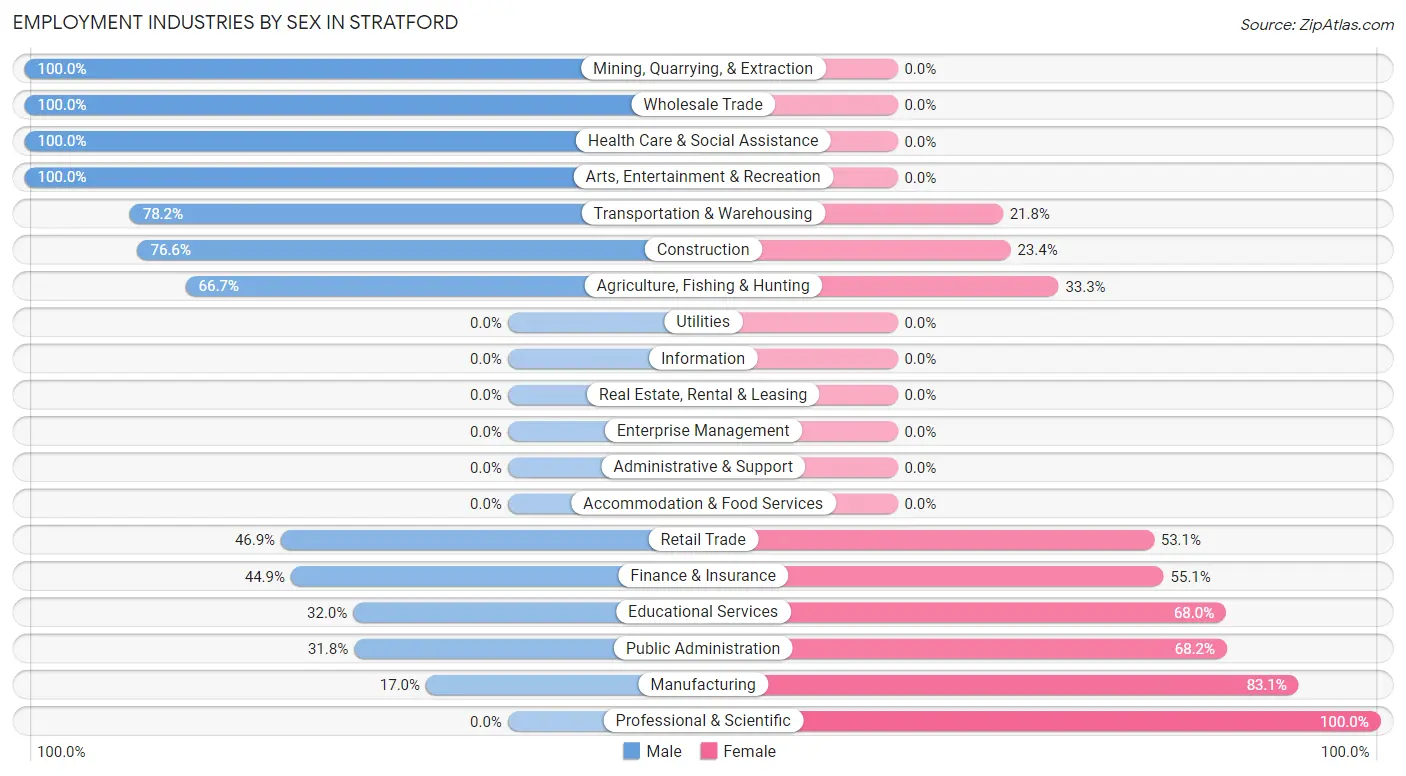
Employment Industries by Sex in Stratford
The Stratford industries that see more men than women are Mining, Quarrying, & Extraction (100.0%), Wholesale Trade (100.0%), and Health Care & Social Assistance (100.0%), whereas the industries that tend to have a higher number of women are Professional & Scientific (100.0%), Manufacturing (83.1%), and Public Administration (68.2%).
| Industry | Male | Female |
| Agriculture, Fishing & Hunting | 42 (66.7%) | 21 (33.3%) |
| Mining, Quarrying, & Extraction | 14 (100.0%) | 0 (0.0%) |
| Construction | 36 (76.6%) | 11 (23.4%) |
| Manufacturing | 10 (17.0%) | 49 (83.1%) |
| Wholesale Trade | 18 (100.0%) | 0 (0.0%) |
| Retail Trade | 23 (46.9%) | 26 (53.1%) |
| Transportation & Warehousing | 61 (78.2%) | 17 (21.8%) |
| Utilities | 0 (0.0%) | 0 (0.0%) |
| Information | 0 (0.0%) | 0 (0.0%) |
| Finance & Insurance | 22 (44.9%) | 27 (55.1%) |
| Real Estate, Rental & Leasing | 0 (0.0%) | 0 (0.0%) |
| Professional & Scientific | 0 (0.0%) | 4 (100.0%) |
| Enterprise Management | 0 (0.0%) | 0 (0.0%) |
| Administrative & Support | 0 (0.0%) | 0 (0.0%) |
| Educational Services | 16 (32.0%) | 34 (68.0%) |
| Health Care & Social Assistance | 17 (100.0%) | 0 (0.0%) |
| Arts, Entertainment & Recreation | 55 (100.0%) | 0 (0.0%) |
| Accommodation & Food Services | 0 (0.0%) | 0 (0.0%) |
| Public Administration | 21 (31.8%) | 45 (68.2%) |
| Total | 340 (55.4%) | 274 (44.6%) |
Education in Stratford
School Enrollment in Stratford
The most common levels of schooling among the 313 students in Stratford are high school (82 | 26.2%), college / undergraduate (77 | 24.6%), and middle school (68 | 21.7%).
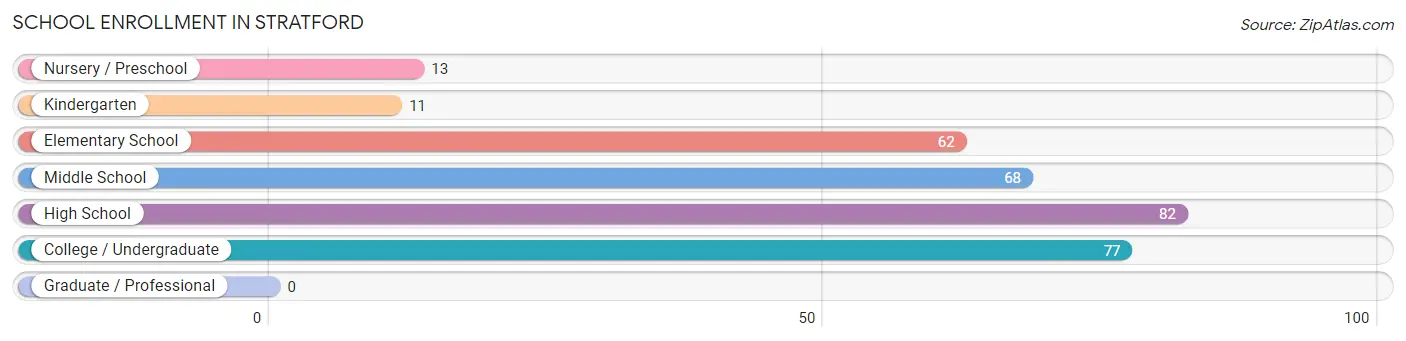
| School Level | # Students | % Students |
| Nursery / Preschool | 13 | 4.2% |
| Kindergarten | 11 | 3.5% |
| Elementary School | 62 | 19.8% |
| Middle School | 68 | 21.7% |
| High School | 82 | 26.2% |
| College / Undergraduate | 77 | 24.6% |
| Graduate / Professional | 0 | 0.0% |
| Total | 313 | 100.0% |
School Enrollment by Age by Funding Source in Stratford
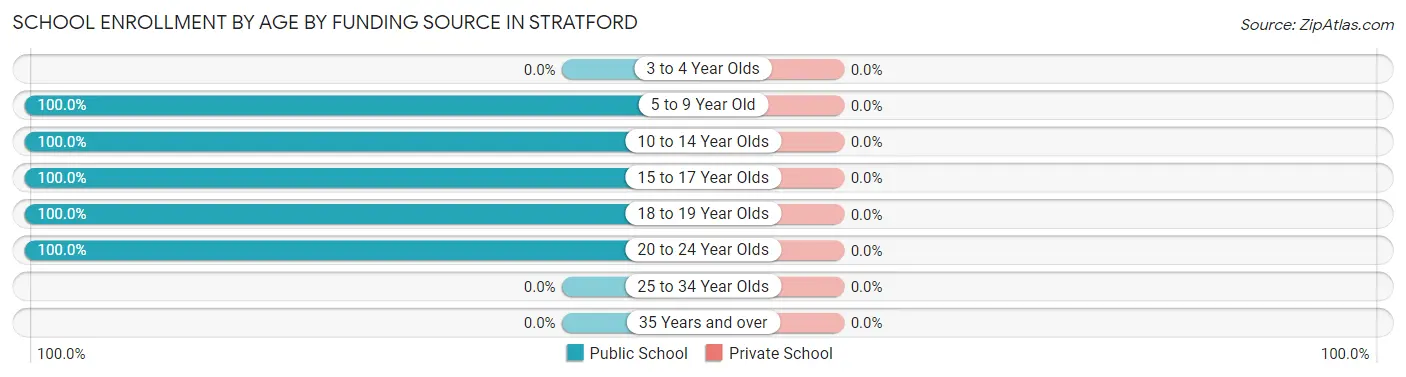
| Age Bracket | Public School | Private School |
| 3 to 4 Year Olds | 0 (0.0%) | 0 (0.0%) |
| 5 to 9 Year Old | 75 (100.0%) | 0 (0.0%) |
| 10 to 14 Year Olds | 79 (100.0%) | 0 (0.0%) |
| 15 to 17 Year Olds | 66 (100.0%) | 0 (0.0%) |
| 18 to 19 Year Olds | 16 (100.0%) | 0 (0.0%) |
| 20 to 24 Year Olds | 77 (100.0%) | 0 (0.0%) |
| 25 to 34 Year Olds | 0 (0.0%) | 0 (0.0%) |
| 35 Years and over | 0 (0.0%) | 0 (0.0%) |
| Total | 313 (100.0%) | 0 (0.0%) |
Educational Attainment by Field of Study in Stratford
Business (75 | 33.0%), bio, nature & agricultural (44 | 19.4%), education (38 | 16.7%), liberal arts & history (37 | 16.3%), and physical & health sciences (17 | 7.5%) are the most common fields of study among 227 individuals in Stratford who have obtained a bachelor's degree or higher.
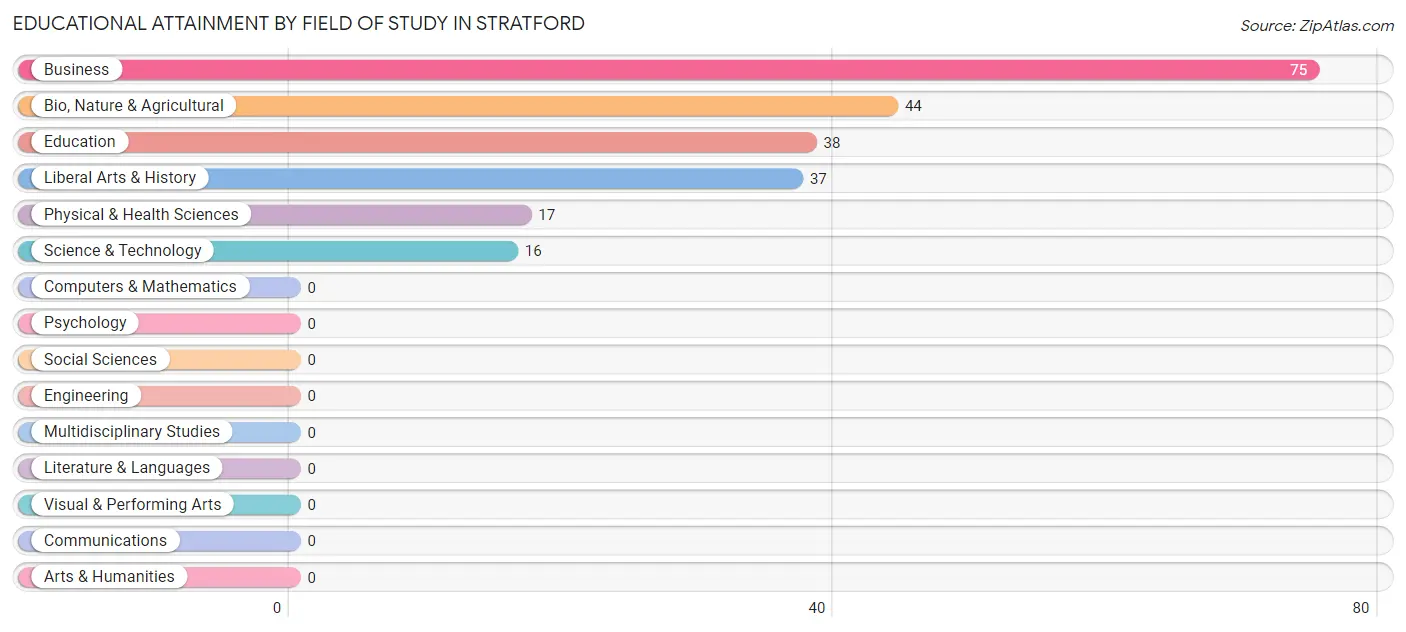
| Field of Study | # Graduates | % Graduates |
| Computers & Mathematics | 0 | 0.0% |
| Bio, Nature & Agricultural | 44 | 19.4% |
| Physical & Health Sciences | 17 | 7.5% |
| Psychology | 0 | 0.0% |
| Social Sciences | 0 | 0.0% |
| Engineering | 0 | 0.0% |
| Multidisciplinary Studies | 0 | 0.0% |
| Science & Technology | 16 | 7.0% |
| Business | 75 | 33.0% |
| Education | 38 | 16.7% |
| Literature & Languages | 0 | 0.0% |
| Liberal Arts & History | 37 | 16.3% |
| Visual & Performing Arts | 0 | 0.0% |
| Communications | 0 | 0.0% |
| Arts & Humanities | 0 | 0.0% |
| Total | 227 | 100.0% |
Transportation & Commute in Stratford
Vehicle Availability by Sex in Stratford
The most prevalent vehicle ownership categories in Stratford are males with 2 vehicles (210, accounting for 61.8%) and females with 2 vehicles (130, making up 80.8%).
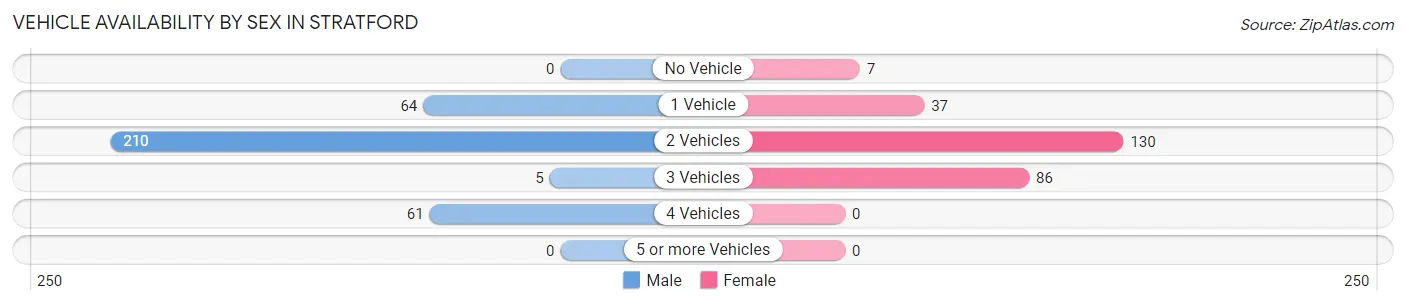
| Vehicles Available | Male | Female |
| No Vehicle | 0 (0.0%) | 7 (2.7%) |
| 1 Vehicle | 64 (18.8%) | 37 (14.2%) |
| 2 Vehicles | 210 (61.8%) | 130 (50.0%) |
| 3 Vehicles | 5 (1.5%) | 86 (33.1%) |
| 4 Vehicles | 61 (17.9%) | 0 (0.0%) |
| 5 or more Vehicles | 0 (0.0%) | 0 (0.0%) |
| Total | 340 (100.0%) | 260 (100.0%) |
Commute Time in Stratford
The most frequently occuring commute durations in Stratford are less than 5 minutes (147 commuters, 25.2%), 5 to 9 minutes (145 commuters, 24.8%), and 10 to 14 minutes (82 commuters, 14.0%).
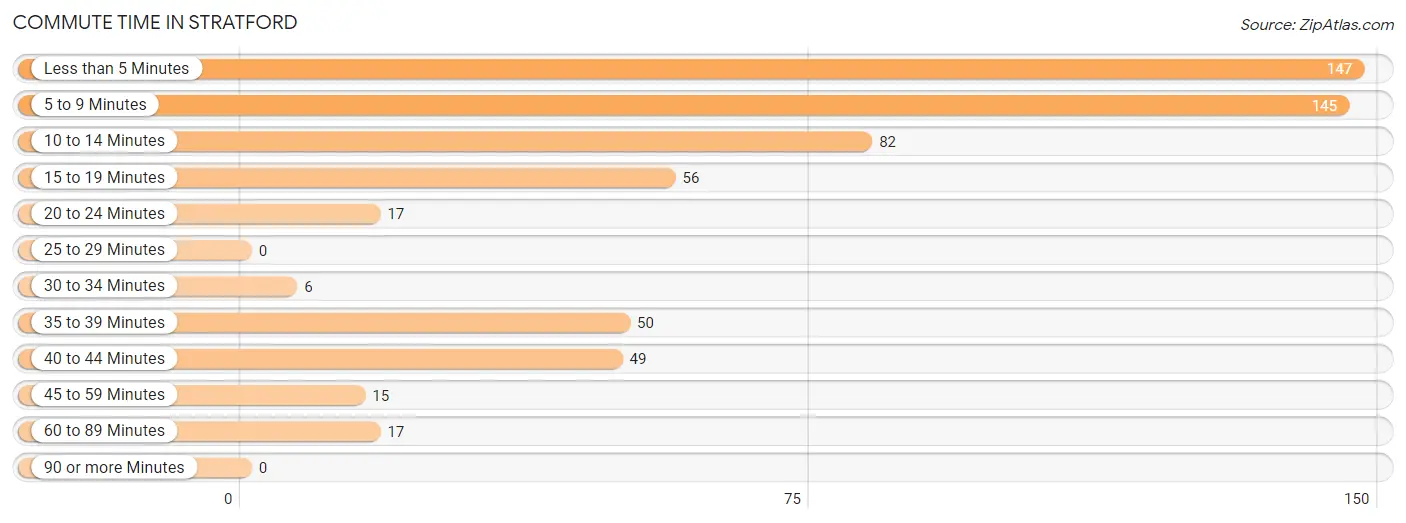
| Commute Time | # Commuters | % Commuters |
| Less than 5 Minutes | 147 | 25.2% |
| 5 to 9 Minutes | 145 | 24.8% |
| 10 to 14 Minutes | 82 | 14.0% |
| 15 to 19 Minutes | 56 | 9.6% |
| 20 to 24 Minutes | 17 | 2.9% |
| 25 to 29 Minutes | 0 | 0.0% |
| 30 to 34 Minutes | 6 | 1.0% |
| 35 to 39 Minutes | 50 | 8.6% |
| 40 to 44 Minutes | 49 | 8.4% |
| 45 to 59 Minutes | 15 | 2.6% |
| 60 to 89 Minutes | 17 | 2.9% |
| 90 or more Minutes | 0 | 0.0% |
Commute Time by Sex in Stratford
The most common commute times in Stratford are less than 5 minutes (102 commuters, 30.0%) for males and 5 to 9 minutes (83 commuters, 34.0%) for females.
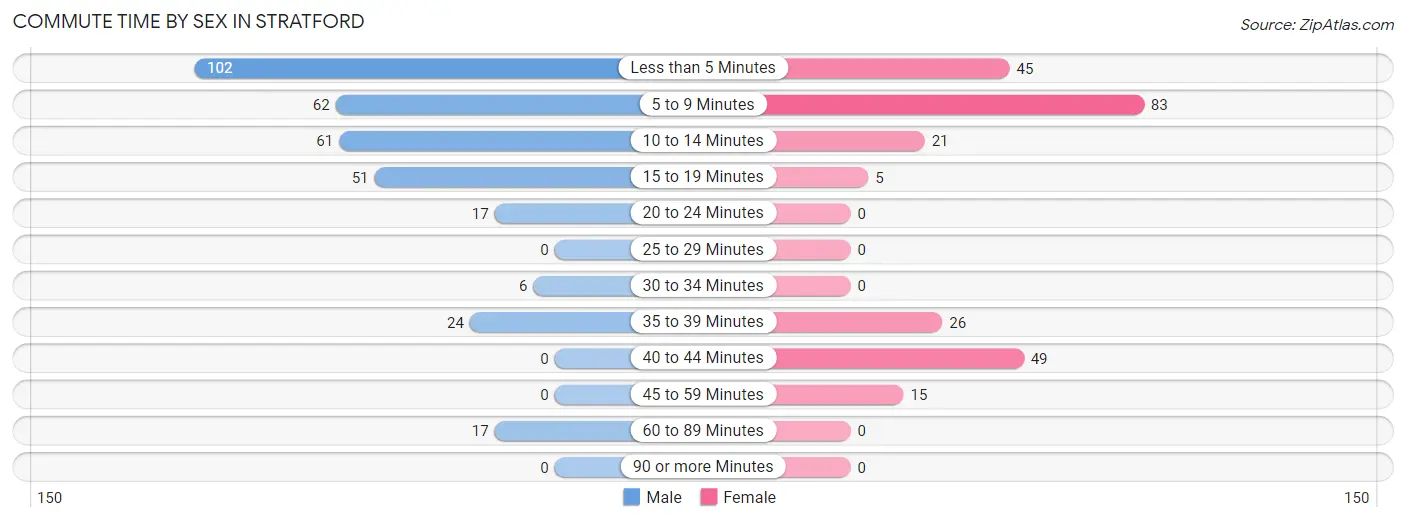
| Commute Time | Male | Female |
| Less than 5 Minutes | 102 (30.0%) | 45 (18.4%) |
| 5 to 9 Minutes | 62 (18.2%) | 83 (34.0%) |
| 10 to 14 Minutes | 61 (17.9%) | 21 (8.6%) |
| 15 to 19 Minutes | 51 (15.0%) | 5 (2.1%) |
| 20 to 24 Minutes | 17 (5.0%) | 0 (0.0%) |
| 25 to 29 Minutes | 0 (0.0%) | 0 (0.0%) |
| 30 to 34 Minutes | 6 (1.8%) | 0 (0.0%) |
| 35 to 39 Minutes | 24 (7.1%) | 26 (10.7%) |
| 40 to 44 Minutes | 0 (0.0%) | 49 (20.1%) |
| 45 to 59 Minutes | 0 (0.0%) | 15 (6.1%) |
| 60 to 89 Minutes | 17 (5.0%) | 0 (0.0%) |
| 90 or more Minutes | 0 (0.0%) | 0 (0.0%) |
Time of Departure to Work by Sex in Stratford
The most frequent times of departure to work in Stratford are 7:30 AM to 7:59 AM (80, 23.5%) for males and 8:00 AM to 8:29 AM (64, 26.2%) for females.
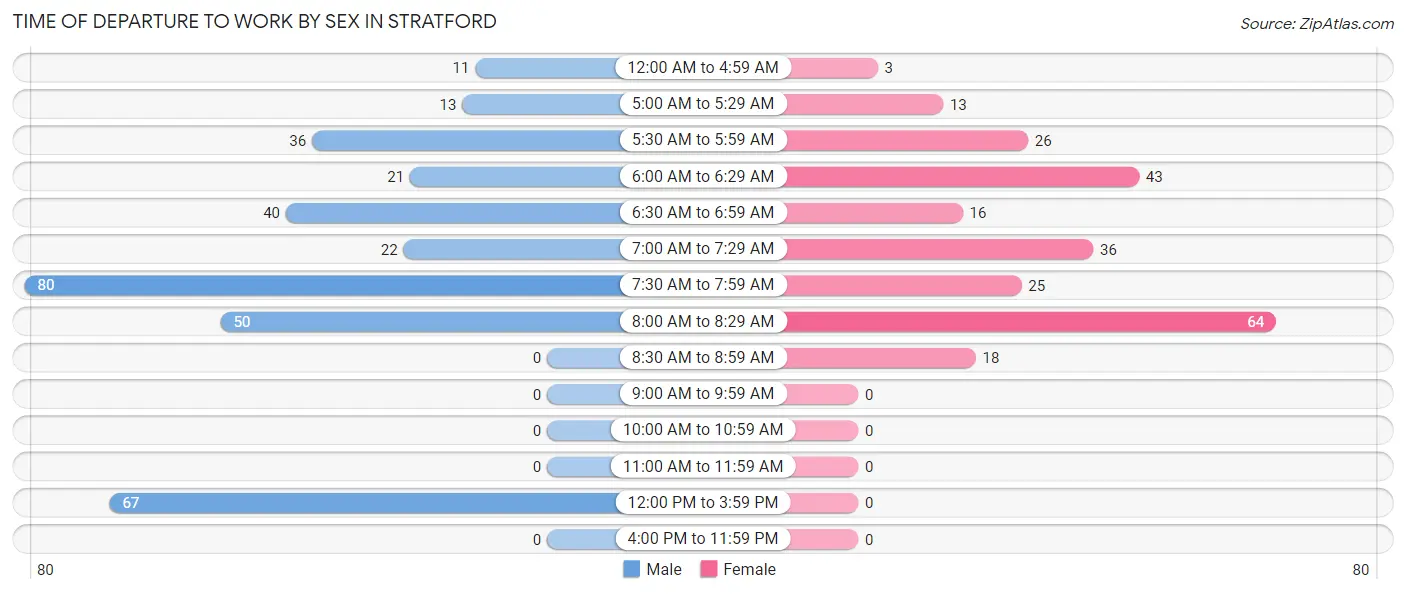
| Time of Departure | Male | Female |
| 12:00 AM to 4:59 AM | 11 (3.2%) | 3 (1.2%) |
| 5:00 AM to 5:29 AM | 13 (3.8%) | 13 (5.3%) |
| 5:30 AM to 5:59 AM | 36 (10.6%) | 26 (10.7%) |
| 6:00 AM to 6:29 AM | 21 (6.2%) | 43 (17.6%) |
| 6:30 AM to 6:59 AM | 40 (11.8%) | 16 (6.6%) |
| 7:00 AM to 7:29 AM | 22 (6.5%) | 36 (14.7%) |
| 7:30 AM to 7:59 AM | 80 (23.5%) | 25 (10.2%) |
| 8:00 AM to 8:29 AM | 50 (14.7%) | 64 (26.2%) |
| 8:30 AM to 8:59 AM | 0 (0.0%) | 18 (7.4%) |
| 9:00 AM to 9:59 AM | 0 (0.0%) | 0 (0.0%) |
| 10:00 AM to 10:59 AM | 0 (0.0%) | 0 (0.0%) |
| 11:00 AM to 11:59 AM | 0 (0.0%) | 0 (0.0%) |
| 12:00 PM to 3:59 PM | 67 (19.7%) | 0 (0.0%) |
| 4:00 PM to 11:59 PM | 0 (0.0%) | 0 (0.0%) |
| Total | 340 (100.0%) | 244 (100.0%) |
Housing Occupancy in Stratford
Occupancy by Ownership in Stratford
Of the total 481 dwellings in Stratford, owner-occupied units account for 408 (84.8%), while renter-occupied units make up 73 (15.2%).
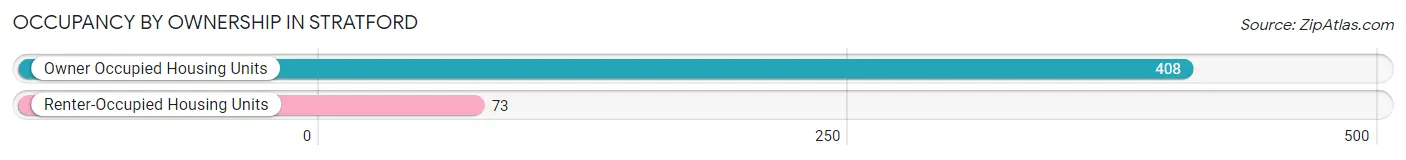
| Occupancy | # Housing Units | % Housing Units |
| Owner Occupied Housing Units | 408 | 84.8% |
| Renter-Occupied Housing Units | 73 | 15.2% |
| Total Occupied Housing Units | 481 | 100.0% |
Occupancy by Household Size in Stratford
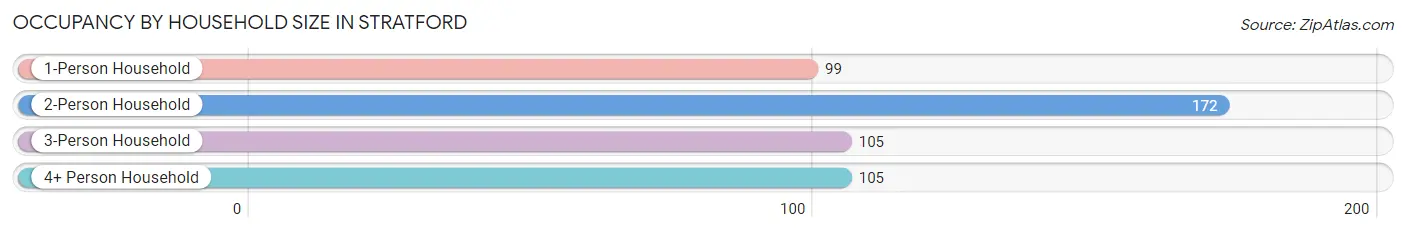
| Household Size | # Housing Units | % Housing Units |
| 1-Person Household | 99 | 20.6% |
| 2-Person Household | 172 | 35.8% |
| 3-Person Household | 105 | 21.8% |
| 4+ Person Household | 105 | 21.8% |
| Total Housing Units | 481 | 100.0% |
Occupancy by Ownership by Household Size in Stratford
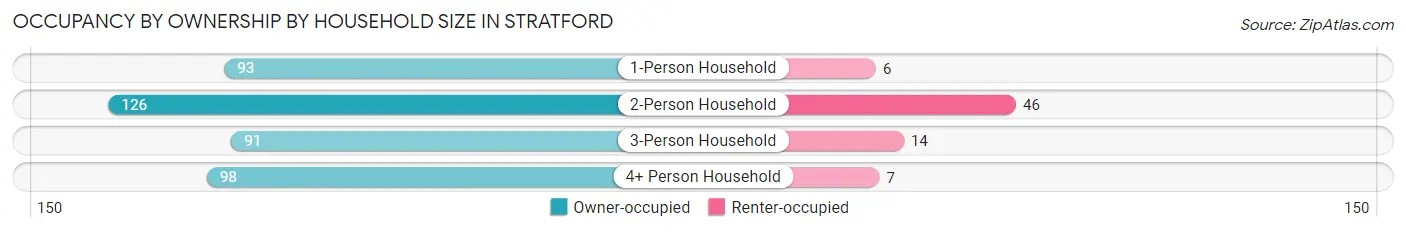
| Household Size | Owner-occupied | Renter-occupied |
| 1-Person Household | 93 (93.9%) | 6 (6.1%) |
| 2-Person Household | 126 (73.3%) | 46 (26.7%) |
| 3-Person Household | 91 (86.7%) | 14 (13.3%) |
| 4+ Person Household | 98 (93.3%) | 7 (6.7%) |
| Total Housing Units | 408 (84.8%) | 73 (15.2%) |
Occupancy by Educational Attainment in Stratford
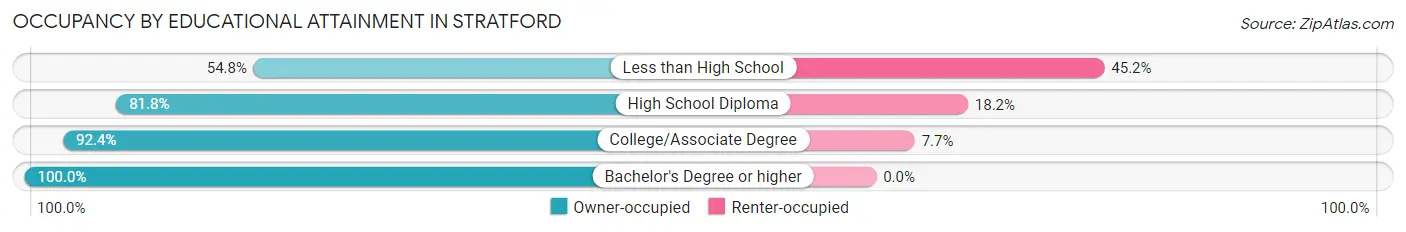
| Household Size | Owner-occupied | Renter-occupied |
| Less than High School | 46 (54.8%) | 38 (45.2%) |
| High School Diploma | 90 (81.8%) | 20 (18.2%) |
| College/Associate Degree | 181 (92.3%) | 15 (7.6%) |
| Bachelor's Degree or higher | 91 (100.0%) | 0 (0.0%) |
Occupancy by Age of Householder in Stratford
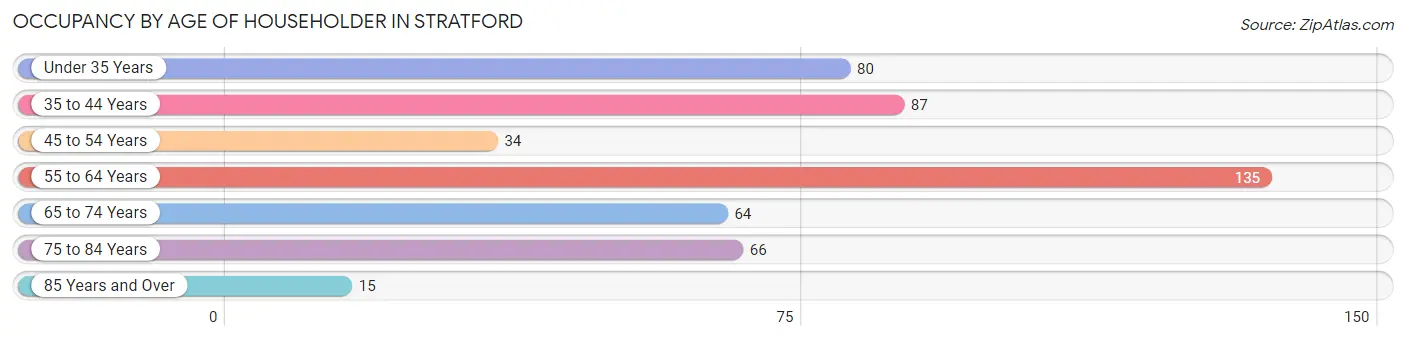
| Age Bracket | # Households | % Households |
| Under 35 Years | 80 | 16.6% |
| 35 to 44 Years | 87 | 18.1% |
| 45 to 54 Years | 34 | 7.1% |
| 55 to 64 Years | 135 | 28.1% |
| 65 to 74 Years | 64 | 13.3% |
| 75 to 84 Years | 66 | 13.7% |
| 85 Years and Over | 15 | 3.1% |
| Total | 481 | 100.0% |
Housing Finances in Stratford
Median Income by Occupancy in Stratford
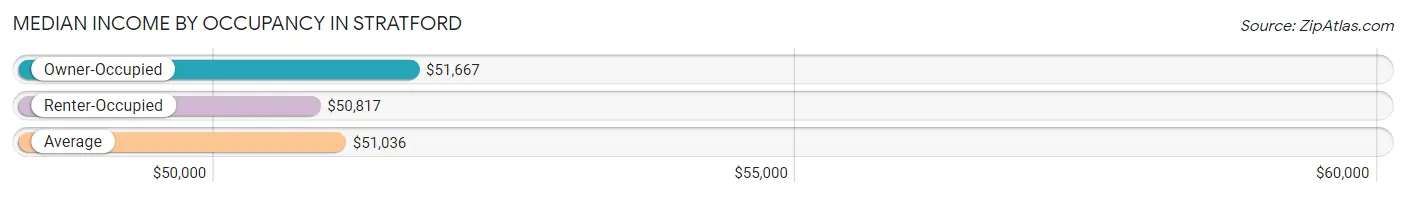
| Occupancy Type | # Households | Median Income |
| Owner-Occupied | 408 (84.8%) | $51,667 |
| Renter-Occupied | 73 (15.2%) | $50,817 |
| Average | 481 (100.0%) | $51,036 |
Occupancy by Householder Income Bracket in Stratford
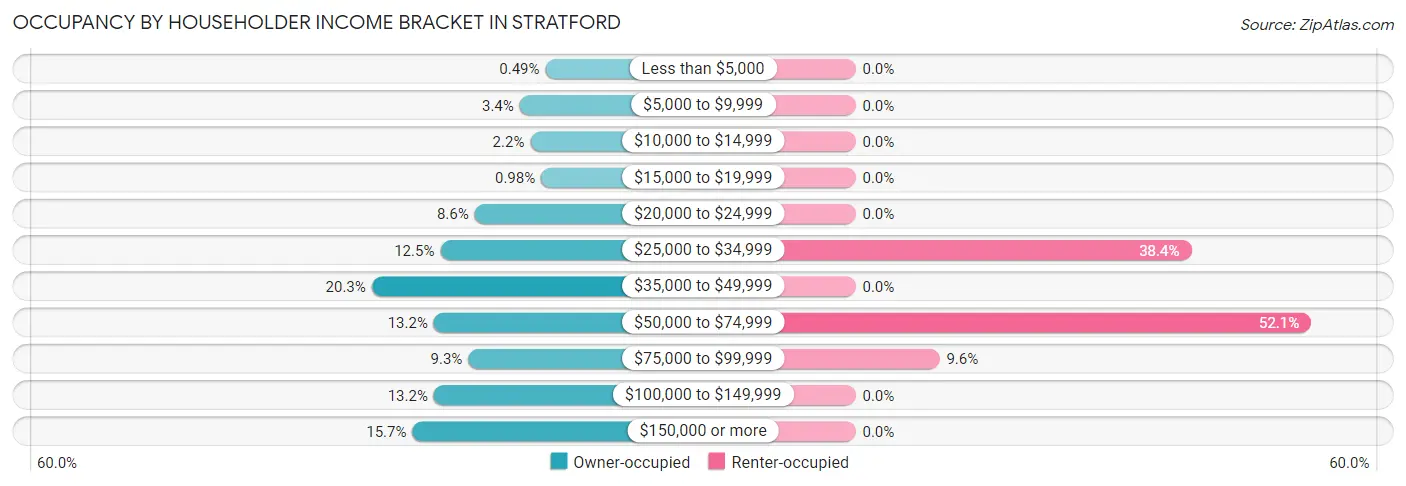
| Income Bracket | Owner-occupied | Renter-occupied |
| Less than $5,000 | 2 (0.5%) | 0 (0.0%) |
| $5,000 to $9,999 | 14 (3.4%) | 0 (0.0%) |
| $10,000 to $14,999 | 9 (2.2%) | 0 (0.0%) |
| $15,000 to $19,999 | 4 (1.0%) | 0 (0.0%) |
| $20,000 to $24,999 | 35 (8.6%) | 0 (0.0%) |
| $25,000 to $34,999 | 51 (12.5%) | 28 (38.4%) |
| $35,000 to $49,999 | 83 (20.3%) | 0 (0.0%) |
| $50,000 to $74,999 | 54 (13.2%) | 38 (52.0%) |
| $75,000 to $99,999 | 38 (9.3%) | 7 (9.6%) |
| $100,000 to $149,999 | 54 (13.2%) | 0 (0.0%) |
| $150,000 or more | 64 (15.7%) | 0 (0.0%) |
| Total | 408 (100.0%) | 73 (100.0%) |
Monthly Housing Cost Tiers in Stratford
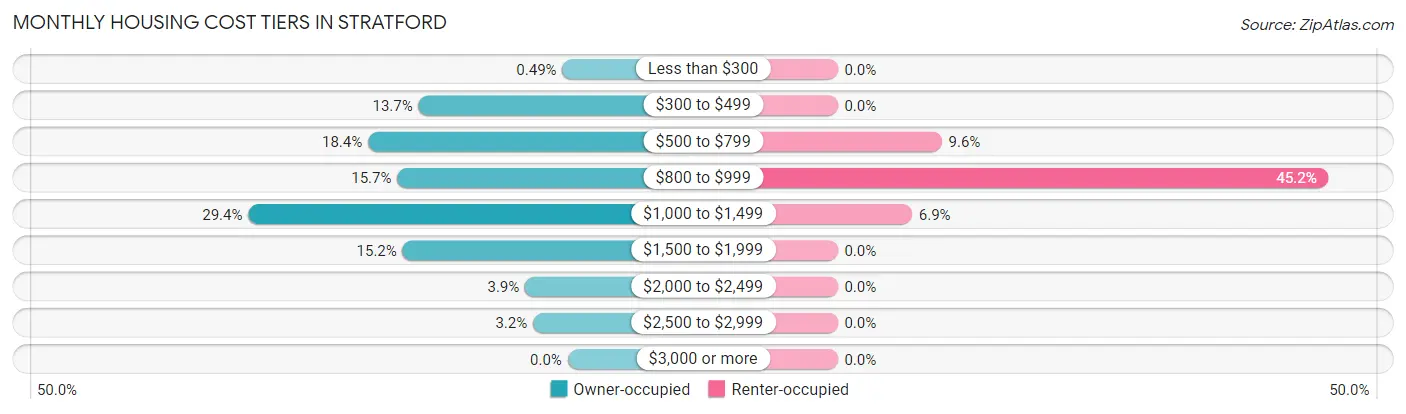
| Monthly Cost | Owner-occupied | Renter-occupied |
| Less than $300 | 2 (0.5%) | 0 (0.0%) |
| $300 to $499 | 56 (13.7%) | 0 (0.0%) |
| $500 to $799 | 75 (18.4%) | 7 (9.6%) |
| $800 to $999 | 64 (15.7%) | 33 (45.2%) |
| $1,000 to $1,499 | 120 (29.4%) | 5 (6.9%) |
| $1,500 to $1,999 | 62 (15.2%) | 0 (0.0%) |
| $2,000 to $2,499 | 16 (3.9%) | 0 (0.0%) |
| $2,500 to $2,999 | 13 (3.2%) | 0 (0.0%) |
| $3,000 or more | 0 (0.0%) | 0 (0.0%) |
| Total | 408 (100.0%) | 73 (100.0%) |
Physical Housing Characteristics in Stratford
Housing Structures in Stratford
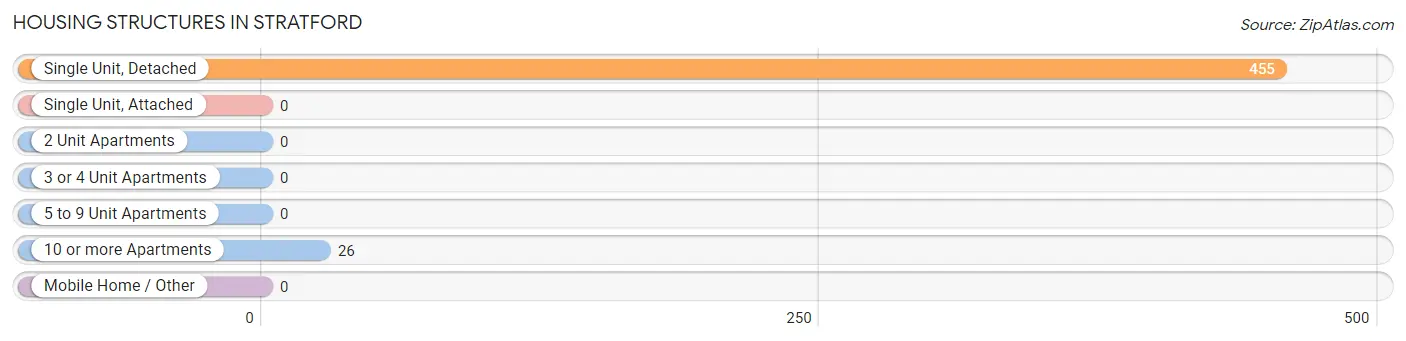
| Structure Type | # Housing Units | % Housing Units |
| Single Unit, Detached | 455 | 94.6% |
| Single Unit, Attached | 0 | 0.0% |
| 2 Unit Apartments | 0 | 0.0% |
| 3 or 4 Unit Apartments | 0 | 0.0% |
| 5 to 9 Unit Apartments | 0 | 0.0% |
| 10 or more Apartments | 26 | 5.4% |
| Mobile Home / Other | 0 | 0.0% |
| Total | 481 | 100.0% |
Housing Structures by Occupancy in Stratford
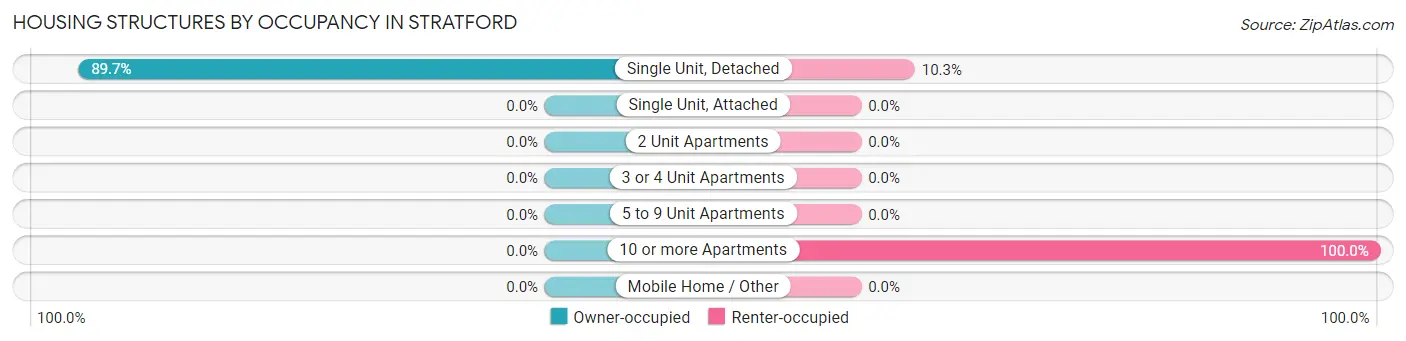
| Structure Type | Owner-occupied | Renter-occupied |
| Single Unit, Detached | 408 (89.7%) | 47 (10.3%) |
| Single Unit, Attached | 0 (0.0%) | 0 (0.0%) |
| 2 Unit Apartments | 0 (0.0%) | 0 (0.0%) |
| 3 or 4 Unit Apartments | 0 (0.0%) | 0 (0.0%) |
| 5 to 9 Unit Apartments | 0 (0.0%) | 0 (0.0%) |
| 10 or more Apartments | 0 (0.0%) | 26 (100.0%) |
| Mobile Home / Other | 0 (0.0%) | 0 (0.0%) |
| Total | 408 (84.8%) | 73 (15.2%) |
Housing Structures by Number of Rooms in Stratford
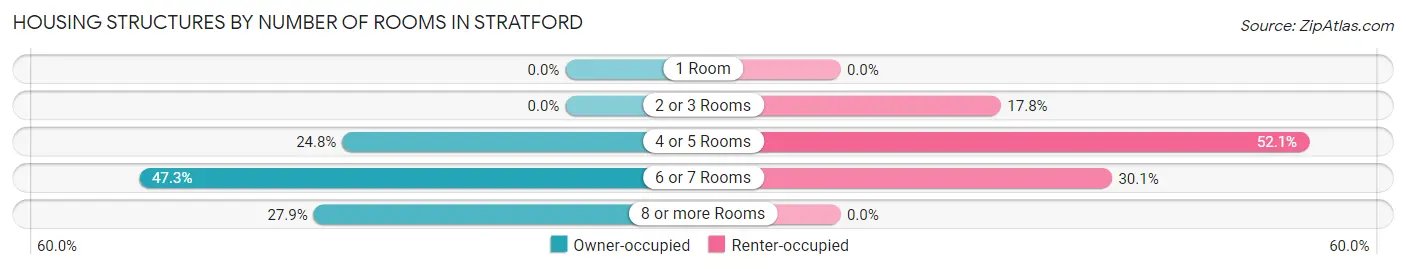
| Number of Rooms | Owner-occupied | Renter-occupied |
| 1 Room | 0 (0.0%) | 0 (0.0%) |
| 2 or 3 Rooms | 0 (0.0%) | 13 (17.8%) |
| 4 or 5 Rooms | 101 (24.7%) | 38 (52.0%) |
| 6 or 7 Rooms | 193 (47.3%) | 22 (30.1%) |
| 8 or more Rooms | 114 (27.9%) | 0 (0.0%) |
| Total | 408 (100.0%) | 73 (100.0%) |
Housing Structure by Heating Type in Stratford
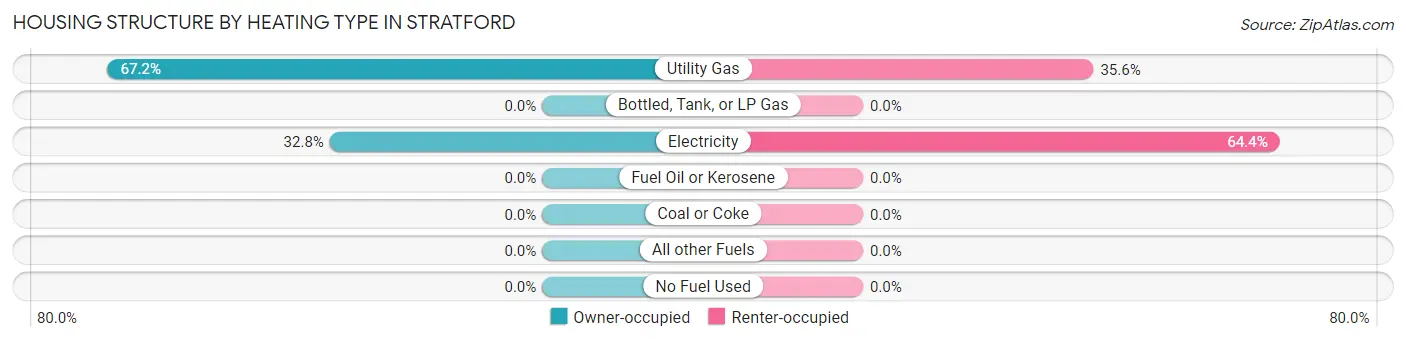
| Heating Type | Owner-occupied | Renter-occupied |
| Utility Gas | 274 (67.2%) | 26 (35.6%) |
| Bottled, Tank, or LP Gas | 0 (0.0%) | 0 (0.0%) |
| Electricity | 134 (32.8%) | 47 (64.4%) |
| Fuel Oil or Kerosene | 0 (0.0%) | 0 (0.0%) |
| Coal or Coke | 0 (0.0%) | 0 (0.0%) |
| All other Fuels | 0 (0.0%) | 0 (0.0%) |
| No Fuel Used | 0 (0.0%) | 0 (0.0%) |
| Total | 408 (100.0%) | 73 (100.0%) |
Household Vehicle Usage in Stratford
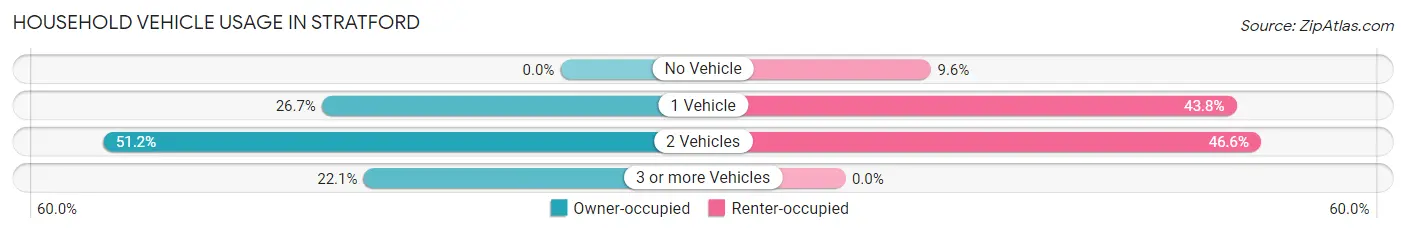
| Vehicles per Household | Owner-occupied | Renter-occupied |
| No Vehicle | 0 (0.0%) | 7 (9.6%) |
| 1 Vehicle | 109 (26.7%) | 32 (43.8%) |
| 2 Vehicles | 209 (51.2%) | 34 (46.6%) |
| 3 or more Vehicles | 90 (22.1%) | 0 (0.0%) |
| Total | 408 (100.0%) | 73 (100.0%) |
Real Estate & Mortgages in Stratford
Real Estate and Mortgage Overview in Stratford
| Characteristic | Without Mortgage | With Mortgage |
| Housing Units | 177 | 231 |
| Median Property Value | $106,400 | $107,200 |
| Median Household Income | $51,806 | $51 |
| Monthly Housing Costs | $676 | $0 |
| Real Estate Taxes | $1,698 | $0 |
Property Value by Mortgage Status in Stratford
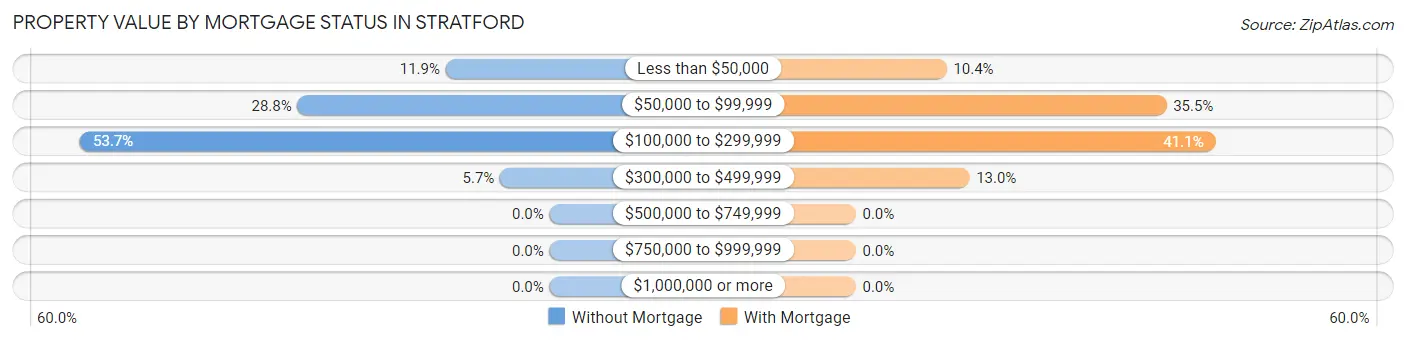
| Property Value | Without Mortgage | With Mortgage |
| Less than $50,000 | 21 (11.9%) | 24 (10.4%) |
| $50,000 to $99,999 | 51 (28.8%) | 82 (35.5%) |
| $100,000 to $299,999 | 95 (53.7%) | 95 (41.1%) |
| $300,000 to $499,999 | 10 (5.7%) | 30 (13.0%) |
| $500,000 to $749,999 | 0 (0.0%) | 0 (0.0%) |
| $750,000 to $999,999 | 0 (0.0%) | 0 (0.0%) |
| $1,000,000 or more | 0 (0.0%) | 0 (0.0%) |
| Total | 177 (100.0%) | 231 (100.0%) |
Household Income by Mortgage Status in Stratford
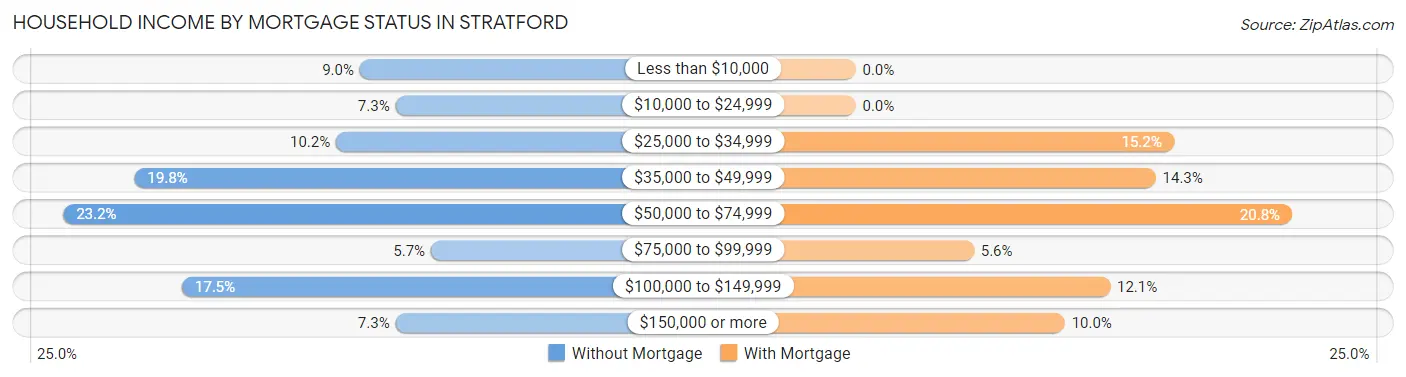
| Household Income | Without Mortgage | With Mortgage |
| Less than $10,000 | 16 (9.0%) | 0 (0.0%) |
| $10,000 to $24,999 | 13 (7.3%) | 0 (0.0%) |
| $25,000 to $34,999 | 18 (10.2%) | 35 (15.1%) |
| $35,000 to $49,999 | 35 (19.8%) | 33 (14.3%) |
| $50,000 to $74,999 | 41 (23.2%) | 48 (20.8%) |
| $75,000 to $99,999 | 10 (5.7%) | 13 (5.6%) |
| $100,000 to $149,999 | 31 (17.5%) | 28 (12.1%) |
| $150,000 or more | 13 (7.3%) | 23 (10.0%) |
| Total | 177 (100.0%) | 231 (100.0%) |
Property Value to Household Income Ratio in Stratford
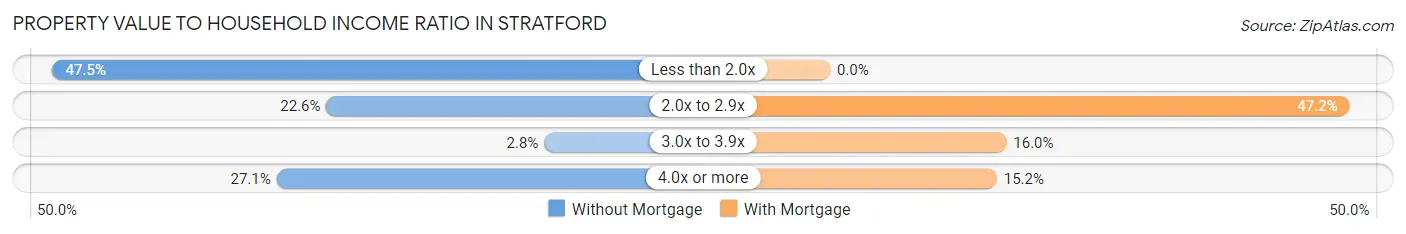
| Value-to-Income Ratio | Without Mortgage | With Mortgage |
| Less than 2.0x | 84 (47.5%) | 0 (0.0%) |
| 2.0x to 2.9x | 40 (22.6%) | 109 (47.2%) |
| 3.0x to 3.9x | 5 (2.8%) | 37 (16.0%) |
| 4.0x or more | 48 (27.1%) | 35 (15.1%) |
| Total | 177 (100.0%) | 231 (100.0%) |
Real Estate Taxes by Mortgage Status in Stratford
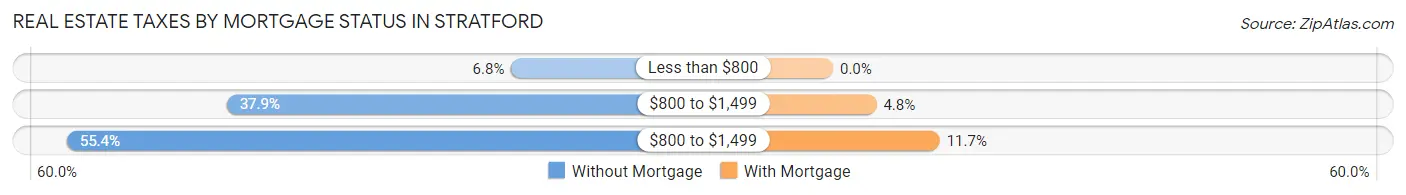
| Property Taxes | Without Mortgage | With Mortgage |
| Less than $800 | 12 (6.8%) | 0 (0.0%) |
| $800 to $1,499 | 67 (37.9%) | 11 (4.8%) |
| $800 to $1,499 | 98 (55.4%) | 27 (11.7%) |
| Total | 177 (100.0%) | 231 (100.0%) |
Health & Disability in Stratford
Health Insurance Coverage by Age in Stratford
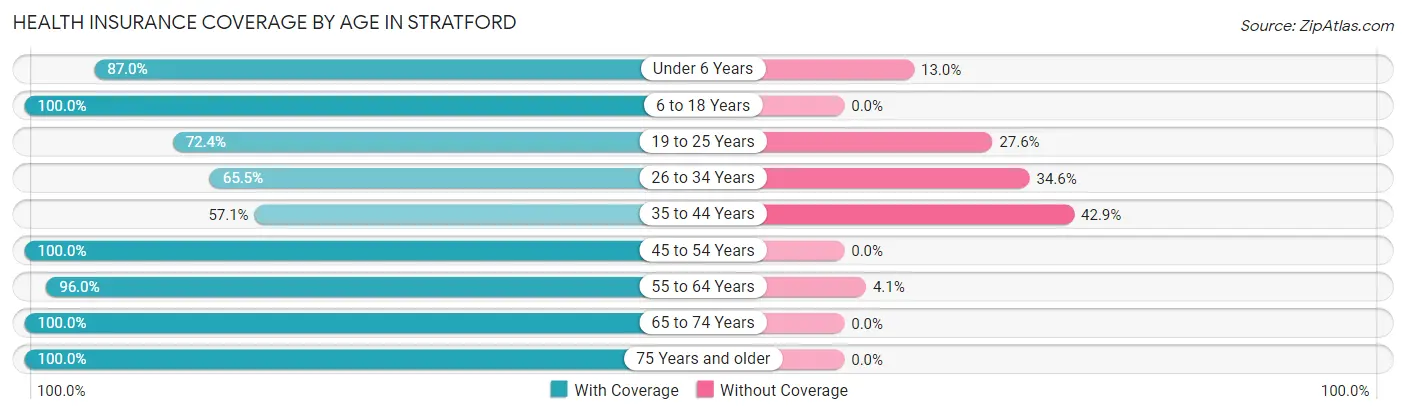
| Age Bracket | With Coverage | Without Coverage |
| Under 6 Years | 87 (87.0%) | 13 (13.0%) |
| 6 to 18 Years | 223 (100.0%) | 0 (0.0%) |
| 19 to 25 Years | 76 (72.4%) | 29 (27.6%) |
| 26 to 34 Years | 72 (65.4%) | 38 (34.5%) |
| 35 to 44 Years | 80 (57.1%) | 60 (42.9%) |
| 45 to 54 Years | 62 (100.0%) | 0 (0.0%) |
| 55 to 64 Years | 237 (96.0%) | 10 (4.1%) |
| 65 to 74 Years | 121 (100.0%) | 0 (0.0%) |
| 75 Years and older | 109 (100.0%) | 0 (0.0%) |
| Total | 1,067 (87.7%) | 150 (12.3%) |
Health Insurance Coverage by Citizenship Status in Stratford
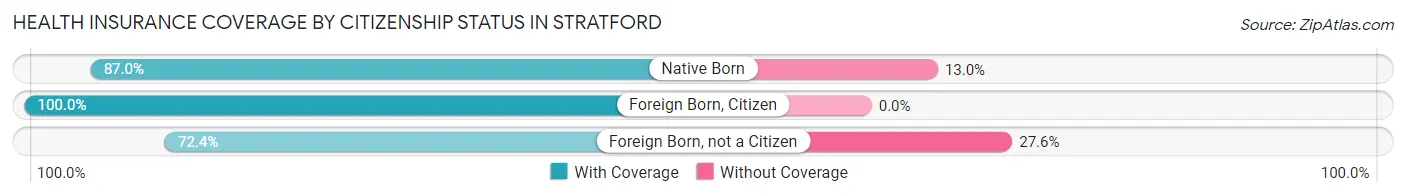
| Citizenship Status | With Coverage | Without Coverage |
| Native Born | 87 (87.0%) | 13 (13.0%) |
| Foreign Born, Citizen | 223 (100.0%) | 0 (0.0%) |
| Foreign Born, not a Citizen | 76 (72.4%) | 29 (27.6%) |
Health Insurance Coverage by Household Income in Stratford
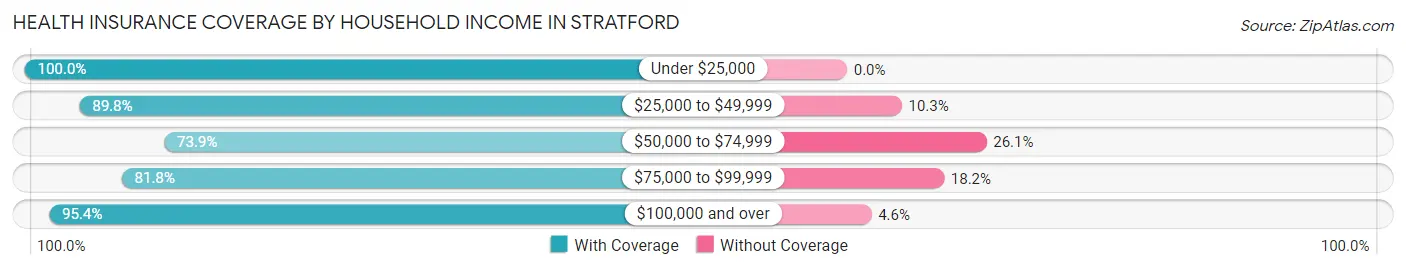
| Household Income | With Coverage | Without Coverage |
| Under $25,000 | 104 (100.0%) | 0 (0.0%) |
| $25,000 to $49,999 | 359 (89.7%) | 41 (10.2%) |
| $50,000 to $74,999 | 195 (73.9%) | 69 (26.1%) |
| $75,000 to $99,999 | 117 (81.8%) | 26 (18.2%) |
| $100,000 and over | 292 (95.4%) | 14 (4.6%) |
Public vs Private Health Insurance Coverage by Age in Stratford
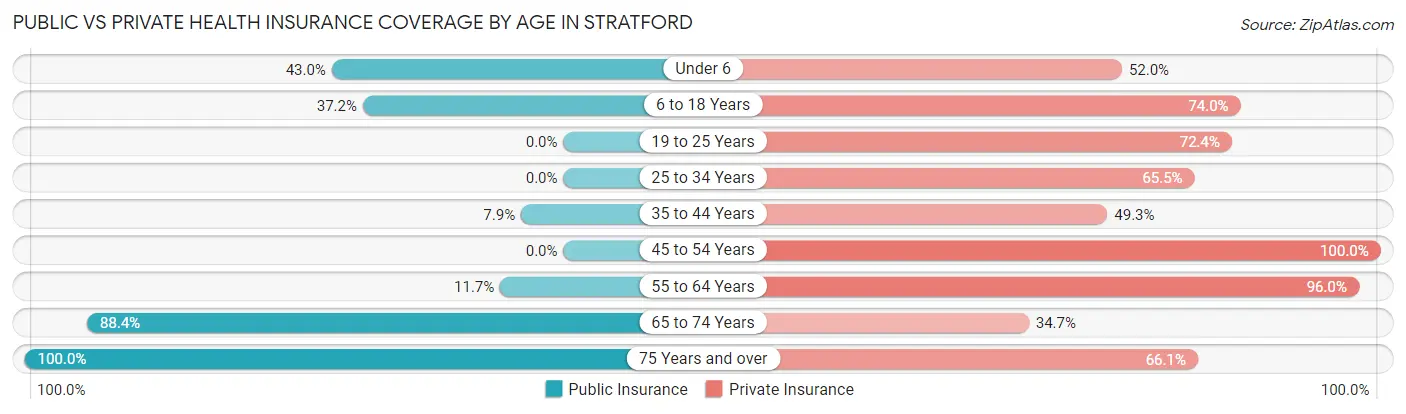
| Age Bracket | Public Insurance | Private Insurance |
| Under 6 | 43 (43.0%) | 52 (52.0%) |
| 6 to 18 Years | 83 (37.2%) | 165 (74.0%) |
| 19 to 25 Years | 0 (0.0%) | 76 (72.4%) |
| 25 to 34 Years | 0 (0.0%) | 72 (65.4%) |
| 35 to 44 Years | 11 (7.9%) | 69 (49.3%) |
| 45 to 54 Years | 0 (0.0%) | 62 (100.0%) |
| 55 to 64 Years | 29 (11.7%) | 237 (96.0%) |
| 65 to 74 Years | 107 (88.4%) | 42 (34.7%) |
| 75 Years and over | 109 (100.0%) | 72 (66.1%) |
| Total | 382 (31.4%) | 847 (69.6%) |
Disability Status by Sex by Age in Stratford
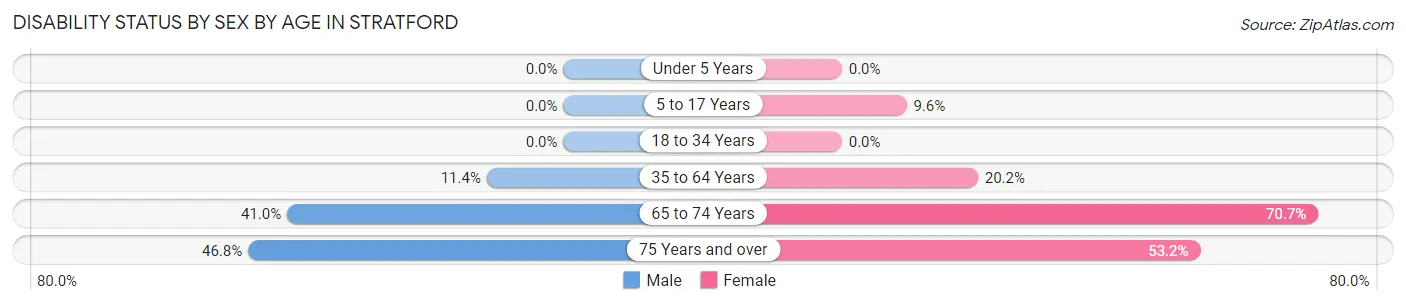
| Age Bracket | Male | Female |
| Under 5 Years | 0 (0.0%) | 0 (0.0%) |
| 5 to 17 Years | 0 (0.0%) | 12 (9.6%) |
| 18 to 34 Years | 0 (0.0%) | 0 (0.0%) |
| 35 to 64 Years | 28 (11.4%) | 41 (20.2%) |
| 65 to 74 Years | 16 (41.0%) | 58 (70.7%) |
| 75 Years and over | 22 (46.8%) | 33 (53.2%) |
Disability Class by Sex by Age in Stratford
Disability Class: Hearing Difficulty
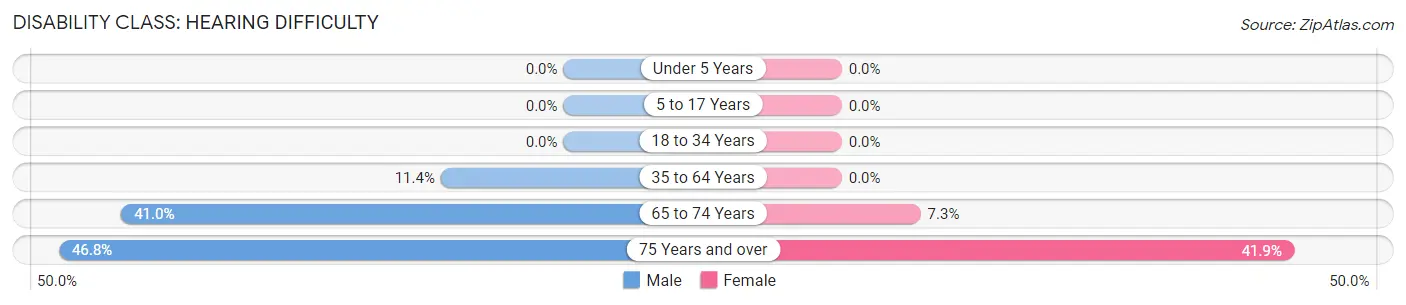
| Age Bracket | Male | Female |
| Under 5 Years | 0 (0.0%) | 0 (0.0%) |
| 5 to 17 Years | 0 (0.0%) | 0 (0.0%) |
| 18 to 34 Years | 0 (0.0%) | 0 (0.0%) |
| 35 to 64 Years | 28 (11.4%) | 0 (0.0%) |
| 65 to 74 Years | 16 (41.0%) | 6 (7.3%) |
| 75 Years and over | 22 (46.8%) | 26 (41.9%) |
Disability Class: Vision Difficulty
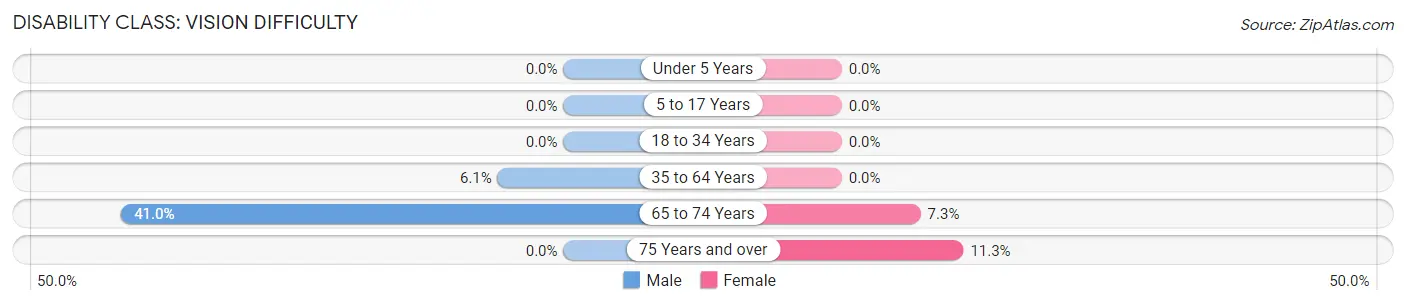
| Age Bracket | Male | Female |
| Under 5 Years | 0 (0.0%) | 0 (0.0%) |
| 5 to 17 Years | 0 (0.0%) | 0 (0.0%) |
| 18 to 34 Years | 0 (0.0%) | 0 (0.0%) |
| 35 to 64 Years | 15 (6.1%) | 0 (0.0%) |
| 65 to 74 Years | 16 (41.0%) | 6 (7.3%) |
| 75 Years and over | 0 (0.0%) | 7 (11.3%) |
Disability Class: Cognitive Difficulty
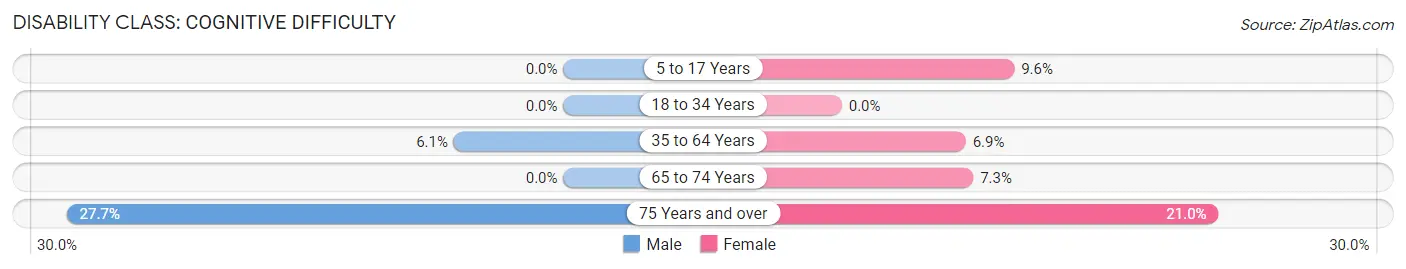
| Age Bracket | Male | Female |
| 5 to 17 Years | 0 (0.0%) | 12 (9.6%) |
| 18 to 34 Years | 0 (0.0%) | 0 (0.0%) |
| 35 to 64 Years | 15 (6.1%) | 14 (6.9%) |
| 65 to 74 Years | 0 (0.0%) | 6 (7.3%) |
| 75 Years and over | 13 (27.7%) | 13 (21.0%) |
Disability Class: Ambulatory Difficulty
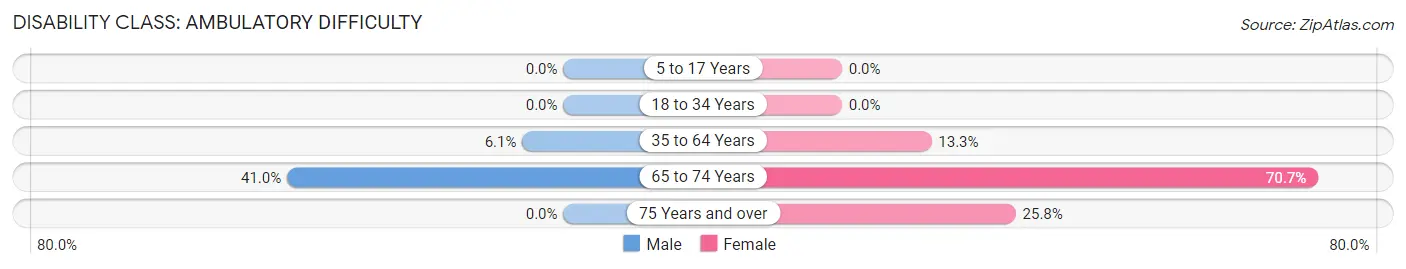
| Age Bracket | Male | Female |
| 5 to 17 Years | 0 (0.0%) | 0 (0.0%) |
| 18 to 34 Years | 0 (0.0%) | 0 (0.0%) |
| 35 to 64 Years | 15 (6.1%) | 27 (13.3%) |
| 65 to 74 Years | 16 (41.0%) | 58 (70.7%) |
| 75 Years and over | 0 (0.0%) | 16 (25.8%) |
Disability Class: Self-Care Difficulty
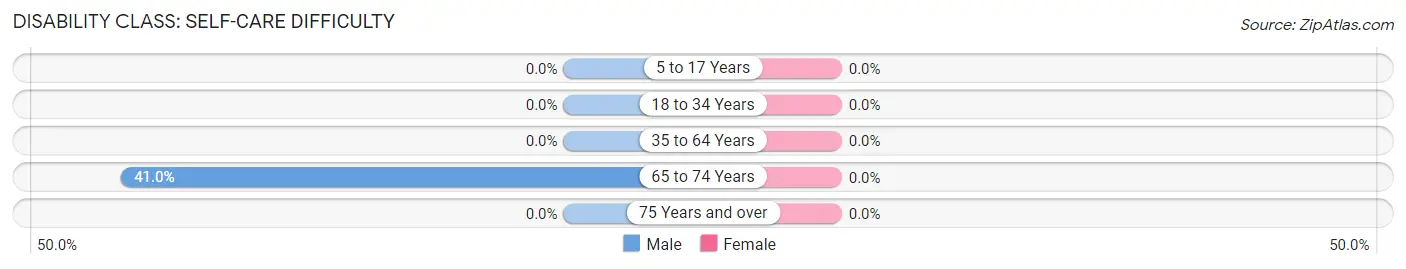
| Age Bracket | Male | Female |
| 5 to 17 Years | 0 (0.0%) | 0 (0.0%) |
| 18 to 34 Years | 0 (0.0%) | 0 (0.0%) |
| 35 to 64 Years | 0 (0.0%) | 0 (0.0%) |
| 65 to 74 Years | 16 (41.0%) | 0 (0.0%) |
| 75 Years and over | 0 (0.0%) | 0 (0.0%) |
Technology Access in Stratford
Computing Device Access in Stratford
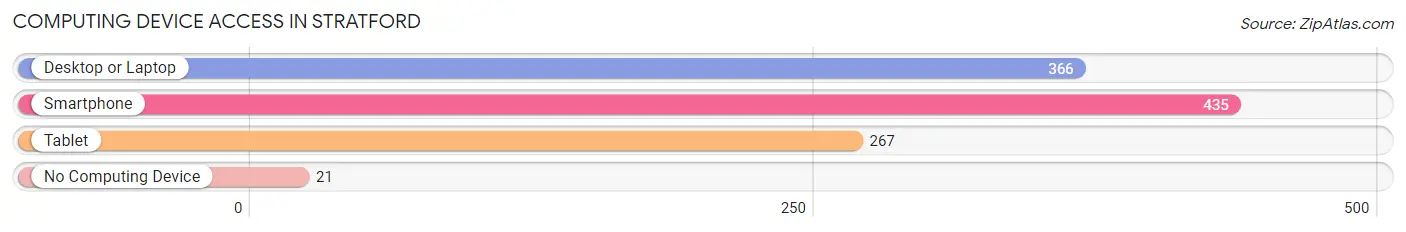
| Device Type | # Households | % Households |
| Desktop or Laptop | 366 | 76.1% |
| Smartphone | 435 | 90.4% |
| Tablet | 267 | 55.5% |
| No Computing Device | 21 | 4.4% |
| Total | 481 | 100.0% |
Internet Access in Stratford
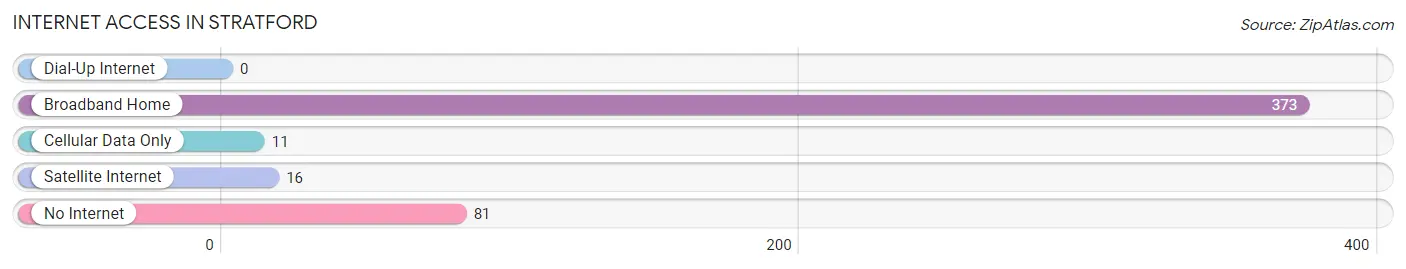
| Internet Type | # Households | % Households |
| Dial-Up Internet | 0 | 0.0% |
| Broadband Home | 373 | 77.5% |
| Cellular Data Only | 11 | 2.3% |
| Satellite Internet | 16 | 3.3% |
| No Internet | 81 | 16.8% |
| Total | 481 | 100.0% |
Stratford Summary
Stratford is a small town located in the Texas Panhandle, in the county of Sherman. It is situated on the banks of the Red River, and is the county seat of Sherman County. The town was founded in 1891, and was named after Stratford-on-Avon, England. Stratford is located in the High Plains region of Texas, and is known for its agricultural production, particularly of cotton and wheat.
History
Stratford was founded in 1891 by a group of settlers from the nearby town of Sherman. The settlers chose the name Stratford in honor of Stratford-on-Avon, England. The town was officially incorporated in 1892, and the first post office was established in 1893.
The town grew rapidly in the early years, and by 1900, the population had grown to over 1,000. The town was a major center for cotton production, and the local economy was largely based on agriculture. The town also had a number of businesses, including a bank, a hotel, a newspaper, and a variety of stores.
In the early 1900s, the town was hit hard by a series of droughts and dust storms, which caused a significant decline in the local economy. The population dropped to just over 500 by 1930.
The town began to recover in the 1940s, and the population grew to over 1,000 by 1950. The local economy was still largely based on agriculture, but the town also had a number of other businesses, including a cotton gin, a feed mill, and a lumber yard.
In the late 1950s, the town was hit hard by another drought, and the population dropped to just over 500 by 1960. The local economy continued to struggle, and the population remained at around 500 until the late 1970s.
In the 1980s, the town began to experience a resurgence, and the population grew to over 1,000 by 1990. The local economy was still largely based on agriculture, but the town also had a number of other businesses, including a feed mill, a lumber yard, and a number of retail stores.
Geography
Stratford is located in the Texas Panhandle, in the county of Sherman. It is situated on the banks of the Red River, and is the county seat of Sherman County. The town is located in the High Plains region of Texas, and is known for its agricultural production, particularly of cotton and wheat.
The town is located at an elevation of 1,845 feet (562 meters), and has an area of 1.3 square miles (3.4 square kilometers). The climate is semi-arid, with hot summers and mild winters. The average annual temperature is 64°F (18°C), and the average annual precipitation is 19.5 inches (49.5 centimeters).
Economy
The local economy is largely based on agriculture, particularly cotton and wheat production. The town also has a number of other businesses, including a feed mill, a lumber yard, and a number of retail stores.
Demographics
As of the 2010 census, the population of Stratford was 1,072. The racial makeup of the town was 94.3% White, 0.7% African American, 0.3% Native American, 0.2% Asian, 0.1% Pacific Islander, 2.7% from other races, and 1.9% from two or more races. Hispanic or Latino of any race were 5.2% of the population.
The median household income in Stratford was $37,500, and the median family income was $45,000. The per capita income was $18,000. About 11.3% of the population was below the poverty line.
Common Questions
What is Per Capita Income in Stratford?
Per Capita income in Stratford is $32,573.
What is the Median Family Income in Stratford?
Median Family Income in Stratford is $54,712.
What is the Median Household income in Stratford?
Median Household Income in Stratford is $51,036.
What is Income or Wage Gap in Stratford?
Income or Wage Gap in Stratford is 38.5%.
Women in Stratford earn 61.5 cents for every dollar earned by a man.
What is Inequality or Gini Index in Stratford?
Inequality or Gini Index in Stratford is 0.47.
What is the Total Population of Stratford?
Total Population of Stratford is 1,251.
What is the Total Male Population of Stratford?
Total Male Population of Stratford is 549.
What is the Total Female Population of Stratford?
Total Female Population of Stratford is 702.
What is the Ratio of Males per 100 Females in Stratford?
There are 78.21 Males per 100 Females in Stratford.
What is the Ratio of Females per 100 Males in Stratford?
There are 127.87 Females per 100 Males in Stratford.
What is the Median Population Age in Stratford?
Median Population Age in Stratford is 38.4 Years.
What is the Average Family Size in Stratford
Average Family Size in Stratford is 3.0 People.
What is the Average Household Size in Stratford
Average Household Size in Stratford is 2.5 People.
How Large is the Labor Force in Stratford?
There are 630 People in the Labor Forcein in Stratford.
What is the Percentage of People in the Labor Force in Stratford?
64.3% of People are in the Labor Force in Stratford.
What is the Unemployment Rate in Stratford?
Unemployment Rate in Stratford is 2.5%.