Spur, TX Map & Demographics
Spur Map
Spur Overview
$20,324
PER CAPITA INCOME
$61,458
AVG FAMILY INCOME
$37,414
AVG HOUSEHOLD INCOME
26.4%
WAGE / INCOME GAP [ % ]
73.6¢/ $1
WAGE / INCOME GAP [ $ ]
0.43
INEQUALITY / GINI INDEX
778
TOTAL POPULATION
365
MALE POPULATION
413
FEMALE POPULATION
88.38
MALES / 100 FEMALES
113.15
FEMALES / 100 MALES
36.2
MEDIAN AGE
3.8
AVG FAMILY SIZE
2.4
AVG HOUSEHOLD SIZE
284
LABOR FORCE [ PEOPLE ]
44.1%
PERCENT IN LABOR FORCE
18.3%
UNEMPLOYMENT RATE
Spur Zip Codes
Spur Area Codes
Income in Spur
Income Overview in Spur
Per Capita Income in Spur is $20,324, while median incomes of families and households are $61,458 and $37,414 respectively.
| Characteristic | Number | Measure |
| Per Capita Income | 778 | $20,324 |
| Median Family Income | 145 | $61,458 |
| Mean Family Income | 145 | $73,447 |
| Median Household Income | 304 | $37,414 |
| Mean Household Income | 304 | $50,076 |
| Income Deficit | 145 | $0 |
| Wage / Income Gap (%) | 778 | 26.40% |
| Wage / Income Gap ($) | 778 | 73.60¢ per $1 |
| Gini / Inequality Index | 778 | 0.43 |
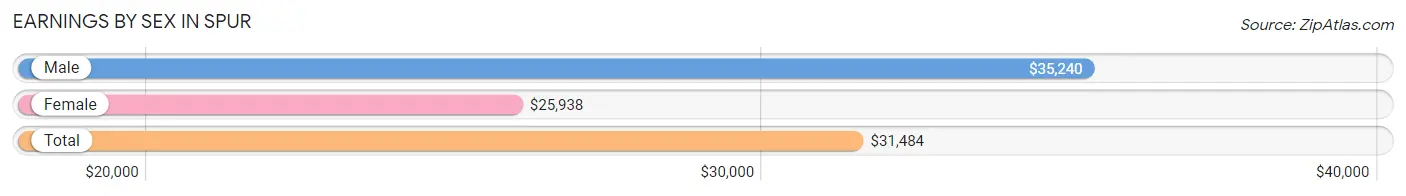
Earnings by Sex in Spur
Average Earnings in Spur are $31,484, $35,240 for men and $25,938 for women, a difference of 26.4%.
| Sex | Number | Average Earnings |
| Male | 165 (55.2%) | $35,240 |
| Female | 134 (44.8%) | $25,938 |
| Total | 299 (100.0%) | $31,484 |
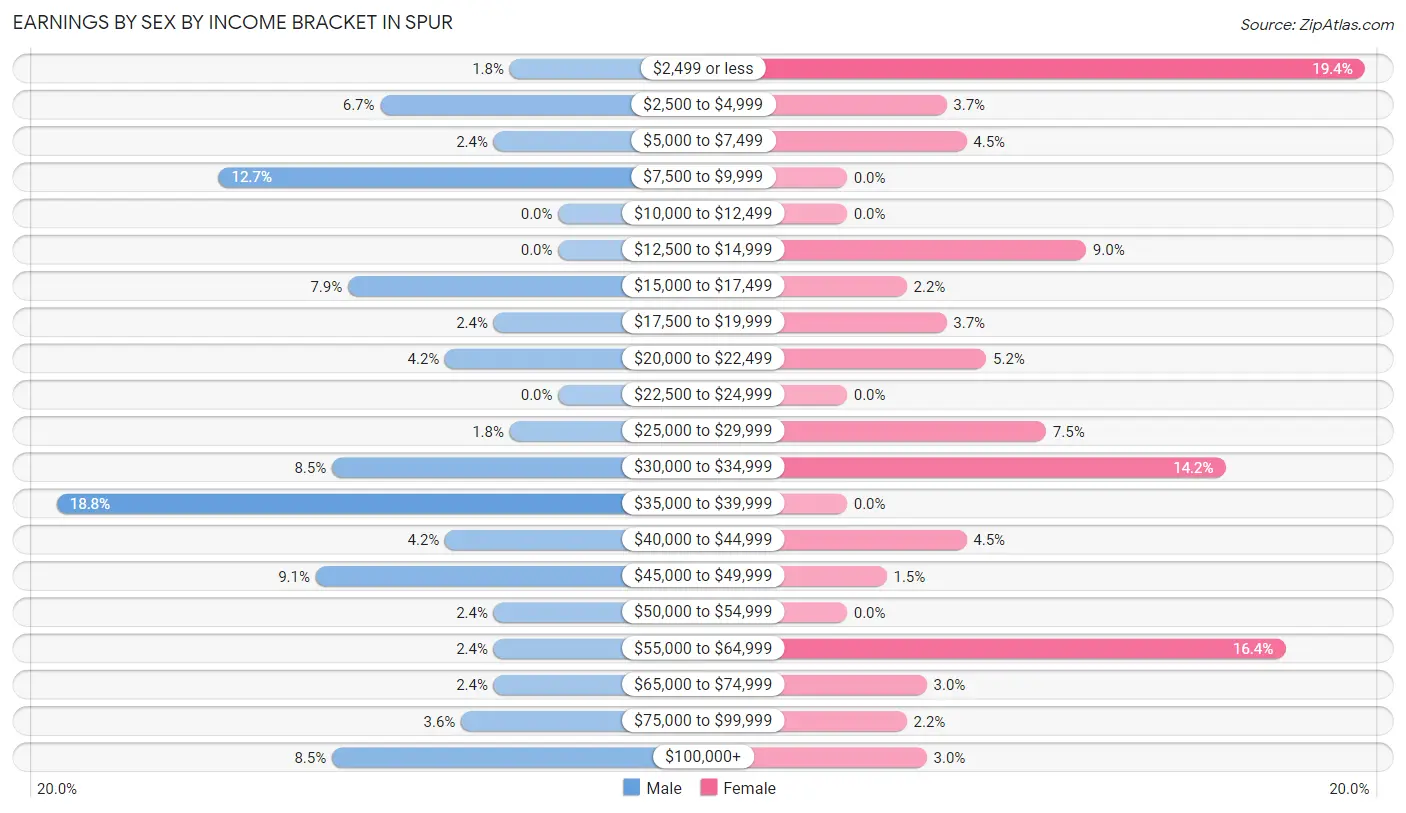
Earnings by Sex by Income Bracket in Spur
The most common earnings brackets in Spur are $35,000 to $39,999 for men (31 | 18.8%) and $2,499 or less for women (26 | 19.4%).
| Income | Male | Female |
| $2,499 or less | 3 (1.8%) | 26 (19.4%) |
| $2,500 to $4,999 | 11 (6.7%) | 5 (3.7%) |
| $5,000 to $7,499 | 4 (2.4%) | 6 (4.5%) |
| $7,500 to $9,999 | 21 (12.7%) | 0 (0.0%) |
| $10,000 to $12,499 | 0 (0.0%) | 0 (0.0%) |
| $12,500 to $14,999 | 0 (0.0%) | 12 (9.0%) |
| $15,000 to $17,499 | 13 (7.9%) | 3 (2.2%) |
| $17,500 to $19,999 | 4 (2.4%) | 5 (3.7%) |
| $20,000 to $22,499 | 7 (4.2%) | 7 (5.2%) |
| $22,500 to $24,999 | 0 (0.0%) | 0 (0.0%) |
| $25,000 to $29,999 | 3 (1.8%) | 10 (7.5%) |
| $30,000 to $34,999 | 14 (8.5%) | 19 (14.2%) |
| $35,000 to $39,999 | 31 (18.8%) | 0 (0.0%) |
| $40,000 to $44,999 | 7 (4.2%) | 6 (4.5%) |
| $45,000 to $49,999 | 15 (9.1%) | 2 (1.5%) |
| $50,000 to $54,999 | 4 (2.4%) | 0 (0.0%) |
| $55,000 to $64,999 | 4 (2.4%) | 22 (16.4%) |
| $65,000 to $74,999 | 4 (2.4%) | 4 (3.0%) |
| $75,000 to $99,999 | 6 (3.6%) | 3 (2.2%) |
| $100,000+ | 14 (8.5%) | 4 (3.0%) |
| Total | 165 (100.0%) | 134 (100.0%) |
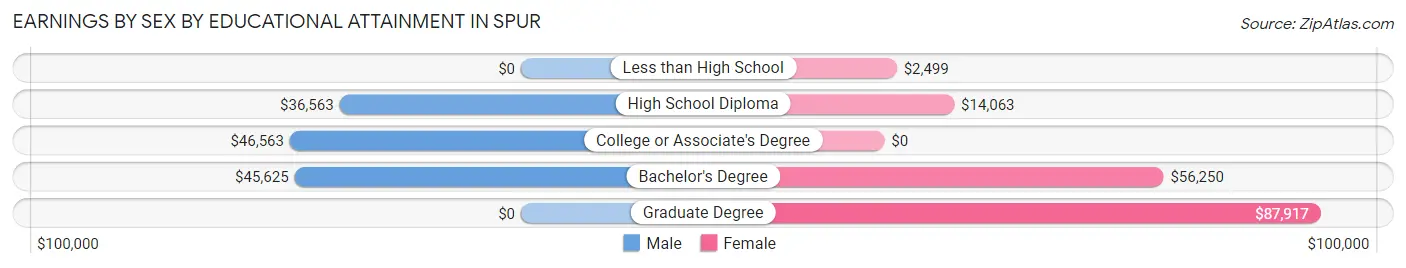
Earnings by Sex by Educational Attainment in Spur
Average earnings in Spur are $39,500 for men and $26,250 for women, a difference of 33.5%. Men with an educational attainment of college or associate's degree enjoy the highest average annual earnings of $46,563, while those with high school diploma education earn the least with $36,563. Women with an educational attainment of graduate degree earn the most with the average annual earnings of $87,917, while those with less than high school education have the smallest earnings of $2,499.
| Educational Attainment | Male Income | Female Income |
| Less than High School | - | - |
| High School Diploma | $36,563 | $14,063 |
| College or Associate's Degree | $46,563 | $0 |
| Bachelor's Degree | $45,625 | $56,250 |
| Graduate Degree | - | - |
| Total | $39,500 | $26,250 |
Family Income in Spur
Family Income Brackets in Spur
According to the Spur family income data, there are 35 families falling into the $35,000 to $49,999 income range, which is the most common income bracket and makes up 24.1% of all families.
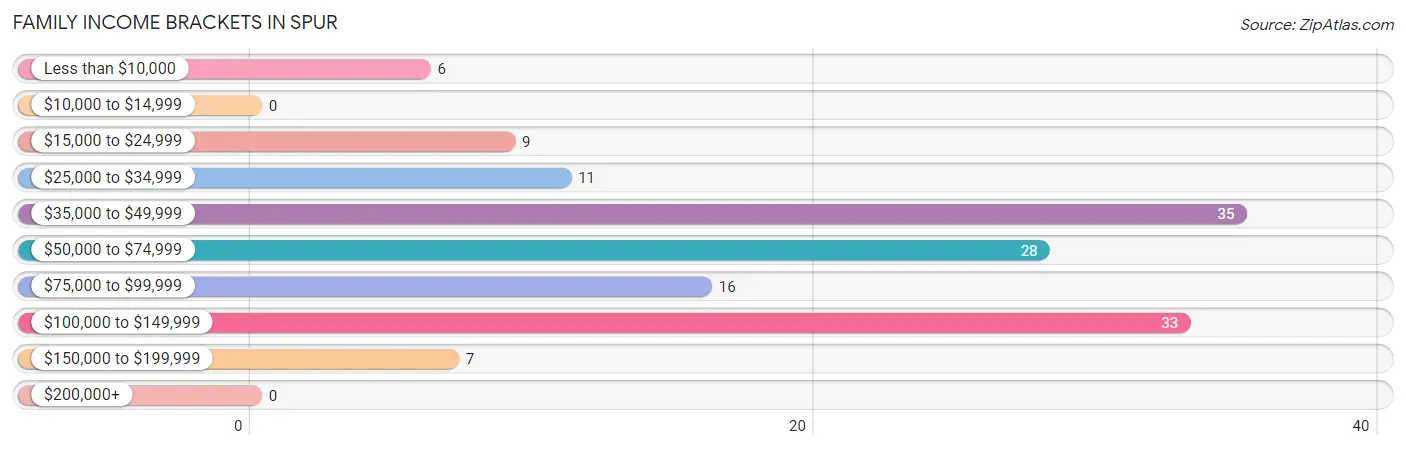
| Income Bracket | # Families | % Families |
| Less than $10,000 | 6 | 4.1% |
| $10,000 to $14,999 | 0 | 0.0% |
| $15,000 to $24,999 | 9 | 6.2% |
| $25,000 to $34,999 | 11 | 7.6% |
| $35,000 to $49,999 | 35 | 24.1% |
| $50,000 to $74,999 | 28 | 19.3% |
| $75,000 to $99,999 | 16 | 11.0% |
| $100,000 to $149,999 | 33 | 22.8% |
| $150,000 to $199,999 | 7 | 4.8% |
| $200,000+ | 0 | 0.0% |
Family Income by Famaliy Size in Spur
5-person families (25 | 17.2%) account for the highest median family income in Spur with $147,768 per family, while 5-person families (25 | 17.2%) have the highest median income of $29,554 per family member.
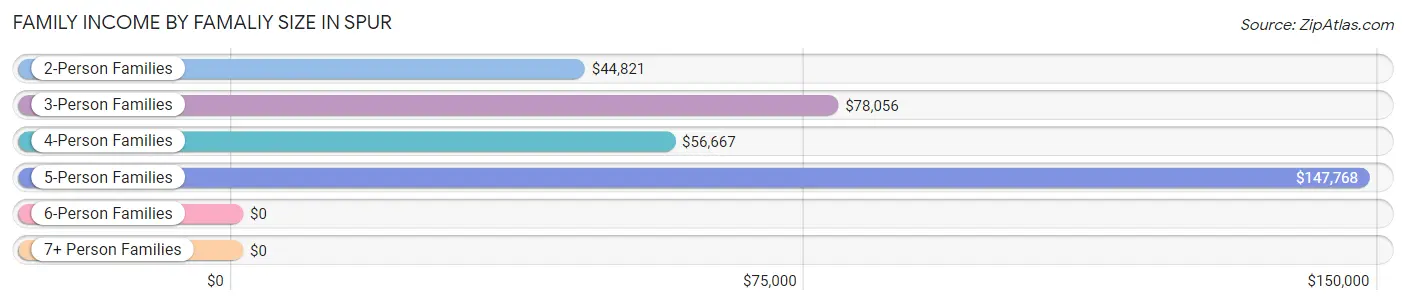
| Income Bracket | # Families | Median Income |
| 2-Person Families | 77 (53.1%) | $44,821 |
| 3-Person Families | 30 (20.7%) | $78,056 |
| 4-Person Families | 10 (6.9%) | $56,667 |
| 5-Person Families | 25 (17.2%) | $147,768 |
| 6-Person Families | 0 (0.0%) | $0 |
| 7+ Person Families | 3 (2.1%) | $0 |
| Total | 145 (100.0%) | $61,458 |
Family Income by Number of Earners in Spur
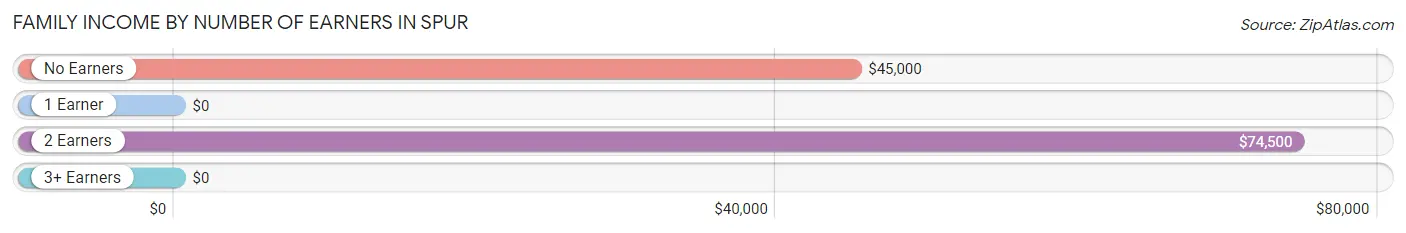
| Number of Earners | # Families | Median Income |
| No Earners | 38 (26.2%) | $45,000 |
| 1 Earner | 46 (31.7%) | $0 |
| 2 Earners | 60 (41.4%) | $74,500 |
| 3+ Earners | 1 (0.7%) | $0 |
| Total | 145 (100.0%) | $61,458 |
Household Income in Spur
Household Income Brackets in Spur
With 65 households falling in the category, the $35,000 to $49,999 income range is the most frequent in Spur, accounting for 21.4% of all households.
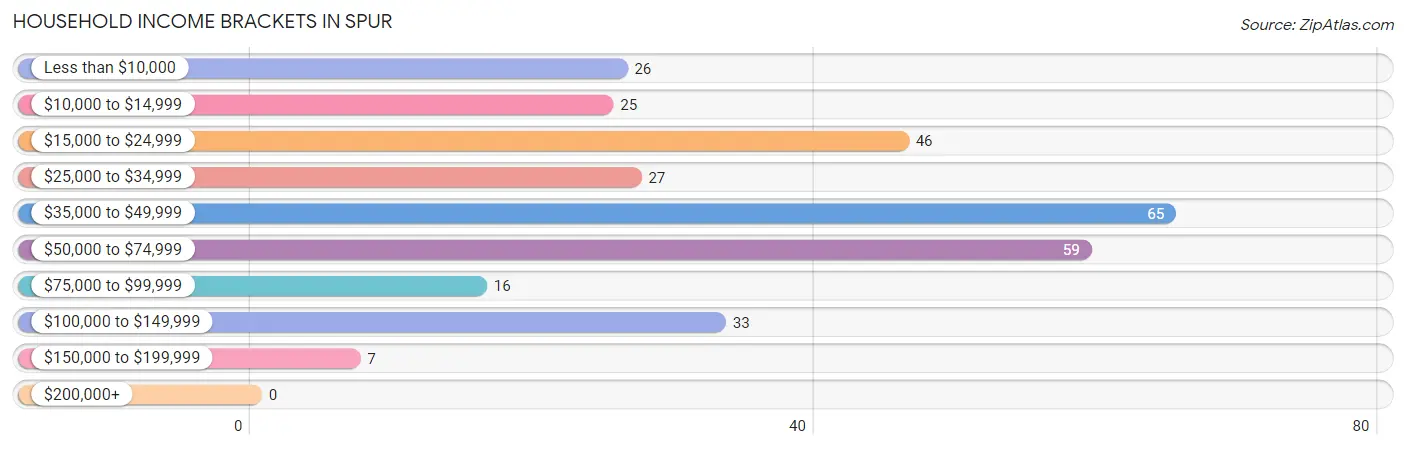
| Income Bracket | # Households | % Households |
| Less than $10,000 | 26 | 8.6% |
| $10,000 to $14,999 | 25 | 8.2% |
| $15,000 to $24,999 | 46 | 15.1% |
| $25,000 to $34,999 | 27 | 8.9% |
| $35,000 to $49,999 | 65 | 21.4% |
| $50,000 to $74,999 | 59 | 19.4% |
| $75,000 to $99,999 | 16 | 5.3% |
| $100,000 to $149,999 | 33 | 10.9% |
| $150,000 to $199,999 | 7 | 2.3% |
| $200,000+ | 0 | 0.0% |
Household Income by Householder Age in Spur
The median household income in Spur is $37,414, with the highest median household income of $65,625 found in the 25 to 44 years age bracket for the primary householder. A total of 75 households (24.7%) fall into this category. Meanwhile, the 15 to 24 years age bracket for the primary householder has the lowest median household income of $0, with 27 households (8.9%) in this group.
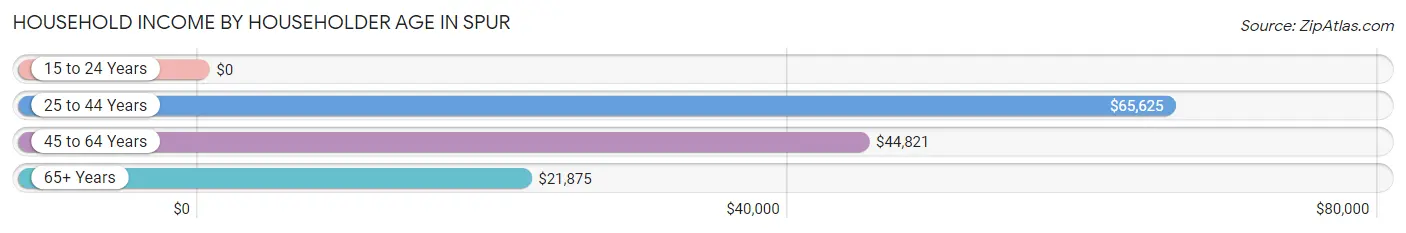
| Income Bracket | # Households | Median Income |
| 15 to 24 Years | 27 (8.9%) | $0 |
| 25 to 44 Years | 75 (24.7%) | $65,625 |
| 45 to 64 Years | 89 (29.3%) | $44,821 |
| 65+ Years | 113 (37.2%) | $21,875 |
| Total | 304 (100.0%) | $37,414 |
Poverty in Spur
Income Below Poverty by Sex and Age in Spur
With 16.4% poverty level for males and 16.7% for females among the residents of Spur, 35 to 44 year old males and 75 year old and over females are the most vulnerable to poverty, with 11 males (68.8%) and 25 females (39.7%) in their respective age groups living below the poverty level.
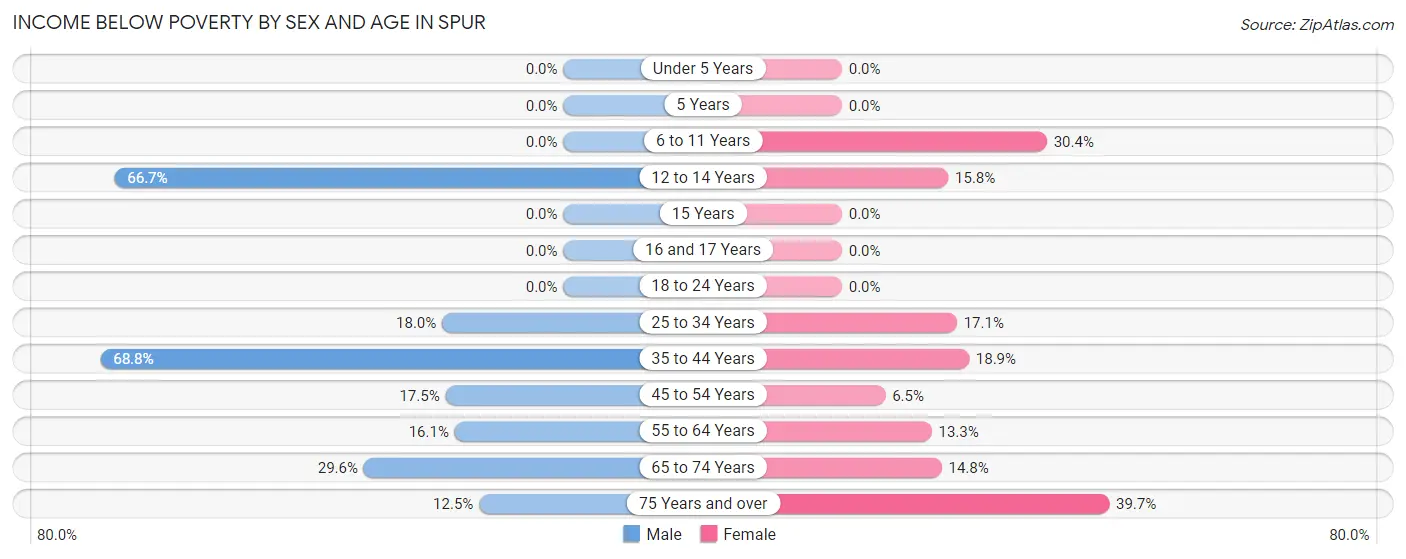
| Age Bracket | Male | Female |
| Under 5 Years | 0 (0.0%) | 0 (0.0%) |
| 5 Years | 0 (0.0%) | 0 (0.0%) |
| 6 to 11 Years | 0 (0.0%) | 7 (30.4%) |
| 12 to 14 Years | 4 (66.7%) | 3 (15.8%) |
| 15 Years | 0 (0.0%) | 0 (0.0%) |
| 16 and 17 Years | 0 (0.0%) | 0 (0.0%) |
| 18 to 24 Years | 0 (0.0%) | 0 (0.0%) |
| 25 to 34 Years | 9 (18.0%) | 14 (17.1%) |
| 35 to 44 Years | 11 (68.8%) | 10 (18.9%) |
| 45 to 54 Years | 7 (17.5%) | 2 (6.5%) |
| 55 to 64 Years | 10 (16.1%) | 4 (13.3%) |
| 65 to 74 Years | 8 (29.6%) | 4 (14.8%) |
| 75 Years and over | 3 (12.5%) | 25 (39.7%) |
| Total | 52 (16.4%) | 69 (16.7%) |
Income Above Poverty by Sex and Age in Spur
According to the poverty statistics in Spur, males aged under 5 years and females aged under 5 years are the age groups that are most secure financially, with 100.0% of males and 100.0% of females in these age groups living above the poverty line.
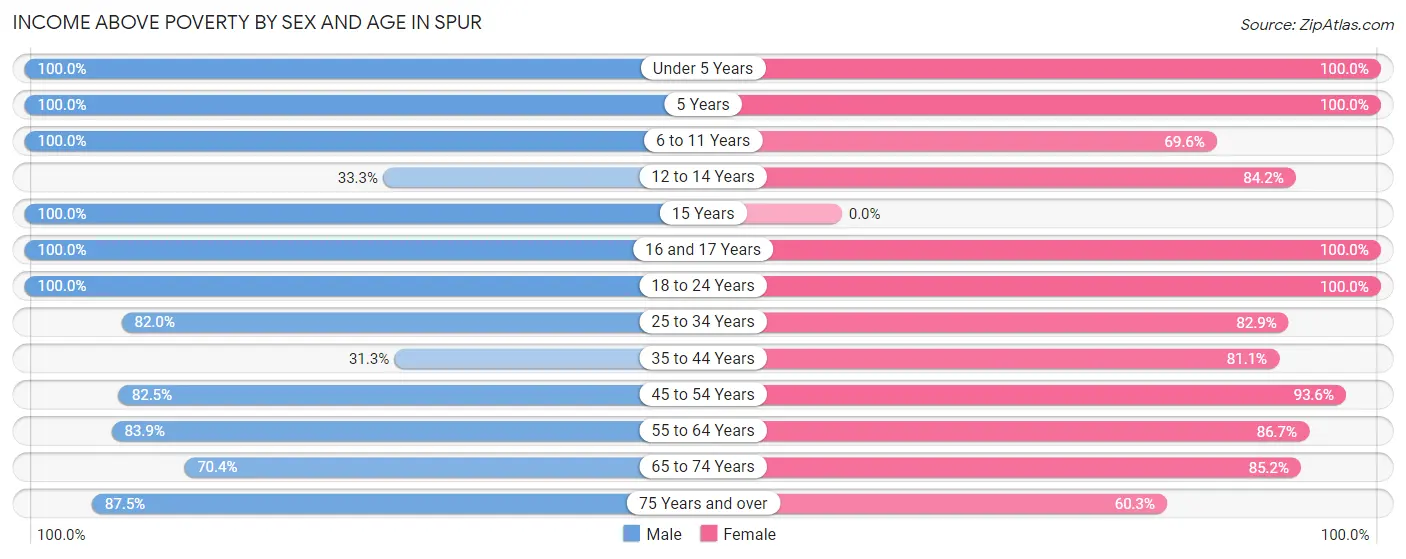
| Age Bracket | Male | Female |
| Under 5 Years | 21 (100.0%) | 44 (100.0%) |
| 5 Years | 5 (100.0%) | 10 (100.0%) |
| 6 to 11 Years | 3 (100.0%) | 16 (69.6%) |
| 12 to 14 Years | 2 (33.3%) | 16 (84.2%) |
| 15 Years | 3 (100.0%) | 0 (0.0%) |
| 16 and 17 Years | 12 (100.0%) | 11 (100.0%) |
| 18 to 24 Years | 48 (100.0%) | 20 (100.0%) |
| 25 to 34 Years | 41 (82.0%) | 68 (82.9%) |
| 35 to 44 Years | 5 (31.2%) | 43 (81.1%) |
| 45 to 54 Years | 33 (82.5%) | 29 (93.5%) |
| 55 to 64 Years | 52 (83.9%) | 26 (86.7%) |
| 65 to 74 Years | 19 (70.4%) | 23 (85.2%) |
| 75 Years and over | 21 (87.5%) | 38 (60.3%) |
| Total | 265 (83.6%) | 344 (83.3%) |
Income Below Poverty Among Married-Couple Families in Spur
The poverty statistics for married-couple families in Spur show that 5.4% or 5 of the total 92 families live below the poverty line. Families with 3 or 4 children have the highest poverty rate of 12.0%, comprising of 3 families. On the other hand, families with 1 or 2 children have the lowest poverty rate of 0.0%, which includes 0 families.
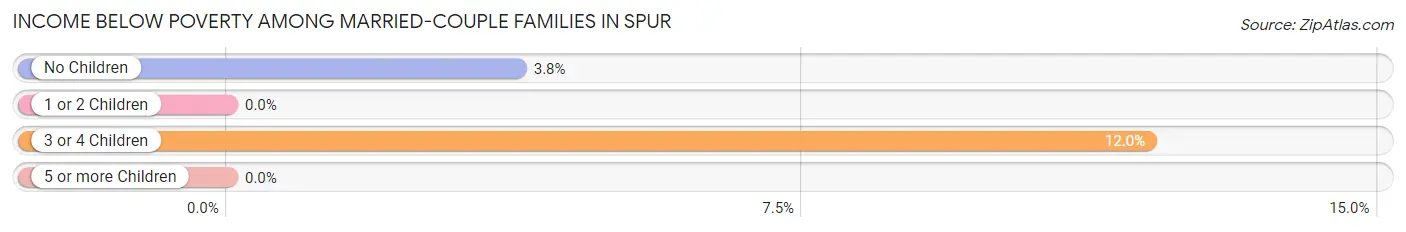
| Children | Above Poverty | Below Poverty |
| No Children | 51 (96.2%) | 2 (3.8%) |
| 1 or 2 Children | 14 (100.0%) | 0 (0.0%) |
| 3 or 4 Children | 22 (88.0%) | 3 (12.0%) |
| 5 or more Children | 0 (0.0%) | 0 (0.0%) |
| Total | 87 (94.6%) | 5 (5.4%) |
Income Below Poverty Among Single-Parent Households in Spur
According to the poverty data in Spur, 17.4% or 4 single-father households and 6.7% or 2 single-mother households are living below the poverty line. Among single-father households, those with no children have the highest poverty rate, with 4 households (36.4%) experiencing poverty. Likewise, among single-mother households, those with 1 or 2 children have the highest poverty rate, with 2 households (8.3%) falling below the poverty line.
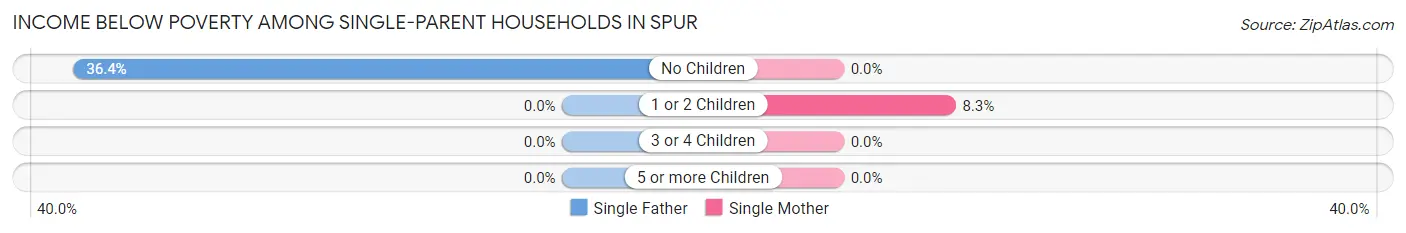
| Children | Single Father | Single Mother |
| No Children | 4 (36.4%) | 0 (0.0%) |
| 1 or 2 Children | 0 (0.0%) | 2 (8.3%) |
| 3 or 4 Children | 0 (0.0%) | 0 (0.0%) |
| 5 or more Children | 0 (0.0%) | 0 (0.0%) |
| Total | 4 (17.4%) | 2 (6.7%) |
Income Below Poverty Among Married-Couple vs Single-Parent Households in Spur
The poverty data for Spur shows that 5 of the married-couple family households (5.4%) and 6 of the single-parent households (11.3%) are living below the poverty level. Within the married-couple family households, those with 3 or 4 children have the highest poverty rate, with 3 households (12.0%) falling below the poverty line. Among the single-parent households, those with no children have the highest poverty rate, with 4 household (30.8%) living below poverty.
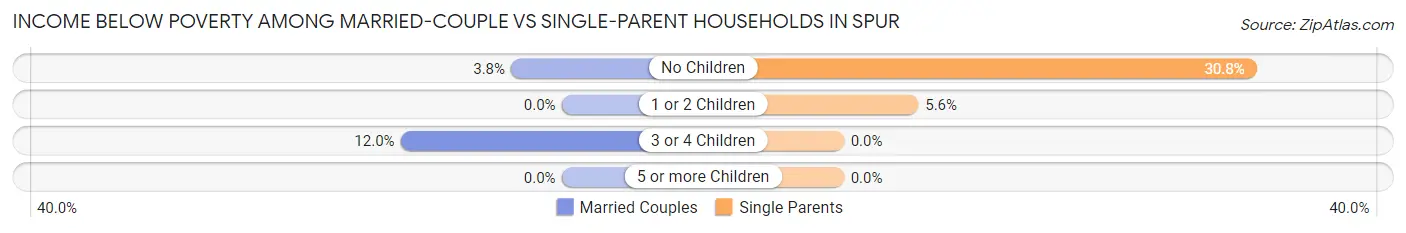
| Children | Married-Couple Families | Single-Parent Households |
| No Children | 2 (3.8%) | 4 (30.8%) |
| 1 or 2 Children | 0 (0.0%) | 2 (5.6%) |
| 3 or 4 Children | 3 (12.0%) | 0 (0.0%) |
| 5 or more Children | 0 (0.0%) | 0 (0.0%) |
| Total | 5 (5.4%) | 6 (11.3%) |
Race in Spur
The most populous races in Spur are White / Caucasian (606 | 77.9%), Hispanic or Latino (406 | 52.2%), and Some other Race (140 | 18.0%).
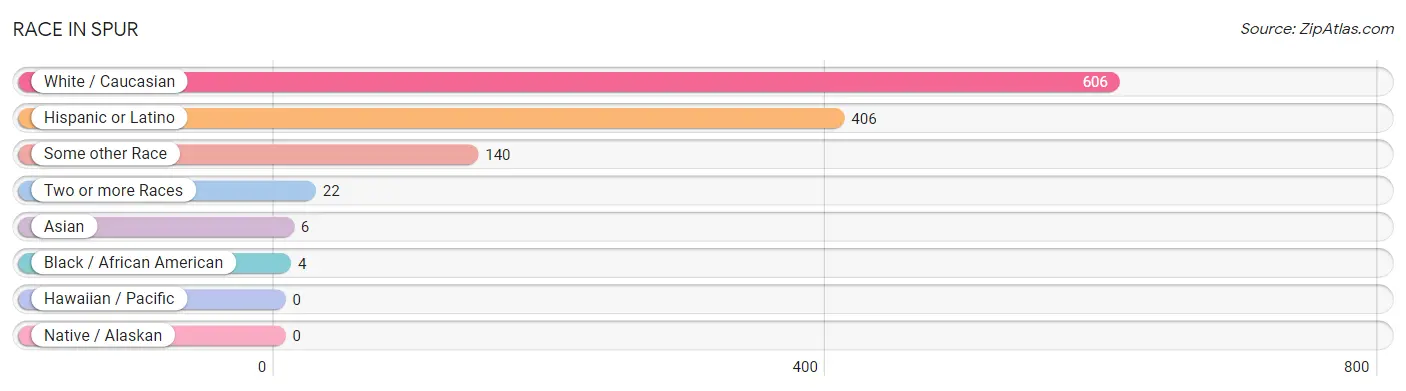
| Race | # Population | % Population |
| Asian | 6 | 0.8% |
| Black / African American | 4 | 0.5% |
| Hawaiian / Pacific | 0 | 0.0% |
| Hispanic or Latino | 406 | 52.2% |
| Native / Alaskan | 0 | 0.0% |
| White / Caucasian | 606 | 77.9% |
| Two or more Races | 22 | 2.8% |
| Some other Race | 140 | 18.0% |
| Total | 778 | 100.0% |
Ancestry in Spur
The most populous ancestries reported in Spur are Mexican (374 | 48.1%), English (51 | 6.6%), American (42 | 5.4%), Scottish (42 | 5.4%), and German (22 | 2.8%), together accounting for 68.3% of all Spur residents.
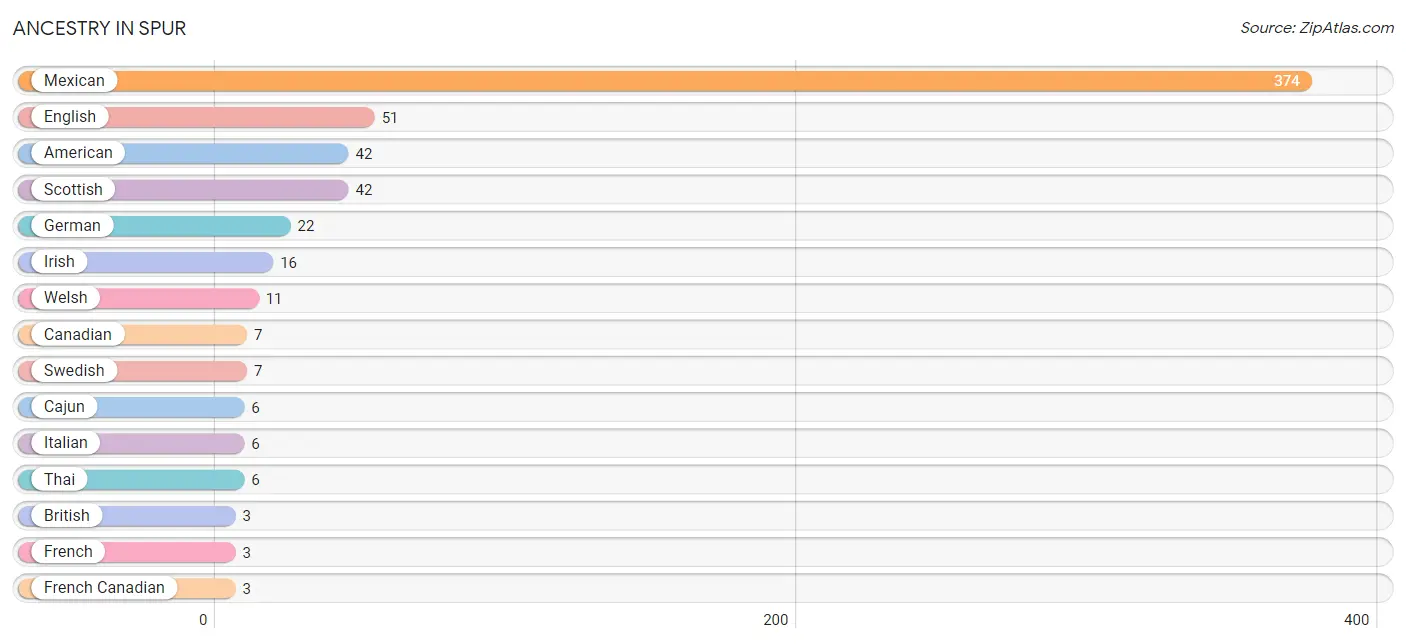
| Ancestry | # Population | % Population |
| American | 42 | 5.4% |
| British | 3 | 0.4% |
| Cajun | 6 | 0.8% |
| Canadian | 7 | 0.9% |
| English | 51 | 6.6% |
| French | 3 | 0.4% |
| French Canadian | 3 | 0.4% |
| German | 22 | 2.8% |
| Irish | 16 | 2.1% |
| Italian | 6 | 0.8% |
| Mexican | 374 | 48.1% |
| Norwegian | 3 | 0.4% |
| Scandinavian | 2 | 0.3% |
| Scottish | 42 | 5.4% |
| Sioux | 3 | 0.4% |
| South American | 3 | 0.4% |
| Swedish | 7 | 0.9% |
| Thai | 6 | 0.8% |
| Venezuelan | 3 | 0.4% |
| Welsh | 11 | 1.4% | View All 20 Rows |
Immigrants in Spur
The most numerous immigrant groups reported in Spur came from Latin America (38 | 4.9%), Central America (35 | 4.5%), Mexico (24 | 3.1%), Europe (8 | 1.0%), and El Salvador (7 | 0.9%), together accounting for 14.4% of all Spur residents.
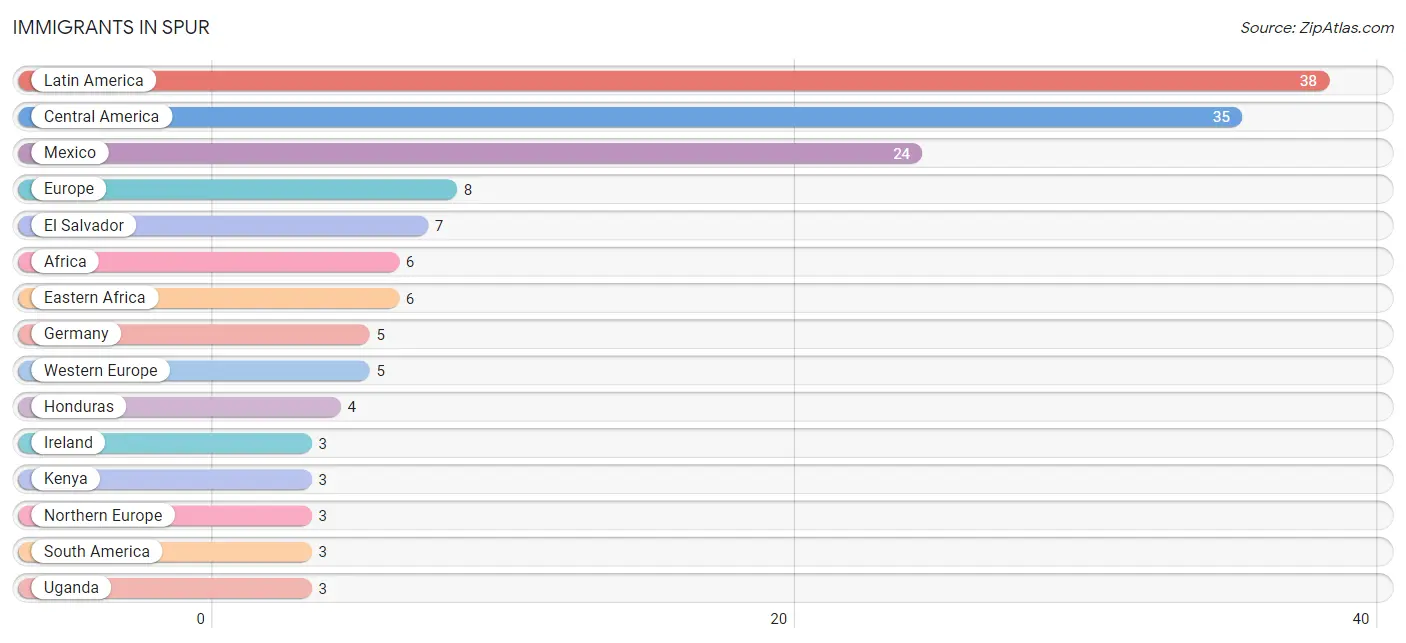
| Immigration Origin | # Population | % Population |
| Africa | 6 | 0.8% |
| Central America | 35 | 4.5% |
| Eastern Africa | 6 | 0.8% |
| El Salvador | 7 | 0.9% |
| Europe | 8 | 1.0% |
| Germany | 5 | 0.6% |
| Honduras | 4 | 0.5% |
| Ireland | 3 | 0.4% |
| Kenya | 3 | 0.4% |
| Latin America | 38 | 4.9% |
| Mexico | 24 | 3.1% |
| Northern Europe | 3 | 0.4% |
| South America | 3 | 0.4% |
| Uganda | 3 | 0.4% |
| Venezuela | 3 | 0.4% |
| Western Europe | 5 | 0.6% | View All 16 Rows |
Sex and Age in Spur
Sex and Age in Spur
The most populous age groups in Spur are 25 to 29 Years (40 | 11.0%) for men and 25 to 29 Years (51 | 12.3%) for women.
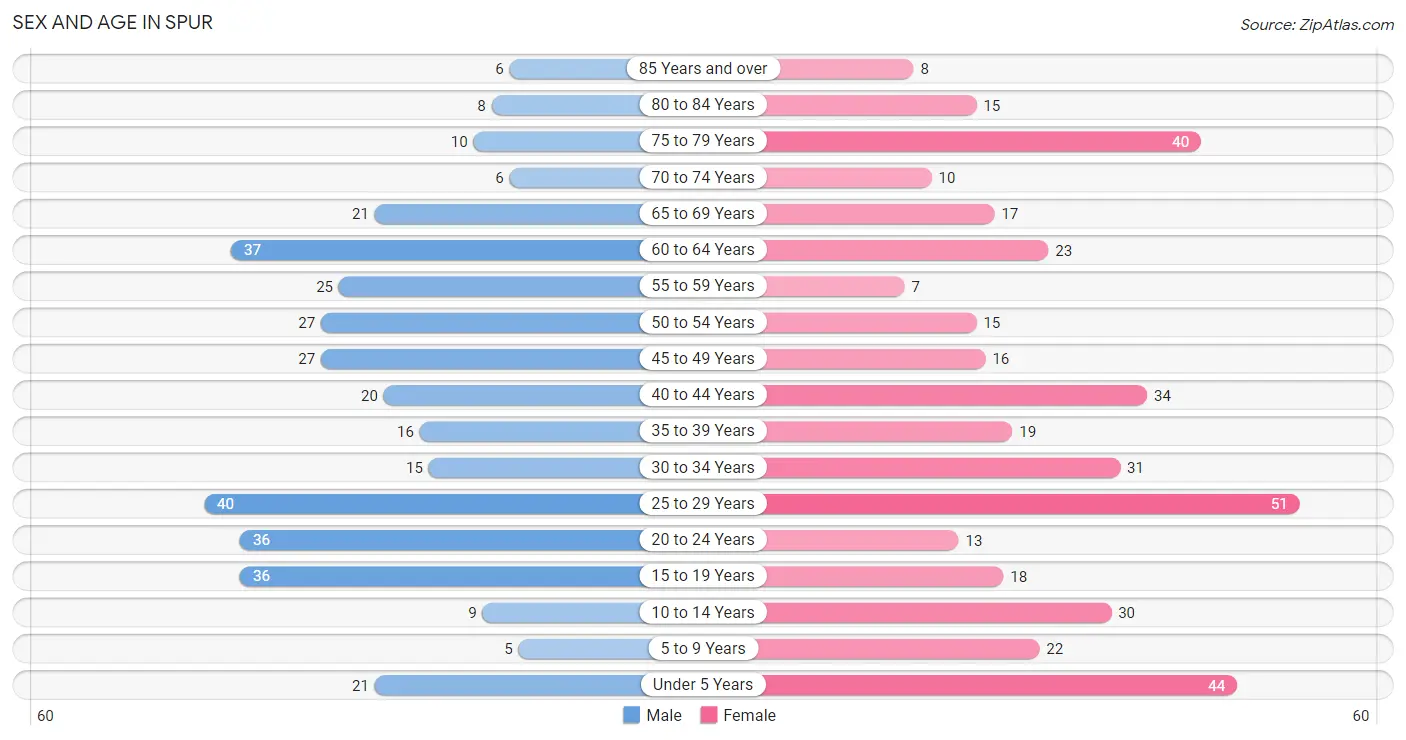
| Age Bracket | Male | Female |
| Under 5 Years | 21 (5.8%) | 44 (10.6%) |
| 5 to 9 Years | 5 (1.4%) | 22 (5.3%) |
| 10 to 14 Years | 9 (2.5%) | 30 (7.3%) |
| 15 to 19 Years | 36 (9.9%) | 18 (4.4%) |
| 20 to 24 Years | 36 (9.9%) | 13 (3.2%) |
| 25 to 29 Years | 40 (11.0%) | 51 (12.3%) |
| 30 to 34 Years | 15 (4.1%) | 31 (7.5%) |
| 35 to 39 Years | 16 (4.4%) | 19 (4.6%) |
| 40 to 44 Years | 20 (5.5%) | 34 (8.2%) |
| 45 to 49 Years | 27 (7.4%) | 16 (3.9%) |
| 50 to 54 Years | 27 (7.4%) | 15 (3.6%) |
| 55 to 59 Years | 25 (6.9%) | 7 (1.7%) |
| 60 to 64 Years | 37 (10.1%) | 23 (5.6%) |
| 65 to 69 Years | 21 (5.8%) | 17 (4.1%) |
| 70 to 74 Years | 6 (1.6%) | 10 (2.4%) |
| 75 to 79 Years | 10 (2.7%) | 40 (9.7%) |
| 80 to 84 Years | 8 (2.2%) | 15 (3.6%) |
| 85 Years and over | 6 (1.6%) | 8 (1.9%) |
| Total | 365 (100.0%) | 413 (100.0%) |
Families and Households in Spur
Median Family Size in Spur
The median family size in Spur is 3.81 persons per family, with married-couple families (92 | 63.4%) accounting for the largest median family size of 3.98 persons per family. On the other hand, single female/mother families (30 | 20.7%) represent the smallest median family size with 3.50 persons per family.
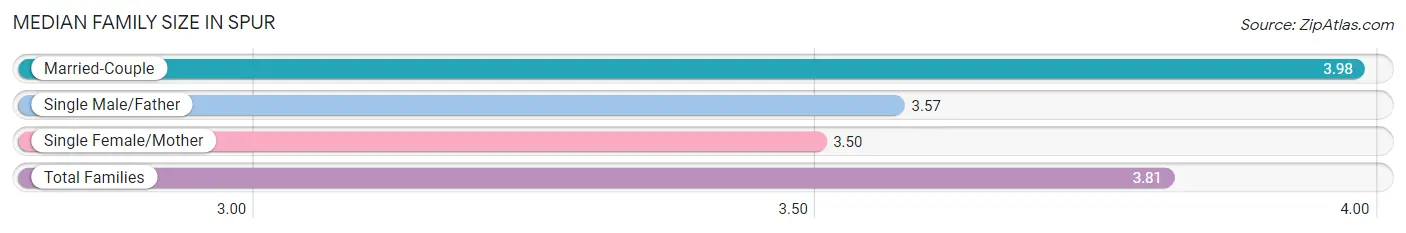
| Family Type | # Families | Family Size |
| Married-Couple | 92 (63.4%) | 3.98 |
| Single Male/Father | 23 (15.9%) | 3.57 |
| Single Female/Mother | 30 (20.7%) | 3.50 |
| Total Families | 145 (100.0%) | 3.81 |
Median Household Size in Spur
The median household size in Spur is 2.40 persons per household, with single male/father households (23 | 7.6%) accounting for the largest median household size of 4 persons per household. non-family households (159 | 52.3%) represent the smallest median household size with 1.05 persons per household.
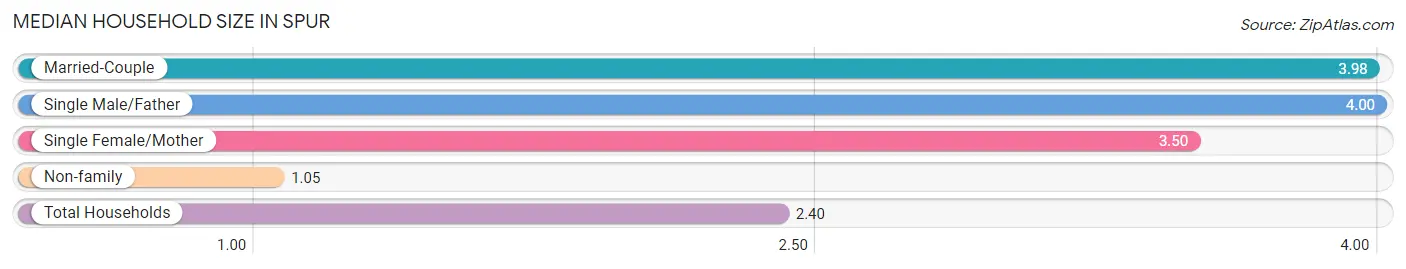
| Household Type | # Households | Household Size |
| Married-Couple | 92 (30.3%) | 3.98 |
| Single Male/Father | 23 (7.6%) | 4.00 |
| Single Female/Mother | 30 (9.9%) | 3.50 |
| Non-family | 159 (52.3%) | 1.05 |
| Total Households | 304 (100.0%) | 2.40 |
Household Size by Marriage Status in Spur
Out of a total of 304 households in Spur, 145 (47.7%) are family households, while 159 (52.3%) are nonfamily households. The most numerous type of family households are 2-person households, comprising 70, and the most common type of nonfamily households are 1-person households, comprising 150.
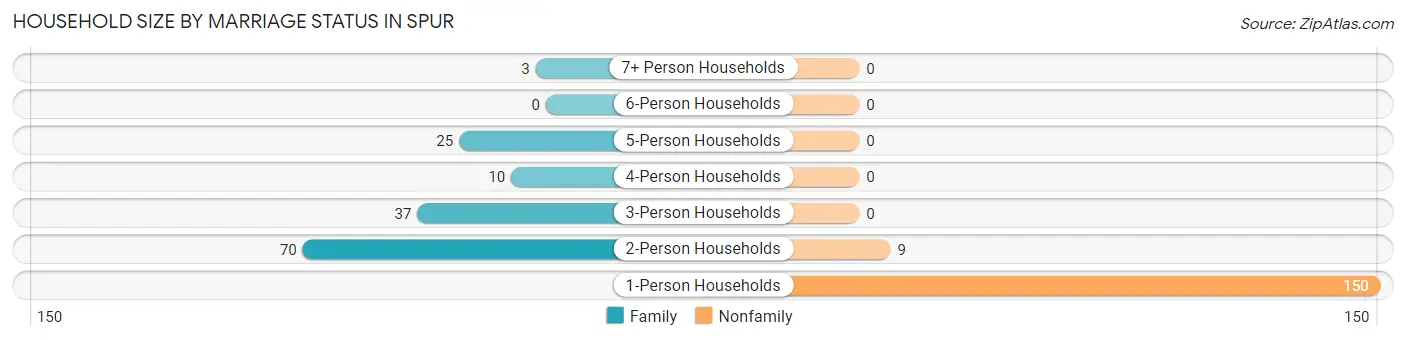
| Household Size | Family Households | Nonfamily Households |
| 1-Person Households | - | 150 (49.3%) |
| 2-Person Households | 70 (23.0%) | 9 (3.0%) |
| 3-Person Households | 37 (12.2%) | 0 (0.0%) |
| 4-Person Households | 10 (3.3%) | 0 (0.0%) |
| 5-Person Households | 25 (8.2%) | 0 (0.0%) |
| 6-Person Households | 0 (0.0%) | 0 (0.0%) |
| 7+ Person Households | 3 (1.0%) | 0 (0.0%) |
| Total | 145 (47.7%) | 159 (52.3%) |
Female Fertility in Spur
Fertility by Age in Spur
Average fertility rate in Spur is 324.0 births per 1,000 women. Women in the age bracket of 20 to 34 years have the highest fertility rate with 547.0 births per 1,000 women. Women in the age bracket of 20 to 34 years acount for 88.1% of all women with births.
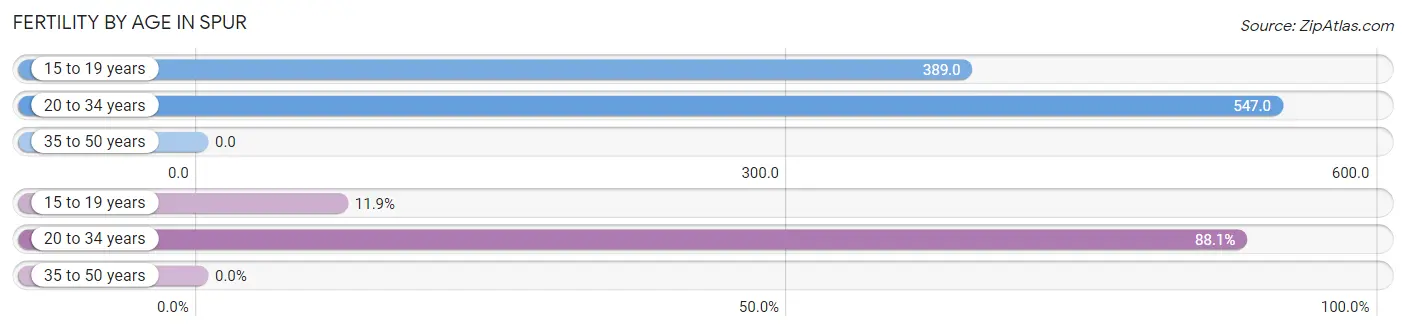
| Age Bracket | Women with Births | Births / 1,000 Women |
| 15 to 19 years | 7 (11.9%) | 389.0 |
| 20 to 34 years | 52 (88.1%) | 547.0 |
| 35 to 50 years | 0 (0.0%) | 0.0 |
| Total | 59 (100.0%) | 324.0 |
Fertility by Age by Marriage Status in Spur
88.1% of women with births (59) in Spur are married. The highest percentage of unmarried women with births falls into 15 to 19 years age bracket with 100.0% of them unmarried at the time of birth, while the lowest percentage of unmarried women with births belong to 20 to 34 years age bracket with 0.0% of them unmarried.
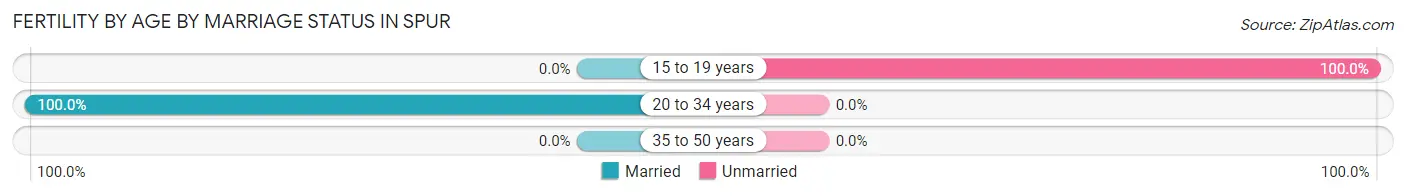
| Age Bracket | Married | Unmarried |
| 15 to 19 years | 0 (0.0%) | 7 (100.0%) |
| 20 to 34 years | 52 (100.0%) | 0 (0.0%) |
| 35 to 50 years | 0 (0.0%) | 0 (0.0%) |
| Total | 52 (88.1%) | 7 (11.9%) |
Fertility by Education in Spur
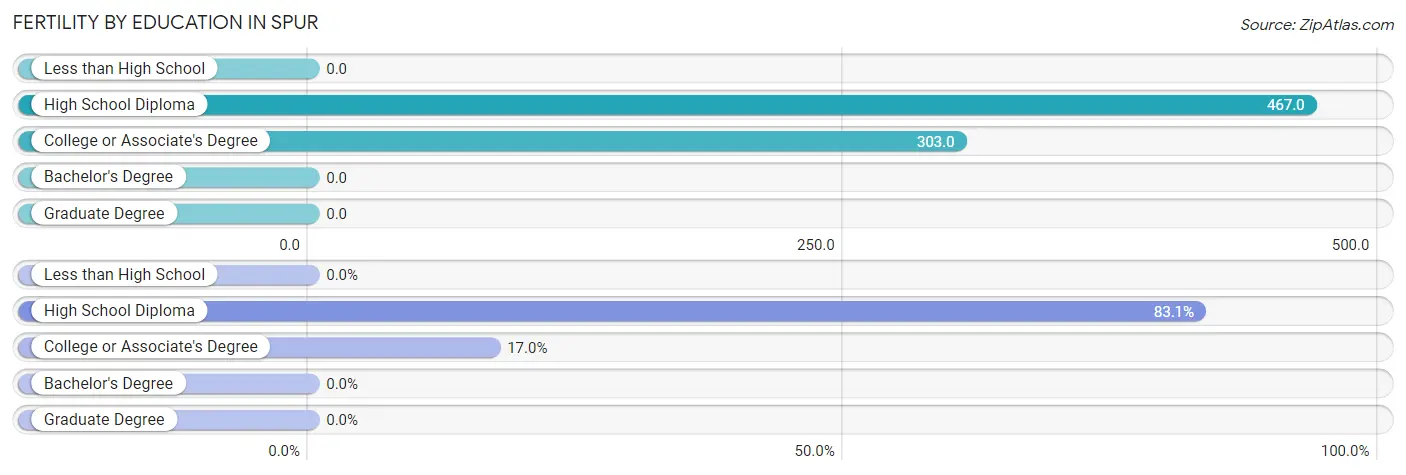
| Educational Attainment | Women with Births | Births / 1,000 Women |
| Less than High School | 0 (0.0%) | 0.0 |
| High School Diploma | 49 (83.1%) | 467.0 |
| College or Associate's Degree | 10 (17.0%) | 303.0 |
| Bachelor's Degree | 0 (0.0%) | 0.0 |
| Graduate Degree | 0 (0.0%) | 0.0 |
| Total | 59 (100.0%) | 324.0 |
Fertility by Education by Marriage Status in Spur
11.9% of women with births in Spur are unmarried. Women with the educational attainment of high school diploma are most likely to be married with 100.0% of them married at childbirth, while women with the educational attainment of college or associate's degree are least likely to be married with 70.0% of them unmarried at childbirth.

| Educational Attainment | Married | Unmarried |
| Less than High School | 0 (0.0%) | 0 (0.0%) |
| High School Diploma | 49 (100.0%) | 0 (0.0%) |
| College or Associate's Degree | 3 (30.0%) | 7 (70.0%) |
| Bachelor's Degree | 0 (0.0%) | 0 (0.0%) |
| Graduate Degree | 0 (0.0%) | 0 (0.0%) |
| Total | 52 (88.1%) | 7 (11.9%) |
Employment Characteristics in Spur
Employment by Class of Employer in Spur
Among the 232 employed individuals in Spur, private company employees (135 | 58.2%), local government employees (50 | 21.5%), and self-employed (not incorporated) (17 | 7.3%) make up the most common classes of employment.
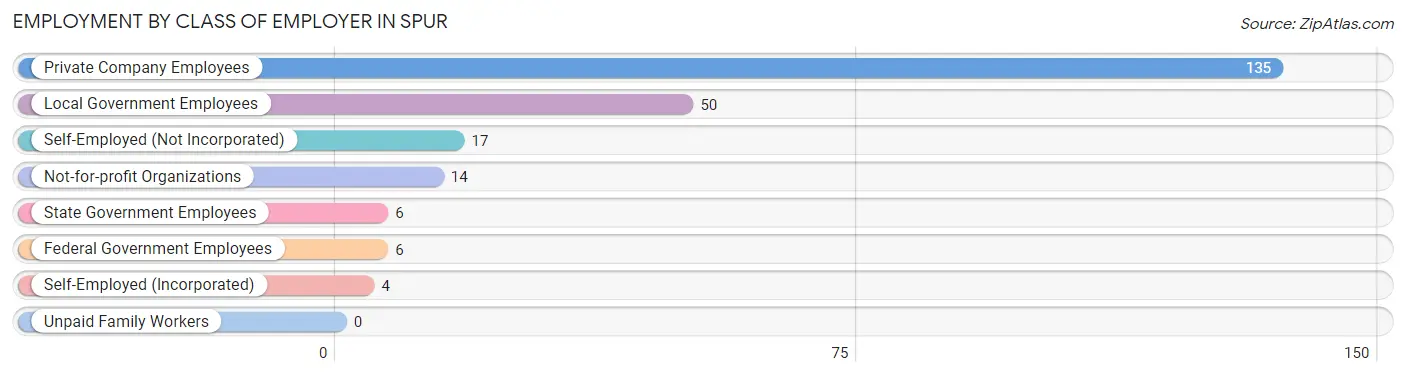
| Employer Class | # Employees | % Employees |
| Private Company Employees | 135 | 58.2% |
| Self-Employed (Incorporated) | 4 | 1.7% |
| Self-Employed (Not Incorporated) | 17 | 7.3% |
| Not-for-profit Organizations | 14 | 6.0% |
| Local Government Employees | 50 | 21.5% |
| State Government Employees | 6 | 2.6% |
| Federal Government Employees | 6 | 2.6% |
| Unpaid Family Workers | 0 | 0.0% |
| Total | 232 | 100.0% |
Employment Status by Age in Spur
According to the labor force statistics for Spur, out of the total population over 16 years of age (644), 44.1% or 284 individuals are in the labor force, with 18.3% or 52 of them unemployed. The age group with the highest labor force participation rate is 20 to 24 years, with 81.6% or 40 individuals in the labor force. Within the labor force, the 20 to 24 years age range has the highest percentage of unemployed individuals, with 35.0% or 14 of them being unemployed.
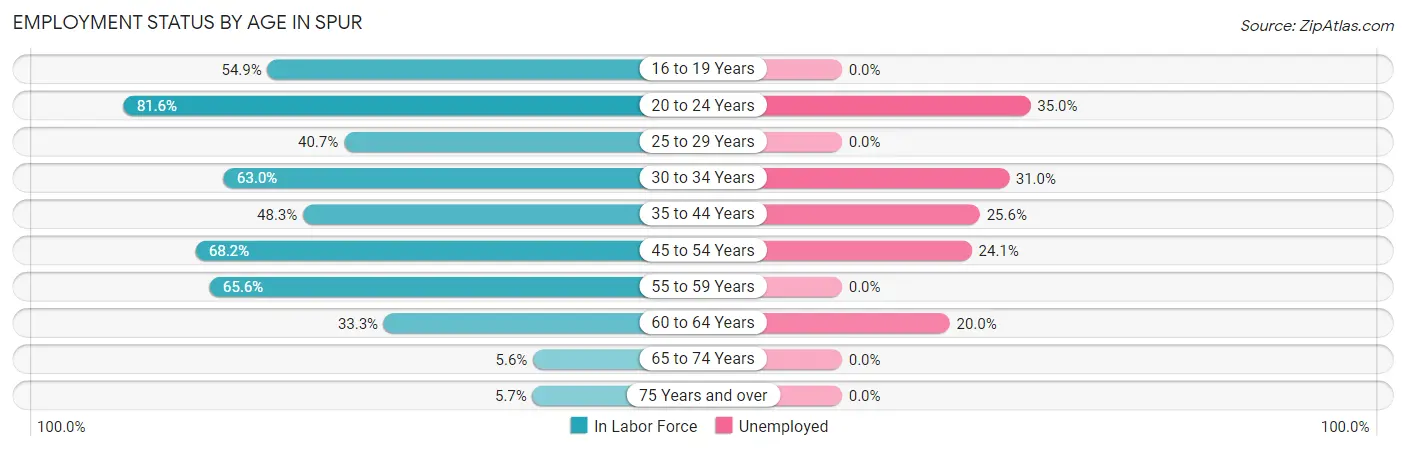
| Age Bracket | In Labor Force | Unemployed |
| 16 to 19 Years | 28 (54.9%) | 0 (0.0%) |
| 20 to 24 Years | 40 (81.6%) | 14 (35.0%) |
| 25 to 29 Years | 37 (40.7%) | 0 (0.0%) |
| 30 to 34 Years | 29 (63.0%) | 9 (31.0%) |
| 35 to 44 Years | 43 (48.3%) | 11 (25.6%) |
| 45 to 54 Years | 58 (68.2%) | 14 (24.1%) |
| 55 to 59 Years | 21 (65.6%) | 0 (0.0%) |
| 60 to 64 Years | 20 (33.3%) | 4 (20.0%) |
| 65 to 74 Years | 3 (5.6%) | 0 (0.0%) |
| 75 Years and over | 5 (5.7%) | 0 (0.0%) |
| Total | 284 (44.1%) | 52 (18.3%) |
Employment Status by Educational Attainment in Spur
According to labor force statistics for Spur, 51.6% of individuals (208) out of the total population between 25 and 64 years of age (403) are in the labor force, with 18.3% or 38 of them being unemployed. The group with the highest labor force participation rate are those with the educational attainment of college / associate degree, with 77.8% or 70 individuals in the labor force. Within the labor force, individuals with less than high school education have the highest percentage of unemployment, with 51.6% or 16 of them being unemployed.
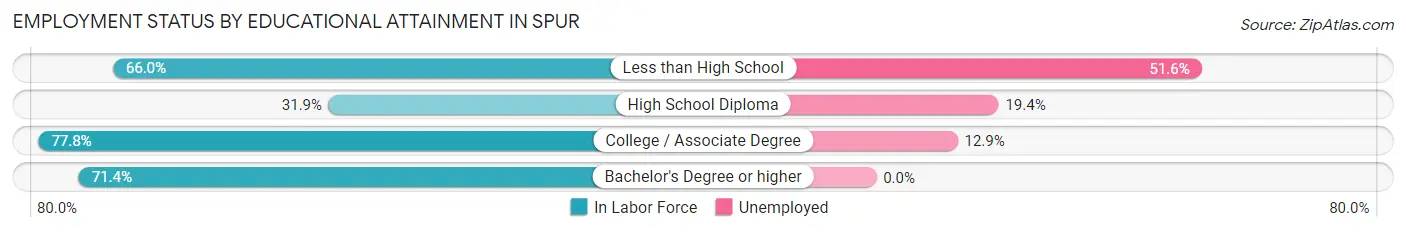
| Educational Attainment | In Labor Force | Unemployed |
| Less than High School | 31 (66.0%) | 24 (51.6%) |
| High School Diploma | 67 (31.9%) | 41 (19.4%) |
| College / Associate Degree | 70 (77.8%) | 12 (12.9%) |
| Bachelor's Degree or higher | 40 (71.4%) | 0 (0.0%) |
| Total | 208 (51.6%) | 74 (18.3%) |
Employment Occupations by Sex in Spur
Management, Business, Science and Arts Occupations
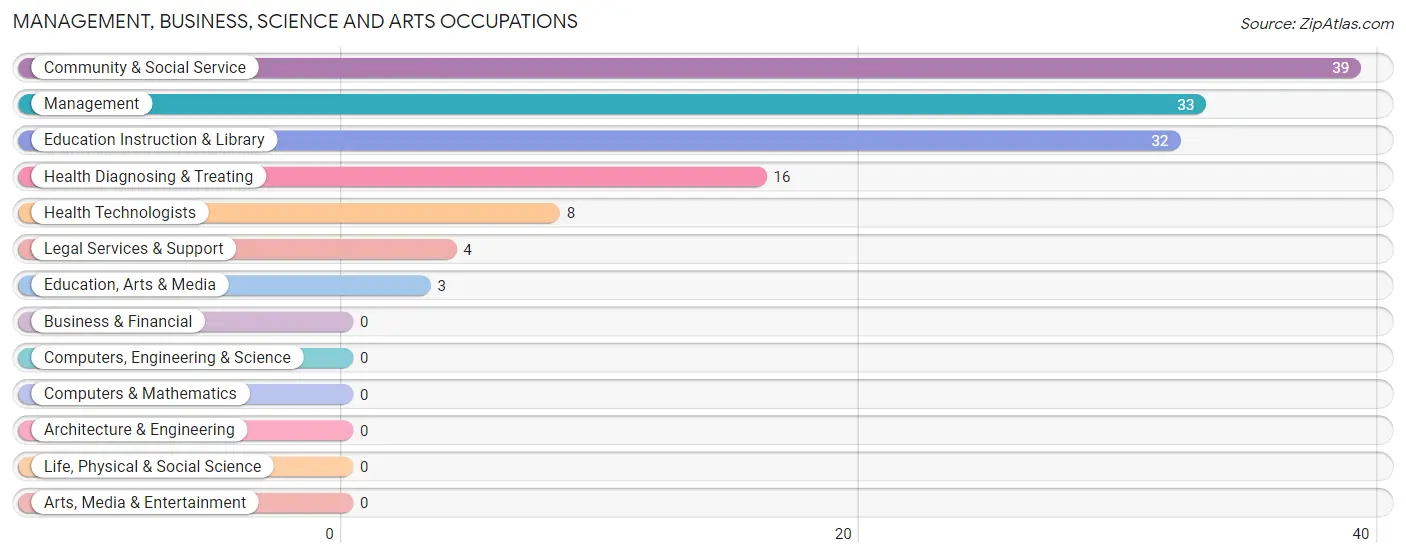
The most common Management, Business, Science and Arts occupations in Spur are Community & Social Service (39 | 16.8%), Management (33 | 14.2%), Education Instruction & Library (32 | 13.8%), Health Diagnosing & Treating (16 | 6.9%), and Health Technologists (8 | 3.5%).
Management, Business, Science and Arts Occupations by Sex
Within the Management, Business, Science and Arts occupations in Spur, the most male-oriented occupations are Education, Arts & Media (100.0%), Legal Services & Support (100.0%), and Community & Social Service (41.0%), while the most female-oriented occupations are Health Diagnosing & Treating (100.0%), Health Technologists (100.0%), and Education Instruction & Library (71.9%).
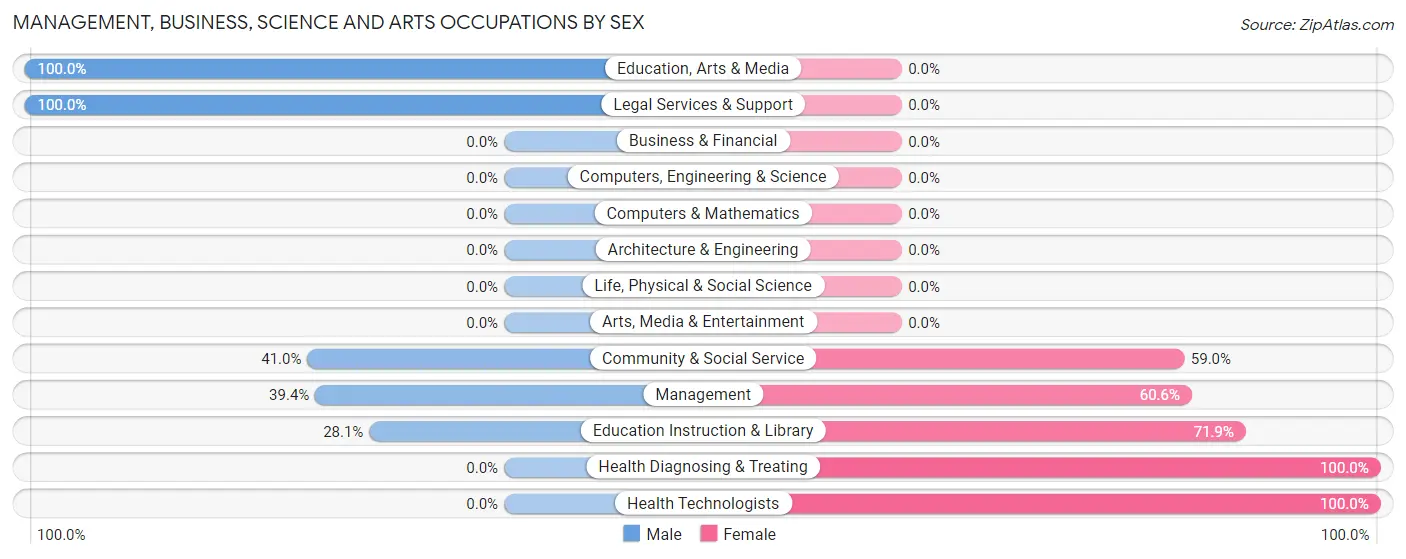
| Occupation | Male | Female |
| Management | 13 (39.4%) | 20 (60.6%) |
| Business & Financial | 0 (0.0%) | 0 (0.0%) |
| Computers, Engineering & Science | 0 (0.0%) | 0 (0.0%) |
| Computers & Mathematics | 0 (0.0%) | 0 (0.0%) |
| Architecture & Engineering | 0 (0.0%) | 0 (0.0%) |
| Life, Physical & Social Science | 0 (0.0%) | 0 (0.0%) |
| Community & Social Service | 16 (41.0%) | 23 (59.0%) |
| Education, Arts & Media | 3 (100.0%) | 0 (0.0%) |
| Legal Services & Support | 4 (100.0%) | 0 (0.0%) |
| Education Instruction & Library | 9 (28.1%) | 23 (71.9%) |
| Arts, Media & Entertainment | 0 (0.0%) | 0 (0.0%) |
| Health Diagnosing & Treating | 0 (0.0%) | 16 (100.0%) |
| Health Technologists | 0 (0.0%) | 8 (100.0%) |
| Total (Category) | 29 (33.0%) | 59 (67.0%) |
| Total (Overall) | 139 (59.9%) | 93 (40.1%) |
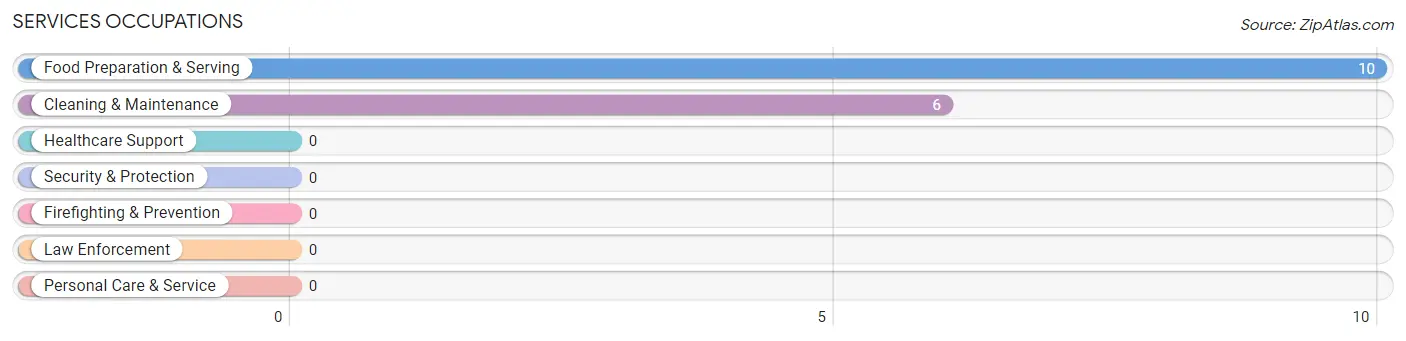
Services Occupations
The most common Services occupations in Spur are Food Preparation & Serving (10 | 4.3%), and Cleaning & Maintenance (6 | 2.6%).
Services Occupations by Sex
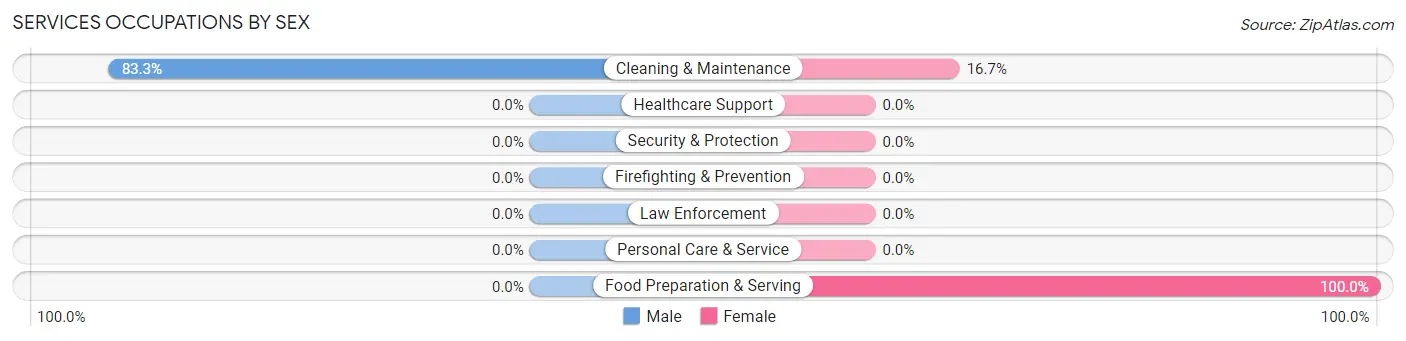
| Occupation | Male | Female |
| Healthcare Support | 0 (0.0%) | 0 (0.0%) |
| Security & Protection | 0 (0.0%) | 0 (0.0%) |
| Firefighting & Prevention | 0 (0.0%) | 0 (0.0%) |
| Law Enforcement | 0 (0.0%) | 0 (0.0%) |
| Food Preparation & Serving | 0 (0.0%) | 10 (100.0%) |
| Cleaning & Maintenance | 5 (83.3%) | 1 (16.7%) |
| Personal Care & Service | 0 (0.0%) | 0 (0.0%) |
| Total (Category) | 5 (31.2%) | 11 (68.8%) |
| Total (Overall) | 139 (59.9%) | 93 (40.1%) |
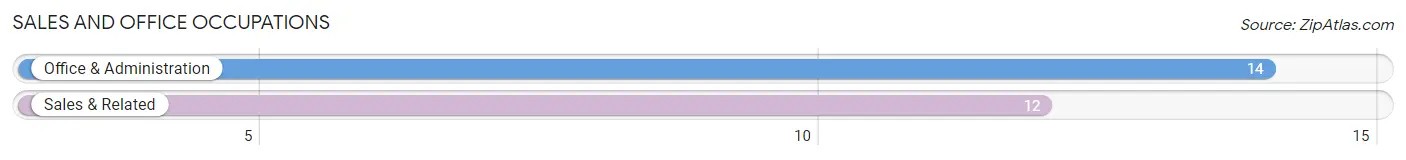
Sales and Office Occupations
The most common Sales and Office occupations in Spur are Office & Administration (14 | 6.0%), and Sales & Related (12 | 5.2%).
Sales and Office Occupations by Sex

| Occupation | Male | Female |
| Sales & Related | 0 (0.0%) | 12 (100.0%) |
| Office & Administration | 4 (28.6%) | 10 (71.4%) |
| Total (Category) | 4 (15.4%) | 22 (84.6%) |
| Total (Overall) | 139 (59.9%) | 93 (40.1%) |
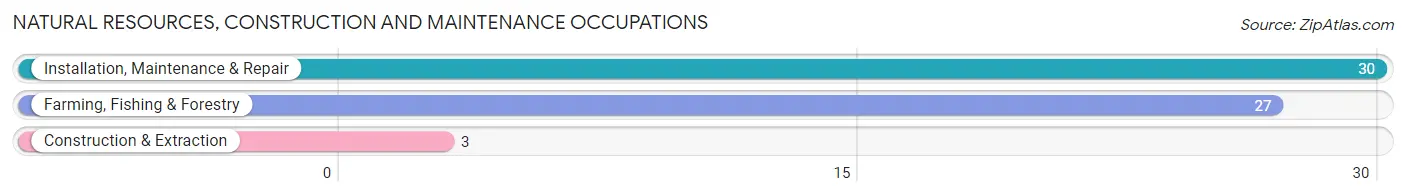
Natural Resources, Construction and Maintenance Occupations
The most common Natural Resources, Construction and Maintenance occupations in Spur are Installation, Maintenance & Repair (30 | 12.9%), Farming, Fishing & Forestry (27 | 11.6%), and Construction & Extraction (3 | 1.3%).
Natural Resources, Construction and Maintenance Occupations by Sex
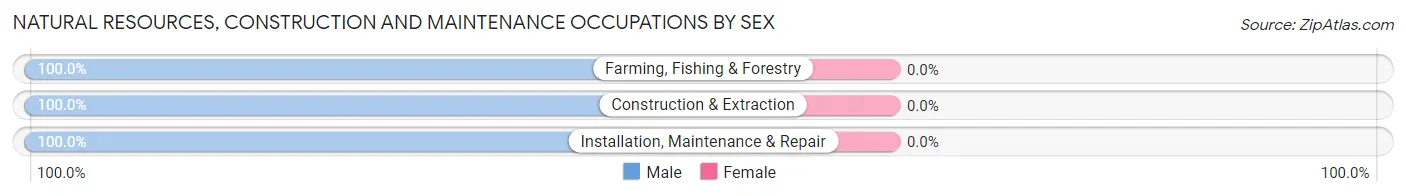
| Occupation | Male | Female |
| Farming, Fishing & Forestry | 27 (100.0%) | 0 (0.0%) |
| Construction & Extraction | 3 (100.0%) | 0 (0.0%) |
| Installation, Maintenance & Repair | 30 (100.0%) | 0 (0.0%) |
| Total (Category) | 60 (100.0%) | 0 (0.0%) |
| Total (Overall) | 139 (59.9%) | 93 (40.1%) |
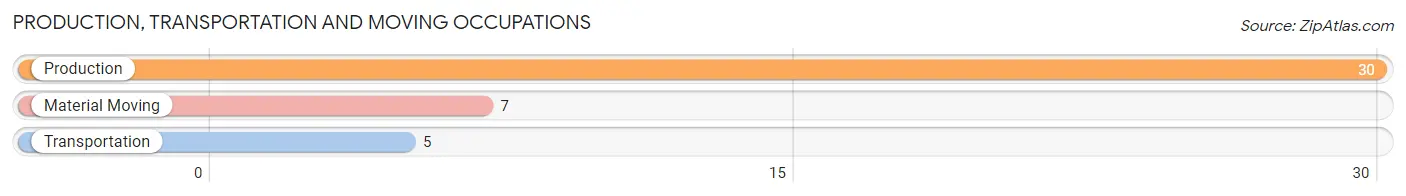
Production, Transportation and Moving Occupations
The most common Production, Transportation and Moving occupations in Spur are Production (30 | 12.9%), Material Moving (7 | 3.0%), and Transportation (5 | 2.2%).
Production, Transportation and Moving Occupations by Sex
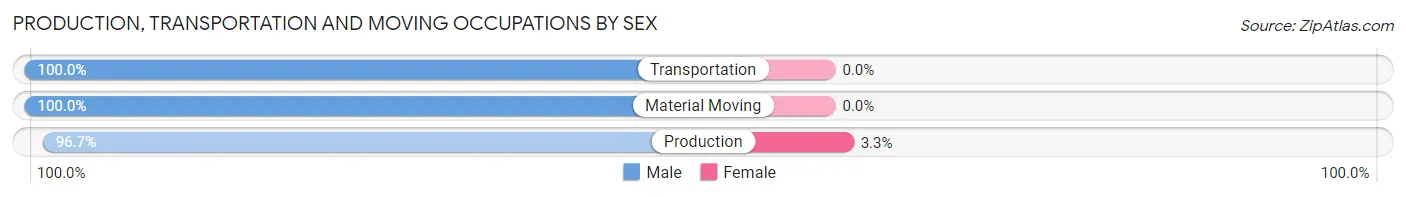
| Occupation | Male | Female |
| Production | 29 (96.7%) | 1 (3.3%) |
| Transportation | 5 (100.0%) | 0 (0.0%) |
| Material Moving | 7 (100.0%) | 0 (0.0%) |
| Total (Category) | 41 (97.6%) | 1 (2.4%) |
| Total (Overall) | 139 (59.9%) | 93 (40.1%) |
Employment Industries by Sex in Spur
Employment Industries in Spur
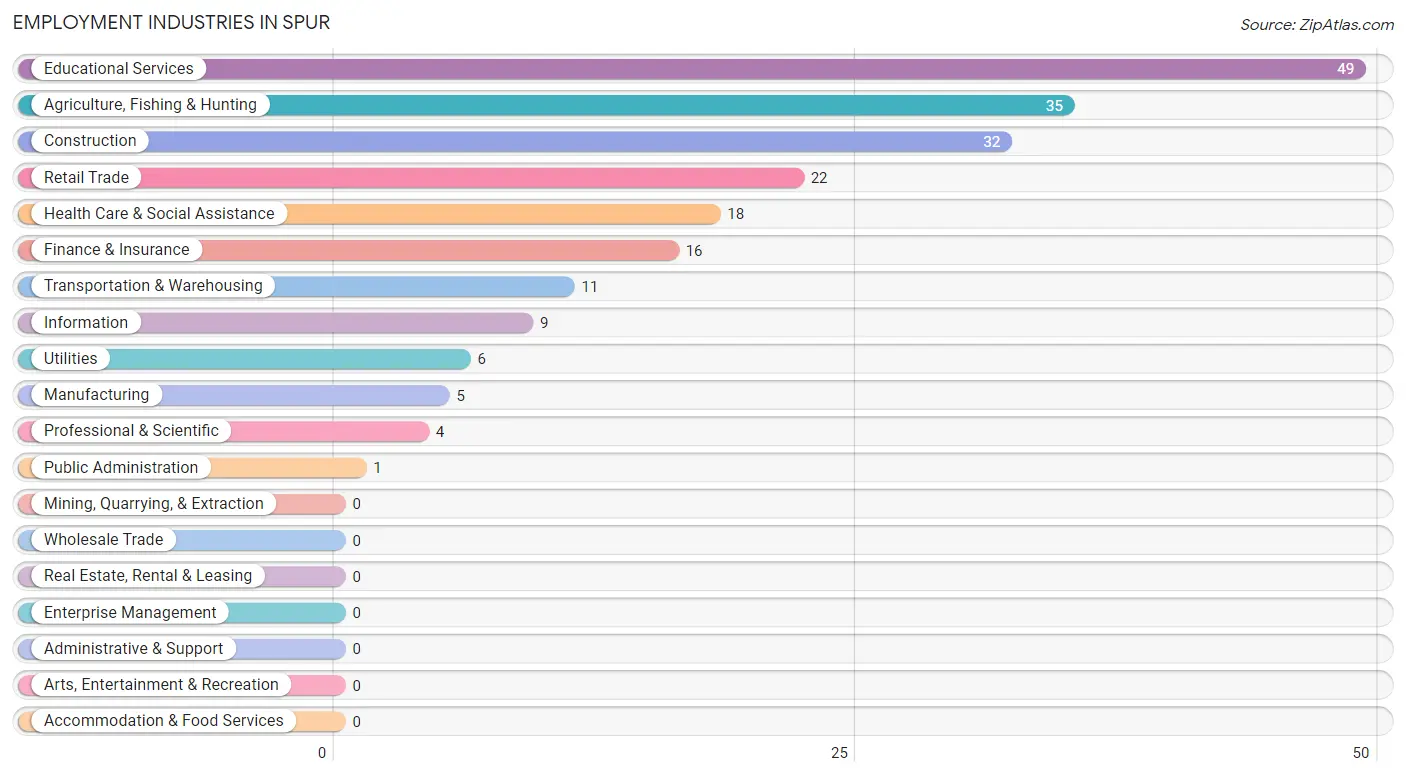
The major employment industries in Spur include Educational Services (49 | 21.1%), Agriculture, Fishing & Hunting (35 | 15.1%), Construction (32 | 13.8%), Retail Trade (22 | 9.5%), and Health Care & Social Assistance (18 | 7.8%).
Employment Industries by Sex in Spur
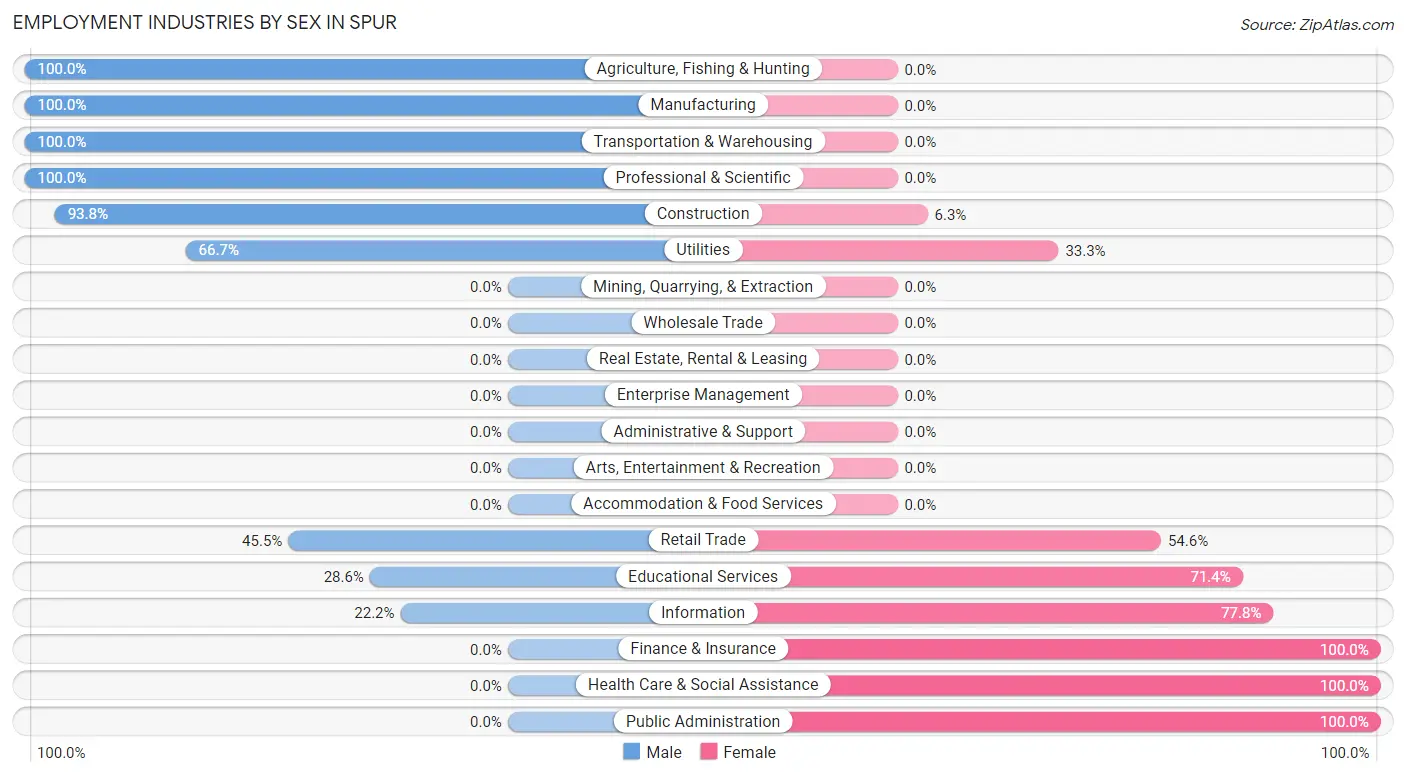
The Spur industries that see more men than women are Agriculture, Fishing & Hunting (100.0%), Manufacturing (100.0%), and Transportation & Warehousing (100.0%), whereas the industries that tend to have a higher number of women are Finance & Insurance (100.0%), Health Care & Social Assistance (100.0%), and Public Administration (100.0%).
| Industry | Male | Female |
| Agriculture, Fishing & Hunting | 35 (100.0%) | 0 (0.0%) |
| Mining, Quarrying, & Extraction | 0 (0.0%) | 0 (0.0%) |
| Construction | 30 (93.8%) | 2 (6.2%) |
| Manufacturing | 5 (100.0%) | 0 (0.0%) |
| Wholesale Trade | 0 (0.0%) | 0 (0.0%) |
| Retail Trade | 10 (45.5%) | 12 (54.5%) |
| Transportation & Warehousing | 11 (100.0%) | 0 (0.0%) |
| Utilities | 4 (66.7%) | 2 (33.3%) |
| Information | 2 (22.2%) | 7 (77.8%) |
| Finance & Insurance | 0 (0.0%) | 16 (100.0%) |
| Real Estate, Rental & Leasing | 0 (0.0%) | 0 (0.0%) |
| Professional & Scientific | 4 (100.0%) | 0 (0.0%) |
| Enterprise Management | 0 (0.0%) | 0 (0.0%) |
| Administrative & Support | 0 (0.0%) | 0 (0.0%) |
| Educational Services | 14 (28.6%) | 35 (71.4%) |
| Health Care & Social Assistance | 0 (0.0%) | 18 (100.0%) |
| Arts, Entertainment & Recreation | 0 (0.0%) | 0 (0.0%) |
| Accommodation & Food Services | 0 (0.0%) | 0 (0.0%) |
| Public Administration | 0 (0.0%) | 1 (100.0%) |
| Total | 139 (59.9%) | 93 (40.1%) |
Education in Spur
School Enrollment in Spur
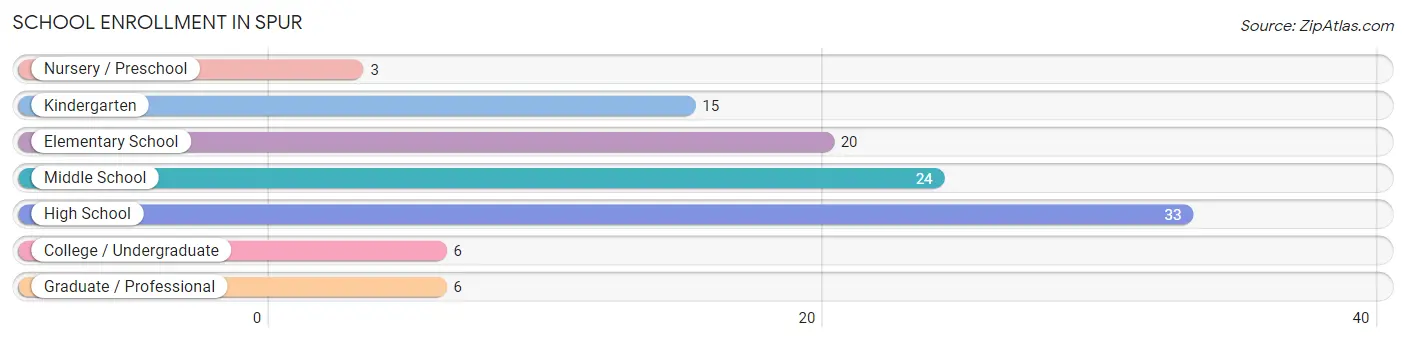
The most common levels of schooling among the 107 students in Spur are high school (33 | 30.8%), middle school (24 | 22.4%), and elementary school (20 | 18.7%).
| School Level | # Students | % Students |
| Nursery / Preschool | 3 | 2.8% |
| Kindergarten | 15 | 14.0% |
| Elementary School | 20 | 18.7% |
| Middle School | 24 | 22.4% |
| High School | 33 | 30.8% |
| College / Undergraduate | 6 | 5.6% |
| Graduate / Professional | 6 | 5.6% |
| Total | 107 | 100.0% |
School Enrollment by Age by Funding Source in Spur
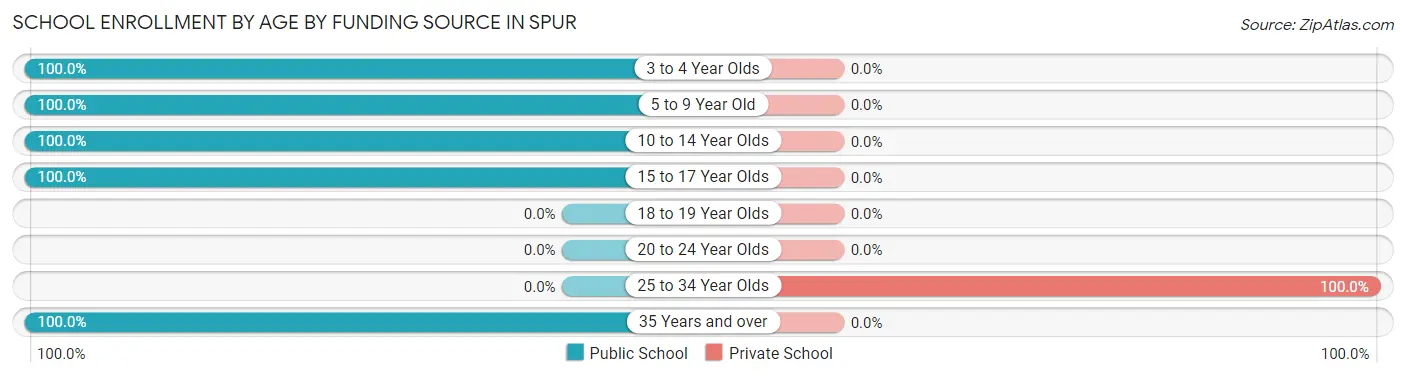
Out of a total of 107 students who are enrolled in schools in Spur, 2 (1.9%) attend a private institution, while the remaining 105 (98.1%) are enrolled in public schools. The age group of 25 to 34 year olds has the highest likelihood of being enrolled in private schools, with 2 (100.0% in the age bracket) enrolled. Conversely, the age group of 3 to 4 year olds has the lowest likelihood of being enrolled in a private school, with 3 (100.0% in the age bracket) attending a public institution.
| Age Bracket | Public School | Private School |
| 3 to 4 Year Olds | 3 (100.0%) | 0 (0.0%) |
| 5 to 9 Year Old | 27 (100.0%) | 0 (0.0%) |
| 10 to 14 Year Olds | 39 (100.0%) | 0 (0.0%) |
| 15 to 17 Year Olds | 26 (100.0%) | 0 (0.0%) |
| 18 to 19 Year Olds | 0 (0.0%) | 0 (0.0%) |
| 20 to 24 Year Olds | 0 (0.0%) | 0 (0.0%) |
| 25 to 34 Year Olds | 0 (0.0%) | 2 (100.0%) |
| 35 Years and over | 10 (100.0%) | 0 (0.0%) |
| Total | 105 (98.1%) | 2 (1.9%) |
Educational Attainment by Field of Study in Spur
Education (24 | 25.8%), arts & humanities (19 | 20.4%), business (18 | 19.4%), bio, nature & agricultural (10 | 10.7%), and liberal arts & history (7 | 7.5%) are the most common fields of study among 93 individuals in Spur who have obtained a bachelor's degree or higher.
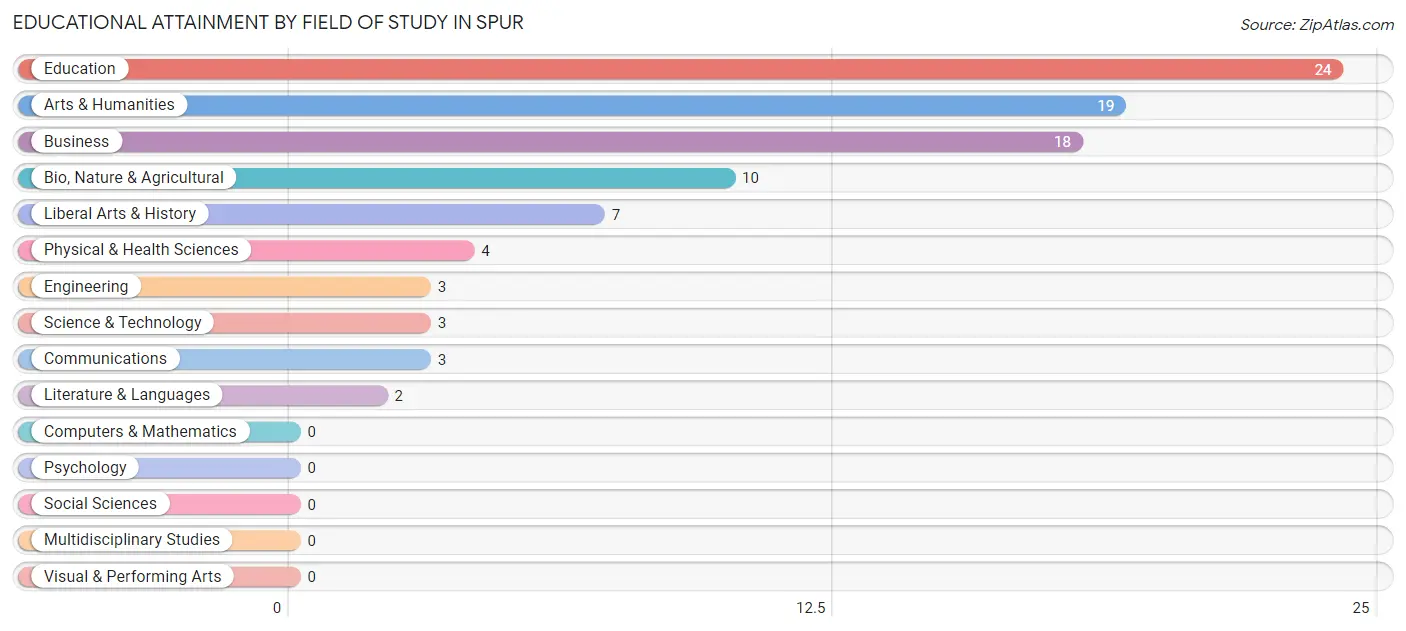
| Field of Study | # Graduates | % Graduates |
| Computers & Mathematics | 0 | 0.0% |
| Bio, Nature & Agricultural | 10 | 10.7% |
| Physical & Health Sciences | 4 | 4.3% |
| Psychology | 0 | 0.0% |
| Social Sciences | 0 | 0.0% |
| Engineering | 3 | 3.2% |
| Multidisciplinary Studies | 0 | 0.0% |
| Science & Technology | 3 | 3.2% |
| Business | 18 | 19.4% |
| Education | 24 | 25.8% |
| Literature & Languages | 2 | 2.1% |
| Liberal Arts & History | 7 | 7.5% |
| Visual & Performing Arts | 0 | 0.0% |
| Communications | 3 | 3.2% |
| Arts & Humanities | 19 | 20.4% |
| Total | 93 | 100.0% |
Transportation & Commute in Spur
Vehicle Availability by Sex in Spur
The most prevalent vehicle ownership categories in Spur are males with 3 vehicles (56, accounting for 40.3%) and females with 3 vehicles (18, making up 60.2%).
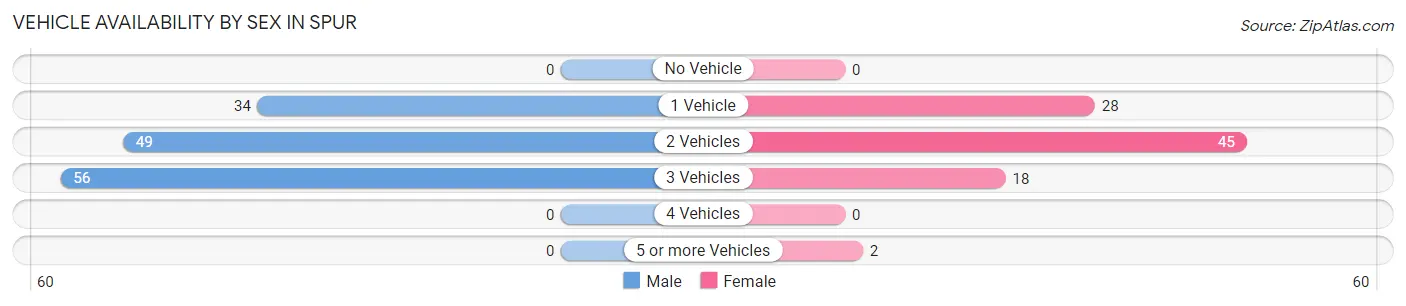
| Vehicles Available | Male | Female |
| No Vehicle | 0 (0.0%) | 0 (0.0%) |
| 1 Vehicle | 34 (24.5%) | 28 (30.1%) |
| 2 Vehicles | 49 (35.2%) | 45 (48.4%) |
| 3 Vehicles | 56 (40.3%) | 18 (19.4%) |
| 4 Vehicles | 0 (0.0%) | 0 (0.0%) |
| 5 or more Vehicles | 0 (0.0%) | 2 (2.1%) |
| Total | 139 (100.0%) | 93 (100.0%) |
Commute Time in Spur
The most frequently occuring commute durations in Spur are 5 to 9 minutes (87 commuters, 38.0%), less than 5 minutes (51 commuters, 22.3%), and 60 to 89 minutes (39 commuters, 17.0%).
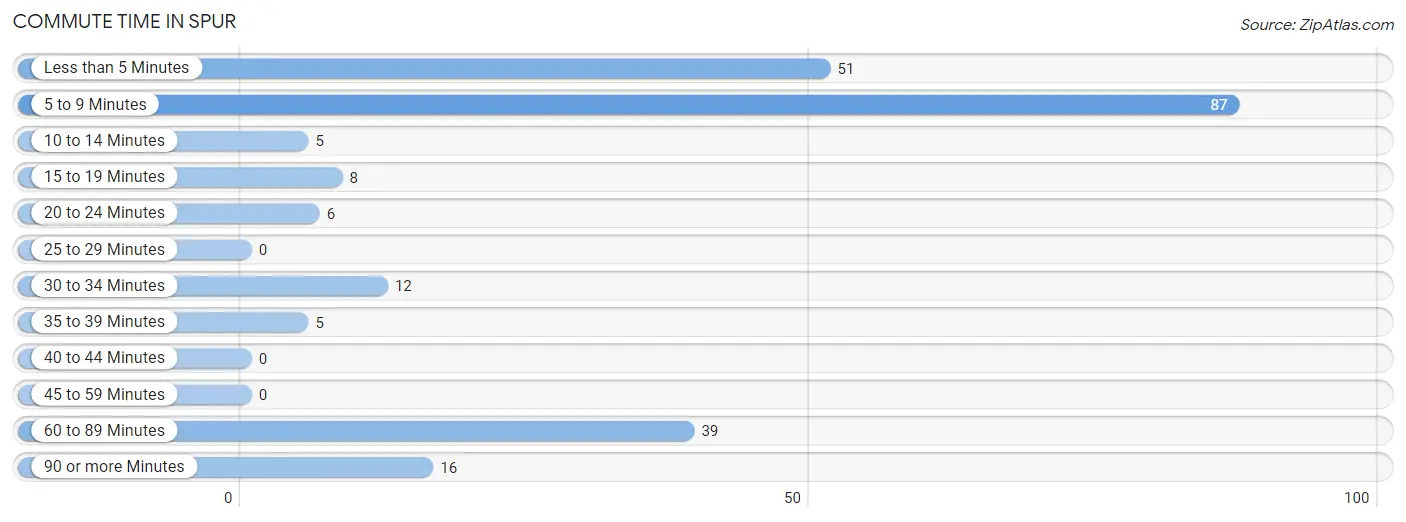
| Commute Time | # Commuters | % Commuters |
| Less than 5 Minutes | 51 | 22.3% |
| 5 to 9 Minutes | 87 | 38.0% |
| 10 to 14 Minutes | 5 | 2.2% |
| 15 to 19 Minutes | 8 | 3.5% |
| 20 to 24 Minutes | 6 | 2.6% |
| 25 to 29 Minutes | 0 | 0.0% |
| 30 to 34 Minutes | 12 | 5.2% |
| 35 to 39 Minutes | 5 | 2.2% |
| 40 to 44 Minutes | 0 | 0.0% |
| 45 to 59 Minutes | 0 | 0.0% |
| 60 to 89 Minutes | 39 | 17.0% |
| 90 or more Minutes | 16 | 7.0% |
Commute Time by Sex in Spur
The most common commute times in Spur are 5 to 9 minutes (68 commuters, 50.0%) for males and less than 5 minutes (28 commuters, 30.1%) for females.
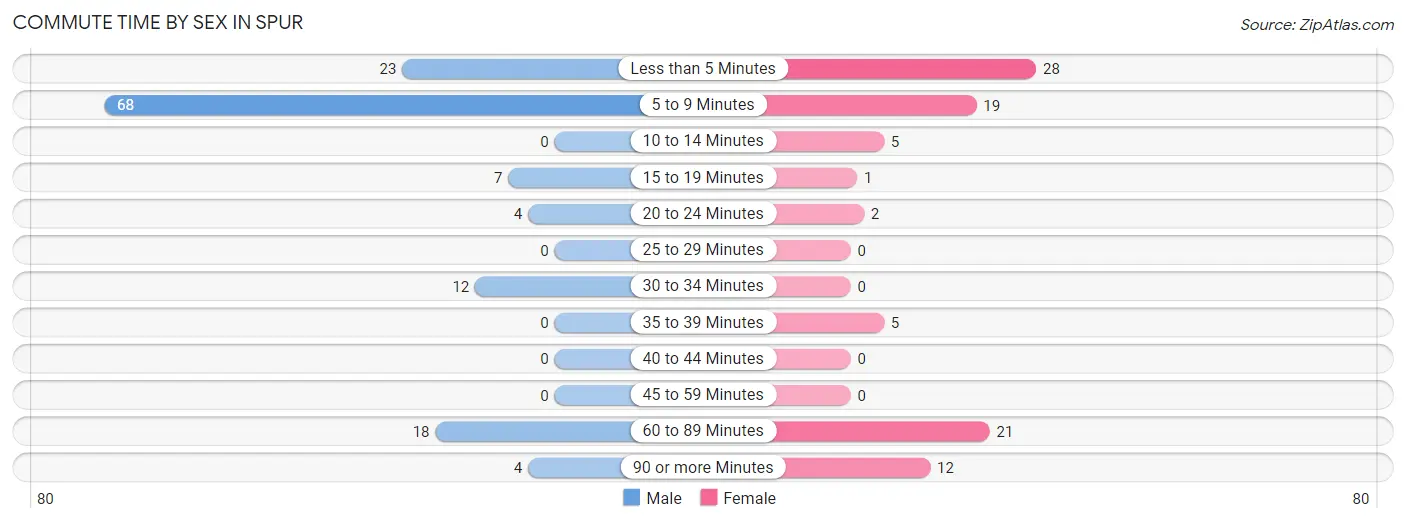
| Commute Time | Male | Female |
| Less than 5 Minutes | 23 (16.9%) | 28 (30.1%) |
| 5 to 9 Minutes | 68 (50.0%) | 19 (20.4%) |
| 10 to 14 Minutes | 0 (0.0%) | 5 (5.4%) |
| 15 to 19 Minutes | 7 (5.1%) | 1 (1.1%) |
| 20 to 24 Minutes | 4 (2.9%) | 2 (2.1%) |
| 25 to 29 Minutes | 0 (0.0%) | 0 (0.0%) |
| 30 to 34 Minutes | 12 (8.8%) | 0 (0.0%) |
| 35 to 39 Minutes | 0 (0.0%) | 5 (5.4%) |
| 40 to 44 Minutes | 0 (0.0%) | 0 (0.0%) |
| 45 to 59 Minutes | 0 (0.0%) | 0 (0.0%) |
| 60 to 89 Minutes | 18 (13.2%) | 21 (22.6%) |
| 90 or more Minutes | 4 (2.9%) | 12 (12.9%) |
Time of Departure to Work by Sex in Spur
The most frequent times of departure to work in Spur are 8:00 AM to 8:29 AM (38, 27.9%) for males and 7:00 AM to 7:29 AM (38, 40.9%) for females.
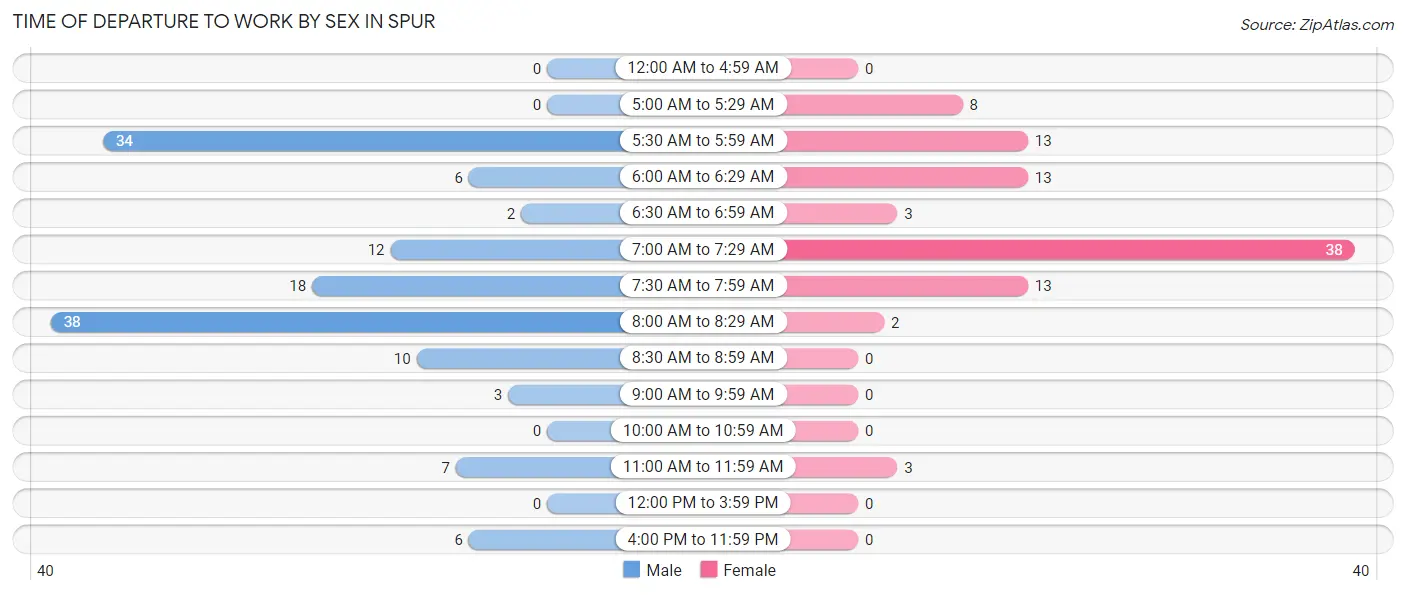
| Time of Departure | Male | Female |
| 12:00 AM to 4:59 AM | 0 (0.0%) | 0 (0.0%) |
| 5:00 AM to 5:29 AM | 0 (0.0%) | 8 (8.6%) |
| 5:30 AM to 5:59 AM | 34 (25.0%) | 13 (14.0%) |
| 6:00 AM to 6:29 AM | 6 (4.4%) | 13 (14.0%) |
| 6:30 AM to 6:59 AM | 2 (1.5%) | 3 (3.2%) |
| 7:00 AM to 7:29 AM | 12 (8.8%) | 38 (40.9%) |
| 7:30 AM to 7:59 AM | 18 (13.2%) | 13 (14.0%) |
| 8:00 AM to 8:29 AM | 38 (27.9%) | 2 (2.1%) |
| 8:30 AM to 8:59 AM | 10 (7.3%) | 0 (0.0%) |
| 9:00 AM to 9:59 AM | 3 (2.2%) | 0 (0.0%) |
| 10:00 AM to 10:59 AM | 0 (0.0%) | 0 (0.0%) |
| 11:00 AM to 11:59 AM | 7 (5.1%) | 3 (3.2%) |
| 12:00 PM to 3:59 PM | 0 (0.0%) | 0 (0.0%) |
| 4:00 PM to 11:59 PM | 6 (4.4%) | 0 (0.0%) |
| Total | 136 (100.0%) | 93 (100.0%) |
Housing Occupancy in Spur
Occupancy by Ownership in Spur
Of the total 304 dwellings in Spur, owner-occupied units account for 235 (77.3%), while renter-occupied units make up 69 (22.7%).
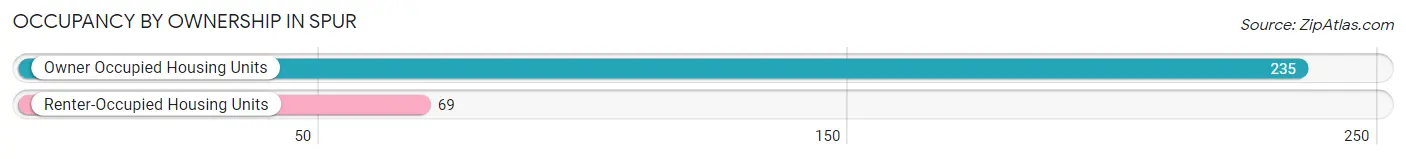
| Occupancy | # Housing Units | % Housing Units |
| Owner Occupied Housing Units | 235 | 77.3% |
| Renter-Occupied Housing Units | 69 | 22.7% |
| Total Occupied Housing Units | 304 | 100.0% |
Occupancy by Household Size in Spur
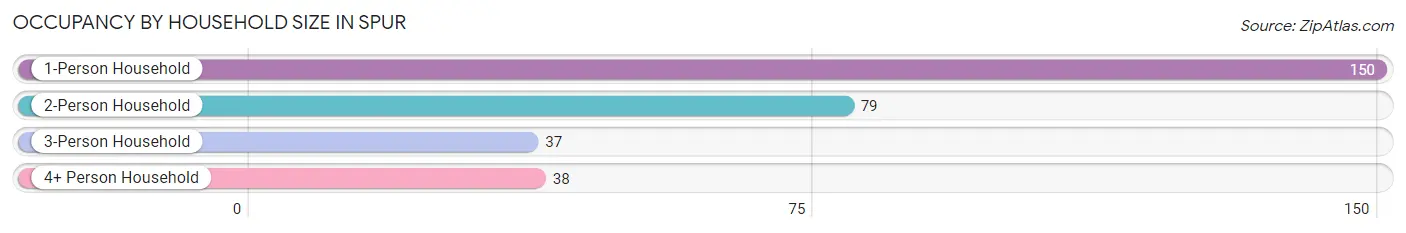
| Household Size | # Housing Units | % Housing Units |
| 1-Person Household | 150 | 49.3% |
| 2-Person Household | 79 | 26.0% |
| 3-Person Household | 37 | 12.2% |
| 4+ Person Household | 38 | 12.5% |
| Total Housing Units | 304 | 100.0% |
Occupancy by Ownership by Household Size in Spur
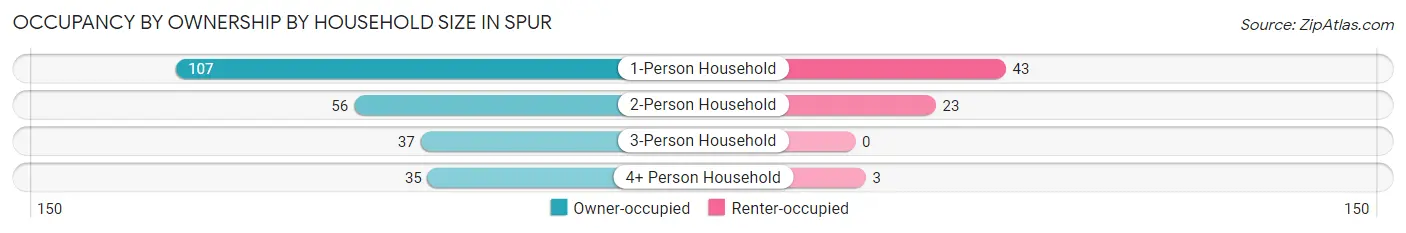
| Household Size | Owner-occupied | Renter-occupied |
| 1-Person Household | 107 (71.3%) | 43 (28.7%) |
| 2-Person Household | 56 (70.9%) | 23 (29.1%) |
| 3-Person Household | 37 (100.0%) | 0 (0.0%) |
| 4+ Person Household | 35 (92.1%) | 3 (7.9%) |
| Total Housing Units | 235 (77.3%) | 69 (22.7%) |
Occupancy by Educational Attainment in Spur
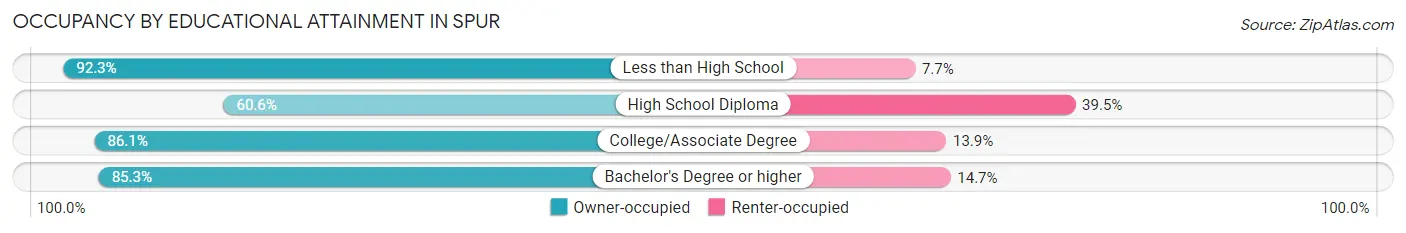
| Household Size | Owner-occupied | Renter-occupied |
| Less than High School | 24 (92.3%) | 2 (7.7%) |
| High School Diploma | 66 (60.6%) | 43 (39.5%) |
| College/Associate Degree | 87 (86.1%) | 14 (13.9%) |
| Bachelor's Degree or higher | 58 (85.3%) | 10 (14.7%) |
Occupancy by Age of Householder in Spur
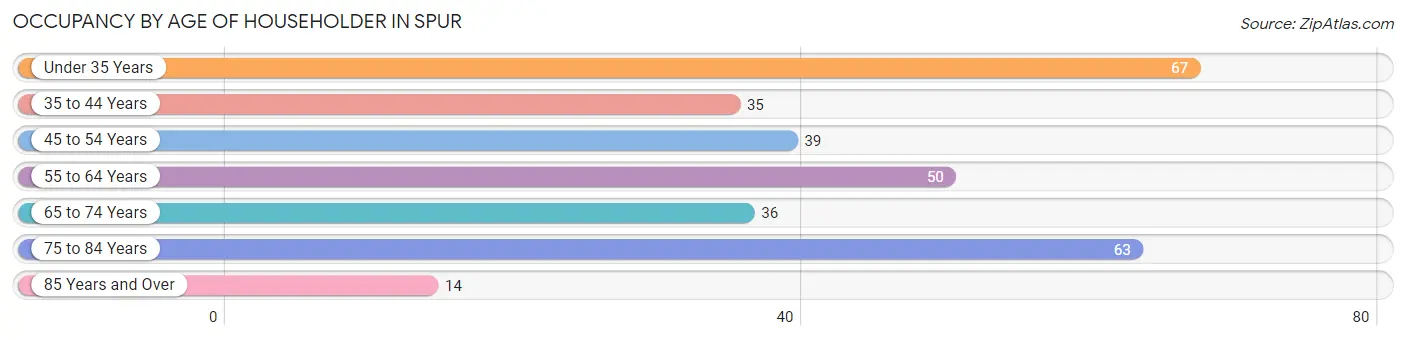
| Age Bracket | # Households | % Households |
| Under 35 Years | 67 | 22.0% |
| 35 to 44 Years | 35 | 11.5% |
| 45 to 54 Years | 39 | 12.8% |
| 55 to 64 Years | 50 | 16.5% |
| 65 to 74 Years | 36 | 11.8% |
| 75 to 84 Years | 63 | 20.7% |
| 85 Years and Over | 14 | 4.6% |
| Total | 304 | 100.0% |
Housing Finances in Spur
Median Income by Occupancy in Spur
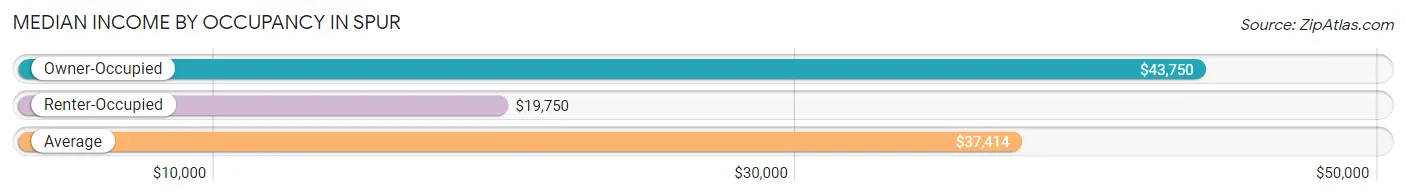
| Occupancy Type | # Households | Median Income |
| Owner-Occupied | 235 (77.3%) | $43,750 |
| Renter-Occupied | 69 (22.7%) | $19,750 |
| Average | 304 (100.0%) | $37,414 |
Occupancy by Householder Income Bracket in Spur
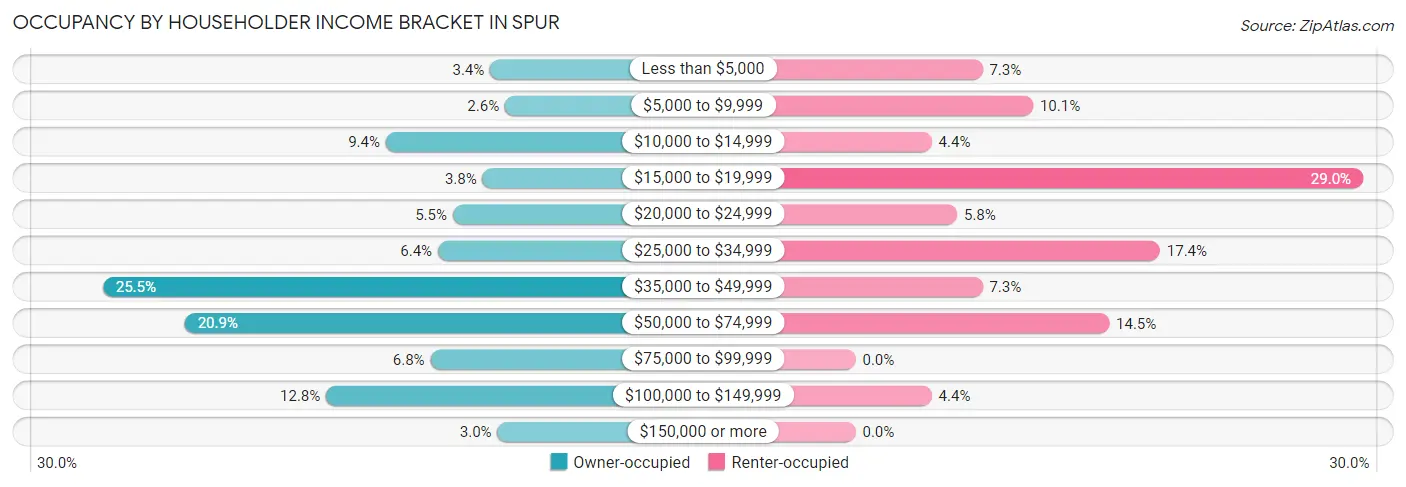
| Income Bracket | Owner-occupied | Renter-occupied |
| Less than $5,000 | 8 (3.4%) | 5 (7.2%) |
| $5,000 to $9,999 | 6 (2.5%) | 7 (10.1%) |
| $10,000 to $14,999 | 22 (9.4%) | 3 (4.3%) |
| $15,000 to $19,999 | 9 (3.8%) | 20 (29.0%) |
| $20,000 to $24,999 | 13 (5.5%) | 4 (5.8%) |
| $25,000 to $34,999 | 15 (6.4%) | 12 (17.4%) |
| $35,000 to $49,999 | 60 (25.5%) | 5 (7.2%) |
| $50,000 to $74,999 | 49 (20.8%) | 10 (14.5%) |
| $75,000 to $99,999 | 16 (6.8%) | 0 (0.0%) |
| $100,000 to $149,999 | 30 (12.8%) | 3 (4.3%) |
| $150,000 or more | 7 (3.0%) | 0 (0.0%) |
| Total | 235 (100.0%) | 69 (100.0%) |
Monthly Housing Cost Tiers in Spur
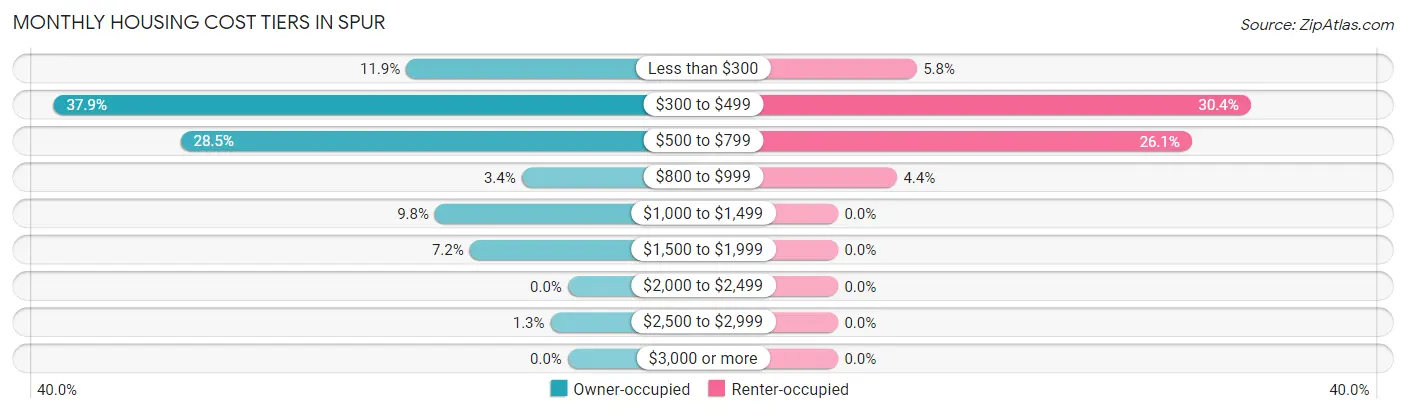
| Monthly Cost | Owner-occupied | Renter-occupied |
| Less than $300 | 28 (11.9%) | 4 (5.8%) |
| $300 to $499 | 89 (37.9%) | 21 (30.4%) |
| $500 to $799 | 67 (28.5%) | 18 (26.1%) |
| $800 to $999 | 8 (3.4%) | 3 (4.3%) |
| $1,000 to $1,499 | 23 (9.8%) | 0 (0.0%) |
| $1,500 to $1,999 | 17 (7.2%) | 0 (0.0%) |
| $2,000 to $2,499 | 0 (0.0%) | 0 (0.0%) |
| $2,500 to $2,999 | 3 (1.3%) | 0 (0.0%) |
| $3,000 or more | 0 (0.0%) | 0 (0.0%) |
| Total | 235 (100.0%) | 69 (100.0%) |
Physical Housing Characteristics in Spur
Housing Structures in Spur
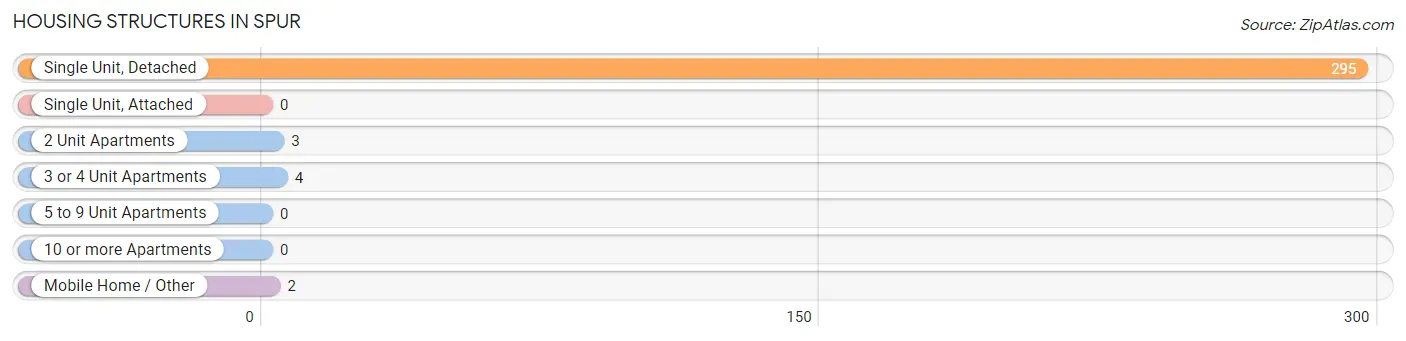
| Structure Type | # Housing Units | % Housing Units |
| Single Unit, Detached | 295 | 97.0% |
| Single Unit, Attached | 0 | 0.0% |
| 2 Unit Apartments | 3 | 1.0% |
| 3 or 4 Unit Apartments | 4 | 1.3% |
| 5 to 9 Unit Apartments | 0 | 0.0% |
| 10 or more Apartments | 0 | 0.0% |
| Mobile Home / Other | 2 | 0.7% |
| Total | 304 | 100.0% |
Housing Structures by Occupancy in Spur
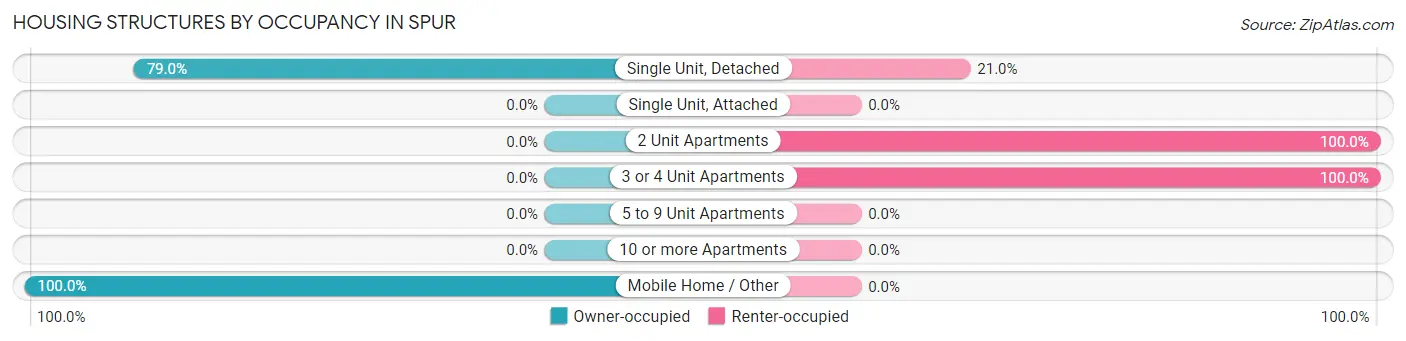
| Structure Type | Owner-occupied | Renter-occupied |
| Single Unit, Detached | 233 (79.0%) | 62 (21.0%) |
| Single Unit, Attached | 0 (0.0%) | 0 (0.0%) |
| 2 Unit Apartments | 0 (0.0%) | 3 (100.0%) |
| 3 or 4 Unit Apartments | 0 (0.0%) | 4 (100.0%) |
| 5 to 9 Unit Apartments | 0 (0.0%) | 0 (0.0%) |
| 10 or more Apartments | 0 (0.0%) | 0 (0.0%) |
| Mobile Home / Other | 2 (100.0%) | 0 (0.0%) |
| Total | 235 (77.3%) | 69 (22.7%) |
Housing Structures by Number of Rooms in Spur
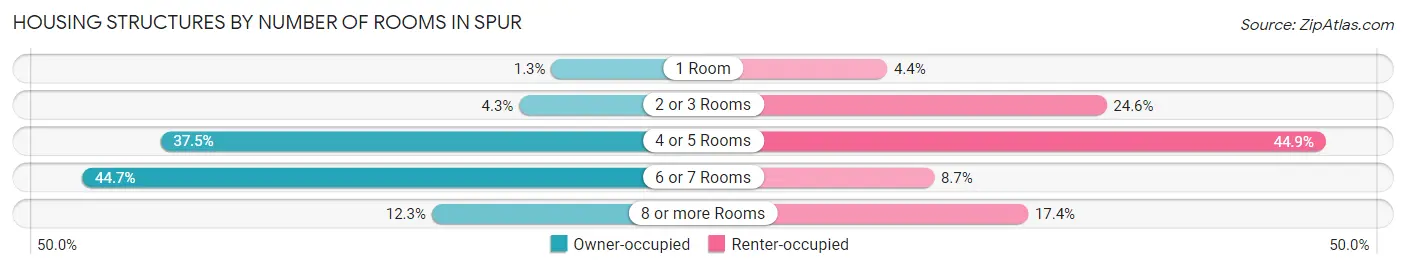
| Number of Rooms | Owner-occupied | Renter-occupied |
| 1 Room | 3 (1.3%) | 3 (4.3%) |
| 2 or 3 Rooms | 10 (4.3%) | 17 (24.6%) |
| 4 or 5 Rooms | 88 (37.4%) | 31 (44.9%) |
| 6 or 7 Rooms | 105 (44.7%) | 6 (8.7%) |
| 8 or more Rooms | 29 (12.3%) | 12 (17.4%) |
| Total | 235 (100.0%) | 69 (100.0%) |
Housing Structure by Heating Type in Spur
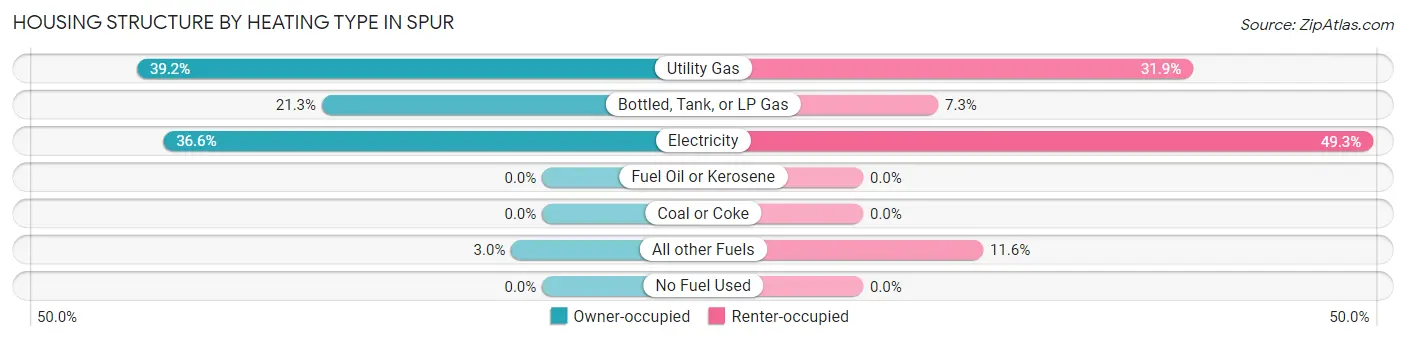
| Heating Type | Owner-occupied | Renter-occupied |
| Utility Gas | 92 (39.2%) | 22 (31.9%) |
| Bottled, Tank, or LP Gas | 50 (21.3%) | 5 (7.2%) |
| Electricity | 86 (36.6%) | 34 (49.3%) |
| Fuel Oil or Kerosene | 0 (0.0%) | 0 (0.0%) |
| Coal or Coke | 0 (0.0%) | 0 (0.0%) |
| All other Fuels | 7 (3.0%) | 8 (11.6%) |
| No Fuel Used | 0 (0.0%) | 0 (0.0%) |
| Total | 235 (100.0%) | 69 (100.0%) |
Household Vehicle Usage in Spur
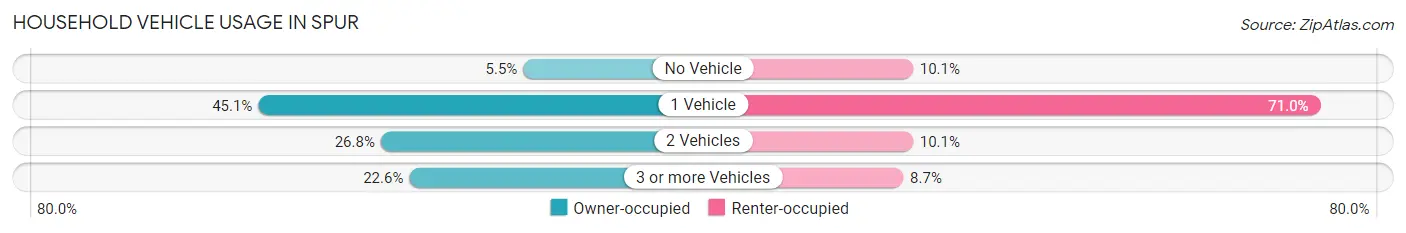
| Vehicles per Household | Owner-occupied | Renter-occupied |
| No Vehicle | 13 (5.5%) | 7 (10.1%) |
| 1 Vehicle | 106 (45.1%) | 49 (71.0%) |
| 2 Vehicles | 63 (26.8%) | 7 (10.1%) |
| 3 or more Vehicles | 53 (22.6%) | 6 (8.7%) |
| Total | 235 (100.0%) | 69 (100.0%) |
Real Estate & Mortgages in Spur
Real Estate and Mortgage Overview in Spur
| Characteristic | Without Mortgage | With Mortgage |
| Housing Units | 188 | 47 |
| Median Property Value | $48,200 | $125,600 |
| Median Household Income | $43,889 | $0 |
| Monthly Housing Costs | $432 | $0 |
| Real Estate Taxes | $815 | $0 |
Property Value by Mortgage Status in Spur
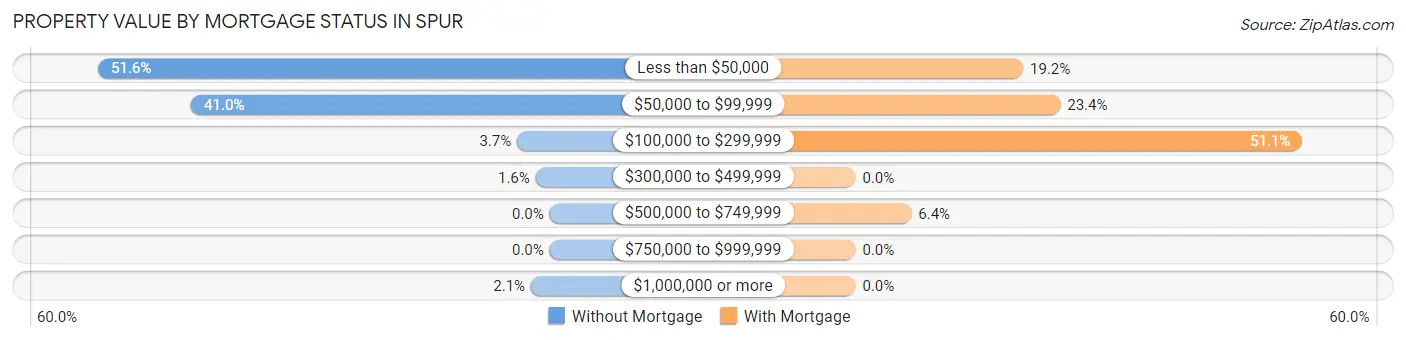
| Property Value | Without Mortgage | With Mortgage |
| Less than $50,000 | 97 (51.6%) | 9 (19.2%) |
| $50,000 to $99,999 | 77 (41.0%) | 11 (23.4%) |
| $100,000 to $299,999 | 7 (3.7%) | 24 (51.1%) |
| $300,000 to $499,999 | 3 (1.6%) | 0 (0.0%) |
| $500,000 to $749,999 | 0 (0.0%) | 3 (6.4%) |
| $750,000 to $999,999 | 0 (0.0%) | 0 (0.0%) |
| $1,000,000 or more | 4 (2.1%) | 0 (0.0%) |
| Total | 188 (100.0%) | 47 (100.0%) |
Household Income by Mortgage Status in Spur
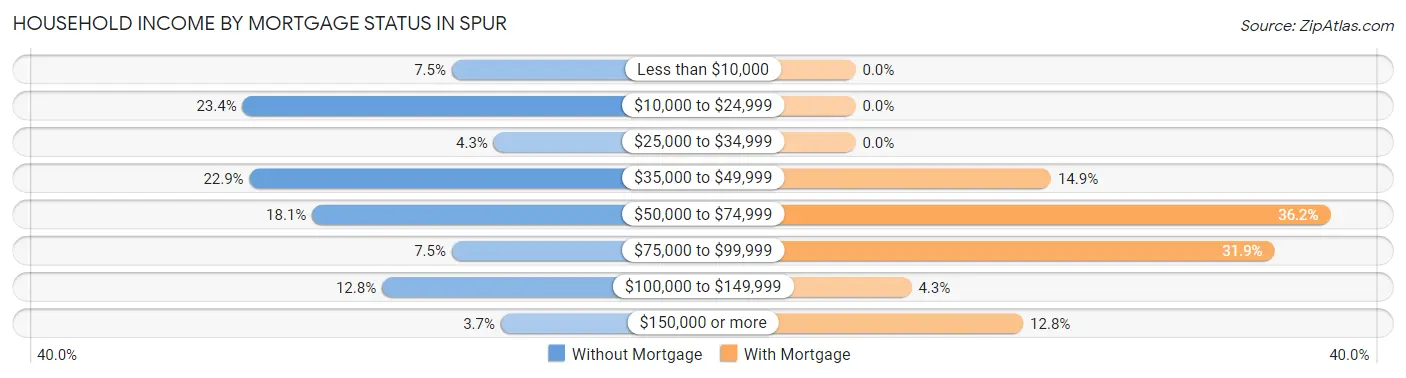
| Household Income | Without Mortgage | With Mortgage |
| Less than $10,000 | 14 (7.4%) | 0 (0.0%) |
| $10,000 to $24,999 | 44 (23.4%) | 0 (0.0%) |
| $25,000 to $34,999 | 8 (4.3%) | 0 (0.0%) |
| $35,000 to $49,999 | 43 (22.9%) | 7 (14.9%) |
| $50,000 to $74,999 | 34 (18.1%) | 17 (36.2%) |
| $75,000 to $99,999 | 14 (7.4%) | 15 (31.9%) |
| $100,000 to $149,999 | 24 (12.8%) | 2 (4.3%) |
| $150,000 or more | 7 (3.7%) | 6 (12.8%) |
| Total | 188 (100.0%) | 47 (100.0%) |
Property Value to Household Income Ratio in Spur
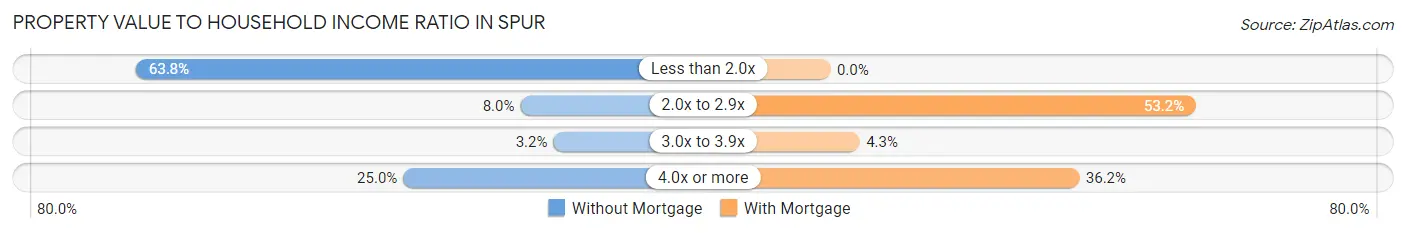
| Value-to-Income Ratio | Without Mortgage | With Mortgage |
| Less than 2.0x | 120 (63.8%) | 0 (0.0%) |
| 2.0x to 2.9x | 15 (8.0%) | 25 (53.2%) |
| 3.0x to 3.9x | 6 (3.2%) | 2 (4.3%) |
| 4.0x or more | 47 (25.0%) | 17 (36.2%) |
| Total | 188 (100.0%) | 47 (100.0%) |
Real Estate Taxes by Mortgage Status in Spur
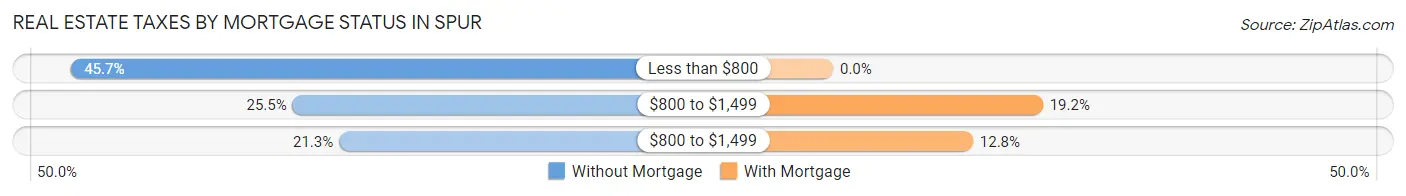
| Property Taxes | Without Mortgage | With Mortgage |
| Less than $800 | 86 (45.7%) | 0 (0.0%) |
| $800 to $1,499 | 48 (25.5%) | 9 (19.2%) |
| $800 to $1,499 | 40 (21.3%) | 6 (12.8%) |
| Total | 188 (100.0%) | 47 (100.0%) |
Health & Disability in Spur
Health Insurance Coverage by Age in Spur
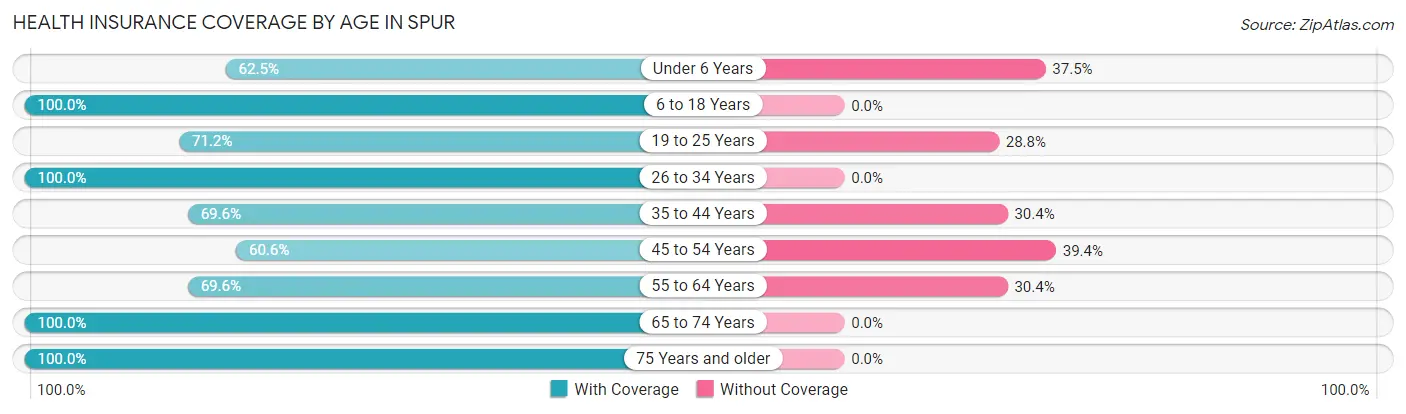
| Age Bracket | With Coverage | Without Coverage |
| Under 6 Years | 50 (62.5%) | 30 (37.5%) |
| 6 to 18 Years | 77 (100.0%) | 0 (0.0%) |
| 19 to 25 Years | 84 (71.2%) | 34 (28.8%) |
| 26 to 34 Years | 82 (100.0%) | 0 (0.0%) |
| 35 to 44 Years | 48 (69.6%) | 21 (30.4%) |
| 45 to 54 Years | 43 (60.6%) | 28 (39.4%) |
| 55 to 64 Years | 64 (69.6%) | 28 (30.4%) |
| 65 to 74 Years | 54 (100.0%) | 0 (0.0%) |
| 75 Years and older | 87 (100.0%) | 0 (0.0%) |
| Total | 589 (80.7%) | 141 (19.3%) |
Health Insurance Coverage by Citizenship Status in Spur
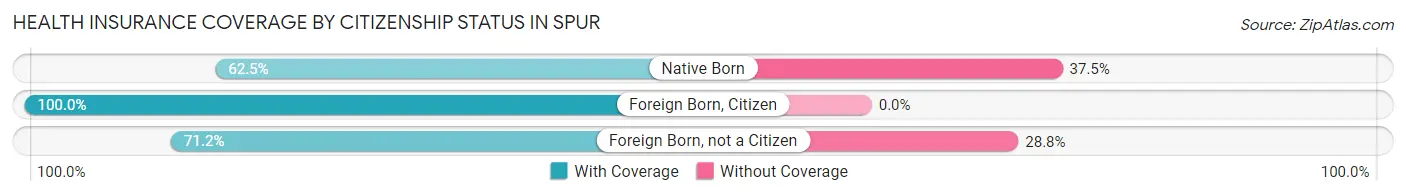
| Citizenship Status | With Coverage | Without Coverage |
| Native Born | 50 (62.5%) | 30 (37.5%) |
| Foreign Born, Citizen | 77 (100.0%) | 0 (0.0%) |
| Foreign Born, not a Citizen | 84 (71.2%) | 34 (28.8%) |
Health Insurance Coverage by Household Income in Spur
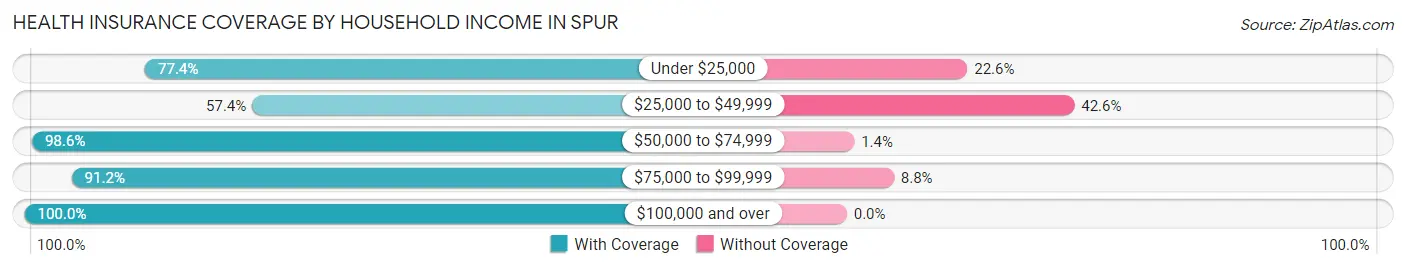
| Household Income | With Coverage | Without Coverage |
| Under $25,000 | 120 (77.4%) | 35 (22.6%) |
| $25,000 to $49,999 | 136 (57.4%) | 101 (42.6%) |
| $50,000 to $74,999 | 142 (98.6%) | 2 (1.4%) |
| $75,000 to $99,999 | 31 (91.2%) | 3 (8.8%) |
| $100,000 and over | 160 (100.0%) | 0 (0.0%) |
Public vs Private Health Insurance Coverage by Age in Spur
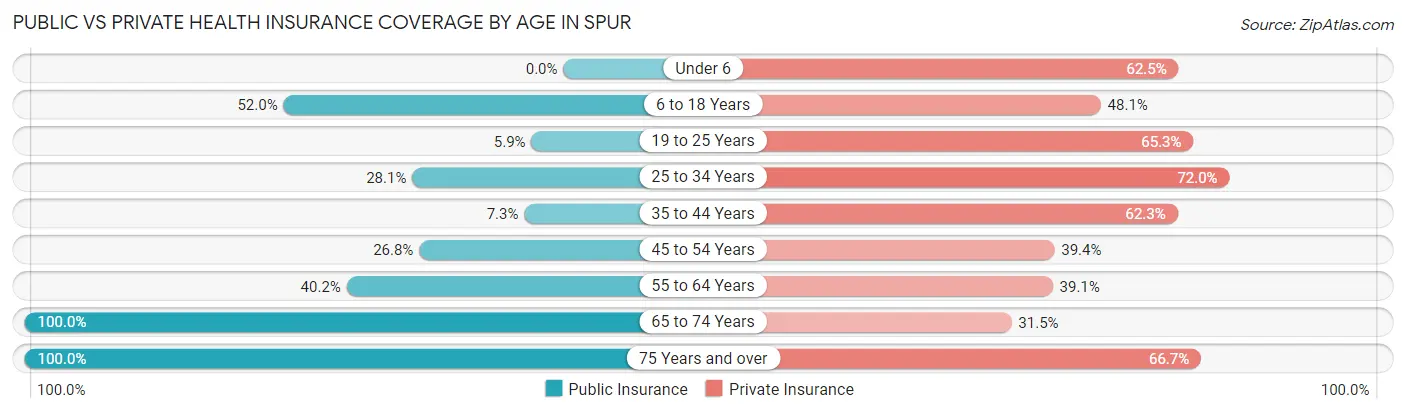
| Age Bracket | Public Insurance | Private Insurance |
| Under 6 | 0 (0.0%) | 50 (62.5%) |
| 6 to 18 Years | 40 (51.9%) | 37 (48.0%) |
| 19 to 25 Years | 7 (5.9%) | 77 (65.2%) |
| 25 to 34 Years | 23 (28.1%) | 59 (72.0%) |
| 35 to 44 Years | 5 (7.2%) | 43 (62.3%) |
| 45 to 54 Years | 19 (26.8%) | 28 (39.4%) |
| 55 to 64 Years | 37 (40.2%) | 36 (39.1%) |
| 65 to 74 Years | 54 (100.0%) | 17 (31.5%) |
| 75 Years and over | 87 (100.0%) | 58 (66.7%) |
| Total | 272 (37.3%) | 405 (55.5%) |
Disability Status by Sex by Age in Spur
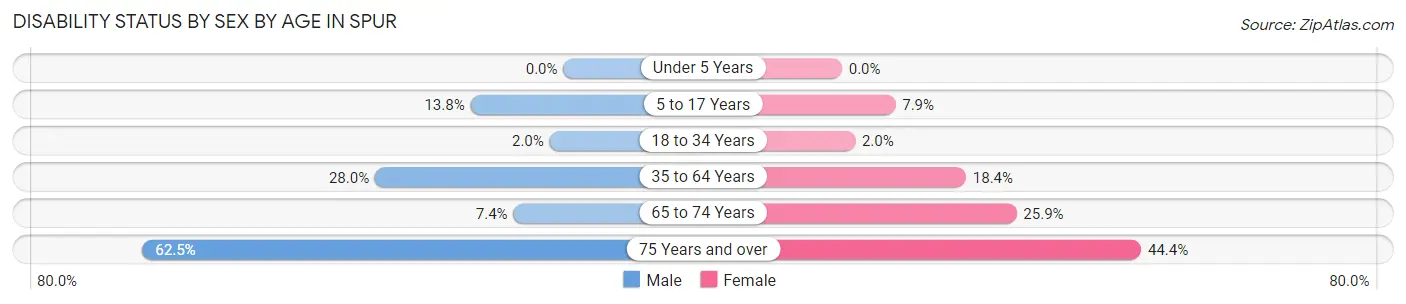
| Age Bracket | Male | Female |
| Under 5 Years | 0 (0.0%) | 0 (0.0%) |
| 5 to 17 Years | 4 (13.8%) | 5 (7.9%) |
| 18 to 34 Years | 2 (2.0%) | 2 (2.0%) |
| 35 to 64 Years | 33 (28.0%) | 21 (18.4%) |
| 65 to 74 Years | 2 (7.4%) | 7 (25.9%) |
| 75 Years and over | 15 (62.5%) | 28 (44.4%) |
Disability Class by Sex by Age in Spur
Disability Class: Hearing Difficulty
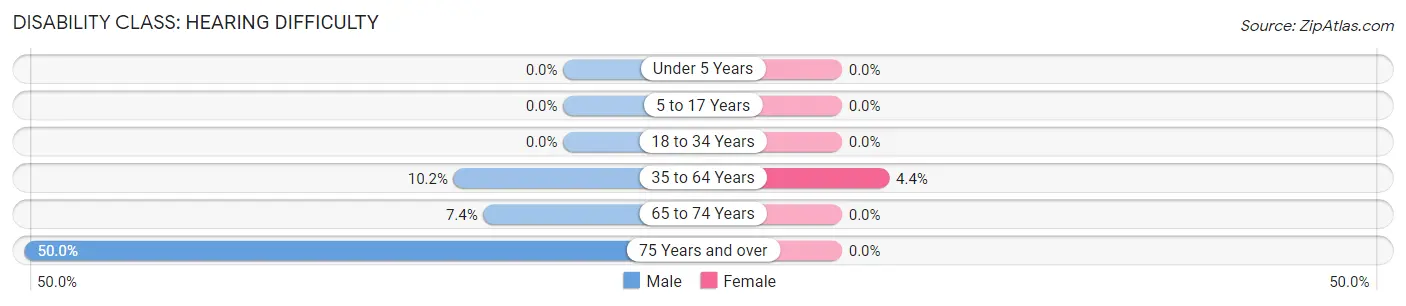
| Age Bracket | Male | Female |
| Under 5 Years | 0 (0.0%) | 0 (0.0%) |
| 5 to 17 Years | 0 (0.0%) | 0 (0.0%) |
| 18 to 34 Years | 0 (0.0%) | 0 (0.0%) |
| 35 to 64 Years | 12 (10.2%) | 5 (4.4%) |
| 65 to 74 Years | 2 (7.4%) | 0 (0.0%) |
| 75 Years and over | 12 (50.0%) | 0 (0.0%) |
Disability Class: Vision Difficulty
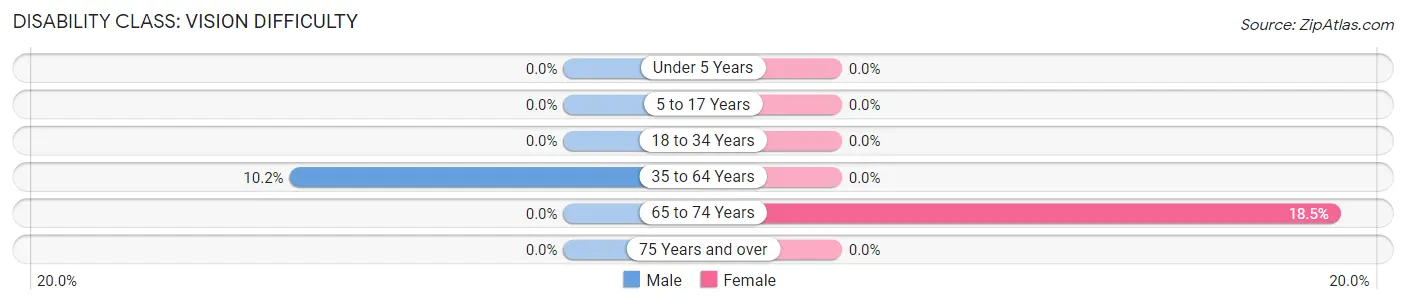
| Age Bracket | Male | Female |
| Under 5 Years | 0 (0.0%) | 0 (0.0%) |
| 5 to 17 Years | 0 (0.0%) | 0 (0.0%) |
| 18 to 34 Years | 0 (0.0%) | 0 (0.0%) |
| 35 to 64 Years | 12 (10.2%) | 0 (0.0%) |
| 65 to 74 Years | 0 (0.0%) | 5 (18.5%) |
| 75 Years and over | 0 (0.0%) | 0 (0.0%) |
Disability Class: Cognitive Difficulty
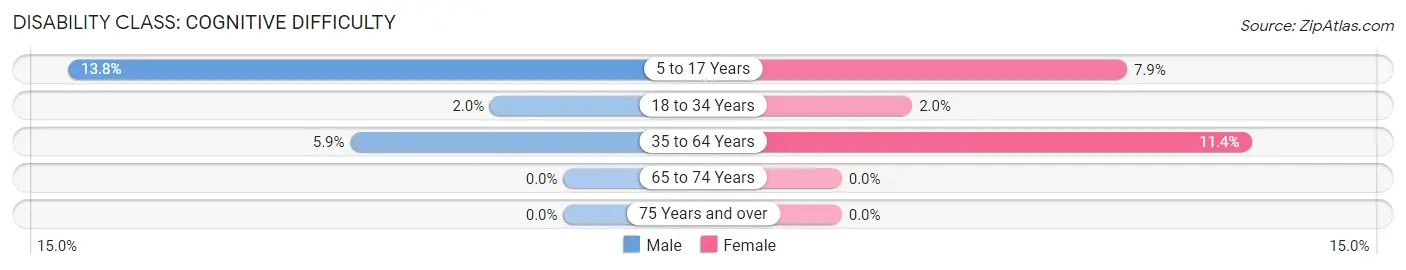
| Age Bracket | Male | Female |
| 5 to 17 Years | 4 (13.8%) | 5 (7.9%) |
| 18 to 34 Years | 2 (2.0%) | 2 (2.0%) |
| 35 to 64 Years | 7 (5.9%) | 13 (11.4%) |
| 65 to 74 Years | 0 (0.0%) | 0 (0.0%) |
| 75 Years and over | 0 (0.0%) | 0 (0.0%) |
Disability Class: Ambulatory Difficulty
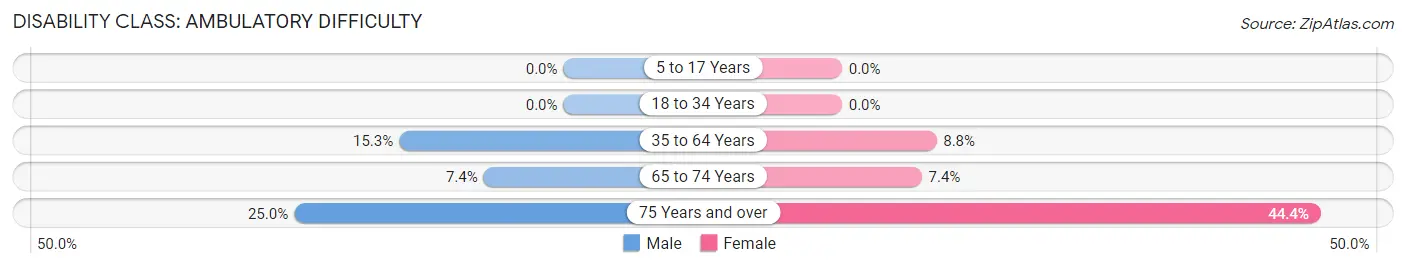
| Age Bracket | Male | Female |
| 5 to 17 Years | 0 (0.0%) | 0 (0.0%) |
| 18 to 34 Years | 0 (0.0%) | 0 (0.0%) |
| 35 to 64 Years | 18 (15.2%) | 10 (8.8%) |
| 65 to 74 Years | 2 (7.4%) | 2 (7.4%) |
| 75 Years and over | 6 (25.0%) | 28 (44.4%) |
Disability Class: Self-Care Difficulty
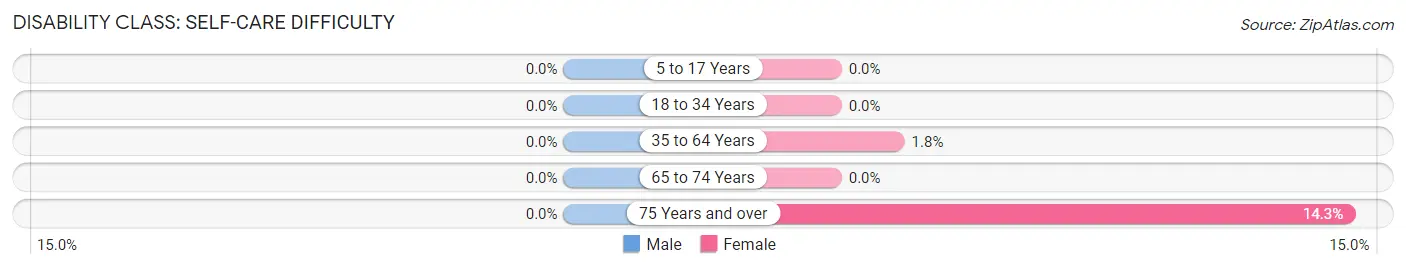
| Age Bracket | Male | Female |
| 5 to 17 Years | 0 (0.0%) | 0 (0.0%) |
| 18 to 34 Years | 0 (0.0%) | 0 (0.0%) |
| 35 to 64 Years | 0 (0.0%) | 2 (1.8%) |
| 65 to 74 Years | 0 (0.0%) | 0 (0.0%) |
| 75 Years and over | 0 (0.0%) | 9 (14.3%) |
Technology Access in Spur
Computing Device Access in Spur
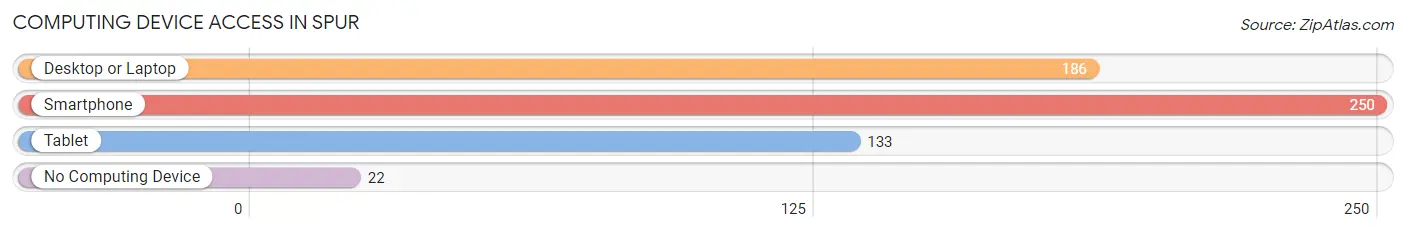
| Device Type | # Households | % Households |
| Desktop or Laptop | 186 | 61.2% |
| Smartphone | 250 | 82.2% |
| Tablet | 133 | 43.8% |
| No Computing Device | 22 | 7.2% |
| Total | 304 | 100.0% |
Internet Access in Spur
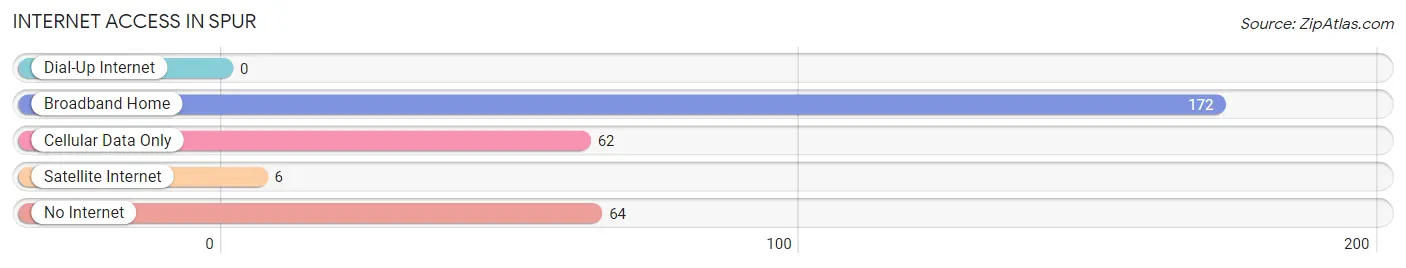
| Internet Type | # Households | % Households |
| Dial-Up Internet | 0 | 0.0% |
| Broadband Home | 172 | 56.6% |
| Cellular Data Only | 62 | 20.4% |
| Satellite Internet | 6 | 2.0% |
| No Internet | 64 | 21.0% |
| Total | 304 | 100.0% |
Spur Summary
Spur, Texas is a small town located in the northwest corner of Dickens County in the Texas Panhandle. It is situated on the banks of the Salt Fork of the Brazos River, approximately 100 miles southeast of Lubbock and 130 miles northwest of Abilene. The town was founded in 1887 and incorporated in 1909. It is the county seat of Dickens County and is home to a population of approximately 1,500 people.
History
The area around Spur was first settled in the late 1870s by ranchers and farmers. The town was originally known as Salt Fork, but was renamed Spur in 1887 after a railroad spur line was built to the area. The town was officially incorporated in 1909 and the first mayor was elected in 1910.
In the early 1900s, Spur was a thriving agricultural and ranching community. The town was home to several cotton gins, a flour mill, a creamery, and a cottonseed oil mill. The town also had a bank, a hotel, a newspaper, and several churches.
In the 1920s, Spur experienced a period of growth and prosperity. The town was home to several businesses, including a movie theater, a bowling alley, and a dance hall. The town also had a hospital, a library, and a public school.
In the 1930s, the Great Depression hit Spur hard. Many businesses closed and the population declined. The town was able to survive, however, and by the 1940s, the economy had begun to recover.
In the 1950s, Spur experienced a period of growth and development. The town was home to several new businesses, including a grocery store, a hardware store, and a furniture store. The town also had a new hospital, a new library, and a new public school.
In the 1960s, Spur experienced a period of decline. Many businesses closed and the population declined. The town was able to survive, however, and by the 1970s, the economy had begun to recover.
In the 1980s, Spur experienced a period of growth and development. The town was home to several new businesses, including a restaurant, a convenience store, and a gas station. The town also had a new hospital, a new library, and a new public school.
In the 1990s, Spur experienced a period of growth and development. The town was home to several new businesses, including a grocery store, a hardware store, and a furniture store. The town also had a new hospital, a new library, and a new public school.
Geography
Spur is located in the northwest corner of Dickens County in the Texas Panhandle. It is situated on the banks of the Salt Fork of the Brazos River, approximately 100 miles southeast of Lubbock and 130 miles northwest of Abilene. The town is located at an elevation of 2,400 feet and has a total area of 1.2 square miles.
Economy
The economy of Spur is largely based on agriculture and ranching. The town is home to several cotton gins, a flour mill, a creamery, and a cottonseed oil mill. The town also has several businesses, including a grocery store, a hardware store, a furniture store, a restaurant, a convenience store, and a gas station.
Demographics
As of the 2010 census, Spur had a population of 1,521 people. The racial makeup of the town was 94.3% White, 0.2% African American, 0.7% Native American, 0.2% Asian, 0.1% Pacific Islander, 3.2% from other races, and 1.5% from two or more races. Hispanic or Latino of any race were 6.2% of the population.
The median household income in Spur was $30,938 and the median family income was $37,500. The per capita income for the town was $15,945. About 17.2% of families and 20.3% of the population were below the poverty line, including 28.3% of those under age 18 and 11.2% of those age 65 or over.
Common Questions
What is Per Capita Income in Spur?
Per Capita income in Spur is $20,324.
What is the Median Family Income in Spur?
Median Family Income in Spur is $61,458.
What is the Median Household income in Spur?
Median Household Income in Spur is $37,414.
What is Income or Wage Gap in Spur?
Income or Wage Gap in Spur is 26.4%.
Women in Spur earn 73.6 cents for every dollar earned by a man.
What is Inequality or Gini Index in Spur?
Inequality or Gini Index in Spur is 0.43.
What is the Total Population of Spur?
Total Population of Spur is 778.
What is the Total Male Population of Spur?
Total Male Population of Spur is 365.
What is the Total Female Population of Spur?
Total Female Population of Spur is 413.
What is the Ratio of Males per 100 Females in Spur?
There are 88.38 Males per 100 Females in Spur.
What is the Ratio of Females per 100 Males in Spur?
There are 113.15 Females per 100 Males in Spur.
What is the Median Population Age in Spur?
Median Population Age in Spur is 36.2 Years.
What is the Average Family Size in Spur
Average Family Size in Spur is 3.8 People.
What is the Average Household Size in Spur
Average Household Size in Spur is 2.4 People.
How Large is the Labor Force in Spur?
There are 284 People in the Labor Forcein in Spur.
What is the Percentage of People in the Labor Force in Spur?
44.1% of People are in the Labor Force in Spur.
What is the Unemployment Rate in Spur?
Unemployment Rate in Spur is 18.3%.