Spring Branch, TX Map & Demographics
Spring Branch Map
Spring Branch Overview
$50,993
PER CAPITA INCOME
$66,436
AVG FAMILY INCOME
$152,750
AVG HOUSEHOLD INCOME
23.9%
WAGE / INCOME GAP [ % ]
76.1¢/ $1
WAGE / INCOME GAP [ $ ]
0.32
INEQUALITY / GINI INDEX
191
TOTAL POPULATION
73
MALE POPULATION
118
FEMALE POPULATION
61.86
MALES / 100 FEMALES
161.64
FEMALES / 100 MALES
49.6
MEDIAN AGE
1.9
AVG FAMILY SIZE
2.1
AVG HOUSEHOLD SIZE
129
LABOR FORCE [ PEOPLE ]
73.7%
PERCENT IN LABOR FORCE
1.6%
UNEMPLOYMENT RATE
Spring Branch Zip Codes
Spring Branch Area Codes
Income in Spring Branch
Income Overview in Spring Branch
Per Capita Income in Spring Branch is $50,993, while median incomes of families and households are $66,436 and $152,750 respectively.
| Characteristic | Number | Measure |
| Per Capita Income | 191 | $50,993 |
| Median Family Income | 64 | $66,436 |
| Mean Family Income | 64 | $86,263 |
| Median Household Income | 89 | $152,750 |
| Mean Household Income | 89 | $113,206 |
| Income Deficit | 64 | $0 |
| Wage / Income Gap (%) | 191 | 23.92% |
| Wage / Income Gap ($) | 191 | 76.08¢ per $1 |
| Gini / Inequality Index | 191 | 0.32 |
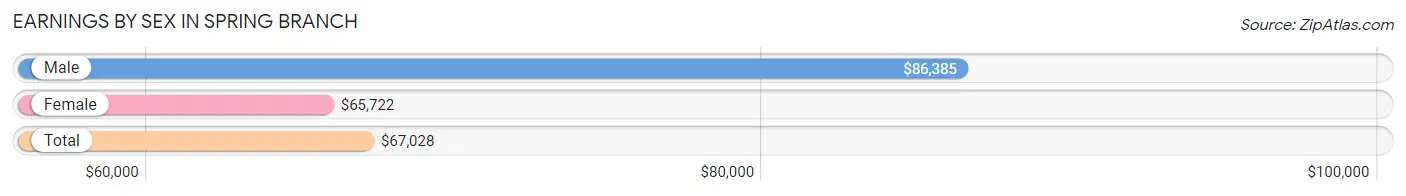
Earnings by Sex in Spring Branch
Average Earnings in Spring Branch are $67,028, $86,385 for men and $65,722 for women, a difference of 23.9%.
| Sex | Number | Average Earnings |
| Male | 61 (48.0%) | $86,385 |
| Female | 66 (52.0%) | $65,722 |
| Total | 127 (100.0%) | $67,028 |
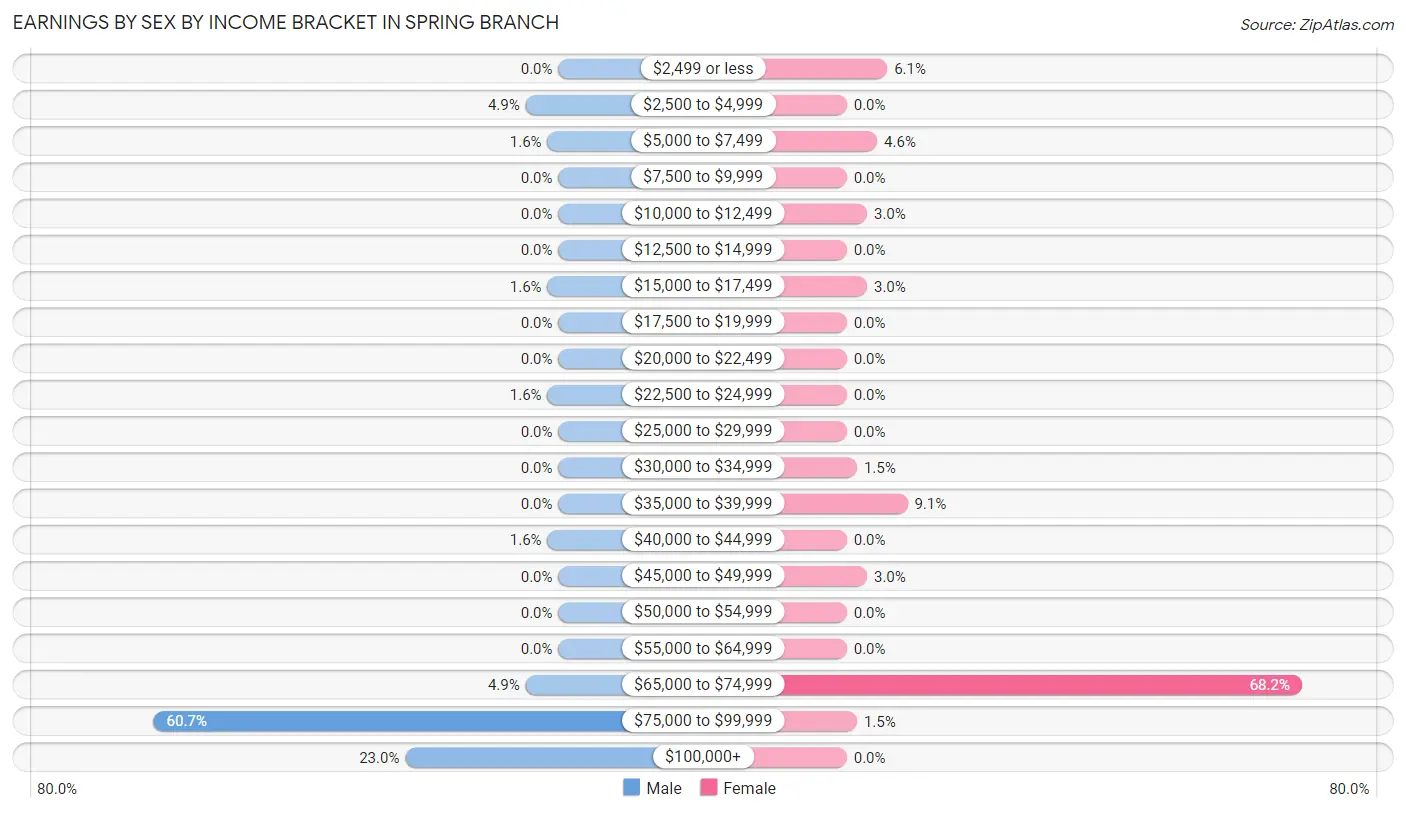
Earnings by Sex by Income Bracket in Spring Branch
The most common earnings brackets in Spring Branch are $75,000 to $99,999 for men (37 | 60.7%) and $65,000 to $74,999 for women (45 | 68.2%).
| Income | Male | Female |
| $2,499 or less | 0 (0.0%) | 4 (6.1%) |
| $2,500 to $4,999 | 3 (4.9%) | 0 (0.0%) |
| $5,000 to $7,499 | 1 (1.6%) | 3 (4.5%) |
| $7,500 to $9,999 | 0 (0.0%) | 0 (0.0%) |
| $10,000 to $12,499 | 0 (0.0%) | 2 (3.0%) |
| $12,500 to $14,999 | 0 (0.0%) | 0 (0.0%) |
| $15,000 to $17,499 | 1 (1.6%) | 2 (3.0%) |
| $17,500 to $19,999 | 0 (0.0%) | 0 (0.0%) |
| $20,000 to $22,499 | 0 (0.0%) | 0 (0.0%) |
| $22,500 to $24,999 | 1 (1.6%) | 0 (0.0%) |
| $25,000 to $29,999 | 0 (0.0%) | 0 (0.0%) |
| $30,000 to $34,999 | 0 (0.0%) | 1 (1.5%) |
| $35,000 to $39,999 | 0 (0.0%) | 6 (9.1%) |
| $40,000 to $44,999 | 1 (1.6%) | 0 (0.0%) |
| $45,000 to $49,999 | 0 (0.0%) | 2 (3.0%) |
| $50,000 to $54,999 | 0 (0.0%) | 0 (0.0%) |
| $55,000 to $64,999 | 0 (0.0%) | 0 (0.0%) |
| $65,000 to $74,999 | 3 (4.9%) | 45 (68.2%) |
| $75,000 to $99,999 | 37 (60.7%) | 1 (1.5%) |
| $100,000+ | 14 (23.0%) | 0 (0.0%) |
| Total | 61 (100.0%) | 66 (100.0%) |
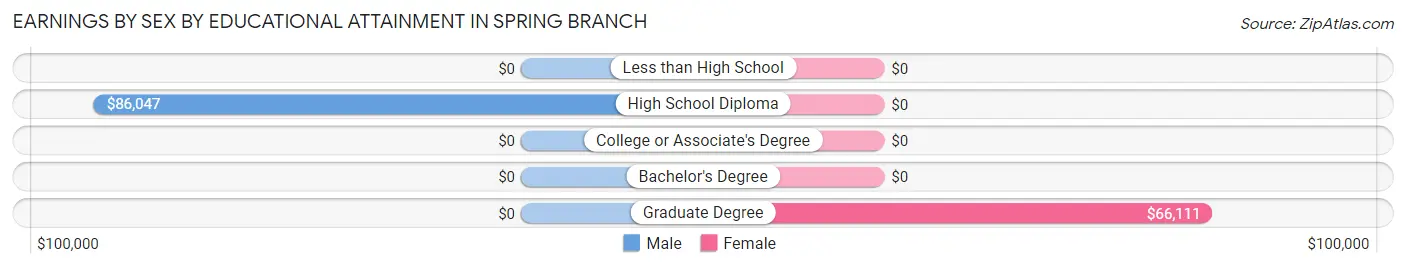
Earnings by Sex by Educational Attainment in Spring Branch
Average earnings in Spring Branch are $86,149 for men and $65,722 for women, a difference of 23.7%. Men with an educational attainment of high school diploma enjoy the highest average annual earnings of $86,047, while those with high school diploma education earn the least with $86,047. Women with an educational attainment of graduate degree earn the most with the average annual earnings of $66,111, while those with graduate degree education have the smallest earnings of $66,111.
| Educational Attainment | Male Income | Female Income |
| Less than High School | - | - |
| High School Diploma | $86,047 | $0 |
| College or Associate's Degree | - | - |
| Bachelor's Degree | - | - |
| Graduate Degree | - | - |
| Total | $86,149 | $65,722 |
Family Income in Spring Branch
Family Income Brackets in Spring Branch
According to the Spring Branch family income data, there are 47 families falling into the $50,000 to $74,999 income range, which is the most common income bracket and makes up 73.4% of all families.
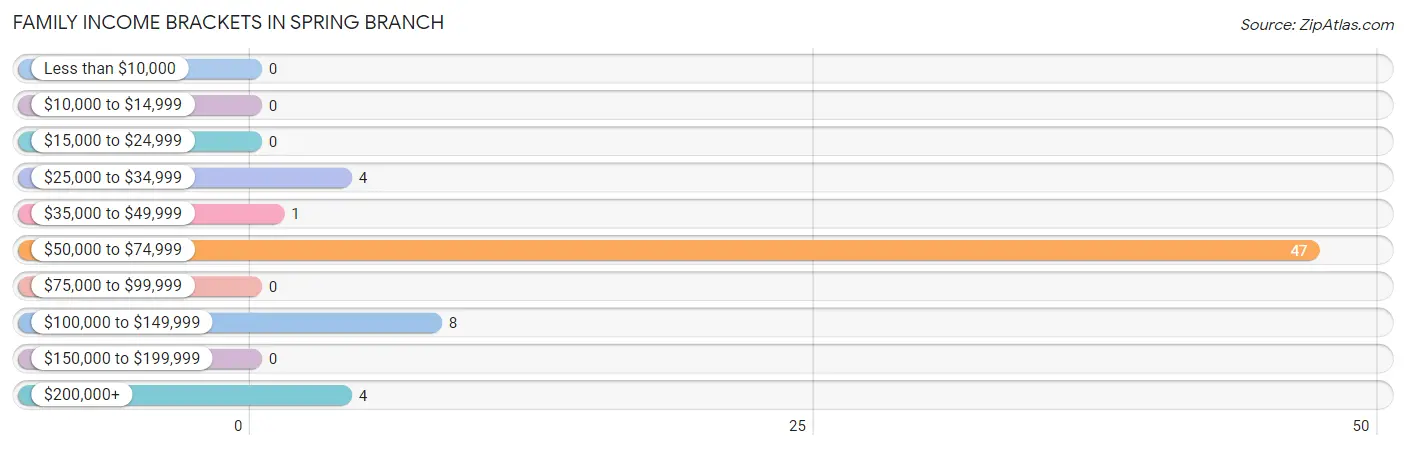
| Income Bracket | # Families | % Families |
| Less than $10,000 | 0 | 0.0% |
| $10,000 to $14,999 | 0 | 0.0% |
| $15,000 to $24,999 | 0 | 0.0% |
| $25,000 to $34,999 | 4 | 6.3% |
| $35,000 to $49,999 | 1 | 1.6% |
| $50,000 to $74,999 | 47 | 73.4% |
| $75,000 to $99,999 | 0 | 0.0% |
| $100,000 to $149,999 | 8 | 12.5% |
| $150,000 to $199,999 | 0 | 0.0% |
| $200,000+ | 4 | 6.3% |
Family Income by Famaliy Size in Spring Branch
2-person families (57 | 89.1%) account for the highest median family income in Spring Branch with $66,303 per family, while 2-person families (57 | 89.1%) have the highest median income of $33,152 per family member.
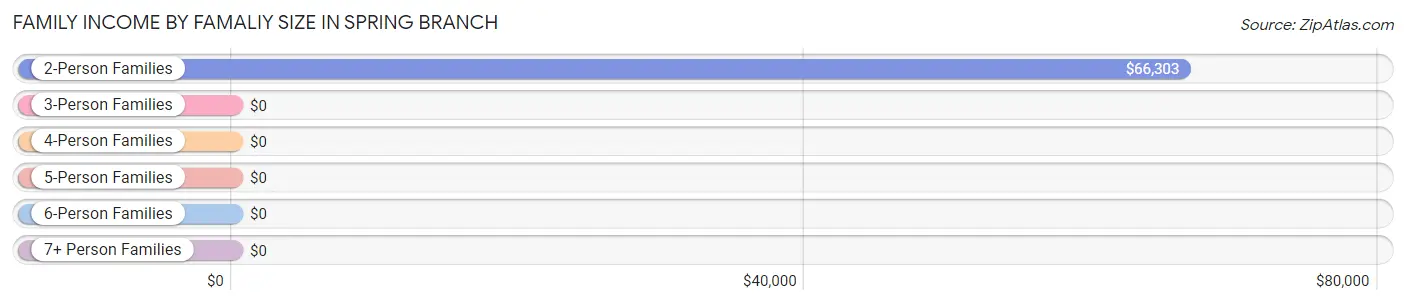
| Income Bracket | # Families | Median Income |
| 2-Person Families | 57 (89.1%) | $66,303 |
| 3-Person Families | 1 (1.6%) | $0 |
| 4-Person Families | 2 (3.1%) | $0 |
| 5-Person Families | 4 (6.2%) | $0 |
| 6-Person Families | 0 (0.0%) | $0 |
| 7+ Person Families | 0 (0.0%) | $0 |
| Total | 64 (100.0%) | $66,436 |
Family Income by Number of Earners in Spring Branch
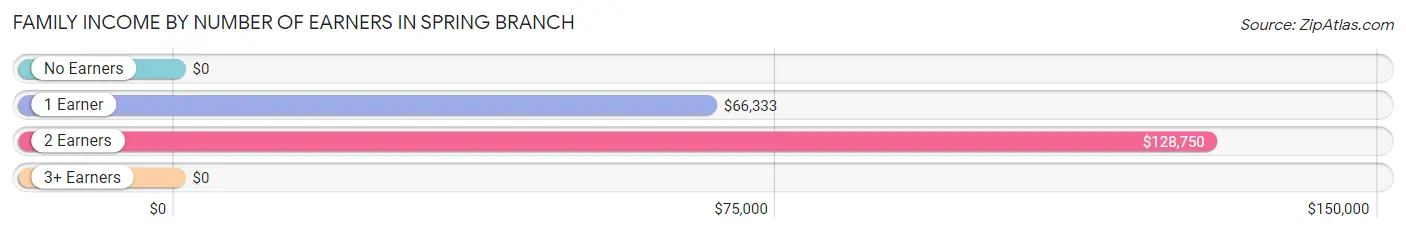
| Number of Earners | # Families | Median Income |
| No Earners | 8 (12.5%) | $0 |
| 1 Earner | 48 (75.0%) | $66,333 |
| 2 Earners | 4 (6.2%) | $128,750 |
| 3+ Earners | 4 (6.2%) | $0 |
| Total | 64 (100.0%) | $66,436 |
Household Income in Spring Branch
Household Income Brackets in Spring Branch
With 45 households falling in the category, the $150,000 to $199,999 income range is the most frequent in Spring Branch, accounting for 50.6% of all households. In contrast, only 1 households (1.1%) fall into the $10,000 to $14,999 income bracket, making it the least populous group.
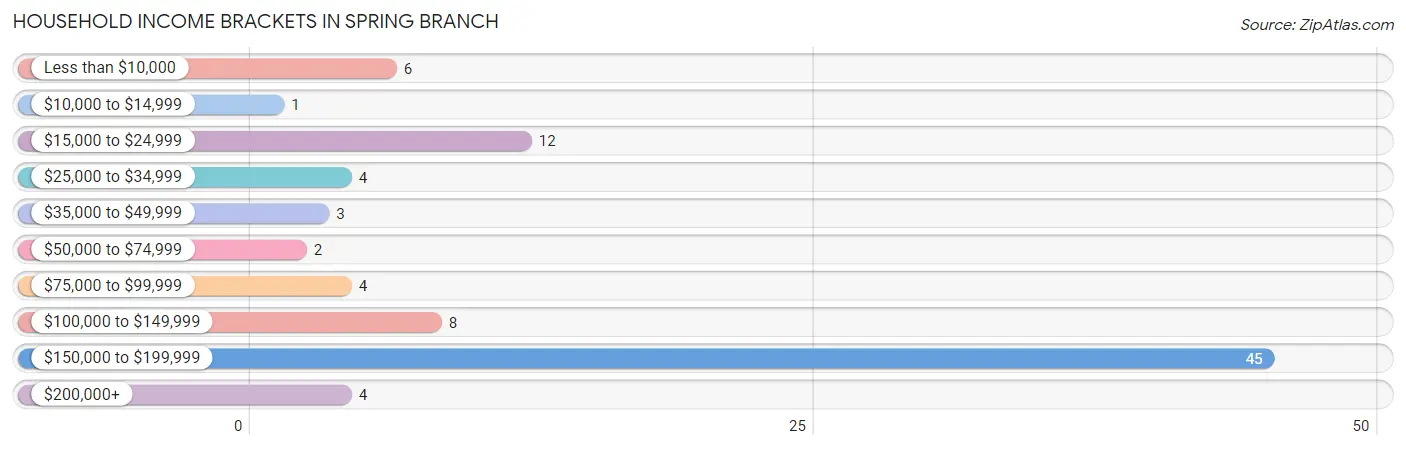
| Income Bracket | # Households | % Households |
| Less than $10,000 | 6 | 6.7% |
| $10,000 to $14,999 | 1 | 1.1% |
| $15,000 to $24,999 | 12 | 13.5% |
| $25,000 to $34,999 | 4 | 4.5% |
| $35,000 to $49,999 | 3 | 3.4% |
| $50,000 to $74,999 | 2 | 2.2% |
| $75,000 to $99,999 | 4 | 4.5% |
| $100,000 to $149,999 | 8 | 9.0% |
| $150,000 to $199,999 | 45 | 50.6% |
| $200,000+ | 4 | 4.5% |
Household Income by Householder Age in Spring Branch
The median household income in Spring Branch is $152,750, with the highest median household income of $153,639 found in the 45 to 64 years age bracket for the primary householder. A total of 57 households (64.0%) fall into this category.
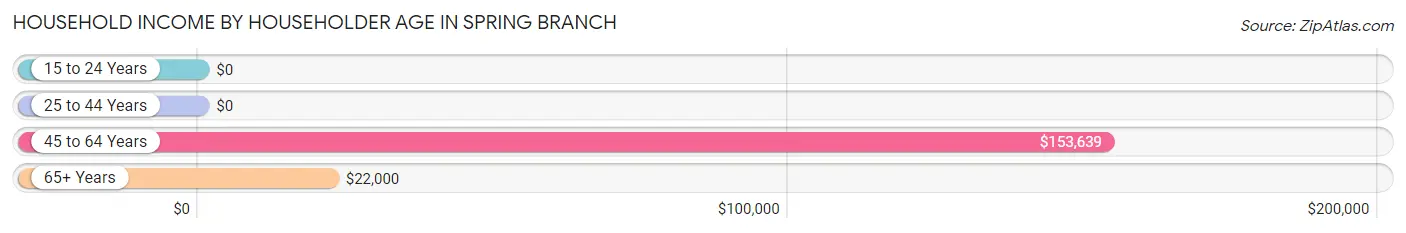
| Income Bracket | # Households | Median Income |
| 15 to 24 Years | 0 (0.0%) | $0 |
| 25 to 44 Years | 10 (11.2%) | $0 |
| 45 to 64 Years | 57 (64.0%) | $153,639 |
| 65+ Years | 22 (24.7%) | $22,000 |
| Total | 89 (100.0%) | $152,750 |
Poverty in Spring Branch
Income Below Poverty by Sex and Age in Spring Branch
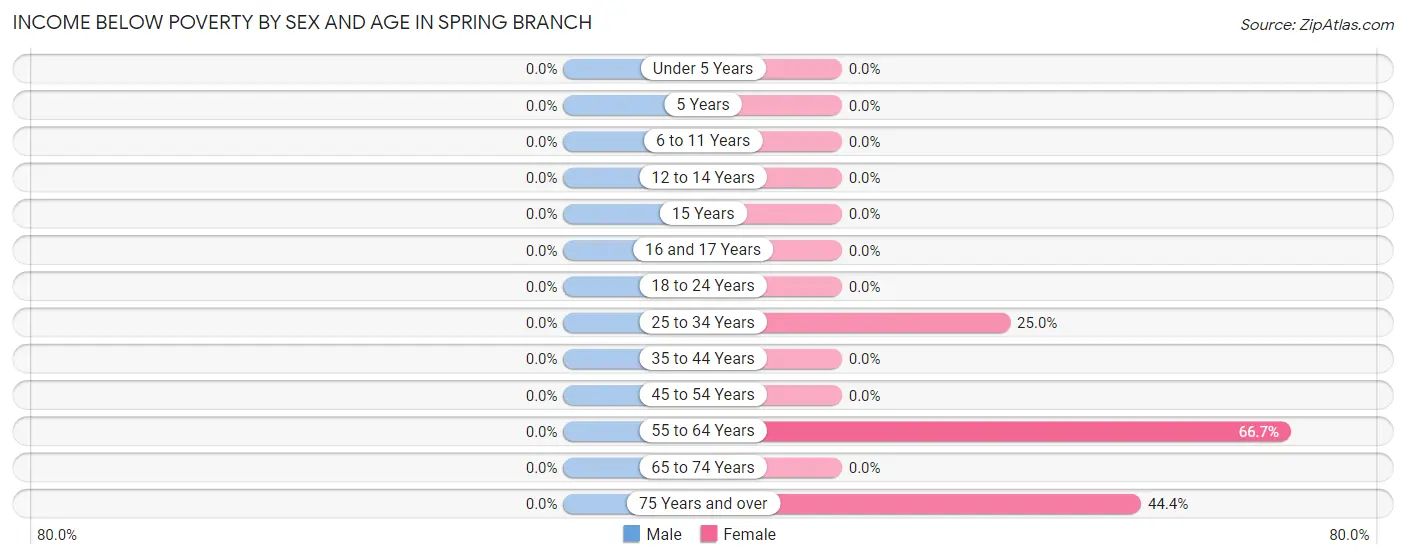
| Age Bracket | Male | Female |
| Under 5 Years | 0 (0.0%) | 0 (0.0%) |
| 5 Years | 0 (0.0%) | 0 (0.0%) |
| 6 to 11 Years | 0 (0.0%) | 0 (0.0%) |
| 12 to 14 Years | 0 (0.0%) | 0 (0.0%) |
| 15 Years | 0 (0.0%) | 0 (0.0%) |
| 16 and 17 Years | 0 (0.0%) | 0 (0.0%) |
| 18 to 24 Years | 0 (0.0%) | 0 (0.0%) |
| 25 to 34 Years | 0 (0.0%) | 3 (25.0%) |
| 35 to 44 Years | 0 (0.0%) | 0 (0.0%) |
| 45 to 54 Years | 0 (0.0%) | 0 (0.0%) |
| 55 to 64 Years | 0 (0.0%) | 2 (66.7%) |
| 65 to 74 Years | 0 (0.0%) | 0 (0.0%) |
| 75 Years and over | 0 (0.0%) | 4 (44.4%) |
| Total | 0 (0.0%) | 9 (7.6%) |
Income Above Poverty by Sex and Age in Spring Branch
According to the poverty statistics in Spring Branch, males aged 18 to 24 years and females aged under 5 years are the age groups that are most secure financially, with 100.0% of males and 100.0% of females in these age groups living above the poverty line.
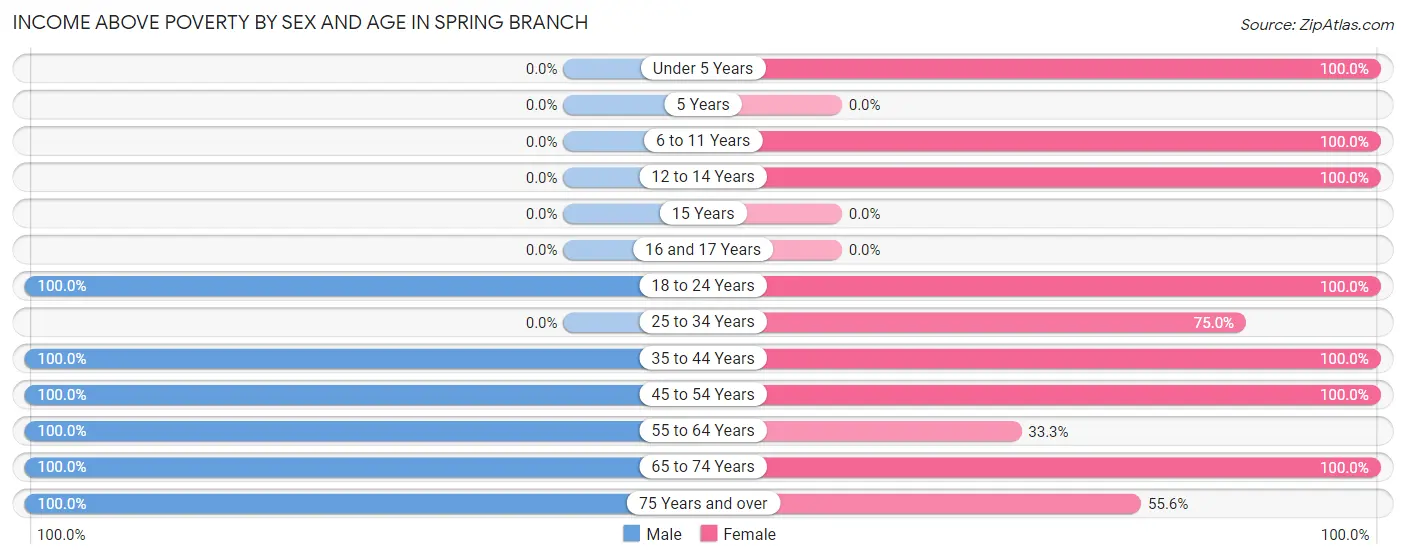
| Age Bracket | Male | Female |
| Under 5 Years | 0 (0.0%) | 6 (100.0%) |
| 5 Years | 0 (0.0%) | 0 (0.0%) |
| 6 to 11 Years | 0 (0.0%) | 5 (100.0%) |
| 12 to 14 Years | 0 (0.0%) | 5 (100.0%) |
| 15 Years | 0 (0.0%) | 0 (0.0%) |
| 16 and 17 Years | 0 (0.0%) | 0 (0.0%) |
| 18 to 24 Years | 7 (100.0%) | 16 (100.0%) |
| 25 to 34 Years | 0 (0.0%) | 9 (75.0%) |
| 35 to 44 Years | 4 (100.0%) | 7 (100.0%) |
| 45 to 54 Years | 46 (100.0%) | 51 (100.0%) |
| 55 to 64 Years | 4 (100.0%) | 1 (33.3%) |
| 65 to 74 Years | 6 (100.0%) | 4 (100.0%) |
| 75 Years and over | 6 (100.0%) | 5 (55.6%) |
| Total | 73 (100.0%) | 109 (92.4%) |
Income Below Poverty Among Married-Couple Families in Spring Branch
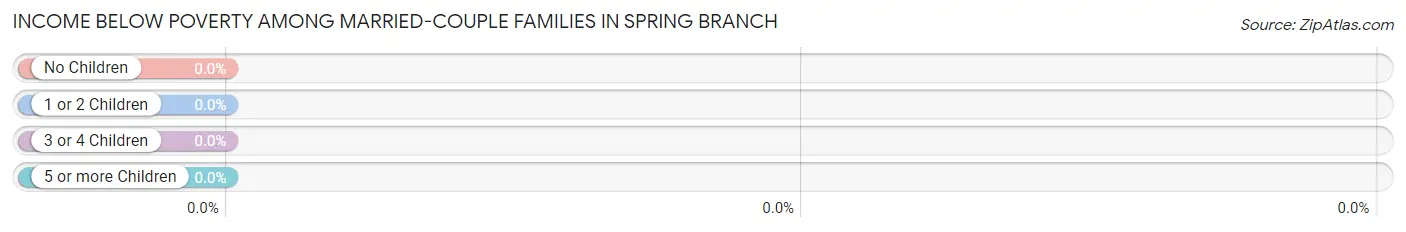
| Children | Above Poverty | Below Poverty |
| No Children | 8 (100.0%) | 0 (0.0%) |
| 1 or 2 Children | 6 (100.0%) | 0 (0.0%) |
| 3 or 4 Children | 0 (0.0%) | 0 (0.0%) |
| 5 or more Children | 0 (0.0%) | 0 (0.0%) |
| Total | 14 (100.0%) | 0 (0.0%) |
Income Below Poverty Among Single-Parent Households in Spring Branch
| Children | Single Father | Single Mother |
| No Children | 0 (0.0%) | 0 (0.0%) |
| 1 or 2 Children | 0 (0.0%) | 0 (0.0%) |
| 3 or 4 Children | 0 (0.0%) | 0 (0.0%) |
| 5 or more Children | 0 (0.0%) | 0 (0.0%) |
| Total | 0 (0.0%) | 0 (0.0%) |
Income Below Poverty Among Married-Couple vs Single-Parent Households in Spring Branch
| Children | Married-Couple Families | Single-Parent Households |
| No Children | 0 (0.0%) | 0 (0.0%) |
| 1 or 2 Children | 0 (0.0%) | 0 (0.0%) |
| 3 or 4 Children | 0 (0.0%) | 0 (0.0%) |
| 5 or more Children | 0 (0.0%) | 0 (0.0%) |
| Total | 0 (0.0%) | 0 (0.0%) |
Race in Spring Branch
The most populous races in Spring Branch are White / Caucasian (184 | 96.3%), Two or more Races (4 | 2.1%), and Asian (3 | 1.6%).
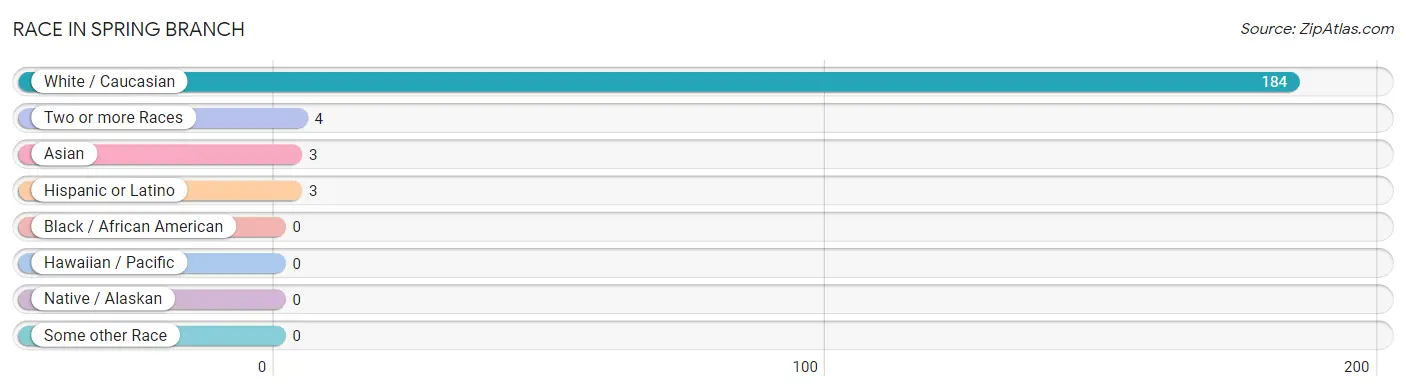
| Race | # Population | % Population |
| Asian | 3 | 1.6% |
| Black / African American | 0 | 0.0% |
| Hawaiian / Pacific | 0 | 0.0% |
| Hispanic or Latino | 3 | 1.6% |
| Native / Alaskan | 0 | 0.0% |
| White / Caucasian | 184 | 96.3% |
| Two or more Races | 4 | 2.1% |
| Some other Race | 0 | 0.0% |
| Total | 191 | 100.0% |
Ancestry in Spring Branch
The most populous ancestries reported in Spring Branch are German (124 | 64.9%), Irish (72 | 37.7%), American (36 | 18.9%), Scotch-Irish (13 | 6.8%), and English (7 | 3.7%), together accounting for 131.9% of all Spring Branch residents.
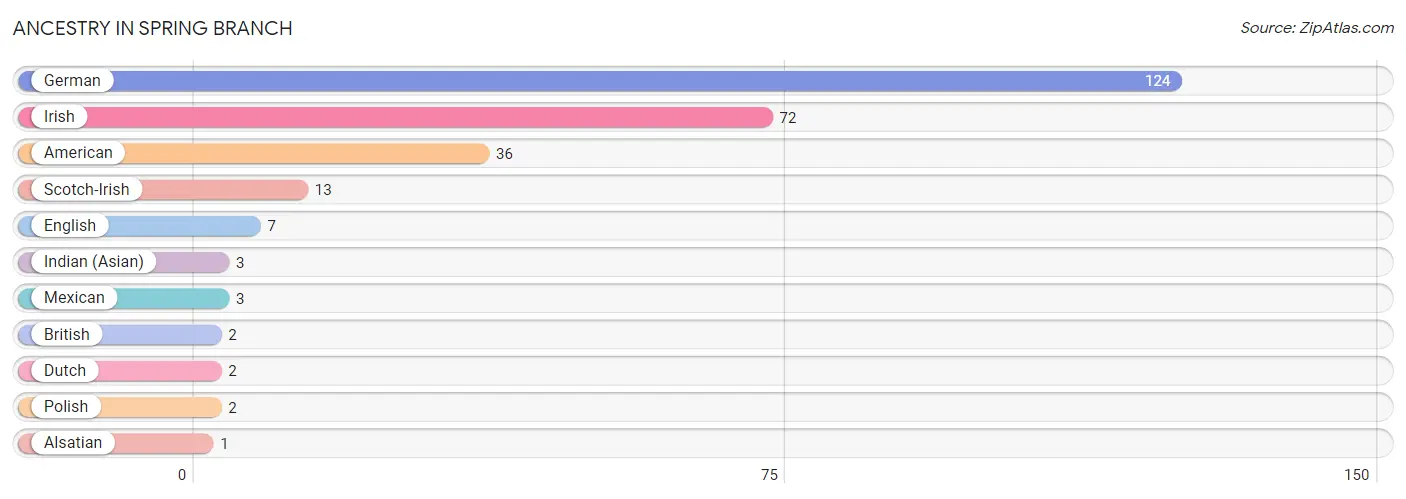
| Ancestry | # Population | % Population |
| Alsatian | 1 | 0.5% |
| American | 36 | 18.9% |
| British | 2 | 1.1% |
| Dutch | 2 | 1.1% |
| English | 7 | 3.7% |
| German | 124 | 64.9% |
| Indian (Asian) | 3 | 1.6% |
| Irish | 72 | 37.7% |
| Mexican | 3 | 1.6% |
| Polish | 2 | 1.1% |
| Scotch-Irish | 13 | 6.8% | View All 11 Rows |
Immigrants in Spring Branch
The most numerous immigrant groups reported in Spring Branch came from Asia (3 | 1.6%), China (3 | 1.6%), and Eastern Asia (3 | 1.6%), together accounting for 4.7% of all Spring Branch residents.
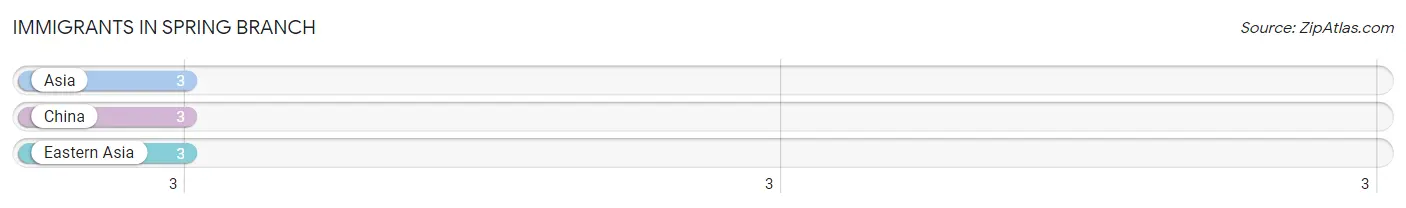
| Immigration Origin | # Population | % Population |
| Asia | 3 | 1.6% |
| China | 3 | 1.6% |
| Eastern Asia | 3 | 1.6% | View All 3 Rows |
Sex and Age in Spring Branch
Sex and Age in Spring Branch
The most populous age groups in Spring Branch are 50 to 54 Years (44 | 60.3%) for men and 45 to 49 Years (51 | 43.2%) for women.
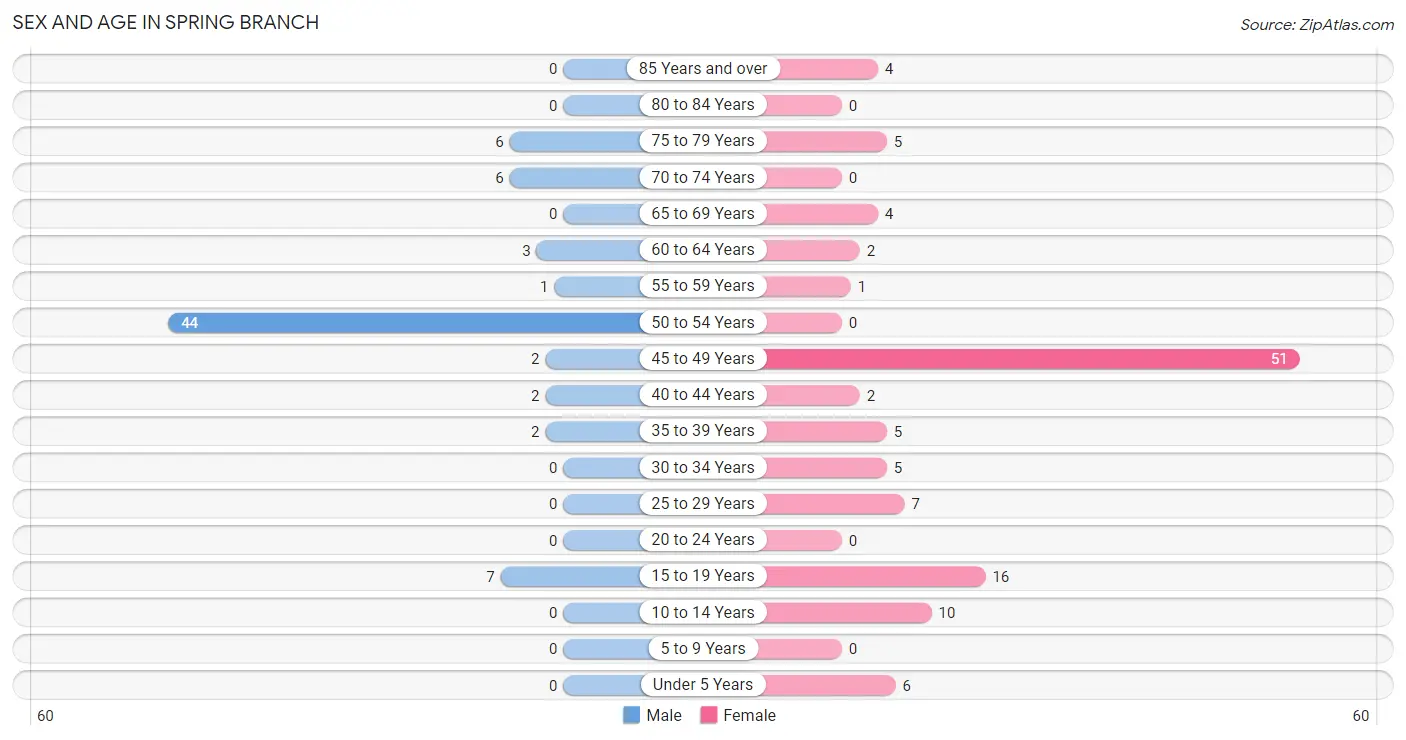
| Age Bracket | Male | Female |
| Under 5 Years | 0 (0.0%) | 6 (5.1%) |
| 5 to 9 Years | 0 (0.0%) | 0 (0.0%) |
| 10 to 14 Years | 0 (0.0%) | 10 (8.5%) |
| 15 to 19 Years | 7 (9.6%) | 16 (13.6%) |
| 20 to 24 Years | 0 (0.0%) | 0 (0.0%) |
| 25 to 29 Years | 0 (0.0%) | 7 (5.9%) |
| 30 to 34 Years | 0 (0.0%) | 5 (4.2%) |
| 35 to 39 Years | 2 (2.7%) | 5 (4.2%) |
| 40 to 44 Years | 2 (2.7%) | 2 (1.7%) |
| 45 to 49 Years | 2 (2.7%) | 51 (43.2%) |
| 50 to 54 Years | 44 (60.3%) | 0 (0.0%) |
| 55 to 59 Years | 1 (1.4%) | 1 (0.9%) |
| 60 to 64 Years | 3 (4.1%) | 2 (1.7%) |
| 65 to 69 Years | 0 (0.0%) | 4 (3.4%) |
| 70 to 74 Years | 6 (8.2%) | 0 (0.0%) |
| 75 to 79 Years | 6 (8.2%) | 5 (4.2%) |
| 80 to 84 Years | 0 (0.0%) | 0 (0.0%) |
| 85 Years and over | 0 (0.0%) | 4 (3.4%) |
| Total | 73 (100.0%) | 118 (100.0%) |
Families and Households in Spring Branch
Median Family Size in Spring Branch
The median family size in Spring Branch is 1.95 persons per family, with married-couple families (14 | 21.9%) accounting for the largest median family size of 3.71 persons per family. On the other hand, single female/mother families (46 | 71.9%) represent the smallest median family size with 1.39 persons per family.
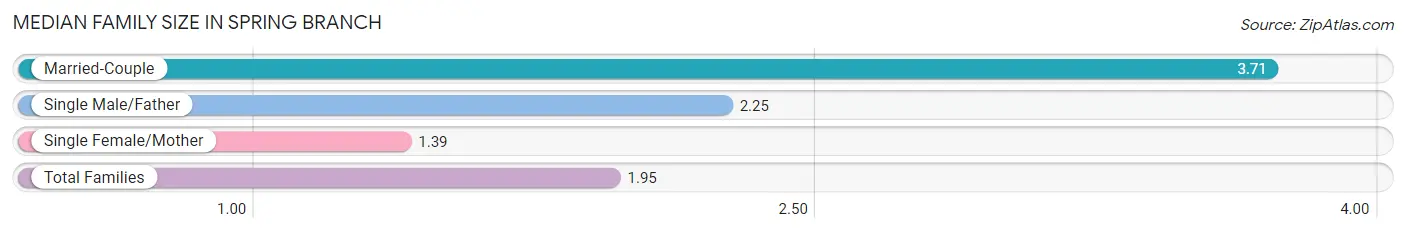
| Family Type | # Families | Family Size |
| Married-Couple | 14 (21.9%) | 3.71 |
| Single Male/Father | 4 (6.2%) | 2.25 |
| Single Female/Mother | 46 (71.9%) | 1.39 |
| Total Families | 64 (100.0%) | 1.95 |
Median Household Size in Spring Branch
The median household size in Spring Branch is 2.15 persons per household, with married-couple households (14 | 15.7%) accounting for the largest median household size of 3.71 persons per household. non-family households (25 | 28.1%) represent the smallest median household size with 1.16 persons per household.
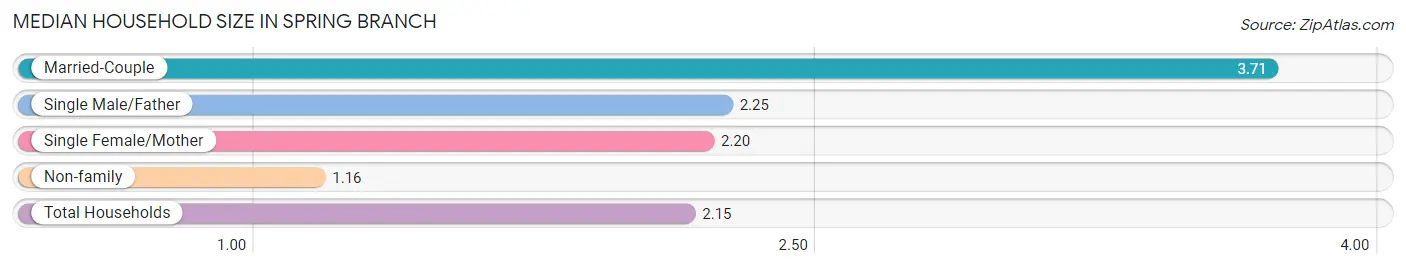
| Household Type | # Households | Household Size |
| Married-Couple | 14 (15.7%) | 3.71 |
| Single Male/Father | 4 (4.5%) | 2.25 |
| Single Female/Mother | 46 (51.7%) | 2.20 |
| Non-family | 25 (28.1%) | 1.16 |
| Total Households | 89 (100.0%) | 2.15 |
Household Size by Marriage Status in Spring Branch
Out of a total of 89 households in Spring Branch, 64 (71.9%) are family households, while 25 (28.1%) are nonfamily households. The most numerous type of family households are 3-person households, comprising 46, and the most common type of nonfamily households are 1-person households, comprising 21.
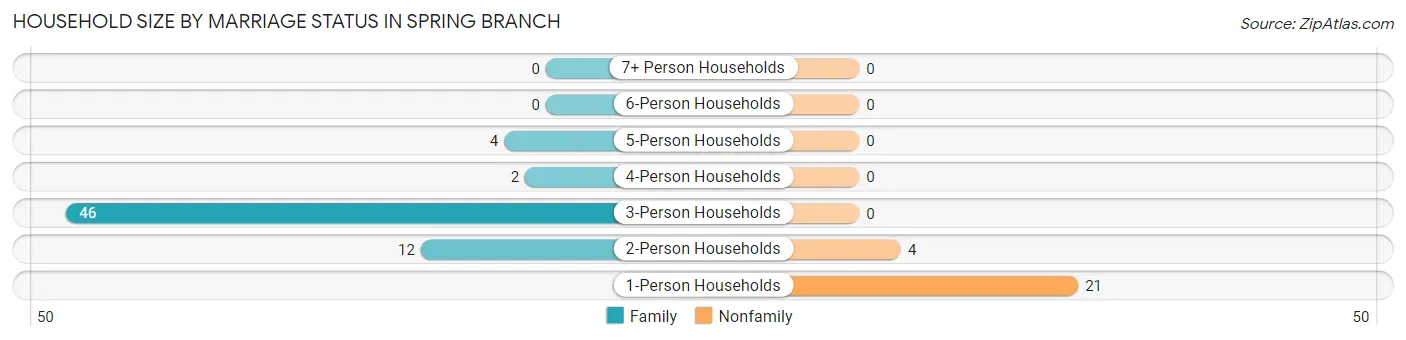
| Household Size | Family Households | Nonfamily Households |
| 1-Person Households | - | 21 (23.6%) |
| 2-Person Households | 12 (13.5%) | 4 (4.5%) |
| 3-Person Households | 46 (51.7%) | 0 (0.0%) |
| 4-Person Households | 2 (2.2%) | 0 (0.0%) |
| 5-Person Households | 4 (4.5%) | 0 (0.0%) |
| 6-Person Households | 0 (0.0%) | 0 (0.0%) |
| 7+ Person Households | 0 (0.0%) | 0 (0.0%) |
| Total | 64 (71.9%) | 25 (28.1%) |
Female Fertility in Spring Branch
Fertility by Age in Spring Branch
| Age Bracket | Women with Births | Births / 1,000 Women |
| 15 to 19 years | 0 (0.0%) | 0.0 |
| 20 to 34 years | 0 (0.0%) | 0.0 |
| 35 to 50 years | 0 (0.0%) | 0.0 |
| Total | 0 (0.0%) | 0.0 |
Fertility by Age by Marriage Status in Spring Branch
| Age Bracket | Married | Unmarried |
| 15 to 19 years | 0 (0.0%) | 0 (0.0%) |
| 20 to 34 years | 0 (0.0%) | 0 (0.0%) |
| 35 to 50 years | 0 (0.0%) | 0 (0.0%) |
| Total | 0 (0.0%) | 0 (0.0%) |
Fertility by Education in Spring Branch
| Educational Attainment | Women with Births | Births / 1,000 Women |
| Less than High School | 0 (0.0%) | 0.0 |
| High School Diploma | 0 (0.0%) | 0.0 |
| College or Associate's Degree | 0 (0.0%) | 0.0 |
| Bachelor's Degree | 0 (0.0%) | 0.0 |
| Graduate Degree | 0 (0.0%) | 0.0 |
| Total | 0 (0.0%) | 0.0 |
Fertility by Education by Marriage Status in Spring Branch
| Educational Attainment | Married | Unmarried |
| Less than High School | 0 (0.0%) | 0 (0.0%) |
| High School Diploma | 0 (0.0%) | 0 (0.0%) |
| College or Associate's Degree | 0 (0.0%) | 0 (0.0%) |
| Bachelor's Degree | 0 (0.0%) | 0 (0.0%) |
| Graduate Degree | 0 (0.0%) | 0 (0.0%) |
| Total | 0 (0.0%) | 0 (0.0%) |
Employment Characteristics in Spring Branch
Employment by Class of Employer in Spring Branch
Among the 126 employed individuals in Spring Branch, private company employees (61 | 48.4%), not-for-profit organizations (51 | 40.5%), and self-employed (not incorporated) (10 | 7.9%) make up the most common classes of employment.
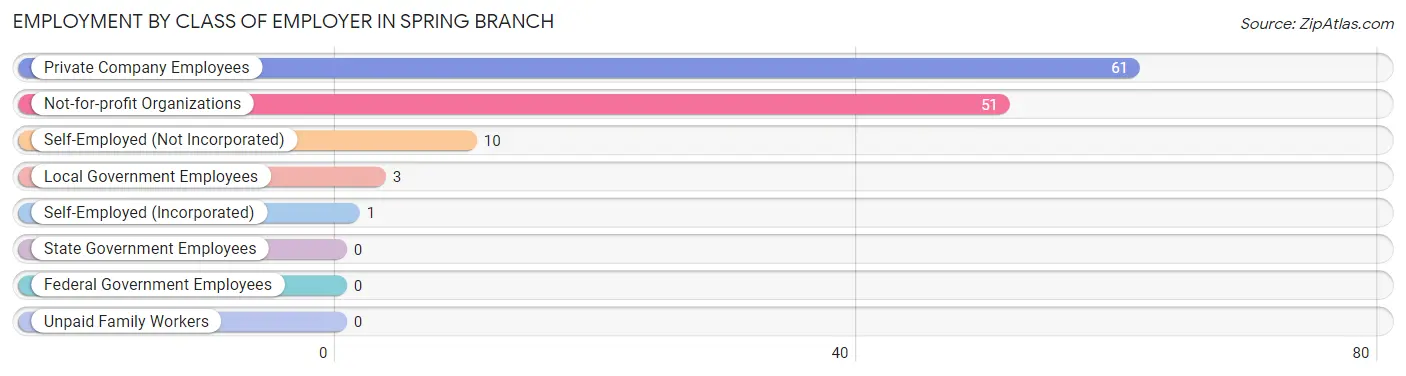
| Employer Class | # Employees | % Employees |
| Private Company Employees | 61 | 48.4% |
| Self-Employed (Incorporated) | 1 | 0.8% |
| Self-Employed (Not Incorporated) | 10 | 7.9% |
| Not-for-profit Organizations | 51 | 40.5% |
| Local Government Employees | 3 | 2.4% |
| State Government Employees | 0 | 0.0% |
| Federal Government Employees | 0 | 0.0% |
| Unpaid Family Workers | 0 | 0.0% |
| Total | 126 | 100.0% |
Employment Status by Age in Spring Branch
According to the labor force statistics for Spring Branch, out of the total population over 16 years of age (175), 73.7% or 129 individuals are in the labor force, with 1.6% or 2 of them unemployed. The age group with the highest labor force participation rate is 25 to 29 years, with 100.0% or 7 individuals in the labor force. Within the labor force, the 60 to 64 years age range has the highest percentage of unemployed individuals, with 100.0% or 2 of them being unemployed.
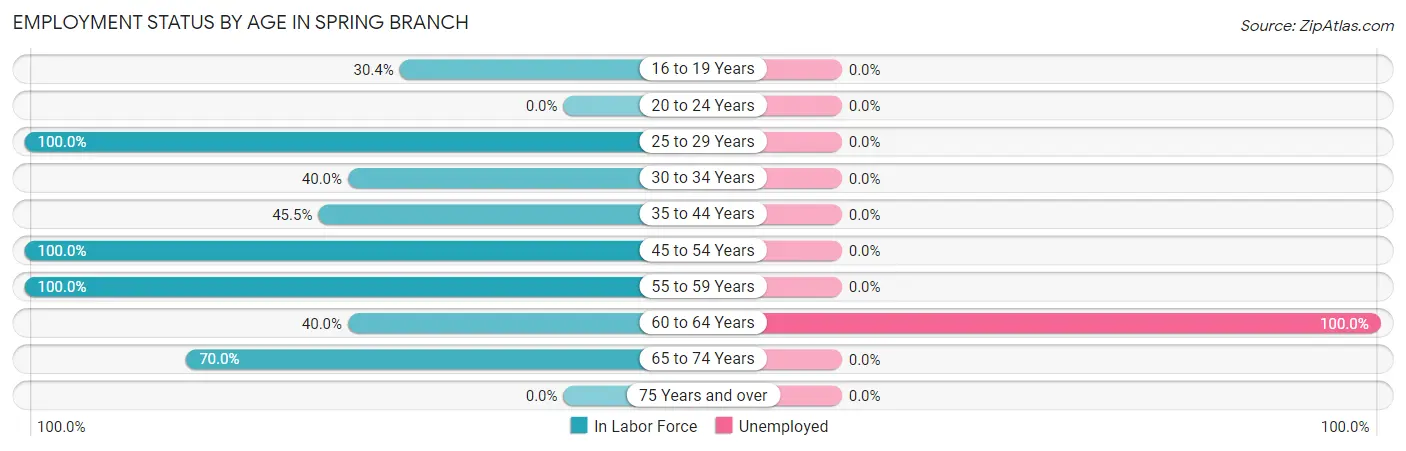
| Age Bracket | In Labor Force | Unemployed |
| 16 to 19 Years | 7 (30.4%) | 0 (0.0%) |
| 20 to 24 Years | 0 (0.0%) | 0 (0.0%) |
| 25 to 29 Years | 7 (100.0%) | 0 (0.0%) |
| 30 to 34 Years | 2 (40.0%) | 0 (0.0%) |
| 35 to 44 Years | 5 (45.5%) | 0 (0.0%) |
| 45 to 54 Years | 97 (100.0%) | 0 (0.0%) |
| 55 to 59 Years | 2 (100.0%) | 0 (0.0%) |
| 60 to 64 Years | 2 (40.0%) | 2 (100.0%) |
| 65 to 74 Years | 7 (70.0%) | 0 (0.0%) |
| 75 Years and over | 0 (0.0%) | 0 (0.0%) |
| Total | 129 (73.7%) | 2 (1.6%) |
Employment Status by Educational Attainment in Spring Branch
According to labor force statistics for Spring Branch, 90.6% of individuals (115) out of the total population between 25 and 64 years of age (127) are in the labor force, with 1.7% or 2 of them being unemployed. The group with the highest labor force participation rate are those with the educational attainment of college / associate degree, with 100.0% or 7 individuals in the labor force. Within the labor force, individuals with high school diploma education have the highest percentage of unemployment, with 4.3% or 2 of them being unemployed.
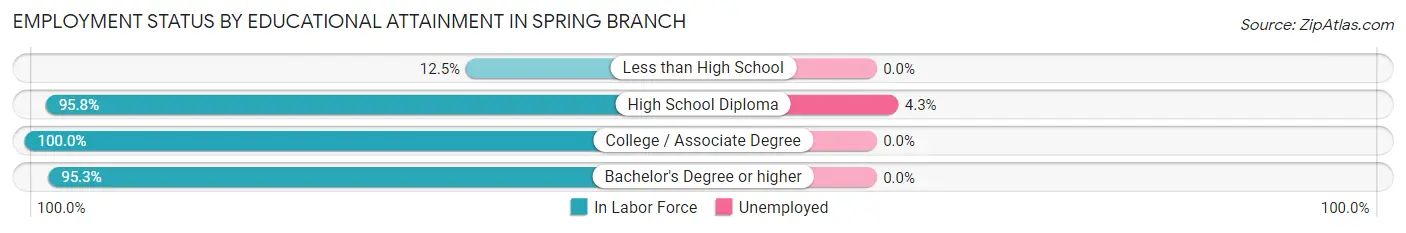
| Educational Attainment | In Labor Force | Unemployed |
| Less than High School | 1 (12.5%) | 0 (0.0%) |
| High School Diploma | 46 (95.8%) | 2 (4.3%) |
| College / Associate Degree | 7 (100.0%) | 0 (0.0%) |
| Bachelor's Degree or higher | 61 (95.3%) | 0 (0.0%) |
| Total | 115 (90.6%) | 2 (1.7%) |
Employment Occupations by Sex in Spring Branch
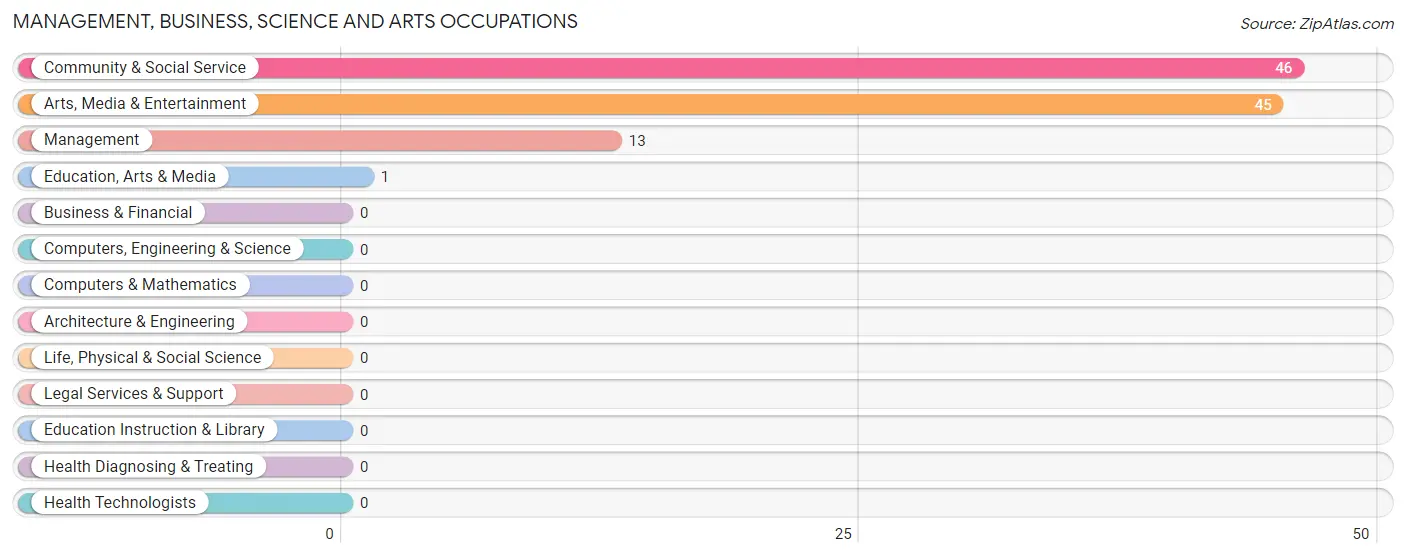
Management, Business, Science and Arts Occupations
The most common Management, Business, Science and Arts occupations in Spring Branch are Community & Social Service (46 | 36.2%), Arts, Media & Entertainment (45 | 35.4%), Management (13 | 10.2%), and Education, Arts & Media (1 | 0.8%).
Management, Business, Science and Arts Occupations by Sex
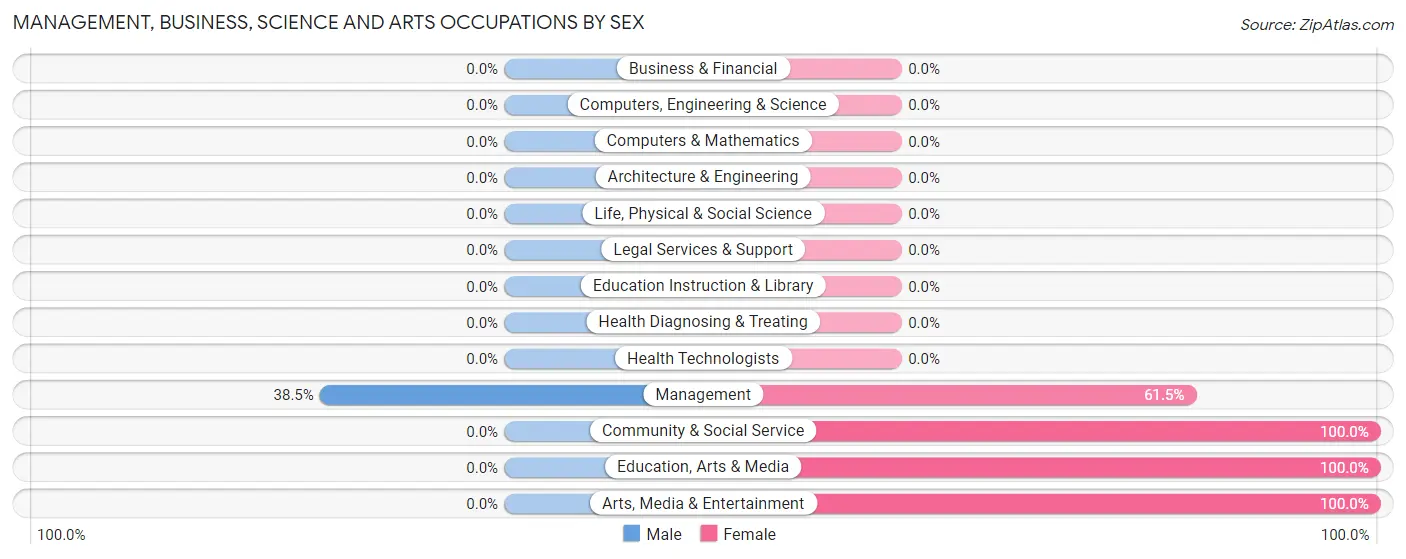
| Occupation | Male | Female |
| Management | 5 (38.5%) | 8 (61.5%) |
| Business & Financial | 0 (0.0%) | 0 (0.0%) |
| Computers, Engineering & Science | 0 (0.0%) | 0 (0.0%) |
| Computers & Mathematics | 0 (0.0%) | 0 (0.0%) |
| Architecture & Engineering | 0 (0.0%) | 0 (0.0%) |
| Life, Physical & Social Science | 0 (0.0%) | 0 (0.0%) |
| Community & Social Service | 0 (0.0%) | 46 (100.0%) |
| Education, Arts & Media | 0 (0.0%) | 1 (100.0%) |
| Legal Services & Support | 0 (0.0%) | 0 (0.0%) |
| Education Instruction & Library | 0 (0.0%) | 0 (0.0%) |
| Arts, Media & Entertainment | 0 (0.0%) | 45 (100.0%) |
| Health Diagnosing & Treating | 0 (0.0%) | 0 (0.0%) |
| Health Technologists | 0 (0.0%) | 0 (0.0%) |
| Total (Category) | 5 (8.5%) | 54 (91.5%) |
| Total (Overall) | 61 (48.0%) | 66 (52.0%) |
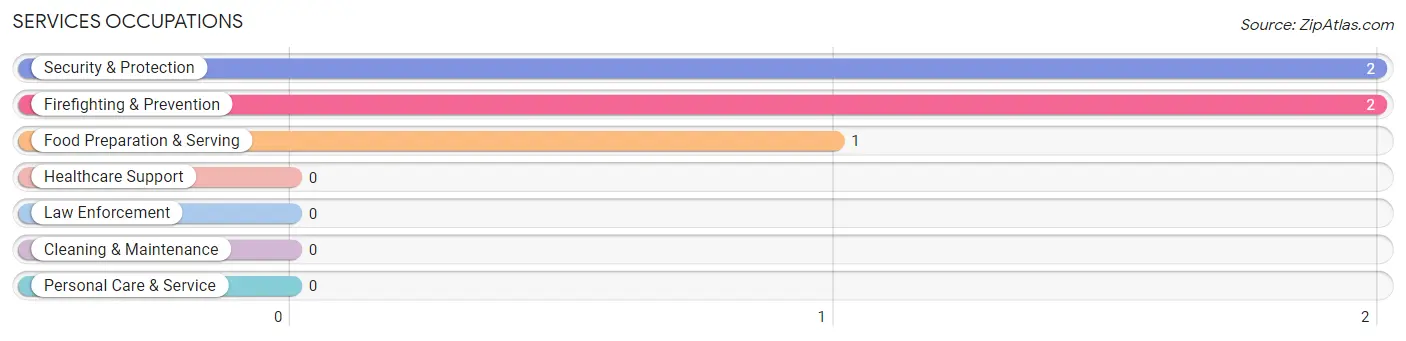
Services Occupations
The most common Services occupations in Spring Branch are Security & Protection (2 | 1.6%), Firefighting & Prevention (2 | 1.6%), and Food Preparation & Serving (1 | 0.8%).
Services Occupations by Sex
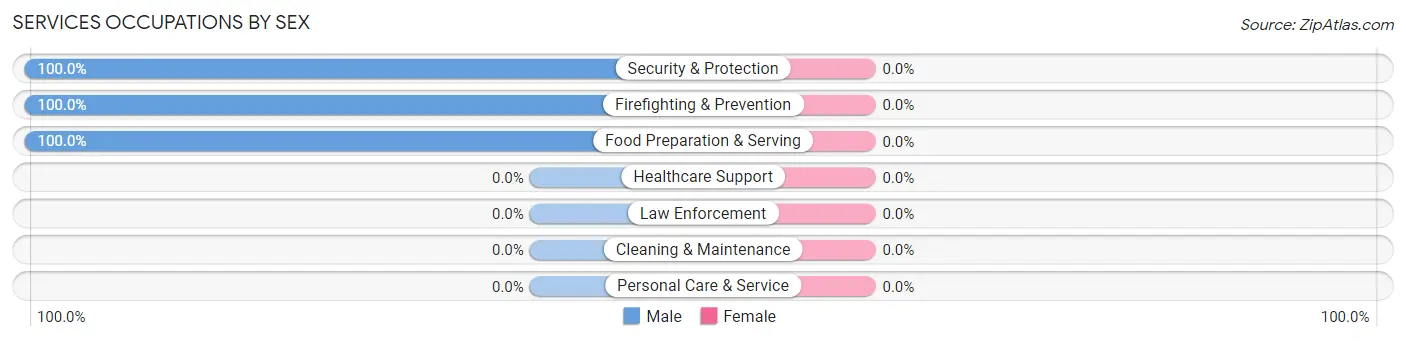
| Occupation | Male | Female |
| Healthcare Support | 0 (0.0%) | 0 (0.0%) |
| Security & Protection | 2 (100.0%) | 0 (0.0%) |
| Firefighting & Prevention | 2 (100.0%) | 0 (0.0%) |
| Law Enforcement | 0 (0.0%) | 0 (0.0%) |
| Food Preparation & Serving | 1 (100.0%) | 0 (0.0%) |
| Cleaning & Maintenance | 0 (0.0%) | 0 (0.0%) |
| Personal Care & Service | 0 (0.0%) | 0 (0.0%) |
| Total (Category) | 3 (100.0%) | 0 (0.0%) |
| Total (Overall) | 61 (48.0%) | 66 (52.0%) |
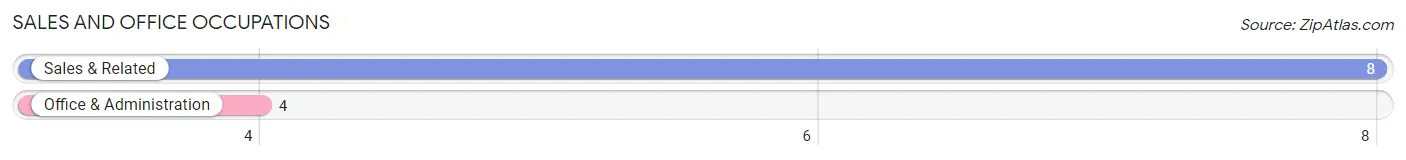
Sales and Office Occupations
The most common Sales and Office occupations in Spring Branch are Sales & Related (8 | 6.3%), and Office & Administration (4 | 3.2%).
Sales and Office Occupations by Sex
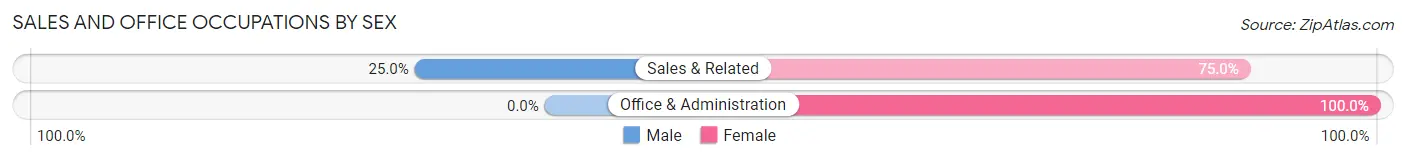
| Occupation | Male | Female |
| Sales & Related | 2 (25.0%) | 6 (75.0%) |
| Office & Administration | 0 (0.0%) | 4 (100.0%) |
| Total (Category) | 2 (16.7%) | 10 (83.3%) |
| Total (Overall) | 61 (48.0%) | 66 (52.0%) |
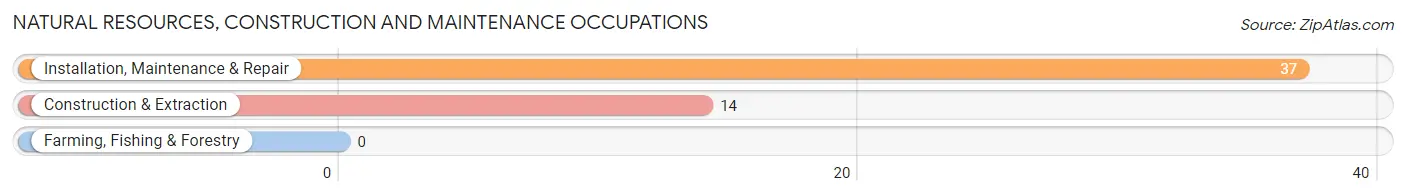
Natural Resources, Construction and Maintenance Occupations
The most common Natural Resources, Construction and Maintenance occupations in Spring Branch are Installation, Maintenance & Repair (37 | 29.1%), and Construction & Extraction (14 | 11.0%).
Natural Resources, Construction and Maintenance Occupations by Sex
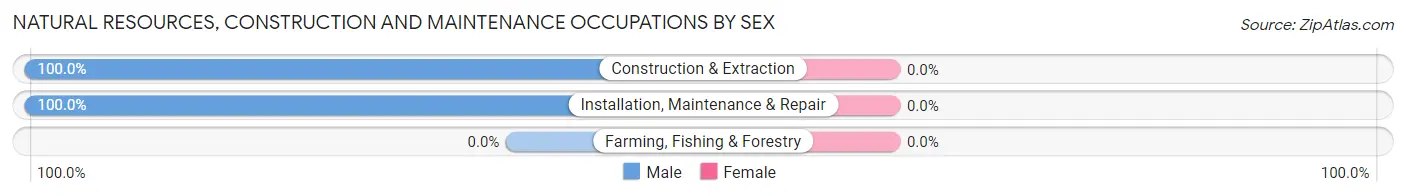
| Occupation | Male | Female |
| Farming, Fishing & Forestry | 0 (0.0%) | 0 (0.0%) |
| Construction & Extraction | 14 (100.0%) | 0 (0.0%) |
| Installation, Maintenance & Repair | 37 (100.0%) | 0 (0.0%) |
| Total (Category) | 51 (100.0%) | 0 (0.0%) |
| Total (Overall) | 61 (48.0%) | 66 (52.0%) |
Production, Transportation and Moving Occupations
The most common Production, Transportation and Moving occupations in Spring Branch are , and Material Moving (2 | 1.6%).
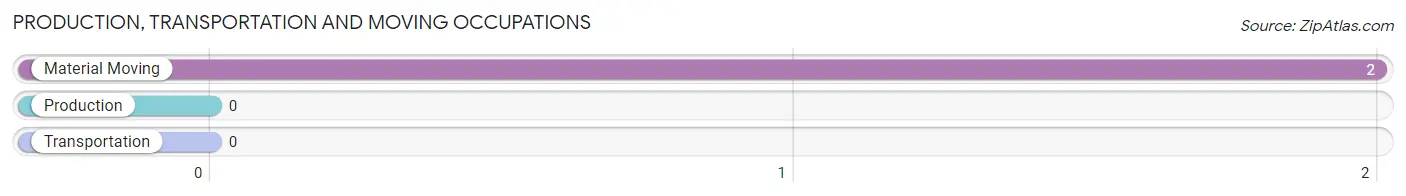
Production, Transportation and Moving Occupations by Sex
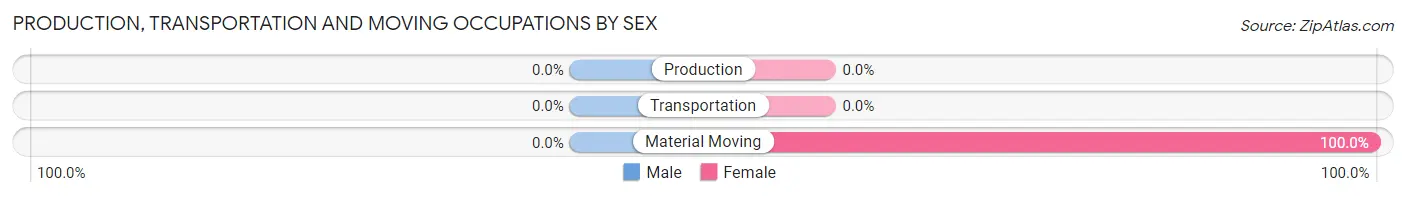
| Occupation | Male | Female |
| Production | 0 (0.0%) | 0 (0.0%) |
| Transportation | 0 (0.0%) | 0 (0.0%) |
| Material Moving | 0 (0.0%) | 2 (100.0%) |
| Total (Category) | 0 (0.0%) | 2 (100.0%) |
| Total (Overall) | 61 (48.0%) | 66 (52.0%) |
Employment Industries by Sex in Spring Branch
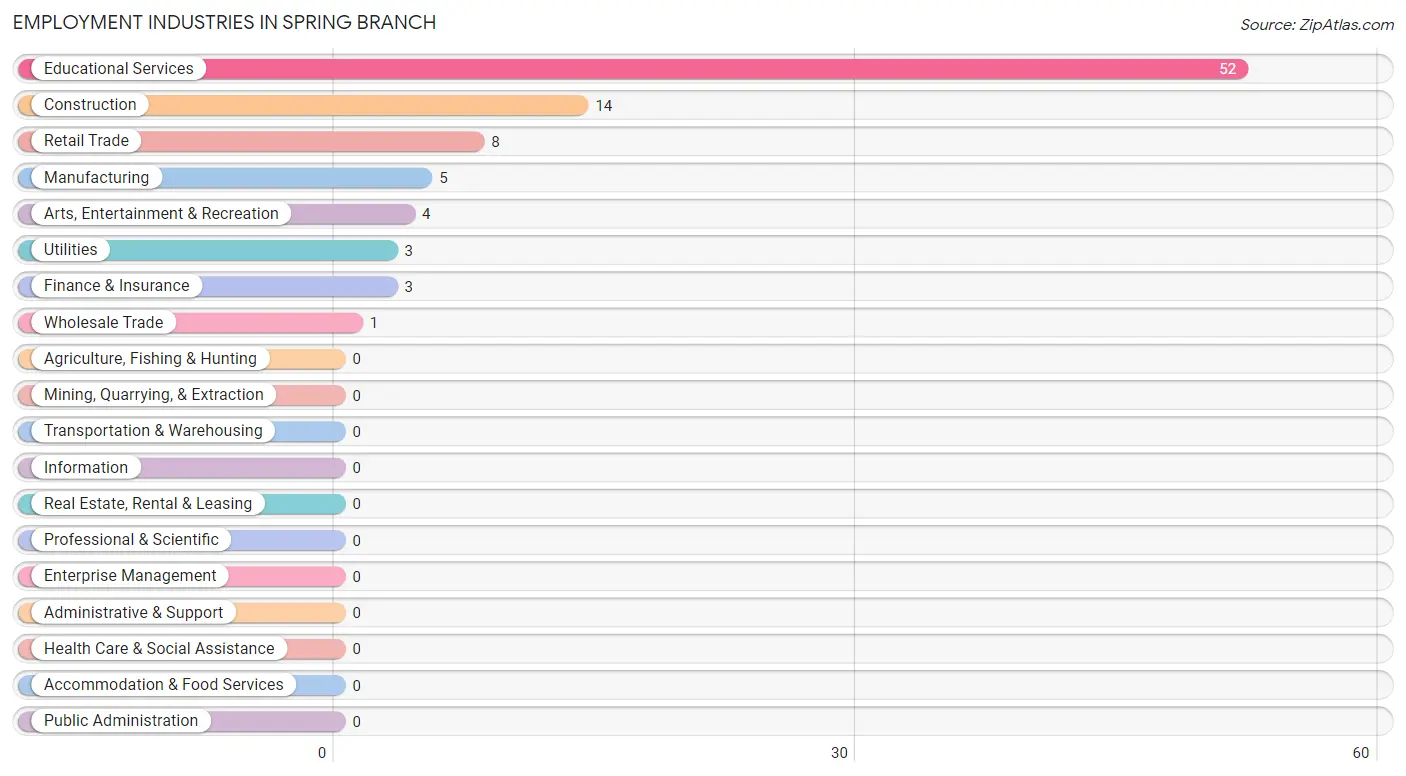
Employment Industries in Spring Branch
The major employment industries in Spring Branch include Educational Services (52 | 40.9%), Construction (14 | 11.0%), Retail Trade (8 | 6.3%), Manufacturing (5 | 3.9%), and Arts, Entertainment & Recreation (4 | 3.2%).
Employment Industries by Sex in Spring Branch
The Spring Branch industries that see more men than women are Construction (100.0%), Utilities (100.0%), and Arts, Entertainment & Recreation (100.0%), whereas the industries that tend to have a higher number of women are Manufacturing (100.0%), Wholesale Trade (100.0%), and Educational Services (100.0%).
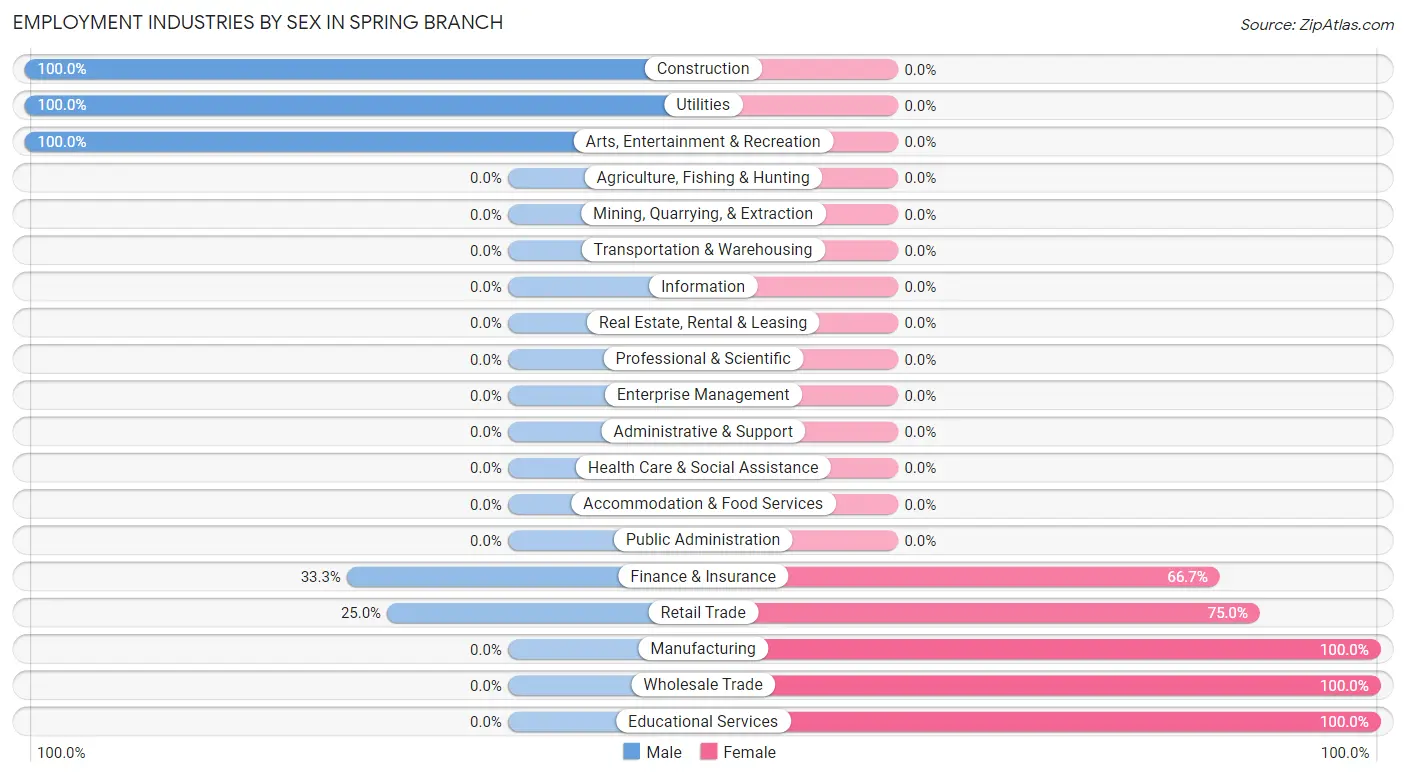
| Industry | Male | Female |
| Agriculture, Fishing & Hunting | 0 (0.0%) | 0 (0.0%) |
| Mining, Quarrying, & Extraction | 0 (0.0%) | 0 (0.0%) |
| Construction | 14 (100.0%) | 0 (0.0%) |
| Manufacturing | 0 (0.0%) | 5 (100.0%) |
| Wholesale Trade | 0 (0.0%) | 1 (100.0%) |
| Retail Trade | 2 (25.0%) | 6 (75.0%) |
| Transportation & Warehousing | 0 (0.0%) | 0 (0.0%) |
| Utilities | 3 (100.0%) | 0 (0.0%) |
| Information | 0 (0.0%) | 0 (0.0%) |
| Finance & Insurance | 1 (33.3%) | 2 (66.7%) |
| Real Estate, Rental & Leasing | 0 (0.0%) | 0 (0.0%) |
| Professional & Scientific | 0 (0.0%) | 0 (0.0%) |
| Enterprise Management | 0 (0.0%) | 0 (0.0%) |
| Administrative & Support | 0 (0.0%) | 0 (0.0%) |
| Educational Services | 0 (0.0%) | 52 (100.0%) |
| Health Care & Social Assistance | 0 (0.0%) | 0 (0.0%) |
| Arts, Entertainment & Recreation | 4 (100.0%) | 0 (0.0%) |
| Accommodation & Food Services | 0 (0.0%) | 0 (0.0%) |
| Public Administration | 0 (0.0%) | 0 (0.0%) |
| Total | 61 (48.0%) | 66 (52.0%) |
Education in Spring Branch
School Enrollment in Spring Branch
The most common levels of schooling among the 71 students in Spring Branch are graduate / professional (45 | 63.4%), college / undergraduate (16 | 22.5%), and middle school (10 | 14.1%).
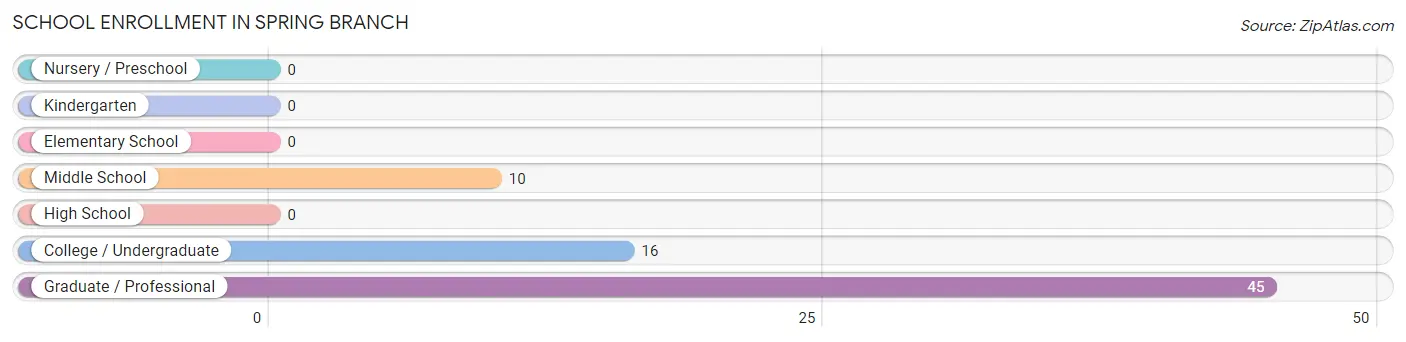
| School Level | # Students | % Students |
| Nursery / Preschool | 0 | 0.0% |
| Kindergarten | 0 | 0.0% |
| Elementary School | 0 | 0.0% |
| Middle School | 10 | 14.1% |
| High School | 0 | 0.0% |
| College / Undergraduate | 16 | 22.5% |
| Graduate / Professional | 45 | 63.4% |
| Total | 71 | 100.0% |
School Enrollment by Age by Funding Source in Spring Branch
Out of a total of 71 students who are enrolled in schools in Spring Branch, 10 (14.1%) attend a private institution, while the remaining 61 (85.9%) are enrolled in public schools. The age group of 10 to 14 year olds has the highest likelihood of being enrolled in private schools, with 10 (100.0% in the age bracket) enrolled. Conversely, the age group of 18 to 19 year olds has the lowest likelihood of being enrolled in a private school, with 16 (100.0% in the age bracket) attending a public institution.
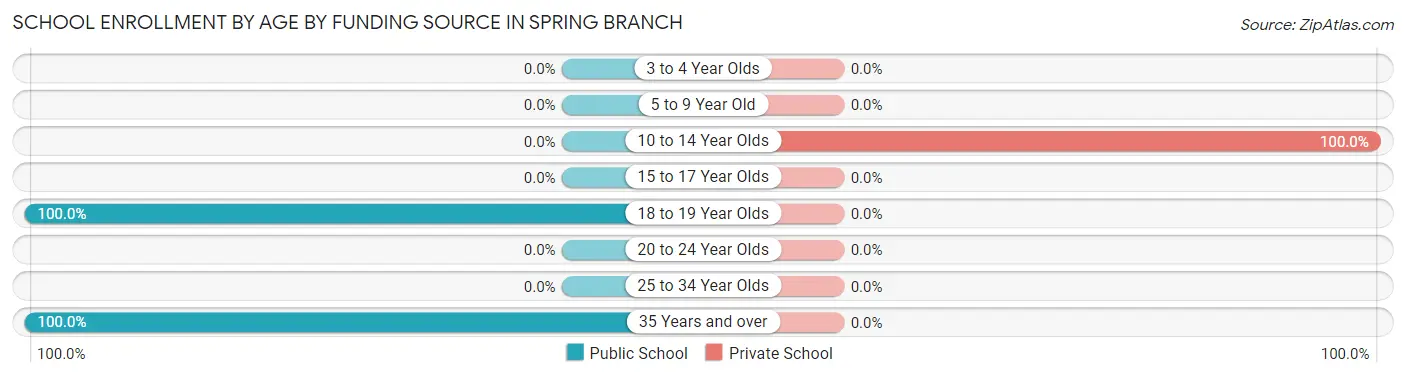
| Age Bracket | Public School | Private School |
| 3 to 4 Year Olds | 0 (0.0%) | 0 (0.0%) |
| 5 to 9 Year Old | 0 (0.0%) | 0 (0.0%) |
| 10 to 14 Year Olds | 0 (0.0%) | 10 (100.0%) |
| 15 to 17 Year Olds | 0 (0.0%) | 0 (0.0%) |
| 18 to 19 Year Olds | 16 (100.0%) | 0 (0.0%) |
| 20 to 24 Year Olds | 0 (0.0%) | 0 (0.0%) |
| 25 to 34 Year Olds | 0 (0.0%) | 0 (0.0%) |
| 35 Years and over | 45 (100.0%) | 0 (0.0%) |
| Total | 61 (85.9%) | 10 (14.1%) |
Educational Attainment by Field of Study in Spring Branch
Visual & performing arts (45 | 70.3%), science & technology (9 | 14.1%), business (7 | 10.9%), arts & humanities (2 | 3.1%), and education (1 | 1.6%) are the most common fields of study among 64 individuals in Spring Branch who have obtained a bachelor's degree or higher.
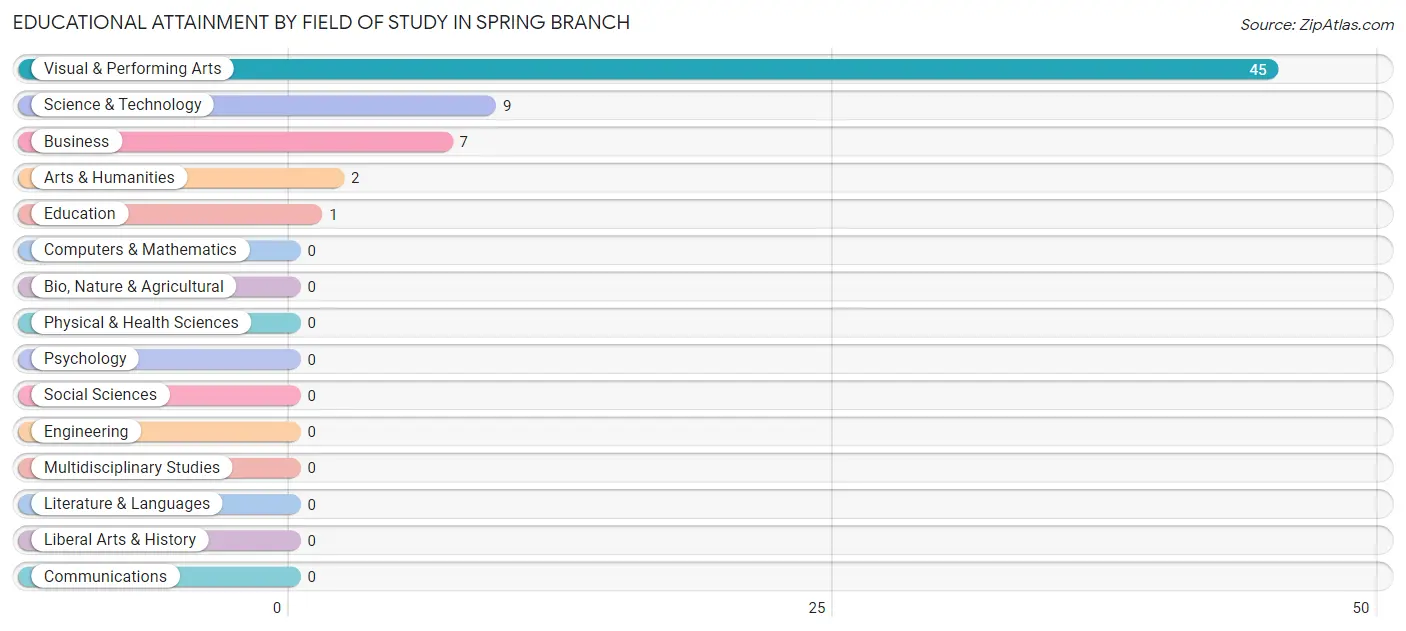
| Field of Study | # Graduates | % Graduates |
| Computers & Mathematics | 0 | 0.0% |
| Bio, Nature & Agricultural | 0 | 0.0% |
| Physical & Health Sciences | 0 | 0.0% |
| Psychology | 0 | 0.0% |
| Social Sciences | 0 | 0.0% |
| Engineering | 0 | 0.0% |
| Multidisciplinary Studies | 0 | 0.0% |
| Science & Technology | 9 | 14.1% |
| Business | 7 | 10.9% |
| Education | 1 | 1.6% |
| Literature & Languages | 0 | 0.0% |
| Liberal Arts & History | 0 | 0.0% |
| Visual & Performing Arts | 45 | 70.3% |
| Communications | 0 | 0.0% |
| Arts & Humanities | 2 | 3.1% |
| Total | 64 | 100.0% |
Transportation & Commute in Spring Branch
Vehicle Availability by Sex in Spring Branch
The most prevalent vehicle ownership categories in Spring Branch are males with 4 vehicles (49, accounting for 80.3%) and females with 4 vehicles (53, making up 75.4%).
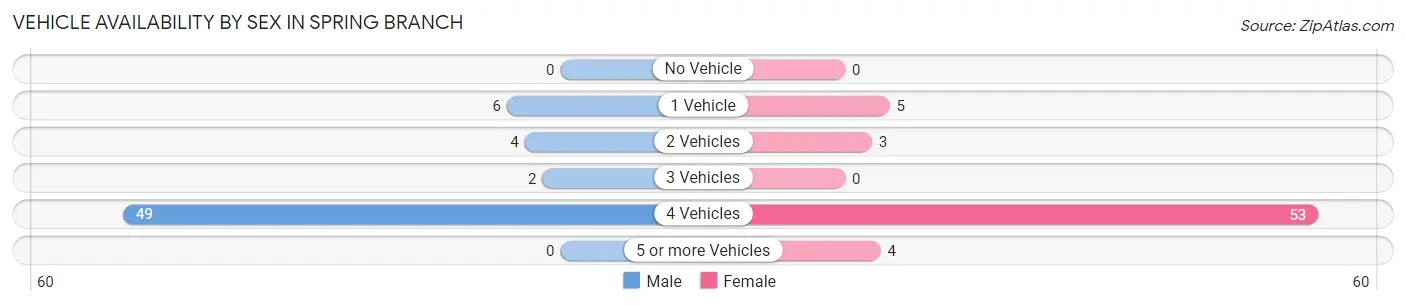
| Vehicles Available | Male | Female |
| No Vehicle | 0 (0.0%) | 0 (0.0%) |
| 1 Vehicle | 6 (9.8%) | 5 (7.7%) |
| 2 Vehicles | 4 (6.6%) | 3 (4.6%) |
| 3 Vehicles | 2 (3.3%) | 0 (0.0%) |
| 4 Vehicles | 49 (80.3%) | 53 (81.5%) |
| 5 or more Vehicles | 0 (0.0%) | 4 (6.1%) |
| Total | 61 (100.0%) | 65 (100.0%) |
Commute Time in Spring Branch
The most frequently occuring commute durations in Spring Branch are 35 to 39 minutes (45 commuters, 37.8%), 90 or more minutes (45 commuters, 37.8%), and 30 to 34 minutes (9 commuters, 7.6%).
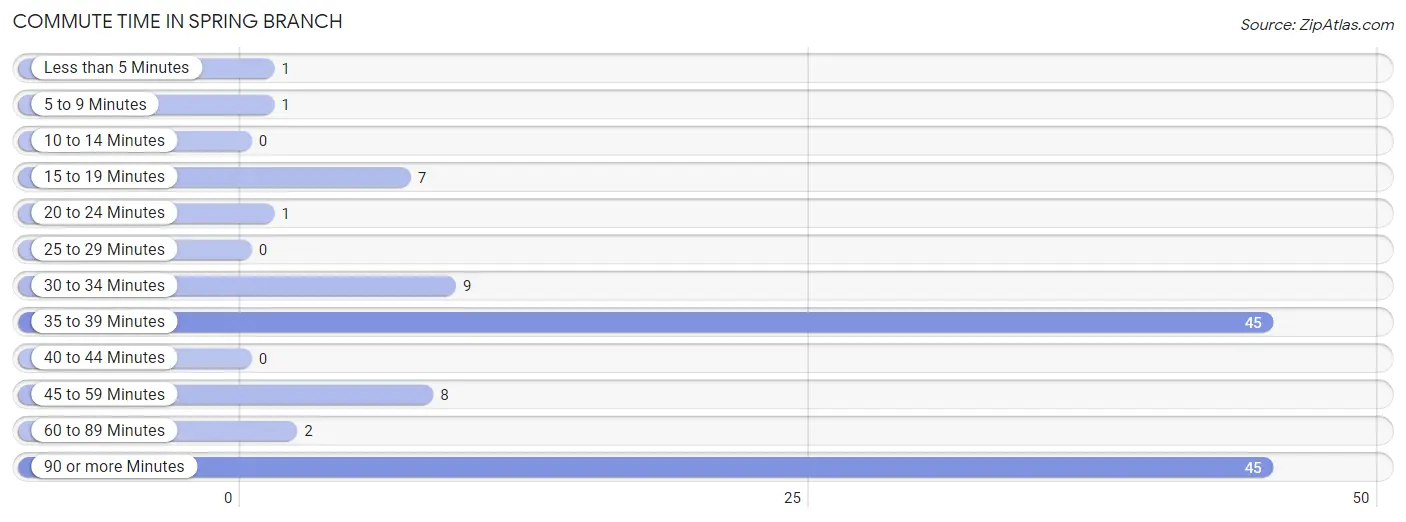
| Commute Time | # Commuters | % Commuters |
| Less than 5 Minutes | 1 | 0.8% |
| 5 to 9 Minutes | 1 | 0.8% |
| 10 to 14 Minutes | 0 | 0.0% |
| 15 to 19 Minutes | 7 | 5.9% |
| 20 to 24 Minutes | 1 | 0.8% |
| 25 to 29 Minutes | 0 | 0.0% |
| 30 to 34 Minutes | 9 | 7.6% |
| 35 to 39 Minutes | 45 | 37.8% |
| 40 to 44 Minutes | 0 | 0.0% |
| 45 to 59 Minutes | 8 | 6.7% |
| 60 to 89 Minutes | 2 | 1.7% |
| 90 or more Minutes | 45 | 37.8% |
Commute Time by Sex in Spring Branch
The most common commute times in Spring Branch are 90 or more minutes (45 commuters, 75.0%) for males and 35 to 39 minutes (45 commuters, 76.3%) for females.
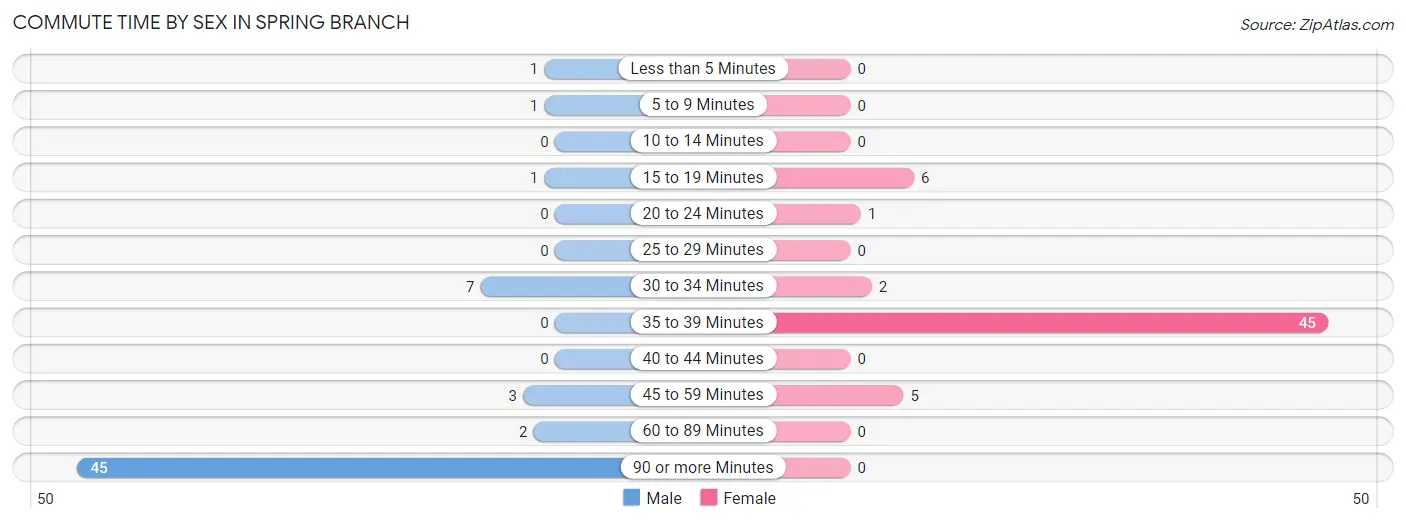
| Commute Time | Male | Female |
| Less than 5 Minutes | 1 (1.7%) | 0 (0.0%) |
| 5 to 9 Minutes | 1 (1.7%) | 0 (0.0%) |
| 10 to 14 Minutes | 0 (0.0%) | 0 (0.0%) |
| 15 to 19 Minutes | 1 (1.7%) | 6 (10.2%) |
| 20 to 24 Minutes | 0 (0.0%) | 1 (1.7%) |
| 25 to 29 Minutes | 0 (0.0%) | 0 (0.0%) |
| 30 to 34 Minutes | 7 (11.7%) | 2 (3.4%) |
| 35 to 39 Minutes | 0 (0.0%) | 45 (76.3%) |
| 40 to 44 Minutes | 0 (0.0%) | 0 (0.0%) |
| 45 to 59 Minutes | 3 (5.0%) | 5 (8.5%) |
| 60 to 89 Minutes | 2 (3.3%) | 0 (0.0%) |
| 90 or more Minutes | 45 (75.0%) | 0 (0.0%) |
Time of Departure to Work by Sex in Spring Branch
The most frequent times of departure to work in Spring Branch are 6:00 AM to 6:29 AM (40, 66.7%) for males and 12:00 AM to 4:59 AM (45, 76.3%) for females.
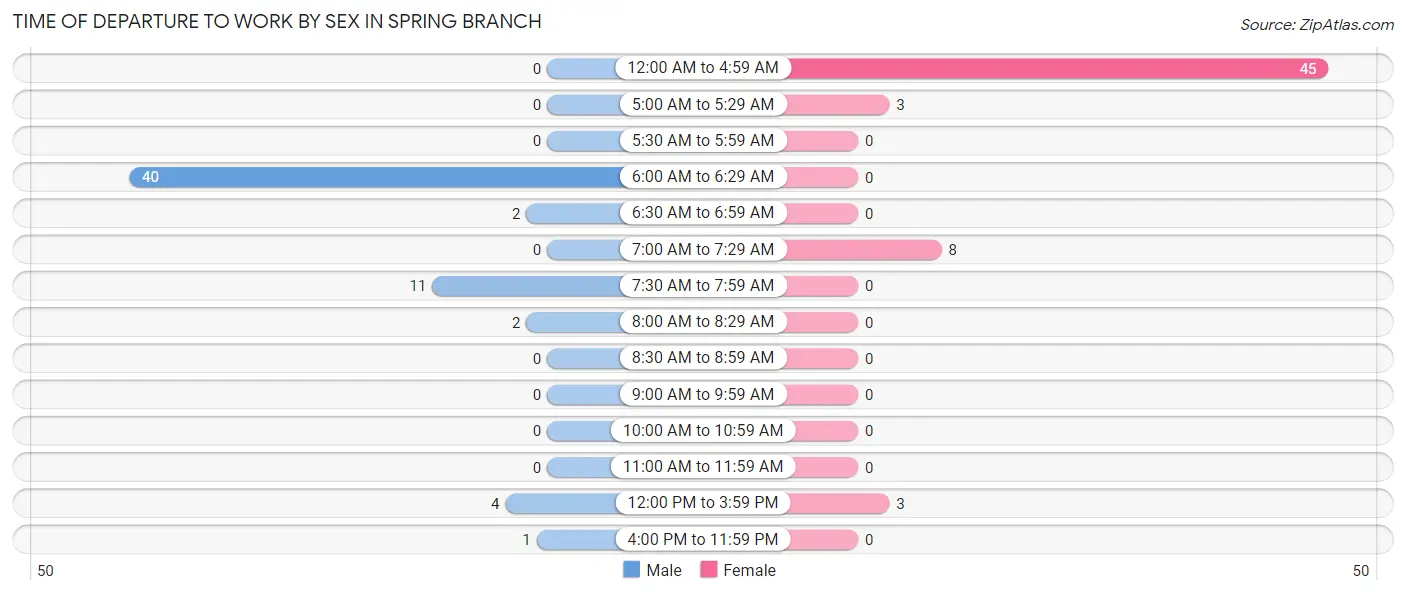
| Time of Departure | Male | Female |
| 12:00 AM to 4:59 AM | 0 (0.0%) | 45 (76.3%) |
| 5:00 AM to 5:29 AM | 0 (0.0%) | 3 (5.1%) |
| 5:30 AM to 5:59 AM | 0 (0.0%) | 0 (0.0%) |
| 6:00 AM to 6:29 AM | 40 (66.7%) | 0 (0.0%) |
| 6:30 AM to 6:59 AM | 2 (3.3%) | 0 (0.0%) |
| 7:00 AM to 7:29 AM | 0 (0.0%) | 8 (13.6%) |
| 7:30 AM to 7:59 AM | 11 (18.3%) | 0 (0.0%) |
| 8:00 AM to 8:29 AM | 2 (3.3%) | 0 (0.0%) |
| 8:30 AM to 8:59 AM | 0 (0.0%) | 0 (0.0%) |
| 9:00 AM to 9:59 AM | 0 (0.0%) | 0 (0.0%) |
| 10:00 AM to 10:59 AM | 0 (0.0%) | 0 (0.0%) |
| 11:00 AM to 11:59 AM | 0 (0.0%) | 0 (0.0%) |
| 12:00 PM to 3:59 PM | 4 (6.7%) | 3 (5.1%) |
| 4:00 PM to 11:59 PM | 1 (1.7%) | 0 (0.0%) |
| Total | 60 (100.0%) | 59 (100.0%) |
Housing Occupancy in Spring Branch
Occupancy by Ownership in Spring Branch
Of the total 89 dwellings in Spring Branch, owner-occupied units account for 41 (46.1%), while renter-occupied units make up 48 (53.9%).
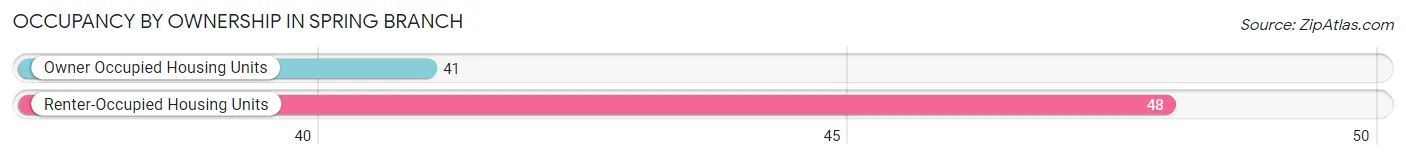
| Occupancy | # Housing Units | % Housing Units |
| Owner Occupied Housing Units | 41 | 46.1% |
| Renter-Occupied Housing Units | 48 | 53.9% |
| Total Occupied Housing Units | 89 | 100.0% |
Occupancy by Household Size in Spring Branch
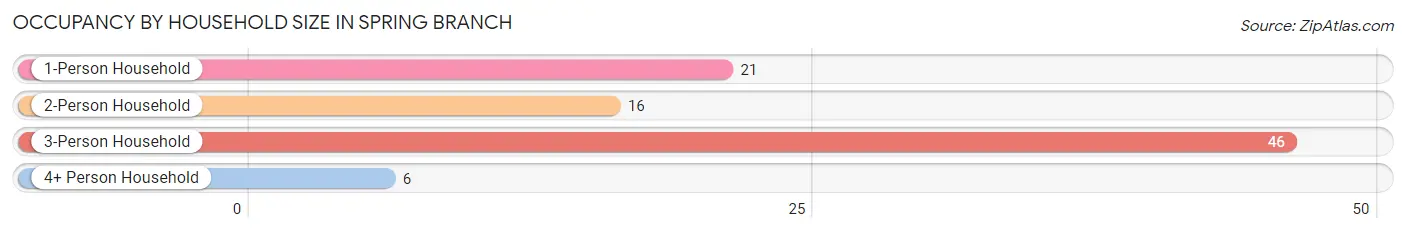
| Household Size | # Housing Units | % Housing Units |
| 1-Person Household | 21 | 23.6% |
| 2-Person Household | 16 | 18.0% |
| 3-Person Household | 46 | 51.7% |
| 4+ Person Household | 6 | 6.7% |
| Total Housing Units | 89 | 100.0% |
Occupancy by Ownership by Household Size in Spring Branch
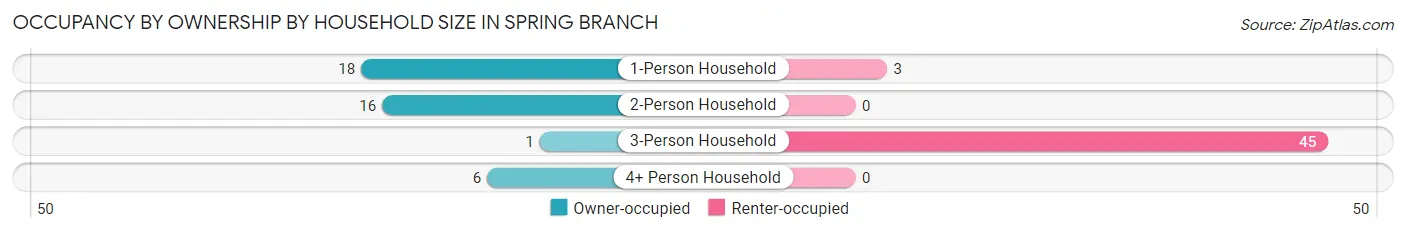
| Household Size | Owner-occupied | Renter-occupied |
| 1-Person Household | 18 (85.7%) | 3 (14.3%) |
| 2-Person Household | 16 (100.0%) | 0 (0.0%) |
| 3-Person Household | 1 (2.2%) | 45 (97.8%) |
| 4+ Person Household | 6 (100.0%) | 0 (0.0%) |
| Total Housing Units | 41 (46.1%) | 48 (53.9%) |
Occupancy by Educational Attainment in Spring Branch
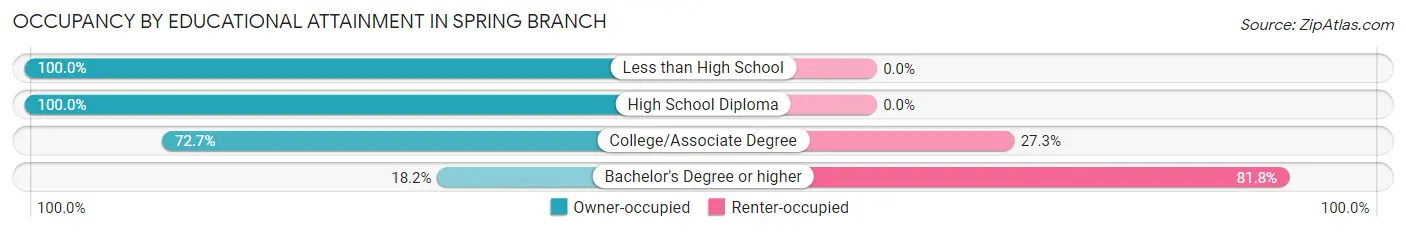
| Household Size | Owner-occupied | Renter-occupied |
| Less than High School | 5 (100.0%) | 0 (0.0%) |
| High School Diploma | 18 (100.0%) | 0 (0.0%) |
| College/Associate Degree | 8 (72.7%) | 3 (27.3%) |
| Bachelor's Degree or higher | 10 (18.2%) | 45 (81.8%) |
Occupancy by Age of Householder in Spring Branch
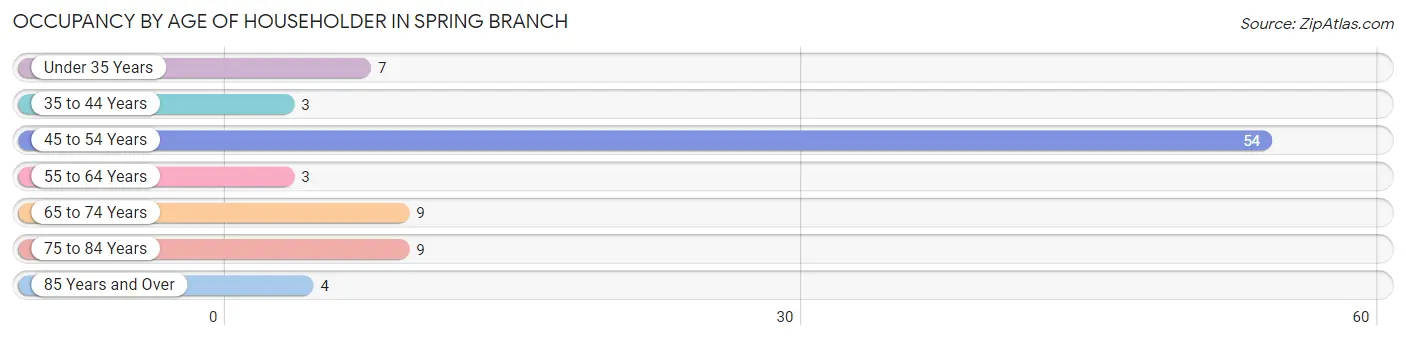
| Age Bracket | # Households | % Households |
| Under 35 Years | 7 | 7.9% |
| 35 to 44 Years | 3 | 3.4% |
| 45 to 54 Years | 54 | 60.7% |
| 55 to 64 Years | 3 | 3.4% |
| 65 to 74 Years | 9 | 10.1% |
| 75 to 84 Years | 9 | 10.1% |
| 85 Years and Over | 4 | 4.5% |
| Total | 89 | 100.0% |
Housing Finances in Spring Branch
Median Income by Occupancy in Spring Branch
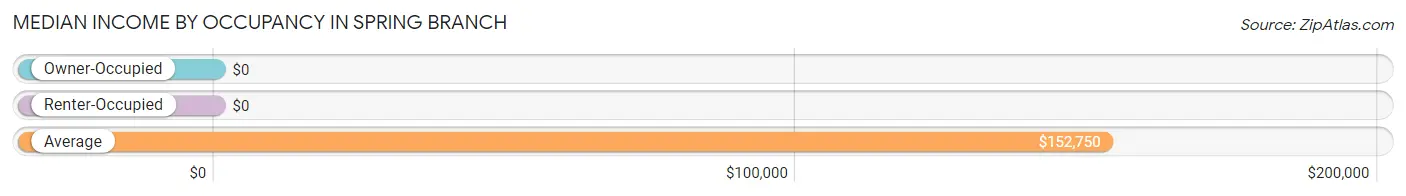
| Occupancy Type | # Households | Median Income |
| Owner-Occupied | 41 (46.1%) | $0 |
| Renter-Occupied | 48 (53.9%) | $0 |
| Average | 89 (100.0%) | $152,750 |
Occupancy by Householder Income Bracket in Spring Branch
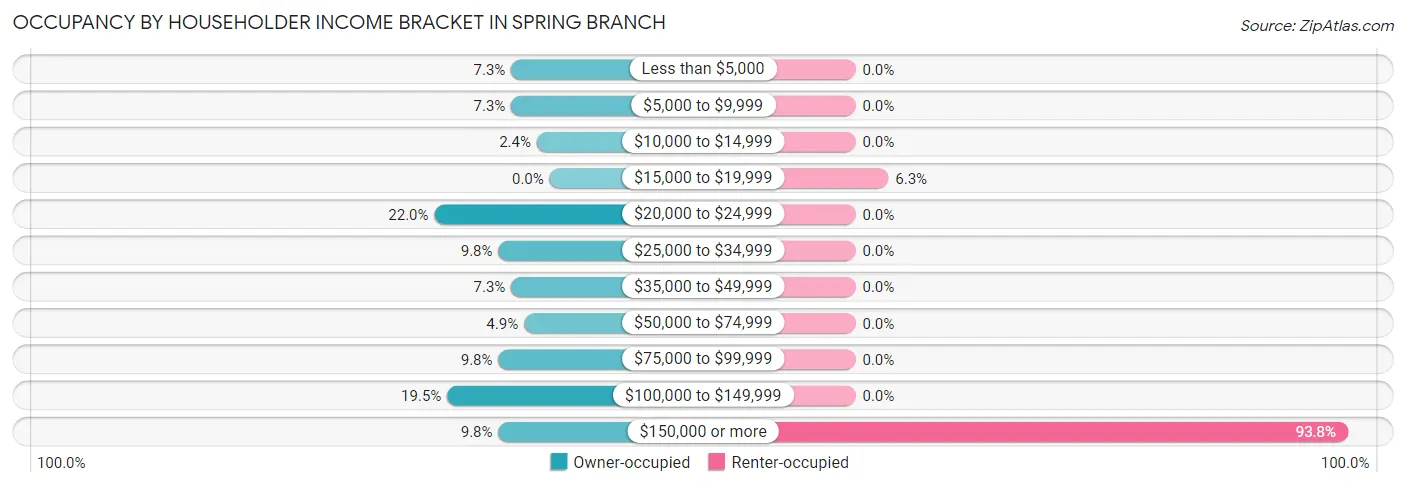
| Income Bracket | Owner-occupied | Renter-occupied |
| Less than $5,000 | 3 (7.3%) | 0 (0.0%) |
| $5,000 to $9,999 | 3 (7.3%) | 0 (0.0%) |
| $10,000 to $14,999 | 1 (2.4%) | 0 (0.0%) |
| $15,000 to $19,999 | 0 (0.0%) | 3 (6.2%) |
| $20,000 to $24,999 | 9 (22.0%) | 0 (0.0%) |
| $25,000 to $34,999 | 4 (9.8%) | 0 (0.0%) |
| $35,000 to $49,999 | 3 (7.3%) | 0 (0.0%) |
| $50,000 to $74,999 | 2 (4.9%) | 0 (0.0%) |
| $75,000 to $99,999 | 4 (9.8%) | 0 (0.0%) |
| $100,000 to $149,999 | 8 (19.5%) | 0 (0.0%) |
| $150,000 or more | 4 (9.8%) | 45 (93.8%) |
| Total | 41 (100.0%) | 48 (100.0%) |
Monthly Housing Cost Tiers in Spring Branch
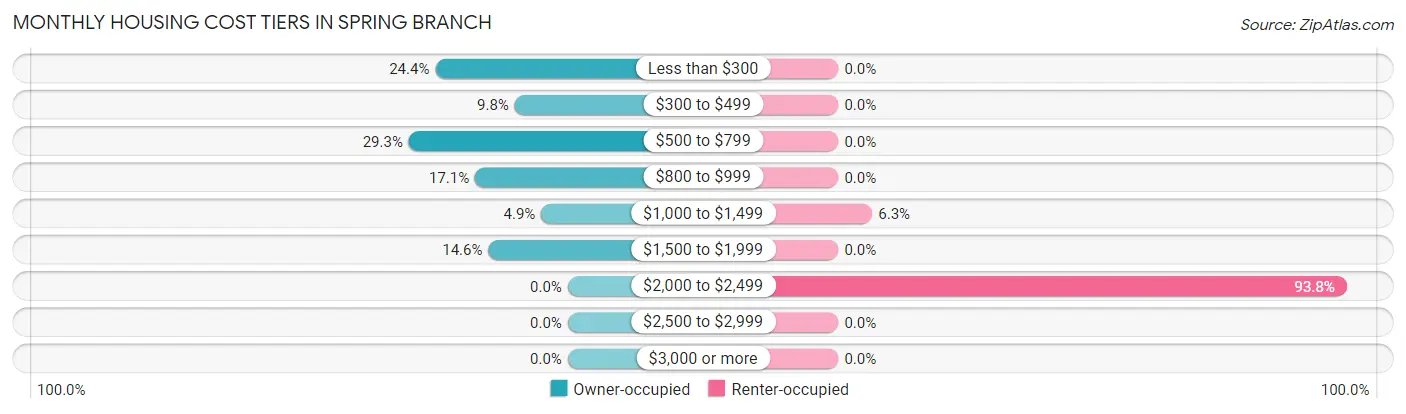
| Monthly Cost | Owner-occupied | Renter-occupied |
| Less than $300 | 10 (24.4%) | 0 (0.0%) |
| $300 to $499 | 4 (9.8%) | 0 (0.0%) |
| $500 to $799 | 12 (29.3%) | 0 (0.0%) |
| $800 to $999 | 7 (17.1%) | 0 (0.0%) |
| $1,000 to $1,499 | 2 (4.9%) | 3 (6.2%) |
| $1,500 to $1,999 | 6 (14.6%) | 0 (0.0%) |
| $2,000 to $2,499 | 0 (0.0%) | 45 (93.8%) |
| $2,500 to $2,999 | 0 (0.0%) | 0 (0.0%) |
| $3,000 or more | 0 (0.0%) | 0 (0.0%) |
| Total | 41 (100.0%) | 48 (100.0%) |
Physical Housing Characteristics in Spring Branch
Housing Structures in Spring Branch
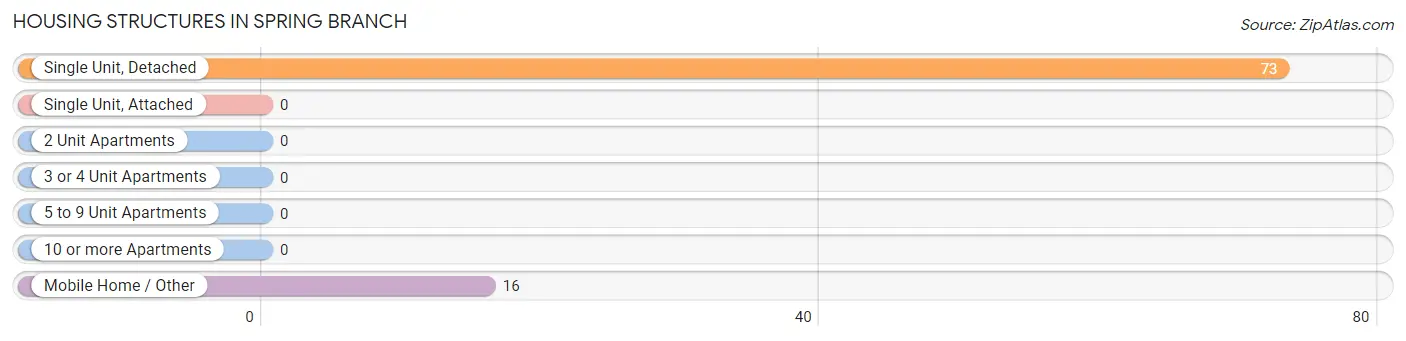
| Structure Type | # Housing Units | % Housing Units |
| Single Unit, Detached | 73 | 82.0% |
| Single Unit, Attached | 0 | 0.0% |
| 2 Unit Apartments | 0 | 0.0% |
| 3 or 4 Unit Apartments | 0 | 0.0% |
| 5 to 9 Unit Apartments | 0 | 0.0% |
| 10 or more Apartments | 0 | 0.0% |
| Mobile Home / Other | 16 | 18.0% |
| Total | 89 | 100.0% |
Housing Structures by Occupancy in Spring Branch
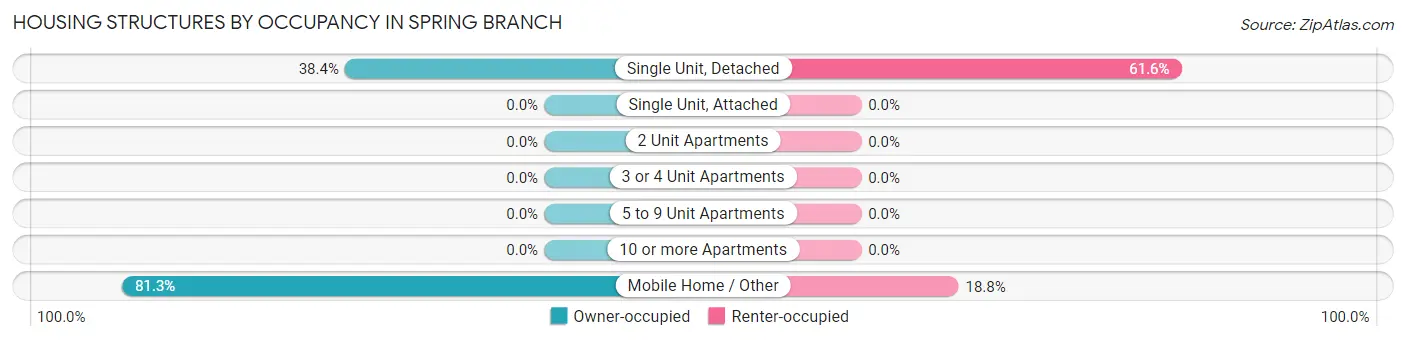
| Structure Type | Owner-occupied | Renter-occupied |
| Single Unit, Detached | 28 (38.4%) | 45 (61.6%) |
| Single Unit, Attached | 0 (0.0%) | 0 (0.0%) |
| 2 Unit Apartments | 0 (0.0%) | 0 (0.0%) |
| 3 or 4 Unit Apartments | 0 (0.0%) | 0 (0.0%) |
| 5 to 9 Unit Apartments | 0 (0.0%) | 0 (0.0%) |
| 10 or more Apartments | 0 (0.0%) | 0 (0.0%) |
| Mobile Home / Other | 13 (81.2%) | 3 (18.8%) |
| Total | 41 (46.1%) | 48 (53.9%) |
Housing Structures by Number of Rooms in Spring Branch
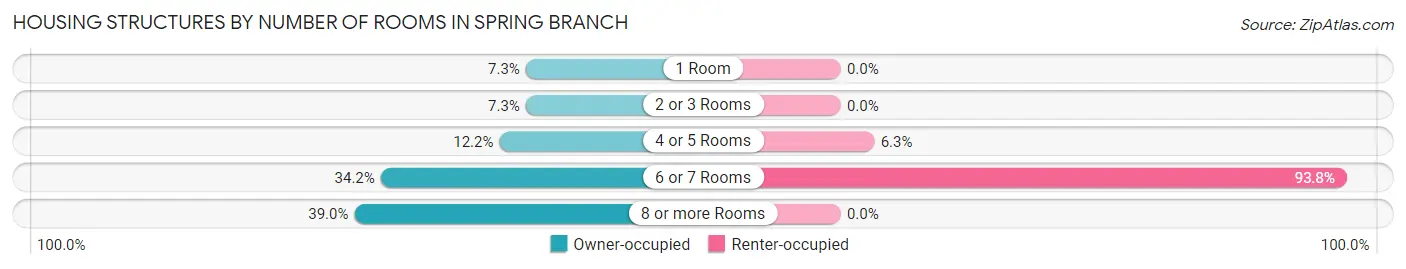
| Number of Rooms | Owner-occupied | Renter-occupied |
| 1 Room | 3 (7.3%) | 0 (0.0%) |
| 2 or 3 Rooms | 3 (7.3%) | 0 (0.0%) |
| 4 or 5 Rooms | 5 (12.2%) | 3 (6.2%) |
| 6 or 7 Rooms | 14 (34.2%) | 45 (93.8%) |
| 8 or more Rooms | 16 (39.0%) | 0 (0.0%) |
| Total | 41 (100.0%) | 48 (100.0%) |
Housing Structure by Heating Type in Spring Branch
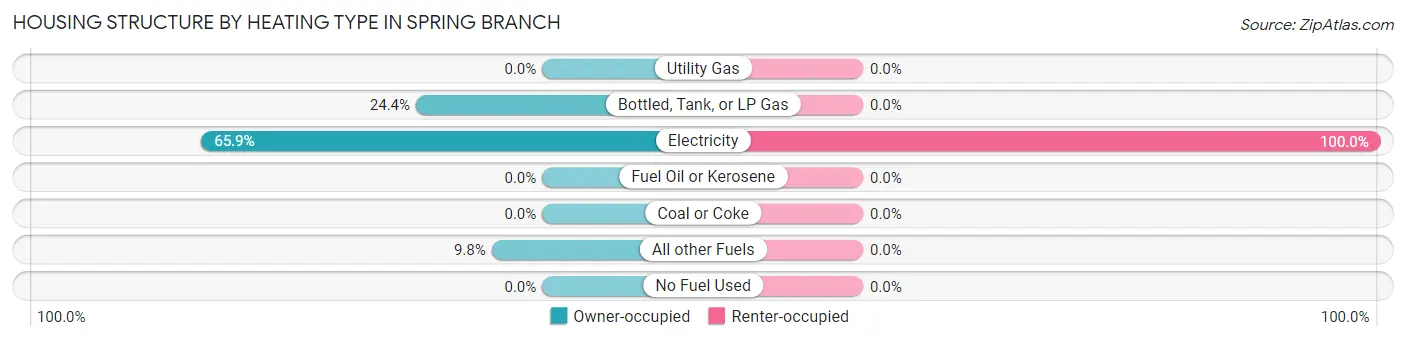
| Heating Type | Owner-occupied | Renter-occupied |
| Utility Gas | 0 (0.0%) | 0 (0.0%) |
| Bottled, Tank, or LP Gas | 10 (24.4%) | 0 (0.0%) |
| Electricity | 27 (65.8%) | 48 (100.0%) |
| Fuel Oil or Kerosene | 0 (0.0%) | 0 (0.0%) |
| Coal or Coke | 0 (0.0%) | 0 (0.0%) |
| All other Fuels | 4 (9.8%) | 0 (0.0%) |
| No Fuel Used | 0 (0.0%) | 0 (0.0%) |
| Total | 41 (100.0%) | 48 (100.0%) |
Household Vehicle Usage in Spring Branch
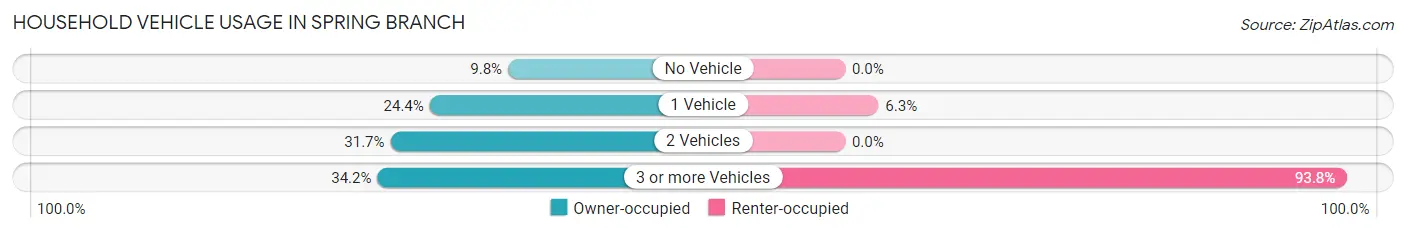
| Vehicles per Household | Owner-occupied | Renter-occupied |
| No Vehicle | 4 (9.8%) | 0 (0.0%) |
| 1 Vehicle | 10 (24.4%) | 3 (6.2%) |
| 2 Vehicles | 13 (31.7%) | 0 (0.0%) |
| 3 or more Vehicles | 14 (34.2%) | 45 (93.8%) |
| Total | 41 (100.0%) | 48 (100.0%) |
Real Estate & Mortgages in Spring Branch
Real Estate and Mortgage Overview in Spring Branch
| Characteristic | Without Mortgage | With Mortgage |
| Housing Units | 34 | 7 |
| Median Property Value | - | - |
| Median Household Income | $30,625 | $4 |
| Monthly Housing Costs | $600 | $0 |
| Real Estate Taxes | $3,500 | $0 |
Property Value by Mortgage Status in Spring Branch
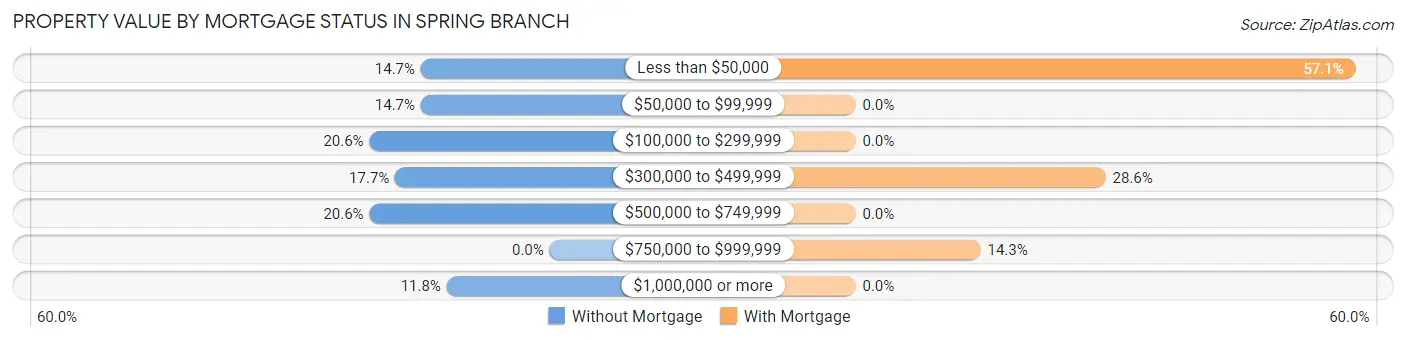
| Property Value | Without Mortgage | With Mortgage |
| Less than $50,000 | 5 (14.7%) | 4 (57.1%) |
| $50,000 to $99,999 | 5 (14.7%) | 0 (0.0%) |
| $100,000 to $299,999 | 7 (20.6%) | 0 (0.0%) |
| $300,000 to $499,999 | 6 (17.6%) | 2 (28.6%) |
| $500,000 to $749,999 | 7 (20.6%) | 0 (0.0%) |
| $750,000 to $999,999 | 0 (0.0%) | 1 (14.3%) |
| $1,000,000 or more | 4 (11.8%) | 0 (0.0%) |
| Total | 34 (100.0%) | 7 (100.0%) |
Household Income by Mortgage Status in Spring Branch
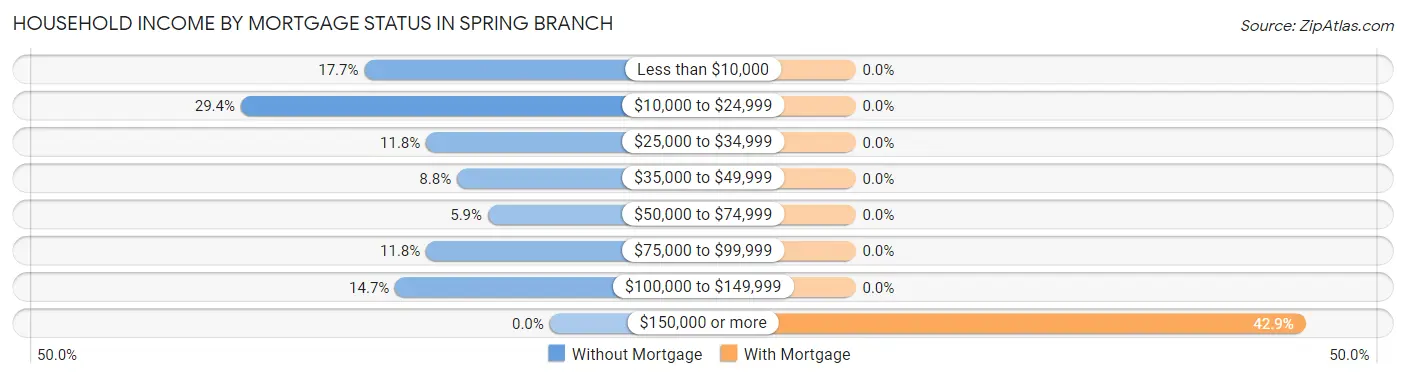
| Household Income | Without Mortgage | With Mortgage |
| Less than $10,000 | 6 (17.6%) | 0 (0.0%) |
| $10,000 to $24,999 | 10 (29.4%) | 0 (0.0%) |
| $25,000 to $34,999 | 4 (11.8%) | 0 (0.0%) |
| $35,000 to $49,999 | 3 (8.8%) | 0 (0.0%) |
| $50,000 to $74,999 | 2 (5.9%) | 0 (0.0%) |
| $75,000 to $99,999 | 4 (11.8%) | 0 (0.0%) |
| $100,000 to $149,999 | 5 (14.7%) | 0 (0.0%) |
| $150,000 or more | 0 (0.0%) | 3 (42.9%) |
| Total | 34 (100.0%) | 7 (100.0%) |
Property Value to Household Income Ratio in Spring Branch
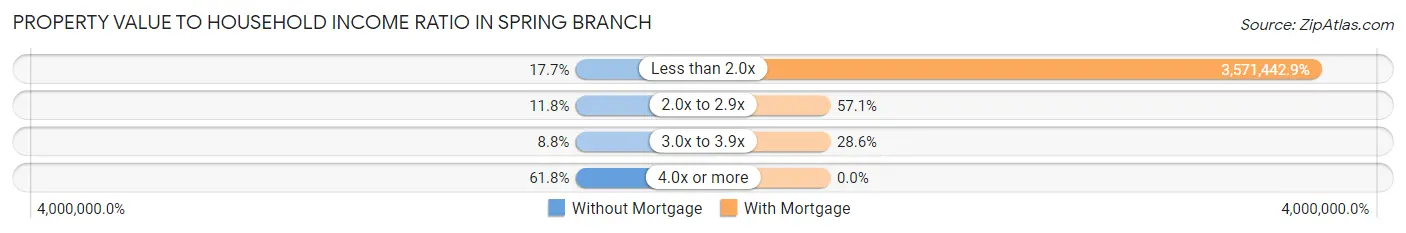
| Value-to-Income Ratio | Without Mortgage | With Mortgage |
| Less than 2.0x | 6 (17.6%) | 250,001 (3,571,442.9%) |
| 2.0x to 2.9x | 4 (11.8%) | 4 (57.1%) |
| 3.0x to 3.9x | 3 (8.8%) | 2 (28.6%) |
| 4.0x or more | 21 (61.8%) | 0 (0.0%) |
| Total | 34 (100.0%) | 7 (100.0%) |
Real Estate Taxes by Mortgage Status in Spring Branch
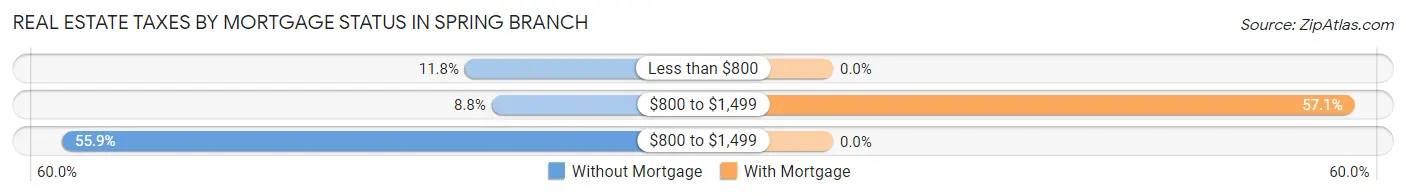
| Property Taxes | Without Mortgage | With Mortgage |
| Less than $800 | 4 (11.8%) | 0 (0.0%) |
| $800 to $1,499 | 3 (8.8%) | 4 (57.1%) |
| $800 to $1,499 | 19 (55.9%) | 0 (0.0%) |
| Total | 34 (100.0%) | 7 (100.0%) |
Health & Disability in Spring Branch
Health Insurance Coverage by Age in Spring Branch
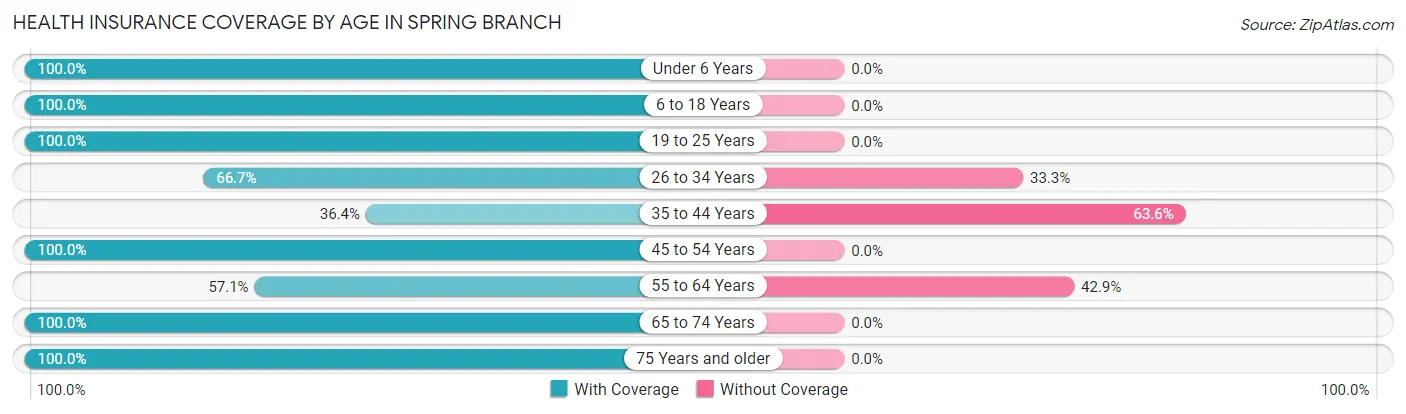
| Age Bracket | With Coverage | Without Coverage |
| Under 6 Years | 6 (100.0%) | 0 (0.0%) |
| 6 to 18 Years | 26 (100.0%) | 0 (0.0%) |
| 19 to 25 Years | 7 (100.0%) | 0 (0.0%) |
| 26 to 34 Years | 8 (66.7%) | 4 (33.3%) |
| 35 to 44 Years | 4 (36.4%) | 7 (63.6%) |
| 45 to 54 Years | 97 (100.0%) | 0 (0.0%) |
| 55 to 64 Years | 4 (57.1%) | 3 (42.9%) |
| 65 to 74 Years | 10 (100.0%) | 0 (0.0%) |
| 75 Years and older | 15 (100.0%) | 0 (0.0%) |
| Total | 177 (92.7%) | 14 (7.3%) |
Health Insurance Coverage by Citizenship Status in Spring Branch
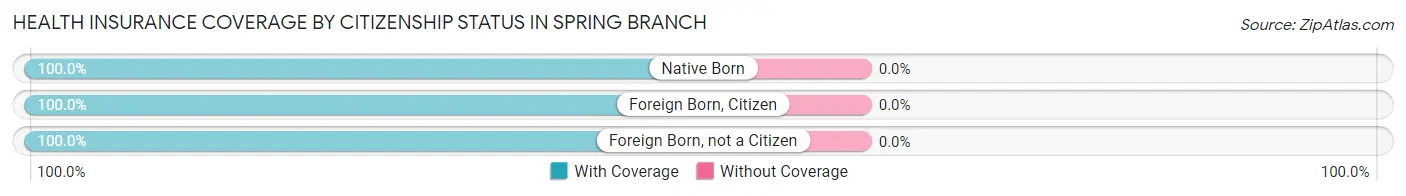
| Citizenship Status | With Coverage | Without Coverage |
| Native Born | 6 (100.0%) | 0 (0.0%) |
| Foreign Born, Citizen | 26 (100.0%) | 0 (0.0%) |
| Foreign Born, not a Citizen | 7 (100.0%) | 0 (0.0%) |
Health Insurance Coverage by Household Income in Spring Branch
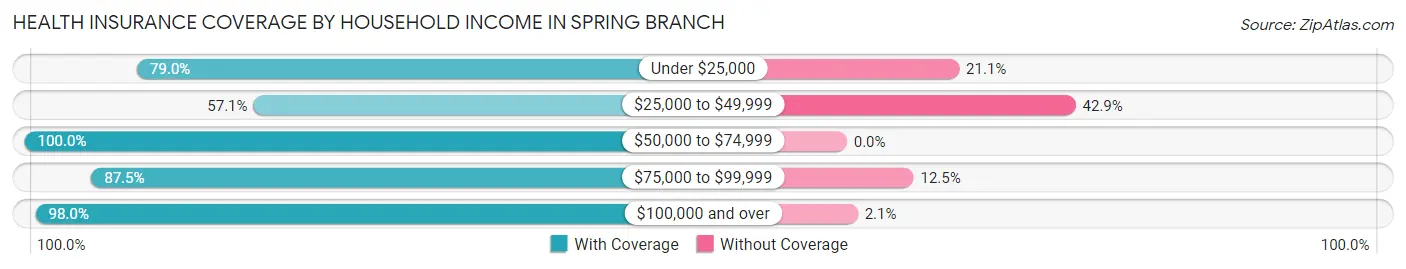
| Household Income | With Coverage | Without Coverage |
| Under $25,000 | 15 (78.9%) | 4 (21.0%) |
| $25,000 to $49,999 | 8 (57.1%) | 6 (42.9%) |
| $50,000 to $74,999 | 4 (100.0%) | 0 (0.0%) |
| $75,000 to $99,999 | 7 (87.5%) | 1 (12.5%) |
| $100,000 and over | 143 (98.0%) | 3 (2.1%) |
Public vs Private Health Insurance Coverage by Age in Spring Branch
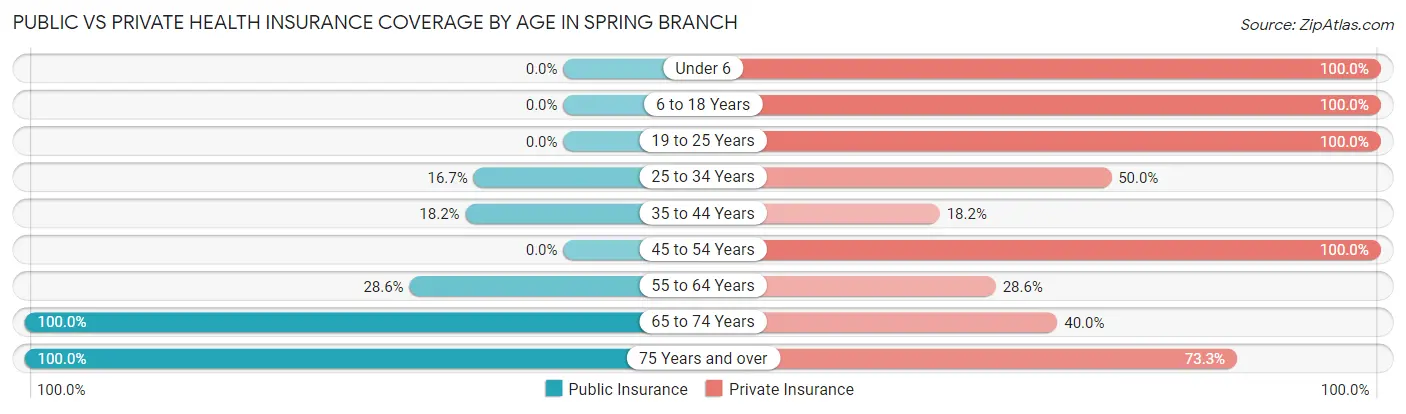
| Age Bracket | Public Insurance | Private Insurance |
| Under 6 | 0 (0.0%) | 6 (100.0%) |
| 6 to 18 Years | 0 (0.0%) | 26 (100.0%) |
| 19 to 25 Years | 0 (0.0%) | 7 (100.0%) |
| 25 to 34 Years | 2 (16.7%) | 6 (50.0%) |
| 35 to 44 Years | 2 (18.2%) | 2 (18.2%) |
| 45 to 54 Years | 0 (0.0%) | 97 (100.0%) |
| 55 to 64 Years | 2 (28.6%) | 2 (28.6%) |
| 65 to 74 Years | 10 (100.0%) | 4 (40.0%) |
| 75 Years and over | 15 (100.0%) | 11 (73.3%) |
| Total | 31 (16.2%) | 161 (84.3%) |
Disability Status by Sex by Age in Spring Branch
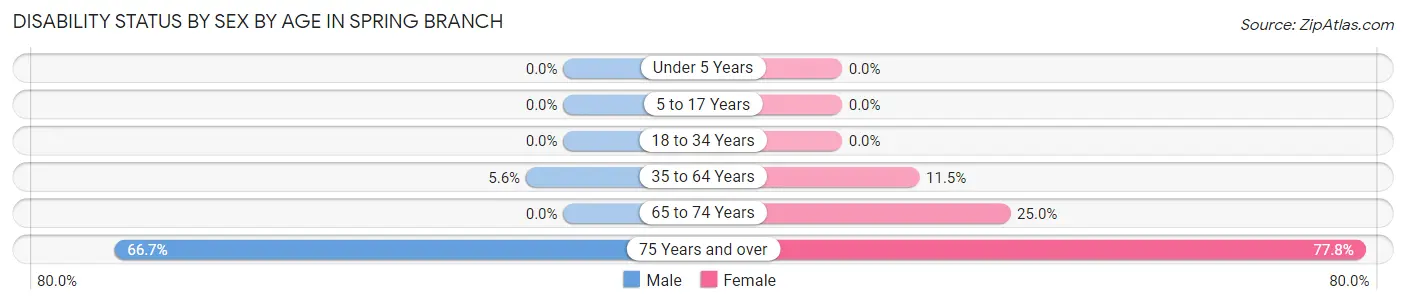
| Age Bracket | Male | Female |
| Under 5 Years | 0 (0.0%) | 0 (0.0%) |
| 5 to 17 Years | 0 (0.0%) | 0 (0.0%) |
| 18 to 34 Years | 0 (0.0%) | 0 (0.0%) |
| 35 to 64 Years | 3 (5.6%) | 7 (11.5%) |
| 65 to 74 Years | 0 (0.0%) | 1 (25.0%) |
| 75 Years and over | 4 (66.7%) | 7 (77.8%) |
Disability Class by Sex by Age in Spring Branch
Disability Class: Hearing Difficulty
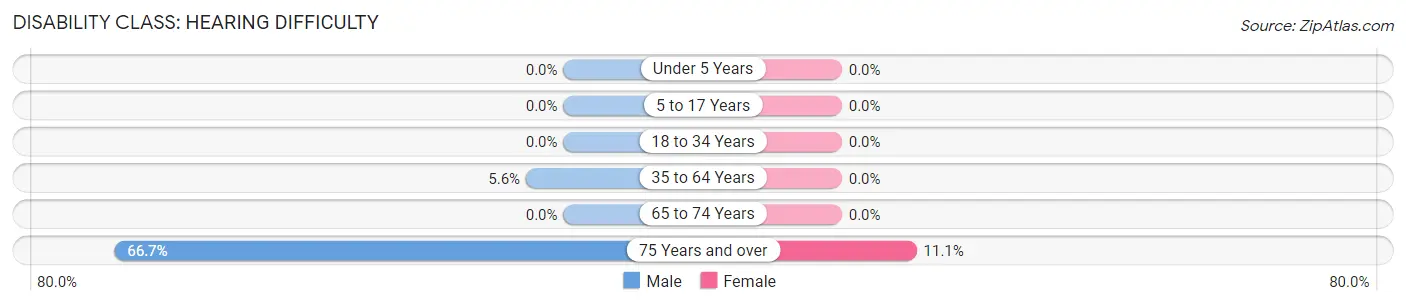
| Age Bracket | Male | Female |
| Under 5 Years | 0 (0.0%) | 0 (0.0%) |
| 5 to 17 Years | 0 (0.0%) | 0 (0.0%) |
| 18 to 34 Years | 0 (0.0%) | 0 (0.0%) |
| 35 to 64 Years | 3 (5.6%) | 0 (0.0%) |
| 65 to 74 Years | 0 (0.0%) | 0 (0.0%) |
| 75 Years and over | 4 (66.7%) | 1 (11.1%) |
Disability Class: Vision Difficulty
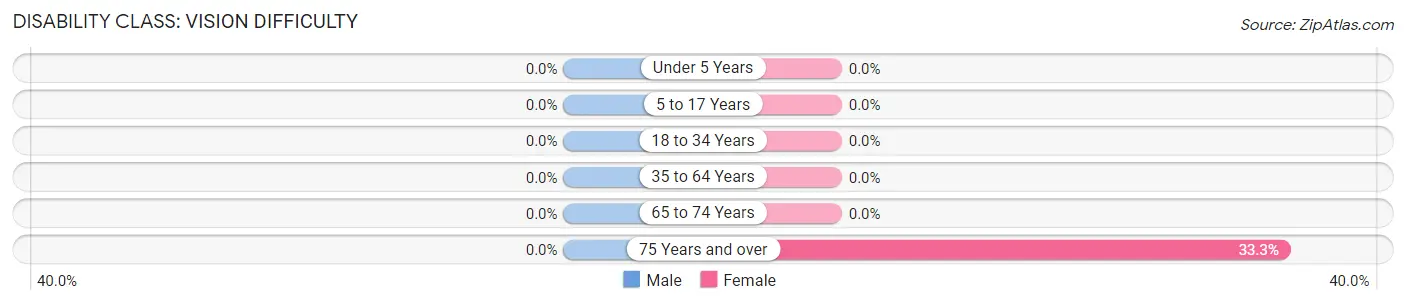
| Age Bracket | Male | Female |
| Under 5 Years | 0 (0.0%) | 0 (0.0%) |
| 5 to 17 Years | 0 (0.0%) | 0 (0.0%) |
| 18 to 34 Years | 0 (0.0%) | 0 (0.0%) |
| 35 to 64 Years | 0 (0.0%) | 0 (0.0%) |
| 65 to 74 Years | 0 (0.0%) | 0 (0.0%) |
| 75 Years and over | 0 (0.0%) | 3 (33.3%) |
Disability Class: Cognitive Difficulty
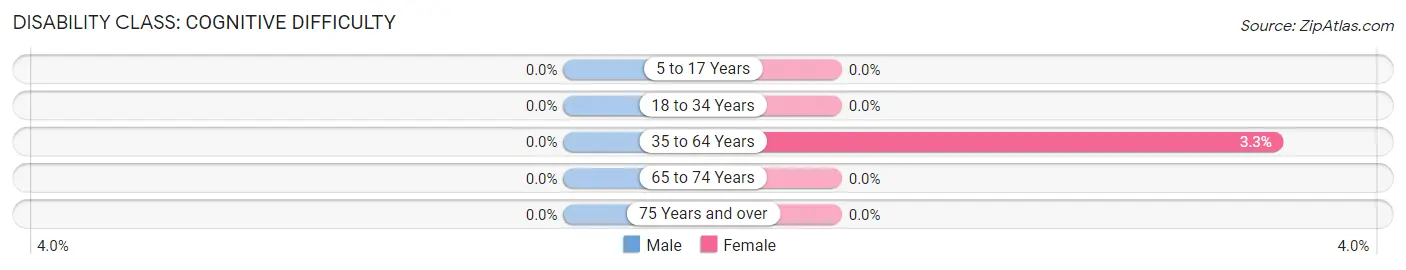
| Age Bracket | Male | Female |
| 5 to 17 Years | 0 (0.0%) | 0 (0.0%) |
| 18 to 34 Years | 0 (0.0%) | 0 (0.0%) |
| 35 to 64 Years | 0 (0.0%) | 2 (3.3%) |
| 65 to 74 Years | 0 (0.0%) | 0 (0.0%) |
| 75 Years and over | 0 (0.0%) | 0 (0.0%) |
Disability Class: Ambulatory Difficulty
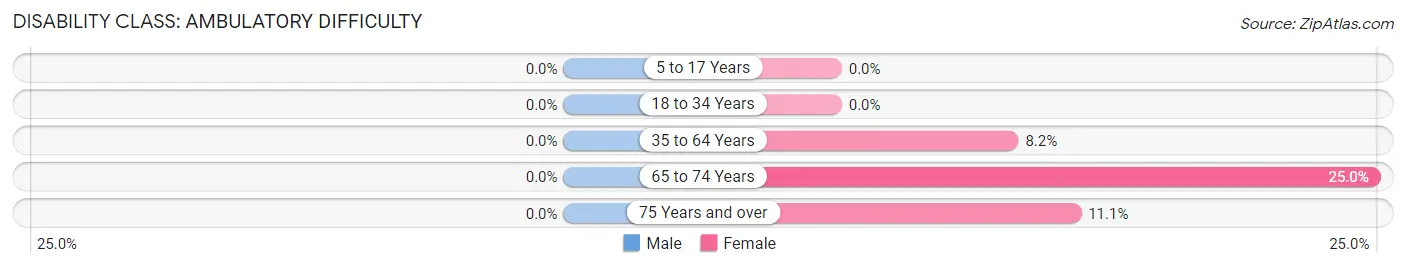
| Age Bracket | Male | Female |
| 5 to 17 Years | 0 (0.0%) | 0 (0.0%) |
| 18 to 34 Years | 0 (0.0%) | 0 (0.0%) |
| 35 to 64 Years | 0 (0.0%) | 5 (8.2%) |
| 65 to 74 Years | 0 (0.0%) | 1 (25.0%) |
| 75 Years and over | 0 (0.0%) | 1 (11.1%) |
Disability Class: Self-Care Difficulty
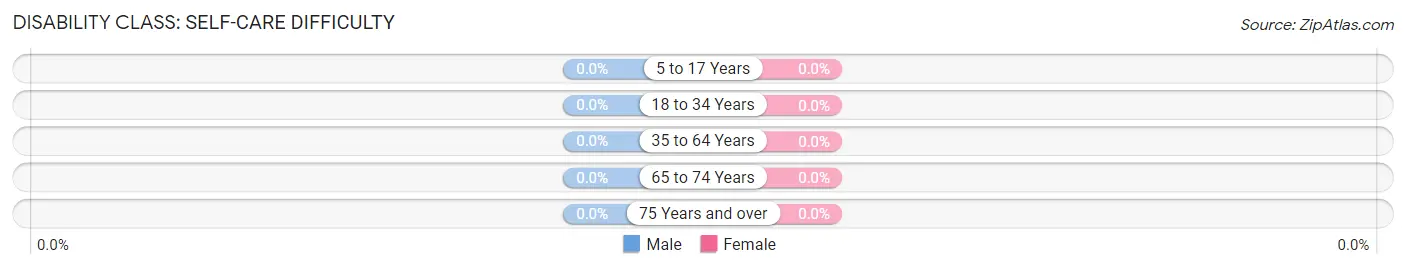
| Age Bracket | Male | Female |
| 5 to 17 Years | 0 (0.0%) | 0 (0.0%) |
| 18 to 34 Years | 0 (0.0%) | 0 (0.0%) |
| 35 to 64 Years | 0 (0.0%) | 0 (0.0%) |
| 65 to 74 Years | 0 (0.0%) | 0 (0.0%) |
| 75 Years and over | 0 (0.0%) | 0 (0.0%) |
Technology Access in Spring Branch
Computing Device Access in Spring Branch
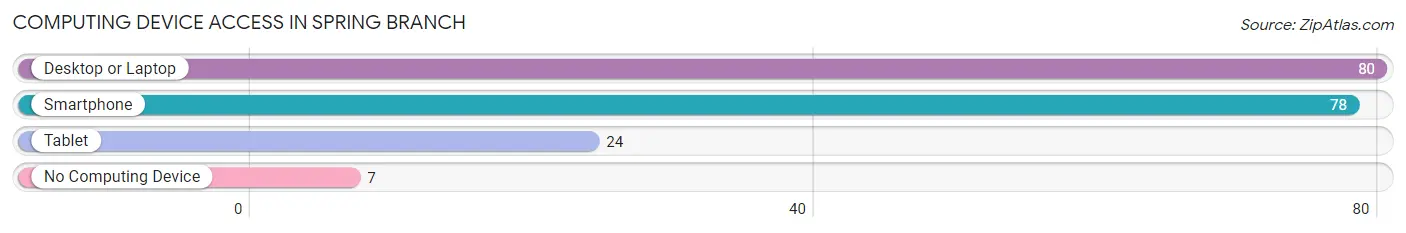
| Device Type | # Households | % Households |
| Desktop or Laptop | 80 | 89.9% |
| Smartphone | 78 | 87.6% |
| Tablet | 24 | 27.0% |
| No Computing Device | 7 | 7.9% |
| Total | 89 | 100.0% |
Internet Access in Spring Branch
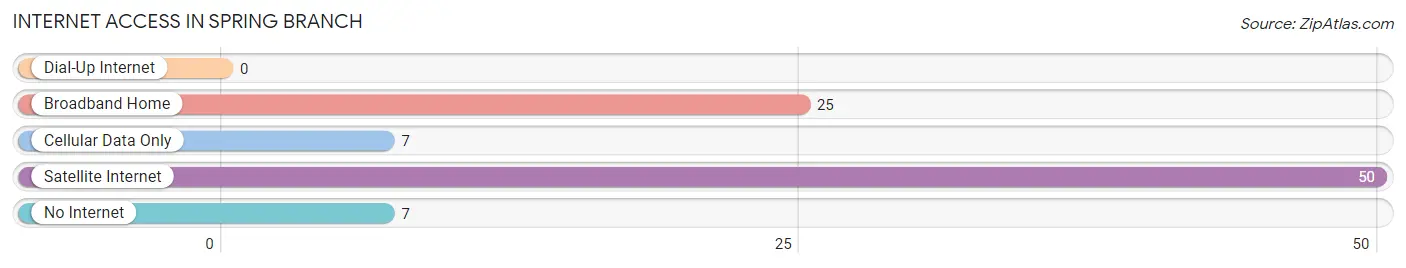
| Internet Type | # Households | % Households |
| Dial-Up Internet | 0 | 0.0% |
| Broadband Home | 25 | 28.1% |
| Cellular Data Only | 7 | 7.9% |
| Satellite Internet | 50 | 56.2% |
| No Internet | 7 | 7.9% |
| Total | 89 | 100.0% |
Spring Branch Summary
Introduction
Spring Branch is a census-designated place (CDP) located in the U.S. state of Texas. It is located in the western part of Harris County, and is part of the Greater Houston metropolitan area. The population of Spring Branch was estimated to be 28,711 in 2019. The area is known for its rolling hills, wooded areas, and numerous creeks and streams.
History
The area now known as Spring Branch was originally inhabited by the Karankawa and Atakapan Native American tribes. The first European settlers arrived in the area in the early 1800s, and the area was officially established in 1838. The area was named after a nearby spring that was located in a branch of Cypress Creek.
The area remained largely rural until the 1950s, when the population began to grow rapidly due to the development of the Houston metropolitan area. The area was annexed by the City of Houston in the 1960s, and the population continued to grow. In the 1970s, the area was incorporated as the City of Spring Branch. The city was later annexed by the City of Houston in 1996.
Geography
Spring Branch is located in the western part of Harris County, and is part of the Greater Houston metropolitan area. The area is bordered by the cities of Houston, Bellaire, and West University Place. The area is known for its rolling hills, wooded areas, and numerous creeks and streams. The area is also home to several parks, including Memorial Park, Spring Branch Park, and Spring Valley Park.
Economy
The economy of Spring Branch is largely based on the service industry. The area is home to several large employers, including Memorial Hermann Health System, Houston Methodist Hospital, and the Houston Independent School District. The area is also home to several retail and dining establishments, as well as a variety of small businesses.
Demographics
As of the 2019 census, the population of Spring Branch was estimated to be 28,711. The population is largely composed of White (63.2%), Hispanic or Latino (25.3%), and Asian (4.7%) residents. The median household income in the area is $63,945, and the median home value is $231,400.
Conclusion
Spring Branch is a census-designated place located in the western part of Harris County, Texas. The area is known for its rolling hills, wooded areas, and numerous creeks and streams. The economy of Spring Branch is largely based on the service industry, and the population is largely composed of White, Hispanic or Latino, and Asian residents. The median household income in the area is $63,945, and the median home value is $231,400.
Common Questions
What is Per Capita Income in Spring Branch?
Per Capita income in Spring Branch is $50,993.
What is the Median Family Income in Spring Branch?
Median Family Income in Spring Branch is $66,436.
What is the Median Household income in Spring Branch?
Median Household Income in Spring Branch is $152,750.
What is Income or Wage Gap in Spring Branch?
Income or Wage Gap in Spring Branch is 23.9%.
Women in Spring Branch earn 76.1 cents for every dollar earned by a man.
What is Inequality or Gini Index in Spring Branch?
Inequality or Gini Index in Spring Branch is 0.32.
What is the Total Population of Spring Branch?
Total Population of Spring Branch is 191.
What is the Total Male Population of Spring Branch?
Total Male Population of Spring Branch is 73.
What is the Total Female Population of Spring Branch?
Total Female Population of Spring Branch is 118.
What is the Ratio of Males per 100 Females in Spring Branch?
There are 61.86 Males per 100 Females in Spring Branch.
What is the Ratio of Females per 100 Males in Spring Branch?
There are 161.64 Females per 100 Males in Spring Branch.
What is the Median Population Age in Spring Branch?
Median Population Age in Spring Branch is 49.6 Years.
What is the Average Family Size in Spring Branch
Average Family Size in Spring Branch is 1.9 People.
What is the Average Household Size in Spring Branch
Average Household Size in Spring Branch is 2.1 People.
How Large is the Labor Force in Spring Branch?
There are 129 People in the Labor Forcein in Spring Branch.
What is the Percentage of People in the Labor Force in Spring Branch?
73.7% of People are in the Labor Force in Spring Branch.
What is the Unemployment Rate in Spring Branch?
Unemployment Rate in Spring Branch is 1.6%.