Slaton, TX Map & Demographics
Slaton Map
Slaton Overview
$23,760
PER CAPITA INCOME
$52,475
AVG FAMILY INCOME
$54,278
AVG HOUSEHOLD INCOME
39.1%
WAGE / INCOME GAP [ % ]
60.9¢/ $1
WAGE / INCOME GAP [ $ ]
0.37
INEQUALITY / GINI INDEX
5,859
TOTAL POPULATION
2,736
MALE POPULATION
3,123
FEMALE POPULATION
87.61
MALES / 100 FEMALES
114.14
FEMALES / 100 MALES
35.4
MEDIAN AGE
3.4
AVG FAMILY SIZE
2.8
AVG HOUSEHOLD SIZE
2,709
LABOR FORCE [ PEOPLE ]
61.2%
PERCENT IN LABOR FORCE
7.7%
UNEMPLOYMENT RATE
Slaton Zip Codes
Slaton Area Codes
Income in Slaton
Income Overview in Slaton
Per Capita Income in Slaton is $23,760, while median incomes of families and households are $52,475 and $54,278 respectively.
| Characteristic | Number | Measure |
| Per Capita Income | 5,859 | $23,760 |
| Median Family Income | 1,429 | $52,475 |
| Mean Family Income | 1,429 | $73,386 |
| Median Household Income | 2,030 | $54,278 |
| Mean Household Income | 2,030 | $68,672 |
| Income Deficit | 1,429 | $0 |
| Wage / Income Gap (%) | 5,859 | 39.14% |
| Wage / Income Gap ($) | 5,859 | 60.86¢ per $1 |
| Gini / Inequality Index | 5,859 | 0.37 |
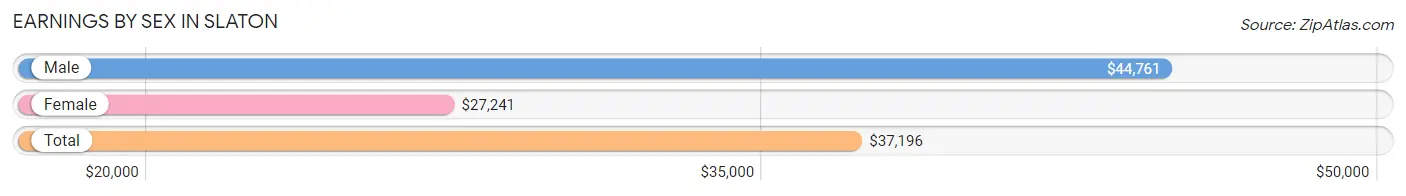
Earnings by Sex in Slaton
Average Earnings in Slaton are $37,196, $44,761 for men and $27,241 for women, a difference of 39.1%.
| Sex | Number | Average Earnings |
| Male | 1,454 (51.4%) | $44,761 |
| Female | 1,372 (48.5%) | $27,241 |
| Total | 2,826 (100.0%) | $37,196 |
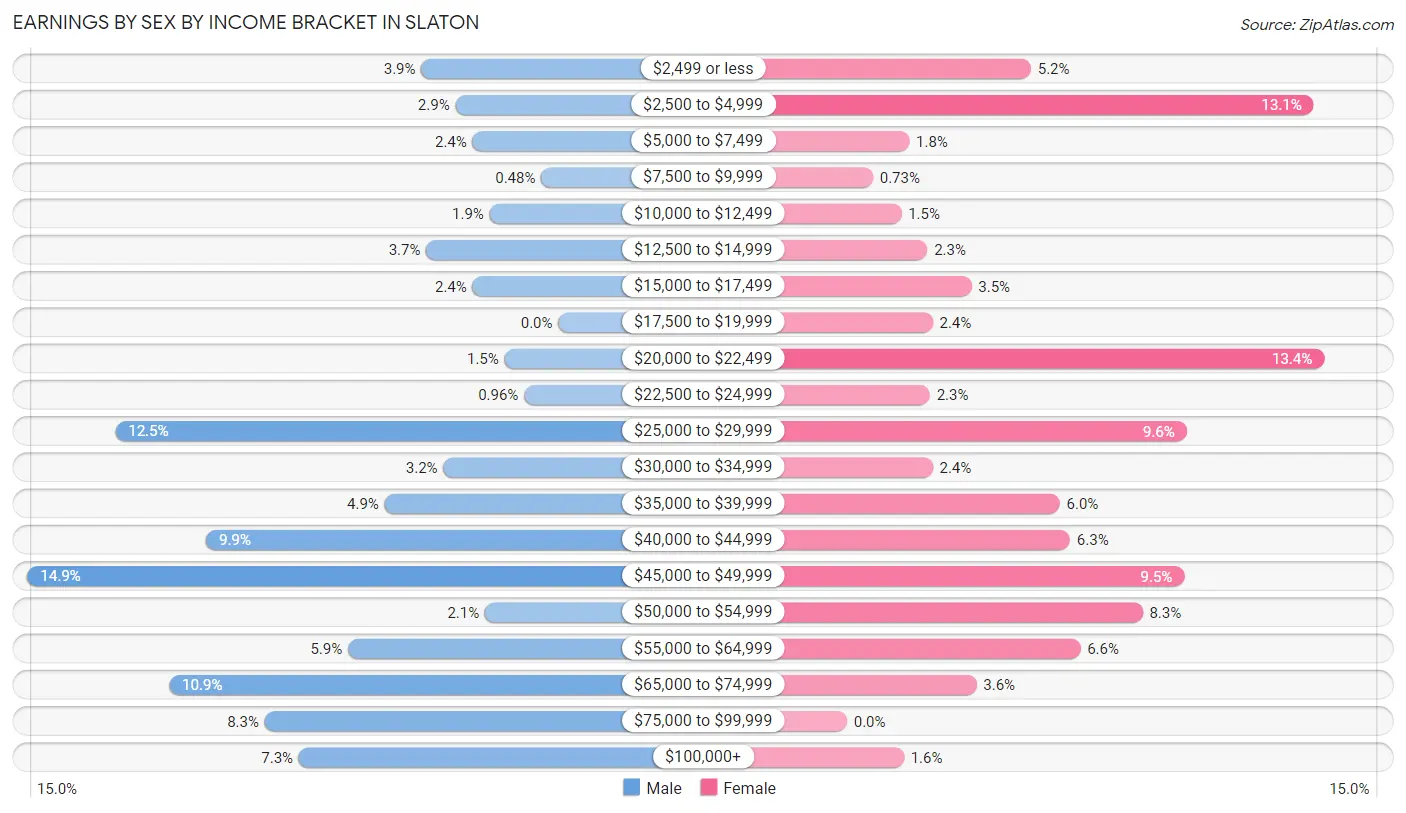
Earnings by Sex by Income Bracket in Slaton
The most common earnings brackets in Slaton are $45,000 to $49,999 for men (217 | 14.9%) and $20,000 to $22,499 for women (184 | 13.4%).
| Income | Male | Female |
| $2,499 or less | 56 (3.8%) | 71 (5.2%) |
| $2,500 to $4,999 | 42 (2.9%) | 180 (13.1%) |
| $5,000 to $7,499 | 35 (2.4%) | 24 (1.8%) |
| $7,500 to $9,999 | 7 (0.5%) | 10 (0.7%) |
| $10,000 to $12,499 | 28 (1.9%) | 21 (1.5%) |
| $12,500 to $14,999 | 54 (3.7%) | 31 (2.3%) |
| $15,000 to $17,499 | 35 (2.4%) | 48 (3.5%) |
| $17,500 to $19,999 | 0 (0.0%) | 33 (2.4%) |
| $20,000 to $22,499 | 22 (1.5%) | 184 (13.4%) |
| $22,500 to $24,999 | 14 (1.0%) | 32 (2.3%) |
| $25,000 to $29,999 | 181 (12.4%) | 131 (9.6%) |
| $30,000 to $34,999 | 47 (3.2%) | 33 (2.4%) |
| $35,000 to $39,999 | 71 (4.9%) | 82 (6.0%) |
| $40,000 to $44,999 | 144 (9.9%) | 86 (6.3%) |
| $45,000 to $49,999 | 217 (14.9%) | 130 (9.5%) |
| $50,000 to $54,999 | 30 (2.1%) | 114 (8.3%) |
| $55,000 to $64,999 | 86 (5.9%) | 90 (6.6%) |
| $65,000 to $74,999 | 159 (10.9%) | 50 (3.6%) |
| $75,000 to $99,999 | 120 (8.3%) | 0 (0.0%) |
| $100,000+ | 106 (7.3%) | 22 (1.6%) |
| Total | 1,454 (100.0%) | 1,372 (100.0%) |
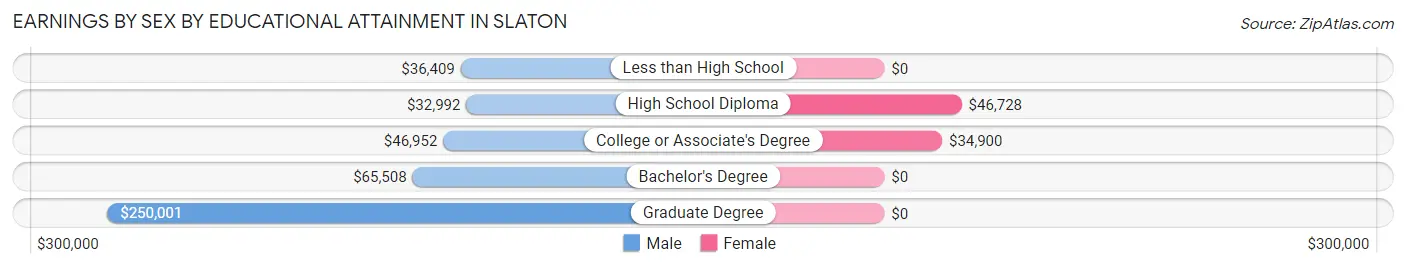
Earnings by Sex by Educational Attainment in Slaton
Average earnings in Slaton are $44,654 for men and $37,772 for women, a difference of 15.4%. Men with an educational attainment of graduate degree enjoy the highest average annual earnings of $250,001, while those with high school diploma education earn the least with $32,992. Women with an educational attainment of high school diploma earn the most with the average annual earnings of $46,728, while those with college or associate's degree education have the smallest earnings of $34,900.
| Educational Attainment | Male Income | Female Income |
| Less than High School | $36,409 | $0 |
| High School Diploma | $32,992 | $46,728 |
| College or Associate's Degree | $46,952 | $34,900 |
| Bachelor's Degree | $65,508 | $0 |
| Graduate Degree | $250,001 | $0 |
| Total | $44,654 | $37,772 |
Family Income in Slaton
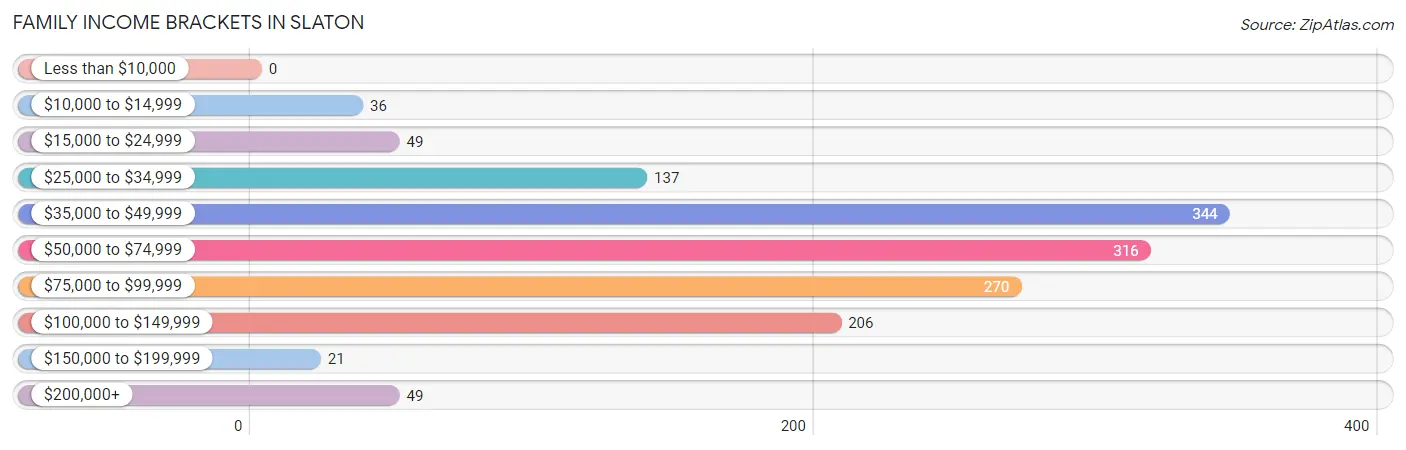
Family Income Brackets in Slaton
According to the Slaton family income data, there are 344 families falling into the $35,000 to $49,999 income range, which is the most common income bracket and makes up 24.1% of all families.
| Income Bracket | # Families | % Families |
| Less than $10,000 | 0 | 0.0% |
| $10,000 to $14,999 | 36 | 2.5% |
| $15,000 to $24,999 | 49 | 3.4% |
| $25,000 to $34,999 | 137 | 9.6% |
| $35,000 to $49,999 | 344 | 24.1% |
| $50,000 to $74,999 | 316 | 22.1% |
| $75,000 to $99,999 | 270 | 18.9% |
| $100,000 to $149,999 | 206 | 14.4% |
| $150,000 to $199,999 | 21 | 1.5% |
| $200,000+ | 49 | 3.4% |
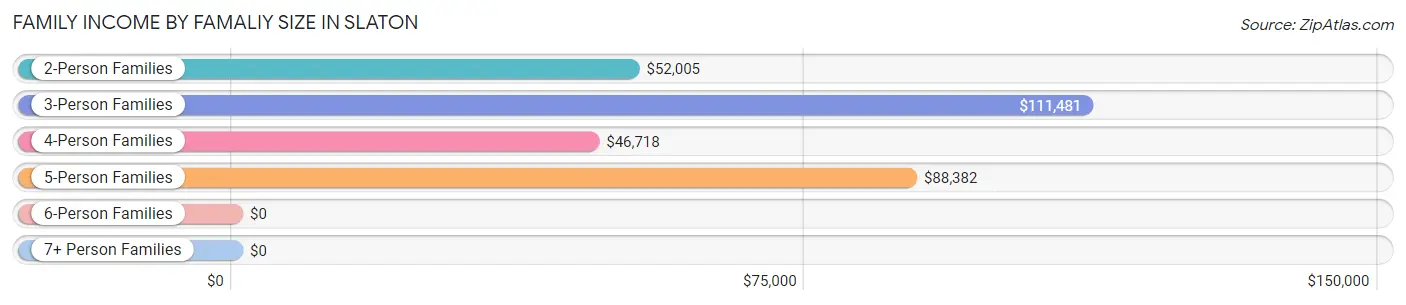
Family Income by Famaliy Size in Slaton
3-person families (165 | 11.6%) account for the highest median family income in Slaton with $111,481 per family, while 3-person families (165 | 11.6%) have the highest median income of $37,160 per family member.
| Income Bracket | # Families | Median Income |
| 2-Person Families | 594 (41.6%) | $52,005 |
| 3-Person Families | 165 (11.6%) | $111,481 |
| 4-Person Families | 448 (31.4%) | $46,718 |
| 5-Person Families | 84 (5.9%) | $88,382 |
| 6-Person Families | 98 (6.9%) | $0 |
| 7+ Person Families | 40 (2.8%) | $0 |
| Total | 1,429 (100.0%) | $52,475 |
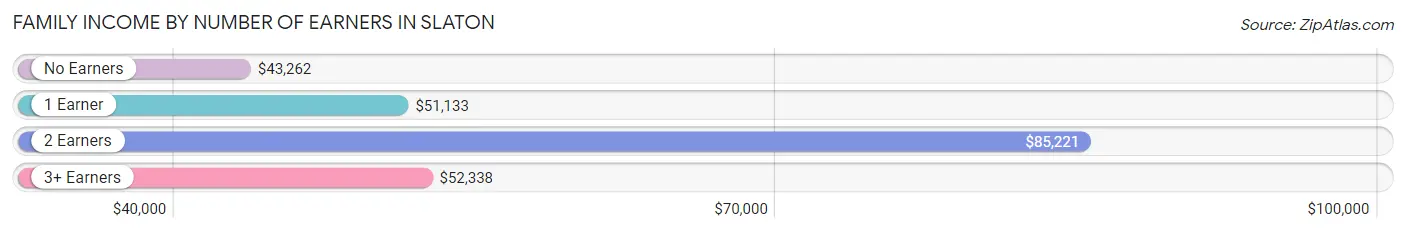
Family Income by Number of Earners in Slaton
The median family income in Slaton is $52,475, with families comprising 2 earners (722) having the highest median family income of $85,221, while families with no earners (87) have the lowest median family income of $43,262, accounting for 50.5% and 6.1% of families, respectively.
| Number of Earners | # Families | Median Income |
| No Earners | 87 (6.1%) | $43,262 |
| 1 Earner | 501 (35.1%) | $51,133 |
| 2 Earners | 722 (50.5%) | $85,221 |
| 3+ Earners | 119 (8.3%) | $52,338 |
| Total | 1,429 (100.0%) | $52,475 |
Household Income in Slaton
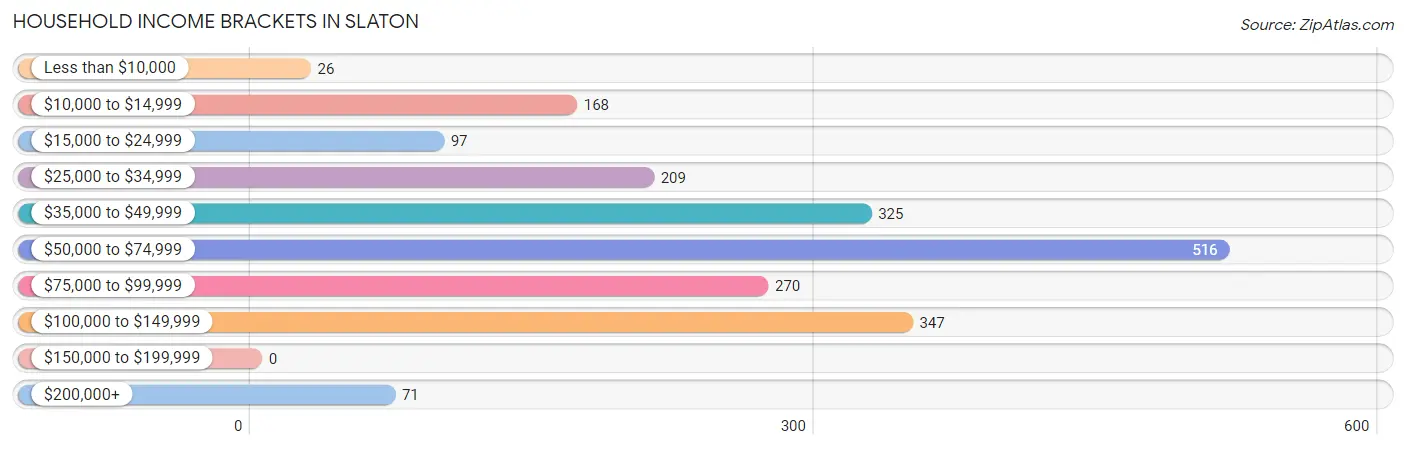
Household Income Brackets in Slaton
With 516 households falling in the category, the $50,000 to $74,999 income range is the most frequent in Slaton, accounting for 25.4% of all households.
| Income Bracket | # Households | % Households |
| Less than $10,000 | 26 | 1.3% |
| $10,000 to $14,999 | 168 | 8.3% |
| $15,000 to $24,999 | 97 | 4.8% |
| $25,000 to $34,999 | 209 | 10.3% |
| $35,000 to $49,999 | 325 | 16.0% |
| $50,000 to $74,999 | 516 | 25.4% |
| $75,000 to $99,999 | 270 | 13.3% |
| $100,000 to $149,999 | 347 | 17.1% |
| $150,000 to $199,999 | 0 | 0.0% |
| $200,000+ | 71 | 3.5% |
Household Income by Householder Age in Slaton
The median household income in Slaton is $54,278, with the highest median household income of $60,227 found in the 25 to 44 years age bracket for the primary householder. A total of 698 households (34.4%) fall into this category. Meanwhile, the 15 to 24 years age bracket for the primary householder has the lowest median household income of $0, with 133 households (6.6%) in this group.
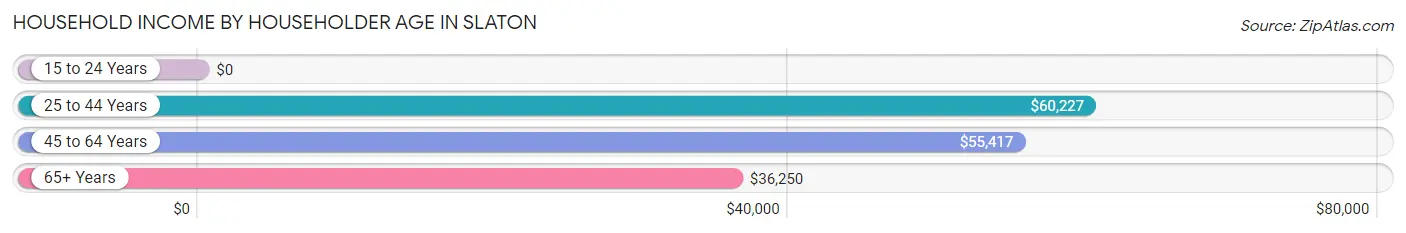
| Income Bracket | # Households | Median Income |
| 15 to 24 Years | 133 (6.6%) | $0 |
| 25 to 44 Years | 698 (34.4%) | $60,227 |
| 45 to 64 Years | 741 (36.5%) | $55,417 |
| 65+ Years | 458 (22.6%) | $36,250 |
| Total | 2,030 (100.0%) | $54,278 |
Poverty in Slaton
Income Below Poverty by Sex and Age in Slaton
With 13.6% poverty level for males and 9.4% for females among the residents of Slaton, 16 and 17 year old males and 16 and 17 year old females are the most vulnerable to poverty, with 69 males (51.1%) and 16 females (27.1%) in their respective age groups living below the poverty level.
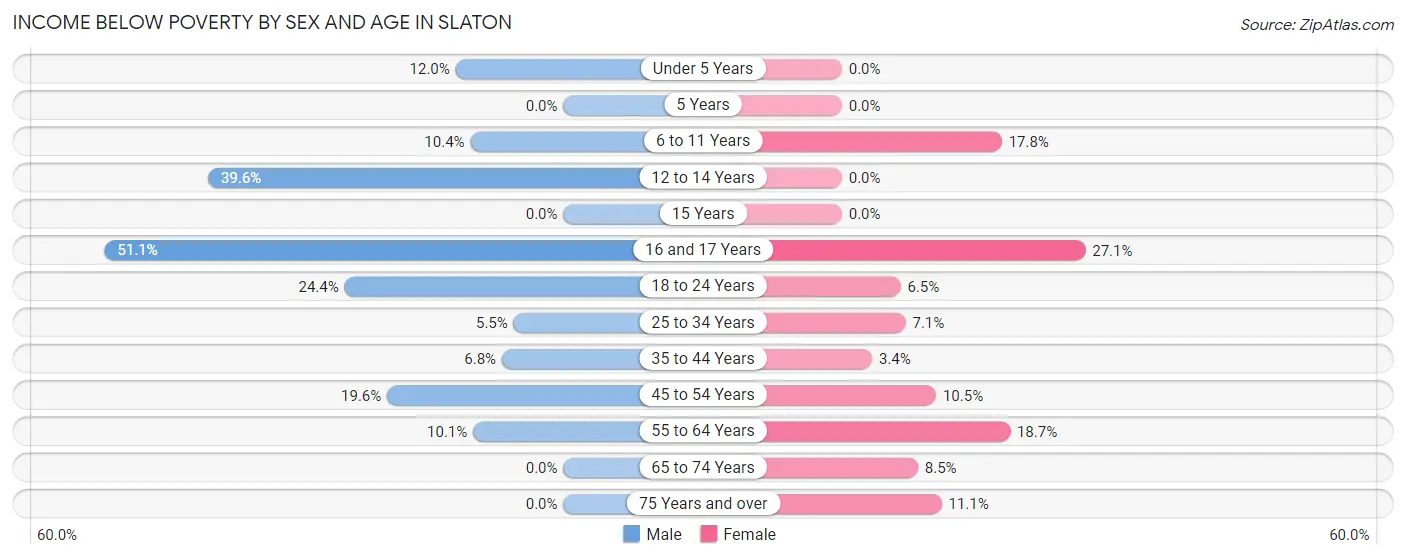
| Age Bracket | Male | Female |
| Under 5 Years | 21 (12.0%) | 0 (0.0%) |
| 5 Years | 0 (0.0%) | 0 (0.0%) |
| 6 to 11 Years | 44 (10.3%) | 44 (17.8%) |
| 12 to 14 Years | 38 (39.6%) | 0 (0.0%) |
| 15 Years | 0 (0.0%) | 0 (0.0%) |
| 16 and 17 Years | 69 (51.1%) | 16 (27.1%) |
| 18 to 24 Years | 77 (24.4%) | 21 (6.5%) |
| 25 to 34 Years | 18 (5.5%) | 22 (7.1%) |
| 35 to 44 Years | 31 (6.8%) | 14 (3.4%) |
| 45 to 54 Years | 32 (19.6%) | 30 (10.5%) |
| 55 to 64 Years | 38 (10.1%) | 97 (18.7%) |
| 65 to 74 Years | 0 (0.0%) | 16 (8.5%) |
| 75 Years and over | 0 (0.0%) | 29 (11.1%) |
| Total | 368 (13.6%) | 289 (9.4%) |
Income Above Poverty by Sex and Age in Slaton
According to the poverty statistics in Slaton, males aged 5 years and females aged under 5 years are the age groups that are most secure financially, with 100.0% of males and 100.0% of females in these age groups living above the poverty line.
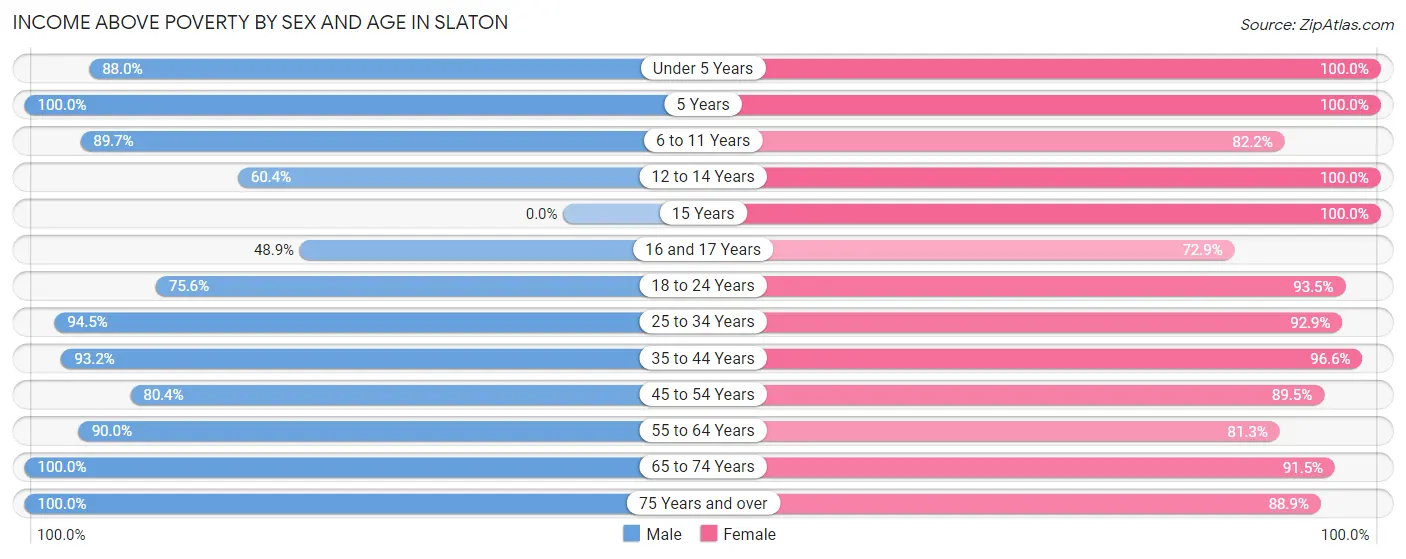
| Age Bracket | Male | Female |
| Under 5 Years | 154 (88.0%) | 241 (100.0%) |
| 5 Years | 20 (100.0%) | 41 (100.0%) |
| 6 to 11 Years | 381 (89.6%) | 203 (82.2%) |
| 12 to 14 Years | 58 (60.4%) | 149 (100.0%) |
| 15 Years | 0 (0.0%) | 39 (100.0%) |
| 16 and 17 Years | 66 (48.9%) | 43 (72.9%) |
| 18 to 24 Years | 239 (75.6%) | 300 (93.5%) |
| 25 to 34 Years | 307 (94.5%) | 288 (92.9%) |
| 35 to 44 Years | 422 (93.2%) | 402 (96.6%) |
| 45 to 54 Years | 131 (80.4%) | 256 (89.5%) |
| 55 to 64 Years | 340 (89.9%) | 421 (81.3%) |
| 65 to 74 Years | 150 (100.0%) | 173 (91.5%) |
| 75 Years and over | 70 (100.0%) | 232 (88.9%) |
| Total | 2,338 (86.4%) | 2,788 (90.6%) |
Income Below Poverty Among Married-Couple Families in Slaton
The poverty statistics for married-couple families in Slaton show that 7.8% or 69 of the total 880 families live below the poverty line. Families with 5 or more children have the highest poverty rate of 100.0%, comprising of 12 families. On the other hand, families with no children have the lowest poverty rate of 0.0%, which includes 0 families.
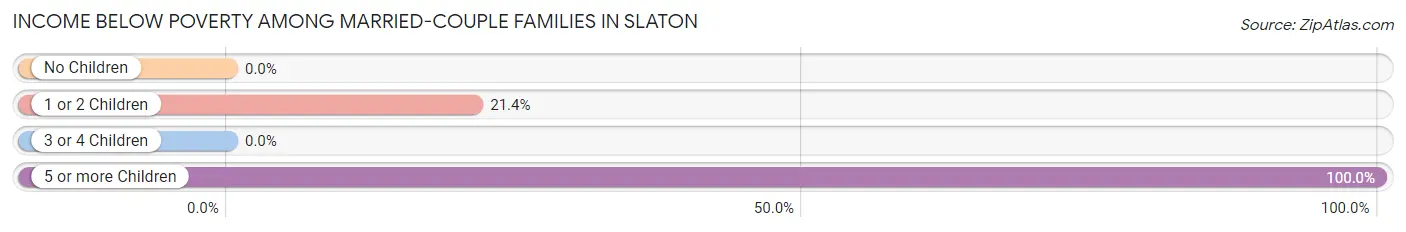
| Children | Above Poverty | Below Poverty |
| No Children | 473 (100.0%) | 0 (0.0%) |
| 1 or 2 Children | 210 (78.6%) | 57 (21.3%) |
| 3 or 4 Children | 128 (100.0%) | 0 (0.0%) |
| 5 or more Children | 0 (0.0%) | 12 (100.0%) |
| Total | 811 (92.2%) | 69 (7.8%) |
Income Below Poverty Among Single-Parent Households in Slaton
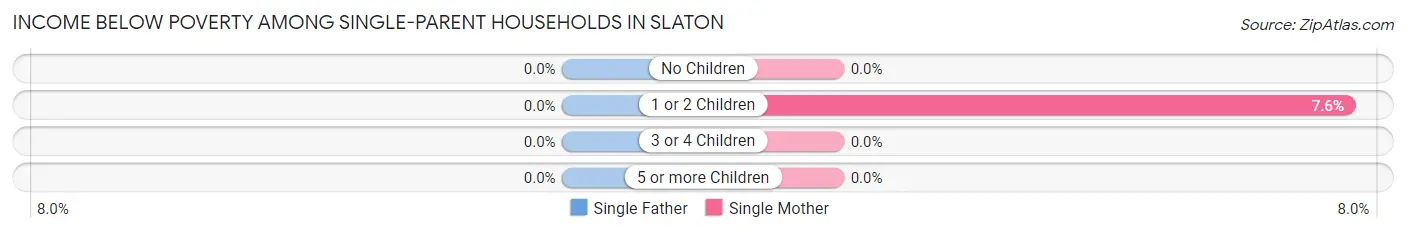
| Children | Single Father | Single Mother |
| No Children | 0 (0.0%) | 0 (0.0%) |
| 1 or 2 Children | 0 (0.0%) | 9 (7.6%) |
| 3 or 4 Children | 0 (0.0%) | 0 (0.0%) |
| 5 or more Children | 0 (0.0%) | 0 (0.0%) |
| Total | 0 (0.0%) | 9 (2.6%) |
Income Below Poverty Among Married-Couple vs Single-Parent Households in Slaton
The poverty data for Slaton shows that 69 of the married-couple family households (7.8%) and 9 of the single-parent households (1.6%) are living below the poverty level. Within the married-couple family households, those with 5 or more children have the highest poverty rate, with 12 households (100.0%) falling below the poverty line. Among the single-parent households, those with 1 or 2 children have the highest poverty rate, with 9 household (3.9%) living below poverty.
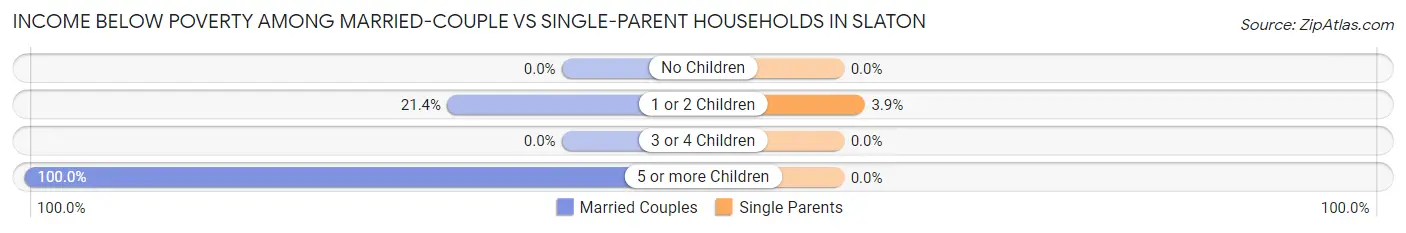
| Children | Married-Couple Families | Single-Parent Households |
| No Children | 0 (0.0%) | 0 (0.0%) |
| 1 or 2 Children | 57 (21.3%) | 9 (3.9%) |
| 3 or 4 Children | 0 (0.0%) | 0 (0.0%) |
| 5 or more Children | 12 (100.0%) | 0 (0.0%) |
| Total | 69 (7.8%) | 9 (1.6%) |
Race in Slaton
The most populous races in Slaton are White / Caucasian (3,924 | 67.0%), Hispanic or Latino (2,851 | 48.7%), and Some other Race (1,224 | 20.9%).
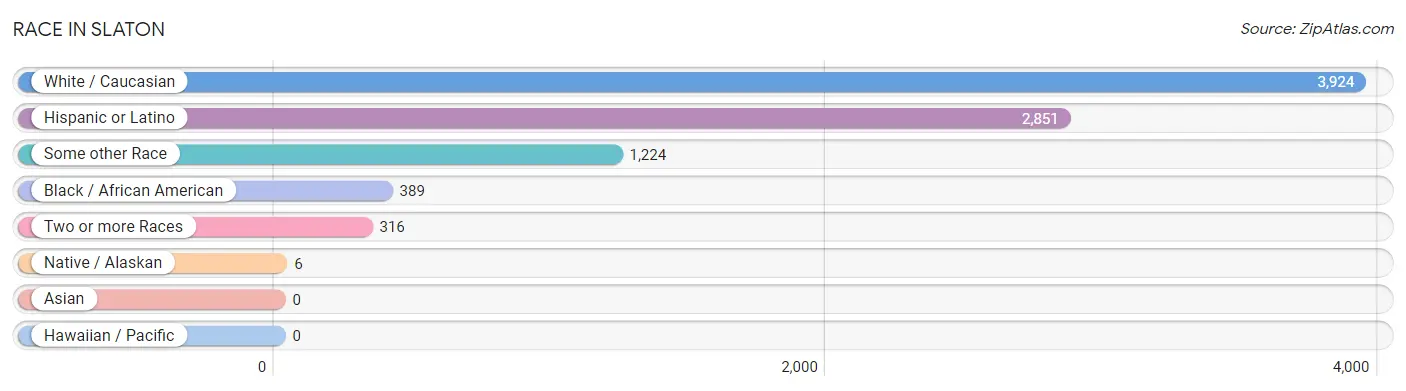
| Race | # Population | % Population |
| Asian | 0 | 0.0% |
| Black / African American | 389 | 6.6% |
| Hawaiian / Pacific | 0 | 0.0% |
| Hispanic or Latino | 2,851 | 48.7% |
| Native / Alaskan | 6 | 0.1% |
| White / Caucasian | 3,924 | 67.0% |
| Two or more Races | 316 | 5.4% |
| Some other Race | 1,224 | 20.9% |
| Total | 5,859 | 100.0% |
Ancestry in Slaton
The most populous ancestries reported in Slaton are Mexican (2,229 | 38.0%), German (444 | 7.6%), English (436 | 7.4%), American (405 | 6.9%), and Irish (295 | 5.0%), together accounting for 65.0% of all Slaton residents.
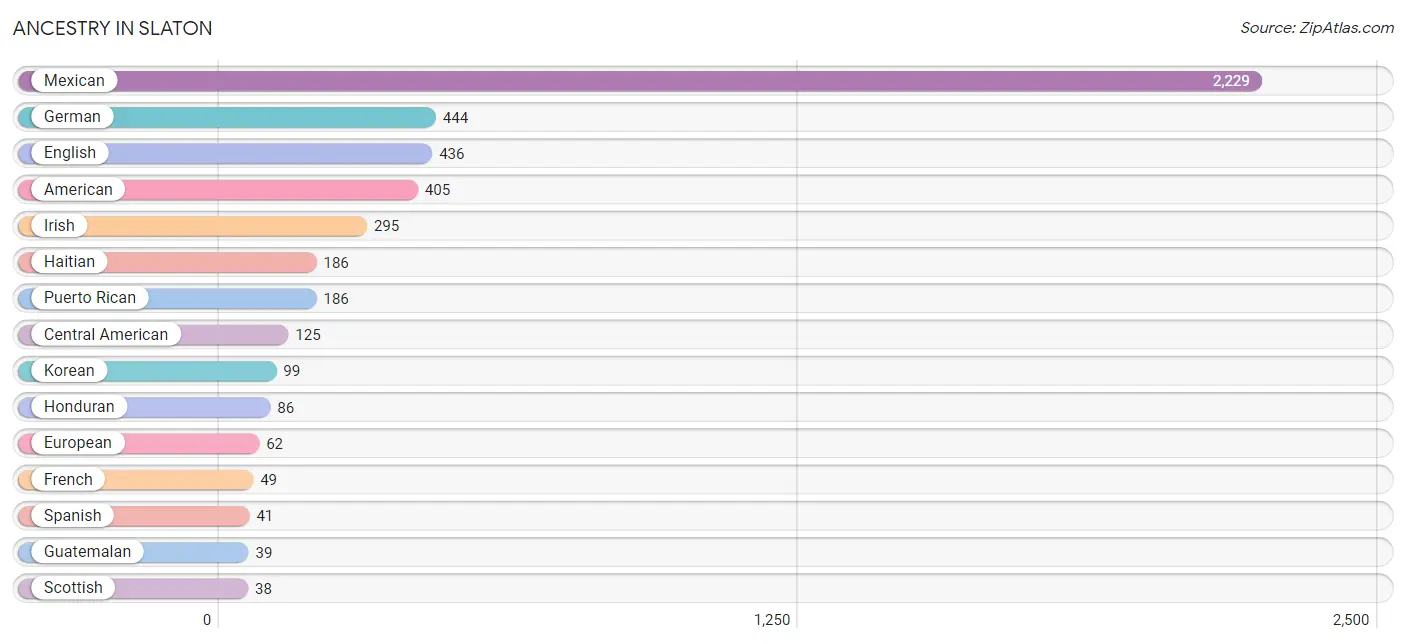
| Ancestry | # Population | % Population |
| American | 405 | 6.9% |
| Central American | 125 | 2.1% |
| Cherokee | 14 | 0.2% |
| Dutch | 24 | 0.4% |
| English | 436 | 7.4% |
| European | 62 | 1.1% |
| French | 49 | 0.8% |
| German | 444 | 7.6% |
| Guatemalan | 39 | 0.7% |
| Haitian | 186 | 3.2% |
| Honduran | 86 | 1.5% |
| Irish | 295 | 5.0% |
| Italian | 4 | 0.1% |
| Korean | 99 | 1.7% |
| Mexican | 2,229 | 38.0% |
| Portuguese | 16 | 0.3% |
| Puerto Rican | 186 | 3.2% |
| Scandinavian | 8 | 0.1% |
| Scotch-Irish | 30 | 0.5% |
| Scottish | 38 | 0.6% |
| Spanish | 41 | 0.7% |
| Swiss | 17 | 0.3% |
| Welsh | 36 | 0.6% | View All 23 Rows |
Immigrants in Slaton
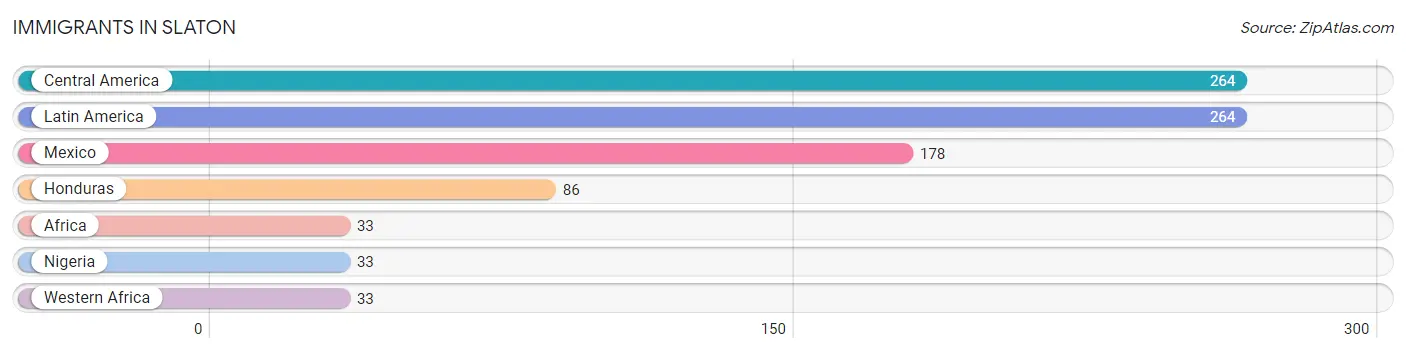
The most numerous immigrant groups reported in Slaton came from Central America (264 | 4.5%), Latin America (264 | 4.5%), Mexico (178 | 3.0%), Honduras (86 | 1.5%), and Africa (33 | 0.6%), together accounting for 14.1% of all Slaton residents.
| Immigration Origin | # Population | % Population |
| Africa | 33 | 0.6% |
| Central America | 264 | 4.5% |
| Honduras | 86 | 1.5% |
| Latin America | 264 | 4.5% |
| Mexico | 178 | 3.0% |
| Nigeria | 33 | 0.6% |
| Western Africa | 33 | 0.6% | View All 7 Rows |
Sex and Age in Slaton
Sex and Age in Slaton
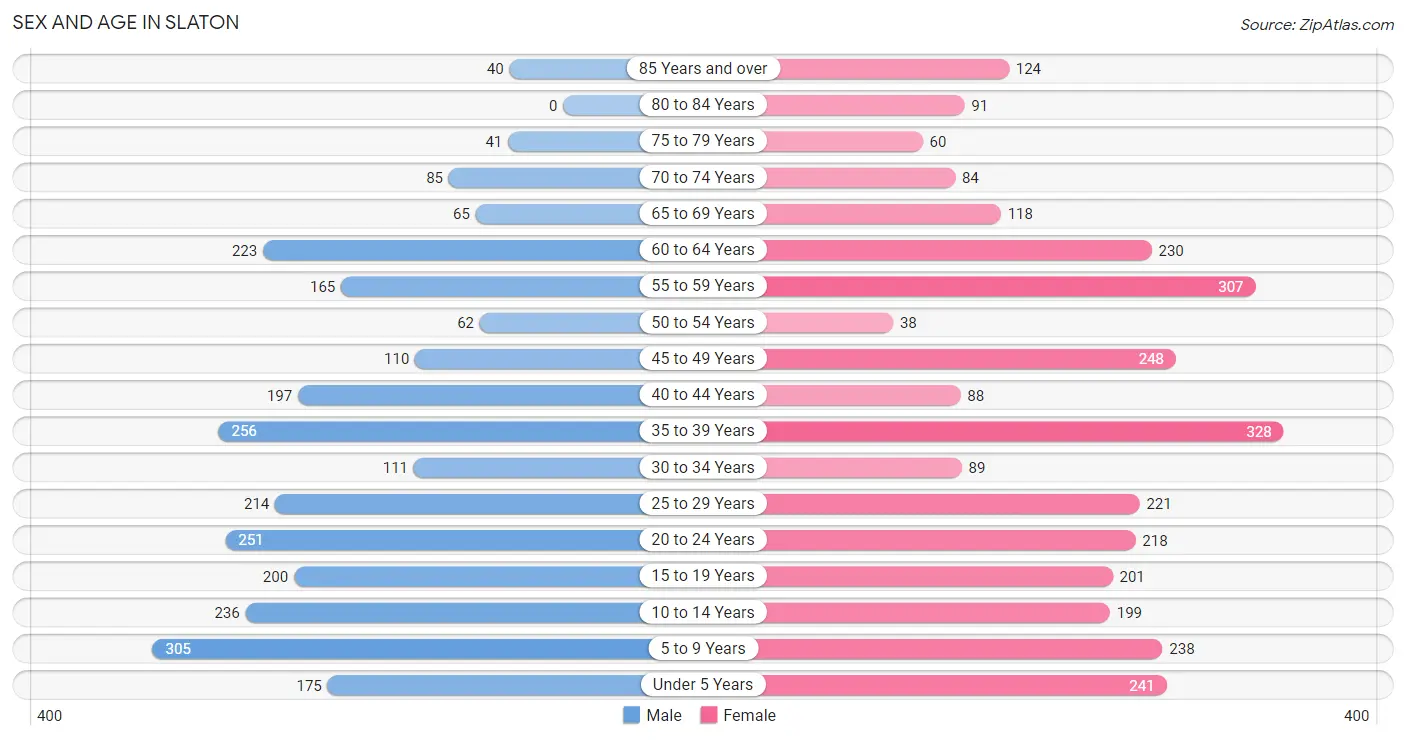
The most populous age groups in Slaton are 5 to 9 Years (305 | 11.2%) for men and 35 to 39 Years (328 | 10.5%) for women.
| Age Bracket | Male | Female |
| Under 5 Years | 175 (6.4%) | 241 (7.7%) |
| 5 to 9 Years | 305 (11.2%) | 238 (7.6%) |
| 10 to 14 Years | 236 (8.6%) | 199 (6.4%) |
| 15 to 19 Years | 200 (7.3%) | 201 (6.4%) |
| 20 to 24 Years | 251 (9.2%) | 218 (7.0%) |
| 25 to 29 Years | 214 (7.8%) | 221 (7.1%) |
| 30 to 34 Years | 111 (4.1%) | 89 (2.9%) |
| 35 to 39 Years | 256 (9.4%) | 328 (10.5%) |
| 40 to 44 Years | 197 (7.2%) | 88 (2.8%) |
| 45 to 49 Years | 110 (4.0%) | 248 (7.9%) |
| 50 to 54 Years | 62 (2.3%) | 38 (1.2%) |
| 55 to 59 Years | 165 (6.0%) | 307 (9.8%) |
| 60 to 64 Years | 223 (8.2%) | 230 (7.4%) |
| 65 to 69 Years | 65 (2.4%) | 118 (3.8%) |
| 70 to 74 Years | 85 (3.1%) | 84 (2.7%) |
| 75 to 79 Years | 41 (1.5%) | 60 (1.9%) |
| 80 to 84 Years | 0 (0.0%) | 91 (2.9%) |
| 85 Years and over | 40 (1.5%) | 124 (4.0%) |
| Total | 2,736 (100.0%) | 3,123 (100.0%) |
Families and Households in Slaton
Median Family Size in Slaton
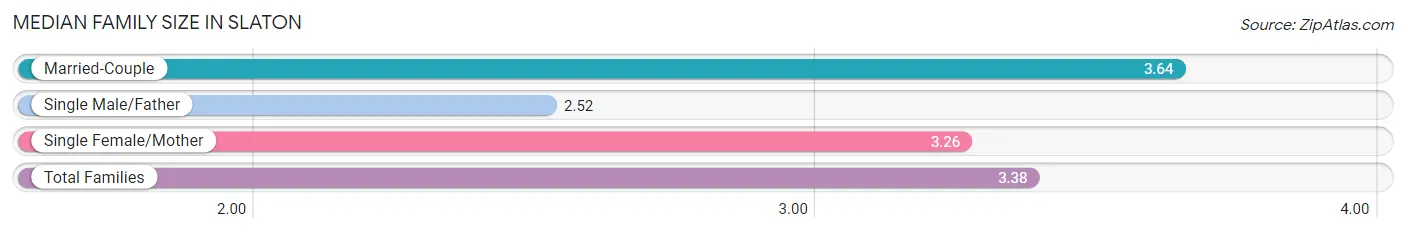
The median family size in Slaton is 3.38 persons per family, with married-couple families (880 | 61.6%) accounting for the largest median family size of 3.64 persons per family. On the other hand, single male/father families (210 | 14.7%) represent the smallest median family size with 2.52 persons per family.
| Family Type | # Families | Family Size |
| Married-Couple | 880 (61.6%) | 3.64 |
| Single Male/Father | 210 (14.7%) | 2.52 |
| Single Female/Mother | 339 (23.7%) | 3.26 |
| Total Families | 1,429 (100.0%) | 3.38 |
Median Household Size in Slaton
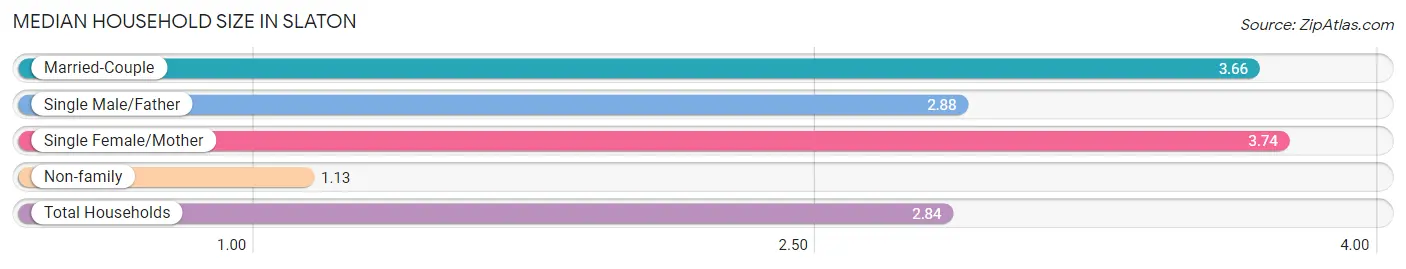
The median household size in Slaton is 2.84 persons per household, with single female/mother households (339 | 16.7%) accounting for the largest median household size of 3.74 persons per household. non-family households (601 | 29.6%) represent the smallest median household size with 1.13 persons per household.
| Household Type | # Households | Household Size |
| Married-Couple | 880 (43.3%) | 3.66 |
| Single Male/Father | 210 (10.3%) | 2.88 |
| Single Female/Mother | 339 (16.7%) | 3.74 |
| Non-family | 601 (29.6%) | 1.13 |
| Total Households | 2,030 (100.0%) | 2.84 |
Household Size by Marriage Status in Slaton
Out of a total of 2,030 households in Slaton, 1,429 (70.4%) are family households, while 601 (29.6%) are nonfamily households. The most numerous type of family households are 2-person households, comprising 570, and the most common type of nonfamily households are 1-person households, comprising 497.
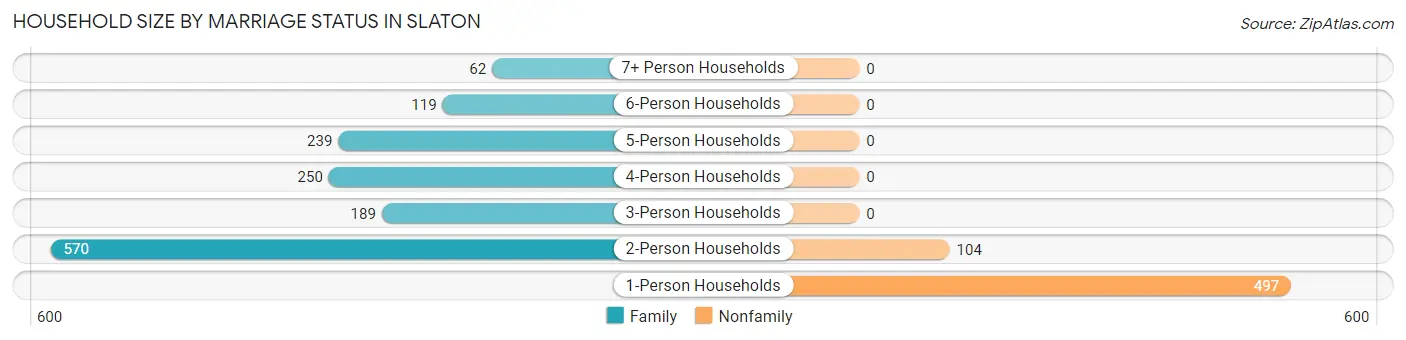
| Household Size | Family Households | Nonfamily Households |
| 1-Person Households | - | 497 (24.5%) |
| 2-Person Households | 570 (28.1%) | 104 (5.1%) |
| 3-Person Households | 189 (9.3%) | 0 (0.0%) |
| 4-Person Households | 250 (12.3%) | 0 (0.0%) |
| 5-Person Households | 239 (11.8%) | 0 (0.0%) |
| 6-Person Households | 119 (5.9%) | 0 (0.0%) |
| 7+ Person Households | 62 (3.0%) | 0 (0.0%) |
| Total | 1,429 (70.4%) | 601 (29.6%) |
Female Fertility in Slaton
Fertility by Age in Slaton
Average fertility rate in Slaton is 16.0 births per 1,000 women. Women in the age bracket of 20 to 34 years have the highest fertility rate with 44.0 births per 1,000 women. Women in the age bracket of 20 to 34 years acount for 100.0% of all women with births.
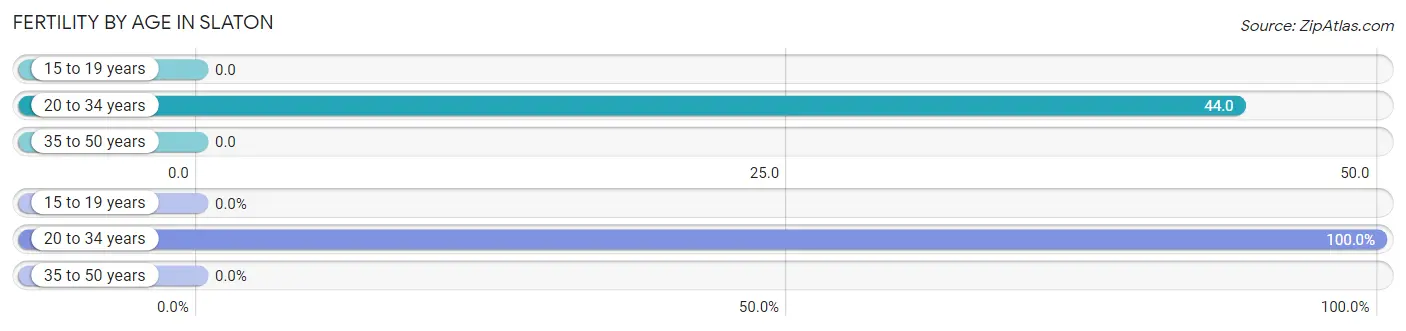
| Age Bracket | Women with Births | Births / 1,000 Women |
| 15 to 19 years | 0 (0.0%) | 0.0 |
| 20 to 34 years | 23 (100.0%) | 44.0 |
| 35 to 50 years | 0 (0.0%) | 0.0 |
| Total | 23 (100.0%) | 16.0 |
Fertility by Age by Marriage Status in Slaton
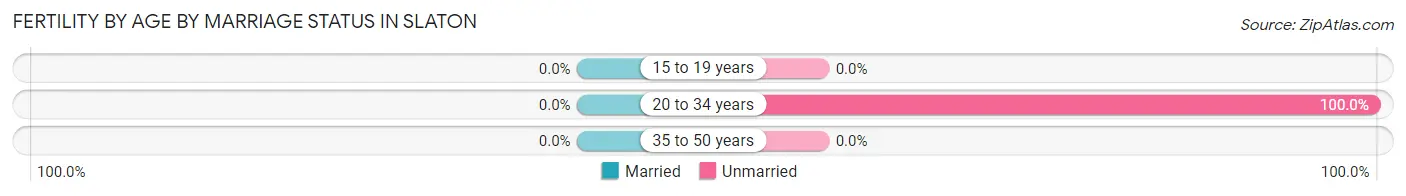
| Age Bracket | Married | Unmarried |
| 15 to 19 years | 0 (0.0%) | 0 (0.0%) |
| 20 to 34 years | 0 (0.0%) | 23 (100.0%) |
| 35 to 50 years | 0 (0.0%) | 0 (0.0%) |
| Total | 0 (0.0%) | 23 (100.0%) |
Fertility by Education in Slaton
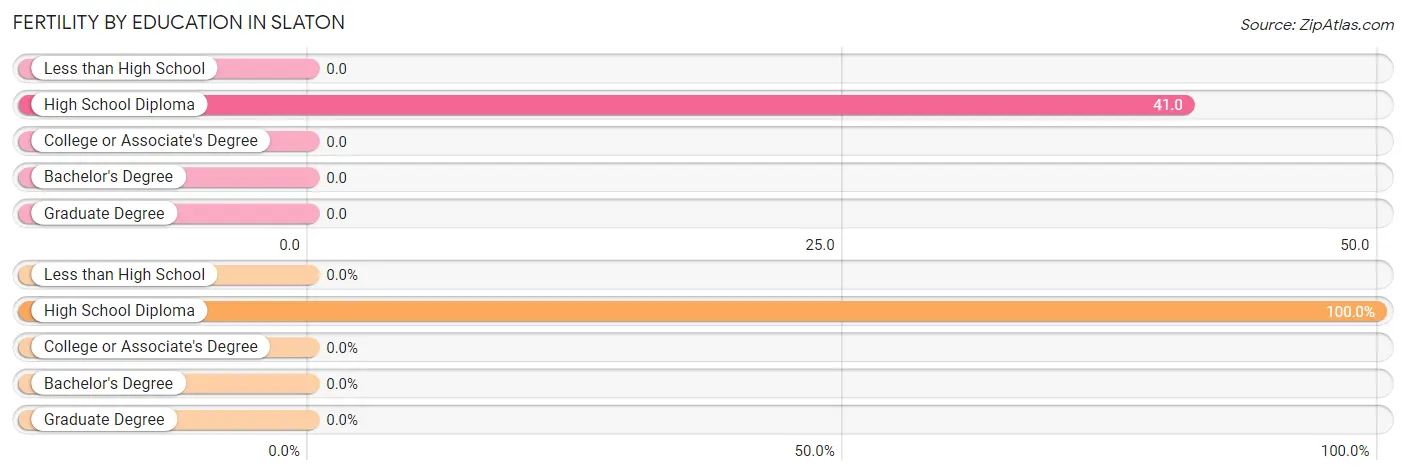
| Educational Attainment | Women with Births | Births / 1,000 Women |
| Less than High School | 0 (0.0%) | 0.0 |
| High School Diploma | 23 (100.0%) | 41.0 |
| College or Associate's Degree | 0 (0.0%) | 0.0 |
| Bachelor's Degree | 0 (0.0%) | 0.0 |
| Graduate Degree | 0 (0.0%) | 0.0 |
| Total | 23 (100.0%) | 16.0 |
Fertility by Education by Marriage Status in Slaton
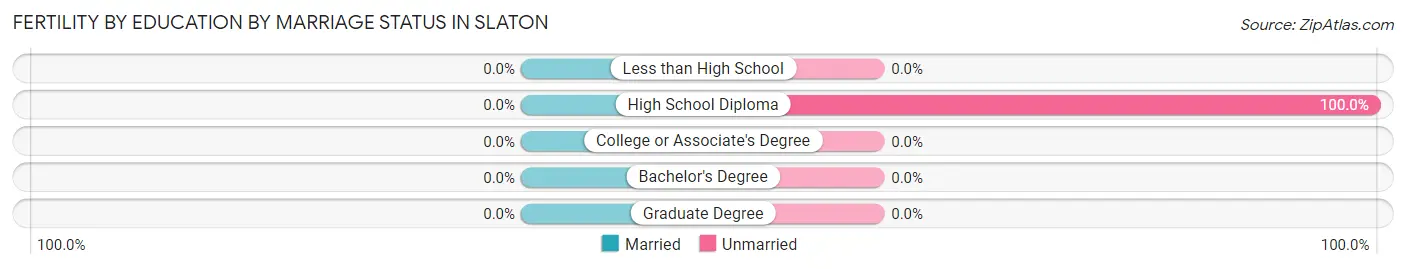
| Educational Attainment | Married | Unmarried |
| Less than High School | 0 (0.0%) | 0 (0.0%) |
| High School Diploma | 0 (0.0%) | 23 (100.0%) |
| College or Associate's Degree | 0 (0.0%) | 0 (0.0%) |
| Bachelor's Degree | 0 (0.0%) | 0 (0.0%) |
| Graduate Degree | 0 (0.0%) | 0 (0.0%) |
| Total | 0 (0.0%) | 23 (100.0%) |
Employment Characteristics in Slaton
Employment by Class of Employer in Slaton
Among the 2,416 employed individuals in Slaton, private company employees (1,398 | 57.9%), local government employees (420 | 17.4%), and self-employed (not incorporated) (177 | 7.3%) make up the most common classes of employment.
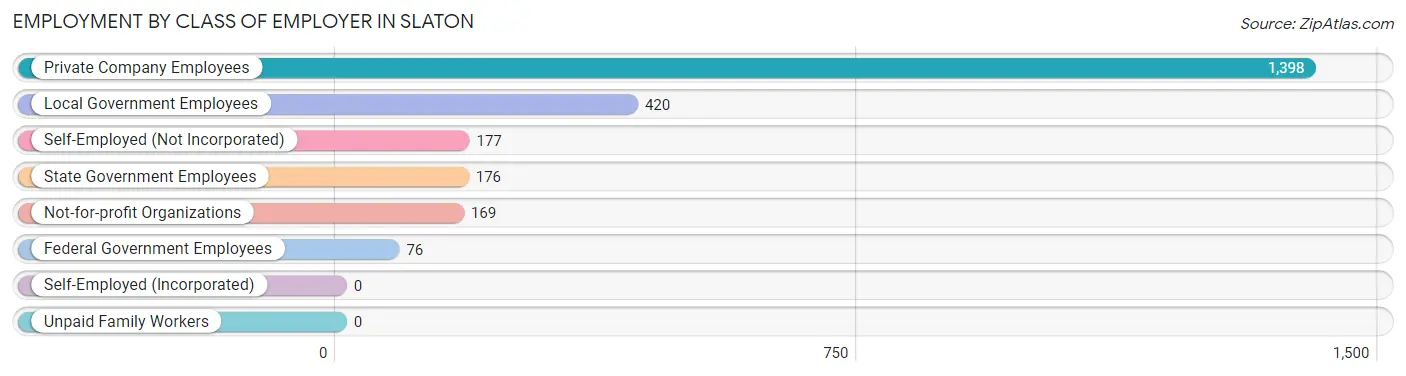
| Employer Class | # Employees | % Employees |
| Private Company Employees | 1,398 | 57.9% |
| Self-Employed (Incorporated) | 0 | 0.0% |
| Self-Employed (Not Incorporated) | 177 | 7.3% |
| Not-for-profit Organizations | 169 | 7.0% |
| Local Government Employees | 420 | 17.4% |
| State Government Employees | 176 | 7.3% |
| Federal Government Employees | 76 | 3.2% |
| Unpaid Family Workers | 0 | 0.0% |
| Total | 2,416 | 100.0% |
Employment Status by Age in Slaton
According to the labor force statistics for Slaton, out of the total population over 16 years of age (4,426), 61.2% or 2,709 individuals are in the labor force, with 7.7% or 209 of them unemployed. The age group with the highest labor force participation rate is 30 to 34 years, with 98.0% or 196 individuals in the labor force. Within the labor force, the 16 to 19 years age range has the highest percentage of unemployed individuals, with 24.6% or 49 of them being unemployed.
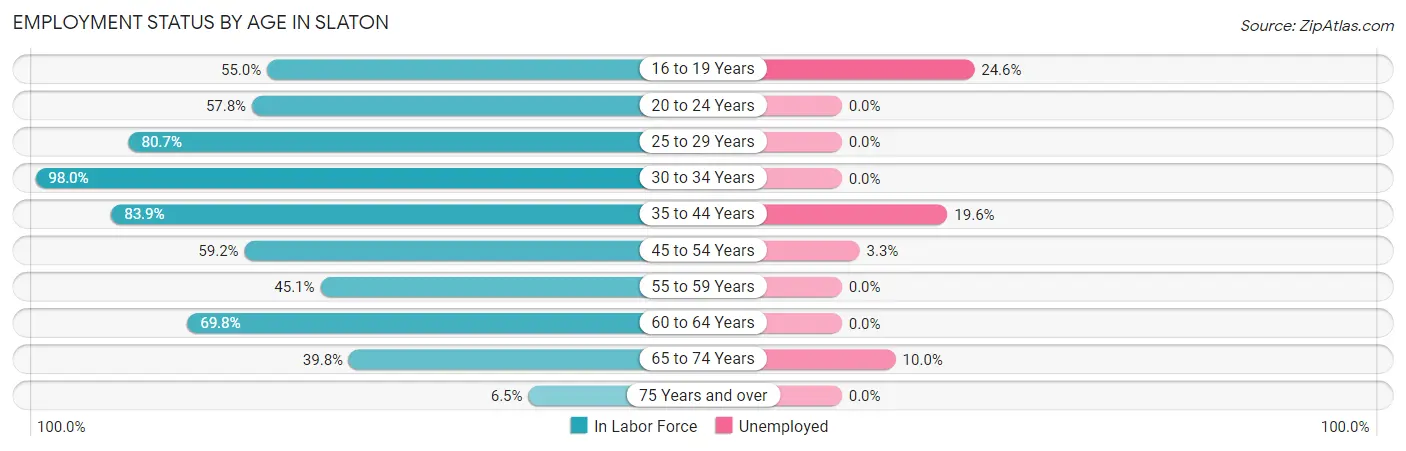
| Age Bracket | In Labor Force | Unemployed |
| 16 to 19 Years | 199 (55.0%) | 49 (24.6%) |
| 20 to 24 Years | 271 (57.8%) | 0 (0.0%) |
| 25 to 29 Years | 351 (80.7%) | 0 (0.0%) |
| 30 to 34 Years | 196 (98.0%) | 0 (0.0%) |
| 35 to 44 Years | 729 (83.9%) | 143 (19.6%) |
| 45 to 54 Years | 271 (59.2%) | 9 (3.3%) |
| 55 to 59 Years | 213 (45.1%) | 0 (0.0%) |
| 60 to 64 Years | 316 (69.8%) | 0 (0.0%) |
| 65 to 74 Years | 140 (39.8%) | 14 (10.0%) |
| 75 Years and over | 23 (6.5%) | 0 (0.0%) |
| Total | 2,709 (61.2%) | 209 (7.7%) |
Employment Status by Educational Attainment in Slaton
According to labor force statistics for Slaton, 71.9% of individuals (2,076) out of the total population between 25 and 64 years of age (2,887) are in the labor force, with 7.0% or 145 of them being unemployed. The group with the highest labor force participation rate are those with the educational attainment of bachelor's degree or higher, with 94.1% or 401 individuals in the labor force. Within the labor force, individuals with high school diploma education have the highest percentage of unemployment, with 14.6% or 96 of them being unemployed.
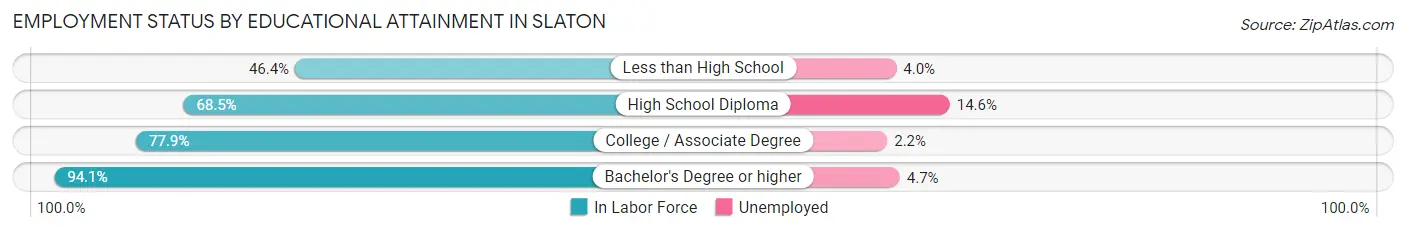
| Educational Attainment | In Labor Force | Unemployed |
| Less than High School | 224 (46.4%) | 19 (4.0%) |
| High School Diploma | 658 (68.5%) | 140 (14.6%) |
| College / Associate Degree | 793 (77.9%) | 22 (2.2%) |
| Bachelor's Degree or higher | 401 (94.1%) | 20 (4.7%) |
| Total | 2,076 (71.9%) | 202 (7.0%) |
Employment Occupations by Sex in Slaton
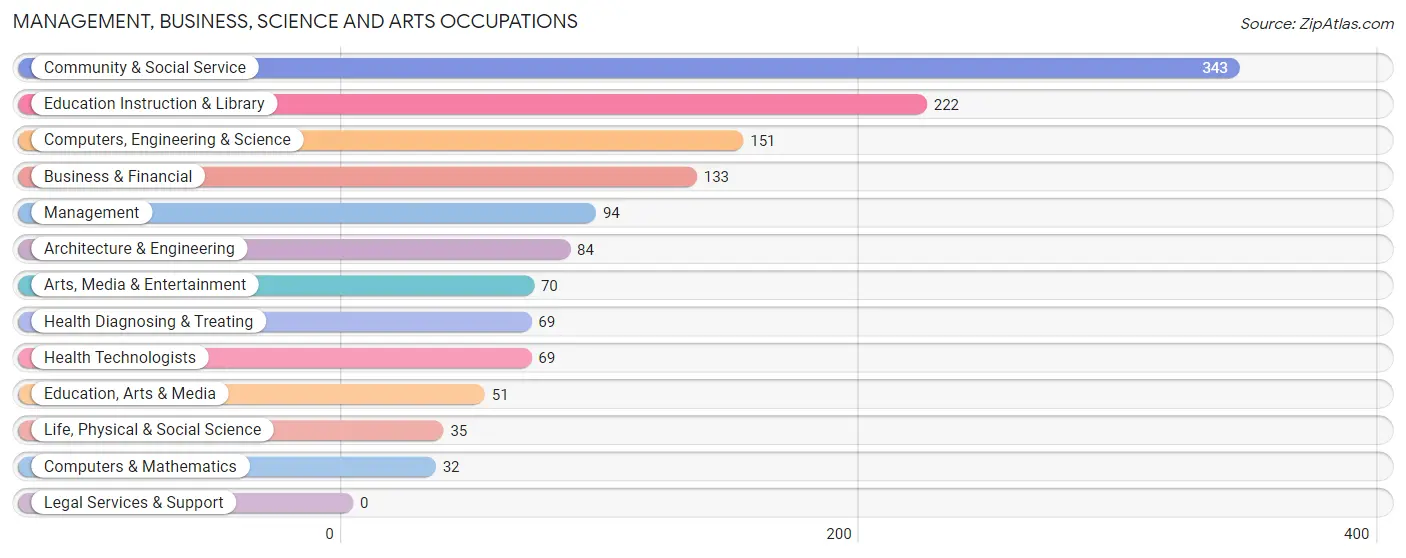
Management, Business, Science and Arts Occupations
The most common Management, Business, Science and Arts occupations in Slaton are Community & Social Service (343 | 14.0%), Education Instruction & Library (222 | 9.1%), Computers, Engineering & Science (151 | 6.2%), Business & Financial (133 | 5.4%), and Management (94 | 3.8%).
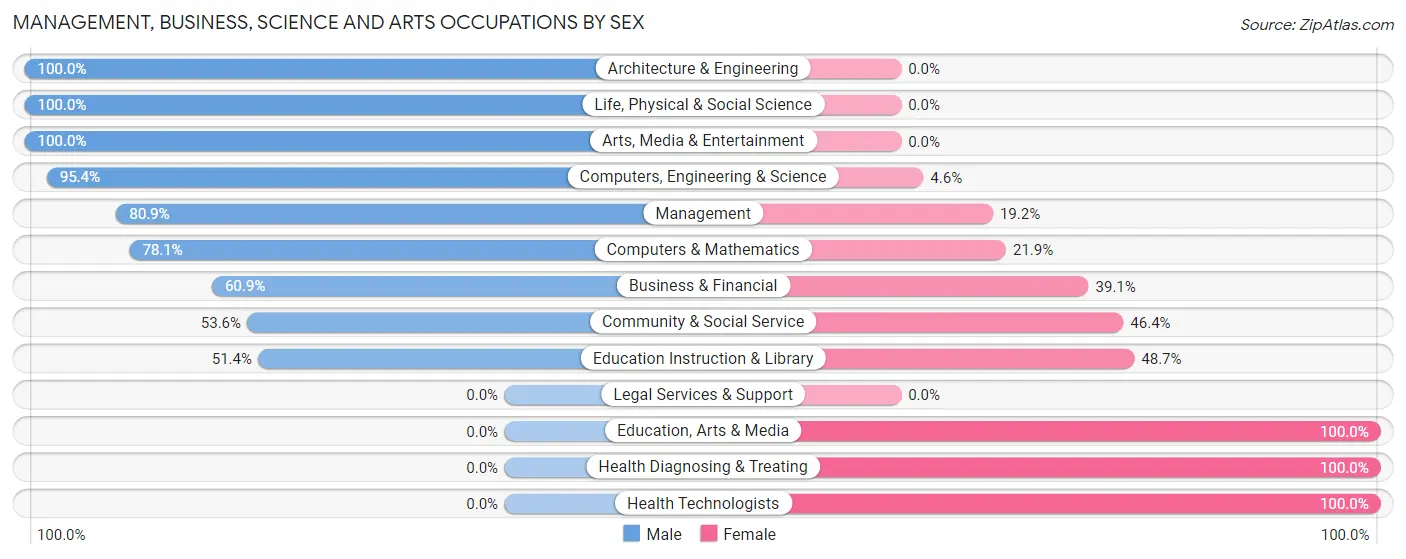
Management, Business, Science and Arts Occupations by Sex
Within the Management, Business, Science and Arts occupations in Slaton, the most male-oriented occupations are Architecture & Engineering (100.0%), Life, Physical & Social Science (100.0%), and Arts, Media & Entertainment (100.0%), while the most female-oriented occupations are Education, Arts & Media (100.0%), Health Diagnosing & Treating (100.0%), and Health Technologists (100.0%).
| Occupation | Male | Female |
| Management | 76 (80.8%) | 18 (19.2%) |
| Business & Financial | 81 (60.9%) | 52 (39.1%) |
| Computers, Engineering & Science | 144 (95.4%) | 7 (4.6%) |
| Computers & Mathematics | 25 (78.1%) | 7 (21.9%) |
| Architecture & Engineering | 84 (100.0%) | 0 (0.0%) |
| Life, Physical & Social Science | 35 (100.0%) | 0 (0.0%) |
| Community & Social Service | 184 (53.6%) | 159 (46.4%) |
| Education, Arts & Media | 0 (0.0%) | 51 (100.0%) |
| Legal Services & Support | 0 (0.0%) | 0 (0.0%) |
| Education Instruction & Library | 114 (51.3%) | 108 (48.6%) |
| Arts, Media & Entertainment | 70 (100.0%) | 0 (0.0%) |
| Health Diagnosing & Treating | 0 (0.0%) | 69 (100.0%) |
| Health Technologists | 0 (0.0%) | 69 (100.0%) |
| Total (Category) | 485 (61.4%) | 305 (38.6%) |
| Total (Overall) | 1,374 (56.2%) | 1,070 (43.8%) |
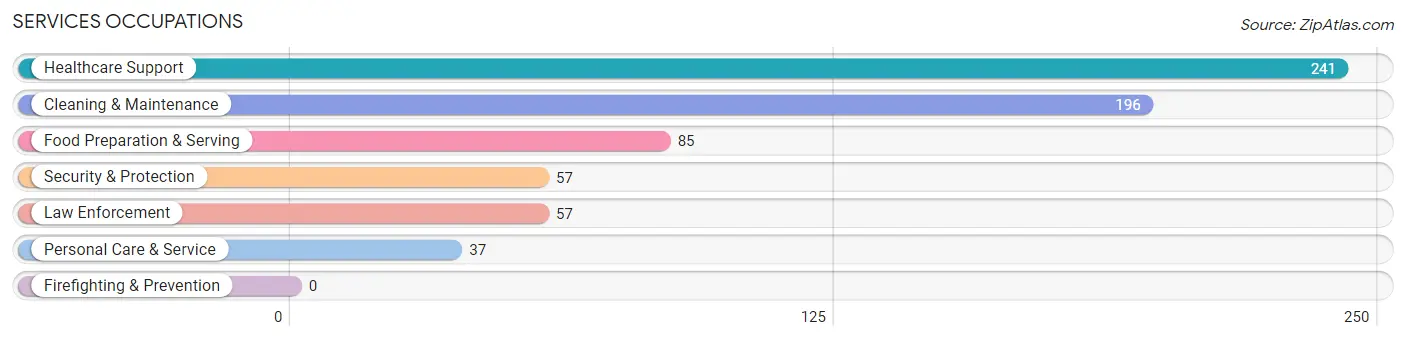
Services Occupations
The most common Services occupations in Slaton are Healthcare Support (241 | 9.9%), Cleaning & Maintenance (196 | 8.0%), Food Preparation & Serving (85 | 3.5%), Security & Protection (57 | 2.3%), and Law Enforcement (57 | 2.3%).
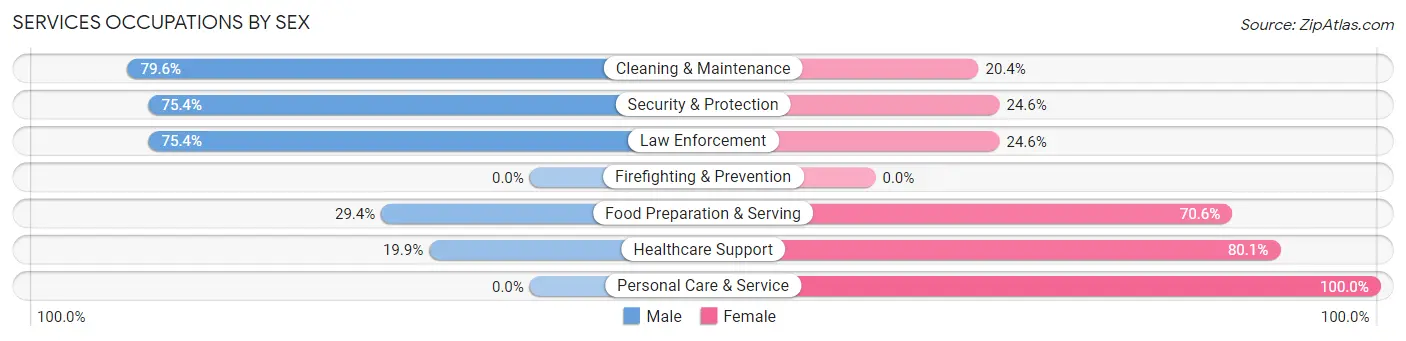
Services Occupations by Sex
Within the Services occupations in Slaton, the most male-oriented occupations are Cleaning & Maintenance (79.6%), Security & Protection (75.4%), and Law Enforcement (75.4%), while the most female-oriented occupations are Personal Care & Service (100.0%), Healthcare Support (80.1%), and Food Preparation & Serving (70.6%).
| Occupation | Male | Female |
| Healthcare Support | 48 (19.9%) | 193 (80.1%) |
| Security & Protection | 43 (75.4%) | 14 (24.6%) |
| Firefighting & Prevention | 0 (0.0%) | 0 (0.0%) |
| Law Enforcement | 43 (75.4%) | 14 (24.6%) |
| Food Preparation & Serving | 25 (29.4%) | 60 (70.6%) |
| Cleaning & Maintenance | 156 (79.6%) | 40 (20.4%) |
| Personal Care & Service | 0 (0.0%) | 37 (100.0%) |
| Total (Category) | 272 (44.2%) | 344 (55.8%) |
| Total (Overall) | 1,374 (56.2%) | 1,070 (43.8%) |
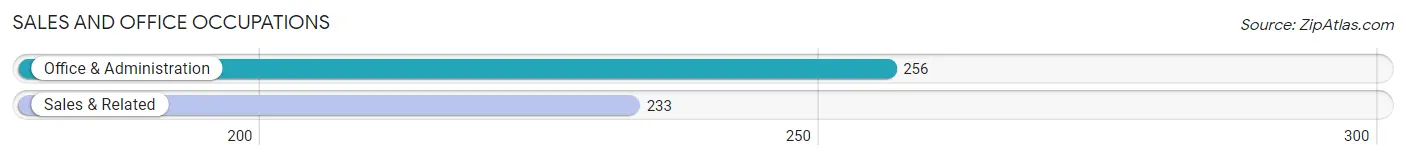
Sales and Office Occupations
The most common Sales and Office occupations in Slaton are Office & Administration (256 | 10.5%), and Sales & Related (233 | 9.5%).
Sales and Office Occupations by Sex
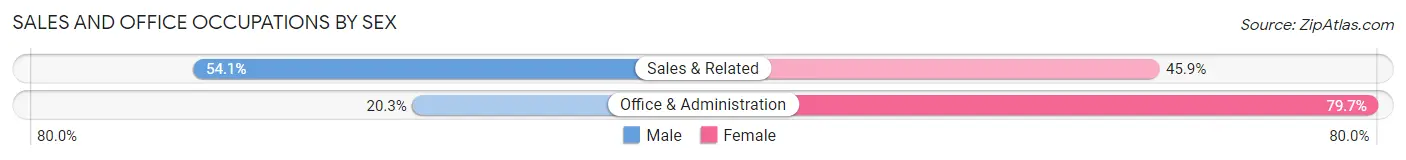
| Occupation | Male | Female |
| Sales & Related | 126 (54.1%) | 107 (45.9%) |
| Office & Administration | 52 (20.3%) | 204 (79.7%) |
| Total (Category) | 178 (36.4%) | 311 (63.6%) |
| Total (Overall) | 1,374 (56.2%) | 1,070 (43.8%) |
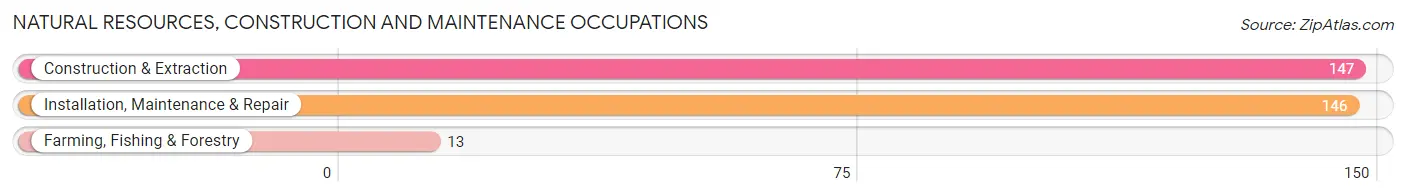
Natural Resources, Construction and Maintenance Occupations
The most common Natural Resources, Construction and Maintenance occupations in Slaton are Construction & Extraction (147 | 6.0%), Installation, Maintenance & Repair (146 | 6.0%), and Farming, Fishing & Forestry (13 | 0.5%).
Natural Resources, Construction and Maintenance Occupations by Sex
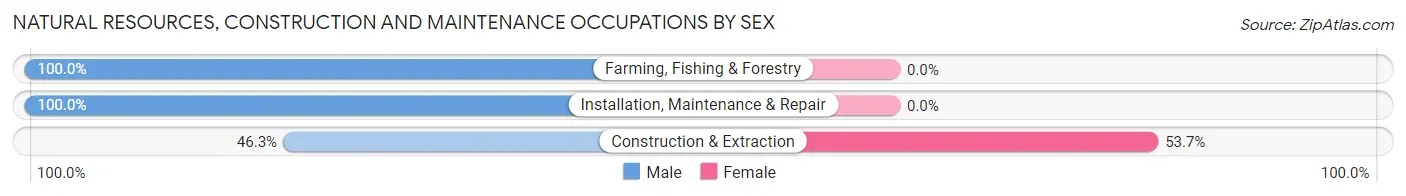
| Occupation | Male | Female |
| Farming, Fishing & Forestry | 13 (100.0%) | 0 (0.0%) |
| Construction & Extraction | 68 (46.3%) | 79 (53.7%) |
| Installation, Maintenance & Repair | 146 (100.0%) | 0 (0.0%) |
| Total (Category) | 227 (74.2%) | 79 (25.8%) |
| Total (Overall) | 1,374 (56.2%) | 1,070 (43.8%) |
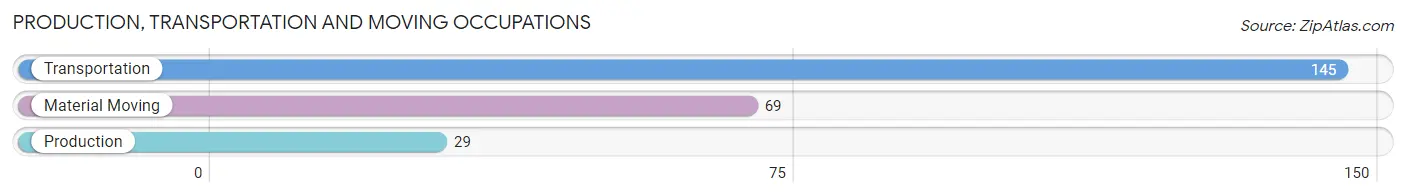
Production, Transportation and Moving Occupations
The most common Production, Transportation and Moving occupations in Slaton are Transportation (145 | 5.9%), Material Moving (69 | 2.8%), and Production (29 | 1.2%).
Production, Transportation and Moving Occupations by Sex
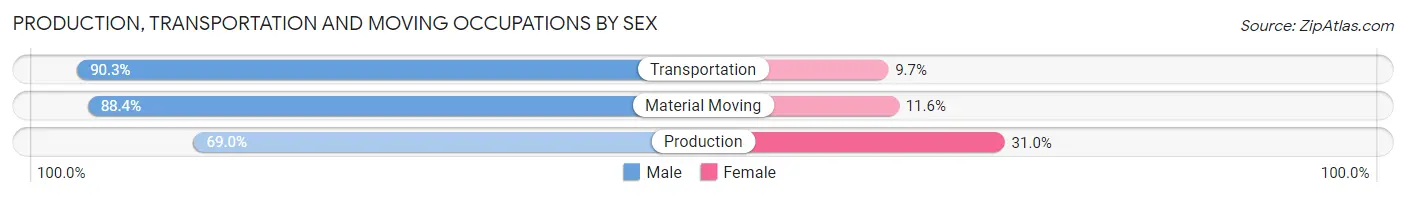
| Occupation | Male | Female |
| Production | 20 (69.0%) | 9 (31.0%) |
| Transportation | 131 (90.3%) | 14 (9.7%) |
| Material Moving | 61 (88.4%) | 8 (11.6%) |
| Total (Category) | 212 (87.2%) | 31 (12.8%) |
| Total (Overall) | 1,374 (56.2%) | 1,070 (43.8%) |
Employment Industries by Sex in Slaton
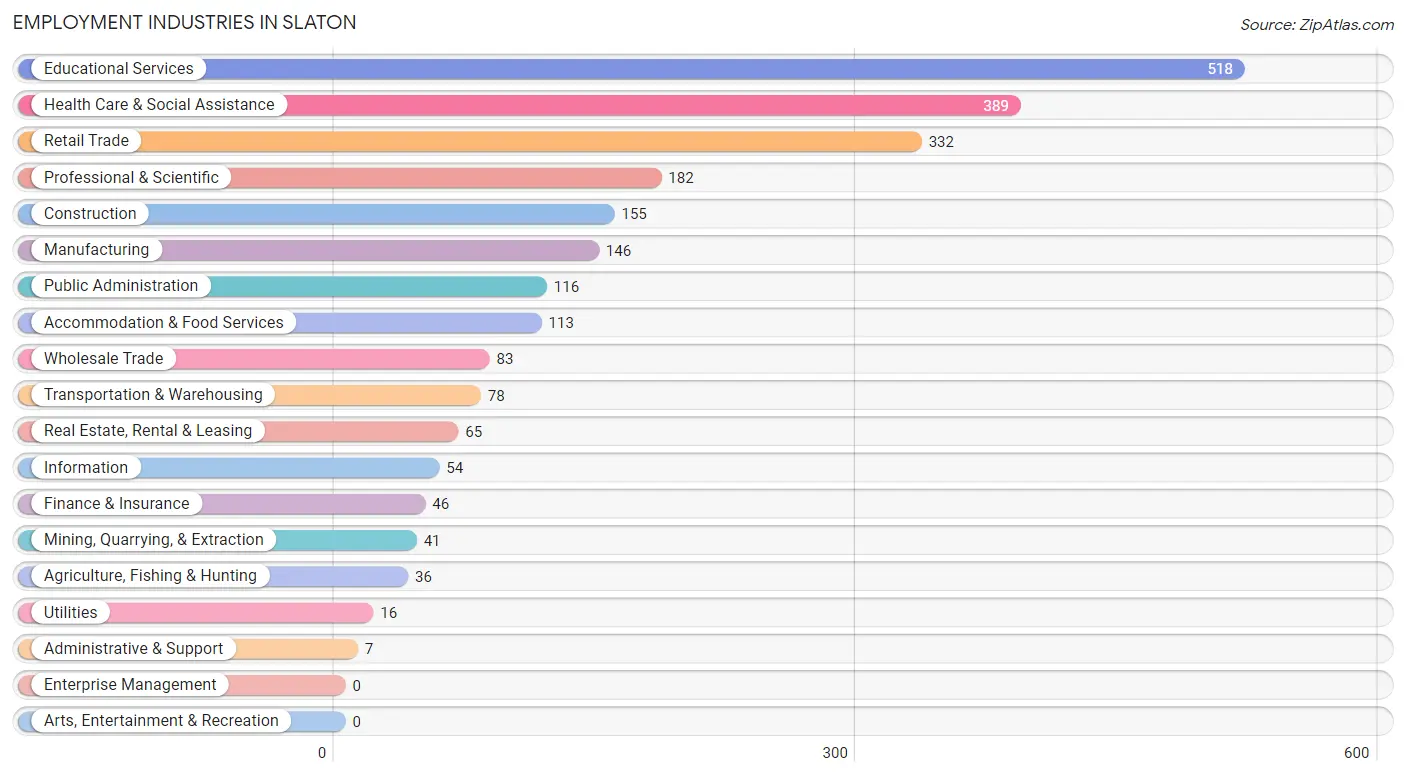
Employment Industries in Slaton
The major employment industries in Slaton include Educational Services (518 | 21.2%), Health Care & Social Assistance (389 | 15.9%), Retail Trade (332 | 13.6%), Professional & Scientific (182 | 7.4%), and Construction (155 | 6.3%).
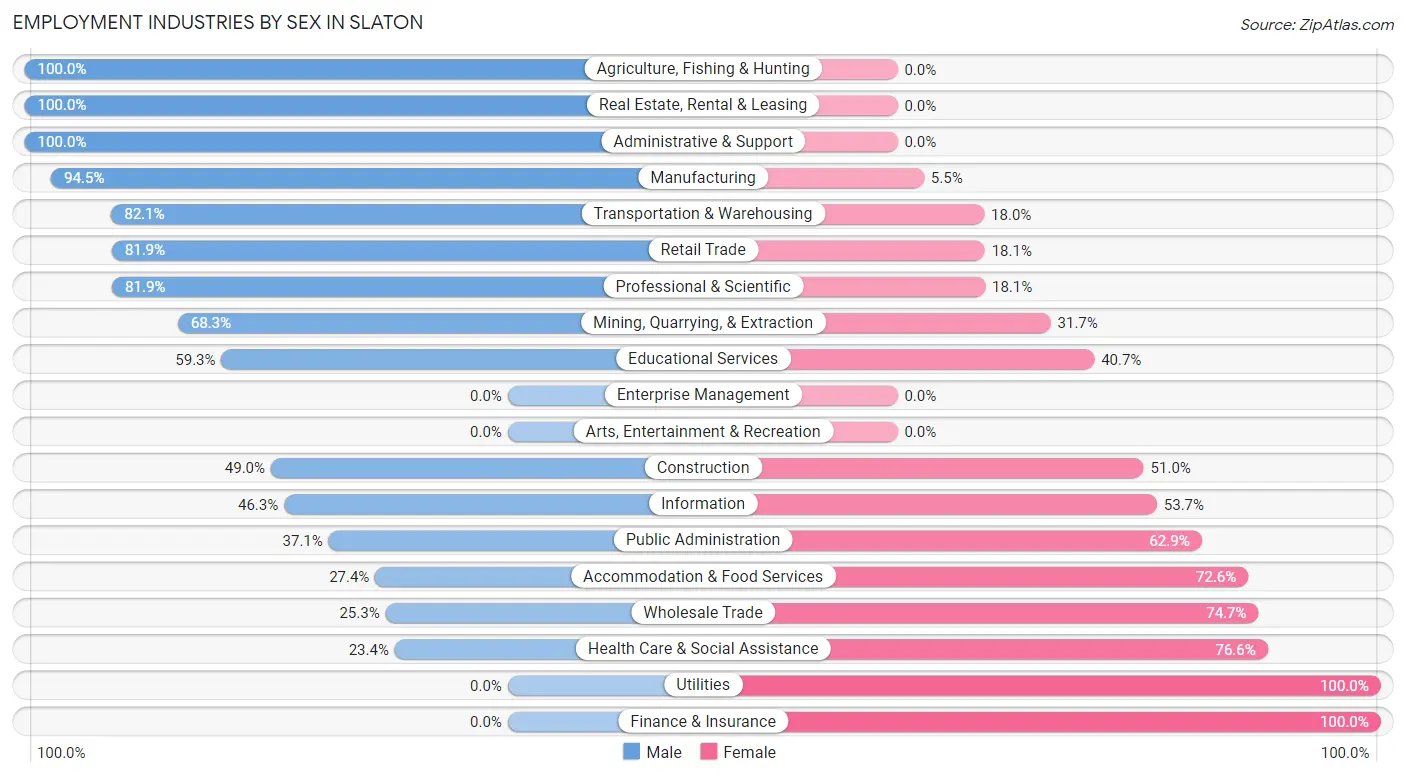
Employment Industries by Sex in Slaton
The Slaton industries that see more men than women are Agriculture, Fishing & Hunting (100.0%), Real Estate, Rental & Leasing (100.0%), and Administrative & Support (100.0%), whereas the industries that tend to have a higher number of women are Utilities (100.0%), Finance & Insurance (100.0%), and Health Care & Social Assistance (76.6%).
| Industry | Male | Female |
| Agriculture, Fishing & Hunting | 36 (100.0%) | 0 (0.0%) |
| Mining, Quarrying, & Extraction | 28 (68.3%) | 13 (31.7%) |
| Construction | 76 (49.0%) | 79 (51.0%) |
| Manufacturing | 138 (94.5%) | 8 (5.5%) |
| Wholesale Trade | 21 (25.3%) | 62 (74.7%) |
| Retail Trade | 272 (81.9%) | 60 (18.1%) |
| Transportation & Warehousing | 64 (82.1%) | 14 (17.9%) |
| Utilities | 0 (0.0%) | 16 (100.0%) |
| Information | 25 (46.3%) | 29 (53.7%) |
| Finance & Insurance | 0 (0.0%) | 46 (100.0%) |
| Real Estate, Rental & Leasing | 65 (100.0%) | 0 (0.0%) |
| Professional & Scientific | 149 (81.9%) | 33 (18.1%) |
| Enterprise Management | 0 (0.0%) | 0 (0.0%) |
| Administrative & Support | 7 (100.0%) | 0 (0.0%) |
| Educational Services | 307 (59.3%) | 211 (40.7%) |
| Health Care & Social Assistance | 91 (23.4%) | 298 (76.6%) |
| Arts, Entertainment & Recreation | 0 (0.0%) | 0 (0.0%) |
| Accommodation & Food Services | 31 (27.4%) | 82 (72.6%) |
| Public Administration | 43 (37.1%) | 73 (62.9%) |
| Total | 1,374 (56.2%) | 1,070 (43.8%) |
Education in Slaton
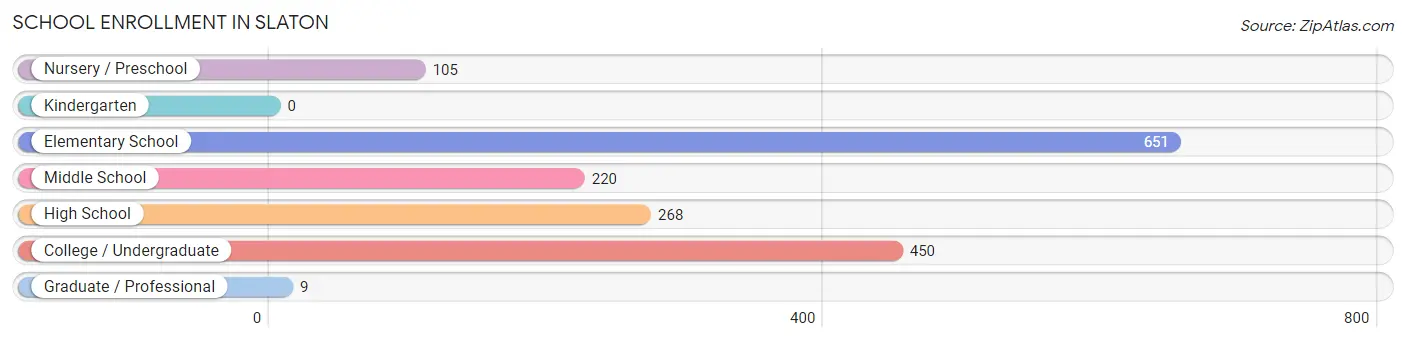
School Enrollment in Slaton
The most common levels of schooling among the 1,703 students in Slaton are elementary school (651 | 38.2%), college / undergraduate (450 | 26.4%), and high school (268 | 15.7%).
| School Level | # Students | % Students |
| Nursery / Preschool | 105 | 6.2% |
| Kindergarten | 0 | 0.0% |
| Elementary School | 651 | 38.2% |
| Middle School | 220 | 12.9% |
| High School | 268 | 15.7% |
| College / Undergraduate | 450 | 26.4% |
| Graduate / Professional | 9 | 0.5% |
| Total | 1,703 | 100.0% |
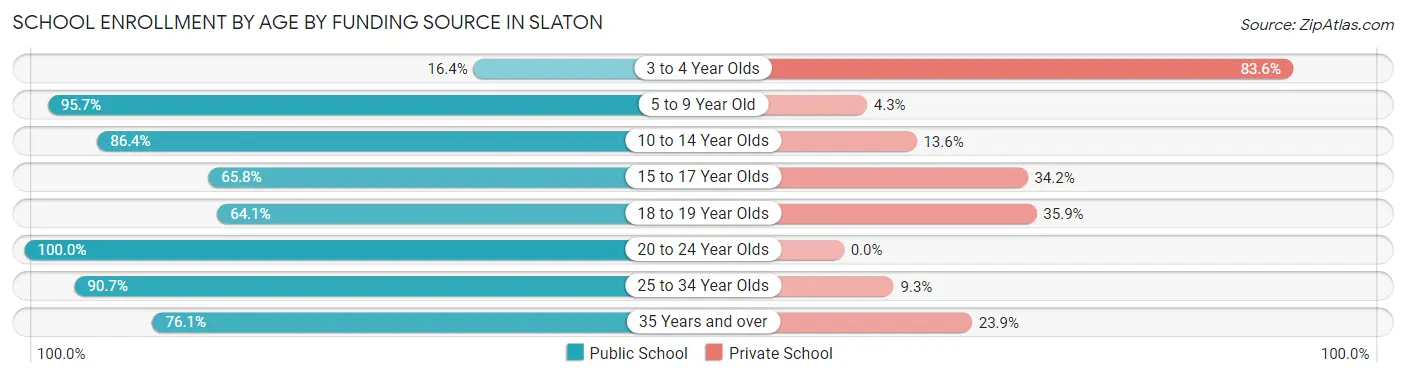
School Enrollment by Age by Funding Source in Slaton
Out of a total of 1,703 students who are enrolled in schools in Slaton, 274 (16.1%) attend a private institution, while the remaining 1,429 (83.9%) are enrolled in public schools. The age group of 3 to 4 year olds has the highest likelihood of being enrolled in private schools, with 46 (83.6% in the age bracket) enrolled. Conversely, the age group of 20 to 24 year olds has the lowest likelihood of being enrolled in a private school, with 136 (100.0% in the age bracket) attending a public institution.
| Age Bracket | Public School | Private School |
| 3 to 4 Year Olds | 9 (16.4%) | 46 (83.6%) |
| 5 to 9 Year Old | 509 (95.7%) | 23 (4.3%) |
| 10 to 14 Year Olds | 376 (86.4%) | 59 (13.6%) |
| 15 to 17 Year Olds | 121 (65.8%) | 63 (34.2%) |
| 18 to 19 Year Olds | 50 (64.1%) | 28 (35.9%) |
| 20 to 24 Year Olds | 136 (100.0%) | 0 (0.0%) |
| 25 to 34 Year Olds | 78 (90.7%) | 8 (9.3%) |
| 35 Years and over | 150 (76.1%) | 47 (23.9%) |
| Total | 1,429 (83.9%) | 274 (16.1%) |
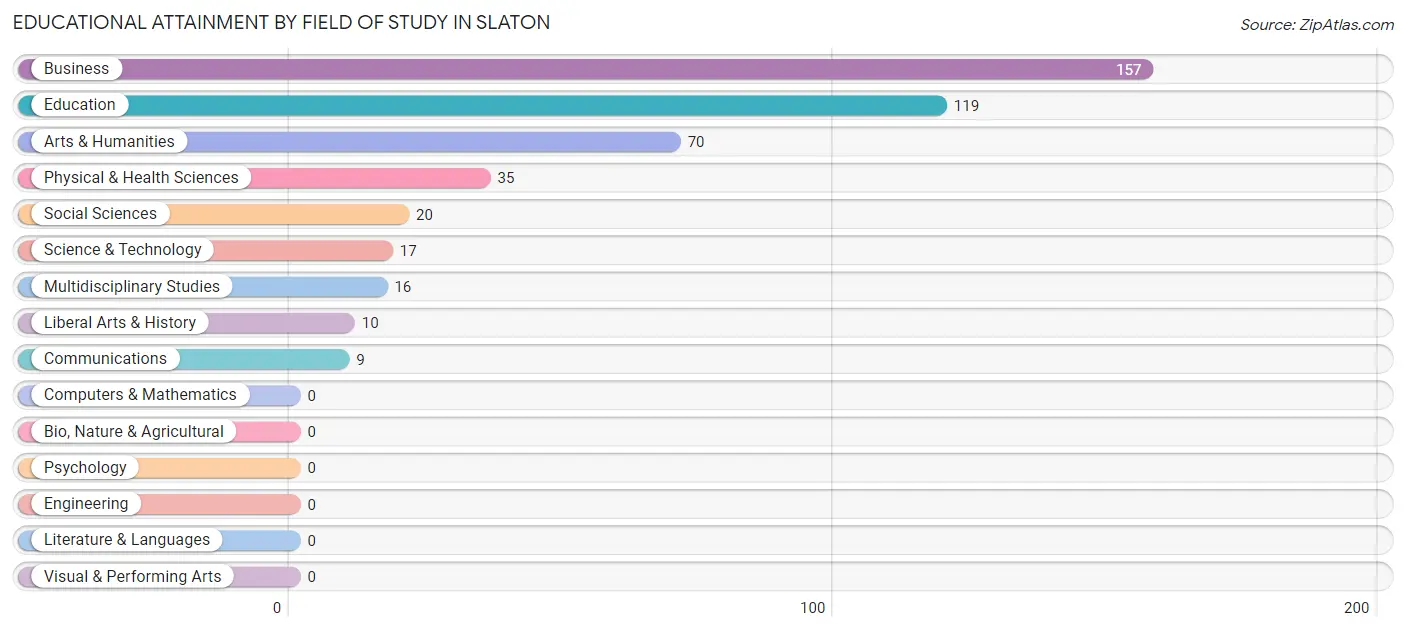
Educational Attainment by Field of Study in Slaton
Business (157 | 34.7%), education (119 | 26.3%), arts & humanities (70 | 15.4%), physical & health sciences (35 | 7.7%), and social sciences (20 | 4.4%) are the most common fields of study among 453 individuals in Slaton who have obtained a bachelor's degree or higher.
| Field of Study | # Graduates | % Graduates |
| Computers & Mathematics | 0 | 0.0% |
| Bio, Nature & Agricultural | 0 | 0.0% |
| Physical & Health Sciences | 35 | 7.7% |
| Psychology | 0 | 0.0% |
| Social Sciences | 20 | 4.4% |
| Engineering | 0 | 0.0% |
| Multidisciplinary Studies | 16 | 3.5% |
| Science & Technology | 17 | 3.7% |
| Business | 157 | 34.7% |
| Education | 119 | 26.3% |
| Literature & Languages | 0 | 0.0% |
| Liberal Arts & History | 10 | 2.2% |
| Visual & Performing Arts | 0 | 0.0% |
| Communications | 9 | 2.0% |
| Arts & Humanities | 70 | 15.4% |
| Total | 453 | 100.0% |
Transportation & Commute in Slaton
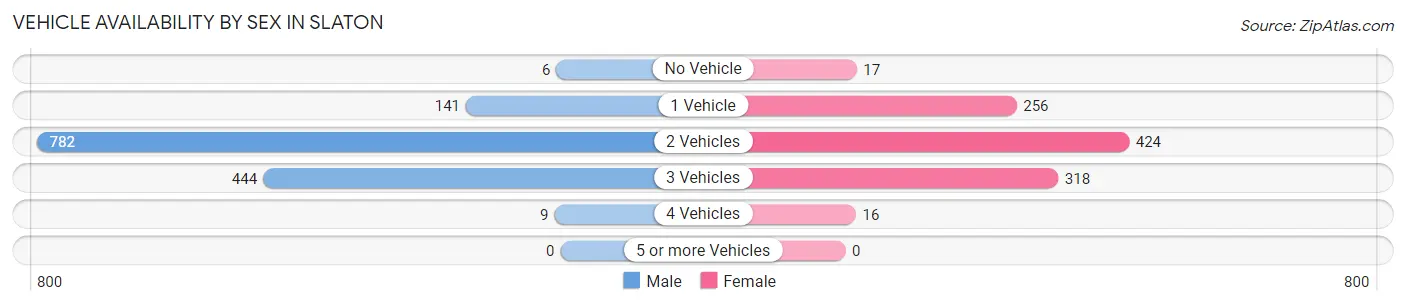
Vehicle Availability by Sex in Slaton
The most prevalent vehicle ownership categories in Slaton are males with 2 vehicles (782, accounting for 56.6%) and females with 2 vehicles (424, making up 75.8%).
| Vehicles Available | Male | Female |
| No Vehicle | 6 (0.4%) | 17 (1.7%) |
| 1 Vehicle | 141 (10.2%) | 256 (24.8%) |
| 2 Vehicles | 782 (56.6%) | 424 (41.1%) |
| 3 Vehicles | 444 (32.1%) | 318 (30.8%) |
| 4 Vehicles | 9 (0.6%) | 16 (1.5%) |
| 5 or more Vehicles | 0 (0.0%) | 0 (0.0%) |
| Total | 1,382 (100.0%) | 1,031 (100.0%) |
Commute Time in Slaton
The most frequently occuring commute durations in Slaton are 20 to 24 minutes (580 commuters, 24.5%), less than 5 minutes (381 commuters, 16.1%), and 15 to 19 minutes (355 commuters, 15.0%).
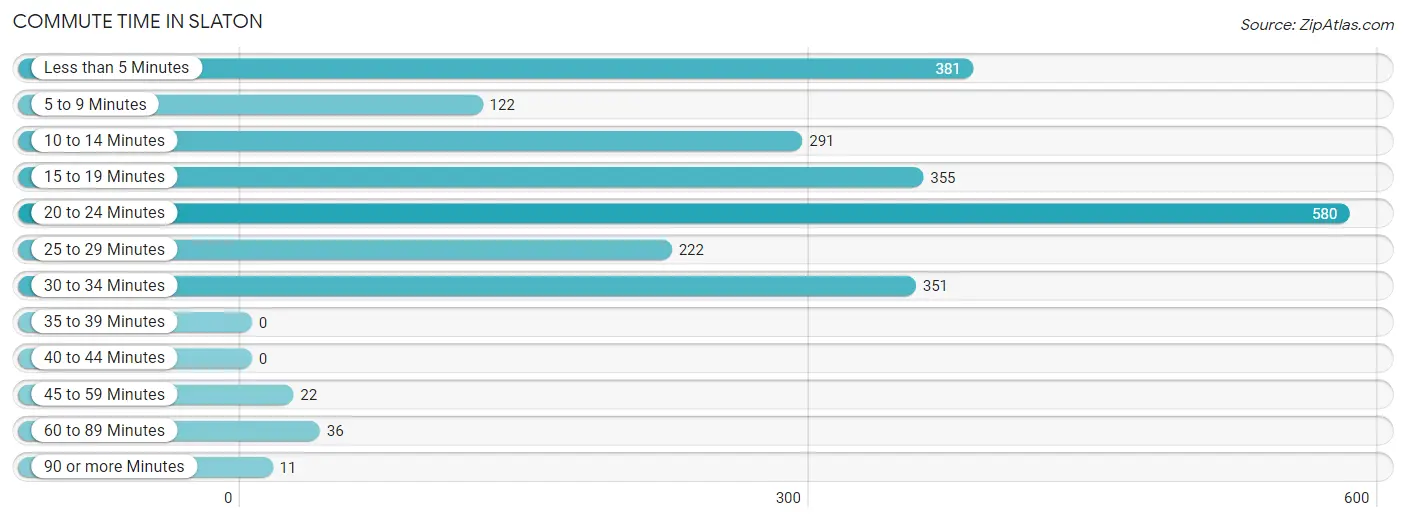
| Commute Time | # Commuters | % Commuters |
| Less than 5 Minutes | 381 | 16.1% |
| 5 to 9 Minutes | 122 | 5.1% |
| 10 to 14 Minutes | 291 | 12.3% |
| 15 to 19 Minutes | 355 | 15.0% |
| 20 to 24 Minutes | 580 | 24.5% |
| 25 to 29 Minutes | 222 | 9.4% |
| 30 to 34 Minutes | 351 | 14.8% |
| 35 to 39 Minutes | 0 | 0.0% |
| 40 to 44 Minutes | 0 | 0.0% |
| 45 to 59 Minutes | 22 | 0.9% |
| 60 to 89 Minutes | 36 | 1.5% |
| 90 or more Minutes | 11 | 0.5% |
Commute Time by Sex in Slaton
The most common commute times in Slaton are 20 to 24 minutes (300 commuters, 21.8%) for males and less than 5 minutes (289 commuters, 29.0%) for females.
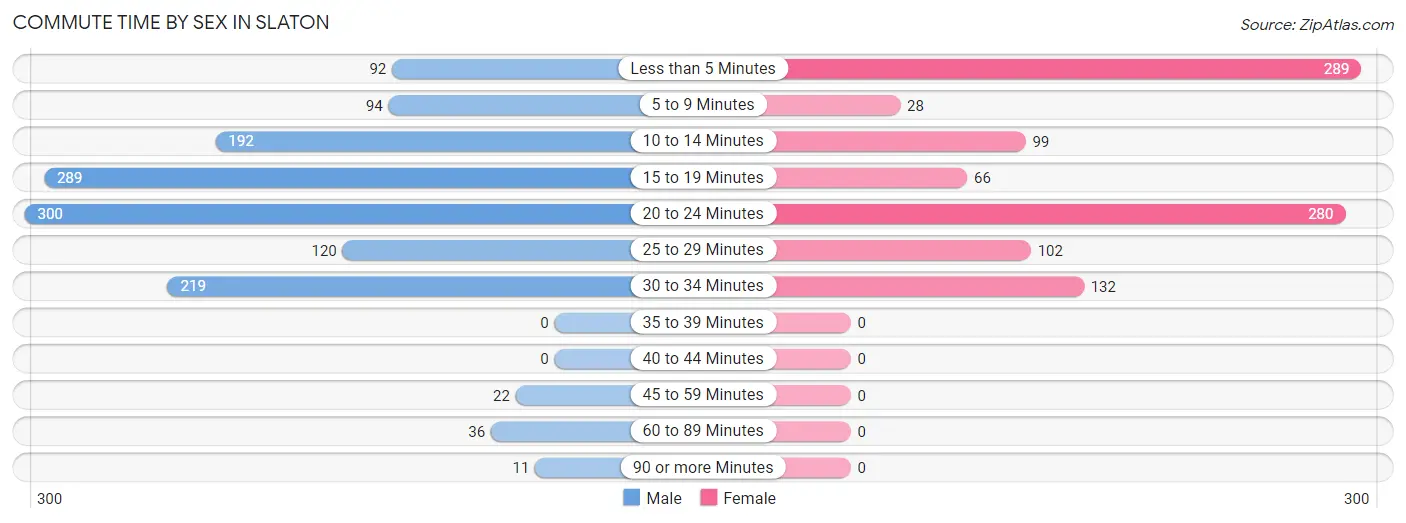
| Commute Time | Male | Female |
| Less than 5 Minutes | 92 (6.7%) | 289 (29.0%) |
| 5 to 9 Minutes | 94 (6.8%) | 28 (2.8%) |
| 10 to 14 Minutes | 192 (14.0%) | 99 (9.9%) |
| 15 to 19 Minutes | 289 (21.0%) | 66 (6.6%) |
| 20 to 24 Minutes | 300 (21.8%) | 280 (28.1%) |
| 25 to 29 Minutes | 120 (8.7%) | 102 (10.2%) |
| 30 to 34 Minutes | 219 (15.9%) | 132 (13.3%) |
| 35 to 39 Minutes | 0 (0.0%) | 0 (0.0%) |
| 40 to 44 Minutes | 0 (0.0%) | 0 (0.0%) |
| 45 to 59 Minutes | 22 (1.6%) | 0 (0.0%) |
| 60 to 89 Minutes | 36 (2.6%) | 0 (0.0%) |
| 90 or more Minutes | 11 (0.8%) | 0 (0.0%) |
Time of Departure to Work by Sex in Slaton
The most frequent times of departure to work in Slaton are 7:00 AM to 7:29 AM (236, 17.2%) for males and 7:00 AM to 7:29 AM (380, 38.2%) for females.
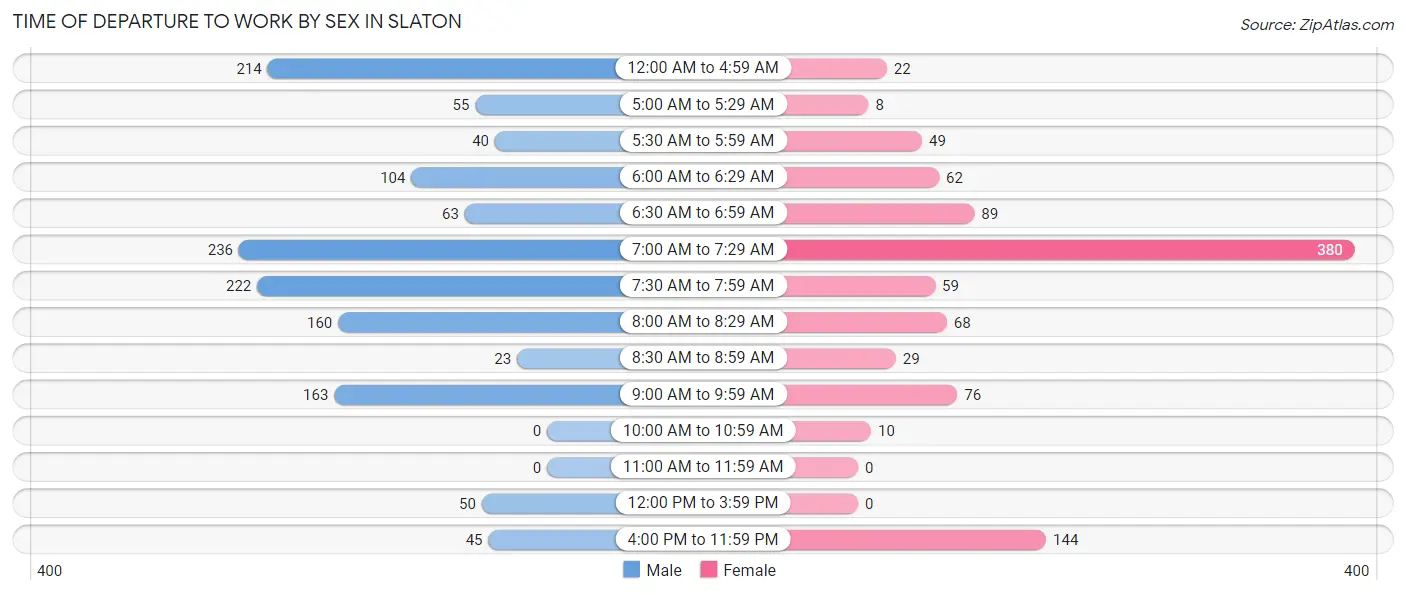
| Time of Departure | Male | Female |
| 12:00 AM to 4:59 AM | 214 (15.6%) | 22 (2.2%) |
| 5:00 AM to 5:29 AM | 55 (4.0%) | 8 (0.8%) |
| 5:30 AM to 5:59 AM | 40 (2.9%) | 49 (4.9%) |
| 6:00 AM to 6:29 AM | 104 (7.6%) | 62 (6.2%) |
| 6:30 AM to 6:59 AM | 63 (4.6%) | 89 (8.9%) |
| 7:00 AM to 7:29 AM | 236 (17.2%) | 380 (38.2%) |
| 7:30 AM to 7:59 AM | 222 (16.2%) | 59 (5.9%) |
| 8:00 AM to 8:29 AM | 160 (11.6%) | 68 (6.8%) |
| 8:30 AM to 8:59 AM | 23 (1.7%) | 29 (2.9%) |
| 9:00 AM to 9:59 AM | 163 (11.8%) | 76 (7.6%) |
| 10:00 AM to 10:59 AM | 0 (0.0%) | 10 (1.0%) |
| 11:00 AM to 11:59 AM | 0 (0.0%) | 0 (0.0%) |
| 12:00 PM to 3:59 PM | 50 (3.6%) | 0 (0.0%) |
| 4:00 PM to 11:59 PM | 45 (3.3%) | 144 (14.5%) |
| Total | 1,375 (100.0%) | 996 (100.0%) |
Housing Occupancy in Slaton
Occupancy by Ownership in Slaton
Of the total 2,030 dwellings in Slaton, owner-occupied units account for 1,508 (74.3%), while renter-occupied units make up 522 (25.7%).
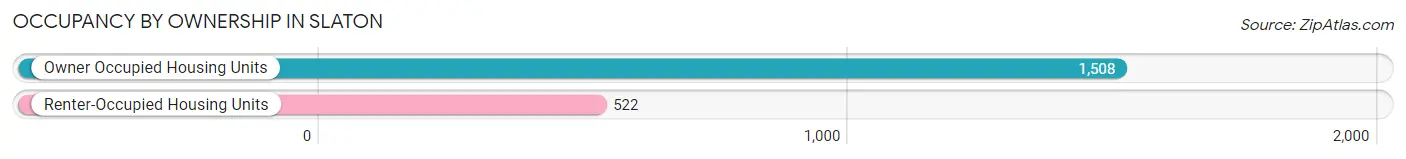
| Occupancy | # Housing Units | % Housing Units |
| Owner Occupied Housing Units | 1,508 | 74.3% |
| Renter-Occupied Housing Units | 522 | 25.7% |
| Total Occupied Housing Units | 2,030 | 100.0% |
Occupancy by Household Size in Slaton
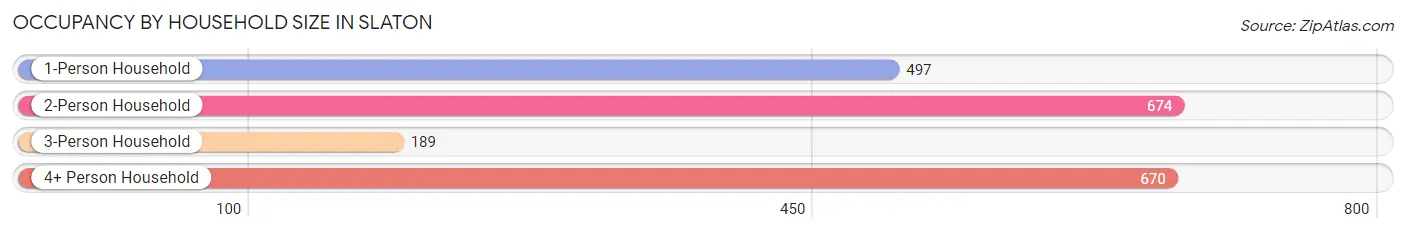
| Household Size | # Housing Units | % Housing Units |
| 1-Person Household | 497 | 24.5% |
| 2-Person Household | 674 | 33.2% |
| 3-Person Household | 189 | 9.3% |
| 4+ Person Household | 670 | 33.0% |
| Total Housing Units | 2,030 | 100.0% |
Occupancy by Ownership by Household Size in Slaton
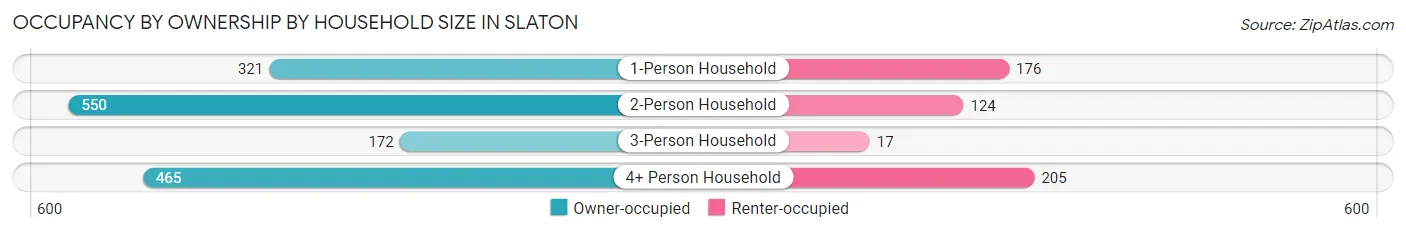
| Household Size | Owner-occupied | Renter-occupied |
| 1-Person Household | 321 (64.6%) | 176 (35.4%) |
| 2-Person Household | 550 (81.6%) | 124 (18.4%) |
| 3-Person Household | 172 (91.0%) | 17 (9.0%) |
| 4+ Person Household | 465 (69.4%) | 205 (30.6%) |
| Total Housing Units | 1,508 (74.3%) | 522 (25.7%) |
Occupancy by Educational Attainment in Slaton
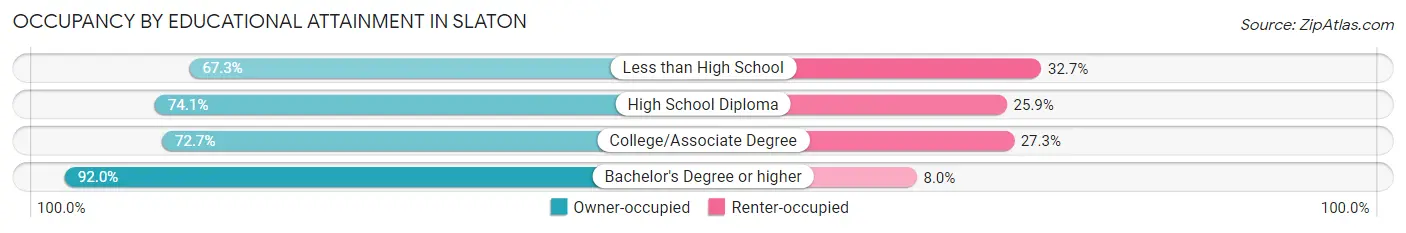
| Household Size | Owner-occupied | Renter-occupied |
| Less than High School | 208 (67.3%) | 101 (32.7%) |
| High School Diploma | 516 (74.1%) | 180 (25.9%) |
| College/Associate Degree | 600 (72.7%) | 225 (27.3%) |
| Bachelor's Degree or higher | 184 (92.0%) | 16 (8.0%) |
Occupancy by Age of Householder in Slaton
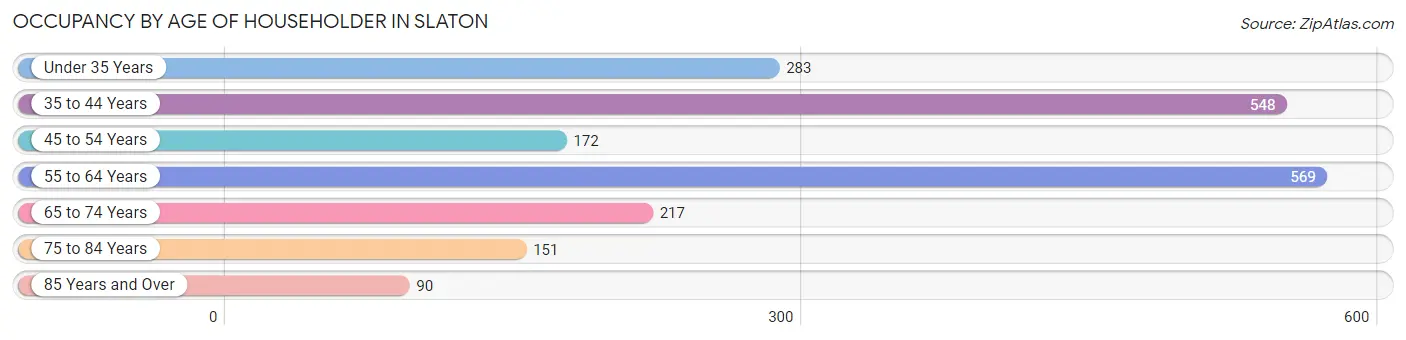
| Age Bracket | # Households | % Households |
| Under 35 Years | 283 | 13.9% |
| 35 to 44 Years | 548 | 27.0% |
| 45 to 54 Years | 172 | 8.5% |
| 55 to 64 Years | 569 | 28.0% |
| 65 to 74 Years | 217 | 10.7% |
| 75 to 84 Years | 151 | 7.4% |
| 85 Years and Over | 90 | 4.4% |
| Total | 2,030 | 100.0% |
Housing Finances in Slaton
Median Income by Occupancy in Slaton
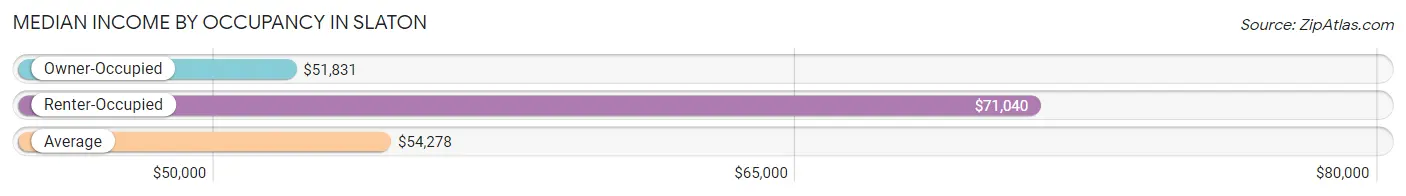
| Occupancy Type | # Households | Median Income |
| Owner-Occupied | 1,508 (74.3%) | $51,831 |
| Renter-Occupied | 522 (25.7%) | $71,040 |
| Average | 2,030 (100.0%) | $54,278 |
Occupancy by Householder Income Bracket in Slaton
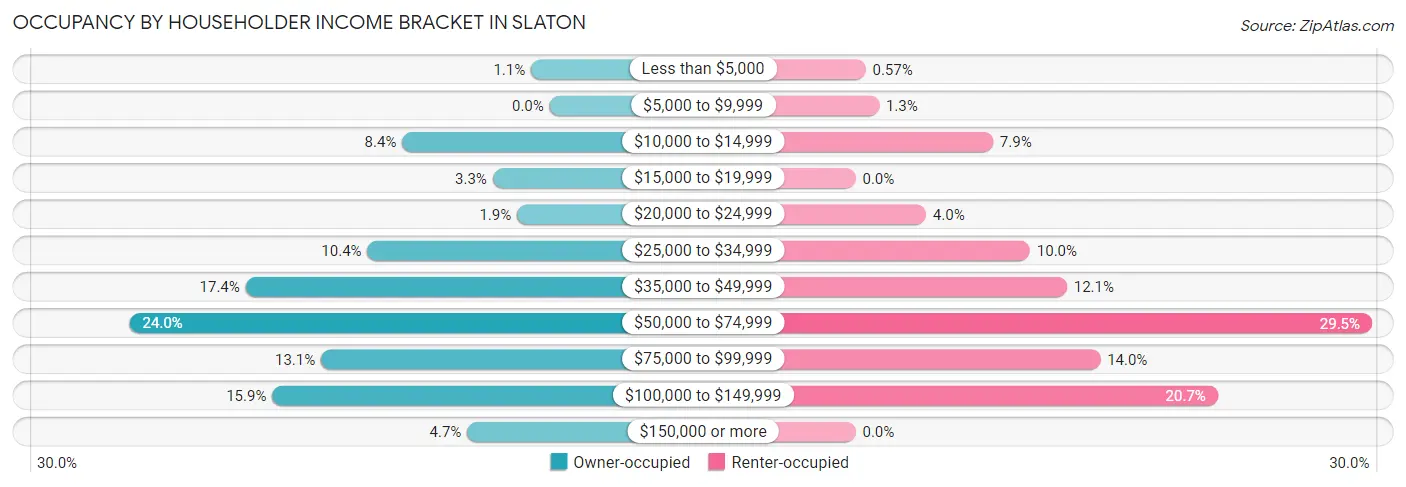
| Income Bracket | Owner-occupied | Renter-occupied |
| Less than $5,000 | 16 (1.1%) | 3 (0.6%) |
| $5,000 to $9,999 | 0 (0.0%) | 7 (1.3%) |
| $10,000 to $14,999 | 127 (8.4%) | 41 (7.9%) |
| $15,000 to $19,999 | 49 (3.3%) | 0 (0.0%) |
| $20,000 to $24,999 | 28 (1.9%) | 21 (4.0%) |
| $25,000 to $34,999 | 157 (10.4%) | 52 (10.0%) |
| $35,000 to $49,999 | 262 (17.4%) | 63 (12.1%) |
| $50,000 to $74,999 | 362 (24.0%) | 154 (29.5%) |
| $75,000 to $99,999 | 197 (13.1%) | 73 (14.0%) |
| $100,000 to $149,999 | 239 (15.9%) | 108 (20.7%) |
| $150,000 or more | 71 (4.7%) | 0 (0.0%) |
| Total | 1,508 (100.0%) | 522 (100.0%) |
Monthly Housing Cost Tiers in Slaton
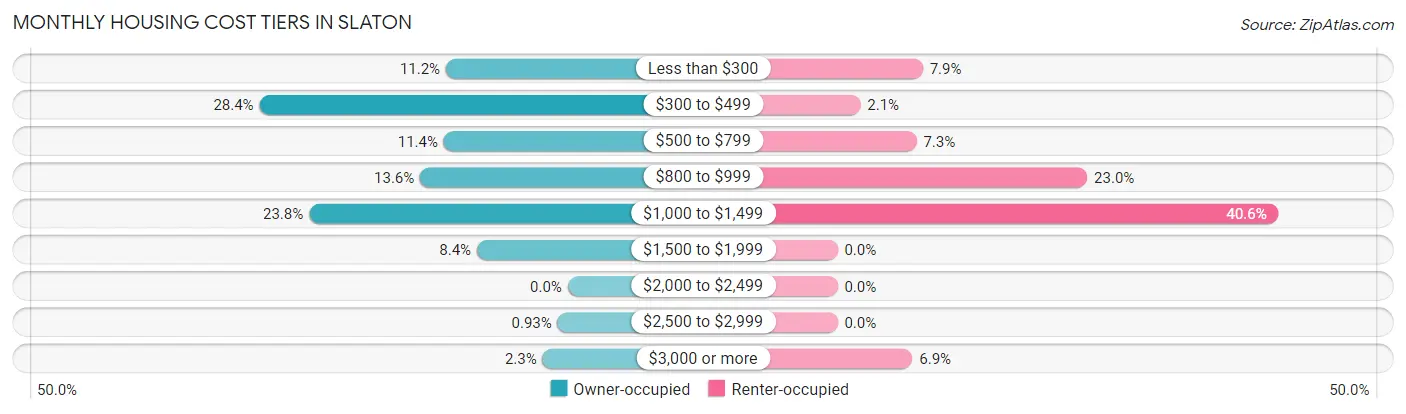
| Monthly Cost | Owner-occupied | Renter-occupied |
| Less than $300 | 169 (11.2%) | 41 (7.9%) |
| $300 to $499 | 428 (28.4%) | 11 (2.1%) |
| $500 to $799 | 172 (11.4%) | 38 (7.3%) |
| $800 to $999 | 205 (13.6%) | 120 (23.0%) |
| $1,000 to $1,499 | 359 (23.8%) | 212 (40.6%) |
| $1,500 to $1,999 | 126 (8.4%) | 0 (0.0%) |
| $2,000 to $2,499 | 0 (0.0%) | 0 (0.0%) |
| $2,500 to $2,999 | 14 (0.9%) | 0 (0.0%) |
| $3,000 or more | 35 (2.3%) | 36 (6.9%) |
| Total | 1,508 (100.0%) | 522 (100.0%) |
Physical Housing Characteristics in Slaton
Housing Structures in Slaton
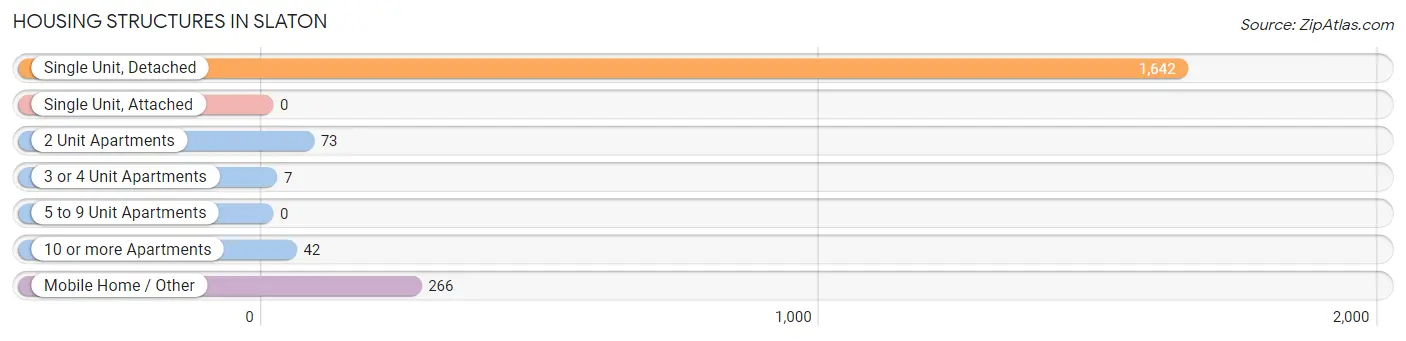
| Structure Type | # Housing Units | % Housing Units |
| Single Unit, Detached | 1,642 | 80.9% |
| Single Unit, Attached | 0 | 0.0% |
| 2 Unit Apartments | 73 | 3.6% |
| 3 or 4 Unit Apartments | 7 | 0.3% |
| 5 to 9 Unit Apartments | 0 | 0.0% |
| 10 or more Apartments | 42 | 2.1% |
| Mobile Home / Other | 266 | 13.1% |
| Total | 2,030 | 100.0% |
Housing Structures by Occupancy in Slaton
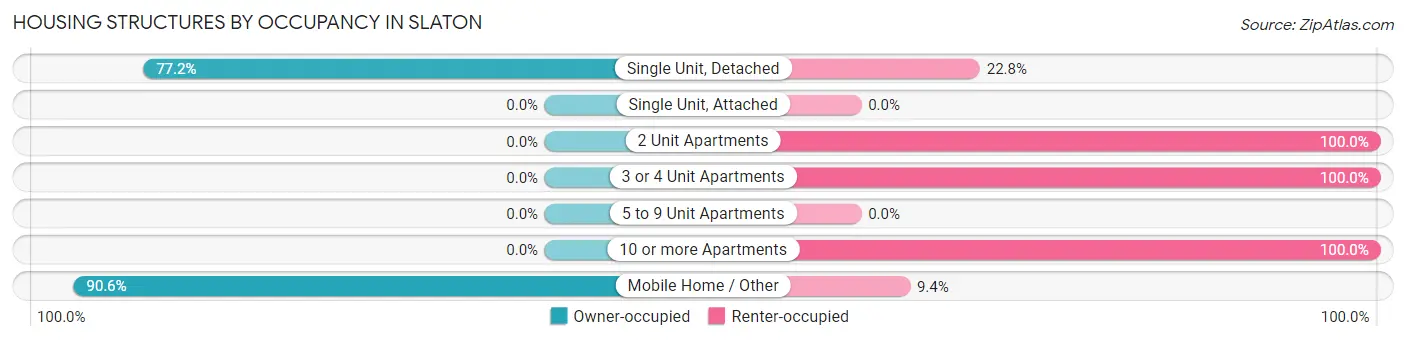
| Structure Type | Owner-occupied | Renter-occupied |
| Single Unit, Detached | 1,267 (77.2%) | 375 (22.8%) |
| Single Unit, Attached | 0 (0.0%) | 0 (0.0%) |
| 2 Unit Apartments | 0 (0.0%) | 73 (100.0%) |
| 3 or 4 Unit Apartments | 0 (0.0%) | 7 (100.0%) |
| 5 to 9 Unit Apartments | 0 (0.0%) | 0 (0.0%) |
| 10 or more Apartments | 0 (0.0%) | 42 (100.0%) |
| Mobile Home / Other | 241 (90.6%) | 25 (9.4%) |
| Total | 1,508 (74.3%) | 522 (25.7%) |
Housing Structures by Number of Rooms in Slaton
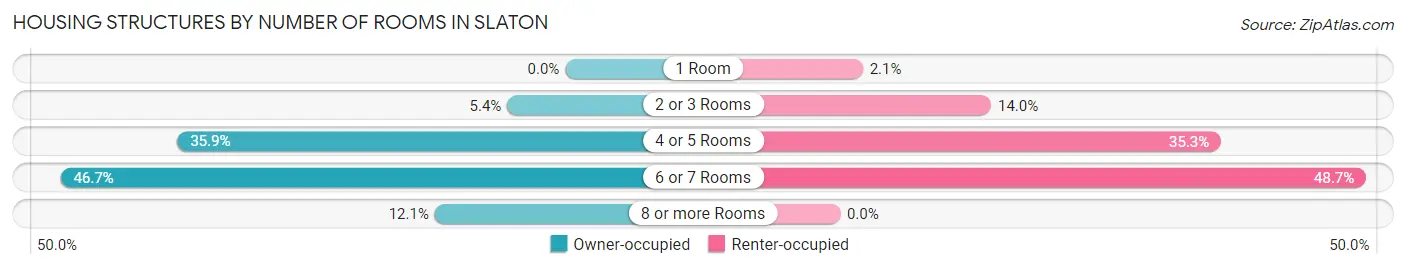
| Number of Rooms | Owner-occupied | Renter-occupied |
| 1 Room | 0 (0.0%) | 11 (2.1%) |
| 2 or 3 Rooms | 81 (5.4%) | 73 (14.0%) |
| 4 or 5 Rooms | 541 (35.9%) | 184 (35.2%) |
| 6 or 7 Rooms | 704 (46.7%) | 254 (48.7%) |
| 8 or more Rooms | 182 (12.1%) | 0 (0.0%) |
| Total | 1,508 (100.0%) | 522 (100.0%) |
Housing Structure by Heating Type in Slaton
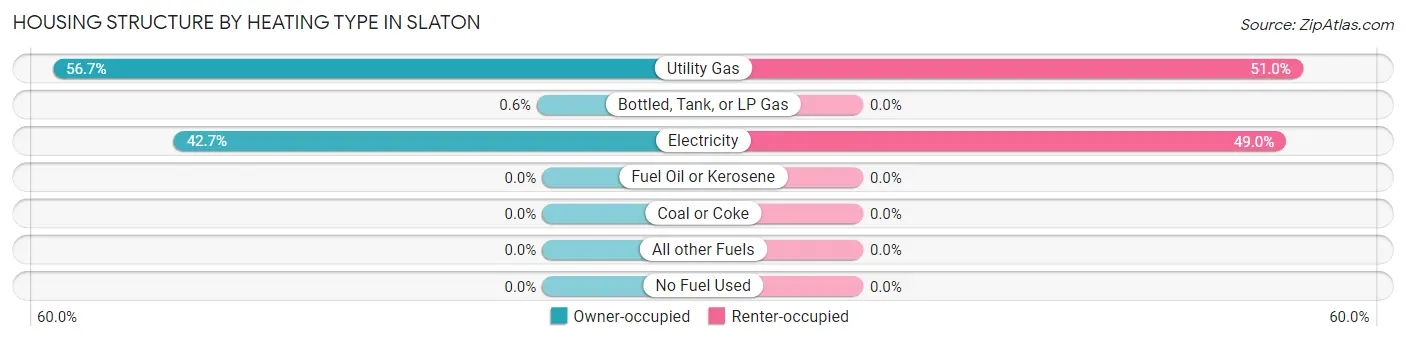
| Heating Type | Owner-occupied | Renter-occupied |
| Utility Gas | 855 (56.7%) | 266 (51.0%) |
| Bottled, Tank, or LP Gas | 9 (0.6%) | 0 (0.0%) |
| Electricity | 644 (42.7%) | 256 (49.0%) |
| Fuel Oil or Kerosene | 0 (0.0%) | 0 (0.0%) |
| Coal or Coke | 0 (0.0%) | 0 (0.0%) |
| All other Fuels | 0 (0.0%) | 0 (0.0%) |
| No Fuel Used | 0 (0.0%) | 0 (0.0%) |
| Total | 1,508 (100.0%) | 522 (100.0%) |
Household Vehicle Usage in Slaton
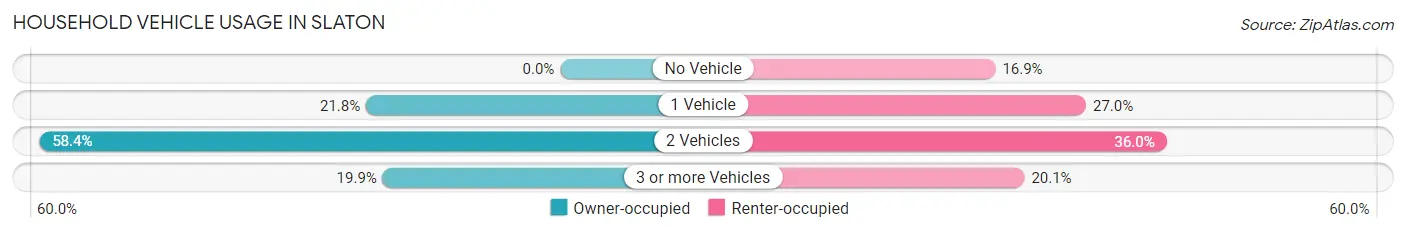
| Vehicles per Household | Owner-occupied | Renter-occupied |
| No Vehicle | 0 (0.0%) | 88 (16.9%) |
| 1 Vehicle | 328 (21.7%) | 141 (27.0%) |
| 2 Vehicles | 880 (58.4%) | 188 (36.0%) |
| 3 or more Vehicles | 300 (19.9%) | 105 (20.1%) |
| Total | 1,508 (100.0%) | 522 (100.0%) |
Real Estate & Mortgages in Slaton
Real Estate and Mortgage Overview in Slaton
| Characteristic | Without Mortgage | With Mortgage |
| Housing Units | 836 | 672 |
| Median Property Value | $72,500 | $115,900 |
| Median Household Income | $49,457 | $71 |
| Monthly Housing Costs | $418 | $35 |
| Real Estate Taxes | $1,072 | $21 |
Property Value by Mortgage Status in Slaton
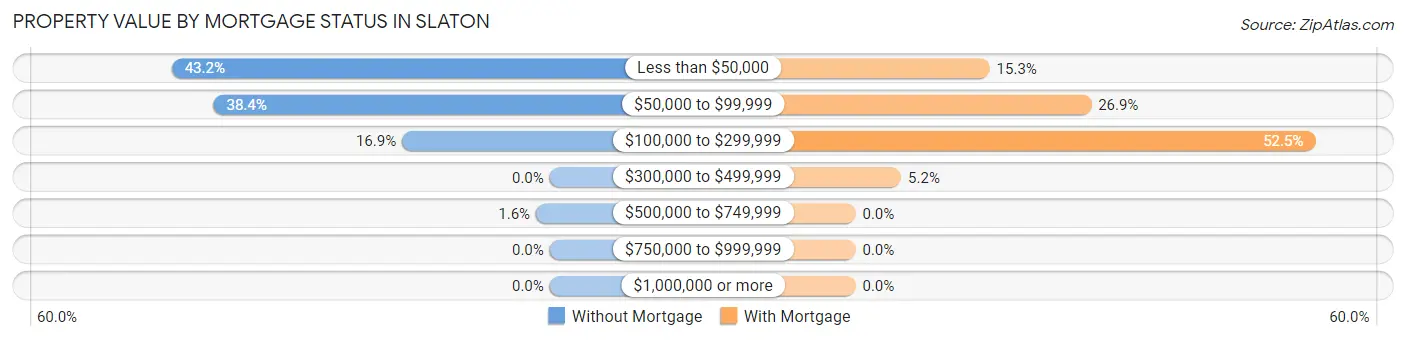
| Property Value | Without Mortgage | With Mortgage |
| Less than $50,000 | 361 (43.2%) | 103 (15.3%) |
| $50,000 to $99,999 | 321 (38.4%) | 181 (26.9%) |
| $100,000 to $299,999 | 141 (16.9%) | 353 (52.5%) |
| $300,000 to $499,999 | 0 (0.0%) | 35 (5.2%) |
| $500,000 to $749,999 | 13 (1.6%) | 0 (0.0%) |
| $750,000 to $999,999 | 0 (0.0%) | 0 (0.0%) |
| $1,000,000 or more | 0 (0.0%) | 0 (0.0%) |
| Total | 836 (100.0%) | 672 (100.0%) |
Household Income by Mortgage Status in Slaton

| Household Income | Without Mortgage | With Mortgage |
| Less than $10,000 | 16 (1.9%) | 0 (0.0%) |
| $10,000 to $24,999 | 175 (20.9%) | 0 (0.0%) |
| $25,000 to $34,999 | 32 (3.8%) | 29 (4.3%) |
| $35,000 to $49,999 | 200 (23.9%) | 125 (18.6%) |
| $50,000 to $74,999 | 291 (34.8%) | 62 (9.2%) |
| $75,000 to $99,999 | 99 (11.8%) | 71 (10.6%) |
| $100,000 to $149,999 | 23 (2.8%) | 98 (14.6%) |
| $150,000 or more | 0 (0.0%) | 216 (32.1%) |
| Total | 836 (100.0%) | 672 (100.0%) |
Property Value to Household Income Ratio in Slaton
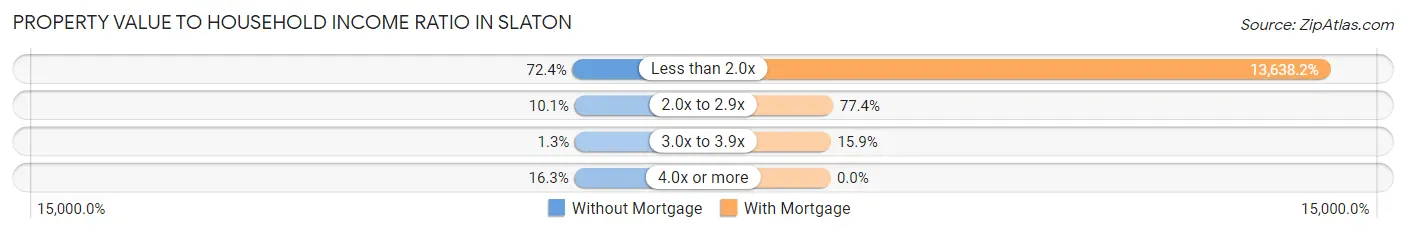
| Value-to-Income Ratio | Without Mortgage | With Mortgage |
| Less than 2.0x | 605 (72.4%) | 91,649 (13,638.2%) |
| 2.0x to 2.9x | 84 (10.1%) | 520 (77.4%) |
| 3.0x to 3.9x | 11 (1.3%) | 107 (15.9%) |
| 4.0x or more | 136 (16.3%) | 0 (0.0%) |
| Total | 836 (100.0%) | 672 (100.0%) |
Real Estate Taxes by Mortgage Status in Slaton
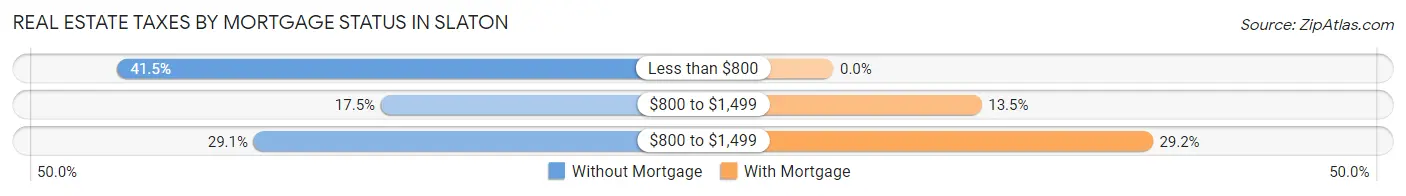
| Property Taxes | Without Mortgage | With Mortgage |
| Less than $800 | 347 (41.5%) | 0 (0.0%) |
| $800 to $1,499 | 146 (17.5%) | 91 (13.5%) |
| $800 to $1,499 | 243 (29.1%) | 196 (29.2%) |
| Total | 836 (100.0%) | 672 (100.0%) |
Health & Disability in Slaton
Health Insurance Coverage by Age in Slaton
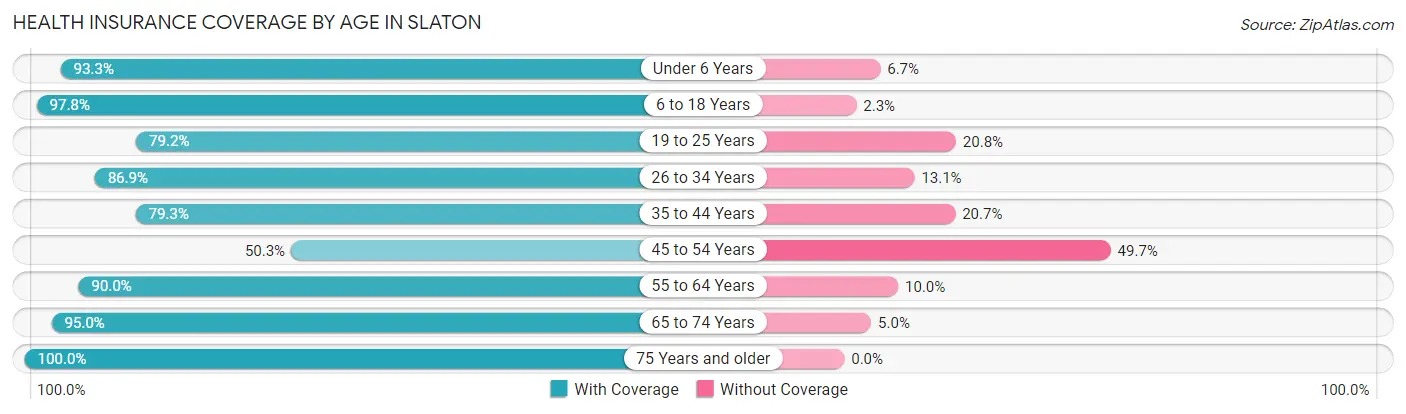
| Age Bracket | With Coverage | Without Coverage |
| Under 6 Years | 445 (93.3%) | 32 (6.7%) |
| 6 to 18 Years | 1,215 (97.8%) | 28 (2.2%) |
| 19 to 25 Years | 510 (79.2%) | 134 (20.8%) |
| 26 to 34 Years | 465 (86.9%) | 70 (13.1%) |
| 35 to 44 Years | 640 (79.3%) | 167 (20.7%) |
| 45 to 54 Years | 226 (50.3%) | 223 (49.7%) |
| 55 to 64 Years | 806 (90.0%) | 90 (10.0%) |
| 65 to 74 Years | 322 (95.0%) | 17 (5.0%) |
| 75 Years and older | 331 (100.0%) | 0 (0.0%) |
| Total | 4,960 (86.7%) | 761 (13.3%) |
Health Insurance Coverage by Citizenship Status in Slaton
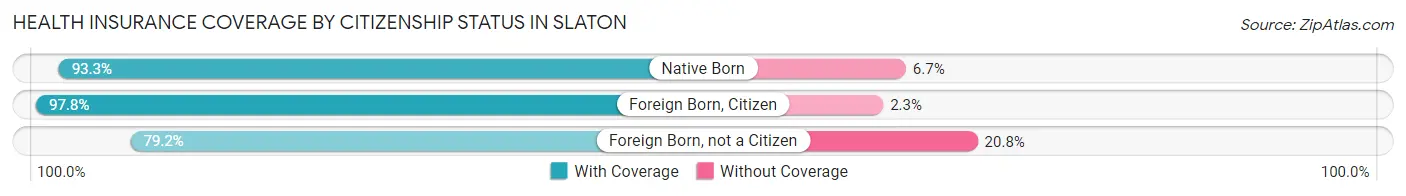
| Citizenship Status | With Coverage | Without Coverage |
| Native Born | 445 (93.3%) | 32 (6.7%) |
| Foreign Born, Citizen | 1,215 (97.8%) | 28 (2.2%) |
| Foreign Born, not a Citizen | 510 (79.2%) | 134 (20.8%) |
Health Insurance Coverage by Household Income in Slaton
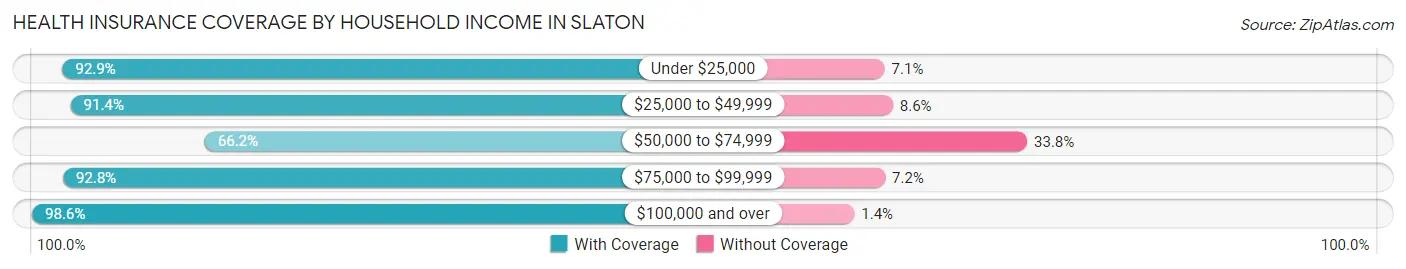
| Household Income | With Coverage | Without Coverage |
| Under $25,000 | 577 (92.9%) | 44 (7.1%) |
| $25,000 to $49,999 | 1,111 (91.4%) | 105 (8.6%) |
| $50,000 to $74,999 | 1,027 (66.2%) | 524 (33.8%) |
| $75,000 to $99,999 | 840 (92.8%) | 65 (7.2%) |
| $100,000 and over | 1,397 (98.6%) | 20 (1.4%) |
Public vs Private Health Insurance Coverage by Age in Slaton
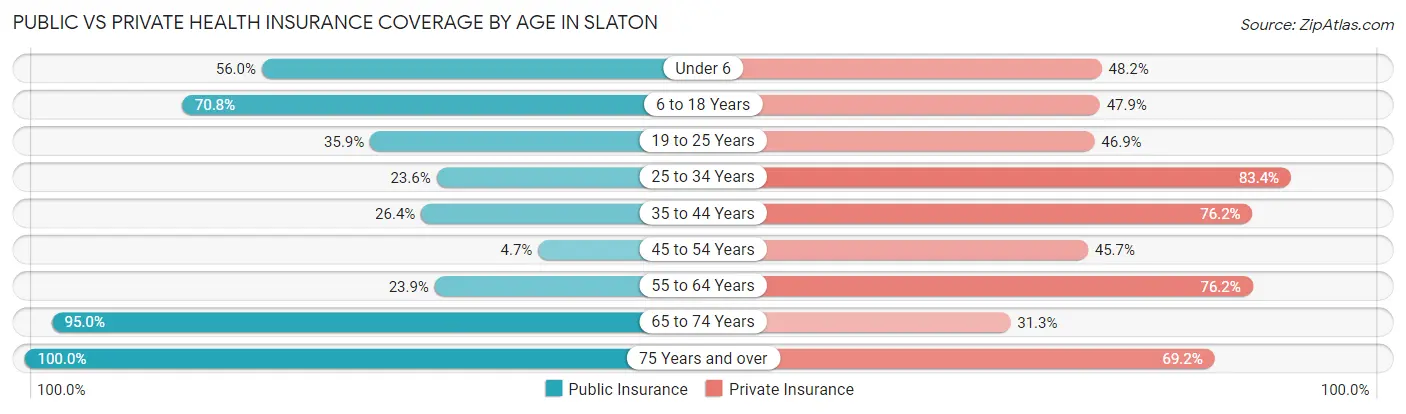
| Age Bracket | Public Insurance | Private Insurance |
| Under 6 | 267 (56.0%) | 230 (48.2%) |
| 6 to 18 Years | 880 (70.8%) | 595 (47.9%) |
| 19 to 25 Years | 231 (35.9%) | 302 (46.9%) |
| 25 to 34 Years | 126 (23.5%) | 446 (83.4%) |
| 35 to 44 Years | 213 (26.4%) | 615 (76.2%) |
| 45 to 54 Years | 21 (4.7%) | 205 (45.7%) |
| 55 to 64 Years | 214 (23.9%) | 683 (76.2%) |
| 65 to 74 Years | 322 (95.0%) | 106 (31.3%) |
| 75 Years and over | 331 (100.0%) | 229 (69.2%) |
| Total | 2,605 (45.5%) | 3,411 (59.6%) |
Disability Status by Sex by Age in Slaton
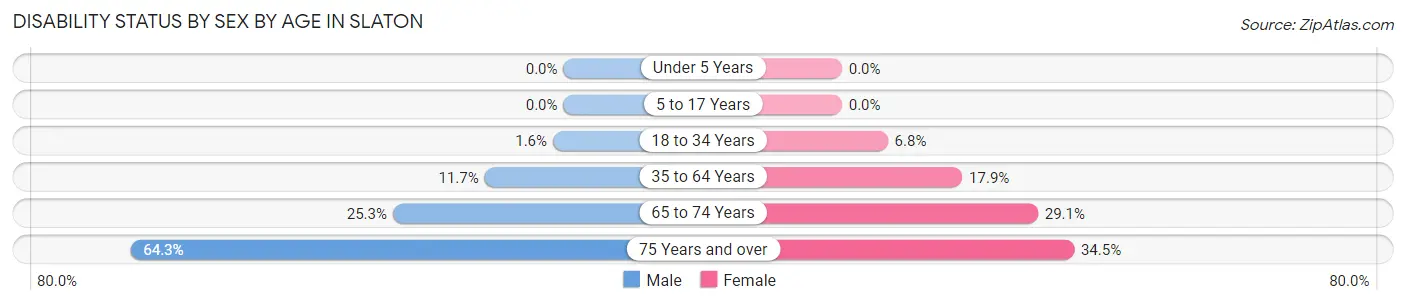
| Age Bracket | Male | Female |
| Under 5 Years | 0 (0.0%) | 0 (0.0%) |
| 5 to 17 Years | 0 (0.0%) | 0 (0.0%) |
| 18 to 34 Years | 10 (1.6%) | 43 (6.8%) |
| 35 to 64 Years | 109 (11.7%) | 218 (17.9%) |
| 65 to 74 Years | 38 (25.3%) | 55 (29.1%) |
| 75 Years and over | 45 (64.3%) | 90 (34.5%) |
Disability Class by Sex by Age in Slaton
Disability Class: Hearing Difficulty
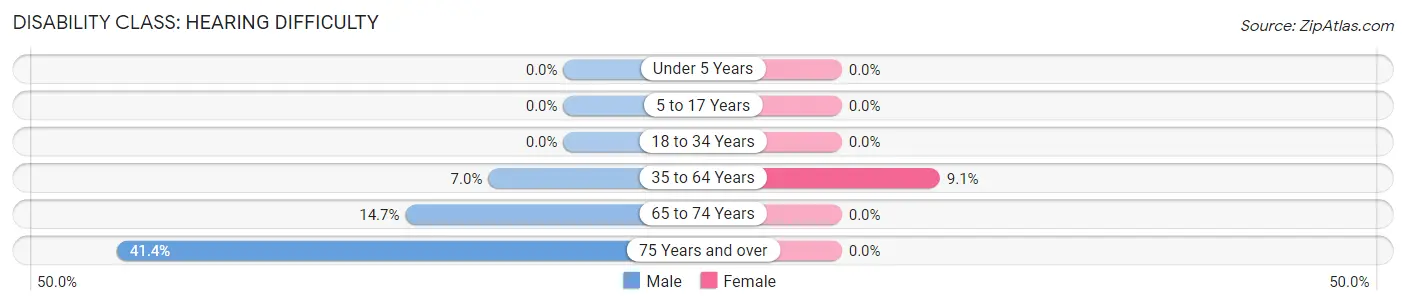
| Age Bracket | Male | Female |
| Under 5 Years | 0 (0.0%) | 0 (0.0%) |
| 5 to 17 Years | 0 (0.0%) | 0 (0.0%) |
| 18 to 34 Years | 0 (0.0%) | 0 (0.0%) |
| 35 to 64 Years | 65 (7.0%) | 111 (9.1%) |
| 65 to 74 Years | 22 (14.7%) | 0 (0.0%) |
| 75 Years and over | 29 (41.4%) | 0 (0.0%) |
Disability Class: Vision Difficulty
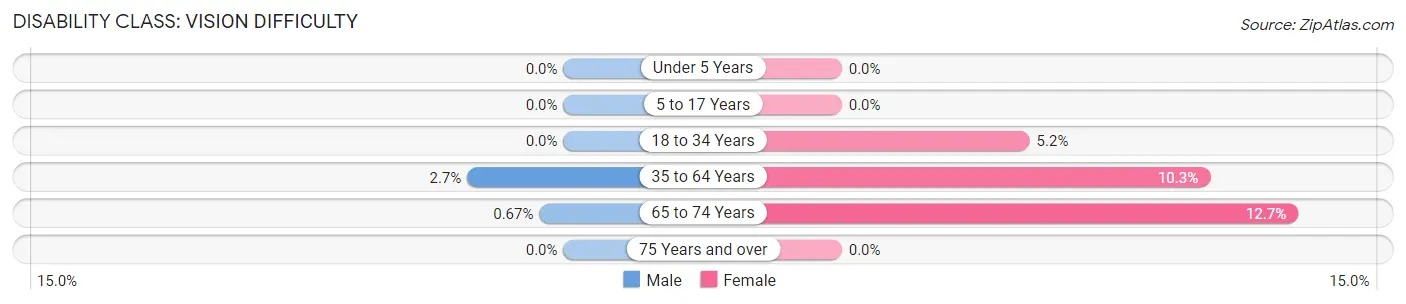
| Age Bracket | Male | Female |
| Under 5 Years | 0 (0.0%) | 0 (0.0%) |
| 5 to 17 Years | 0 (0.0%) | 0 (0.0%) |
| 18 to 34 Years | 0 (0.0%) | 33 (5.2%) |
| 35 to 64 Years | 25 (2.7%) | 125 (10.2%) |
| 65 to 74 Years | 1 (0.7%) | 24 (12.7%) |
| 75 Years and over | 0 (0.0%) | 0 (0.0%) |
Disability Class: Cognitive Difficulty
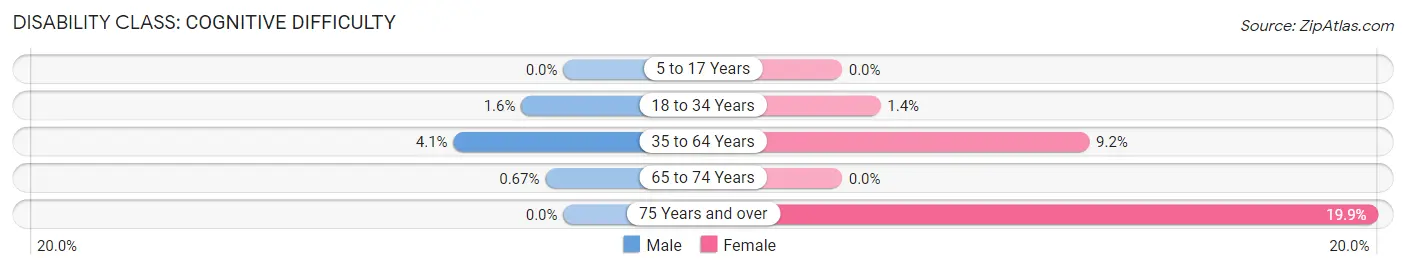
| Age Bracket | Male | Female |
| 5 to 17 Years | 0 (0.0%) | 0 (0.0%) |
| 18 to 34 Years | 10 (1.6%) | 9 (1.4%) |
| 35 to 64 Years | 38 (4.1%) | 112 (9.2%) |
| 65 to 74 Years | 1 (0.7%) | 0 (0.0%) |
| 75 Years and over | 0 (0.0%) | 52 (19.9%) |
Disability Class: Ambulatory Difficulty
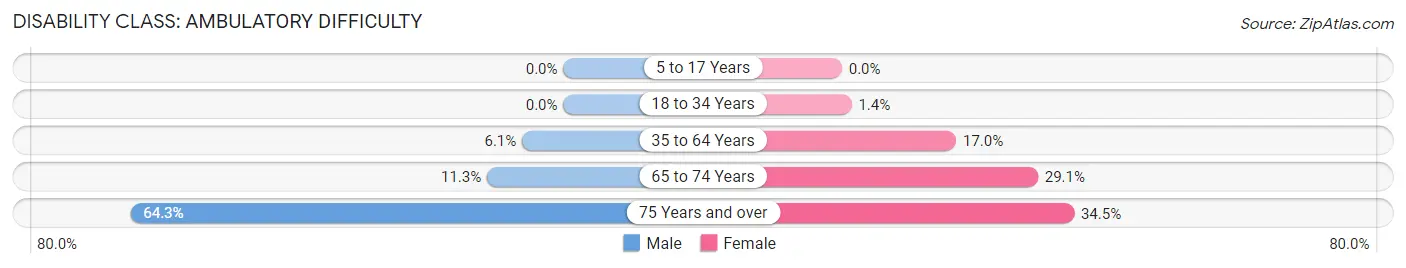
| Age Bracket | Male | Female |
| 5 to 17 Years | 0 (0.0%) | 0 (0.0%) |
| 18 to 34 Years | 0 (0.0%) | 9 (1.4%) |
| 35 to 64 Years | 57 (6.1%) | 207 (17.0%) |
| 65 to 74 Years | 17 (11.3%) | 55 (29.1%) |
| 75 Years and over | 45 (64.3%) | 90 (34.5%) |
Disability Class: Self-Care Difficulty
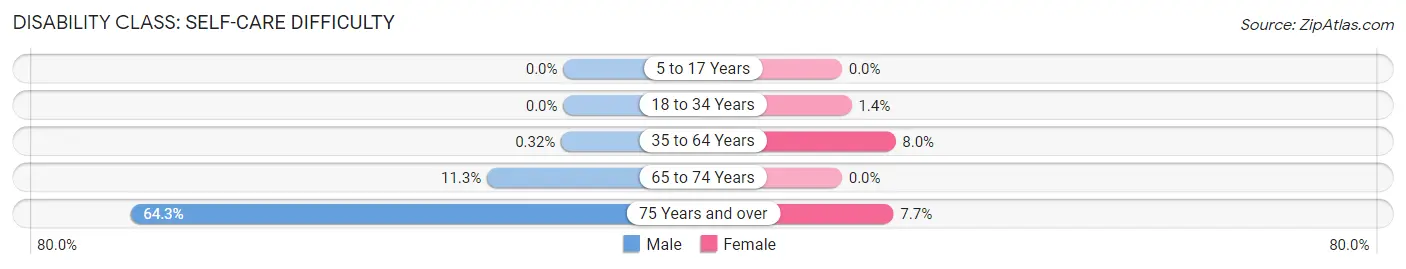
| Age Bracket | Male | Female |
| 5 to 17 Years | 0 (0.0%) | 0 (0.0%) |
| 18 to 34 Years | 0 (0.0%) | 9 (1.4%) |
| 35 to 64 Years | 3 (0.3%) | 97 (8.0%) |
| 65 to 74 Years | 17 (11.3%) | 0 (0.0%) |
| 75 Years and over | 45 (64.3%) | 20 (7.7%) |
Technology Access in Slaton
Computing Device Access in Slaton
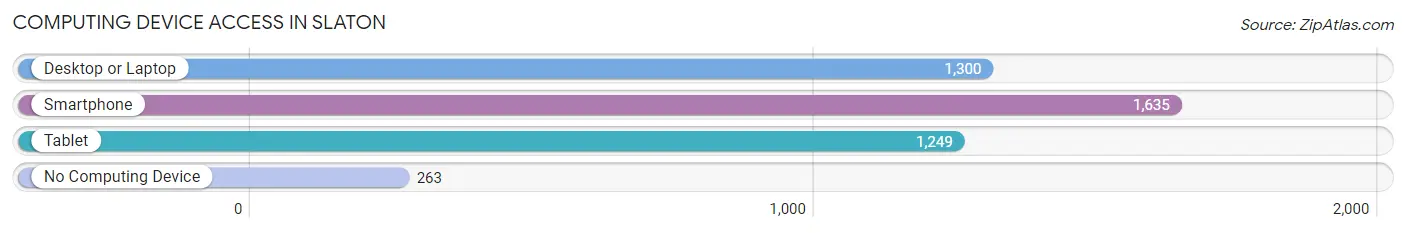
| Device Type | # Households | % Households |
| Desktop or Laptop | 1,300 | 64.0% |
| Smartphone | 1,635 | 80.5% |
| Tablet | 1,249 | 61.5% |
| No Computing Device | 263 | 13.0% |
| Total | 2,030 | 100.0% |
Internet Access in Slaton
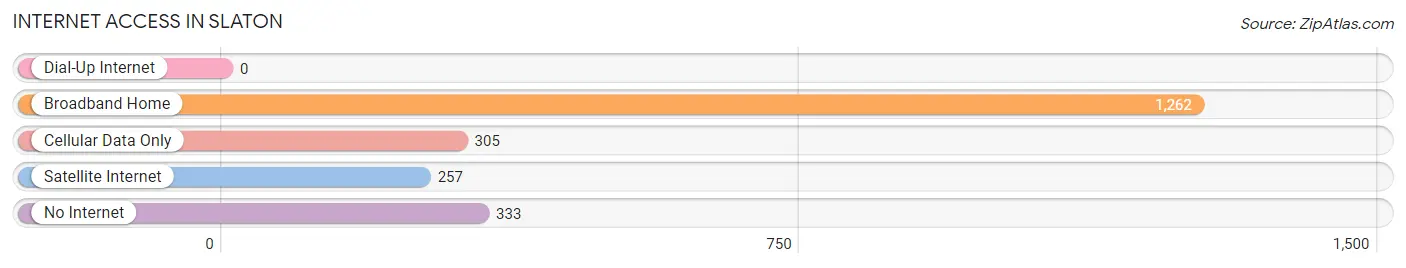
| Internet Type | # Households | % Households |
| Dial-Up Internet | 0 | 0.0% |
| Broadband Home | 1,262 | 62.2% |
| Cellular Data Only | 305 | 15.0% |
| Satellite Internet | 257 | 12.7% |
| No Internet | 333 | 16.4% |
| Total | 2,030 | 100.0% |
Slaton Summary
Slaton, Texas is a small town located in Lubbock County, Texas. It is situated about 10 miles west of Lubbock and is part of the Lubbock Metropolitan Statistical Area. The population of Slaton was 6,121 at the 2010 census, making it the second-largest town in Lubbock County.
History
Slaton was founded in 1906 by the Santa Fe Railroad. The town was named after the railroad's chief engineer, William Slaton. The town was originally a farming community, but it soon became a center for the cotton industry. The town was incorporated in 1911 and by the 1920s, it had become a major cotton-producing center.
Geography
Slaton is located at 33°27'25" North, 101°45'45" West (33.456944, -101.762500). It is situated in the South Plains region of Texas, about 10 miles west of Lubbock. The town is located on the Llano Estacado, a large plateau that stretches across the Texas Panhandle. The town is surrounded by flat, open farmland and is located near the Double Mountain Fork of the Brazos River.
Economy
Slaton's economy is largely based on agriculture. The town is home to several cotton gins and is a major producer of cotton. Other crops grown in the area include corn, wheat, sorghum, and hay. The town is also home to several manufacturing companies, including a furniture factory and a plastics plant.
Demographics
As of the 2010 census, Slaton had a population of 6,121. The racial makeup of the town was 79.2% White, 0.7% African American, 0.7% Native American, 0.3% Asian, 0.1% Pacific Islander, 16.7% from other races, and 2.2% from two or more races. Hispanic or Latino of any race were 33.2% of the population.
The median income for a household in Slaton was $31,944, and the median income for a family was $37,917. The per capita income for the town was $15,945. About 17.2% of families and 20.2% of the population were below the poverty line, including 28.2% of those under age 18 and 11.2% of those age 65 or over.
Common Questions
What is Per Capita Income in Slaton?
Per Capita income in Slaton is $23,760.
What is the Median Family Income in Slaton?
Median Family Income in Slaton is $52,475.
What is the Median Household income in Slaton?
Median Household Income in Slaton is $54,278.
What is Income or Wage Gap in Slaton?
Income or Wage Gap in Slaton is 39.1%.
Women in Slaton earn 60.9 cents for every dollar earned by a man.
What is Inequality or Gini Index in Slaton?
Inequality or Gini Index in Slaton is 0.37.
What is the Total Population of Slaton?
Total Population of Slaton is 5,859.
What is the Total Male Population of Slaton?
Total Male Population of Slaton is 2,736.
What is the Total Female Population of Slaton?
Total Female Population of Slaton is 3,123.
What is the Ratio of Males per 100 Females in Slaton?
There are 87.61 Males per 100 Females in Slaton.
What is the Ratio of Females per 100 Males in Slaton?
There are 114.14 Females per 100 Males in Slaton.
What is the Median Population Age in Slaton?
Median Population Age in Slaton is 35.4 Years.
What is the Average Family Size in Slaton
Average Family Size in Slaton is 3.4 People.
What is the Average Household Size in Slaton
Average Household Size in Slaton is 2.8 People.
How Large is the Labor Force in Slaton?
There are 2,709 People in the Labor Forcein in Slaton.
What is the Percentage of People in the Labor Force in Slaton?
61.2% of People are in the Labor Force in Slaton.
What is the Unemployment Rate in Slaton?
Unemployment Rate in Slaton is 7.7%.