Silsbee, TX Map & Demographics
Silsbee Map
Silsbee Overview
$27,046
PER CAPITA INCOME
$68,750
AVG FAMILY INCOME
$58,641
AVG HOUSEHOLD INCOME
47.4%
WAGE / INCOME GAP [ % ]
52.6¢/ $1
WAGE / INCOME GAP [ $ ]
$10,557
FAMILY INCOME DEFICIT
0.40
INEQUALITY / GINI INDEX
6,904
TOTAL POPULATION
2,979
MALE POPULATION
3,925
FEMALE POPULATION
75.90
MALES / 100 FEMALES
131.76
FEMALES / 100 MALES
41.7
MEDIAN AGE
3.2
AVG FAMILY SIZE
2.6
AVG HOUSEHOLD SIZE
2,787
LABOR FORCE [ PEOPLE ]
52.9%
PERCENT IN LABOR FORCE
4.2%
UNEMPLOYMENT RATE
Silsbee Zip Codes
Silsbee Area Codes
Income in Silsbee
Income Overview in Silsbee
Per Capita Income in Silsbee is $27,046, while median incomes of families and households are $68,750 and $58,641 respectively.
| Characteristic | Number | Measure |
| Per Capita Income | 6,904 | $27,046 |
| Median Family Income | 1,803 | $68,750 |
| Mean Family Income | 1,803 | $83,138 |
| Median Household Income | 2,557 | $58,641 |
| Mean Household Income | 2,557 | $70,095 |
| Income Deficit | 1,803 | $10,557 |
| Wage / Income Gap (%) | 6,904 | 47.39% |
| Wage / Income Gap ($) | 6,904 | 52.61¢ per $1 |
| Gini / Inequality Index | 6,904 | 0.40 |
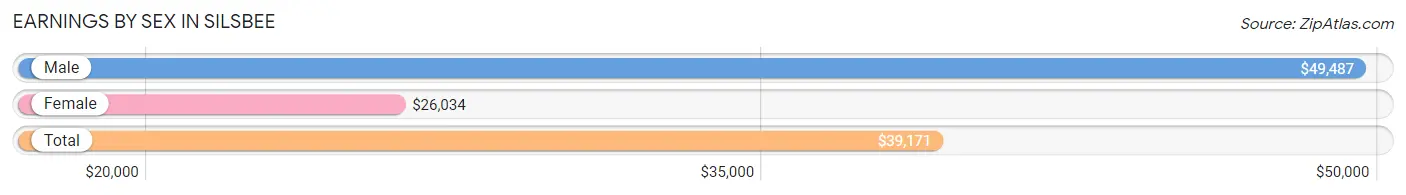
Earnings by Sex in Silsbee
Average Earnings in Silsbee are $39,171, $49,487 for men and $26,034 for women, a difference of 47.4%.
| Sex | Number | Average Earnings |
| Male | 1,572 (51.4%) | $49,487 |
| Female | 1,485 (48.6%) | $26,034 |
| Total | 3,057 (100.0%) | $39,171 |
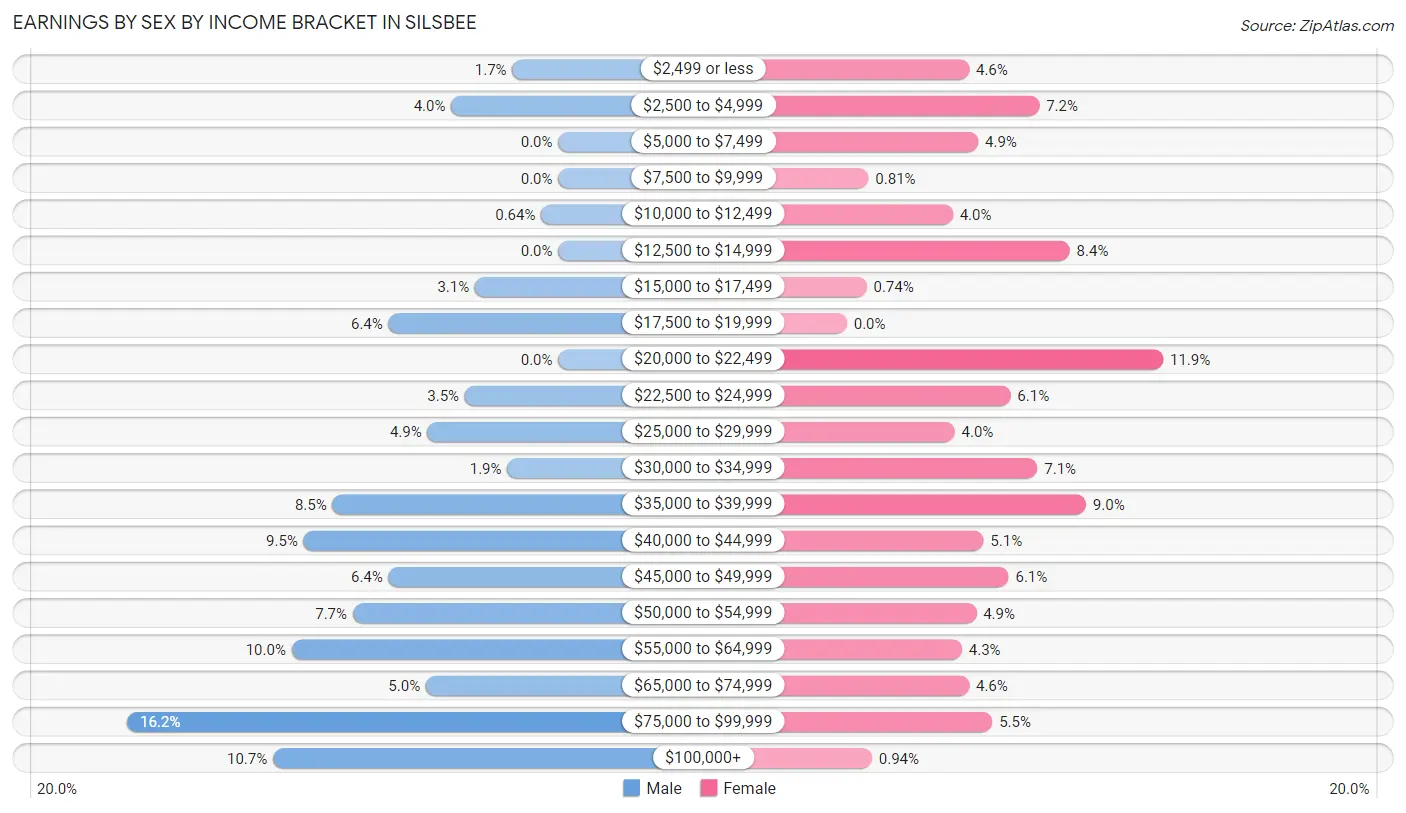
Earnings by Sex by Income Bracket in Silsbee
The most common earnings brackets in Silsbee are $75,000 to $99,999 for men (254 | 16.2%) and $20,000 to $22,499 for women (176 | 11.8%).
| Income | Male | Female |
| $2,499 or less | 27 (1.7%) | 68 (4.6%) |
| $2,500 to $4,999 | 63 (4.0%) | 107 (7.2%) |
| $5,000 to $7,499 | 0 (0.0%) | 73 (4.9%) |
| $7,500 to $9,999 | 0 (0.0%) | 12 (0.8%) |
| $10,000 to $12,499 | 10 (0.6%) | 59 (4.0%) |
| $12,500 to $14,999 | 0 (0.0%) | 124 (8.4%) |
| $15,000 to $17,499 | 49 (3.1%) | 11 (0.7%) |
| $17,500 to $19,999 | 100 (6.4%) | 0 (0.0%) |
| $20,000 to $22,499 | 0 (0.0%) | 176 (11.8%) |
| $22,500 to $24,999 | 55 (3.5%) | 91 (6.1%) |
| $25,000 to $29,999 | 77 (4.9%) | 60 (4.0%) |
| $30,000 to $34,999 | 30 (1.9%) | 106 (7.1%) |
| $35,000 to $39,999 | 133 (8.5%) | 133 (9.0%) |
| $40,000 to $44,999 | 150 (9.5%) | 76 (5.1%) |
| $45,000 to $49,999 | 100 (6.4%) | 90 (6.1%) |
| $50,000 to $54,999 | 121 (7.7%) | 72 (4.9%) |
| $55,000 to $64,999 | 157 (10.0%) | 64 (4.3%) |
| $65,000 to $74,999 | 78 (5.0%) | 68 (4.6%) |
| $75,000 to $99,999 | 254 (16.2%) | 81 (5.4%) |
| $100,000+ | 168 (10.7%) | 14 (0.9%) |
| Total | 1,572 (100.0%) | 1,485 (100.0%) |
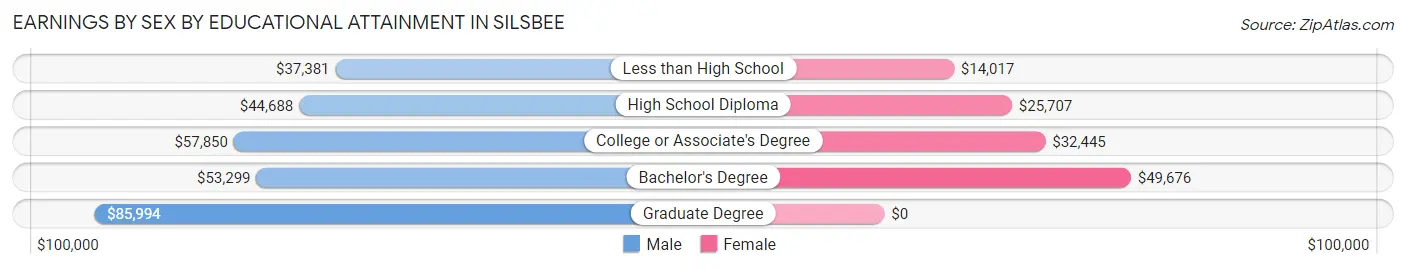
Earnings by Sex by Educational Attainment in Silsbee
Average earnings in Silsbee are $52,722 for men and $31,599 for women, a difference of 40.1%. Men with an educational attainment of graduate degree enjoy the highest average annual earnings of $85,994, while those with less than high school education earn the least with $37,381. Women with an educational attainment of bachelor's degree earn the most with the average annual earnings of $49,676, while those with less than high school education have the smallest earnings of $14,017.
| Educational Attainment | Male Income | Female Income |
| Less than High School | $37,381 | $14,017 |
| High School Diploma | $44,688 | $25,707 |
| College or Associate's Degree | $57,850 | $32,445 |
| Bachelor's Degree | $53,299 | $49,676 |
| Graduate Degree | $85,994 | $0 |
| Total | $52,722 | $31,599 |
Family Income in Silsbee
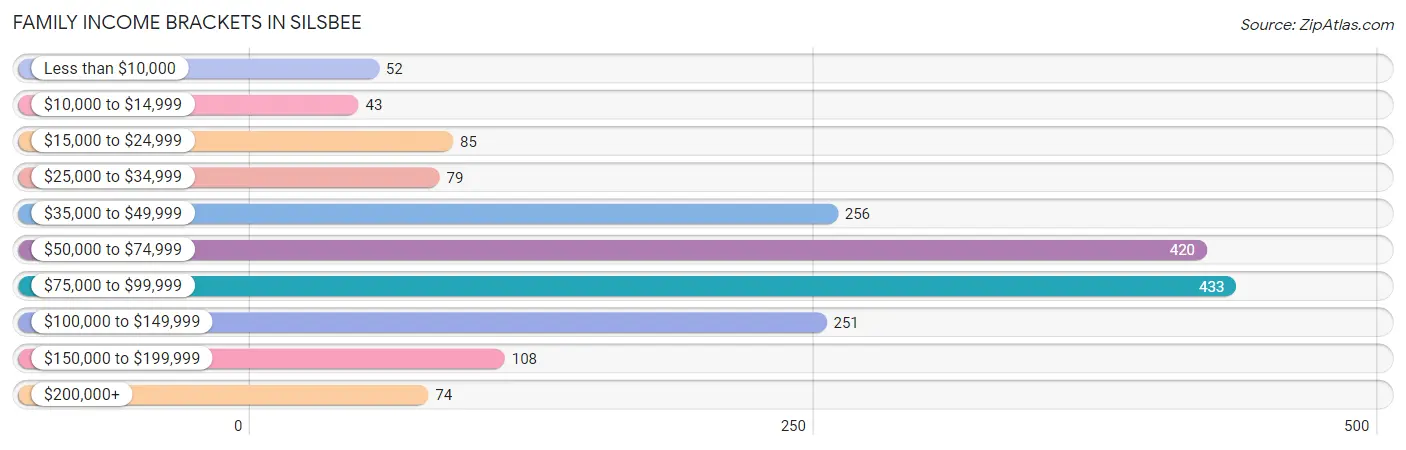
Family Income Brackets in Silsbee
According to the Silsbee family income data, there are 433 families falling into the $75,000 to $99,999 income range, which is the most common income bracket and makes up 24.0% of all families. Conversely, the $10,000 to $14,999 income bracket is the least frequent group with only 43 families (2.4%) belonging to this category.
| Income Bracket | # Families | % Families |
| Less than $10,000 | 52 | 2.9% |
| $10,000 to $14,999 | 43 | 2.4% |
| $15,000 to $24,999 | 85 | 4.7% |
| $25,000 to $34,999 | 79 | 4.4% |
| $35,000 to $49,999 | 256 | 14.2% |
| $50,000 to $74,999 | 420 | 23.3% |
| $75,000 to $99,999 | 433 | 24.0% |
| $100,000 to $149,999 | 251 | 13.9% |
| $150,000 to $199,999 | 108 | 6.0% |
| $200,000+ | 74 | 4.1% |
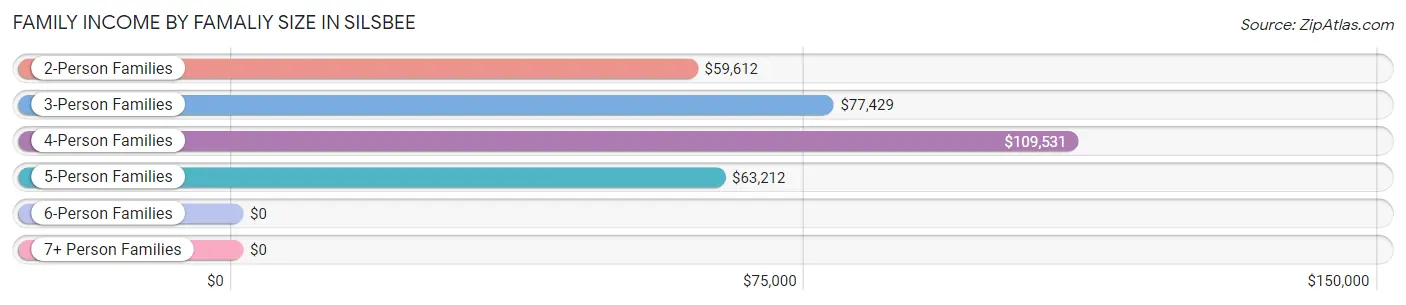
Family Income by Famaliy Size in Silsbee
4-person families (313 | 17.4%) account for the highest median family income in Silsbee with $109,531 per family, while 2-person families (869 | 48.2%) have the highest median income of $29,806 per family member.
| Income Bracket | # Families | Median Income |
| 2-Person Families | 869 (48.2%) | $59,612 |
| 3-Person Families | 314 (17.4%) | $77,429 |
| 4-Person Families | 313 (17.4%) | $109,531 |
| 5-Person Families | 243 (13.5%) | $63,212 |
| 6-Person Families | 29 (1.6%) | $0 |
| 7+ Person Families | 35 (1.9%) | $0 |
| Total | 1,803 (100.0%) | $68,750 |
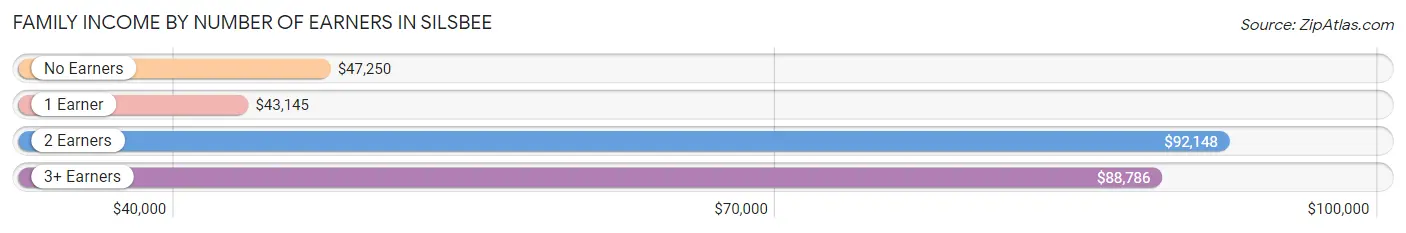
Family Income by Number of Earners in Silsbee
The median family income in Silsbee is $68,750, with families comprising 2 earners (861) having the highest median family income of $92,148, while families with 1 earner (536) have the lowest median family income of $43,145, accounting for 47.7% and 29.7% of families, respectively.
| Number of Earners | # Families | Median Income |
| No Earners | 296 (16.4%) | $47,250 |
| 1 Earner | 536 (29.7%) | $43,145 |
| 2 Earners | 861 (47.7%) | $92,148 |
| 3+ Earners | 110 (6.1%) | $88,786 |
| Total | 1,803 (100.0%) | $68,750 |
Household Income in Silsbee
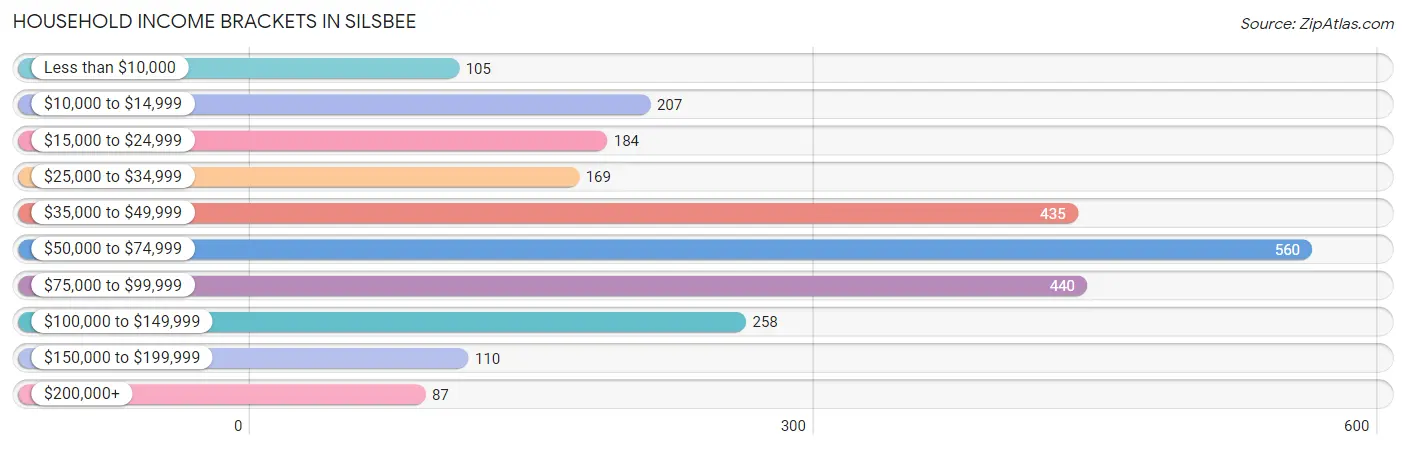
Household Income Brackets in Silsbee
With 560 households falling in the category, the $50,000 to $74,999 income range is the most frequent in Silsbee, accounting for 21.9% of all households. In contrast, only 87 households (3.4%) fall into the $200,000+ income bracket, making it the least populous group.
| Income Bracket | # Households | % Households |
| Less than $10,000 | 105 | 4.1% |
| $10,000 to $14,999 | 207 | 8.1% |
| $15,000 to $24,999 | 184 | 7.2% |
| $25,000 to $34,999 | 169 | 6.6% |
| $35,000 to $49,999 | 435 | 17.0% |
| $50,000 to $74,999 | 560 | 21.9% |
| $75,000 to $99,999 | 440 | 17.2% |
| $100,000 to $149,999 | 258 | 10.1% |
| $150,000 to $199,999 | 110 | 4.3% |
| $200,000+ | 87 | 3.4% |
Household Income by Householder Age in Silsbee
The median household income in Silsbee is $58,641, with the highest median household income of $64,091 found in the 45 to 64 years age bracket for the primary householder. A total of 776 households (30.3%) fall into this category. Meanwhile, the 15 to 24 years age bracket for the primary householder has the lowest median household income of $0, with 77 households (3.0%) in this group.
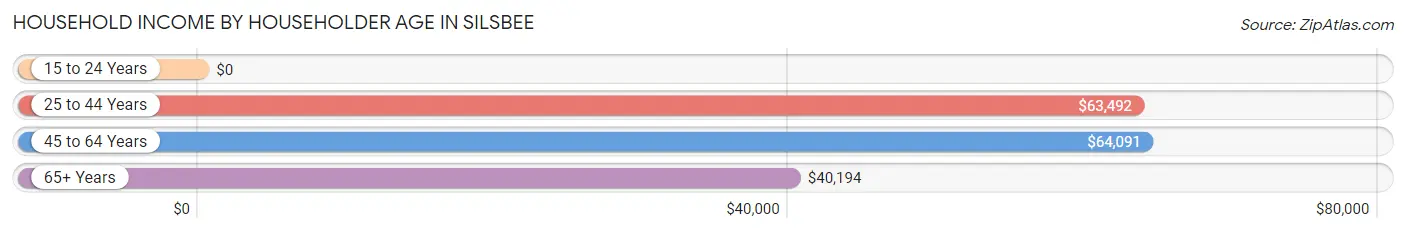
| Income Bracket | # Households | Median Income |
| 15 to 24 Years | 77 (3.0%) | $0 |
| 25 to 44 Years | 859 (33.6%) | $63,492 |
| 45 to 64 Years | 776 (30.3%) | $64,091 |
| 65+ Years | 845 (33.1%) | $40,194 |
| Total | 2,557 (100.0%) | $58,641 |
Poverty in Silsbee
Income Below Poverty by Sex and Age in Silsbee
With 9.9% poverty level for males and 13.8% for females among the residents of Silsbee, 12 to 14 year old males and 55 to 64 year old females are the most vulnerable to poverty, with 35 males (40.7%) and 110 females (19.3%) in their respective age groups living below the poverty level.
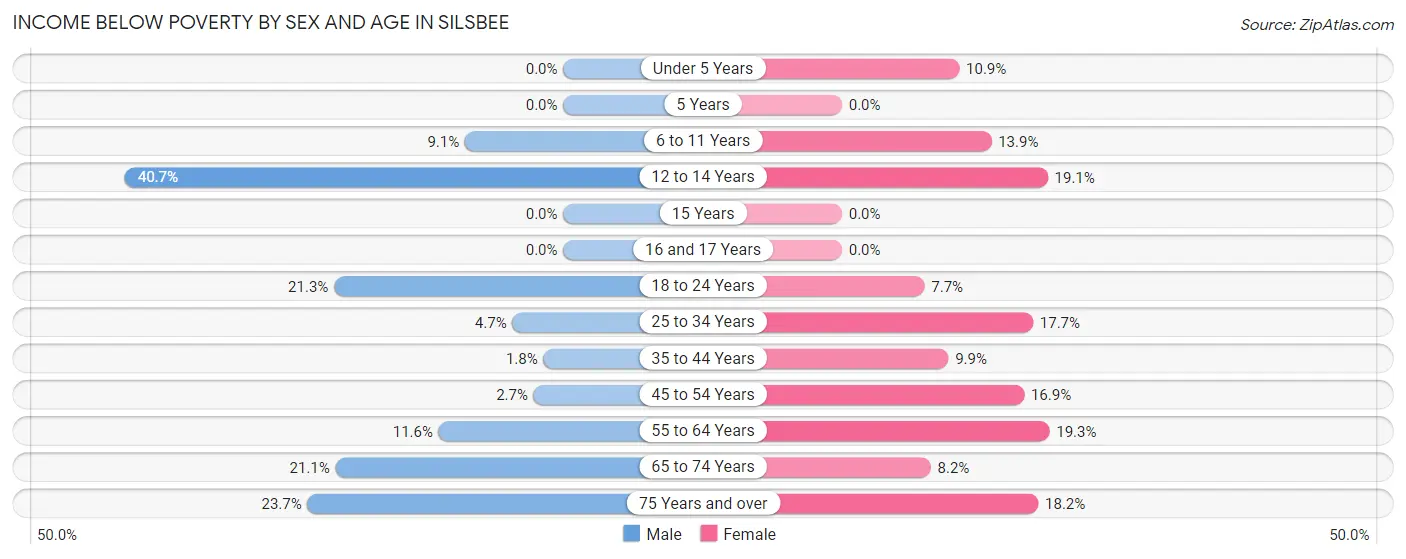
| Age Bracket | Male | Female |
| Under 5 Years | 0 (0.0%) | 39 (10.9%) |
| 5 Years | 0 (0.0%) | 0 (0.0%) |
| 6 to 11 Years | 32 (9.1%) | 33 (13.9%) |
| 12 to 14 Years | 35 (40.7%) | 64 (19.1%) |
| 15 Years | 0 (0.0%) | 0 (0.0%) |
| 16 and 17 Years | 0 (0.0%) | 0 (0.0%) |
| 18 to 24 Years | 47 (21.3%) | 17 (7.7%) |
| 25 to 34 Years | 23 (4.7%) | 72 (17.7%) |
| 35 to 44 Years | 7 (1.8%) | 48 (9.9%) |
| 45 to 54 Years | 11 (2.7%) | 47 (16.9%) |
| 55 to 64 Years | 34 (11.6%) | 110 (19.3%) |
| 65 to 74 Years | 63 (21.1%) | 38 (8.2%) |
| 75 Years and over | 33 (23.7%) | 45 (18.2%) |
| Total | 285 (9.9%) | 513 (13.8%) |
Income Above Poverty by Sex and Age in Silsbee
According to the poverty statistics in Silsbee, males aged under 5 years and females aged 15 years are the age groups that are most secure financially, with 100.0% of males and 100.0% of females in these age groups living above the poverty line.
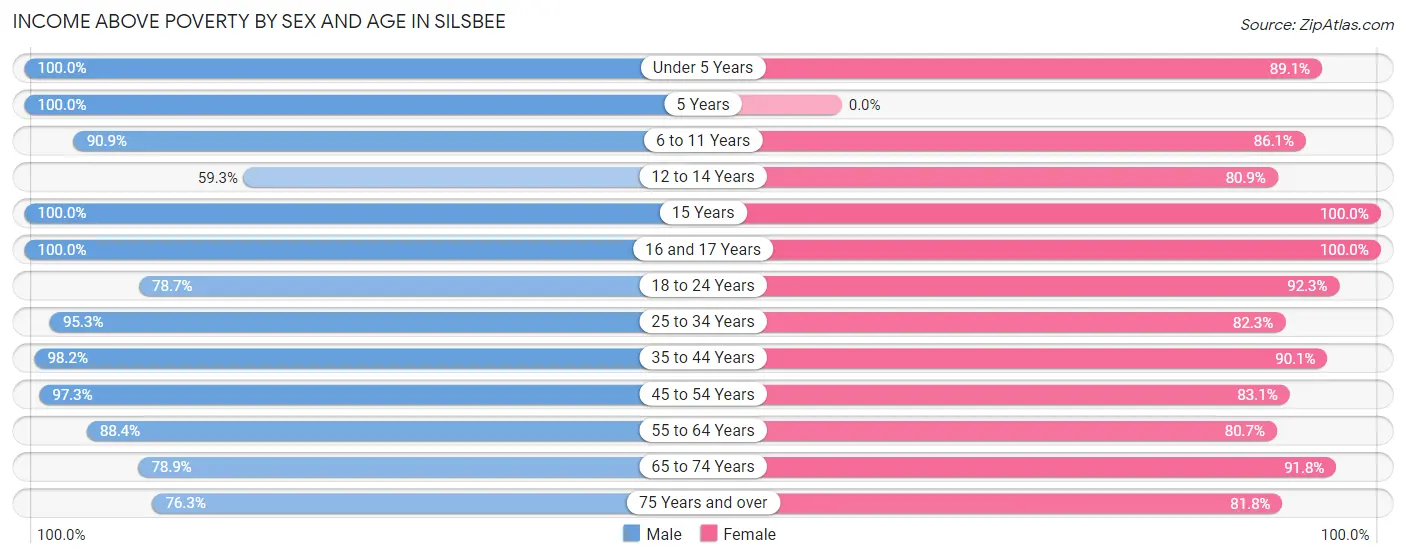
| Age Bracket | Male | Female |
| Under 5 Years | 107 (100.0%) | 319 (89.1%) |
| 5 Years | 73 (100.0%) | 0 (0.0%) |
| 6 to 11 Years | 319 (90.9%) | 205 (86.1%) |
| 12 to 14 Years | 51 (59.3%) | 271 (80.9%) |
| 15 Years | 19 (100.0%) | 69 (100.0%) |
| 16 and 17 Years | 20 (100.0%) | 60 (100.0%) |
| 18 to 24 Years | 174 (78.7%) | 205 (92.3%) |
| 25 to 34 Years | 464 (95.3%) | 334 (82.3%) |
| 35 to 44 Years | 373 (98.2%) | 438 (90.1%) |
| 45 to 54 Years | 391 (97.3%) | 231 (83.1%) |
| 55 to 64 Years | 260 (88.4%) | 461 (80.7%) |
| 65 to 74 Years | 235 (78.9%) | 423 (91.8%) |
| 75 Years and over | 106 (76.3%) | 202 (81.8%) |
| Total | 2,592 (90.1%) | 3,218 (86.3%) |
Income Below Poverty Among Married-Couple Families in Silsbee
The poverty statistics for married-couple families in Silsbee show that 5.0% or 60 of the total 1,195 families live below the poverty line. Families with no children have the highest poverty rate of 8.3%, comprising of 53 families. On the other hand, families with 3 or 4 children have the lowest poverty rate of 0.0%, which includes 0 families.
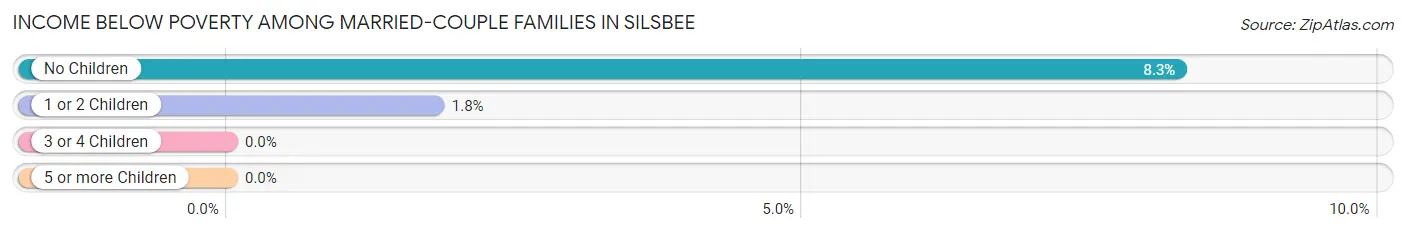
| Children | Above Poverty | Below Poverty |
| No Children | 589 (91.7%) | 53 (8.3%) |
| 1 or 2 Children | 382 (98.2%) | 7 (1.8%) |
| 3 or 4 Children | 164 (100.0%) | 0 (0.0%) |
| 5 or more Children | 0 (0.0%) | 0 (0.0%) |
| Total | 1,135 (95.0%) | 60 (5.0%) |
Income Below Poverty Among Single-Parent Households in Silsbee
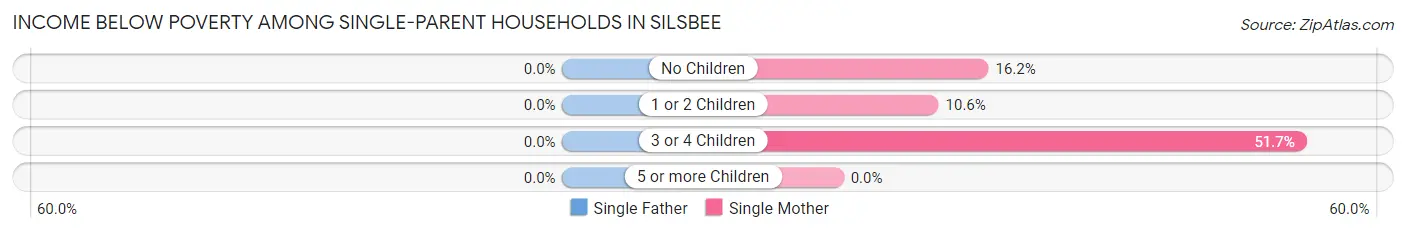
| Children | Single Father | Single Mother |
| No Children | 0 (0.0%) | 45 (16.2%) |
| 1 or 2 Children | 0 (0.0%) | 14 (10.6%) |
| 3 or 4 Children | 0 (0.0%) | 45 (51.7%) |
| 5 or more Children | 0 (0.0%) | 0 (0.0%) |
| Total | 0 (0.0%) | 104 (20.1%) |
Income Below Poverty Among Married-Couple vs Single-Parent Households in Silsbee
The poverty data for Silsbee shows that 60 of the married-couple family households (5.0%) and 104 of the single-parent households (17.1%) are living below the poverty level. Within the married-couple family households, those with no children have the highest poverty rate, with 53 households (8.3%) falling below the poverty line. Among the single-parent households, those with 3 or 4 children have the highest poverty rate, with 45 household (51.7%) living below poverty.
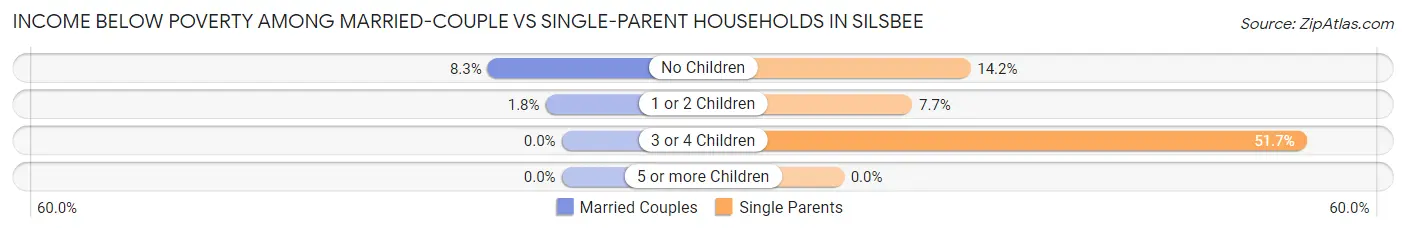
| Children | Married-Couple Families | Single-Parent Households |
| No Children | 53 (8.3%) | 45 (14.1%) |
| 1 or 2 Children | 7 (1.8%) | 14 (7.6%) |
| 3 or 4 Children | 0 (0.0%) | 45 (51.7%) |
| 5 or more Children | 0 (0.0%) | 0 (0.0%) |
| Total | 60 (5.0%) | 104 (17.1%) |
Race in Silsbee
The most populous races in Silsbee are White / Caucasian (4,265 | 61.8%), Black / African American (1,961 | 28.4%), and Hispanic or Latino (843 | 12.2%).
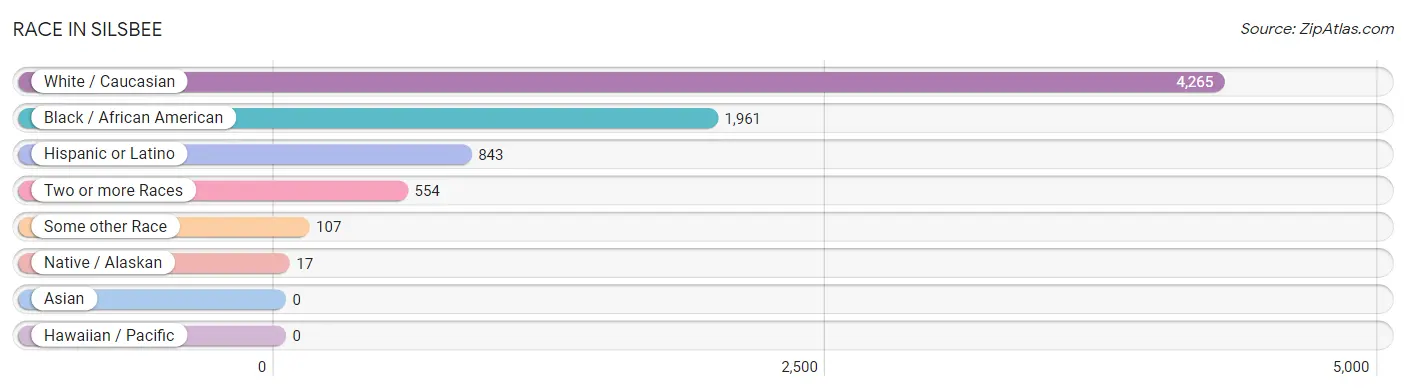
| Race | # Population | % Population |
| Asian | 0 | 0.0% |
| Black / African American | 1,961 | 28.4% |
| Hawaiian / Pacific | 0 | 0.0% |
| Hispanic or Latino | 843 | 12.2% |
| Native / Alaskan | 17 | 0.3% |
| White / Caucasian | 4,265 | 61.8% |
| Two or more Races | 554 | 8.0% |
| Some other Race | 107 | 1.5% |
| Total | 6,904 | 100.0% |
Ancestry in Silsbee
The most populous ancestries reported in Silsbee are Mexican (622 | 9.0%), English (462 | 6.7%), Irish (317 | 4.6%), German (284 | 4.1%), and European (237 | 3.4%), together accounting for 27.8% of all Silsbee residents.
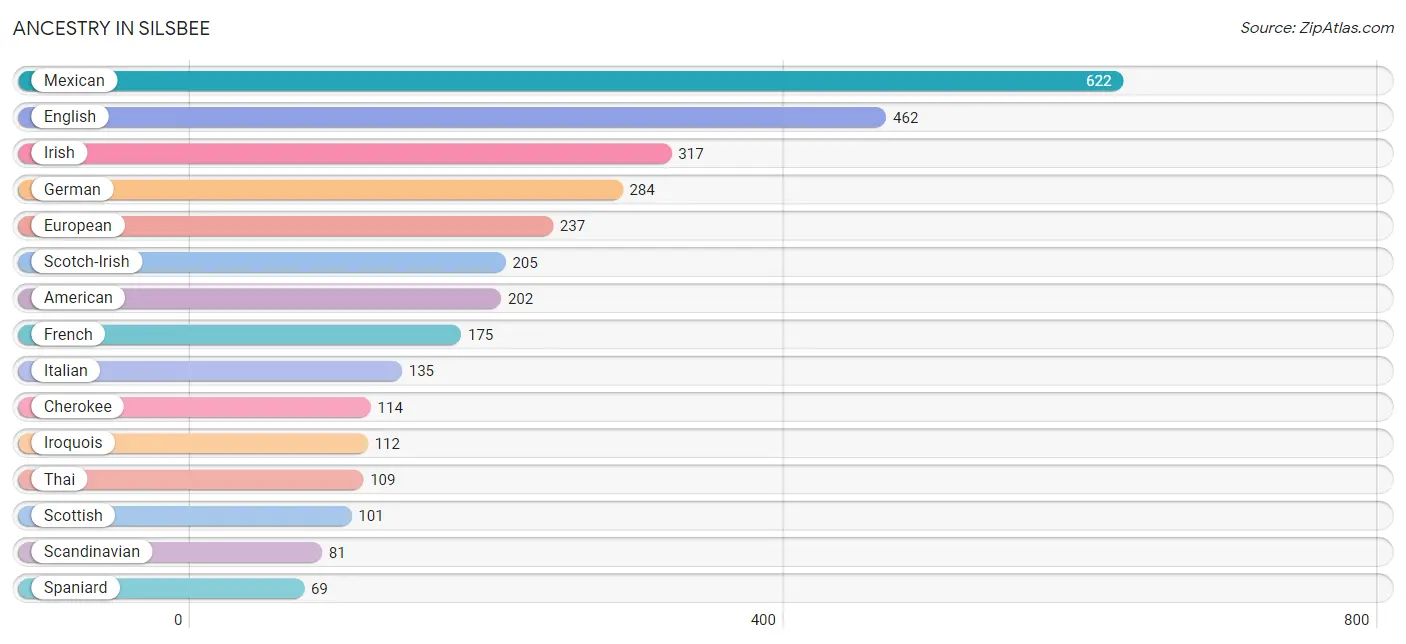
| Ancestry | # Population | % Population |
| African | 54 | 0.8% |
| American | 202 | 2.9% |
| Arab | 8 | 0.1% |
| Cajun | 21 | 0.3% |
| Central American | 24 | 0.4% |
| Cherokee | 114 | 1.7% |
| Choctaw | 14 | 0.2% |
| Czech | 8 | 0.1% |
| Dutch | 25 | 0.4% |
| English | 462 | 6.7% |
| European | 237 | 3.4% |
| Finnish | 14 | 0.2% |
| French | 175 | 2.5% |
| French Canadian | 40 | 0.6% |
| German | 284 | 4.1% |
| Greek | 9 | 0.1% |
| Irish | 317 | 4.6% |
| Iroquois | 112 | 1.6% |
| Italian | 135 | 2.0% |
| Lebanese | 8 | 0.1% |
| Mexican | 622 | 9.0% |
| Norwegian | 22 | 0.3% |
| Panamanian | 24 | 0.4% |
| Polish | 51 | 0.7% |
| Puerto Rican | 17 | 0.3% |
| Russian | 17 | 0.3% |
| Scandinavian | 81 | 1.2% |
| Scotch-Irish | 205 | 3.0% |
| Scottish | 101 | 1.5% |
| South American | 5 | 0.1% |
| Spaniard | 69 | 1.0% |
| Spanish | 45 | 0.6% |
| Sri Lankan | 23 | 0.3% |
| Subsaharan African | 54 | 0.8% |
| Thai | 109 | 1.6% |
| Venezuelan | 5 | 0.1% | View All 36 Rows |
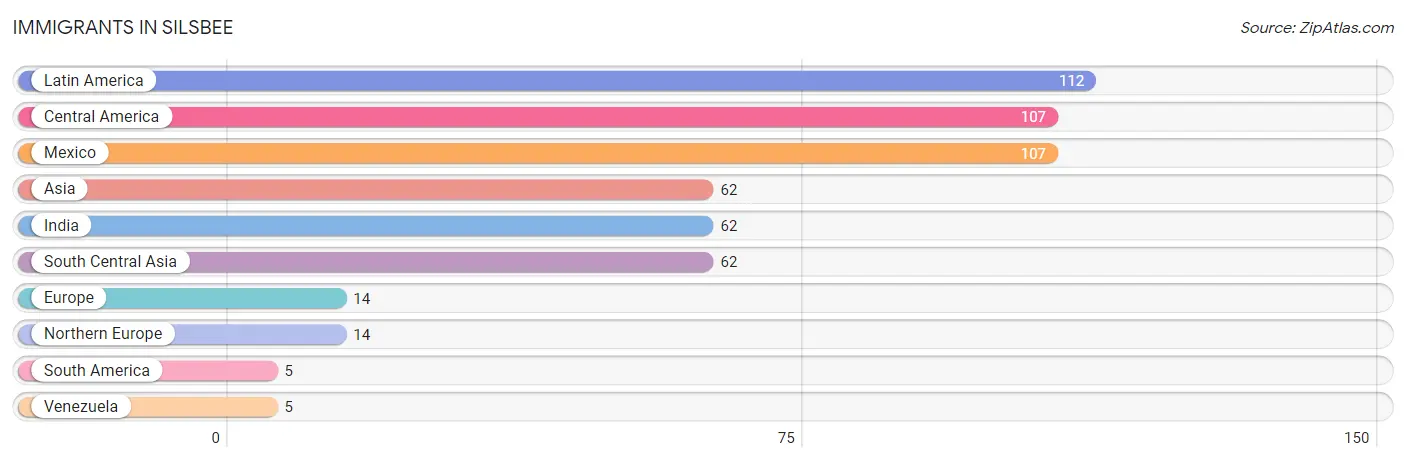
Immigrants in Silsbee
The most numerous immigrant groups reported in Silsbee came from Latin America (112 | 1.6%), Central America (107 | 1.5%), Mexico (107 | 1.5%), Asia (62 | 0.9%), and India (62 | 0.9%), together accounting for 6.5% of all Silsbee residents.
| Immigration Origin | # Population | % Population |
| Asia | 62 | 0.9% |
| Central America | 107 | 1.5% |
| Europe | 14 | 0.2% |
| India | 62 | 0.9% |
| Latin America | 112 | 1.6% |
| Mexico | 107 | 1.5% |
| Northern Europe | 14 | 0.2% |
| South America | 5 | 0.1% |
| South Central Asia | 62 | 0.9% |
| Venezuela | 5 | 0.1% | View All 10 Rows |
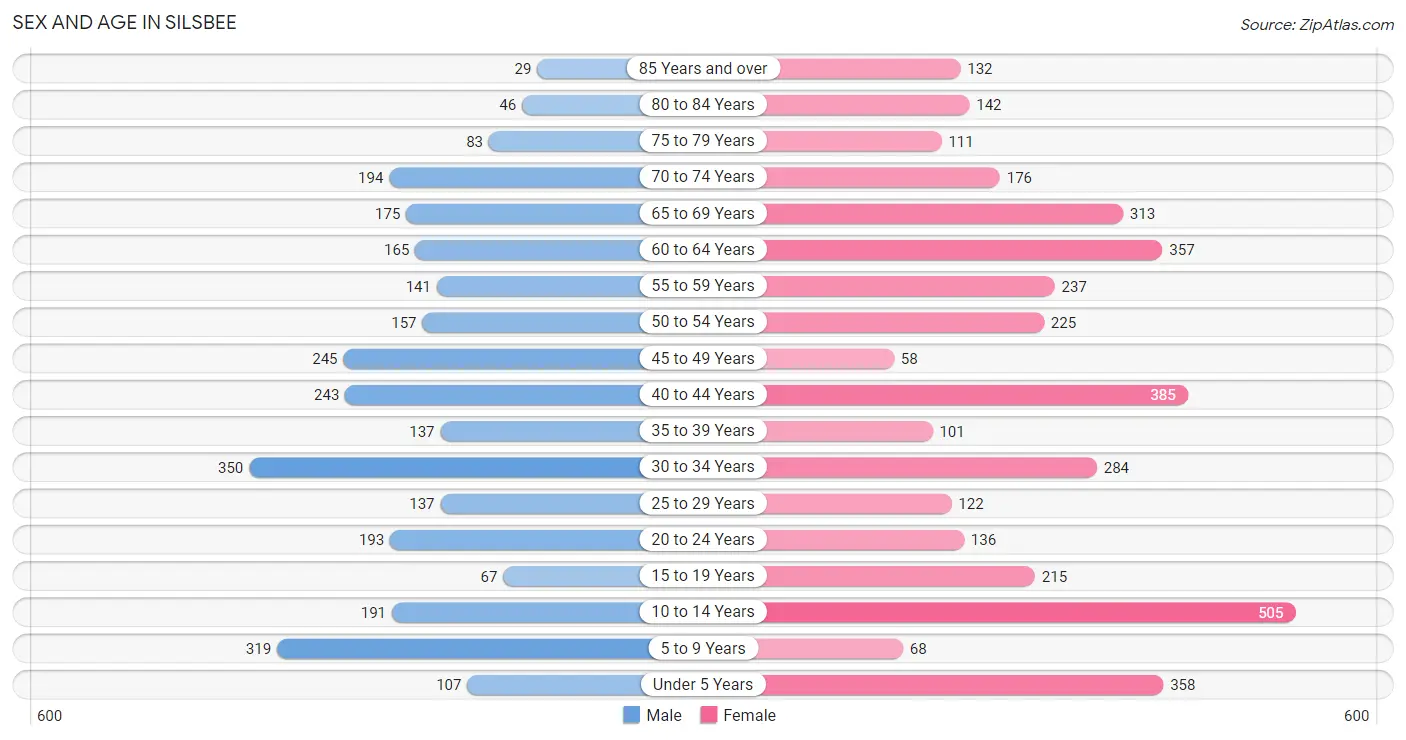
Sex and Age in Silsbee
Sex and Age in Silsbee
The most populous age groups in Silsbee are 30 to 34 Years (350 | 11.7%) for men and 10 to 14 Years (505 | 12.9%) for women.
| Age Bracket | Male | Female |
| Under 5 Years | 107 (3.6%) | 358 (9.1%) |
| 5 to 9 Years | 319 (10.7%) | 68 (1.7%) |
| 10 to 14 Years | 191 (6.4%) | 505 (12.9%) |
| 15 to 19 Years | 67 (2.2%) | 215 (5.5%) |
| 20 to 24 Years | 193 (6.5%) | 136 (3.5%) |
| 25 to 29 Years | 137 (4.6%) | 122 (3.1%) |
| 30 to 34 Years | 350 (11.7%) | 284 (7.2%) |
| 35 to 39 Years | 137 (4.6%) | 101 (2.6%) |
| 40 to 44 Years | 243 (8.2%) | 385 (9.8%) |
| 45 to 49 Years | 245 (8.2%) | 58 (1.5%) |
| 50 to 54 Years | 157 (5.3%) | 225 (5.7%) |
| 55 to 59 Years | 141 (4.7%) | 237 (6.0%) |
| 60 to 64 Years | 165 (5.5%) | 357 (9.1%) |
| 65 to 69 Years | 175 (5.9%) | 313 (8.0%) |
| 70 to 74 Years | 194 (6.5%) | 176 (4.5%) |
| 75 to 79 Years | 83 (2.8%) | 111 (2.8%) |
| 80 to 84 Years | 46 (1.5%) | 142 (3.6%) |
| 85 Years and over | 29 (1.0%) | 132 (3.4%) |
| Total | 2,979 (100.0%) | 3,925 (100.0%) |
Families and Households in Silsbee
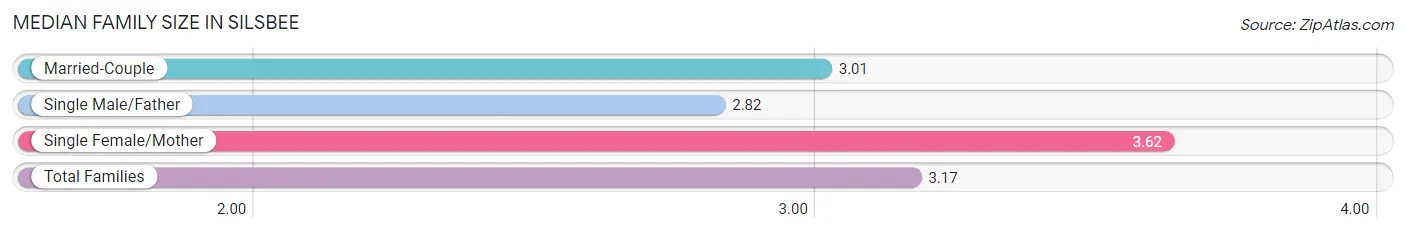
Median Family Size in Silsbee
The median family size in Silsbee is 3.17 persons per family, with single female/mother families (517 | 28.7%) accounting for the largest median family size of 3.62 persons per family. On the other hand, single male/father families (91 | 5.1%) represent the smallest median family size with 2.82 persons per family.
| Family Type | # Families | Family Size |
| Married-Couple | 1,195 (66.3%) | 3.01 |
| Single Male/Father | 91 (5.1%) | 2.82 |
| Single Female/Mother | 517 (28.7%) | 3.62 |
| Total Families | 1,803 (100.0%) | 3.17 |
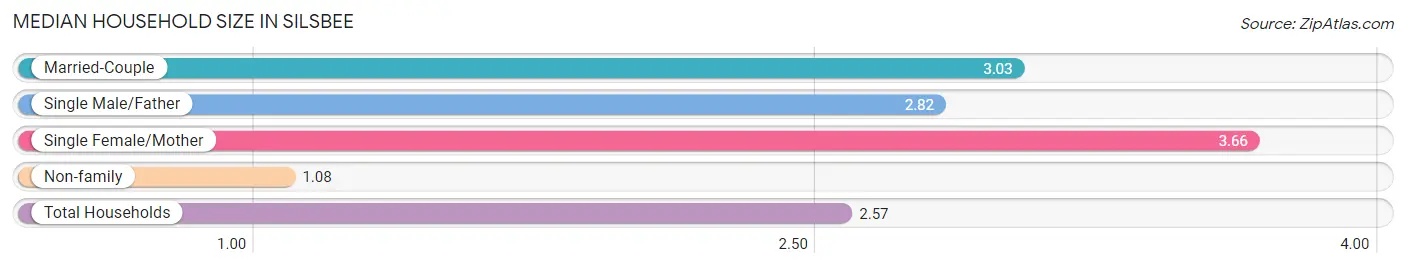
Median Household Size in Silsbee
The median household size in Silsbee is 2.57 persons per household, with single female/mother households (517 | 20.2%) accounting for the largest median household size of 3.66 persons per household. non-family households (754 | 29.5%) represent the smallest median household size with 1.08 persons per household.
| Household Type | # Households | Household Size |
| Married-Couple | 1,195 (46.7%) | 3.03 |
| Single Male/Father | 91 (3.6%) | 2.82 |
| Single Female/Mother | 517 (20.2%) | 3.66 |
| Non-family | 754 (29.5%) | 1.08 |
| Total Households | 2,557 (100.0%) | 2.57 |
Household Size by Marriage Status in Silsbee
Out of a total of 2,557 households in Silsbee, 1,803 (70.5%) are family households, while 754 (29.5%) are nonfamily households. The most numerous type of family households are 2-person households, comprising 869, and the most common type of nonfamily households are 1-person households, comprising 708.
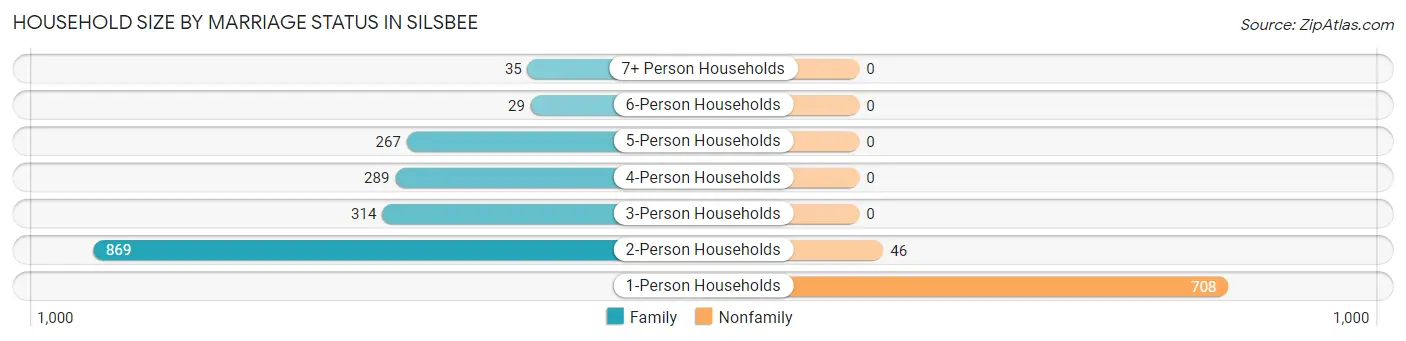
| Household Size | Family Households | Nonfamily Households |
| 1-Person Households | - | 708 (27.7%) |
| 2-Person Households | 869 (34.0%) | 46 (1.8%) |
| 3-Person Households | 314 (12.3%) | 0 (0.0%) |
| 4-Person Households | 289 (11.3%) | 0 (0.0%) |
| 5-Person Households | 267 (10.4%) | 0 (0.0%) |
| 6-Person Households | 29 (1.1%) | 0 (0.0%) |
| 7+ Person Households | 35 (1.4%) | 0 (0.0%) |
| Total | 1,803 (70.5%) | 754 (29.5%) |
Female Fertility in Silsbee
Fertility by Age in Silsbee
Average fertility rate in Silsbee is 134.0 births per 1,000 women. Women in the age bracket of 20 to 34 years have the highest fertility rate with 188.0 births per 1,000 women. Women in the age bracket of 20 to 34 years acount for 56.4% of all women with births.
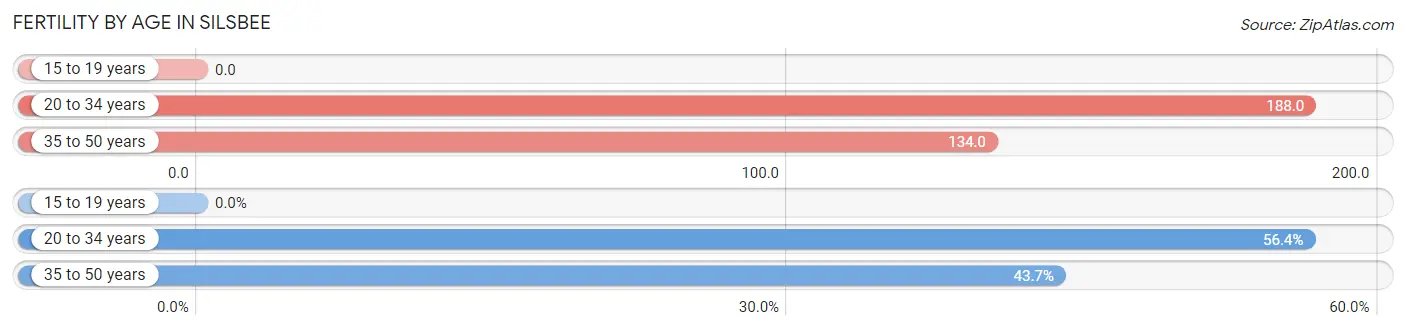
| Age Bracket | Women with Births | Births / 1,000 Women |
| 15 to 19 years | 0 (0.0%) | 0.0 |
| 20 to 34 years | 102 (56.4%) | 188.0 |
| 35 to 50 years | 79 (43.6%) | 134.0 |
| Total | 181 (100.0%) | 134.0 |
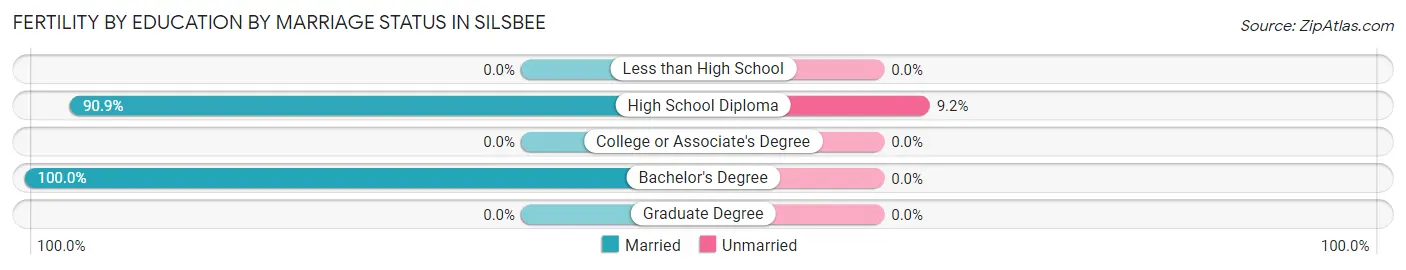
Fertility by Age by Marriage Status in Silsbee
91.7% of women with births (181) in Silsbee are married. The highest percentage of unmarried women with births falls into 20 to 34 years age bracket with 14.7% of them unmarried at the time of birth, while the lowest percentage of unmarried women with births belong to 35 to 50 years age bracket with 0.0% of them unmarried.
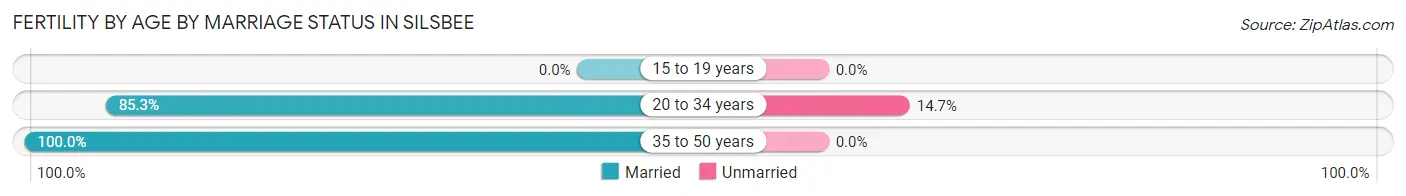
| Age Bracket | Married | Unmarried |
| 15 to 19 years | 0 (0.0%) | 0 (0.0%) |
| 20 to 34 years | 87 (85.3%) | 15 (14.7%) |
| 35 to 50 years | 79 (100.0%) | 0 (0.0%) |
| Total | 166 (91.7%) | 15 (8.3%) |
Fertility by Education in Silsbee
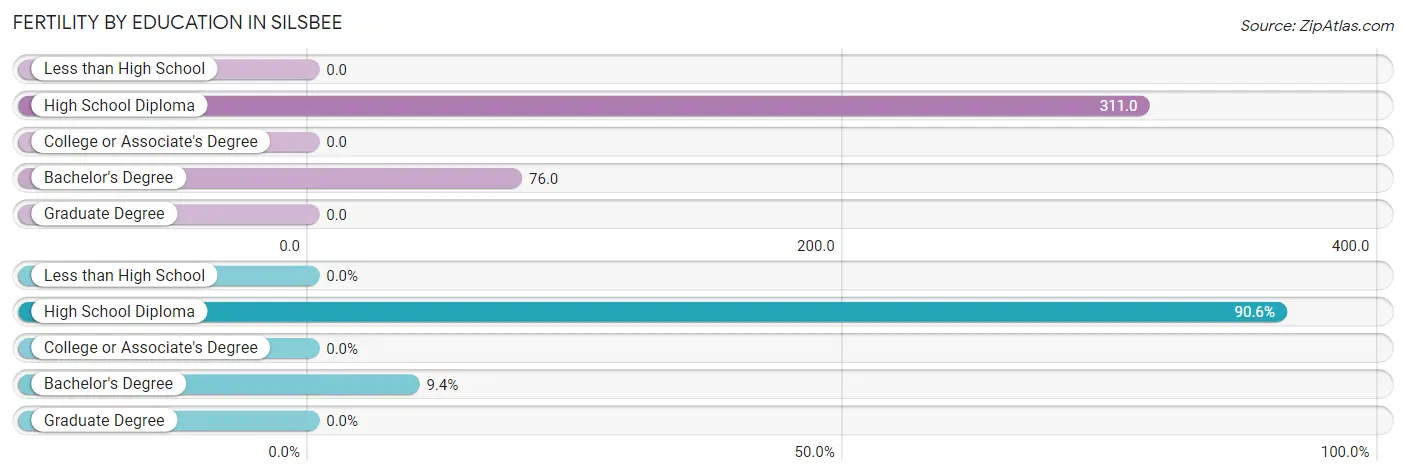
| Educational Attainment | Women with Births | Births / 1,000 Women |
| Less than High School | 0 (0.0%) | 0.0 |
| High School Diploma | 164 (90.6%) | 311.0 |
| College or Associate's Degree | 0 (0.0%) | 0.0 |
| Bachelor's Degree | 17 (9.4%) | 76.0 |
| Graduate Degree | 0 (0.0%) | 0.0 |
| Total | 181 (100.0%) | 134.0 |
Fertility by Education by Marriage Status in Silsbee
8.3% of women with births in Silsbee are unmarried. Women with the educational attainment of bachelor's degree are most likely to be married with 100.0% of them married at childbirth, while women with the educational attainment of high school diploma are least likely to be married with 9.1% of them unmarried at childbirth.
| Educational Attainment | Married | Unmarried |
| Less than High School | 0 (0.0%) | 0 (0.0%) |
| High School Diploma | 149 (90.8%) | 15 (9.1%) |
| College or Associate's Degree | 0 (0.0%) | 0 (0.0%) |
| Bachelor's Degree | 17 (100.0%) | 0 (0.0%) |
| Graduate Degree | 0 (0.0%) | 0 (0.0%) |
| Total | 166 (91.7%) | 15 (8.3%) |
Employment Characteristics in Silsbee
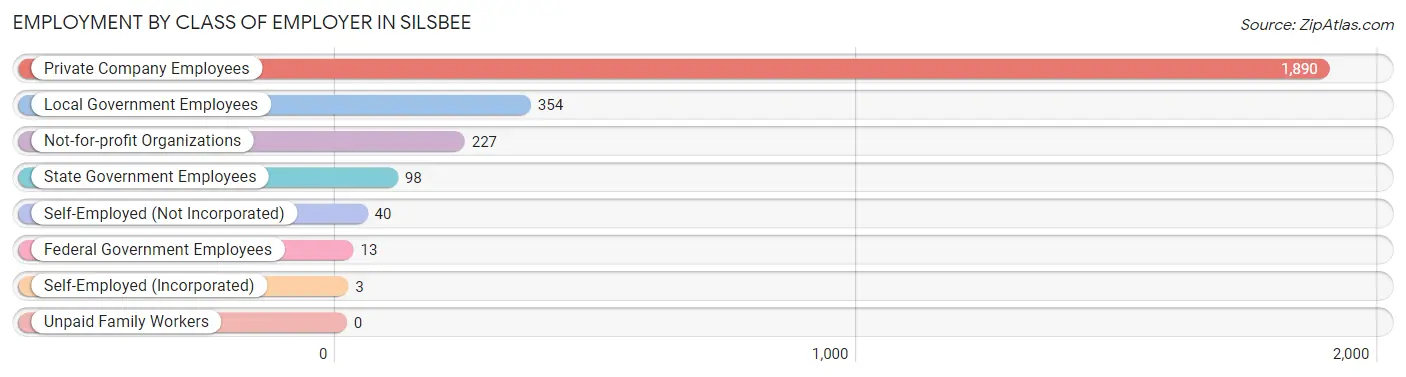
Employment by Class of Employer in Silsbee
Among the 2,625 employed individuals in Silsbee, private company employees (1,890 | 72.0%), local government employees (354 | 13.5%), and not-for-profit organizations (227 | 8.6%) make up the most common classes of employment.
| Employer Class | # Employees | % Employees |
| Private Company Employees | 1,890 | 72.0% |
| Self-Employed (Incorporated) | 3 | 0.1% |
| Self-Employed (Not Incorporated) | 40 | 1.5% |
| Not-for-profit Organizations | 227 | 8.6% |
| Local Government Employees | 354 | 13.5% |
| State Government Employees | 98 | 3.7% |
| Federal Government Employees | 13 | 0.5% |
| Unpaid Family Workers | 0 | 0.0% |
| Total | 2,625 | 100.0% |
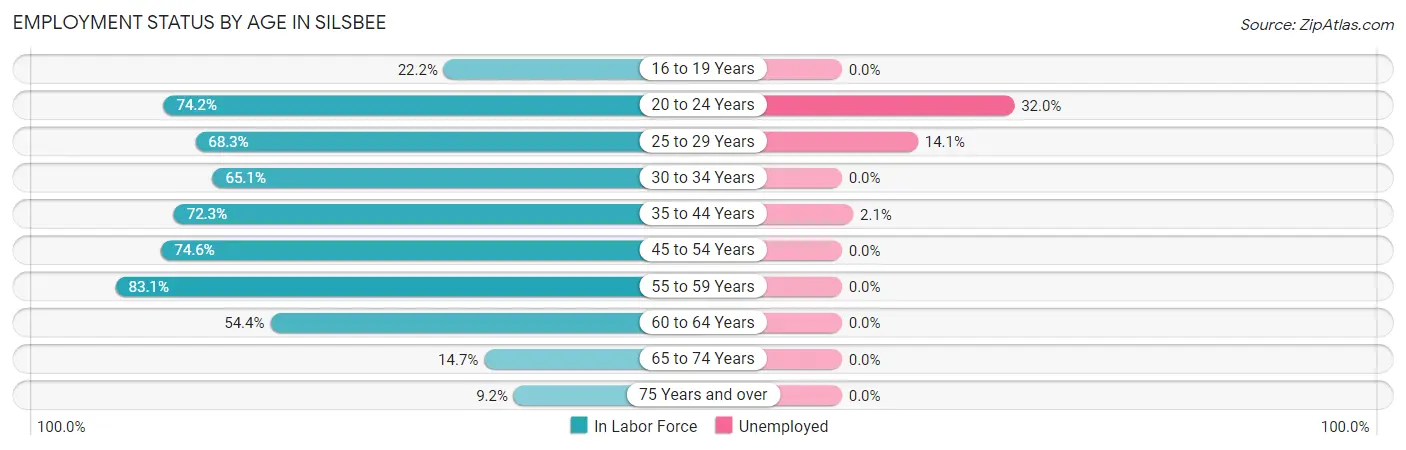
Employment Status by Age in Silsbee
According to the labor force statistics for Silsbee, out of the total population over 16 years of age (5,268), 52.9% or 2,787 individuals are in the labor force, with 4.2% or 117 of them unemployed. The age group with the highest labor force participation rate is 55 to 59 years, with 83.1% or 314 individuals in the labor force. Within the labor force, the 20 to 24 years age range has the highest percentage of unemployed individuals, with 32.0% or 78 of them being unemployed.
| Age Bracket | In Labor Force | Unemployed |
| 16 to 19 Years | 43 (22.2%) | 0 (0.0%) |
| 20 to 24 Years | 244 (74.2%) | 78 (32.0%) |
| 25 to 29 Years | 177 (68.3%) | 25 (14.1%) |
| 30 to 34 Years | 413 (65.1%) | 0 (0.0%) |
| 35 to 44 Years | 626 (72.3%) | 13 (2.1%) |
| 45 to 54 Years | 511 (74.6%) | 0 (0.0%) |
| 55 to 59 Years | 314 (83.1%) | 0 (0.0%) |
| 60 to 64 Years | 284 (54.4%) | 0 (0.0%) |
| 65 to 74 Years | 126 (14.7%) | 0 (0.0%) |
| 75 Years and over | 50 (9.2%) | 0 (0.0%) |
| Total | 2,787 (52.9%) | 117 (4.2%) |
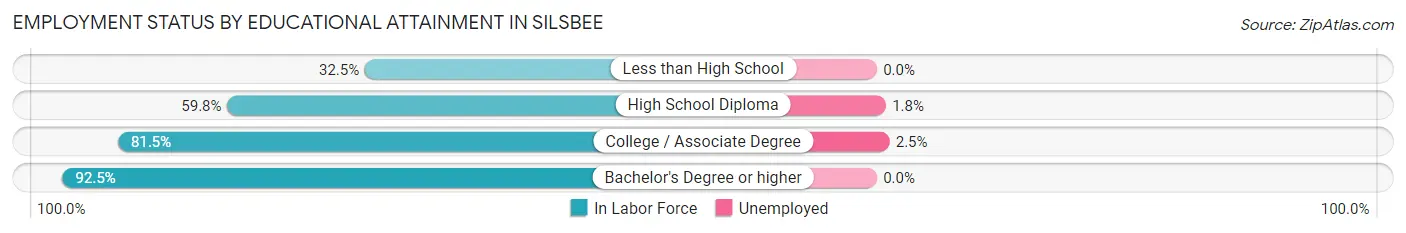
Employment Status by Educational Attainment in Silsbee
According to labor force statistics for Silsbee, 69.5% of individuals (2,324) out of the total population between 25 and 64 years of age (3,344) are in the labor force, with 1.6% or 37 of them being unemployed. The group with the highest labor force participation rate are those with the educational attainment of bachelor's degree or higher, with 92.5% or 459 individuals in the labor force. Within the labor force, individuals with college / associate degree education have the highest percentage of unemployment, with 2.5% or 25 of them being unemployed.
| Educational Attainment | In Labor Force | Unemployed |
| Less than High School | 127 (32.5%) | 0 (0.0%) |
| High School Diploma | 727 (59.8%) | 22 (1.8%) |
| College / Associate Degree | 1,011 (81.5%) | 31 (2.5%) |
| Bachelor's Degree or higher | 459 (92.5%) | 0 (0.0%) |
| Total | 2,324 (69.5%) | 54 (1.6%) |
Employment Occupations by Sex in Silsbee
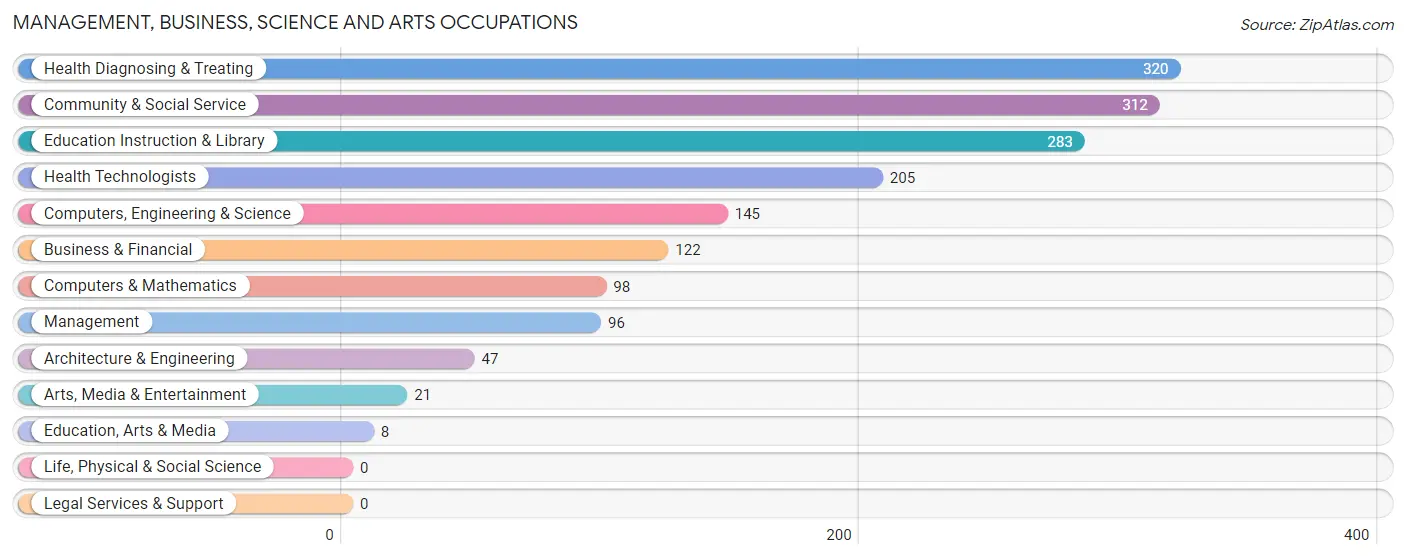
Management, Business, Science and Arts Occupations
The most common Management, Business, Science and Arts occupations in Silsbee are Health Diagnosing & Treating (320 | 12.0%), Community & Social Service (312 | 11.7%), Education Instruction & Library (283 | 10.6%), Health Technologists (205 | 7.7%), and Computers, Engineering & Science (145 | 5.4%).
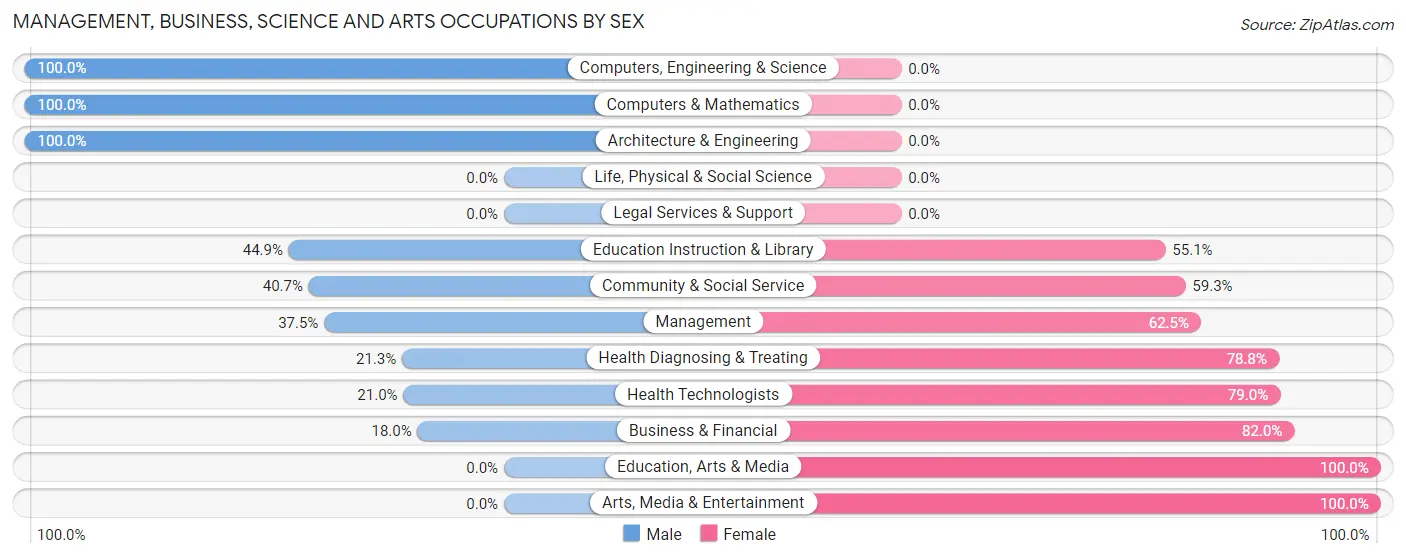
Management, Business, Science and Arts Occupations by Sex
Within the Management, Business, Science and Arts occupations in Silsbee, the most male-oriented occupations are Computers, Engineering & Science (100.0%), Computers & Mathematics (100.0%), and Architecture & Engineering (100.0%), while the most female-oriented occupations are Education, Arts & Media (100.0%), Arts, Media & Entertainment (100.0%), and Business & Financial (82.0%).
| Occupation | Male | Female |
| Management | 36 (37.5%) | 60 (62.5%) |
| Business & Financial | 22 (18.0%) | 100 (82.0%) |
| Computers, Engineering & Science | 145 (100.0%) | 0 (0.0%) |
| Computers & Mathematics | 98 (100.0%) | 0 (0.0%) |
| Architecture & Engineering | 47 (100.0%) | 0 (0.0%) |
| Life, Physical & Social Science | 0 (0.0%) | 0 (0.0%) |
| Community & Social Service | 127 (40.7%) | 185 (59.3%) |
| Education, Arts & Media | 0 (0.0%) | 8 (100.0%) |
| Legal Services & Support | 0 (0.0%) | 0 (0.0%) |
| Education Instruction & Library | 127 (44.9%) | 156 (55.1%) |
| Arts, Media & Entertainment | 0 (0.0%) | 21 (100.0%) |
| Health Diagnosing & Treating | 68 (21.2%) | 252 (78.7%) |
| Health Technologists | 43 (21.0%) | 162 (79.0%) |
| Total (Category) | 398 (40.0%) | 597 (60.0%) |
| Total (Overall) | 1,458 (54.6%) | 1,214 (45.4%) |
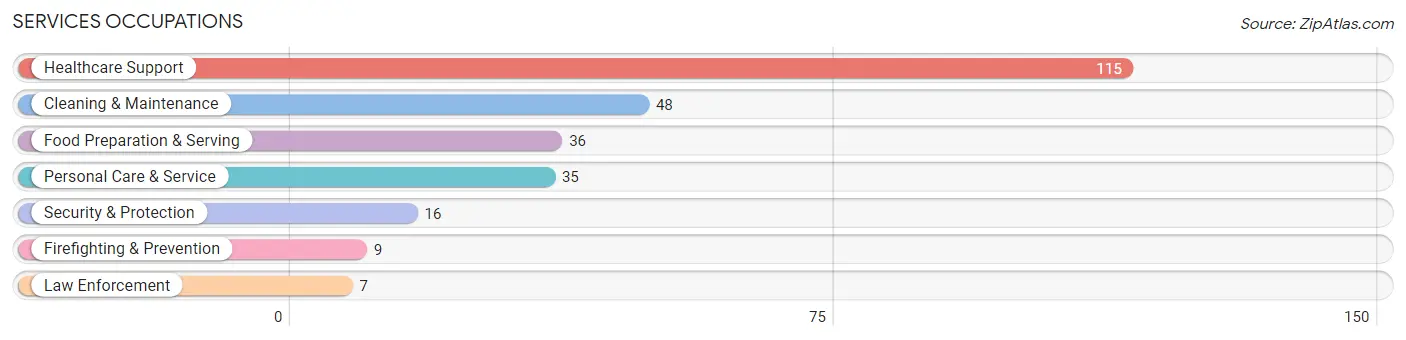
Services Occupations
The most common Services occupations in Silsbee are Healthcare Support (115 | 4.3%), Cleaning & Maintenance (48 | 1.8%), Food Preparation & Serving (36 | 1.3%), Personal Care & Service (35 | 1.3%), and Security & Protection (16 | 0.6%).
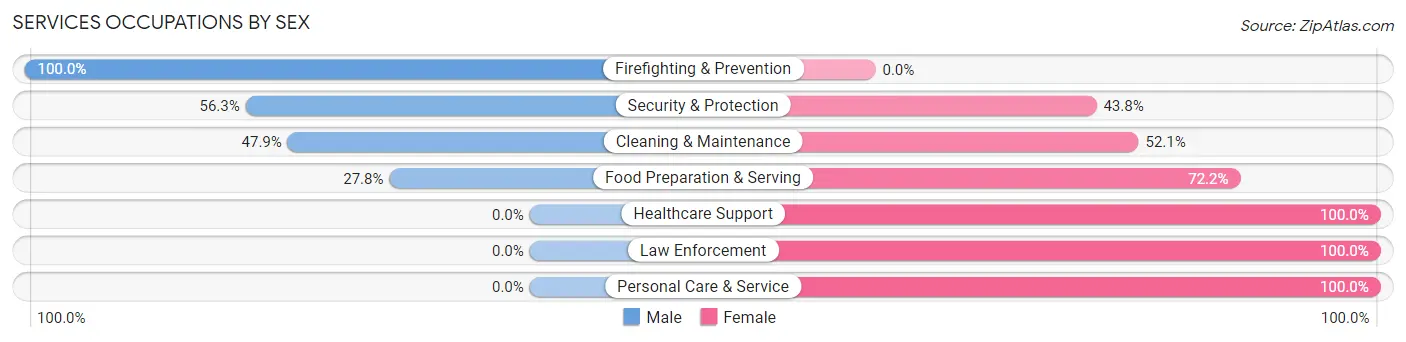
Services Occupations by Sex
Within the Services occupations in Silsbee, the most male-oriented occupations are Firefighting & Prevention (100.0%), Security & Protection (56.2%), and Cleaning & Maintenance (47.9%), while the most female-oriented occupations are Healthcare Support (100.0%), Law Enforcement (100.0%), and Personal Care & Service (100.0%).
| Occupation | Male | Female |
| Healthcare Support | 0 (0.0%) | 115 (100.0%) |
| Security & Protection | 9 (56.2%) | 7 (43.8%) |
| Firefighting & Prevention | 9 (100.0%) | 0 (0.0%) |
| Law Enforcement | 0 (0.0%) | 7 (100.0%) |
| Food Preparation & Serving | 10 (27.8%) | 26 (72.2%) |
| Cleaning & Maintenance | 23 (47.9%) | 25 (52.1%) |
| Personal Care & Service | 0 (0.0%) | 35 (100.0%) |
| Total (Category) | 42 (16.8%) | 208 (83.2%) |
| Total (Overall) | 1,458 (54.6%) | 1,214 (45.4%) |
Sales and Office Occupations
The most common Sales and Office occupations in Silsbee are Sales & Related (329 | 12.3%), and Office & Administration (193 | 7.2%).

Sales and Office Occupations by Sex
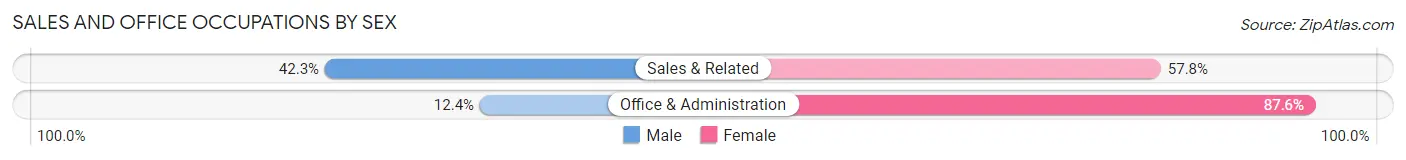
| Occupation | Male | Female |
| Sales & Related | 139 (42.2%) | 190 (57.8%) |
| Office & Administration | 24 (12.4%) | 169 (87.6%) |
| Total (Category) | 163 (31.2%) | 359 (68.8%) |
| Total (Overall) | 1,458 (54.6%) | 1,214 (45.4%) |
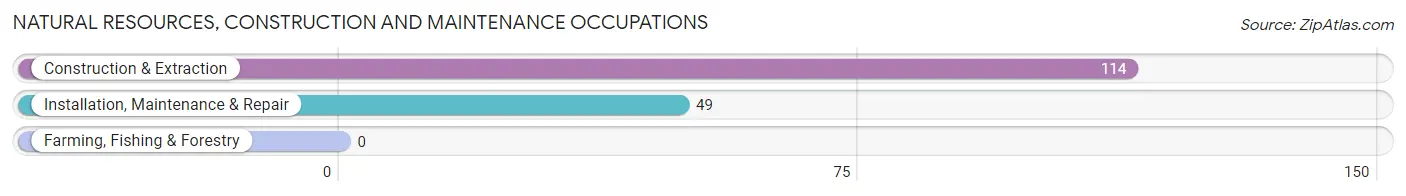
Natural Resources, Construction and Maintenance Occupations
The most common Natural Resources, Construction and Maintenance occupations in Silsbee are Construction & Extraction (114 | 4.3%), and Installation, Maintenance & Repair (49 | 1.8%).
Natural Resources, Construction and Maintenance Occupations by Sex
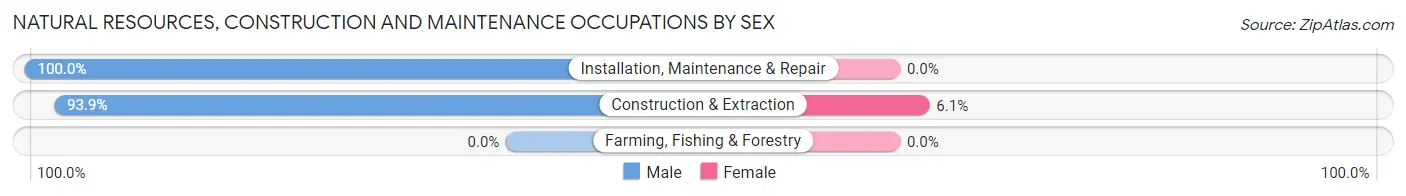
| Occupation | Male | Female |
| Farming, Fishing & Forestry | 0 (0.0%) | 0 (0.0%) |
| Construction & Extraction | 107 (93.9%) | 7 (6.1%) |
| Installation, Maintenance & Repair | 49 (100.0%) | 0 (0.0%) |
| Total (Category) | 156 (95.7%) | 7 (4.3%) |
| Total (Overall) | 1,458 (54.6%) | 1,214 (45.4%) |
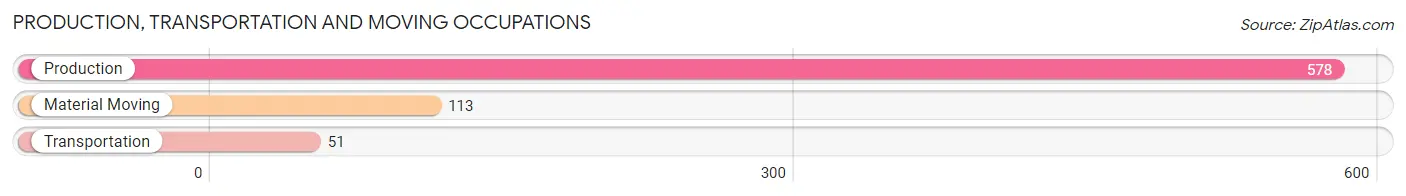
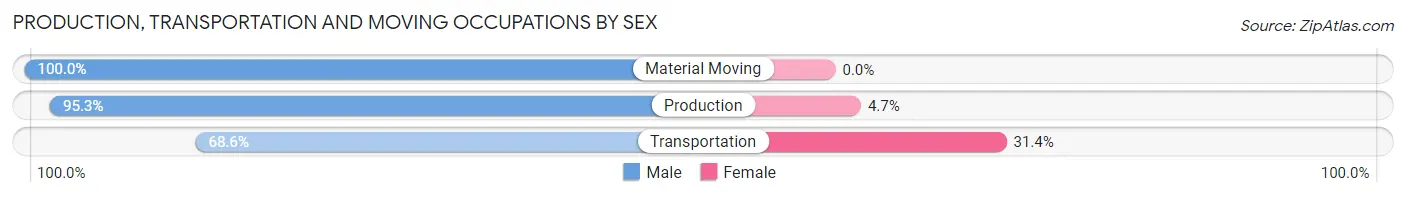
Production, Transportation and Moving Occupations
The most common Production, Transportation and Moving occupations in Silsbee are Production (578 | 21.6%), Material Moving (113 | 4.2%), and Transportation (51 | 1.9%).
Production, Transportation and Moving Occupations by Sex
| Occupation | Male | Female |
| Production | 551 (95.3%) | 27 (4.7%) |
| Transportation | 35 (68.6%) | 16 (31.4%) |
| Material Moving | 113 (100.0%) | 0 (0.0%) |
| Total (Category) | 699 (94.2%) | 43 (5.8%) |
| Total (Overall) | 1,458 (54.6%) | 1,214 (45.4%) |
Employment Industries by Sex in Silsbee
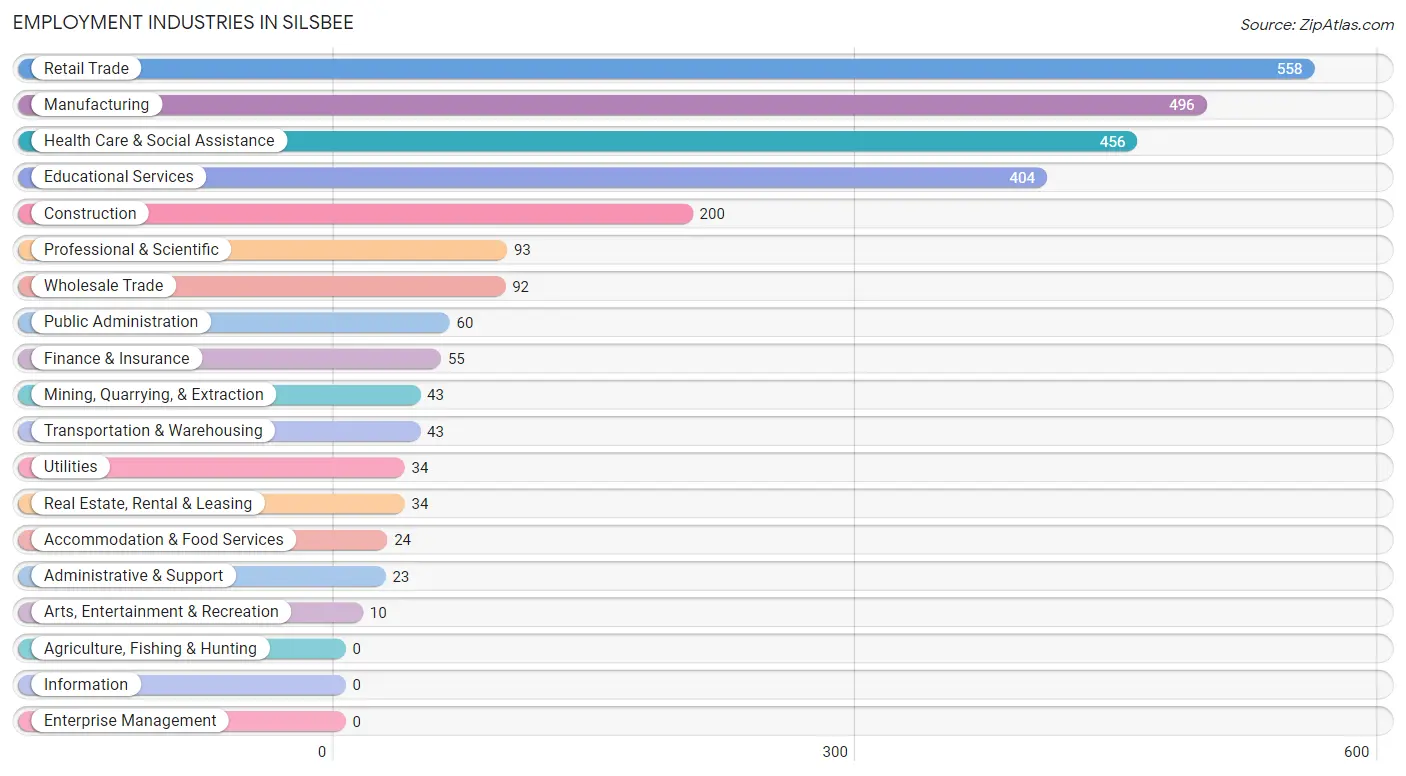
Employment Industries in Silsbee
The major employment industries in Silsbee include Retail Trade (558 | 20.9%), Manufacturing (496 | 18.6%), Health Care & Social Assistance (456 | 17.1%), Educational Services (404 | 15.1%), and Construction (200 | 7.5%).
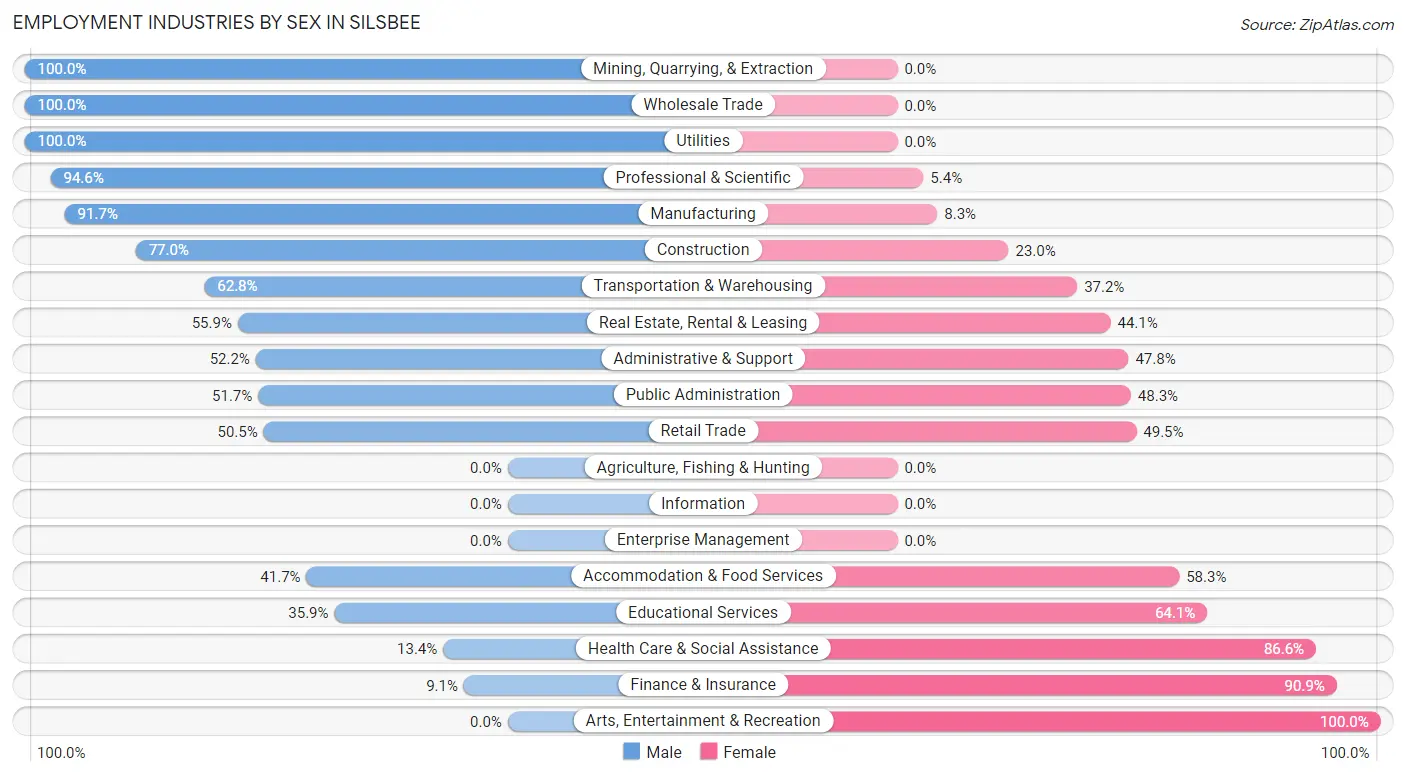
Employment Industries by Sex in Silsbee
The Silsbee industries that see more men than women are Mining, Quarrying, & Extraction (100.0%), Wholesale Trade (100.0%), and Utilities (100.0%), whereas the industries that tend to have a higher number of women are Arts, Entertainment & Recreation (100.0%), Finance & Insurance (90.9%), and Health Care & Social Assistance (86.6%).
| Industry | Male | Female |
| Agriculture, Fishing & Hunting | 0 (0.0%) | 0 (0.0%) |
| Mining, Quarrying, & Extraction | 43 (100.0%) | 0 (0.0%) |
| Construction | 154 (77.0%) | 46 (23.0%) |
| Manufacturing | 455 (91.7%) | 41 (8.3%) |
| Wholesale Trade | 92 (100.0%) | 0 (0.0%) |
| Retail Trade | 282 (50.5%) | 276 (49.5%) |
| Transportation & Warehousing | 27 (62.8%) | 16 (37.2%) |
| Utilities | 34 (100.0%) | 0 (0.0%) |
| Information | 0 (0.0%) | 0 (0.0%) |
| Finance & Insurance | 5 (9.1%) | 50 (90.9%) |
| Real Estate, Rental & Leasing | 19 (55.9%) | 15 (44.1%) |
| Professional & Scientific | 88 (94.6%) | 5 (5.4%) |
| Enterprise Management | 0 (0.0%) | 0 (0.0%) |
| Administrative & Support | 12 (52.2%) | 11 (47.8%) |
| Educational Services | 145 (35.9%) | 259 (64.1%) |
| Health Care & Social Assistance | 61 (13.4%) | 395 (86.6%) |
| Arts, Entertainment & Recreation | 0 (0.0%) | 10 (100.0%) |
| Accommodation & Food Services | 10 (41.7%) | 14 (58.3%) |
| Public Administration | 31 (51.7%) | 29 (48.3%) |
| Total | 1,458 (54.6%) | 1,214 (45.4%) |
Education in Silsbee
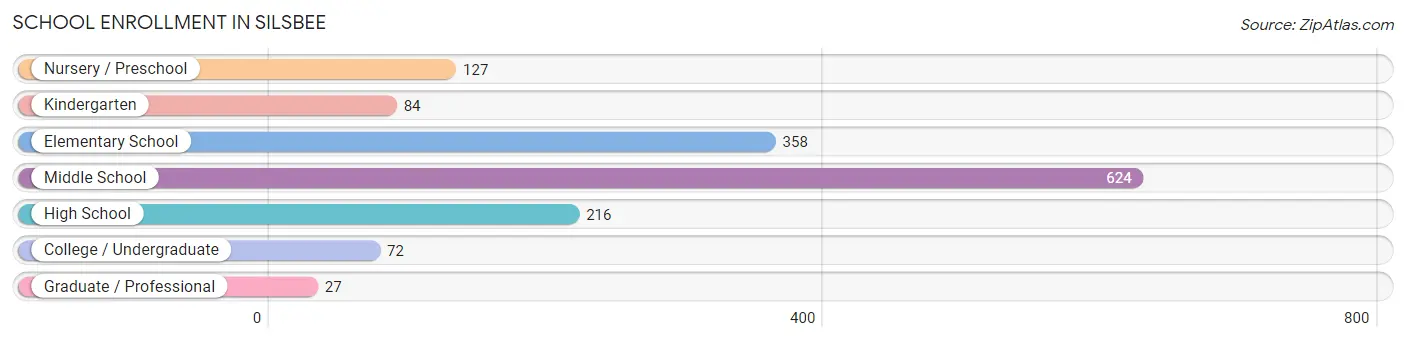
School Enrollment in Silsbee
The most common levels of schooling among the 1,508 students in Silsbee are middle school (624 | 41.4%), elementary school (358 | 23.7%), and high school (216 | 14.3%).
| School Level | # Students | % Students |
| Nursery / Preschool | 127 | 8.4% |
| Kindergarten | 84 | 5.6% |
| Elementary School | 358 | 23.7% |
| Middle School | 624 | 41.4% |
| High School | 216 | 14.3% |
| College / Undergraduate | 72 | 4.8% |
| Graduate / Professional | 27 | 1.8% |
| Total | 1,508 | 100.0% |
School Enrollment by Age by Funding Source in Silsbee
Out of a total of 1,508 students who are enrolled in schools in Silsbee, 149 (9.9%) attend a private institution, while the remaining 1,359 (90.1%) are enrolled in public schools. The age group of 35 years and over has the highest likelihood of being enrolled in private schools, with 25 (100.0% in the age bracket) enrolled. Conversely, the age group of 15 to 17 year olds has the lowest likelihood of being enrolled in a private school, with 168 (100.0% in the age bracket) attending a public institution.
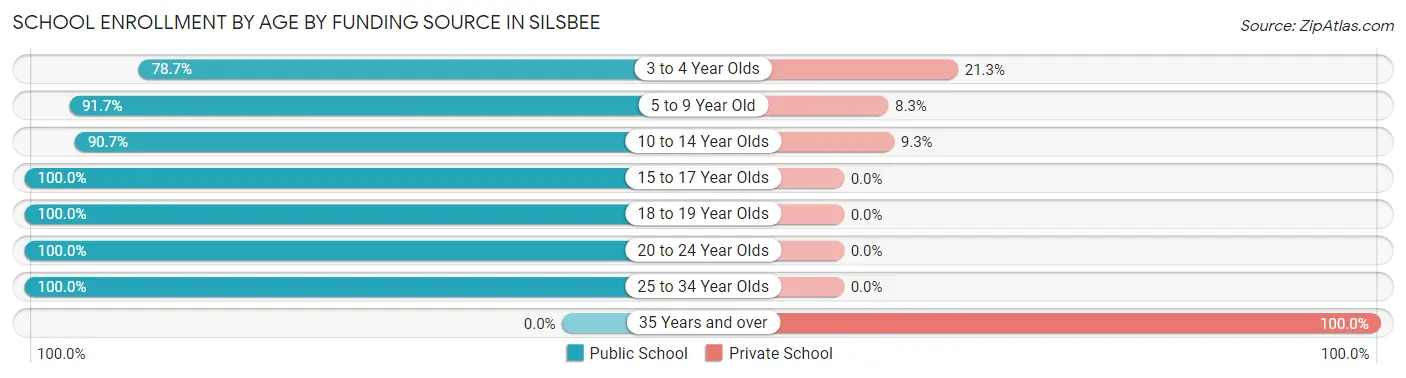
| Age Bracket | Public School | Private School |
| 3 to 4 Year Olds | 100 (78.7%) | 27 (21.3%) |
| 5 to 9 Year Old | 355 (91.7%) | 32 (8.3%) |
| 10 to 14 Year Olds | 631 (90.7%) | 65 (9.3%) |
| 15 to 17 Year Olds | 168 (100.0%) | 0 (0.0%) |
| 18 to 19 Year Olds | 44 (100.0%) | 0 (0.0%) |
| 20 to 24 Year Olds | 34 (100.0%) | 0 (0.0%) |
| 25 to 34 Year Olds | 27 (100.0%) | 0 (0.0%) |
| 35 Years and over | 0 (0.0%) | 25 (100.0%) |
| Total | 1,359 (90.1%) | 149 (9.9%) |
Educational Attainment by Field of Study in Silsbee
Education (349 | 42.3%), science & technology (135 | 16.4%), psychology (60 | 7.3%), social sciences (59 | 7.2%), and business (44 | 5.3%) are the most common fields of study among 824 individuals in Silsbee who have obtained a bachelor's degree or higher.
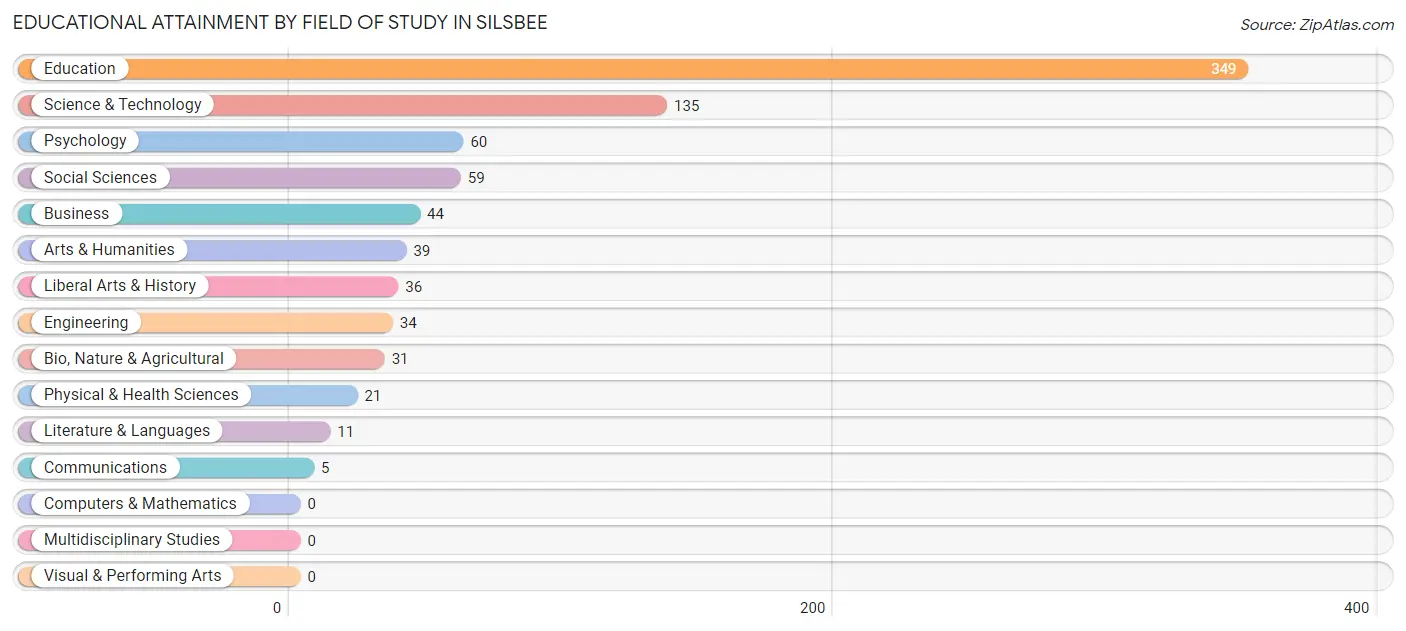
| Field of Study | # Graduates | % Graduates |
| Computers & Mathematics | 0 | 0.0% |
| Bio, Nature & Agricultural | 31 | 3.8% |
| Physical & Health Sciences | 21 | 2.5% |
| Psychology | 60 | 7.3% |
| Social Sciences | 59 | 7.2% |
| Engineering | 34 | 4.1% |
| Multidisciplinary Studies | 0 | 0.0% |
| Science & Technology | 135 | 16.4% |
| Business | 44 | 5.3% |
| Education | 349 | 42.3% |
| Literature & Languages | 11 | 1.3% |
| Liberal Arts & History | 36 | 4.4% |
| Visual & Performing Arts | 0 | 0.0% |
| Communications | 5 | 0.6% |
| Arts & Humanities | 39 | 4.7% |
| Total | 824 | 100.0% |
Transportation & Commute in Silsbee
Vehicle Availability by Sex in Silsbee
The most prevalent vehicle ownership categories in Silsbee are males with 3 vehicles (731, accounting for 50.5%) and females with 3 vehicles (382, making up 62.1%).
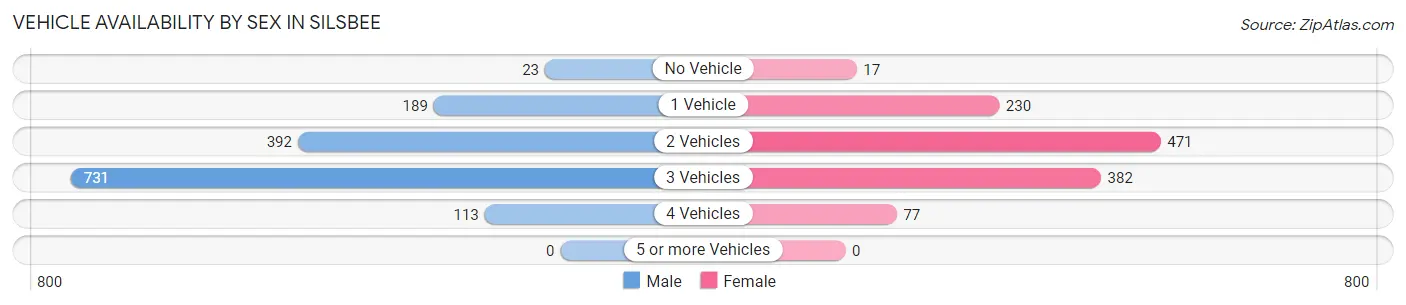
| Vehicles Available | Male | Female |
| No Vehicle | 23 (1.6%) | 17 (1.4%) |
| 1 Vehicle | 189 (13.1%) | 230 (19.5%) |
| 2 Vehicles | 392 (27.1%) | 471 (40.0%) |
| 3 Vehicles | 731 (50.5%) | 382 (32.5%) |
| 4 Vehicles | 113 (7.8%) | 77 (6.5%) |
| 5 or more Vehicles | 0 (0.0%) | 0 (0.0%) |
| Total | 1,448 (100.0%) | 1,177 (100.0%) |
Commute Time in Silsbee
The most frequently occuring commute durations in Silsbee are 30 to 34 minutes (618 commuters, 24.1%), 5 to 9 minutes (416 commuters, 16.2%), and 10 to 14 minutes (279 commuters, 10.9%).
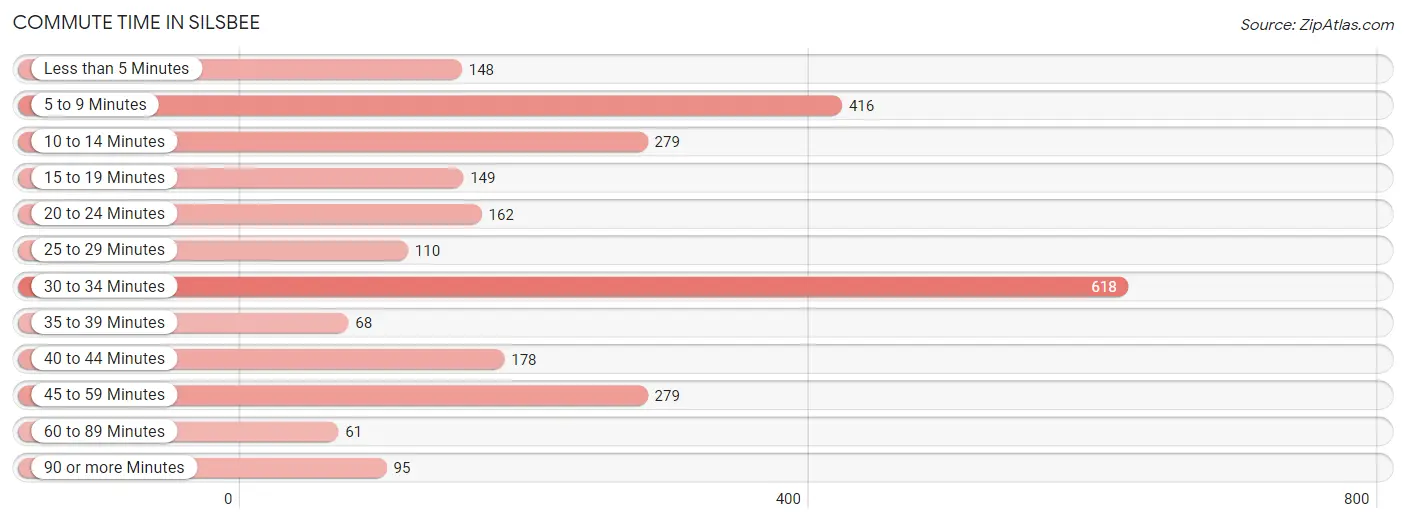
| Commute Time | # Commuters | % Commuters |
| Less than 5 Minutes | 148 | 5.8% |
| 5 to 9 Minutes | 416 | 16.2% |
| 10 to 14 Minutes | 279 | 10.9% |
| 15 to 19 Minutes | 149 | 5.8% |
| 20 to 24 Minutes | 162 | 6.3% |
| 25 to 29 Minutes | 110 | 4.3% |
| 30 to 34 Minutes | 618 | 24.1% |
| 35 to 39 Minutes | 68 | 2.6% |
| 40 to 44 Minutes | 178 | 6.9% |
| 45 to 59 Minutes | 279 | 10.9% |
| 60 to 89 Minutes | 61 | 2.4% |
| 90 or more Minutes | 95 | 3.7% |
Commute Time by Sex in Silsbee
The most common commute times in Silsbee are 30 to 34 minutes (389 commuters, 27.5%) for males and 5 to 9 minutes (263 commuters, 22.9%) for females.
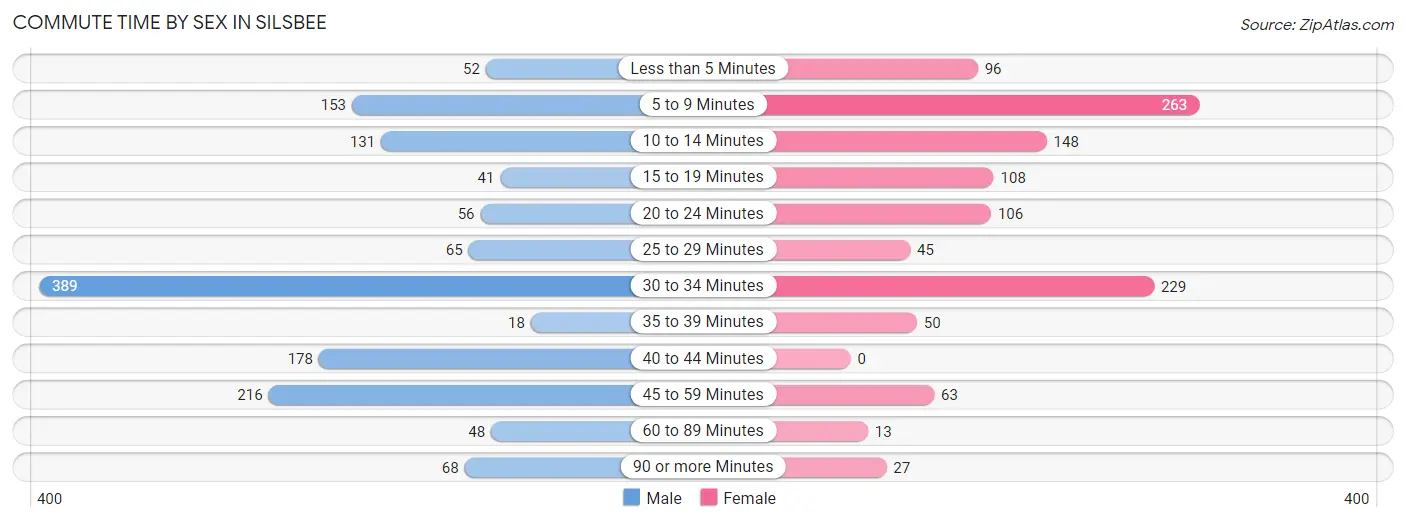
| Commute Time | Male | Female |
| Less than 5 Minutes | 52 (3.7%) | 96 (8.4%) |
| 5 to 9 Minutes | 153 (10.8%) | 263 (22.9%) |
| 10 to 14 Minutes | 131 (9.3%) | 148 (12.9%) |
| 15 to 19 Minutes | 41 (2.9%) | 108 (9.4%) |
| 20 to 24 Minutes | 56 (4.0%) | 106 (9.2%) |
| 25 to 29 Minutes | 65 (4.6%) | 45 (3.9%) |
| 30 to 34 Minutes | 389 (27.5%) | 229 (20.0%) |
| 35 to 39 Minutes | 18 (1.3%) | 50 (4.4%) |
| 40 to 44 Minutes | 178 (12.6%) | 0 (0.0%) |
| 45 to 59 Minutes | 216 (15.3%) | 63 (5.5%) |
| 60 to 89 Minutes | 48 (3.4%) | 13 (1.1%) |
| 90 or more Minutes | 68 (4.8%) | 27 (2.4%) |
Time of Departure to Work by Sex in Silsbee
The most frequent times of departure to work in Silsbee are 12:00 AM to 4:59 AM (384, 27.1%) for males and 7:00 AM to 7:29 AM (288, 25.1%) for females.
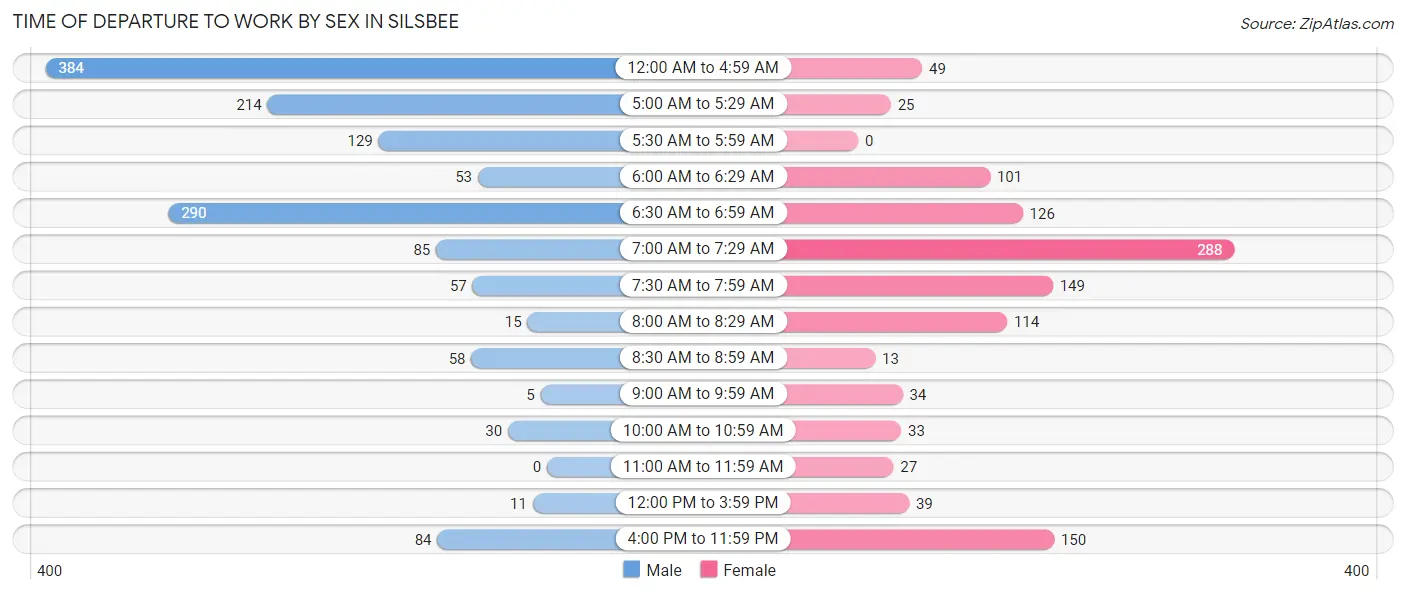
| Time of Departure | Male | Female |
| 12:00 AM to 4:59 AM | 384 (27.1%) | 49 (4.3%) |
| 5:00 AM to 5:29 AM | 214 (15.1%) | 25 (2.2%) |
| 5:30 AM to 5:59 AM | 129 (9.1%) | 0 (0.0%) |
| 6:00 AM to 6:29 AM | 53 (3.7%) | 101 (8.8%) |
| 6:30 AM to 6:59 AM | 290 (20.5%) | 126 (11.0%) |
| 7:00 AM to 7:29 AM | 85 (6.0%) | 288 (25.1%) |
| 7:30 AM to 7:59 AM | 57 (4.0%) | 149 (13.0%) |
| 8:00 AM to 8:29 AM | 15 (1.1%) | 114 (9.9%) |
| 8:30 AM to 8:59 AM | 58 (4.1%) | 13 (1.1%) |
| 9:00 AM to 9:59 AM | 5 (0.4%) | 34 (3.0%) |
| 10:00 AM to 10:59 AM | 30 (2.1%) | 33 (2.9%) |
| 11:00 AM to 11:59 AM | 0 (0.0%) | 27 (2.4%) |
| 12:00 PM to 3:59 PM | 11 (0.8%) | 39 (3.4%) |
| 4:00 PM to 11:59 PM | 84 (5.9%) | 150 (13.1%) |
| Total | 1,415 (100.0%) | 1,148 (100.0%) |
Housing Occupancy in Silsbee
Occupancy by Ownership in Silsbee
Of the total 2,557 dwellings in Silsbee, owner-occupied units account for 1,784 (69.8%), while renter-occupied units make up 773 (30.2%).
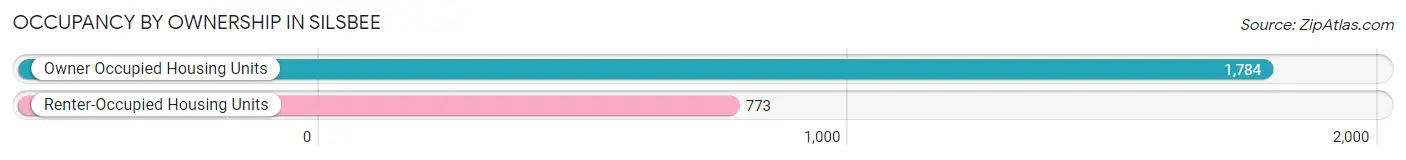
| Occupancy | # Housing Units | % Housing Units |
| Owner Occupied Housing Units | 1,784 | 69.8% |
| Renter-Occupied Housing Units | 773 | 30.2% |
| Total Occupied Housing Units | 2,557 | 100.0% |
Occupancy by Household Size in Silsbee
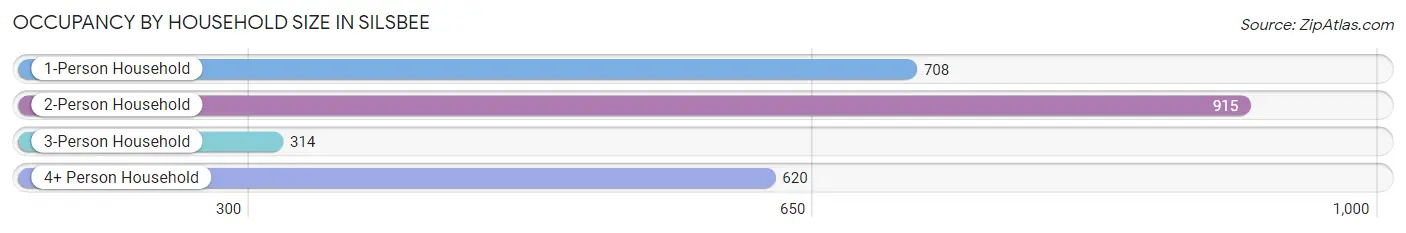
| Household Size | # Housing Units | % Housing Units |
| 1-Person Household | 708 | 27.7% |
| 2-Person Household | 915 | 35.8% |
| 3-Person Household | 314 | 12.3% |
| 4+ Person Household | 620 | 24.2% |
| Total Housing Units | 2,557 | 100.0% |
Occupancy by Ownership by Household Size in Silsbee
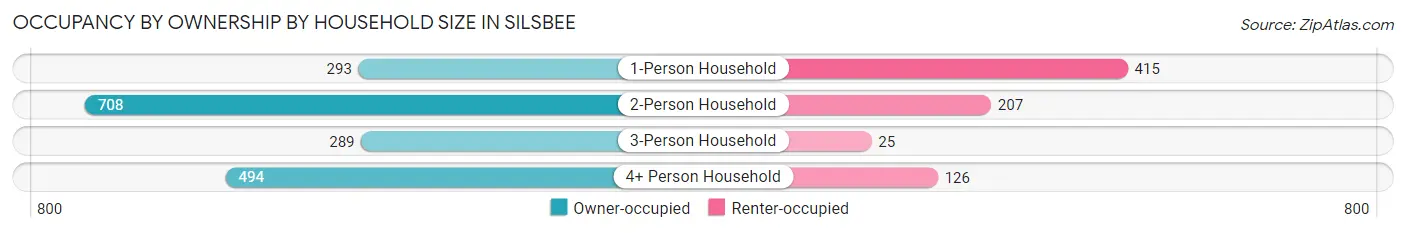
| Household Size | Owner-occupied | Renter-occupied |
| 1-Person Household | 293 (41.4%) | 415 (58.6%) |
| 2-Person Household | 708 (77.4%) | 207 (22.6%) |
| 3-Person Household | 289 (92.0%) | 25 (8.0%) |
| 4+ Person Household | 494 (79.7%) | 126 (20.3%) |
| Total Housing Units | 1,784 (69.8%) | 773 (30.2%) |
Occupancy by Educational Attainment in Silsbee
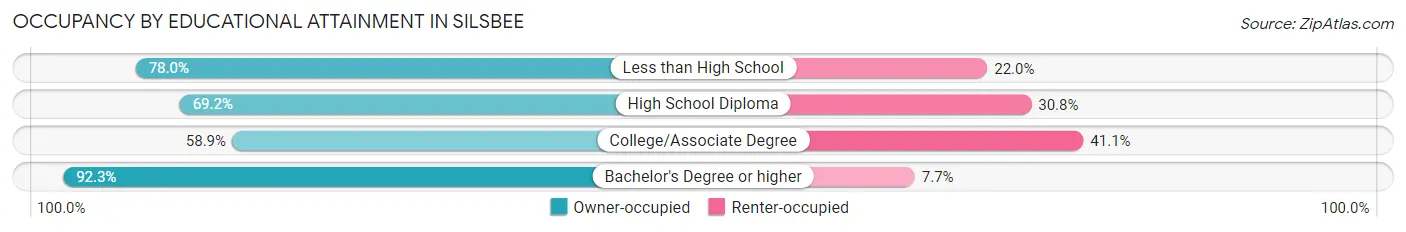
| Household Size | Owner-occupied | Renter-occupied |
| Less than High School | 92 (78.0%) | 26 (22.0%) |
| High School Diploma | 745 (69.2%) | 331 (30.8%) |
| College/Associate Degree | 549 (58.9%) | 383 (41.1%) |
| Bachelor's Degree or higher | 398 (92.3%) | 33 (7.7%) |
Occupancy by Age of Householder in Silsbee
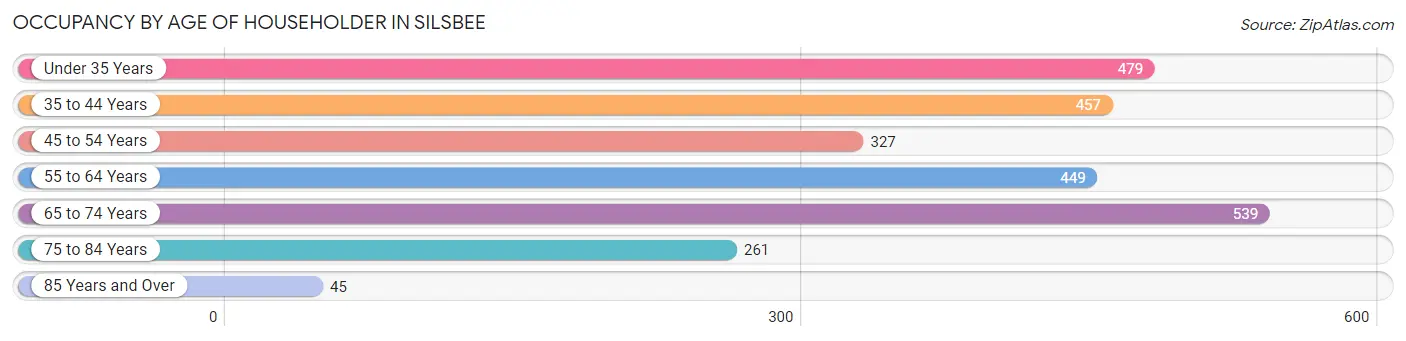
| Age Bracket | # Households | % Households |
| Under 35 Years | 479 | 18.7% |
| 35 to 44 Years | 457 | 17.9% |
| 45 to 54 Years | 327 | 12.8% |
| 55 to 64 Years | 449 | 17.6% |
| 65 to 74 Years | 539 | 21.1% |
| 75 to 84 Years | 261 | 10.2% |
| 85 Years and Over | 45 | 1.8% |
| Total | 2,557 | 100.0% |
Housing Finances in Silsbee
Median Income by Occupancy in Silsbee
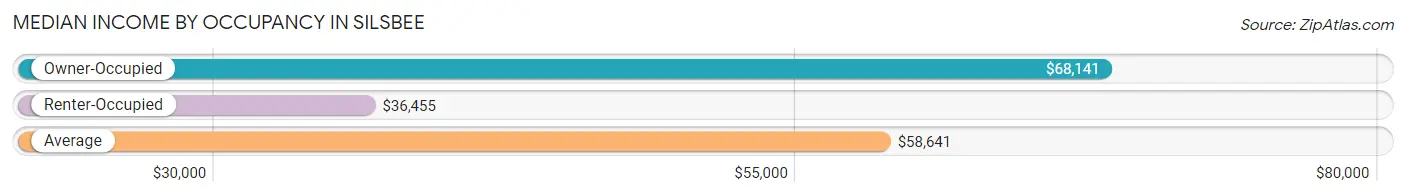
| Occupancy Type | # Households | Median Income |
| Owner-Occupied | 1,784 (69.8%) | $68,141 |
| Renter-Occupied | 773 (30.2%) | $36,455 |
| Average | 2,557 (100.0%) | $58,641 |
Occupancy by Householder Income Bracket in Silsbee
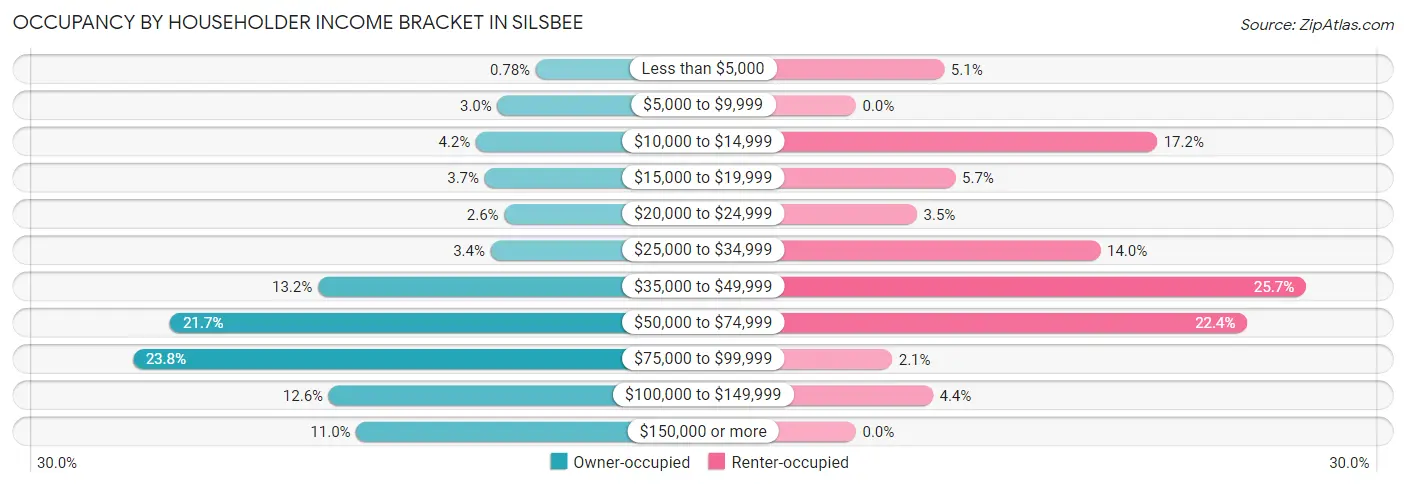
| Income Bracket | Owner-occupied | Renter-occupied |
| Less than $5,000 | 14 (0.8%) | 39 (5.1%) |
| $5,000 to $9,999 | 53 (3.0%) | 0 (0.0%) |
| $10,000 to $14,999 | 75 (4.2%) | 133 (17.2%) |
| $15,000 to $19,999 | 66 (3.7%) | 44 (5.7%) |
| $20,000 to $24,999 | 46 (2.6%) | 27 (3.5%) |
| $25,000 to $34,999 | 60 (3.4%) | 108 (14.0%) |
| $35,000 to $49,999 | 236 (13.2%) | 199 (25.7%) |
| $50,000 to $74,999 | 387 (21.7%) | 173 (22.4%) |
| $75,000 to $99,999 | 425 (23.8%) | 16 (2.1%) |
| $100,000 to $149,999 | 225 (12.6%) | 34 (4.4%) |
| $150,000 or more | 197 (11.0%) | 0 (0.0%) |
| Total | 1,784 (100.0%) | 773 (100.0%) |
Monthly Housing Cost Tiers in Silsbee
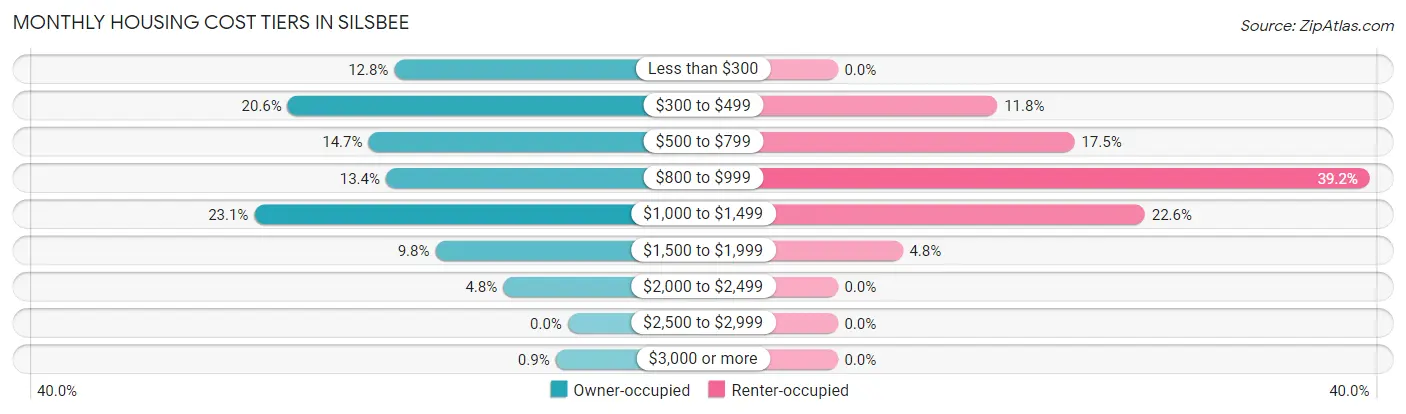
| Monthly Cost | Owner-occupied | Renter-occupied |
| Less than $300 | 228 (12.8%) | 0 (0.0%) |
| $300 to $499 | 368 (20.6%) | 91 (11.8%) |
| $500 to $799 | 262 (14.7%) | 135 (17.5%) |
| $800 to $999 | 239 (13.4%) | 303 (39.2%) |
| $1,000 to $1,499 | 412 (23.1%) | 175 (22.6%) |
| $1,500 to $1,999 | 174 (9.8%) | 37 (4.8%) |
| $2,000 to $2,499 | 85 (4.8%) | 0 (0.0%) |
| $2,500 to $2,999 | 0 (0.0%) | 0 (0.0%) |
| $3,000 or more | 16 (0.9%) | 0 (0.0%) |
| Total | 1,784 (100.0%) | 773 (100.0%) |
Physical Housing Characteristics in Silsbee
Housing Structures in Silsbee
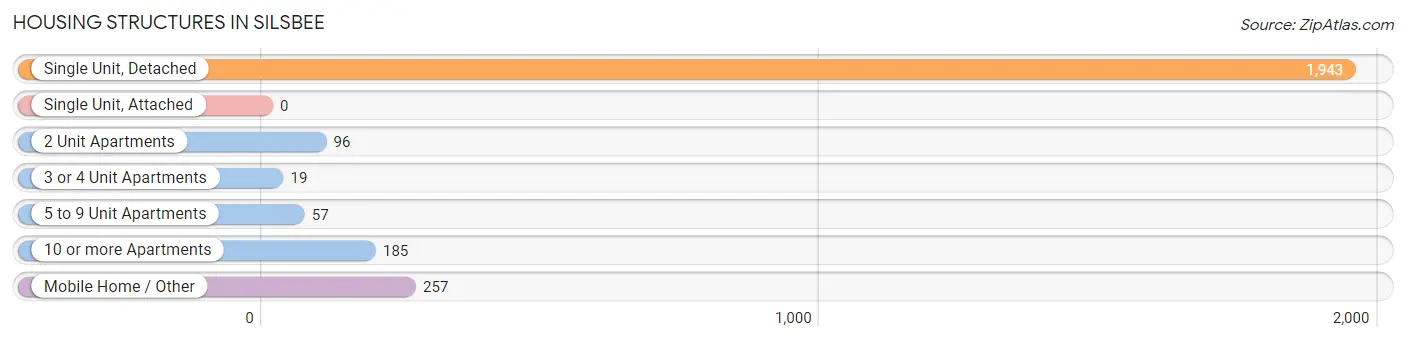
| Structure Type | # Housing Units | % Housing Units |
| Single Unit, Detached | 1,943 | 76.0% |
| Single Unit, Attached | 0 | 0.0% |
| 2 Unit Apartments | 96 | 3.7% |
| 3 or 4 Unit Apartments | 19 | 0.7% |
| 5 to 9 Unit Apartments | 57 | 2.2% |
| 10 or more Apartments | 185 | 7.2% |
| Mobile Home / Other | 257 | 10.1% |
| Total | 2,557 | 100.0% |
Housing Structures by Occupancy in Silsbee
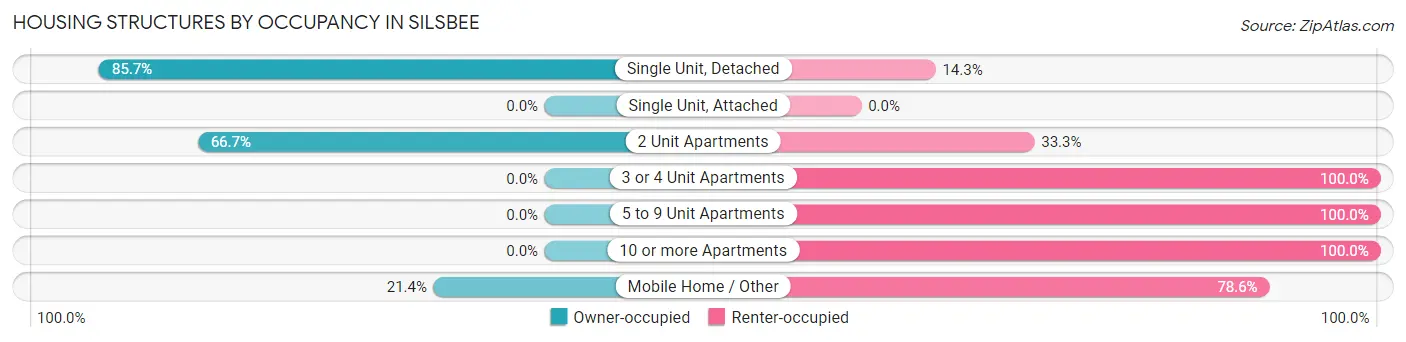
| Structure Type | Owner-occupied | Renter-occupied |
| Single Unit, Detached | 1,665 (85.7%) | 278 (14.3%) |
| Single Unit, Attached | 0 (0.0%) | 0 (0.0%) |
| 2 Unit Apartments | 64 (66.7%) | 32 (33.3%) |
| 3 or 4 Unit Apartments | 0 (0.0%) | 19 (100.0%) |
| 5 to 9 Unit Apartments | 0 (0.0%) | 57 (100.0%) |
| 10 or more Apartments | 0 (0.0%) | 185 (100.0%) |
| Mobile Home / Other | 55 (21.4%) | 202 (78.6%) |
| Total | 1,784 (69.8%) | 773 (30.2%) |
Housing Structures by Number of Rooms in Silsbee
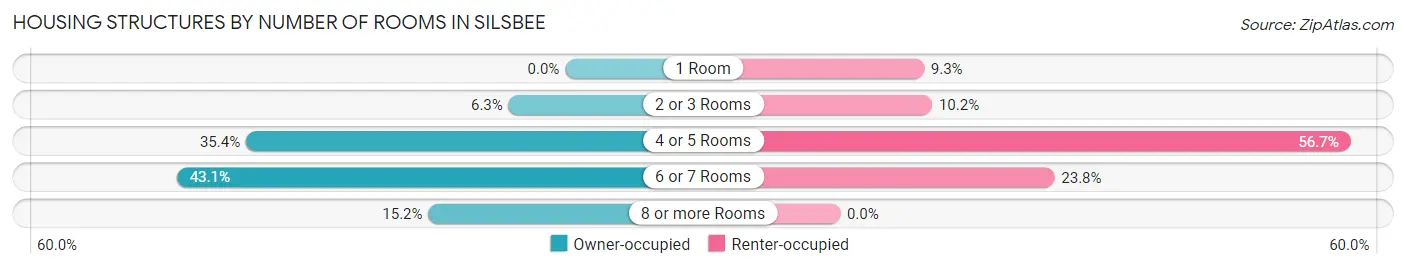
| Number of Rooms | Owner-occupied | Renter-occupied |
| 1 Room | 0 (0.0%) | 72 (9.3%) |
| 2 or 3 Rooms | 112 (6.3%) | 79 (10.2%) |
| 4 or 5 Rooms | 632 (35.4%) | 438 (56.7%) |
| 6 or 7 Rooms | 769 (43.1%) | 184 (23.8%) |
| 8 or more Rooms | 271 (15.2%) | 0 (0.0%) |
| Total | 1,784 (100.0%) | 773 (100.0%) |
Housing Structure by Heating Type in Silsbee
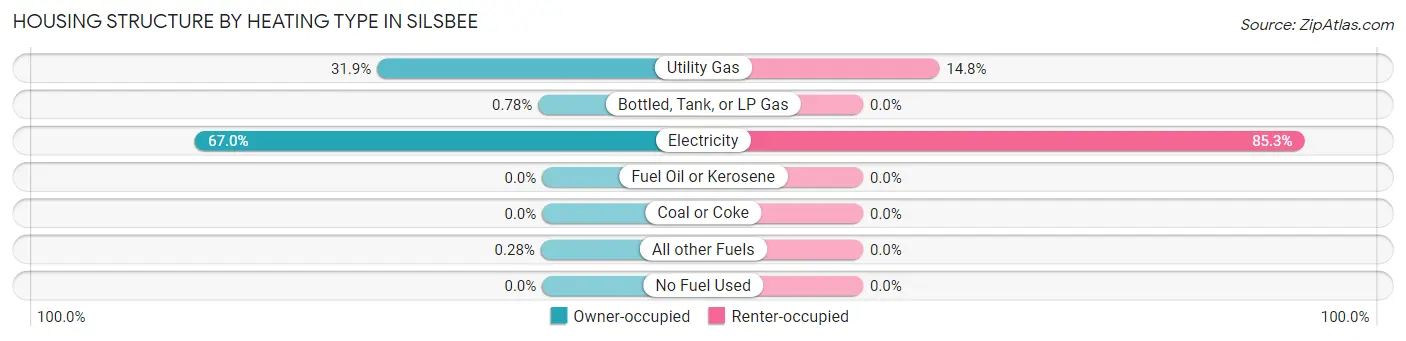
| Heating Type | Owner-occupied | Renter-occupied |
| Utility Gas | 569 (31.9%) | 114 (14.7%) |
| Bottled, Tank, or LP Gas | 14 (0.8%) | 0 (0.0%) |
| Electricity | 1,196 (67.0%) | 659 (85.3%) |
| Fuel Oil or Kerosene | 0 (0.0%) | 0 (0.0%) |
| Coal or Coke | 0 (0.0%) | 0 (0.0%) |
| All other Fuels | 5 (0.3%) | 0 (0.0%) |
| No Fuel Used | 0 (0.0%) | 0 (0.0%) |
| Total | 1,784 (100.0%) | 773 (100.0%) |
Household Vehicle Usage in Silsbee
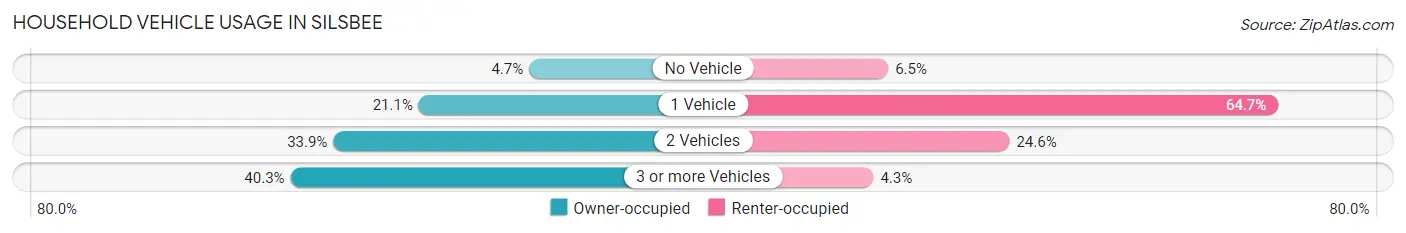
| Vehicles per Household | Owner-occupied | Renter-occupied |
| No Vehicle | 83 (4.6%) | 50 (6.5%) |
| 1 Vehicle | 377 (21.1%) | 500 (64.7%) |
| 2 Vehicles | 605 (33.9%) | 190 (24.6%) |
| 3 or more Vehicles | 719 (40.3%) | 33 (4.3%) |
| Total | 1,784 (100.0%) | 773 (100.0%) |
Real Estate & Mortgages in Silsbee
Real Estate and Mortgage Overview in Silsbee
| Characteristic | Without Mortgage | With Mortgage |
| Housing Units | 1,066 | 718 |
| Median Property Value | $107,500 | $153,800 |
| Median Household Income | $76,563 | $126 |
| Monthly Housing Costs | $469 | $16 |
| Real Estate Taxes | $1,407 | $31 |
Property Value by Mortgage Status in Silsbee
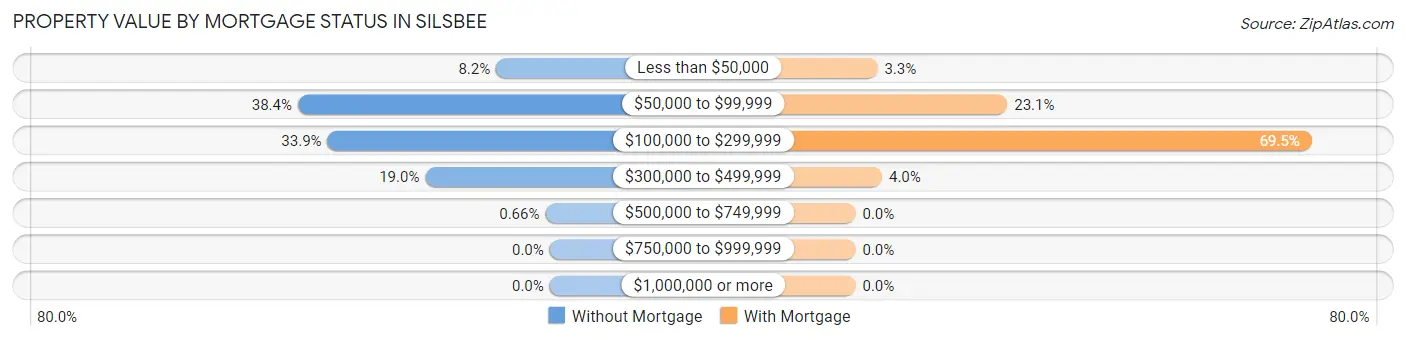
| Property Value | Without Mortgage | With Mortgage |
| Less than $50,000 | 87 (8.2%) | 24 (3.3%) |
| $50,000 to $99,999 | 409 (38.4%) | 166 (23.1%) |
| $100,000 to $299,999 | 361 (33.9%) | 499 (69.5%) |
| $300,000 to $499,999 | 202 (19.0%) | 29 (4.0%) |
| $500,000 to $749,999 | 7 (0.7%) | 0 (0.0%) |
| $750,000 to $999,999 | 0 (0.0%) | 0 (0.0%) |
| $1,000,000 or more | 0 (0.0%) | 0 (0.0%) |
| Total | 1,066 (100.0%) | 718 (100.0%) |
Household Income by Mortgage Status in Silsbee
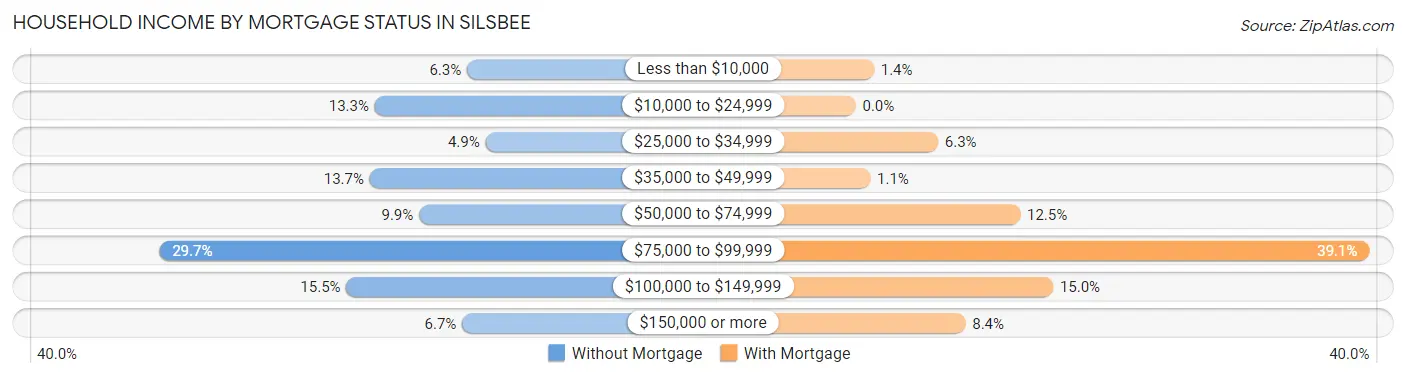
| Household Income | Without Mortgage | With Mortgage |
| Less than $10,000 | 67 (6.3%) | 10 (1.4%) |
| $10,000 to $24,999 | 142 (13.3%) | 0 (0.0%) |
| $25,000 to $34,999 | 52 (4.9%) | 45 (6.3%) |
| $35,000 to $49,999 | 146 (13.7%) | 8 (1.1%) |
| $50,000 to $74,999 | 106 (9.9%) | 90 (12.5%) |
| $75,000 to $99,999 | 317 (29.7%) | 281 (39.1%) |
| $100,000 to $149,999 | 165 (15.5%) | 108 (15.0%) |
| $150,000 or more | 71 (6.7%) | 60 (8.4%) |
| Total | 1,066 (100.0%) | 718 (100.0%) |
Property Value to Household Income Ratio in Silsbee
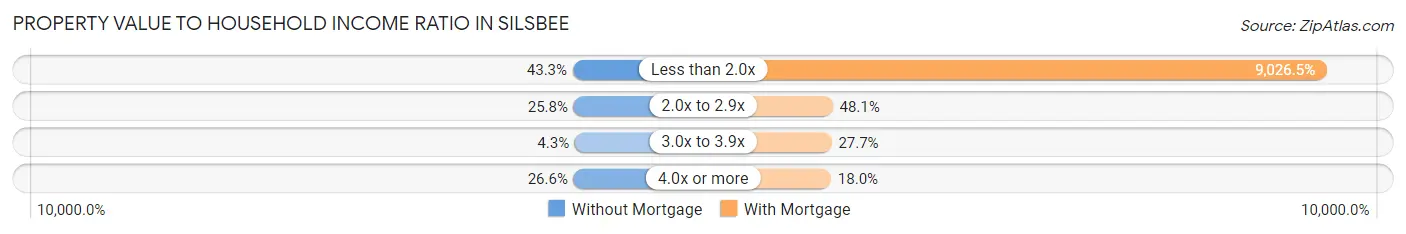
| Value-to-Income Ratio | Without Mortgage | With Mortgage |
| Less than 2.0x | 461 (43.2%) | 64,810 (9,026.5%) |
| 2.0x to 2.9x | 275 (25.8%) | 345 (48.0%) |
| 3.0x to 3.9x | 46 (4.3%) | 199 (27.7%) |
| 4.0x or more | 284 (26.6%) | 129 (18.0%) |
| Total | 1,066 (100.0%) | 718 (100.0%) |
Real Estate Taxes by Mortgage Status in Silsbee
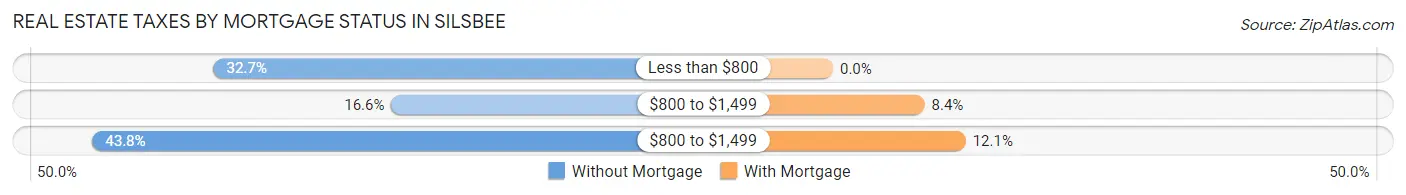
| Property Taxes | Without Mortgage | With Mortgage |
| Less than $800 | 349 (32.7%) | 0 (0.0%) |
| $800 to $1,499 | 177 (16.6%) | 60 (8.4%) |
| $800 to $1,499 | 467 (43.8%) | 87 (12.1%) |
| Total | 1,066 (100.0%) | 718 (100.0%) |
Health & Disability in Silsbee
Health Insurance Coverage by Age in Silsbee
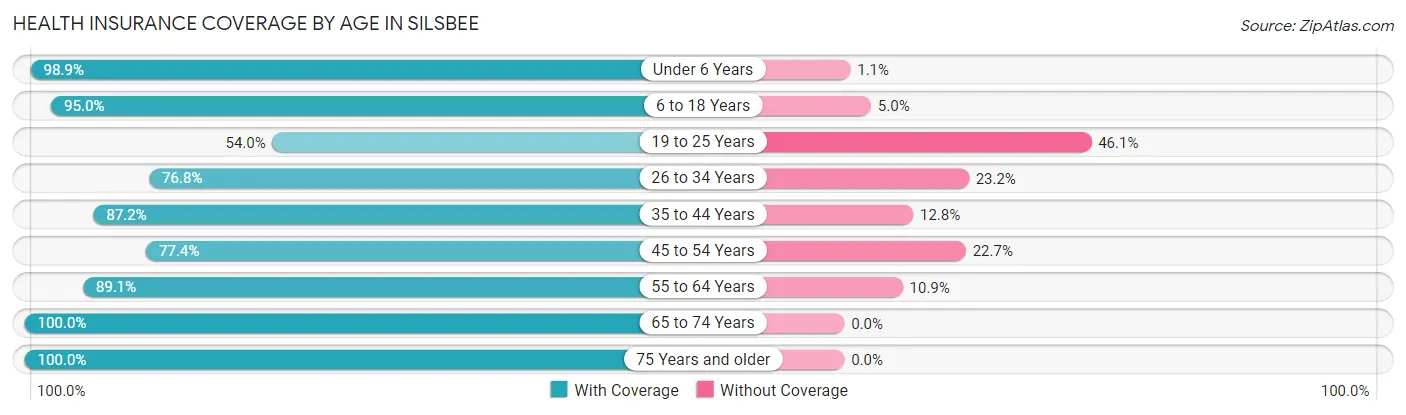
| Age Bracket | With Coverage | Without Coverage |
| Under 6 Years | 532 (98.9%) | 6 (1.1%) |
| 6 to 18 Years | 1,149 (95.0%) | 60 (5.0%) |
| 19 to 25 Years | 246 (53.9%) | 210 (46.1%) |
| 26 to 34 Years | 652 (76.8%) | 197 (23.2%) |
| 35 to 44 Years | 755 (87.2%) | 111 (12.8%) |
| 45 to 54 Years | 526 (77.3%) | 154 (22.7%) |
| 55 to 64 Years | 771 (89.1%) | 94 (10.9%) |
| 65 to 74 Years | 759 (100.0%) | 0 (0.0%) |
| 75 Years and older | 386 (100.0%) | 0 (0.0%) |
| Total | 5,776 (87.4%) | 832 (12.6%) |
Health Insurance Coverage by Citizenship Status in Silsbee
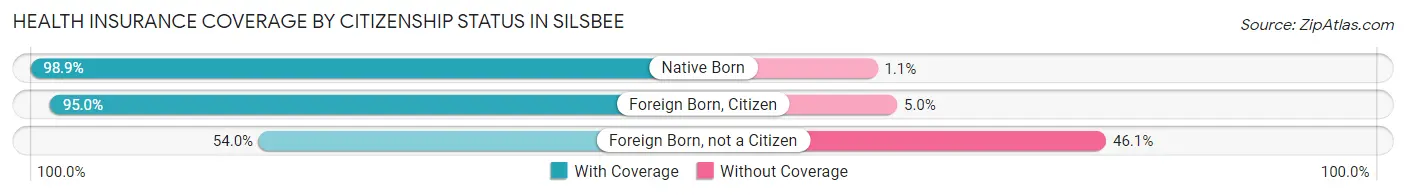
| Citizenship Status | With Coverage | Without Coverage |
| Native Born | 532 (98.9%) | 6 (1.1%) |
| Foreign Born, Citizen | 1,149 (95.0%) | 60 (5.0%) |
| Foreign Born, not a Citizen | 246 (53.9%) | 210 (46.1%) |
Health Insurance Coverage by Household Income in Silsbee
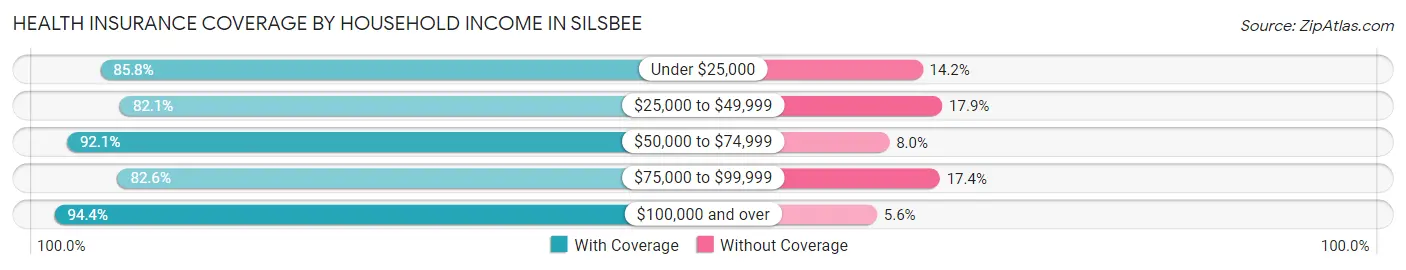
| Household Income | With Coverage | Without Coverage |
| Under $25,000 | 755 (85.8%) | 125 (14.2%) |
| $25,000 to $49,999 | 1,259 (82.1%) | 274 (17.9%) |
| $50,000 to $74,999 | 1,354 (92.0%) | 117 (8.0%) |
| $75,000 to $99,999 | 1,153 (82.6%) | 243 (17.4%) |
| $100,000 and over | 1,224 (94.4%) | 73 (5.6%) |
Public vs Private Health Insurance Coverage by Age in Silsbee
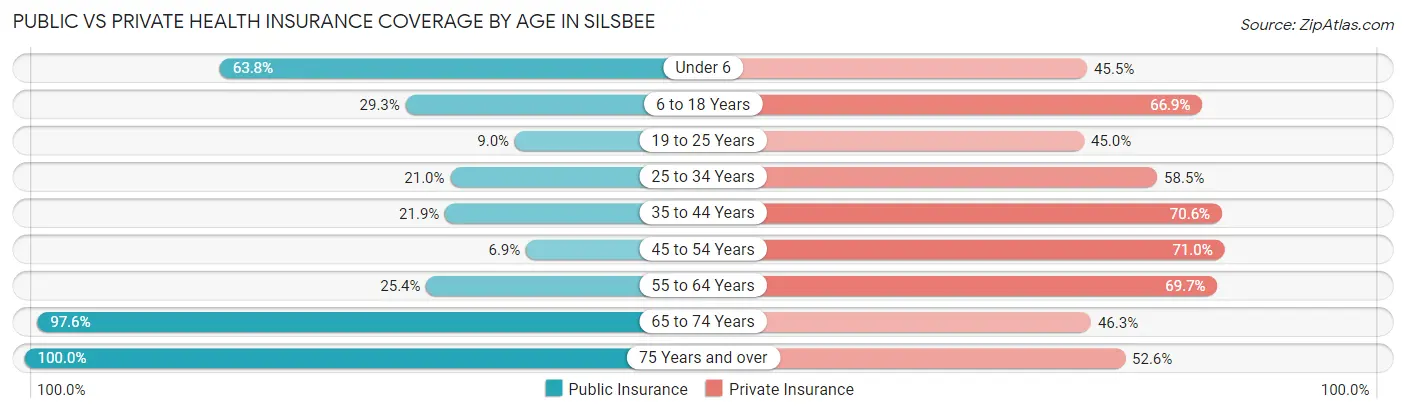
| Age Bracket | Public Insurance | Private Insurance |
| Under 6 | 343 (63.7%) | 245 (45.5%) |
| 6 to 18 Years | 354 (29.3%) | 809 (66.9%) |
| 19 to 25 Years | 41 (9.0%) | 205 (45.0%) |
| 25 to 34 Years | 178 (21.0%) | 497 (58.5%) |
| 35 to 44 Years | 190 (21.9%) | 611 (70.6%) |
| 45 to 54 Years | 47 (6.9%) | 483 (71.0%) |
| 55 to 64 Years | 220 (25.4%) | 603 (69.7%) |
| 65 to 74 Years | 741 (97.6%) | 351 (46.3%) |
| 75 Years and over | 386 (100.0%) | 203 (52.6%) |
| Total | 2,500 (37.8%) | 4,007 (60.6%) |
Disability Status by Sex by Age in Silsbee
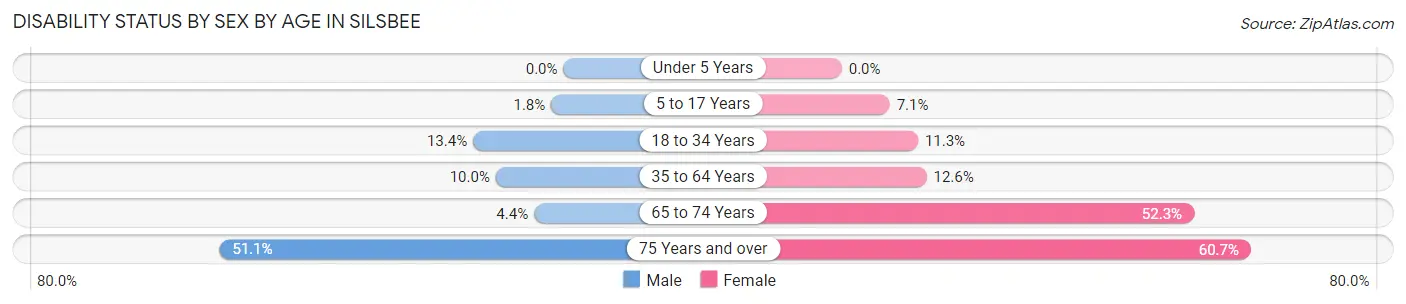
| Age Bracket | Male | Female |
| Under 5 Years | 0 (0.0%) | 0 (0.0%) |
| 5 to 17 Years | 10 (1.8%) | 50 (7.1%) |
| 18 to 34 Years | 95 (13.4%) | 71 (11.3%) |
| 35 to 64 Years | 108 (10.0%) | 168 (12.6%) |
| 65 to 74 Years | 13 (4.4%) | 241 (52.3%) |
| 75 Years and over | 71 (51.1%) | 150 (60.7%) |
Disability Class by Sex by Age in Silsbee
Disability Class: Hearing Difficulty
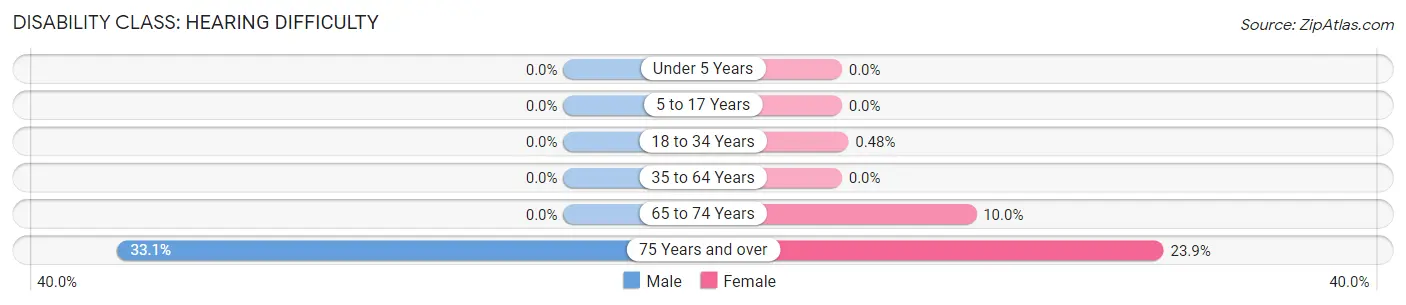
| Age Bracket | Male | Female |
| Under 5 Years | 0 (0.0%) | 0 (0.0%) |
| 5 to 17 Years | 0 (0.0%) | 0 (0.0%) |
| 18 to 34 Years | 0 (0.0%) | 3 (0.5%) |
| 35 to 64 Years | 0 (0.0%) | 0 (0.0%) |
| 65 to 74 Years | 0 (0.0%) | 46 (10.0%) |
| 75 Years and over | 46 (33.1%) | 59 (23.9%) |
Disability Class: Vision Difficulty
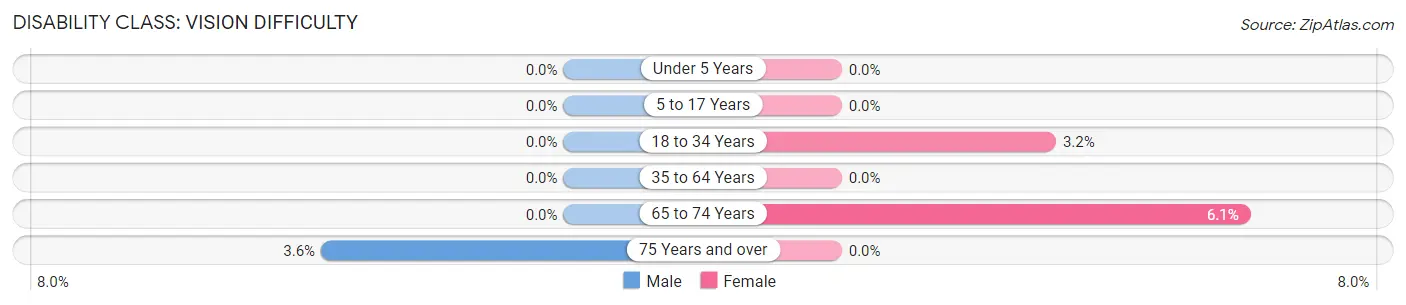
| Age Bracket | Male | Female |
| Under 5 Years | 0 (0.0%) | 0 (0.0%) |
| 5 to 17 Years | 0 (0.0%) | 0 (0.0%) |
| 18 to 34 Years | 0 (0.0%) | 20 (3.2%) |
| 35 to 64 Years | 0 (0.0%) | 0 (0.0%) |
| 65 to 74 Years | 0 (0.0%) | 28 (6.1%) |
| 75 Years and over | 5 (3.6%) | 0 (0.0%) |
Disability Class: Cognitive Difficulty
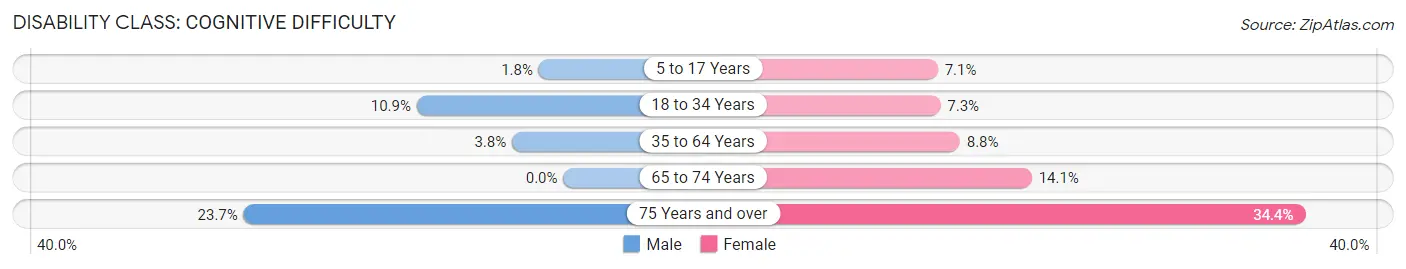
| Age Bracket | Male | Female |
| 5 to 17 Years | 10 (1.8%) | 50 (7.1%) |
| 18 to 34 Years | 77 (10.9%) | 46 (7.3%) |
| 35 to 64 Years | 41 (3.8%) | 117 (8.8%) |
| 65 to 74 Years | 0 (0.0%) | 65 (14.1%) |
| 75 Years and over | 33 (23.7%) | 85 (34.4%) |
Disability Class: Ambulatory Difficulty
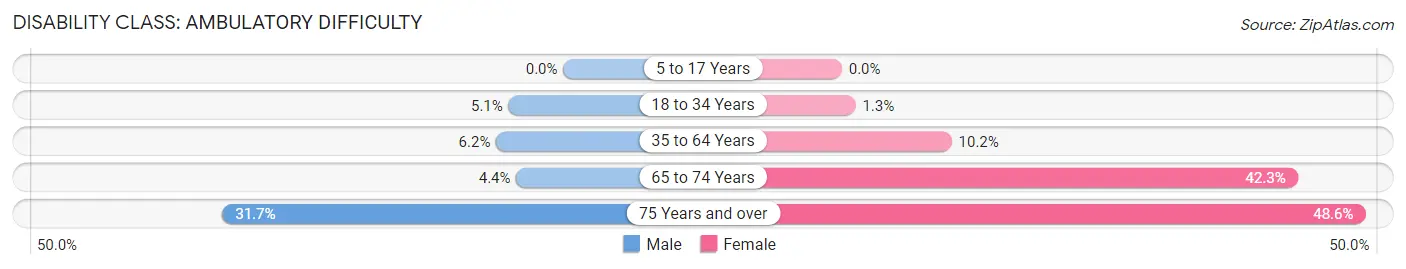
| Age Bracket | Male | Female |
| 5 to 17 Years | 0 (0.0%) | 0 (0.0%) |
| 18 to 34 Years | 36 (5.1%) | 8 (1.3%) |
| 35 to 64 Years | 67 (6.2%) | 136 (10.2%) |
| 65 to 74 Years | 13 (4.4%) | 195 (42.3%) |
| 75 Years and over | 44 (31.7%) | 120 (48.6%) |
Disability Class: Self-Care Difficulty
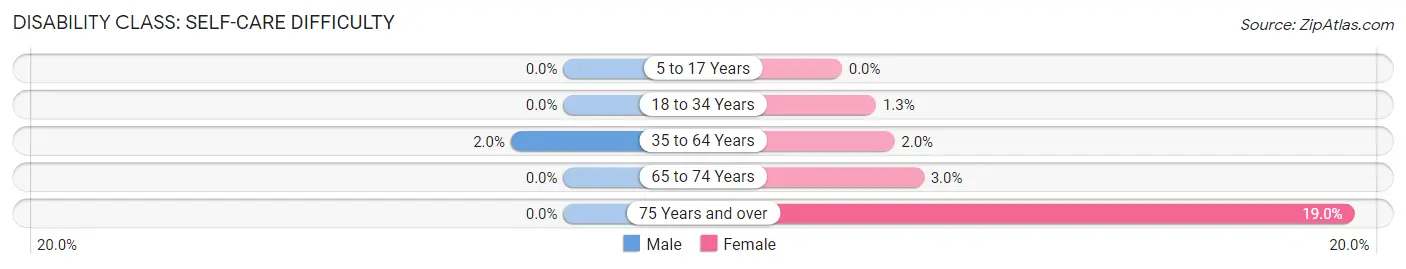
| Age Bracket | Male | Female |
| 5 to 17 Years | 0 (0.0%) | 0 (0.0%) |
| 18 to 34 Years | 0 (0.0%) | 8 (1.3%) |
| 35 to 64 Years | 21 (1.9%) | 26 (1.9%) |
| 65 to 74 Years | 0 (0.0%) | 14 (3.0%) |
| 75 Years and over | 0 (0.0%) | 47 (19.0%) |
Technology Access in Silsbee
Computing Device Access in Silsbee
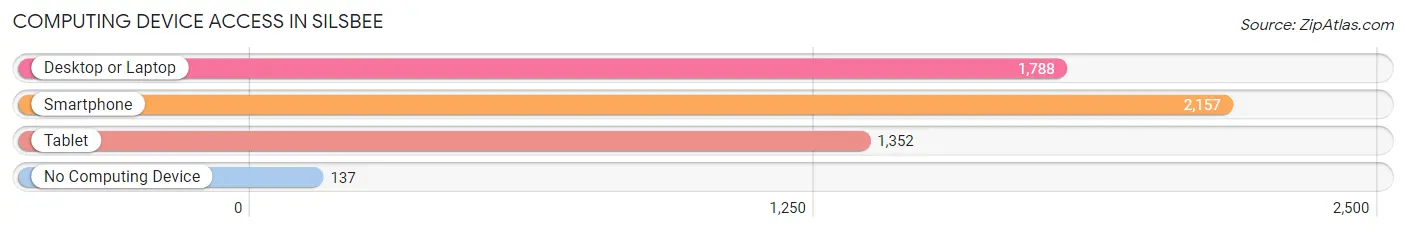
| Device Type | # Households | % Households |
| Desktop or Laptop | 1,788 | 69.9% |
| Smartphone | 2,157 | 84.4% |
| Tablet | 1,352 | 52.9% |
| No Computing Device | 137 | 5.4% |
| Total | 2,557 | 100.0% |
Internet Access in Silsbee
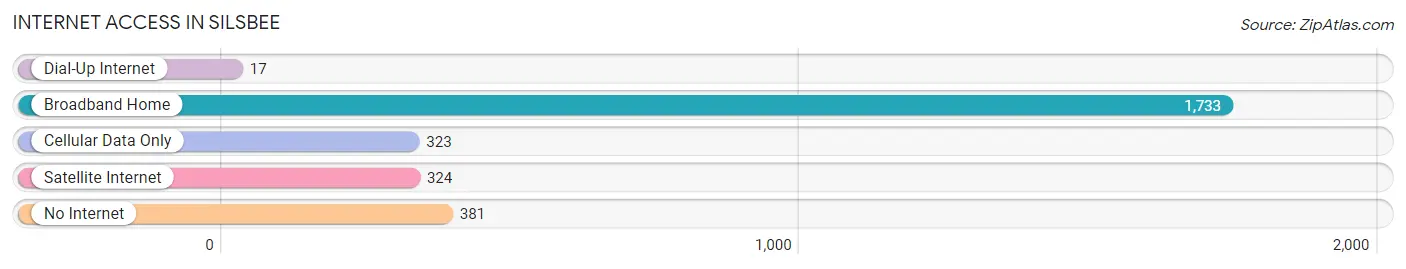
| Internet Type | # Households | % Households |
| Dial-Up Internet | 17 | 0.7% |
| Broadband Home | 1,733 | 67.8% |
| Cellular Data Only | 323 | 12.6% |
| Satellite Internet | 324 | 12.7% |
| No Internet | 381 | 14.9% |
| Total | 2,557 | 100.0% |
Silsbee Summary
Silsbee, Texas is a small city located in Hardin County, Texas, United States. It is situated about 90 miles northeast of Houston and about 30 miles west of Beaumont. The city is part of the Beaumont–Port Arthur Metropolitan Statistical Area. As of the 2010 census, the city had a population of 5,386.
History
Silsbee was founded in 1894 by the Silsbee brothers, who were looking for a place to build a sawmill. The town was named after them and was incorporated in 1895. The first post office was established in 1895.
The town grew rapidly in the early 1900s, and by 1910, it had a population of 1,000. The town was home to several businesses, including a cotton gin, a lumber mill, and a brick factory.
In the 1920s, the town was home to a number of oil refineries, which helped to fuel the local economy. The town also had a number of churches, schools, and other businesses.
In the 1950s, the town began to decline as the oil industry moved away. The population dropped to just over 2,000 by the 1970s.
Geography
Silsbee is located at 30°19'25" North, 94°13'45" West (30.323750, -94.229167). The city is situated in the southeastern part of Hardin County, about 90 miles northeast of Houston and about 30 miles west of Beaumont.
The city has a total area of 4.2 square miles, all of which is land. The terrain is mostly flat, with some rolling hills. The city is located in the Piney Woods region of Texas.
Economy
The economy of Silsbee is largely based on the oil and gas industry. The city is home to several oil refineries, as well as a number of other businesses related to the industry.
The city is also home to a number of other businesses, including retail stores, restaurants, and other services. The city is also home to a number of manufacturing companies, including a paper mill and a plastics plant.
Demographics
As of the 2010 census, the city had a population of 5,386. The racial makeup of the city was 79.2% White, 15.3% African American, 0.7% Native American, 0.5% Asian, 0.1% Pacific Islander, 2.3% from other races, and 2.0% from two or more races. Hispanic or Latino of any race were 6.3% of the population.
The median income for a household in the city was $35,938, and the median income for a family was $41,944. The per capita income for the city was $17,845. About 17.2% of families and 20.2% of the population were below the poverty line, including 28.2% of those under age 18 and 11.2% of those age 65 or over.
Common Questions
What is Per Capita Income in Silsbee?
Per Capita income in Silsbee is $27,046.
What is the Median Family Income in Silsbee?
Median Family Income in Silsbee is $68,750.
What is the Median Household income in Silsbee?
Median Household Income in Silsbee is $58,641.
What is Income or Wage Gap in Silsbee?
Income or Wage Gap in Silsbee is 47.4%.
Women in Silsbee earn 52.6 cents for every dollar earned by a man.
What is Family Income Deficit in Silsbee?
Family Income Deficit in Silsbee is $10,557.
Families that are below poverty line in Silsbee earn $10,557 less on average than the poverty threshold level.
What is Inequality or Gini Index in Silsbee?
Inequality or Gini Index in Silsbee is 0.40.
What is the Total Population of Silsbee?
Total Population of Silsbee is 6,904.
What is the Total Male Population of Silsbee?
Total Male Population of Silsbee is 2,979.
What is the Total Female Population of Silsbee?
Total Female Population of Silsbee is 3,925.
What is the Ratio of Males per 100 Females in Silsbee?
There are 75.90 Males per 100 Females in Silsbee.
What is the Ratio of Females per 100 Males in Silsbee?
There are 131.76 Females per 100 Males in Silsbee.
What is the Median Population Age in Silsbee?
Median Population Age in Silsbee is 41.7 Years.
What is the Average Family Size in Silsbee
Average Family Size in Silsbee is 3.2 People.
What is the Average Household Size in Silsbee
Average Household Size in Silsbee is 2.6 People.
How Large is the Labor Force in Silsbee?
There are 2,787 People in the Labor Forcein in Silsbee.
What is the Percentage of People in the Labor Force in Silsbee?
52.9% of People are in the Labor Force in Silsbee.
What is the Unemployment Rate in Silsbee?
Unemployment Rate in Silsbee is 4.2%.