Shiner, TX Map & Demographics
Shiner Map
Shiner Overview
$39,180
PER CAPITA INCOME
$111,827
AVG FAMILY INCOME
$90,119
AVG HOUSEHOLD INCOME
40.7%
WAGE / INCOME GAP [ % ]
59.3¢/ $1
WAGE / INCOME GAP [ $ ]
$11,192
FAMILY INCOME DEFICIT
0.38
INEQUALITY / GINI INDEX
2,095
TOTAL POPULATION
962
MALE POPULATION
1,133
FEMALE POPULATION
84.91
MALES / 100 FEMALES
117.78
FEMALES / 100 MALES
40.5
MEDIAN AGE
3.0
AVG FAMILY SIZE
2.6
AVG HOUSEHOLD SIZE
1,013
LABOR FORCE [ PEOPLE ]
63.1%
PERCENT IN LABOR FORCE
2.0%
UNEMPLOYMENT RATE
Shiner Zip Codes
Shiner Area Codes
Income in Shiner
Income Overview in Shiner
Per Capita Income in Shiner is $39,180, while median incomes of families and households are $111,827 and $90,119 respectively.
| Characteristic | Number | Measure |
| Per Capita Income | 2,095 | $39,180 |
| Median Family Income | 621 | $111,827 |
| Mean Family Income | 621 | $118,800 |
| Median Household Income | 772 | $90,119 |
| Mean Household Income | 772 | $105,146 |
| Income Deficit | 621 | $11,192 |
| Wage / Income Gap (%) | 2,095 | 40.68% |
| Wage / Income Gap ($) | 2,095 | 59.32¢ per $1 |
| Gini / Inequality Index | 2,095 | 0.38 |
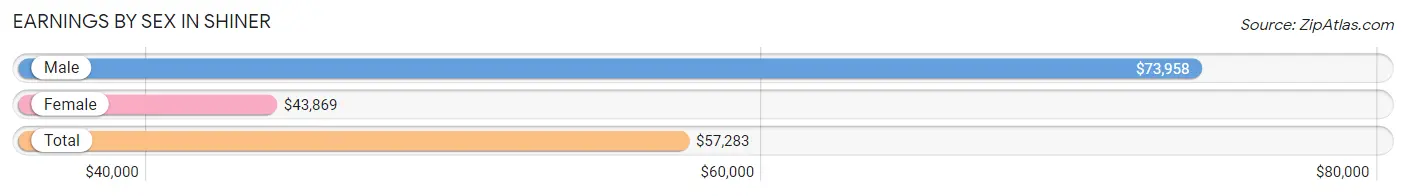
Earnings by Sex in Shiner
Average Earnings in Shiner are $57,283, $73,958 for men and $43,869 for women, a difference of 40.7%.
| Sex | Number | Average Earnings |
| Male | 474 (46.9%) | $73,958 |
| Female | 536 (53.1%) | $43,869 |
| Total | 1,010 (100.0%) | $57,283 |
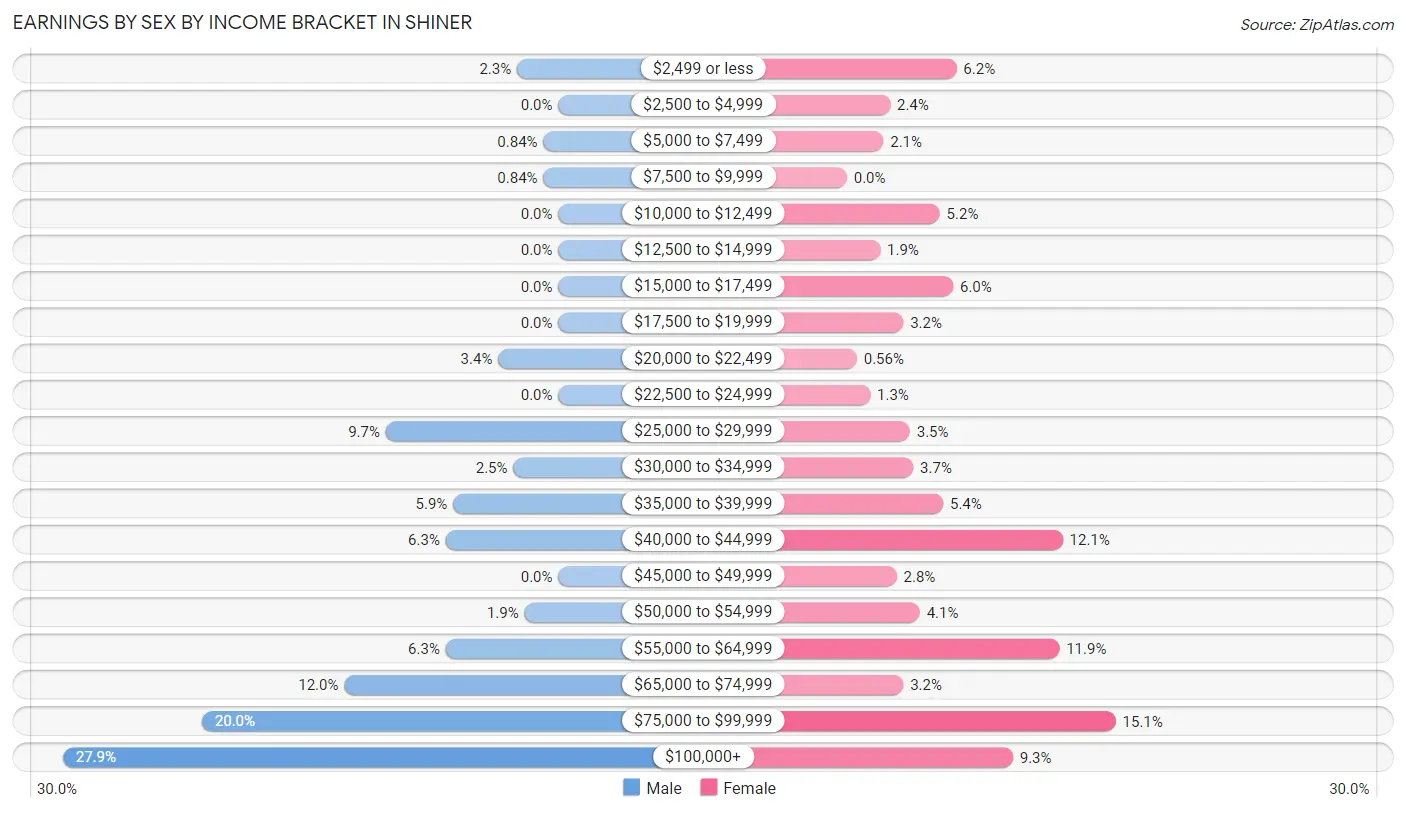
Earnings by Sex by Income Bracket in Shiner
The most common earnings brackets in Shiner are $100,000+ for men (132 | 27.9%) and $75,000 to $99,999 for women (81 | 15.1%).
| Income | Male | Female |
| $2,499 or less | 11 (2.3%) | 33 (6.2%) |
| $2,500 to $4,999 | 0 (0.0%) | 13 (2.4%) |
| $5,000 to $7,499 | 4 (0.8%) | 11 (2.1%) |
| $7,500 to $9,999 | 4 (0.8%) | 0 (0.0%) |
| $10,000 to $12,499 | 0 (0.0%) | 28 (5.2%) |
| $12,500 to $14,999 | 0 (0.0%) | 10 (1.9%) |
| $15,000 to $17,499 | 0 (0.0%) | 32 (6.0%) |
| $17,500 to $19,999 | 0 (0.0%) | 17 (3.2%) |
| $20,000 to $22,499 | 16 (3.4%) | 3 (0.6%) |
| $22,500 to $24,999 | 0 (0.0%) | 7 (1.3%) |
| $25,000 to $29,999 | 46 (9.7%) | 19 (3.5%) |
| $30,000 to $34,999 | 12 (2.5%) | 20 (3.7%) |
| $35,000 to $39,999 | 28 (5.9%) | 29 (5.4%) |
| $40,000 to $44,999 | 30 (6.3%) | 65 (12.1%) |
| $45,000 to $49,999 | 0 (0.0%) | 15 (2.8%) |
| $50,000 to $54,999 | 9 (1.9%) | 22 (4.1%) |
| $55,000 to $64,999 | 30 (6.3%) | 64 (11.9%) |
| $65,000 to $74,999 | 57 (12.0%) | 17 (3.2%) |
| $75,000 to $99,999 | 95 (20.0%) | 81 (15.1%) |
| $100,000+ | 132 (27.9%) | 50 (9.3%) |
| Total | 474 (100.0%) | 536 (100.0%) |
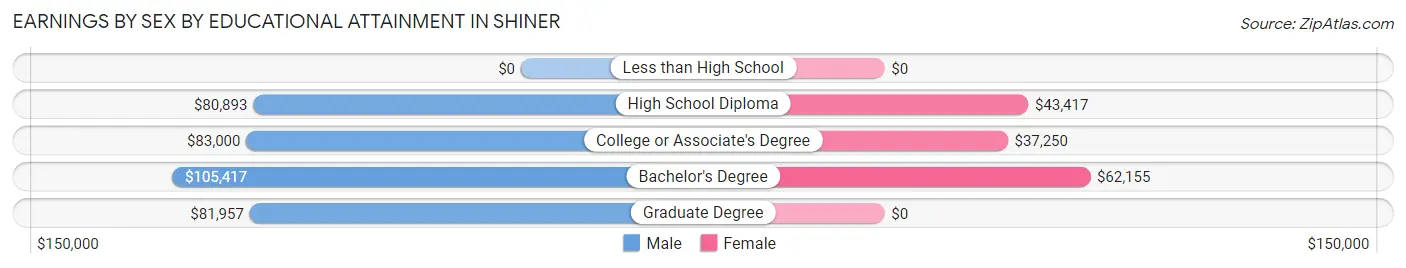
Earnings by Sex by Educational Attainment in Shiner
Average earnings in Shiner are $81,792 for men and $50,625 for women, a difference of 38.1%. Men with an educational attainment of bachelor's degree enjoy the highest average annual earnings of $105,417, while those with high school diploma education earn the least with $80,893. Women with an educational attainment of bachelor's degree earn the most with the average annual earnings of $62,155, while those with college or associate's degree education have the smallest earnings of $37,250.
| Educational Attainment | Male Income | Female Income |
| Less than High School | - | - |
| High School Diploma | $80,893 | $43,417 |
| College or Associate's Degree | $83,000 | $37,250 |
| Bachelor's Degree | $105,417 | $62,155 |
| Graduate Degree | $81,957 | $0 |
| Total | $81,792 | $50,625 |
Family Income in Shiner
Family Income Brackets in Shiner
According to the Shiner family income data, there are 172 families falling into the $100,000 to $149,999 income range, which is the most common income bracket and makes up 27.7% of all families.
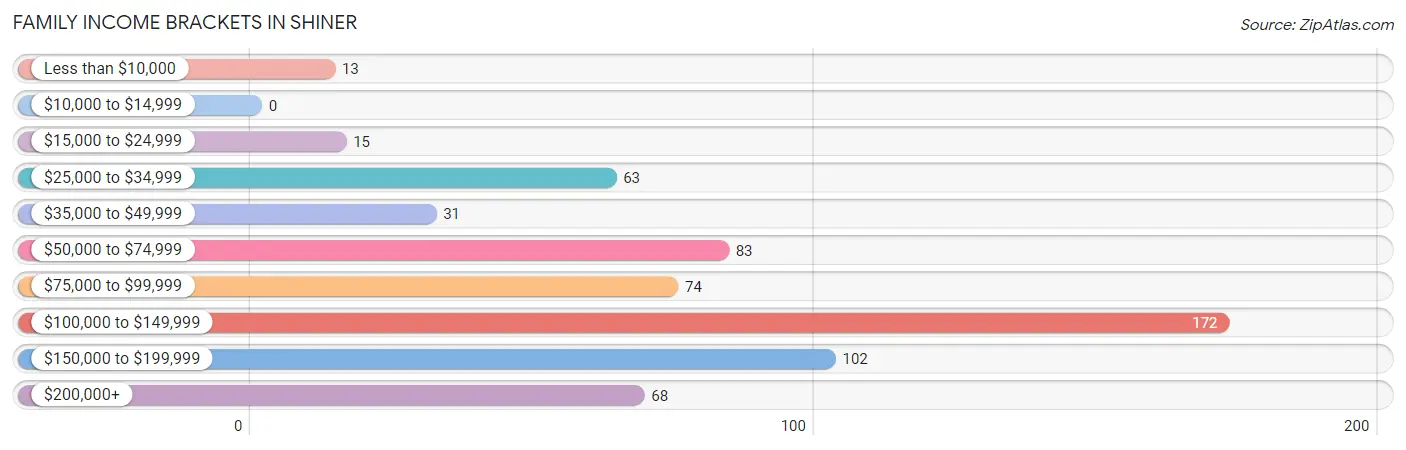
| Income Bracket | # Families | % Families |
| Less than $10,000 | 13 | 2.1% |
| $10,000 to $14,999 | 0 | 0.0% |
| $15,000 to $24,999 | 15 | 2.4% |
| $25,000 to $34,999 | 63 | 10.1% |
| $35,000 to $49,999 | 31 | 5.0% |
| $50,000 to $74,999 | 83 | 13.4% |
| $75,000 to $99,999 | 74 | 11.9% |
| $100,000 to $149,999 | 172 | 27.7% |
| $150,000 to $199,999 | 102 | 16.4% |
| $200,000+ | 68 | 11.0% |
Family Income by Famaliy Size in Shiner
4-person families (149 | 24.0%) account for the highest median family income in Shiner with $143,155 per family, while 2-person families (379 | 61.0%) have the highest median income of $42,836 per family member.
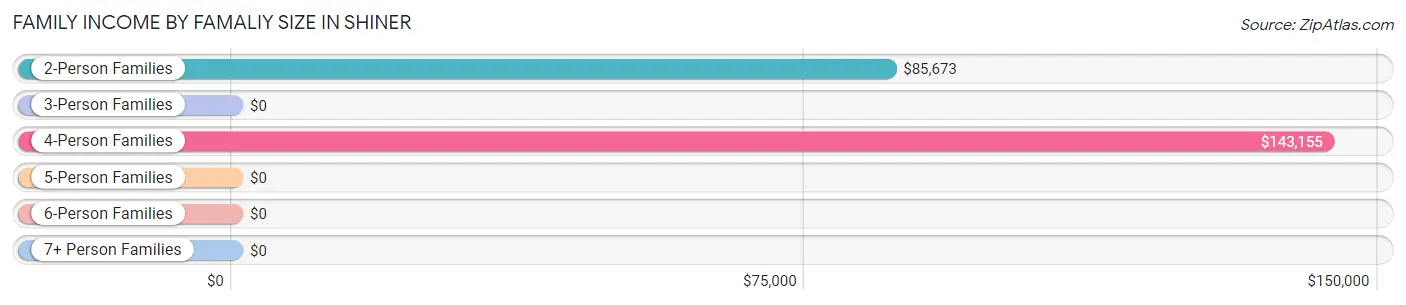
| Income Bracket | # Families | Median Income |
| 2-Person Families | 379 (61.0%) | $85,673 |
| 3-Person Families | 51 (8.2%) | $0 |
| 4-Person Families | 149 (24.0%) | $143,155 |
| 5-Person Families | 21 (3.4%) | $0 |
| 6-Person Families | 16 (2.6%) | $0 |
| 7+ Person Families | 5 (0.8%) | $0 |
| Total | 621 (100.0%) | $111,827 |
Family Income by Number of Earners in Shiner
The median family income in Shiner is $111,827, with families comprising 3+ earners (68) having the highest median family income of $153,646, while families with no earners (125) have the lowest median family income of $45,313, accounting for 11.0% and 20.1% of families, respectively.
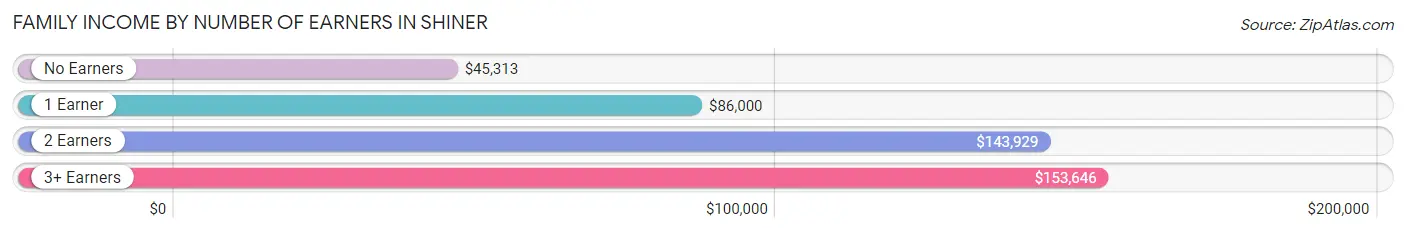
| Number of Earners | # Families | Median Income |
| No Earners | 125 (20.1%) | $45,313 |
| 1 Earner | 156 (25.1%) | $86,000 |
| 2 Earners | 272 (43.8%) | $143,929 |
| 3+ Earners | 68 (11.0%) | $153,646 |
| Total | 621 (100.0%) | $111,827 |
Household Income in Shiner
Household Income Brackets in Shiner
With 191 households falling in the category, the $100,000 to $149,999 income range is the most frequent in Shiner, accounting for 24.7% of all households. In contrast, only 8 households (1.0%) fall into the less than $10,000 income bracket, making it the least populous group.
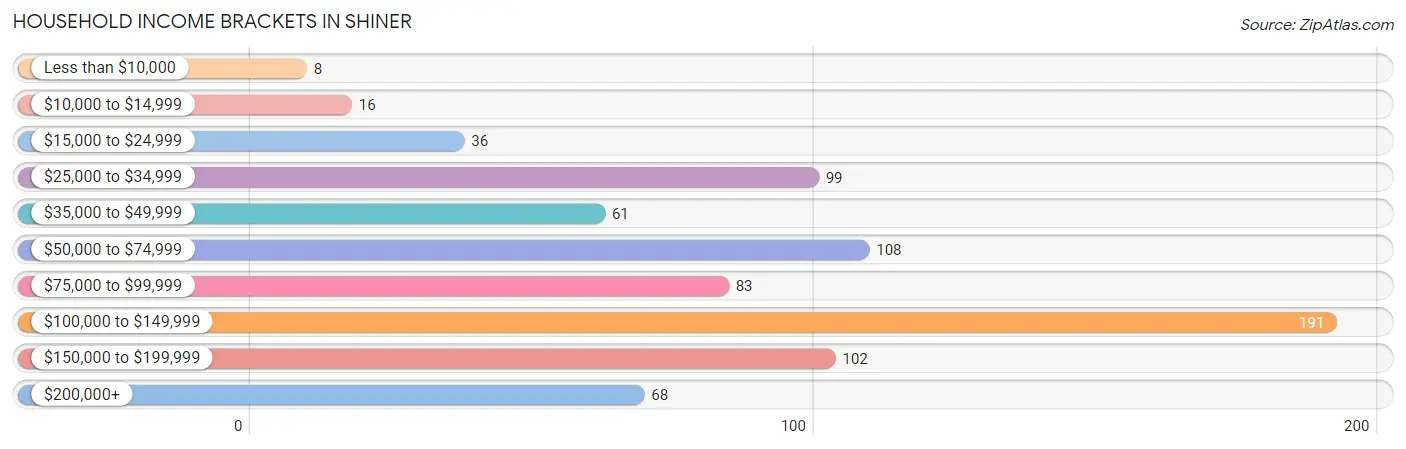
| Income Bracket | # Households | % Households |
| Less than $10,000 | 8 | 1.0% |
| $10,000 to $14,999 | 16 | 2.1% |
| $15,000 to $24,999 | 36 | 4.7% |
| $25,000 to $34,999 | 99 | 12.8% |
| $35,000 to $49,999 | 61 | 7.9% |
| $50,000 to $74,999 | 108 | 14.0% |
| $75,000 to $99,999 | 83 | 10.8% |
| $100,000 to $149,999 | 191 | 24.7% |
| $150,000 to $199,999 | 102 | 13.2% |
| $200,000+ | 68 | 8.8% |
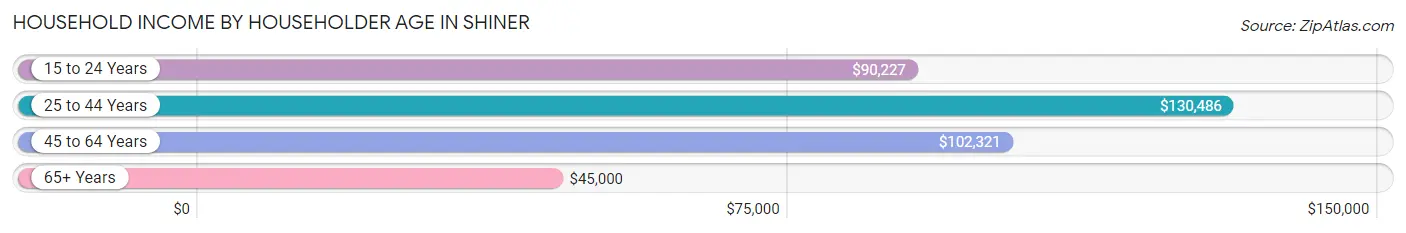
Household Income by Householder Age in Shiner
The median household income in Shiner is $90,119, with the highest median household income of $130,486 found in the 25 to 44 years age bracket for the primary householder. A total of 241 households (31.2%) fall into this category. Meanwhile, the 65+ years age bracket for the primary householder has the lowest median household income of $45,000, with 254 households (32.9%) in this group.
| Income Bracket | # Households | Median Income |
| 15 to 24 Years | 20 (2.6%) | $90,227 |
| 25 to 44 Years | 241 (31.2%) | $130,486 |
| 45 to 64 Years | 257 (33.3%) | $102,321 |
| 65+ Years | 254 (32.9%) | $45,000 |
| Total | 772 (100.0%) | $90,119 |
Poverty in Shiner
Income Below Poverty by Sex and Age in Shiner
With 4.4% poverty level for males and 7.2% for females among the residents of Shiner, 12 to 14 year old males and 5 year old females are the most vulnerable to poverty, with 18 males (100.0%) and 4 females (100.0%) in their respective age groups living below the poverty level.
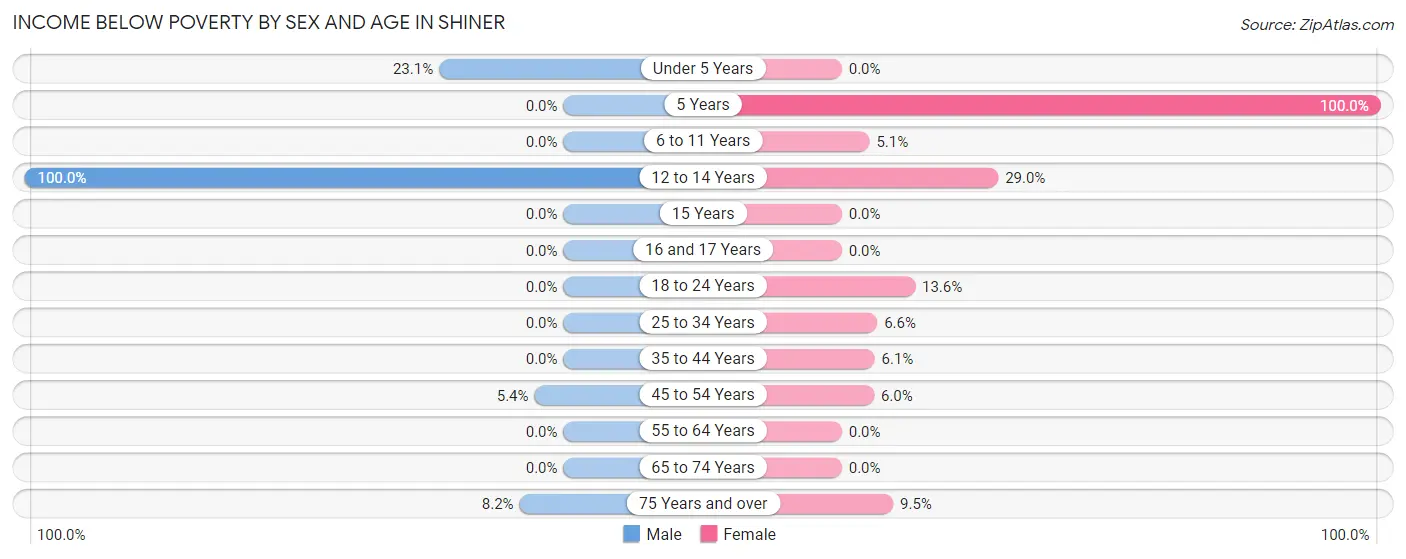
| Age Bracket | Male | Female |
| Under 5 Years | 12 (23.1%) | 0 (0.0%) |
| 5 Years | 0 (0.0%) | 4 (100.0%) |
| 6 to 11 Years | 0 (0.0%) | 6 (5.1%) |
| 12 to 14 Years | 18 (100.0%) | 18 (29.0%) |
| 15 Years | 0 (0.0%) | 0 (0.0%) |
| 16 and 17 Years | 0 (0.0%) | 0 (0.0%) |
| 18 to 24 Years | 0 (0.0%) | 17 (13.6%) |
| 25 to 34 Years | 0 (0.0%) | 5 (6.6%) |
| 35 to 44 Years | 0 (0.0%) | 7 (6.1%) |
| 45 to 54 Years | 7 (5.4%) | 8 (6.0%) |
| 55 to 64 Years | 0 (0.0%) | 0 (0.0%) |
| 65 to 74 Years | 0 (0.0%) | 0 (0.0%) |
| 75 Years and over | 4 (8.2%) | 14 (9.5%) |
| Total | 41 (4.4%) | 79 (7.2%) |
Income Above Poverty by Sex and Age in Shiner
According to the poverty statistics in Shiner, males aged 5 years and females aged under 5 years are the age groups that are most secure financially, with 100.0% of males and 100.0% of females in these age groups living above the poverty line.
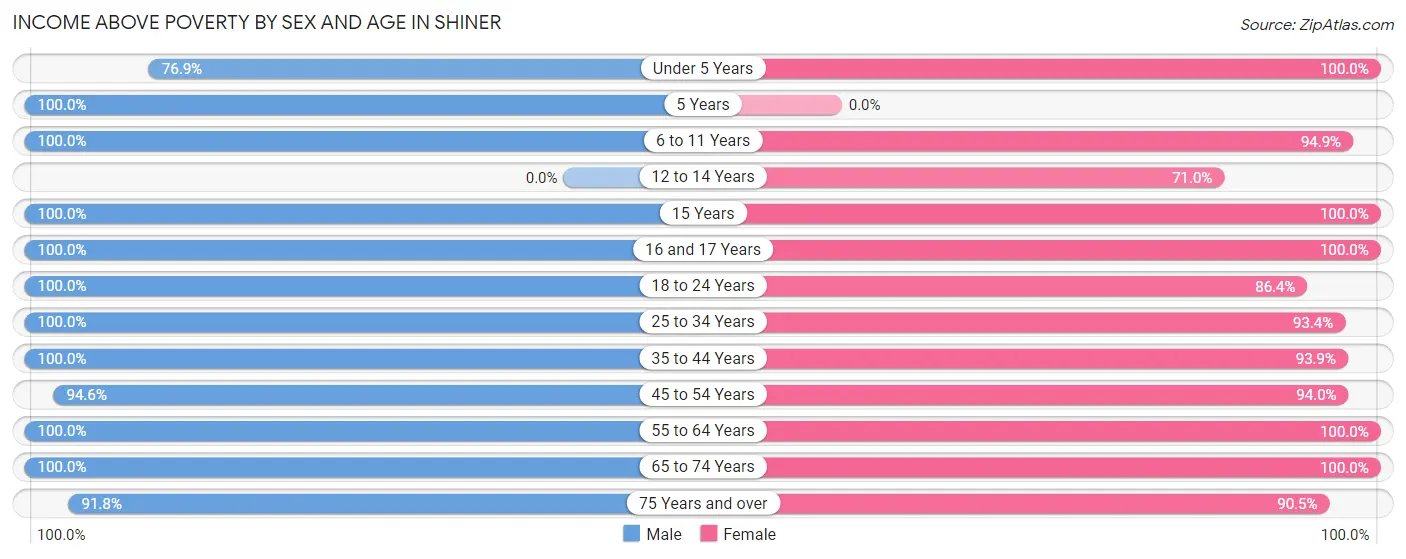
| Age Bracket | Male | Female |
| Under 5 Years | 40 (76.9%) | 37 (100.0%) |
| 5 Years | 26 (100.0%) | 0 (0.0%) |
| 6 to 11 Years | 126 (100.0%) | 111 (94.9%) |
| 12 to 14 Years | 0 (0.0%) | 44 (71.0%) |
| 15 Years | 19 (100.0%) | 23 (100.0%) |
| 16 and 17 Years | 31 (100.0%) | 31 (100.0%) |
| 18 to 24 Years | 56 (100.0%) | 108 (86.4%) |
| 25 to 34 Years | 133 (100.0%) | 71 (93.4%) |
| 35 to 44 Years | 76 (100.0%) | 108 (93.9%) |
| 45 to 54 Years | 123 (94.6%) | 126 (94.0%) |
| 55 to 64 Years | 104 (100.0%) | 129 (100.0%) |
| 65 to 74 Years | 108 (100.0%) | 95 (100.0%) |
| 75 Years and over | 45 (91.8%) | 133 (90.5%) |
| Total | 887 (95.6%) | 1,016 (92.8%) |
Income Below Poverty Among Married-Couple Families in Shiner
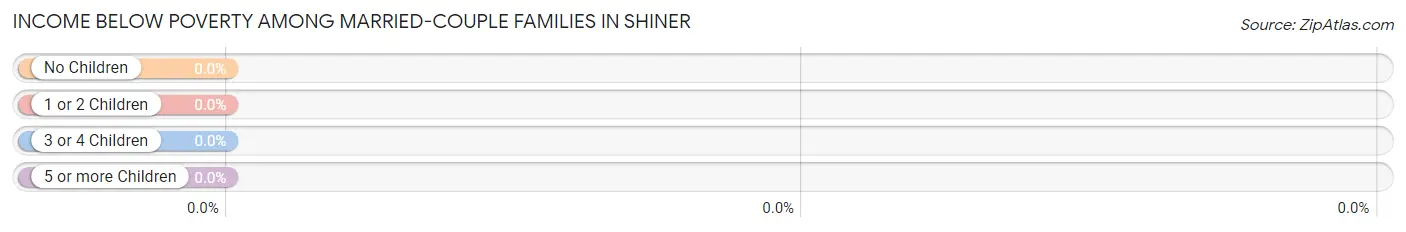
| Children | Above Poverty | Below Poverty |
| No Children | 327 (100.0%) | 0 (0.0%) |
| 1 or 2 Children | 141 (100.0%) | 0 (0.0%) |
| 3 or 4 Children | 27 (100.0%) | 0 (0.0%) |
| 5 or more Children | 5 (100.0%) | 0 (0.0%) |
| Total | 500 (100.0%) | 0 (0.0%) |
Income Below Poverty Among Single-Parent Households in Shiner
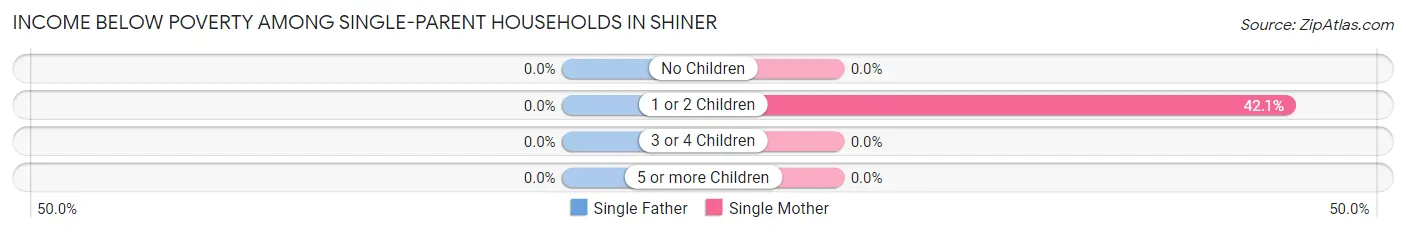
| Children | Single Father | Single Mother |
| No Children | 0 (0.0%) | 0 (0.0%) |
| 1 or 2 Children | 0 (0.0%) | 24 (42.1%) |
| 3 or 4 Children | 0 (0.0%) | 0 (0.0%) |
| 5 or more Children | 0 (0.0%) | 0 (0.0%) |
| Total | 0 (0.0%) | 24 (21.8%) |
Income Below Poverty Among Married-Couple vs Single-Parent Households in Shiner
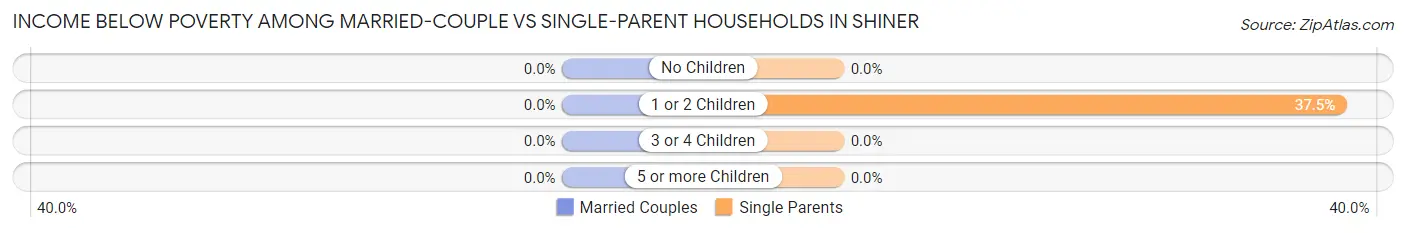
| Children | Married-Couple Families | Single-Parent Households |
| No Children | 0 (0.0%) | 0 (0.0%) |
| 1 or 2 Children | 0 (0.0%) | 24 (37.5%) |
| 3 or 4 Children | 0 (0.0%) | 0 (0.0%) |
| 5 or more Children | 0 (0.0%) | 0 (0.0%) |
| Total | 0 (0.0%) | 24 (19.8%) |
Race in Shiner
The most populous races in Shiner are White / Caucasian (1,838 | 87.7%), Hispanic or Latino (138 | 6.6%), and Two or more Races (133 | 6.4%).
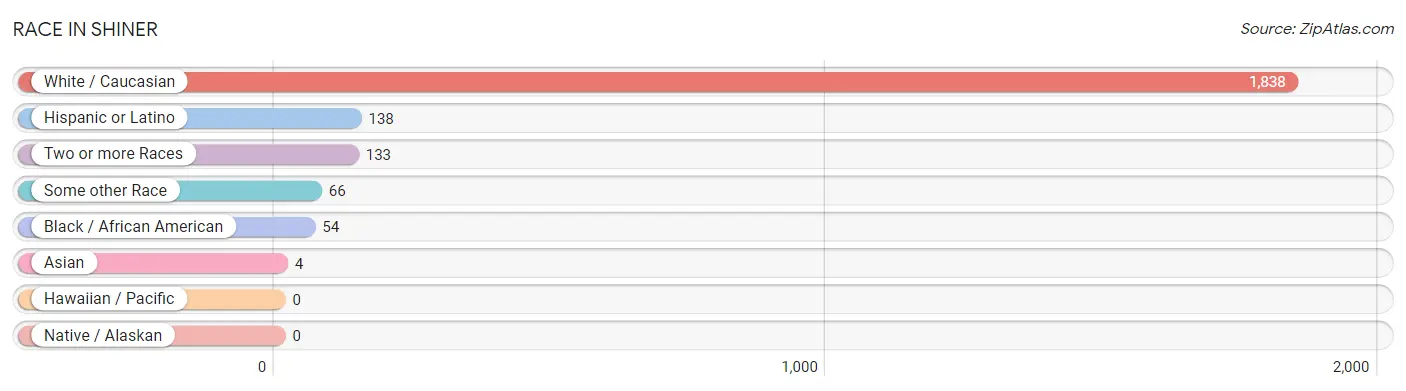
| Race | # Population | % Population |
| Asian | 4 | 0.2% |
| Black / African American | 54 | 2.6% |
| Hawaiian / Pacific | 0 | 0.0% |
| Hispanic or Latino | 138 | 6.6% |
| Native / Alaskan | 0 | 0.0% |
| White / Caucasian | 1,838 | 87.7% |
| Two or more Races | 133 | 6.4% |
| Some other Race | 66 | 3.2% |
| Total | 2,095 | 100.0% |
Ancestry in Shiner
The most populous ancestries reported in Shiner are German (971 | 46.4%), Czech (837 | 40.0%), English (256 | 12.2%), Irish (168 | 8.0%), and Mexican (119 | 5.7%), together accounting for 112.2% of all Shiner residents.
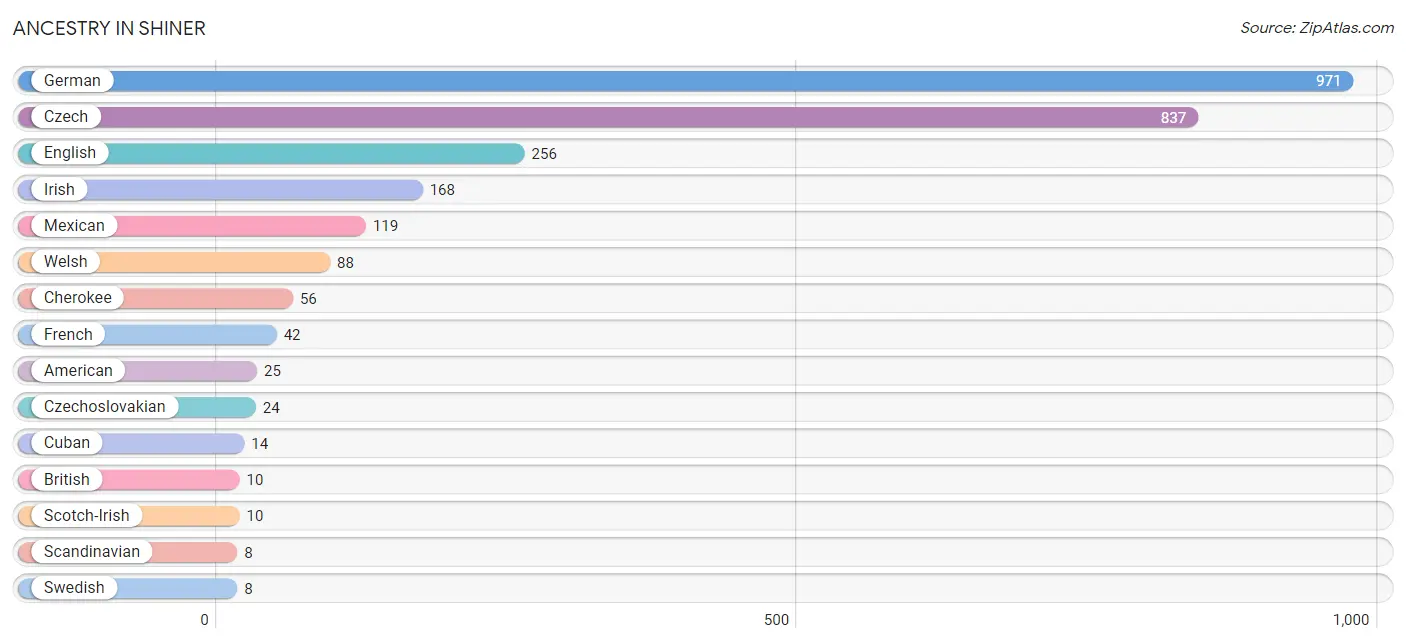
| Ancestry | # Population | % Population |
| American | 25 | 1.2% |
| Arab | 6 | 0.3% |
| Austrian | 6 | 0.3% |
| British | 10 | 0.5% |
| Celtic | 5 | 0.2% |
| Central American | 1 | 0.1% |
| Cherokee | 56 | 2.7% |
| Cuban | 14 | 0.7% |
| Czech | 837 | 40.0% |
| Czechoslovakian | 24 | 1.1% |
| English | 256 | 12.2% |
| Filipino | 5 | 0.2% |
| French | 42 | 2.0% |
| German | 971 | 46.4% |
| Honduran | 1 | 0.1% |
| Irish | 168 | 8.0% |
| Korean | 1 | 0.1% |
| Lebanese | 6 | 0.3% |
| Mexican | 119 | 5.7% |
| Polish | 7 | 0.3% |
| Russian | 7 | 0.3% |
| Scandinavian | 8 | 0.4% |
| Scotch-Irish | 10 | 0.5% |
| Scottish | 1 | 0.1% |
| Swedish | 8 | 0.4% |
| Swiss | 5 | 0.2% |
| Welsh | 88 | 4.2% | View All 27 Rows |
Immigrants in Shiner
The most numerous immigrant groups reported in Shiner came from Latin America (18 | 0.9%), Central America (14 | 0.7%), Mexico (13 | 0.6%), Canada (5 | 0.2%), and Asia (4 | 0.2%), together accounting for 2.6% of all Shiner residents.
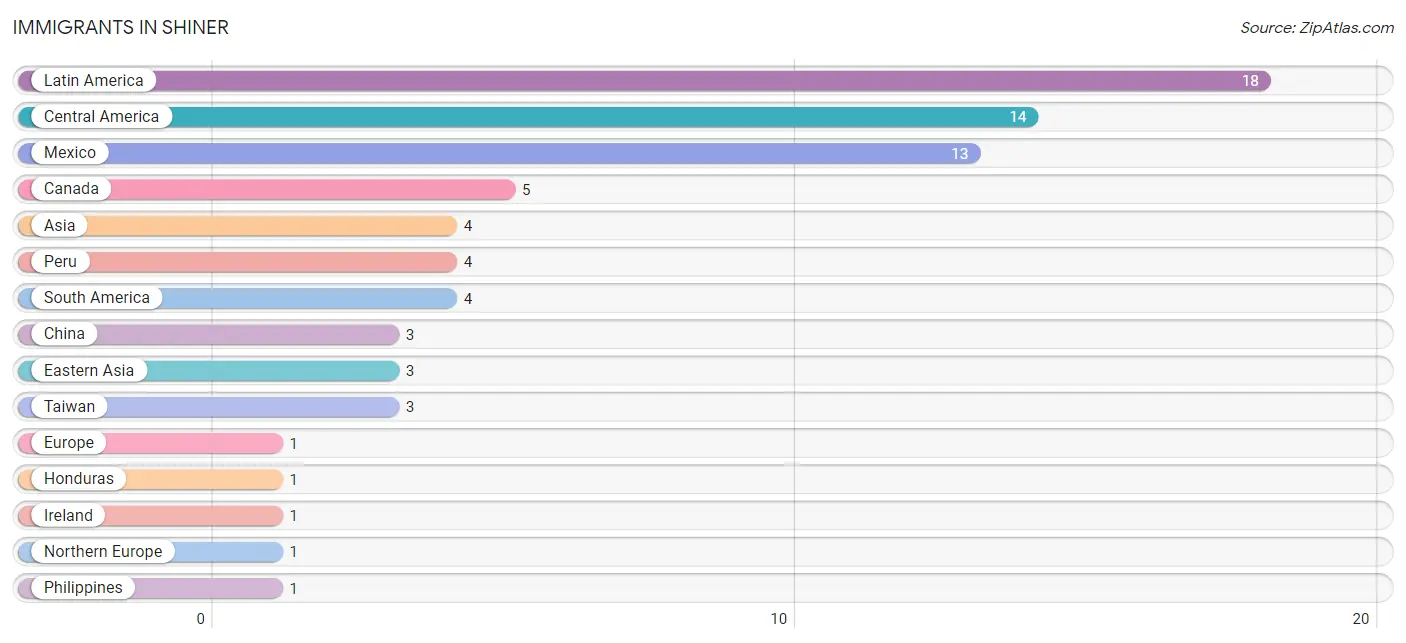
| Immigration Origin | # Population | % Population |
| Asia | 4 | 0.2% |
| Canada | 5 | 0.2% |
| Central America | 14 | 0.7% |
| China | 3 | 0.1% |
| Eastern Asia | 3 | 0.1% |
| Europe | 1 | 0.1% |
| Honduras | 1 | 0.1% |
| Ireland | 1 | 0.1% |
| Latin America | 18 | 0.9% |
| Mexico | 13 | 0.6% |
| Northern Europe | 1 | 0.1% |
| Peru | 4 | 0.2% |
| Philippines | 1 | 0.1% |
| South America | 4 | 0.2% |
| South Eastern Asia | 1 | 0.1% |
| Taiwan | 3 | 0.1% | View All 16 Rows |
Sex and Age in Shiner
Sex and Age in Shiner
The most populous age groups in Shiner are 5 to 9 Years (93 | 9.7%) for men and 15 to 19 Years (101 | 8.9%) for women.
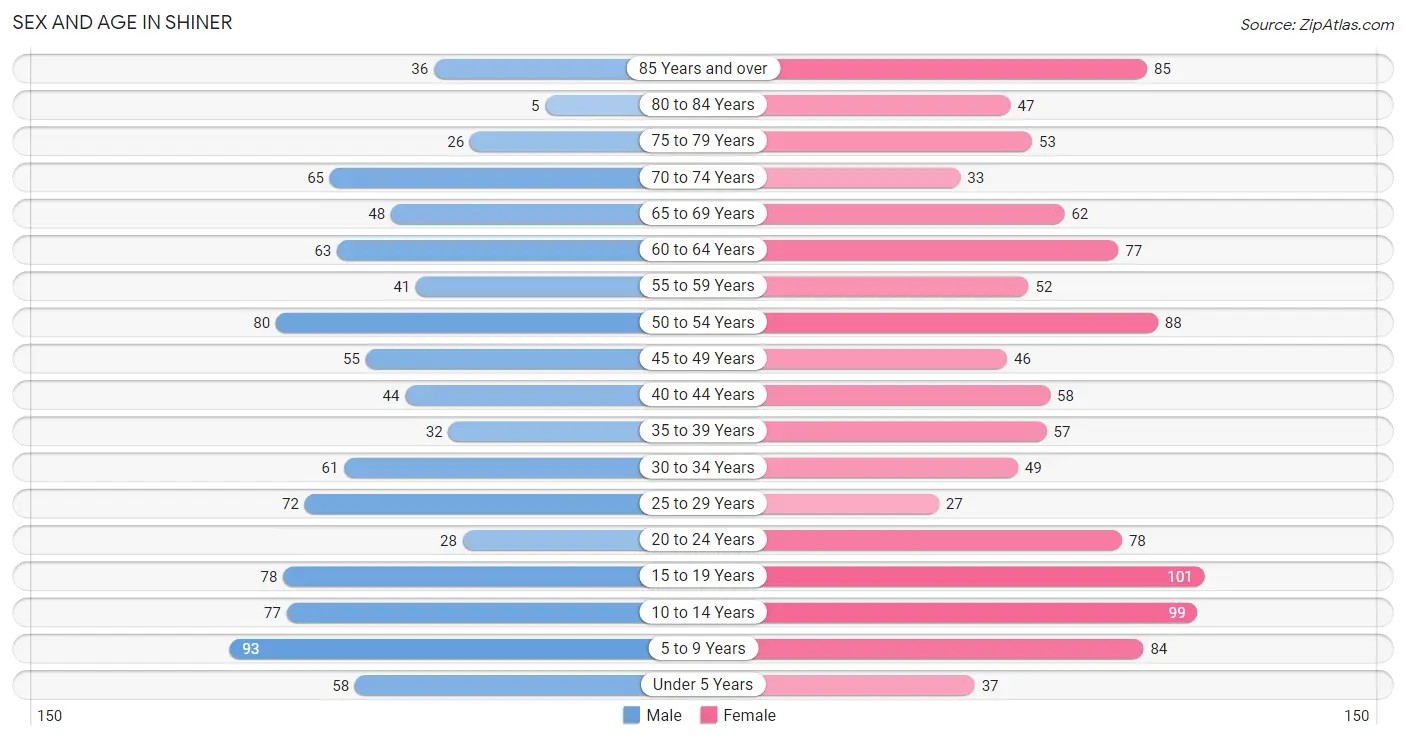
| Age Bracket | Male | Female |
| Under 5 Years | 58 (6.0%) | 37 (3.3%) |
| 5 to 9 Years | 93 (9.7%) | 84 (7.4%) |
| 10 to 14 Years | 77 (8.0%) | 99 (8.7%) |
| 15 to 19 Years | 78 (8.1%) | 101 (8.9%) |
| 20 to 24 Years | 28 (2.9%) | 78 (6.9%) |
| 25 to 29 Years | 72 (7.5%) | 27 (2.4%) |
| 30 to 34 Years | 61 (6.3%) | 49 (4.3%) |
| 35 to 39 Years | 32 (3.3%) | 57 (5.0%) |
| 40 to 44 Years | 44 (4.6%) | 58 (5.1%) |
| 45 to 49 Years | 55 (5.7%) | 46 (4.1%) |
| 50 to 54 Years | 80 (8.3%) | 88 (7.8%) |
| 55 to 59 Years | 41 (4.3%) | 52 (4.6%) |
| 60 to 64 Years | 63 (6.6%) | 77 (6.8%) |
| 65 to 69 Years | 48 (5.0%) | 62 (5.5%) |
| 70 to 74 Years | 65 (6.8%) | 33 (2.9%) |
| 75 to 79 Years | 26 (2.7%) | 53 (4.7%) |
| 80 to 84 Years | 5 (0.5%) | 47 (4.2%) |
| 85 Years and over | 36 (3.7%) | 85 (7.5%) |
| Total | 962 (100.0%) | 1,133 (100.0%) |
Families and Households in Shiner
Median Family Size in Shiner
The median family size in Shiner is 2.96 persons per family, with single female/mother families (110 | 17.7%) accounting for the largest median family size of 3.49 persons per family. On the other hand, married-couple families (500 | 80.5%) represent the smallest median family size with 2.84 persons per family.
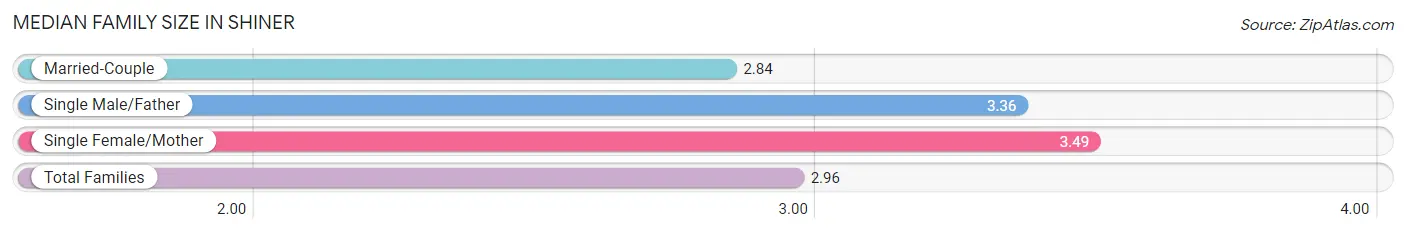
| Family Type | # Families | Family Size |
| Married-Couple | 500 (80.5%) | 2.84 |
| Single Male/Father | 11 (1.8%) | 3.36 |
| Single Female/Mother | 110 (17.7%) | 3.49 |
| Total Families | 621 (100.0%) | 2.96 |
Median Household Size in Shiner
The median household size in Shiner is 2.62 persons per household, with single male/father households (11 | 1.4%) accounting for the largest median household size of 3.73 persons per household. non-family households (151 | 19.6%) represent the smallest median household size with 1.01 persons per household.
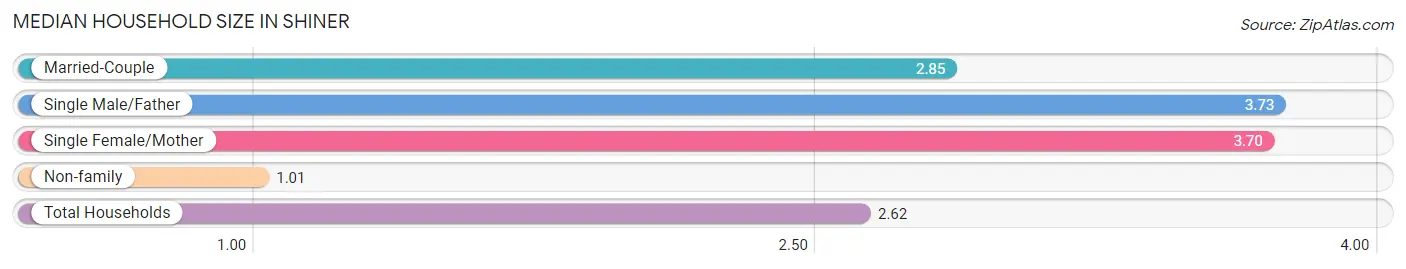
| Household Type | # Households | Household Size |
| Married-Couple | 500 (64.8%) | 2.85 |
| Single Male/Father | 11 (1.4%) | 3.73 |
| Single Female/Mother | 110 (14.2%) | 3.70 |
| Non-family | 151 (19.6%) | 1.01 |
| Total Households | 772 (100.0%) | 2.62 |
Household Size by Marriage Status in Shiner
Out of a total of 772 households in Shiner, 621 (80.4%) are family households, while 151 (19.6%) are nonfamily households. The most numerous type of family households are 2-person households, comprising 373, and the most common type of nonfamily households are 1-person households, comprising 146.
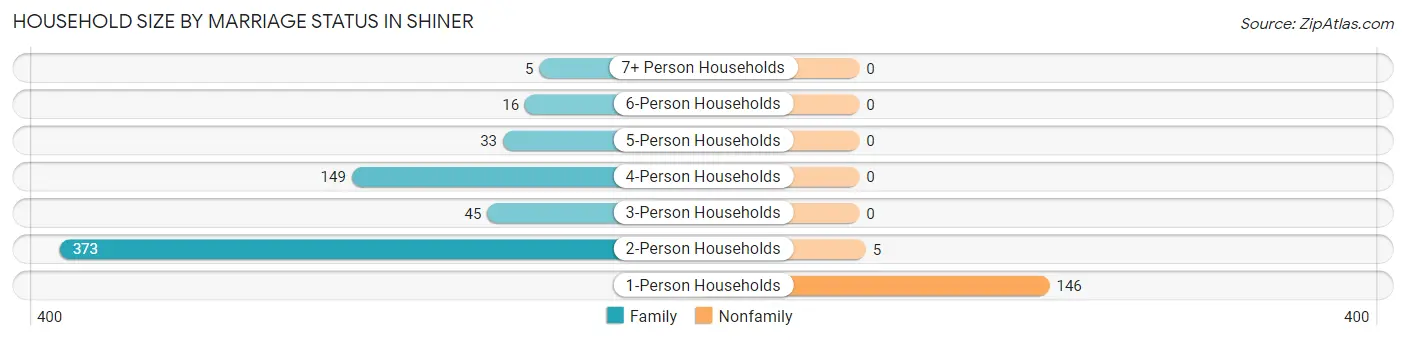
| Household Size | Family Households | Nonfamily Households |
| 1-Person Households | - | 146 (18.9%) |
| 2-Person Households | 373 (48.3%) | 5 (0.6%) |
| 3-Person Households | 45 (5.8%) | 0 (0.0%) |
| 4-Person Households | 149 (19.3%) | 0 (0.0%) |
| 5-Person Households | 33 (4.3%) | 0 (0.0%) |
| 6-Person Households | 16 (2.1%) | 0 (0.0%) |
| 7+ Person Households | 5 (0.6%) | 0 (0.0%) |
| Total | 621 (80.4%) | 151 (19.6%) |
Female Fertility in Shiner
Fertility by Age in Shiner
Average fertility rate in Shiner is 54.0 births per 1,000 women. Women in the age bracket of 20 to 34 years have the highest fertility rate with 143.0 births per 1,000 women. Women in the age bracket of 20 to 34 years acount for 95.7% of all women with births.
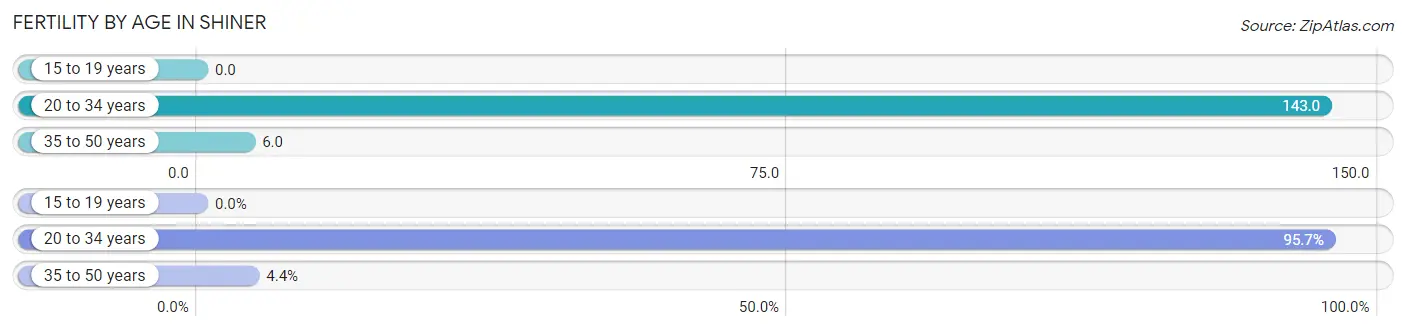
| Age Bracket | Women with Births | Births / 1,000 Women |
| 15 to 19 years | 0 (0.0%) | 0.0 |
| 20 to 34 years | 22 (95.7%) | 143.0 |
| 35 to 50 years | 1 (4.3%) | 6.0 |
| Total | 23 (100.0%) | 54.0 |
Fertility by Age by Marriage Status in Shiner
73.9% of women with births (23) in Shiner are married. The highest percentage of unmarried women with births falls into 35 to 50 years age bracket with 100.0% of them unmarried at the time of birth, while the lowest percentage of unmarried women with births belong to 20 to 34 years age bracket with 22.7% of them unmarried.
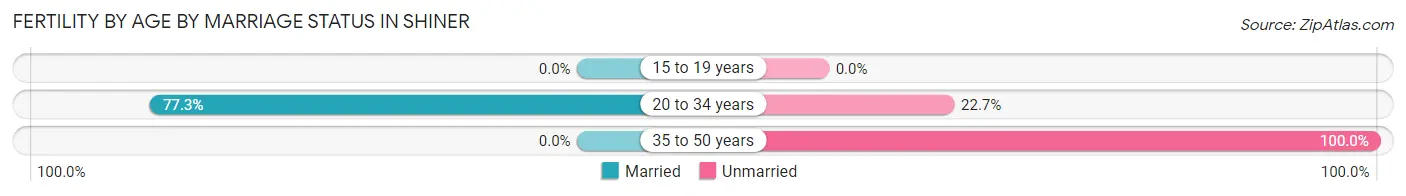
| Age Bracket | Married | Unmarried |
| 15 to 19 years | 0 (0.0%) | 0 (0.0%) |
| 20 to 34 years | 17 (77.3%) | 5 (22.7%) |
| 35 to 50 years | 0 (0.0%) | 1 (100.0%) |
| Total | 17 (73.9%) | 6 (26.1%) |
Fertility by Education in Shiner
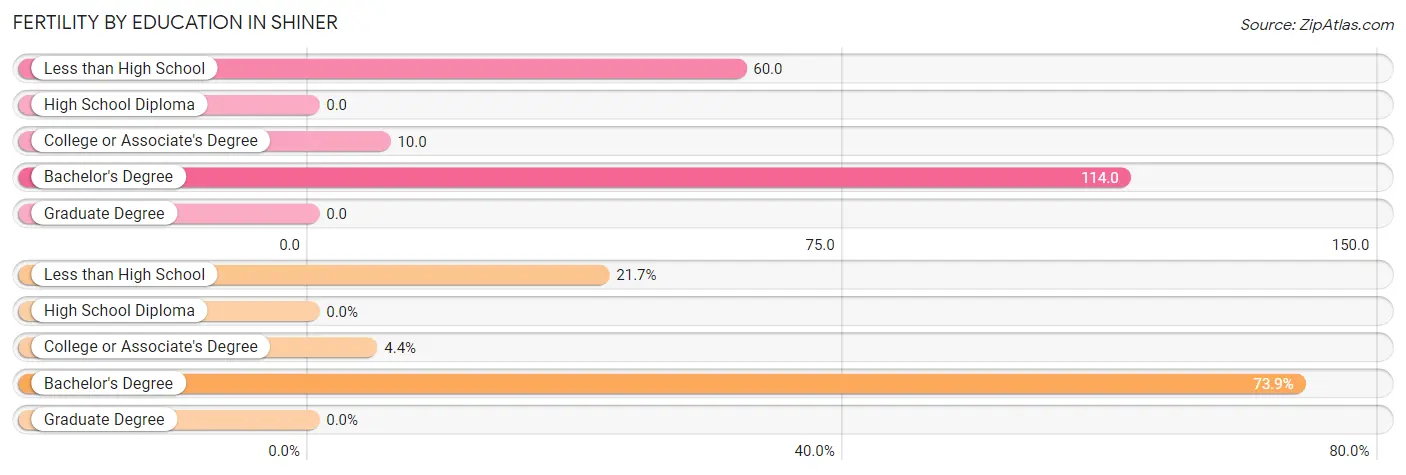
| Educational Attainment | Women with Births | Births / 1,000 Women |
| Less than High School | 5 (21.7%) | 60.0 |
| High School Diploma | 0 (0.0%) | 0.0 |
| College or Associate's Degree | 1 (4.3%) | 10.0 |
| Bachelor's Degree | 17 (73.9%) | 114.0 |
| Graduate Degree | 0 (0.0%) | 0.0 |
| Total | 23 (100.0%) | 54.0 |
Fertility by Education by Marriage Status in Shiner
26.1% of women with births in Shiner are unmarried. Women with the educational attainment of bachelor's degree are most likely to be married with 100.0% of them married at childbirth, while women with the educational attainment of less than high school are least likely to be married with 100.0% of them unmarried at childbirth.
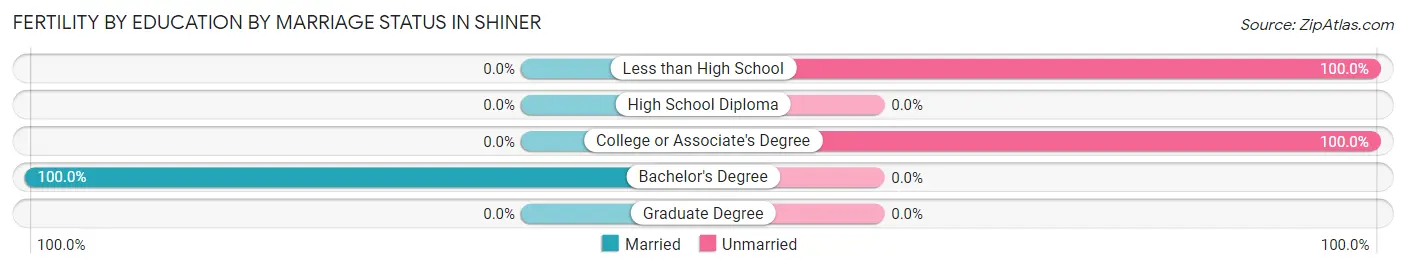
| Educational Attainment | Married | Unmarried |
| Less than High School | 0 (0.0%) | 5 (100.0%) |
| High School Diploma | 0 (0.0%) | 0 (0.0%) |
| College or Associate's Degree | 0 (0.0%) | 1 (100.0%) |
| Bachelor's Degree | 17 (100.0%) | 0 (0.0%) |
| Graduate Degree | 0 (0.0%) | 0 (0.0%) |
| Total | 17 (73.9%) | 6 (26.1%) |
Employment Characteristics in Shiner
Employment by Class of Employer in Shiner
Among the 993 employed individuals in Shiner, private company employees (639 | 64.3%), local government employees (180 | 18.1%), and not-for-profit organizations (63 | 6.3%) make up the most common classes of employment.
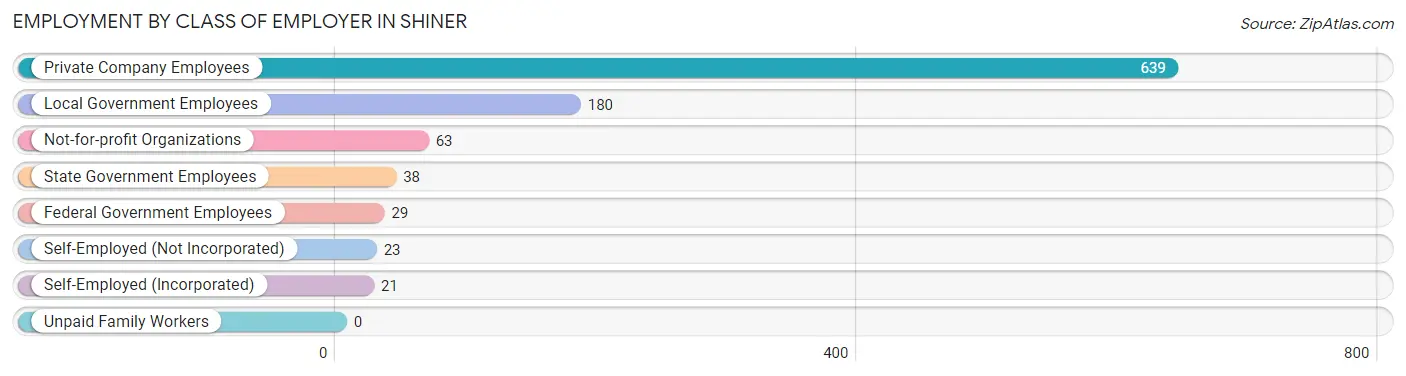
| Employer Class | # Employees | % Employees |
| Private Company Employees | 639 | 64.3% |
| Self-Employed (Incorporated) | 21 | 2.1% |
| Self-Employed (Not Incorporated) | 23 | 2.3% |
| Not-for-profit Organizations | 63 | 6.3% |
| Local Government Employees | 180 | 18.1% |
| State Government Employees | 38 | 3.8% |
| Federal Government Employees | 29 | 2.9% |
| Unpaid Family Workers | 0 | 0.0% |
| Total | 993 | 100.0% |
Employment Status by Age in Shiner
According to the labor force statistics for Shiner, out of the total population over 16 years of age (1,605), 63.1% or 1,013 individuals are in the labor force, with 2.0% or 20 of them unemployed. The age group with the highest labor force participation rate is 30 to 34 years, with 98.2% or 108 individuals in the labor force. Within the labor force, the 25 to 29 years age range has the highest percentage of unemployed individuals, with 12.8% or 12 of them being unemployed.
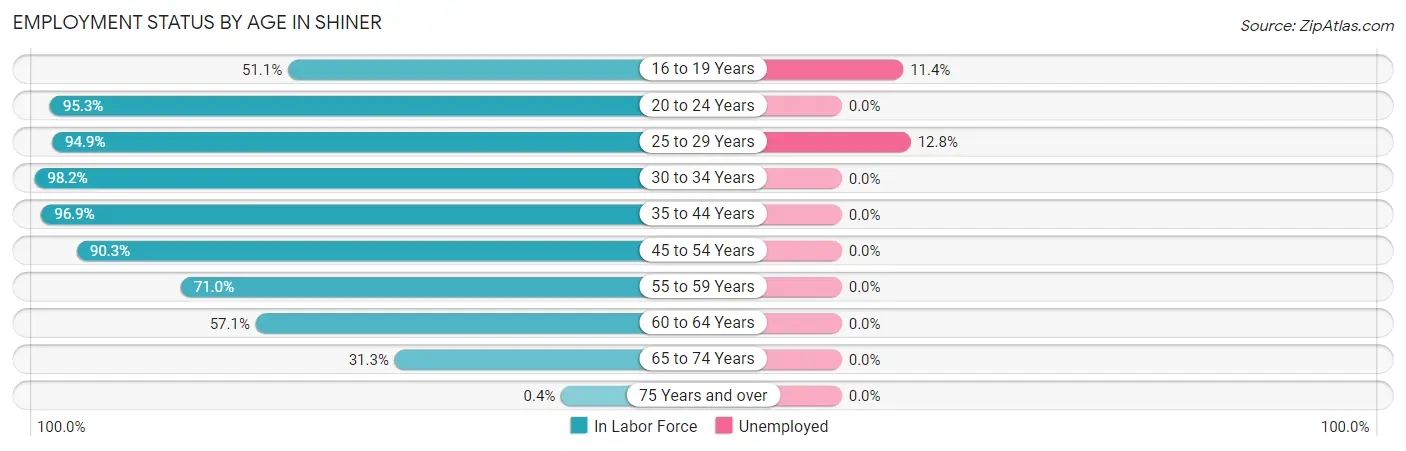
| Age Bracket | In Labor Force | Unemployed |
| 16 to 19 Years | 70 (51.1%) | 8 (11.4%) |
| 20 to 24 Years | 101 (95.3%) | 0 (0.0%) |
| 25 to 29 Years | 94 (94.9%) | 12 (12.8%) |
| 30 to 34 Years | 108 (98.2%) | 0 (0.0%) |
| 35 to 44 Years | 185 (96.9%) | 0 (0.0%) |
| 45 to 54 Years | 243 (90.3%) | 0 (0.0%) |
| 55 to 59 Years | 66 (71.0%) | 0 (0.0%) |
| 60 to 64 Years | 80 (57.1%) | 0 (0.0%) |
| 65 to 74 Years | 65 (31.3%) | 0 (0.0%) |
| 75 Years and over | 1 (0.4%) | 0 (0.0%) |
| Total | 1,013 (63.1%) | 20 (2.0%) |
Employment Status by Educational Attainment in Shiner
According to labor force statistics for Shiner, 86.0% of individuals (776) out of the total population between 25 and 64 years of age (902) are in the labor force, with 1.5% or 12 of them being unemployed. The group with the highest labor force participation rate are those with the educational attainment of college / associate degree, with 88.0% or 184 individuals in the labor force. Within the labor force, individuals with high school diploma education have the highest percentage of unemployment, with 5.1% or 12 of them being unemployed.
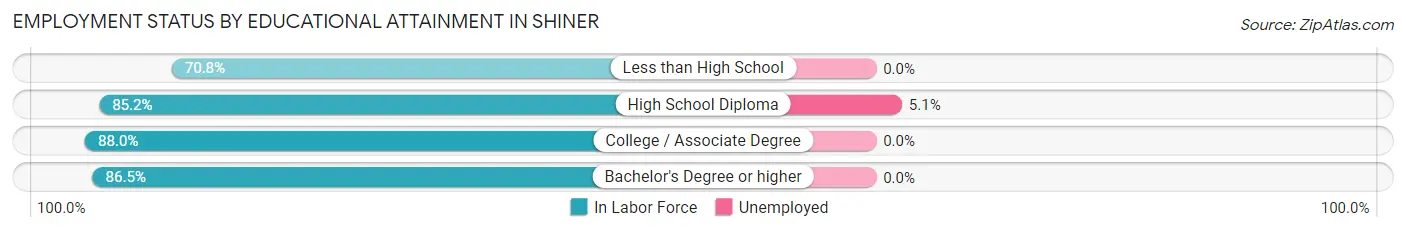
| Educational Attainment | In Labor Force | Unemployed |
| Less than High School | 17 (70.8%) | 0 (0.0%) |
| High School Diploma | 236 (85.2%) | 14 (5.1%) |
| College / Associate Degree | 184 (88.0%) | 0 (0.0%) |
| Bachelor's Degree or higher | 339 (86.5%) | 0 (0.0%) |
| Total | 776 (86.0%) | 14 (1.5%) |
Employment Occupations by Sex in Shiner
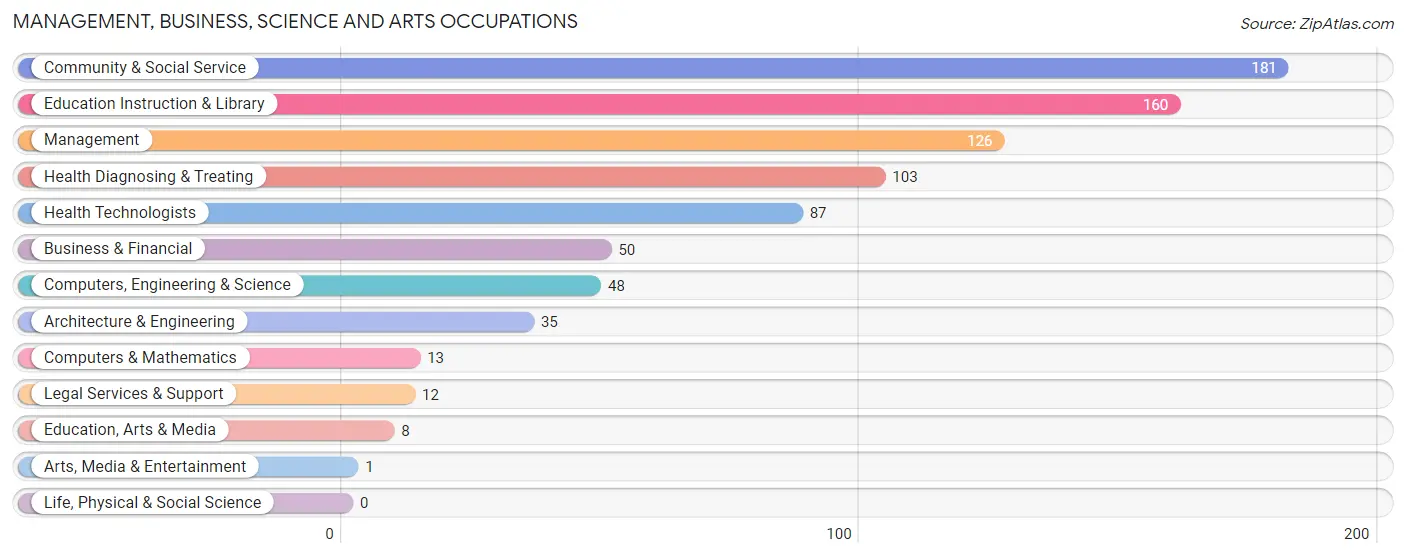
Management, Business, Science and Arts Occupations
The most common Management, Business, Science and Arts occupations in Shiner are Community & Social Service (181 | 18.2%), Education Instruction & Library (160 | 16.1%), Management (126 | 12.7%), Health Diagnosing & Treating (103 | 10.4%), and Health Technologists (87 | 8.8%).
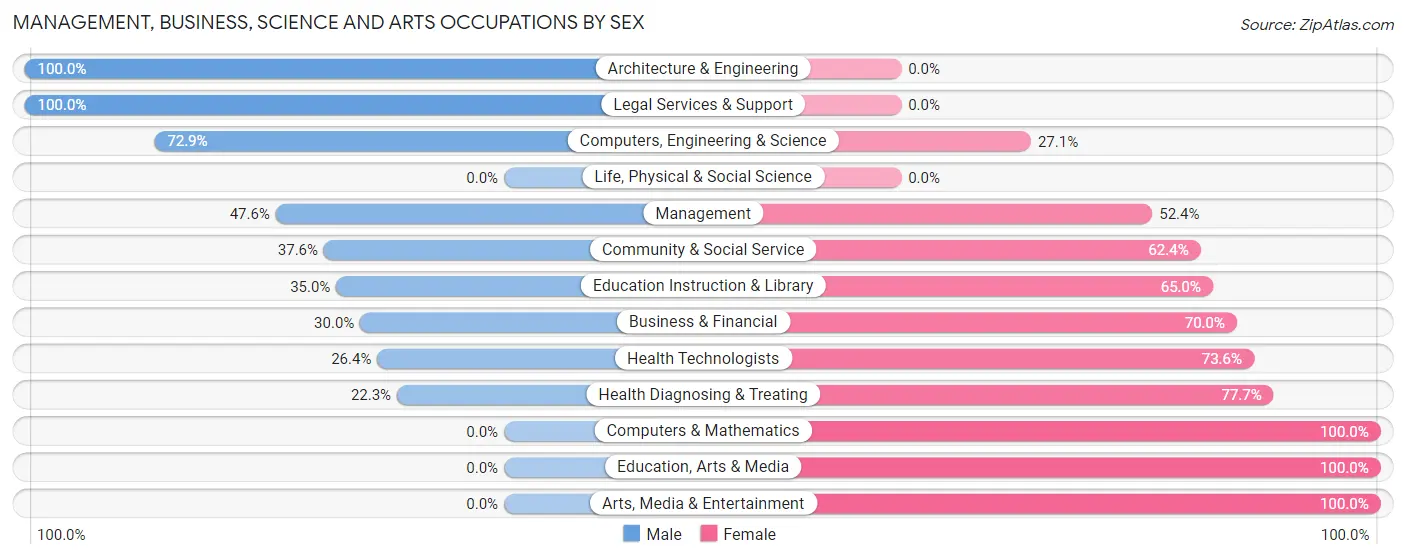
Management, Business, Science and Arts Occupations by Sex
Within the Management, Business, Science and Arts occupations in Shiner, the most male-oriented occupations are Architecture & Engineering (100.0%), Legal Services & Support (100.0%), and Computers, Engineering & Science (72.9%), while the most female-oriented occupations are Computers & Mathematics (100.0%), Education, Arts & Media (100.0%), and Arts, Media & Entertainment (100.0%).
| Occupation | Male | Female |
| Management | 60 (47.6%) | 66 (52.4%) |
| Business & Financial | 15 (30.0%) | 35 (70.0%) |
| Computers, Engineering & Science | 35 (72.9%) | 13 (27.1%) |
| Computers & Mathematics | 0 (0.0%) | 13 (100.0%) |
| Architecture & Engineering | 35 (100.0%) | 0 (0.0%) |
| Life, Physical & Social Science | 0 (0.0%) | 0 (0.0%) |
| Community & Social Service | 68 (37.6%) | 113 (62.4%) |
| Education, Arts & Media | 0 (0.0%) | 8 (100.0%) |
| Legal Services & Support | 12 (100.0%) | 0 (0.0%) |
| Education Instruction & Library | 56 (35.0%) | 104 (65.0%) |
| Arts, Media & Entertainment | 0 (0.0%) | 1 (100.0%) |
| Health Diagnosing & Treating | 23 (22.3%) | 80 (77.7%) |
| Health Technologists | 23 (26.4%) | 64 (73.6%) |
| Total (Category) | 201 (39.6%) | 307 (60.4%) |
| Total (Overall) | 462 (46.5%) | 531 (53.5%) |
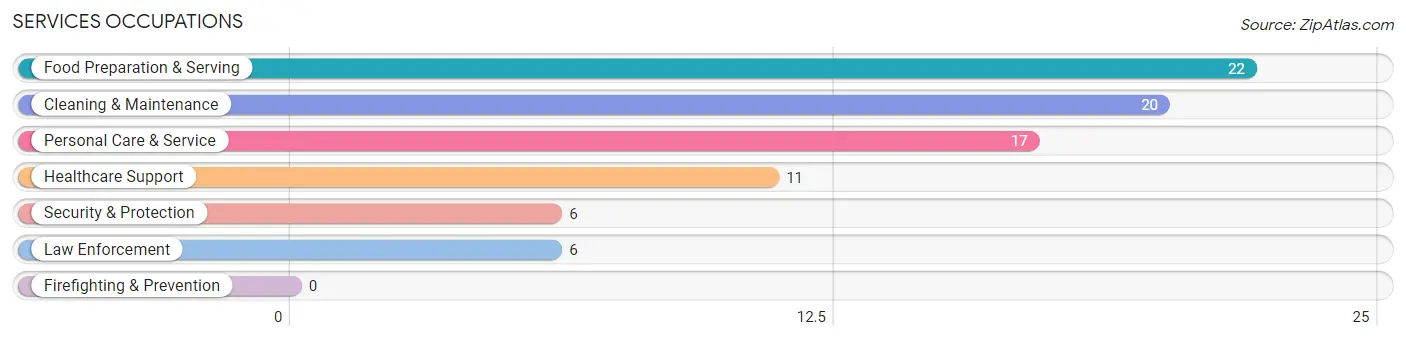
Services Occupations
The most common Services occupations in Shiner are Food Preparation & Serving (22 | 2.2%), Cleaning & Maintenance (20 | 2.0%), Personal Care & Service (17 | 1.7%), Healthcare Support (11 | 1.1%), and Security & Protection (6 | 0.6%).
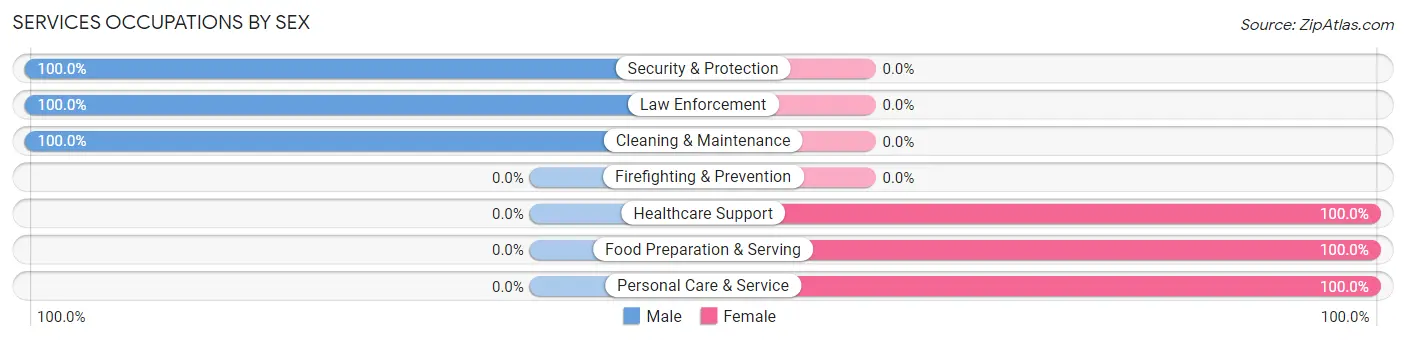
Services Occupations by Sex
Within the Services occupations in Shiner, the most male-oriented occupations are Security & Protection (100.0%), Law Enforcement (100.0%), and Cleaning & Maintenance (100.0%), while the most female-oriented occupations are Healthcare Support (100.0%), Food Preparation & Serving (100.0%), and Personal Care & Service (100.0%).
| Occupation | Male | Female |
| Healthcare Support | 0 (0.0%) | 11 (100.0%) |
| Security & Protection | 6 (100.0%) | 0 (0.0%) |
| Firefighting & Prevention | 0 (0.0%) | 0 (0.0%) |
| Law Enforcement | 6 (100.0%) | 0 (0.0%) |
| Food Preparation & Serving | 0 (0.0%) | 22 (100.0%) |
| Cleaning & Maintenance | 20 (100.0%) | 0 (0.0%) |
| Personal Care & Service | 0 (0.0%) | 17 (100.0%) |
| Total (Category) | 26 (34.2%) | 50 (65.8%) |
| Total (Overall) | 462 (46.5%) | 531 (53.5%) |
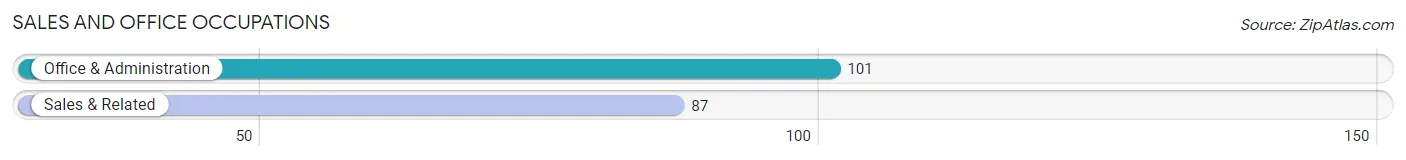
Sales and Office Occupations
The most common Sales and Office occupations in Shiner are Office & Administration (101 | 10.2%), and Sales & Related (87 | 8.8%).
Sales and Office Occupations by Sex
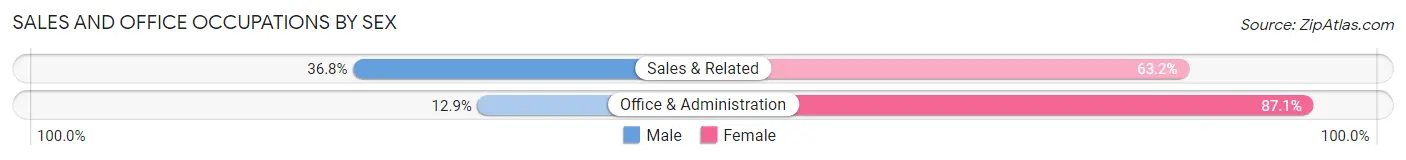
| Occupation | Male | Female |
| Sales & Related | 32 (36.8%) | 55 (63.2%) |
| Office & Administration | 13 (12.9%) | 88 (87.1%) |
| Total (Category) | 45 (23.9%) | 143 (76.1%) |
| Total (Overall) | 462 (46.5%) | 531 (53.5%) |
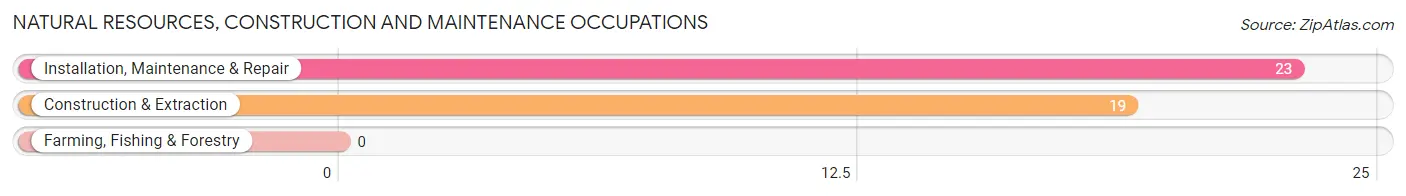
Natural Resources, Construction and Maintenance Occupations
The most common Natural Resources, Construction and Maintenance occupations in Shiner are Installation, Maintenance & Repair (23 | 2.3%), and Construction & Extraction (19 | 1.9%).
Natural Resources, Construction and Maintenance Occupations by Sex
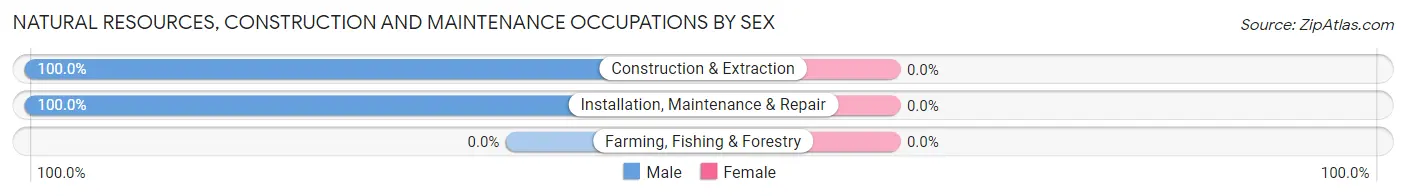
| Occupation | Male | Female |
| Farming, Fishing & Forestry | 0 (0.0%) | 0 (0.0%) |
| Construction & Extraction | 19 (100.0%) | 0 (0.0%) |
| Installation, Maintenance & Repair | 23 (100.0%) | 0 (0.0%) |
| Total (Category) | 42 (100.0%) | 0 (0.0%) |
| Total (Overall) | 462 (46.5%) | 531 (53.5%) |
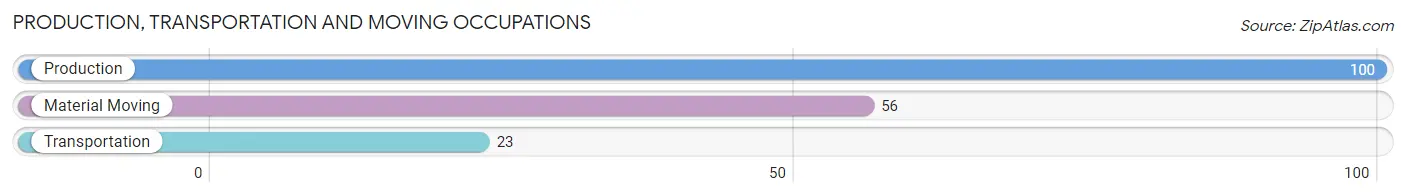
Production, Transportation and Moving Occupations
The most common Production, Transportation and Moving occupations in Shiner are Production (100 | 10.1%), Material Moving (56 | 5.6%), and Transportation (23 | 2.3%).
Production, Transportation and Moving Occupations by Sex
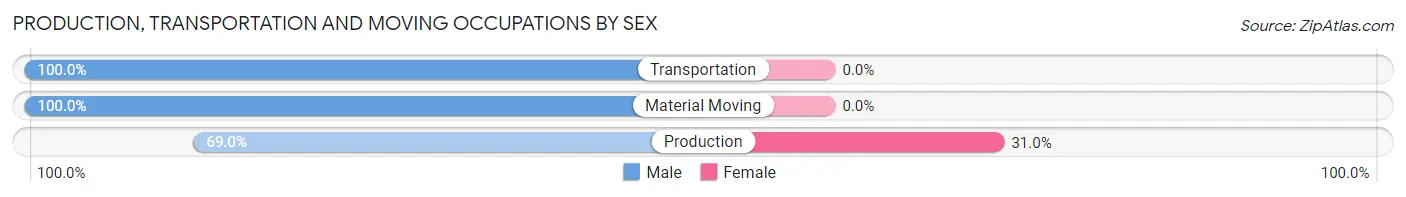
| Occupation | Male | Female |
| Production | 69 (69.0%) | 31 (31.0%) |
| Transportation | 23 (100.0%) | 0 (0.0%) |
| Material Moving | 56 (100.0%) | 0 (0.0%) |
| Total (Category) | 148 (82.7%) | 31 (17.3%) |
| Total (Overall) | 462 (46.5%) | 531 (53.5%) |
Employment Industries by Sex in Shiner
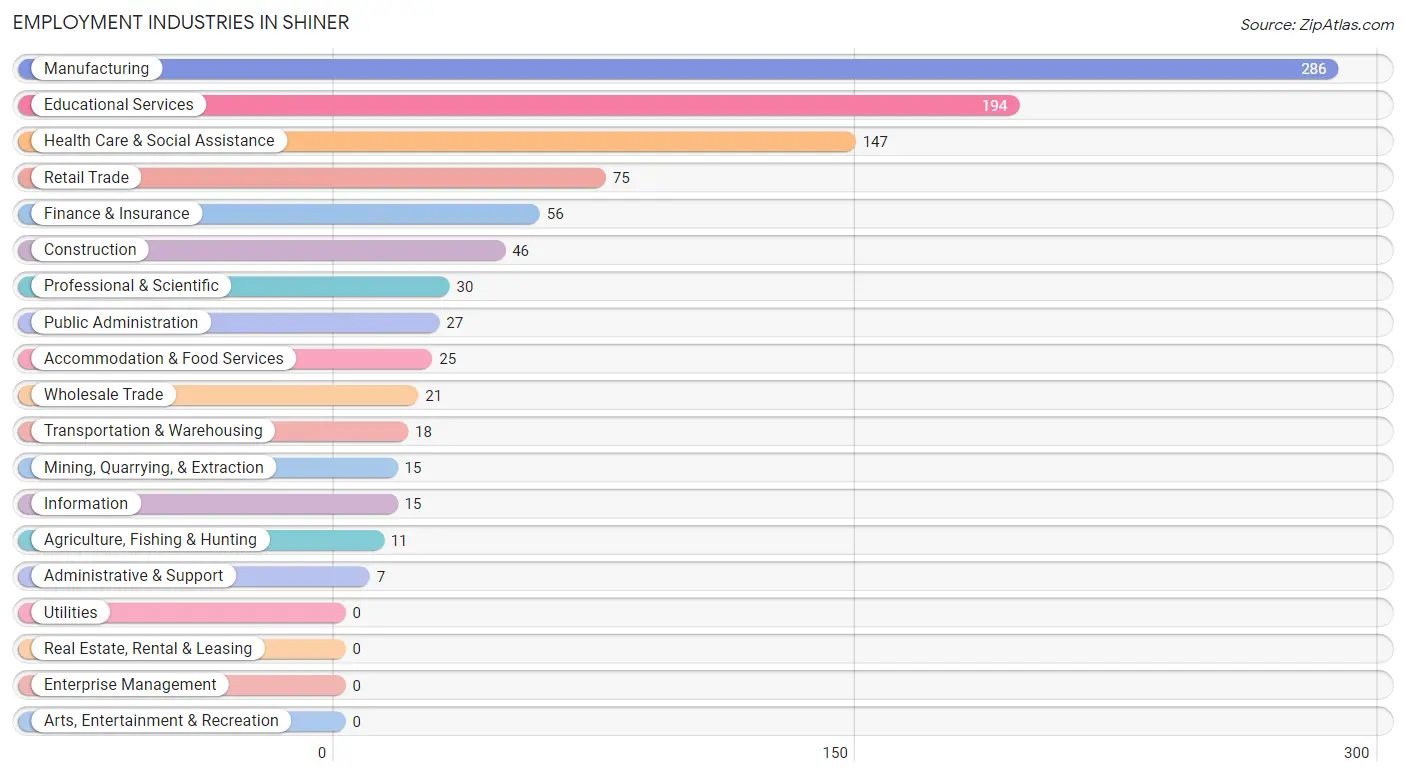
Employment Industries in Shiner
The major employment industries in Shiner include Manufacturing (286 | 28.8%), Educational Services (194 | 19.5%), Health Care & Social Assistance (147 | 14.8%), Retail Trade (75 | 7.5%), and Finance & Insurance (56 | 5.6%).
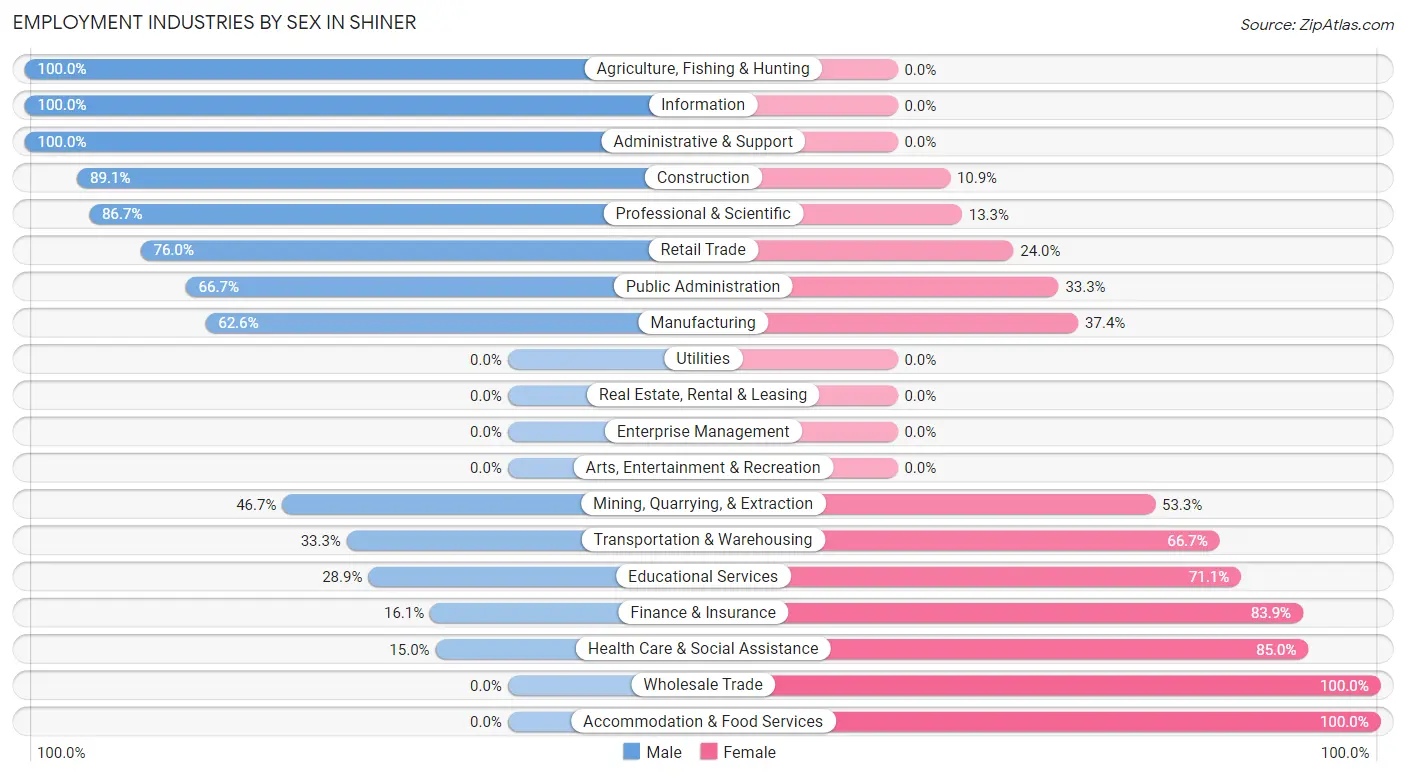
Employment Industries by Sex in Shiner
The Shiner industries that see more men than women are Agriculture, Fishing & Hunting (100.0%), Information (100.0%), and Administrative & Support (100.0%), whereas the industries that tend to have a higher number of women are Wholesale Trade (100.0%), Accommodation & Food Services (100.0%), and Health Care & Social Assistance (85.0%).
| Industry | Male | Female |
| Agriculture, Fishing & Hunting | 11 (100.0%) | 0 (0.0%) |
| Mining, Quarrying, & Extraction | 7 (46.7%) | 8 (53.3%) |
| Construction | 41 (89.1%) | 5 (10.9%) |
| Manufacturing | 179 (62.6%) | 107 (37.4%) |
| Wholesale Trade | 0 (0.0%) | 21 (100.0%) |
| Retail Trade | 57 (76.0%) | 18 (24.0%) |
| Transportation & Warehousing | 6 (33.3%) | 12 (66.7%) |
| Utilities | 0 (0.0%) | 0 (0.0%) |
| Information | 15 (100.0%) | 0 (0.0%) |
| Finance & Insurance | 9 (16.1%) | 47 (83.9%) |
| Real Estate, Rental & Leasing | 0 (0.0%) | 0 (0.0%) |
| Professional & Scientific | 26 (86.7%) | 4 (13.3%) |
| Enterprise Management | 0 (0.0%) | 0 (0.0%) |
| Administrative & Support | 7 (100.0%) | 0 (0.0%) |
| Educational Services | 56 (28.9%) | 138 (71.1%) |
| Health Care & Social Assistance | 22 (15.0%) | 125 (85.0%) |
| Arts, Entertainment & Recreation | 0 (0.0%) | 0 (0.0%) |
| Accommodation & Food Services | 0 (0.0%) | 25 (100.0%) |
| Public Administration | 18 (66.7%) | 9 (33.3%) |
| Total | 462 (46.5%) | 531 (53.5%) |
Education in Shiner
School Enrollment in Shiner
The most common levels of schooling among the 545 students in Shiner are high school (175 | 32.1%), middle school (120 | 22.0%), and elementary school (119 | 21.8%).
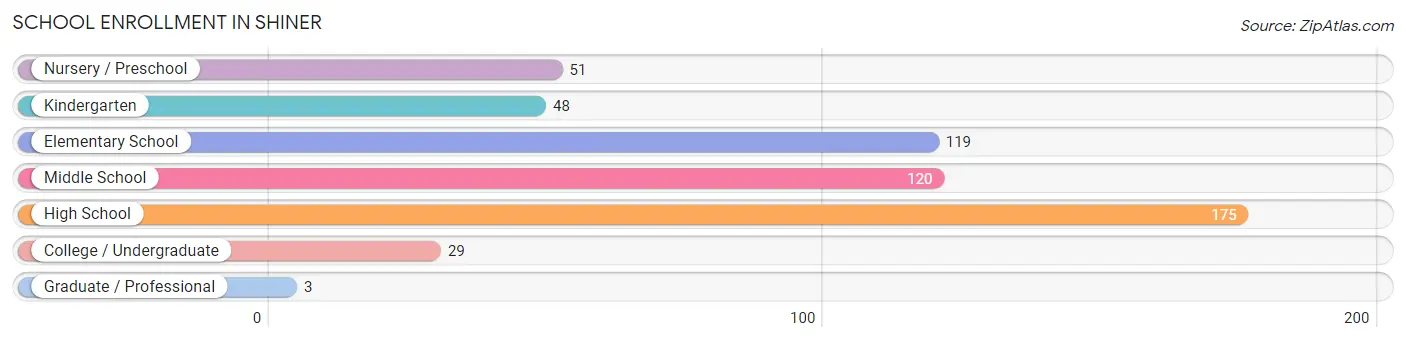
| School Level | # Students | % Students |
| Nursery / Preschool | 51 | 9.4% |
| Kindergarten | 48 | 8.8% |
| Elementary School | 119 | 21.8% |
| Middle School | 120 | 22.0% |
| High School | 175 | 32.1% |
| College / Undergraduate | 29 | 5.3% |
| Graduate / Professional | 3 | 0.5% |
| Total | 545 | 100.0% |
School Enrollment by Age by Funding Source in Shiner
Out of a total of 545 students who are enrolled in schools in Shiner, 109 (20.0%) attend a private institution, while the remaining 436 (80.0%) are enrolled in public schools. The age group of 20 to 24 year olds has the highest likelihood of being enrolled in private schools, with 1 (100.0% in the age bracket) enrolled. Conversely, the age group of 10 to 14 year olds has the lowest likelihood of being enrolled in a private school, with 149 (92.0% in the age bracket) attending a public institution.
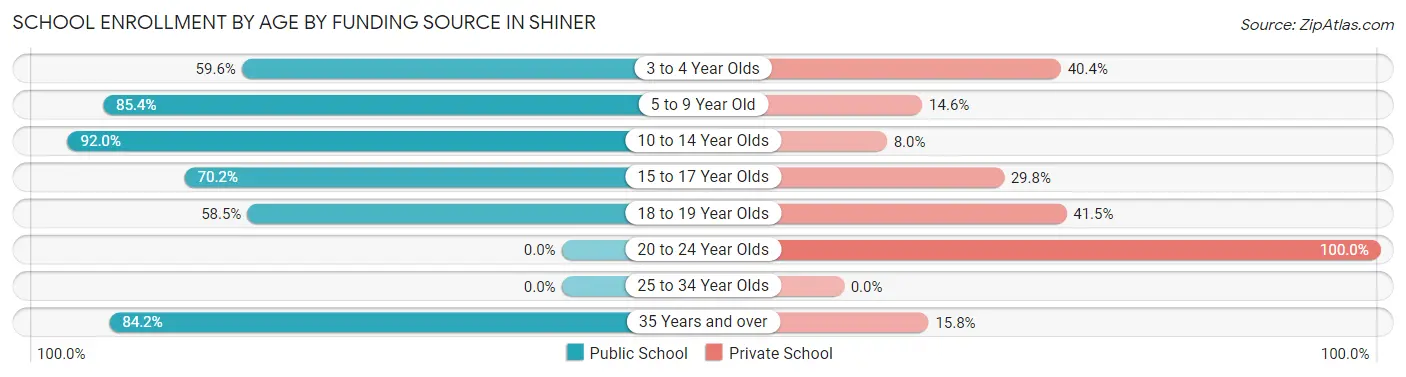
| Age Bracket | Public School | Private School |
| 3 to 4 Year Olds | 28 (59.6%) | 19 (40.4%) |
| 5 to 9 Year Old | 146 (85.4%) | 25 (14.6%) |
| 10 to 14 Year Olds | 149 (92.0%) | 13 (8.0%) |
| 15 to 17 Year Olds | 73 (70.2%) | 31 (29.8%) |
| 18 to 19 Year Olds | 24 (58.5%) | 17 (41.5%) |
| 20 to 24 Year Olds | 0 (0.0%) | 1 (100.0%) |
| 25 to 34 Year Olds | 0 (0.0%) | 0 (0.0%) |
| 35 Years and over | 16 (84.2%) | 3 (15.8%) |
| Total | 436 (80.0%) | 109 (20.0%) |
Educational Attainment by Field of Study in Shiner
Education (175 | 29.3%), business (101 | 16.9%), liberal arts & history (71 | 11.9%), science & technology (50 | 8.4%), and communications (46 | 7.7%) are the most common fields of study among 598 individuals in Shiner who have obtained a bachelor's degree or higher.
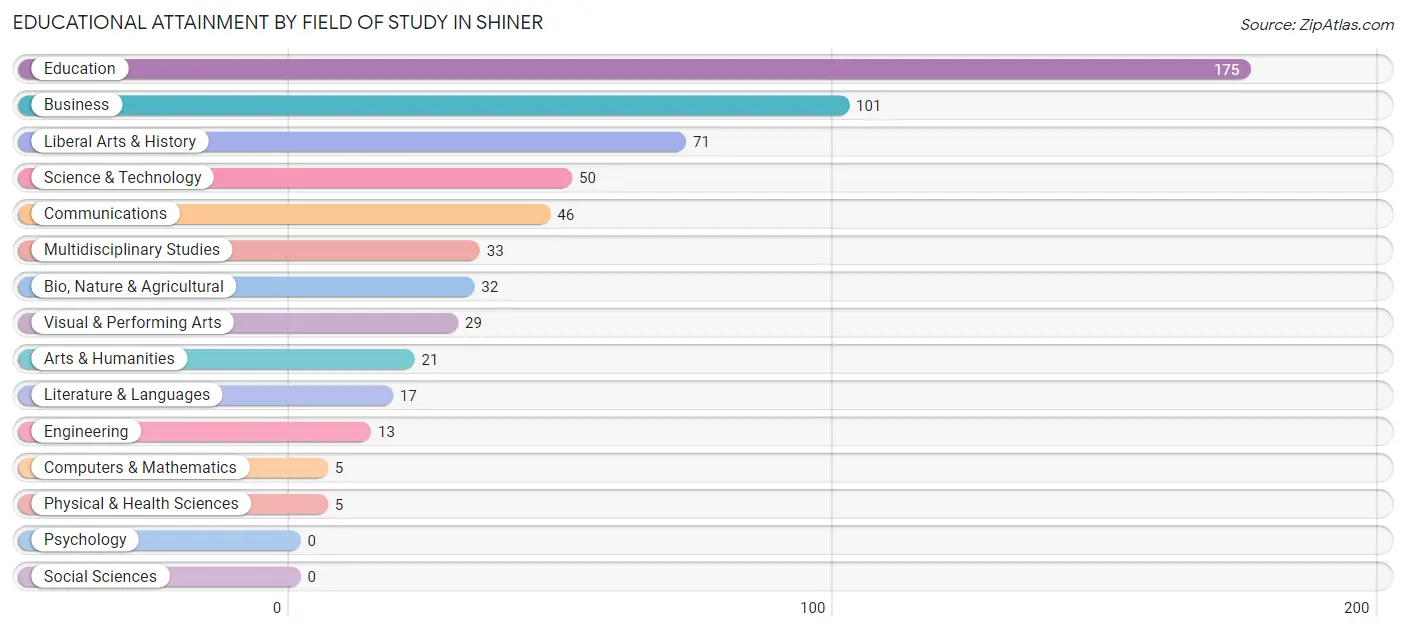
| Field of Study | # Graduates | % Graduates |
| Computers & Mathematics | 5 | 0.8% |
| Bio, Nature & Agricultural | 32 | 5.3% |
| Physical & Health Sciences | 5 | 0.8% |
| Psychology | 0 | 0.0% |
| Social Sciences | 0 | 0.0% |
| Engineering | 13 | 2.2% |
| Multidisciplinary Studies | 33 | 5.5% |
| Science & Technology | 50 | 8.4% |
| Business | 101 | 16.9% |
| Education | 175 | 29.3% |
| Literature & Languages | 17 | 2.8% |
| Liberal Arts & History | 71 | 11.9% |
| Visual & Performing Arts | 29 | 4.9% |
| Communications | 46 | 7.7% |
| Arts & Humanities | 21 | 3.5% |
| Total | 598 | 100.0% |
Transportation & Commute in Shiner
Vehicle Availability by Sex in Shiner
The most prevalent vehicle ownership categories in Shiner are males with 2 vehicles (245, accounting for 53.0%) and females with 2 vehicles (268, making up 46.3%).
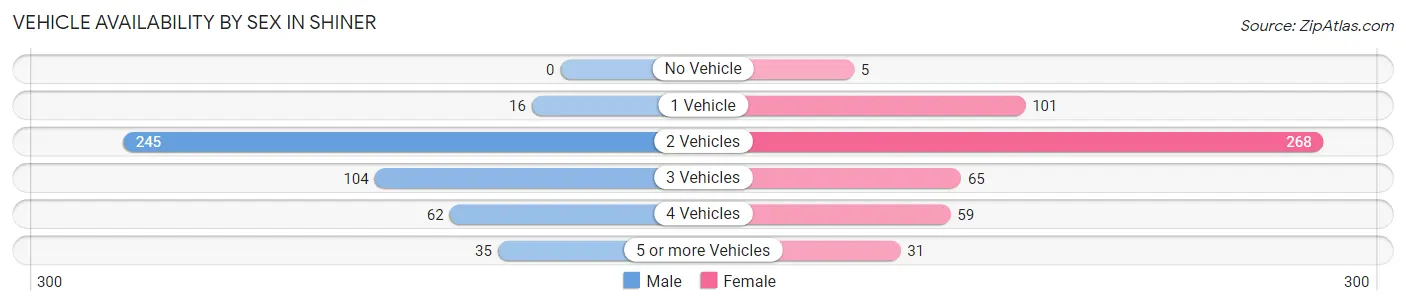
| Vehicles Available | Male | Female |
| No Vehicle | 0 (0.0%) | 5 (0.9%) |
| 1 Vehicle | 16 (3.5%) | 101 (19.1%) |
| 2 Vehicles | 245 (53.0%) | 268 (50.7%) |
| 3 Vehicles | 104 (22.5%) | 65 (12.3%) |
| 4 Vehicles | 62 (13.4%) | 59 (11.2%) |
| 5 or more Vehicles | 35 (7.6%) | 31 (5.9%) |
| Total | 462 (100.0%) | 529 (100.0%) |
Commute Time in Shiner
The most frequently occuring commute durations in Shiner are 5 to 9 minutes (347 commuters, 37.1%), less than 5 minutes (129 commuters, 13.8%), and 15 to 19 minutes (94 commuters, 10.1%).
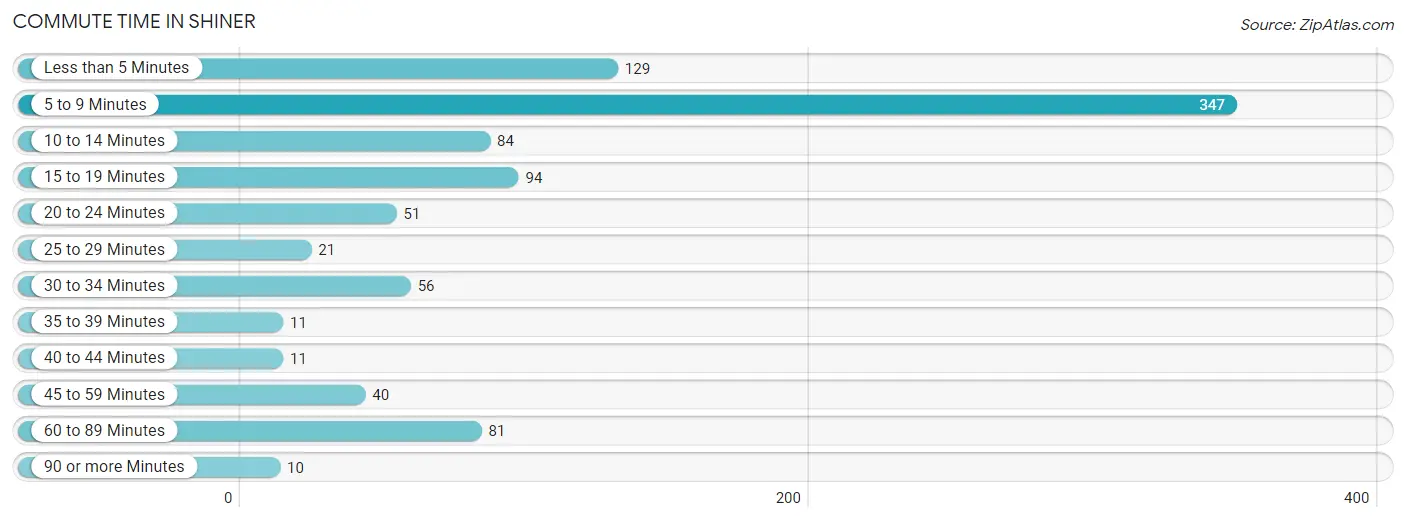
| Commute Time | # Commuters | % Commuters |
| Less than 5 Minutes | 129 | 13.8% |
| 5 to 9 Minutes | 347 | 37.1% |
| 10 to 14 Minutes | 84 | 9.0% |
| 15 to 19 Minutes | 94 | 10.1% |
| 20 to 24 Minutes | 51 | 5.4% |
| 25 to 29 Minutes | 21 | 2.2% |
| 30 to 34 Minutes | 56 | 6.0% |
| 35 to 39 Minutes | 11 | 1.2% |
| 40 to 44 Minutes | 11 | 1.2% |
| 45 to 59 Minutes | 40 | 4.3% |
| 60 to 89 Minutes | 81 | 8.7% |
| 90 or more Minutes | 10 | 1.1% |
Commute Time by Sex in Shiner
The most common commute times in Shiner are 5 to 9 minutes (178 commuters, 40.9%) for males and 5 to 9 minutes (169 commuters, 33.8%) for females.
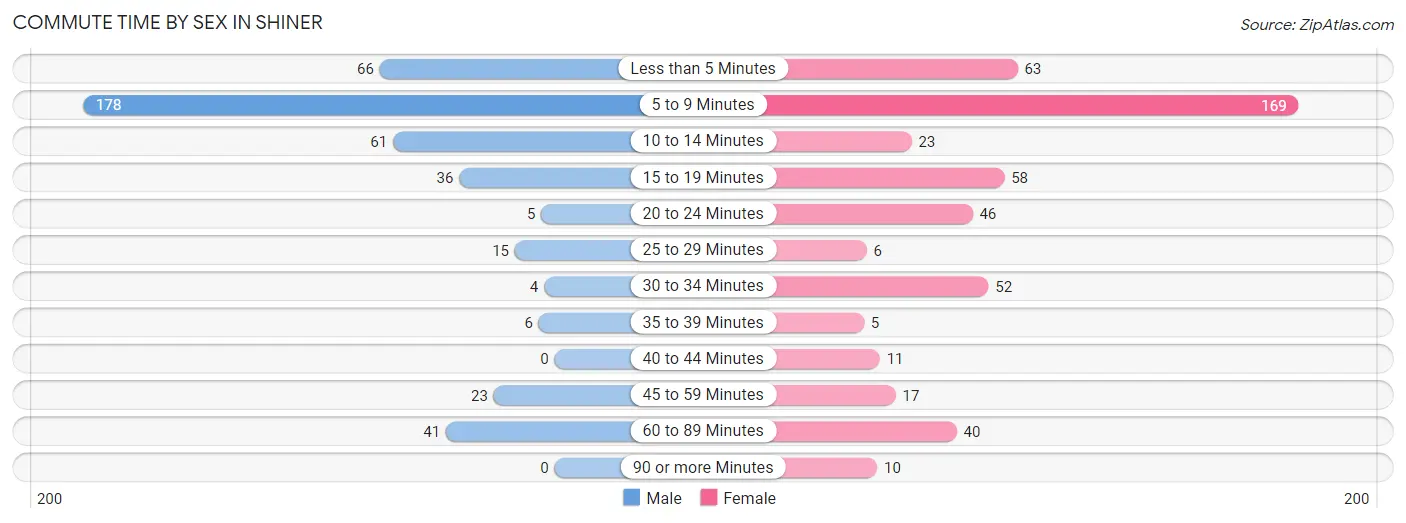
| Commute Time | Male | Female |
| Less than 5 Minutes | 66 (15.2%) | 63 (12.6%) |
| 5 to 9 Minutes | 178 (40.9%) | 169 (33.8%) |
| 10 to 14 Minutes | 61 (14.0%) | 23 (4.6%) |
| 15 to 19 Minutes | 36 (8.3%) | 58 (11.6%) |
| 20 to 24 Minutes | 5 (1.1%) | 46 (9.2%) |
| 25 to 29 Minutes | 15 (3.5%) | 6 (1.2%) |
| 30 to 34 Minutes | 4 (0.9%) | 52 (10.4%) |
| 35 to 39 Minutes | 6 (1.4%) | 5 (1.0%) |
| 40 to 44 Minutes | 0 (0.0%) | 11 (2.2%) |
| 45 to 59 Minutes | 23 (5.3%) | 17 (3.4%) |
| 60 to 89 Minutes | 41 (9.4%) | 40 (8.0%) |
| 90 or more Minutes | 0 (0.0%) | 10 (2.0%) |
Time of Departure to Work by Sex in Shiner
The most frequent times of departure to work in Shiner are 7:00 AM to 7:29 AM (93, 21.4%) for males and 7:30 AM to 7:59 AM (132, 26.4%) for females.
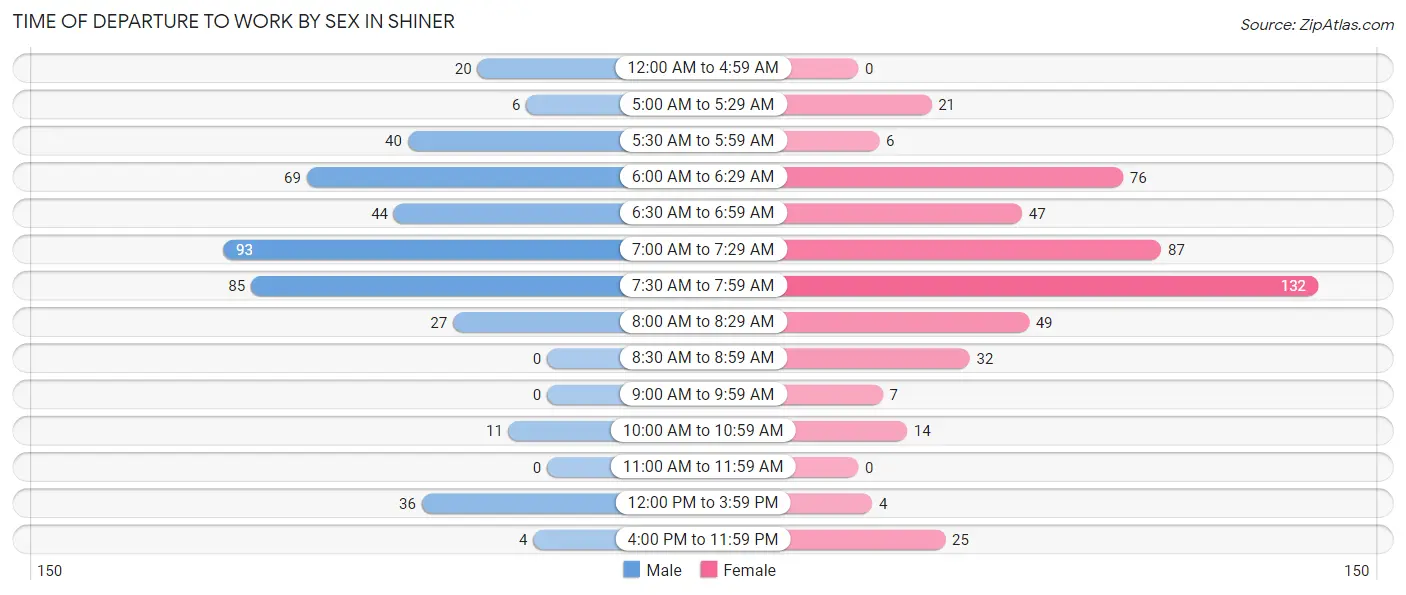
| Time of Departure | Male | Female |
| 12:00 AM to 4:59 AM | 20 (4.6%) | 0 (0.0%) |
| 5:00 AM to 5:29 AM | 6 (1.4%) | 21 (4.2%) |
| 5:30 AM to 5:59 AM | 40 (9.2%) | 6 (1.2%) |
| 6:00 AM to 6:29 AM | 69 (15.9%) | 76 (15.2%) |
| 6:30 AM to 6:59 AM | 44 (10.1%) | 47 (9.4%) |
| 7:00 AM to 7:29 AM | 93 (21.4%) | 87 (17.4%) |
| 7:30 AM to 7:59 AM | 85 (19.5%) | 132 (26.4%) |
| 8:00 AM to 8:29 AM | 27 (6.2%) | 49 (9.8%) |
| 8:30 AM to 8:59 AM | 0 (0.0%) | 32 (6.4%) |
| 9:00 AM to 9:59 AM | 0 (0.0%) | 7 (1.4%) |
| 10:00 AM to 10:59 AM | 11 (2.5%) | 14 (2.8%) |
| 11:00 AM to 11:59 AM | 0 (0.0%) | 0 (0.0%) |
| 12:00 PM to 3:59 PM | 36 (8.3%) | 4 (0.8%) |
| 4:00 PM to 11:59 PM | 4 (0.9%) | 25 (5.0%) |
| Total | 435 (100.0%) | 500 (100.0%) |
Housing Occupancy in Shiner
Occupancy by Ownership in Shiner
Of the total 772 dwellings in Shiner, owner-occupied units account for 623 (80.7%), while renter-occupied units make up 149 (19.3%).
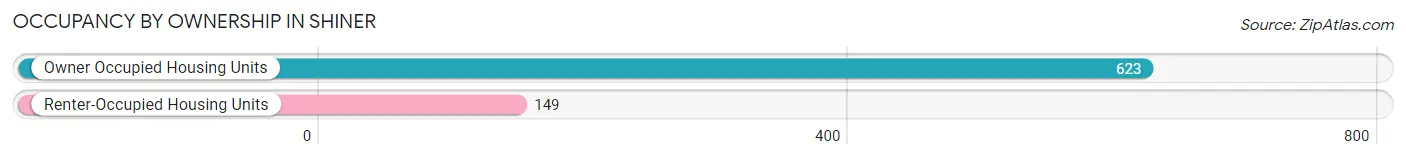
| Occupancy | # Housing Units | % Housing Units |
| Owner Occupied Housing Units | 623 | 80.7% |
| Renter-Occupied Housing Units | 149 | 19.3% |
| Total Occupied Housing Units | 772 | 100.0% |
Occupancy by Household Size in Shiner
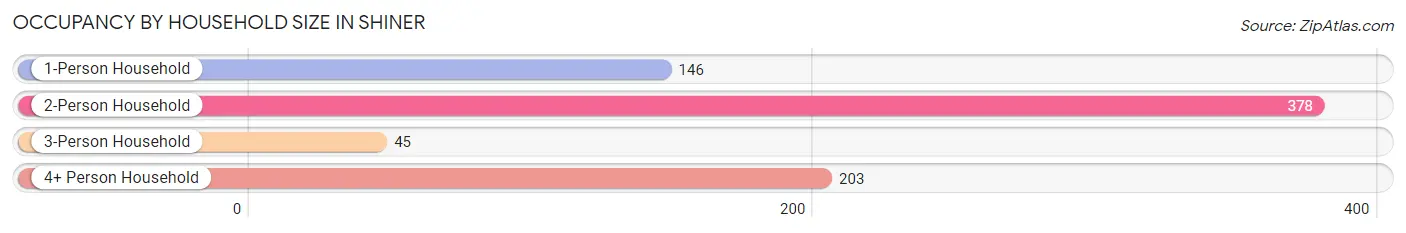
| Household Size | # Housing Units | % Housing Units |
| 1-Person Household | 146 | 18.9% |
| 2-Person Household | 378 | 49.0% |
| 3-Person Household | 45 | 5.8% |
| 4+ Person Household | 203 | 26.3% |
| Total Housing Units | 772 | 100.0% |
Occupancy by Ownership by Household Size in Shiner
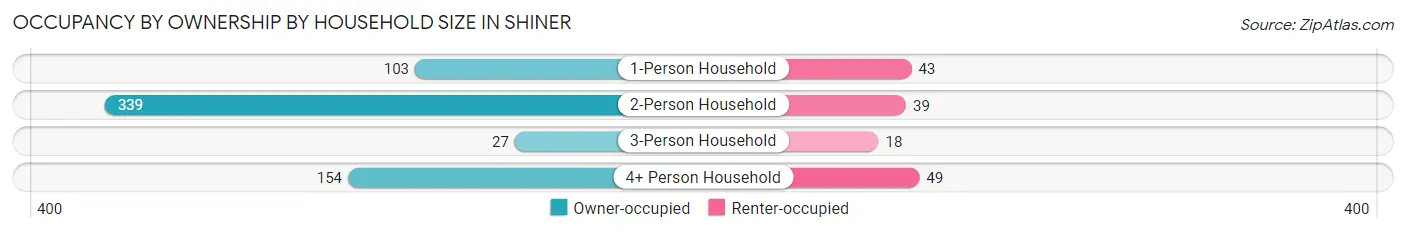
| Household Size | Owner-occupied | Renter-occupied |
| 1-Person Household | 103 (70.6%) | 43 (29.4%) |
| 2-Person Household | 339 (89.7%) | 39 (10.3%) |
| 3-Person Household | 27 (60.0%) | 18 (40.0%) |
| 4+ Person Household | 154 (75.9%) | 49 (24.1%) |
| Total Housing Units | 623 (80.7%) | 149 (19.3%) |
Occupancy by Educational Attainment in Shiner
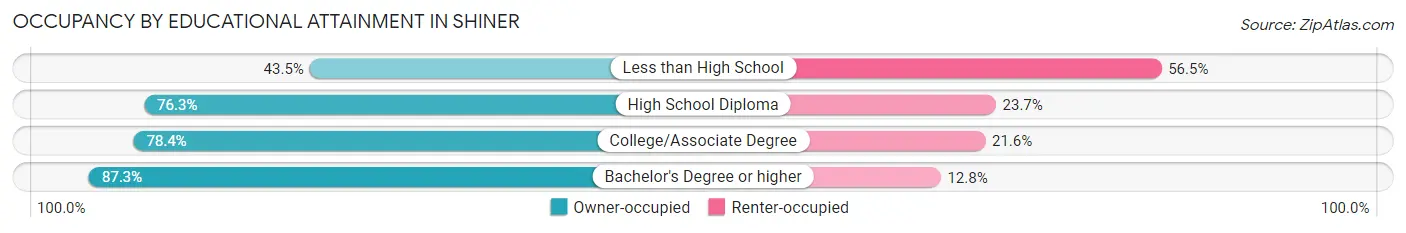
| Household Size | Owner-occupied | Renter-occupied |
| Less than High School | 10 (43.5%) | 13 (56.5%) |
| High School Diploma | 174 (76.3%) | 54 (23.7%) |
| College/Associate Degree | 138 (78.4%) | 38 (21.6%) |
| Bachelor's Degree or higher | 301 (87.3%) | 44 (12.8%) |
Occupancy by Age of Householder in Shiner
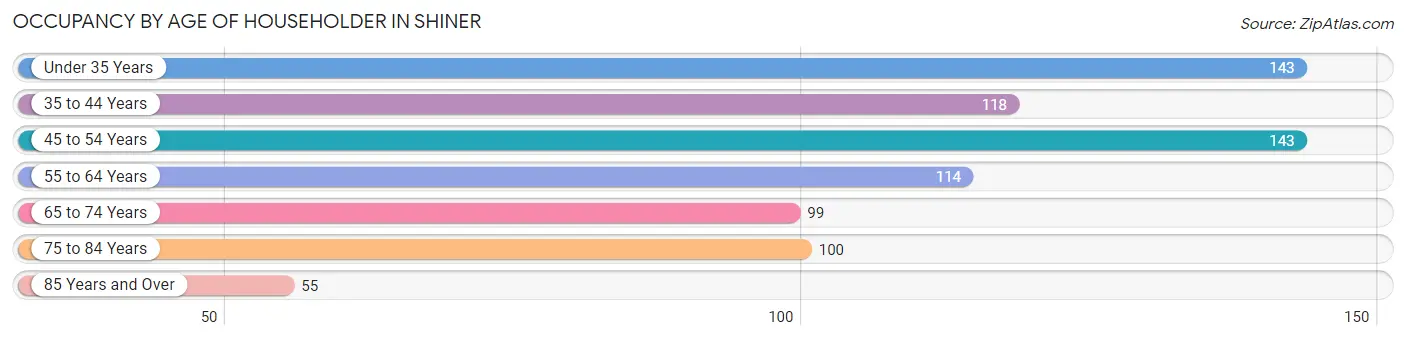
| Age Bracket | # Households | % Households |
| Under 35 Years | 143 | 18.5% |
| 35 to 44 Years | 118 | 15.3% |
| 45 to 54 Years | 143 | 18.5% |
| 55 to 64 Years | 114 | 14.8% |
| 65 to 74 Years | 99 | 12.8% |
| 75 to 84 Years | 100 | 13.0% |
| 85 Years and Over | 55 | 7.1% |
| Total | 772 | 100.0% |
Housing Finances in Shiner
Median Income by Occupancy in Shiner
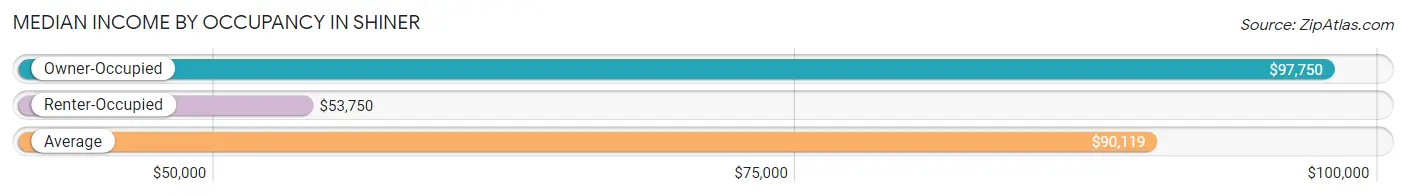
| Occupancy Type | # Households | Median Income |
| Owner-Occupied | 623 (80.7%) | $97,750 |
| Renter-Occupied | 149 (19.3%) | $53,750 |
| Average | 772 (100.0%) | $90,119 |
Occupancy by Householder Income Bracket in Shiner
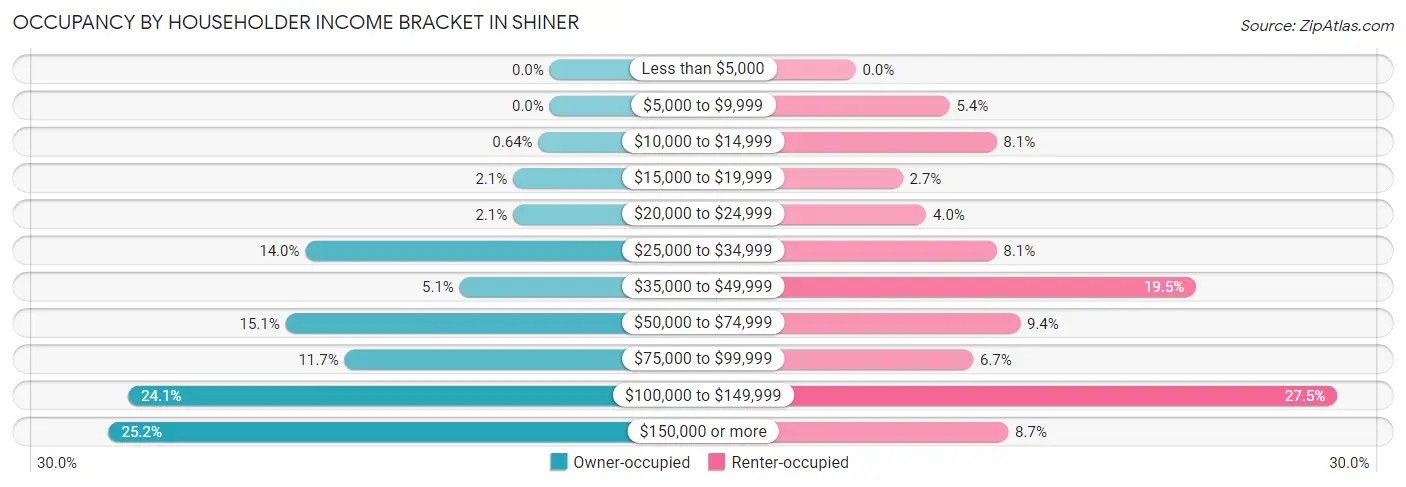
| Income Bracket | Owner-occupied | Renter-occupied |
| Less than $5,000 | 0 (0.0%) | 0 (0.0%) |
| $5,000 to $9,999 | 0 (0.0%) | 8 (5.4%) |
| $10,000 to $14,999 | 4 (0.6%) | 12 (8.1%) |
| $15,000 to $19,999 | 13 (2.1%) | 4 (2.7%) |
| $20,000 to $24,999 | 13 (2.1%) | 6 (4.0%) |
| $25,000 to $34,999 | 87 (14.0%) | 12 (8.1%) |
| $35,000 to $49,999 | 32 (5.1%) | 29 (19.5%) |
| $50,000 to $74,999 | 94 (15.1%) | 14 (9.4%) |
| $75,000 to $99,999 | 73 (11.7%) | 10 (6.7%) |
| $100,000 to $149,999 | 150 (24.1%) | 41 (27.5%) |
| $150,000 or more | 157 (25.2%) | 13 (8.7%) |
| Total | 623 (100.0%) | 149 (100.0%) |
Monthly Housing Cost Tiers in Shiner
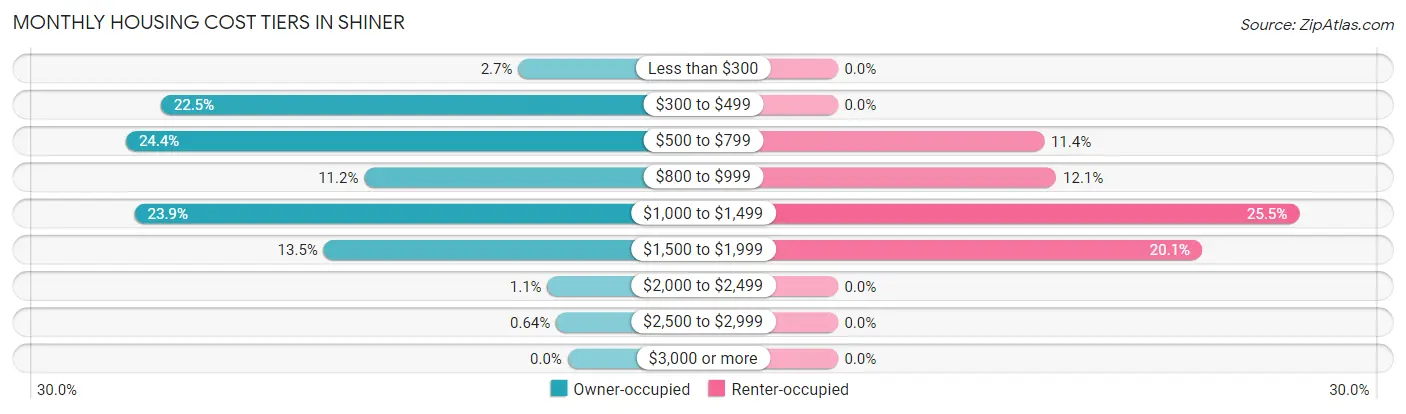
| Monthly Cost | Owner-occupied | Renter-occupied |
| Less than $300 | 17 (2.7%) | 0 (0.0%) |
| $300 to $499 | 140 (22.5%) | 0 (0.0%) |
| $500 to $799 | 152 (24.4%) | 17 (11.4%) |
| $800 to $999 | 70 (11.2%) | 18 (12.1%) |
| $1,000 to $1,499 | 149 (23.9%) | 38 (25.5%) |
| $1,500 to $1,999 | 84 (13.5%) | 30 (20.1%) |
| $2,000 to $2,499 | 7 (1.1%) | 0 (0.0%) |
| $2,500 to $2,999 | 4 (0.6%) | 0 (0.0%) |
| $3,000 or more | 0 (0.0%) | 0 (0.0%) |
| Total | 623 (100.0%) | 149 (100.0%) |
Physical Housing Characteristics in Shiner
Housing Structures in Shiner
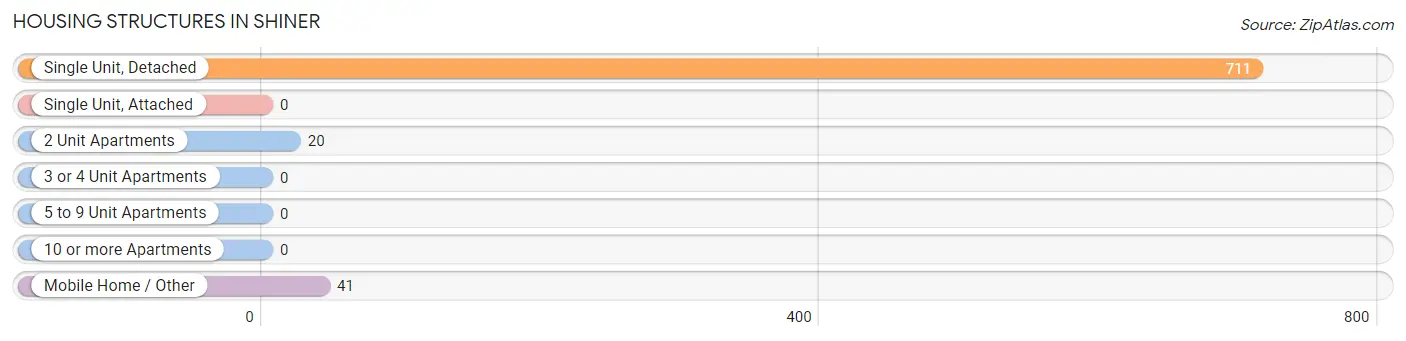
| Structure Type | # Housing Units | % Housing Units |
| Single Unit, Detached | 711 | 92.1% |
| Single Unit, Attached | 0 | 0.0% |
| 2 Unit Apartments | 20 | 2.6% |
| 3 or 4 Unit Apartments | 0 | 0.0% |
| 5 to 9 Unit Apartments | 0 | 0.0% |
| 10 or more Apartments | 0 | 0.0% |
| Mobile Home / Other | 41 | 5.3% |
| Total | 772 | 100.0% |
Housing Structures by Occupancy in Shiner
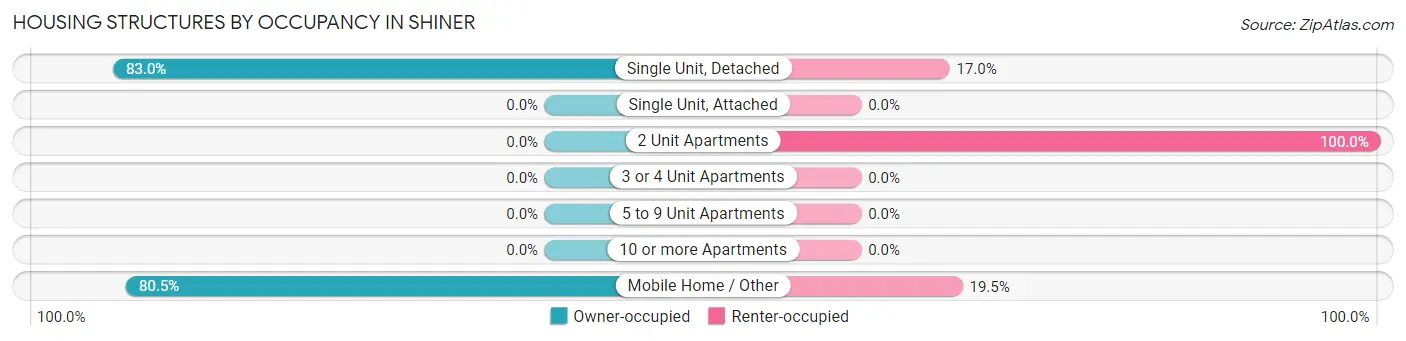
| Structure Type | Owner-occupied | Renter-occupied |
| Single Unit, Detached | 590 (83.0%) | 121 (17.0%) |
| Single Unit, Attached | 0 (0.0%) | 0 (0.0%) |
| 2 Unit Apartments | 0 (0.0%) | 20 (100.0%) |
| 3 or 4 Unit Apartments | 0 (0.0%) | 0 (0.0%) |
| 5 to 9 Unit Apartments | 0 (0.0%) | 0 (0.0%) |
| 10 or more Apartments | 0 (0.0%) | 0 (0.0%) |
| Mobile Home / Other | 33 (80.5%) | 8 (19.5%) |
| Total | 623 (80.7%) | 149 (19.3%) |
Housing Structures by Number of Rooms in Shiner
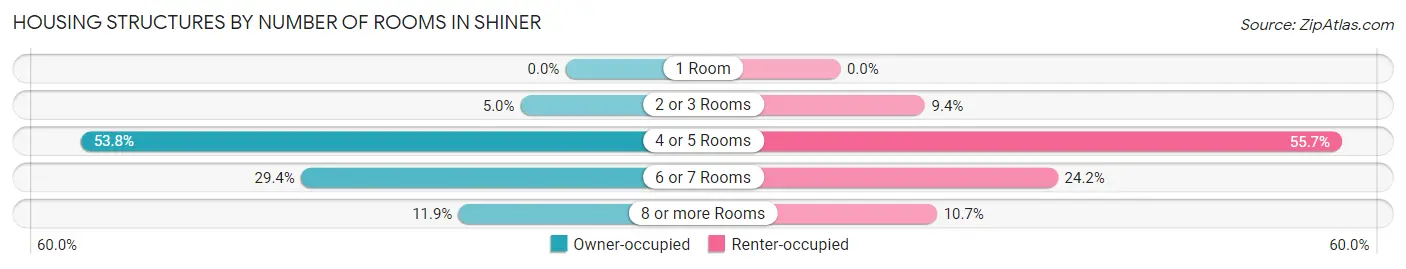
| Number of Rooms | Owner-occupied | Renter-occupied |
| 1 Room | 0 (0.0%) | 0 (0.0%) |
| 2 or 3 Rooms | 31 (5.0%) | 14 (9.4%) |
| 4 or 5 Rooms | 335 (53.8%) | 83 (55.7%) |
| 6 or 7 Rooms | 183 (29.4%) | 36 (24.2%) |
| 8 or more Rooms | 74 (11.9%) | 16 (10.7%) |
| Total | 623 (100.0%) | 149 (100.0%) |
Housing Structure by Heating Type in Shiner
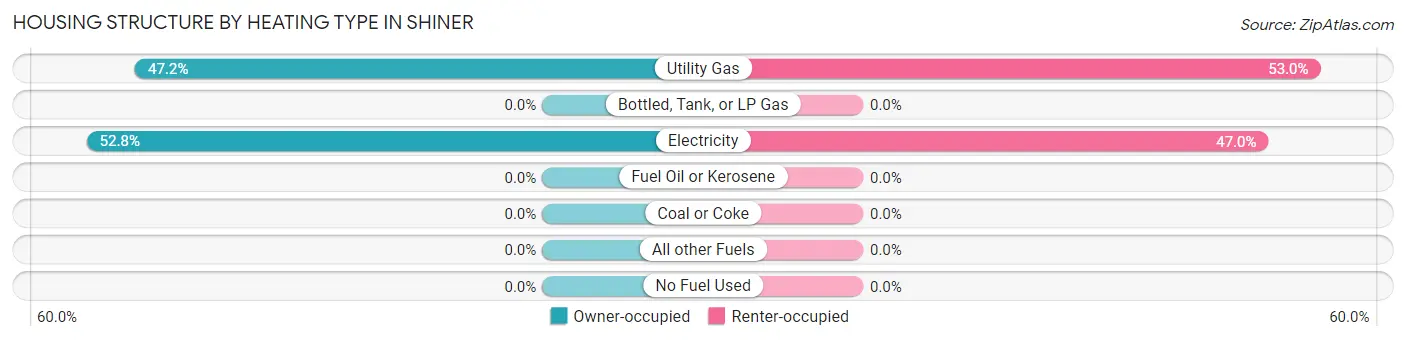
| Heating Type | Owner-occupied | Renter-occupied |
| Utility Gas | 294 (47.2%) | 79 (53.0%) |
| Bottled, Tank, or LP Gas | 0 (0.0%) | 0 (0.0%) |
| Electricity | 329 (52.8%) | 70 (47.0%) |
| Fuel Oil or Kerosene | 0 (0.0%) | 0 (0.0%) |
| Coal or Coke | 0 (0.0%) | 0 (0.0%) |
| All other Fuels | 0 (0.0%) | 0 (0.0%) |
| No Fuel Used | 0 (0.0%) | 0 (0.0%) |
| Total | 623 (100.0%) | 149 (100.0%) |
Household Vehicle Usage in Shiner
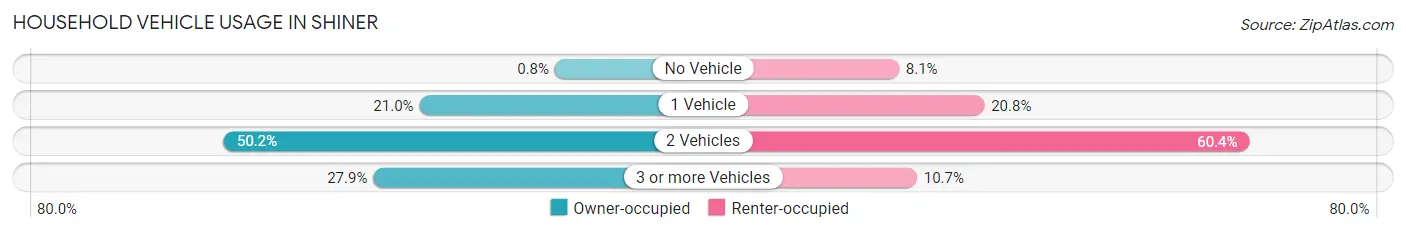
| Vehicles per Household | Owner-occupied | Renter-occupied |
| No Vehicle | 5 (0.8%) | 12 (8.1%) |
| 1 Vehicle | 131 (21.0%) | 31 (20.8%) |
| 2 Vehicles | 313 (50.2%) | 90 (60.4%) |
| 3 or more Vehicles | 174 (27.9%) | 16 (10.7%) |
| Total | 623 (100.0%) | 149 (100.0%) |
Real Estate & Mortgages in Shiner
Real Estate and Mortgage Overview in Shiner
| Characteristic | Without Mortgage | With Mortgage |
| Housing Units | 325 | 298 |
| Median Property Value | $233,100 | $186,700 |
| Median Household Income | $68,606 | $112 |
| Monthly Housing Costs | $510 | $0 |
| Real Estate Taxes | $2,046 | $15 |
Property Value by Mortgage Status in Shiner
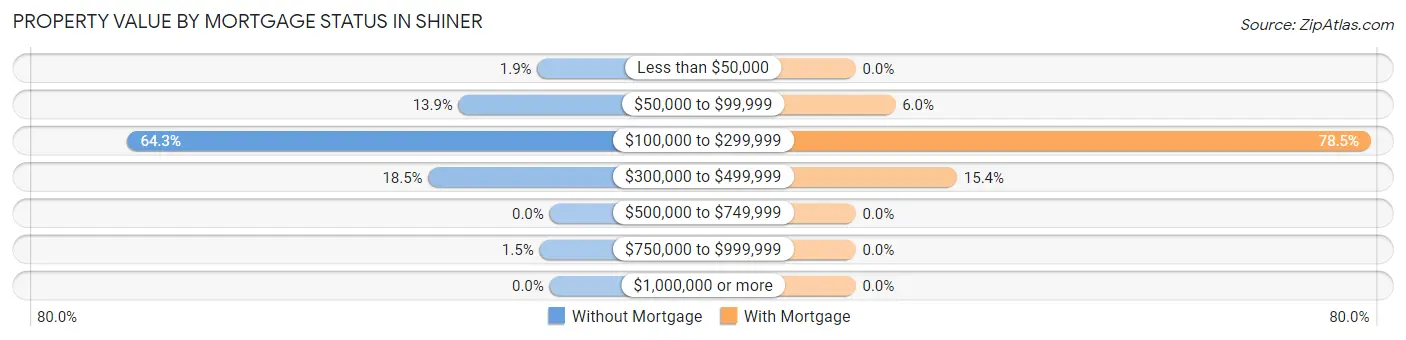
| Property Value | Without Mortgage | With Mortgage |
| Less than $50,000 | 6 (1.8%) | 0 (0.0%) |
| $50,000 to $99,999 | 45 (13.9%) | 18 (6.0%) |
| $100,000 to $299,999 | 209 (64.3%) | 234 (78.5%) |
| $300,000 to $499,999 | 60 (18.5%) | 46 (15.4%) |
| $500,000 to $749,999 | 0 (0.0%) | 0 (0.0%) |
| $750,000 to $999,999 | 5 (1.5%) | 0 (0.0%) |
| $1,000,000 or more | 0 (0.0%) | 0 (0.0%) |
| Total | 325 (100.0%) | 298 (100.0%) |
Household Income by Mortgage Status in Shiner
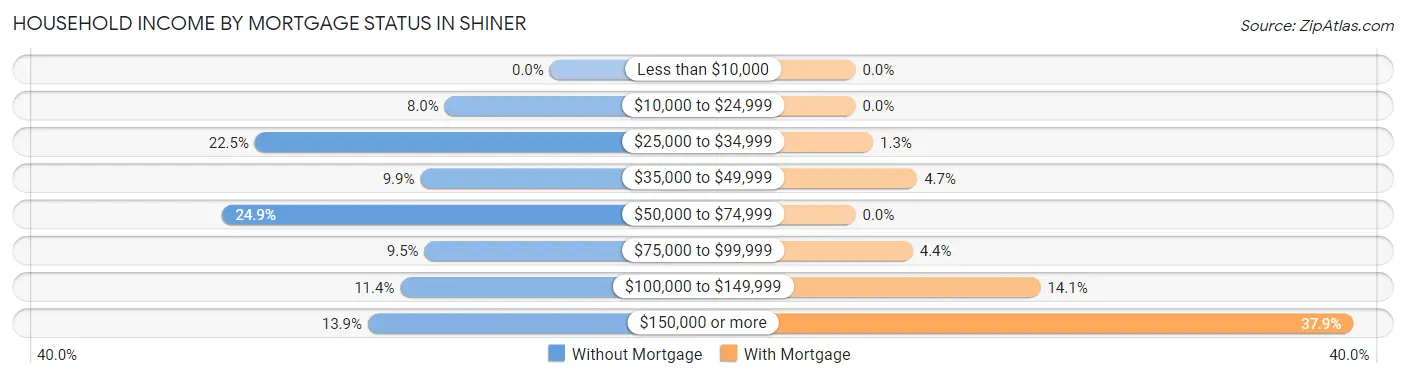
| Household Income | Without Mortgage | With Mortgage |
| Less than $10,000 | 0 (0.0%) | 0 (0.0%) |
| $10,000 to $24,999 | 26 (8.0%) | 0 (0.0%) |
| $25,000 to $34,999 | 73 (22.5%) | 4 (1.3%) |
| $35,000 to $49,999 | 32 (9.9%) | 14 (4.7%) |
| $50,000 to $74,999 | 81 (24.9%) | 0 (0.0%) |
| $75,000 to $99,999 | 31 (9.5%) | 13 (4.4%) |
| $100,000 to $149,999 | 37 (11.4%) | 42 (14.1%) |
| $150,000 or more | 45 (13.9%) | 113 (37.9%) |
| Total | 325 (100.0%) | 298 (100.0%) |
Property Value to Household Income Ratio in Shiner
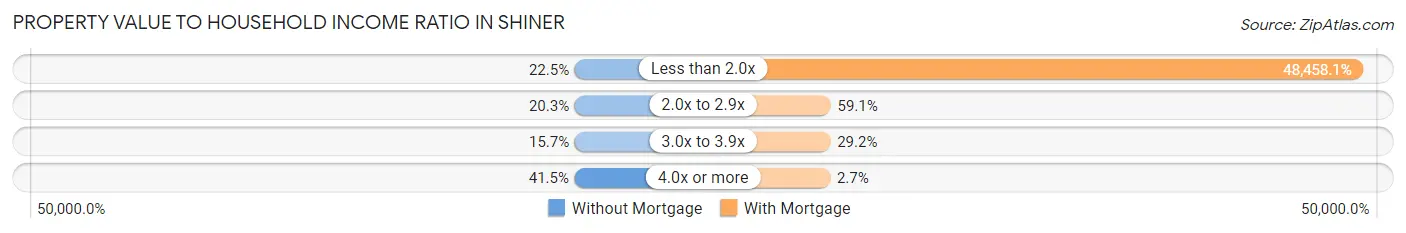
| Value-to-Income Ratio | Without Mortgage | With Mortgage |
| Less than 2.0x | 73 (22.5%) | 144,405 (48,458.0%) |
| 2.0x to 2.9x | 66 (20.3%) | 176 (59.1%) |
| 3.0x to 3.9x | 51 (15.7%) | 87 (29.2%) |
| 4.0x or more | 135 (41.5%) | 8 (2.7%) |
| Total | 325 (100.0%) | 298 (100.0%) |
Real Estate Taxes by Mortgage Status in Shiner
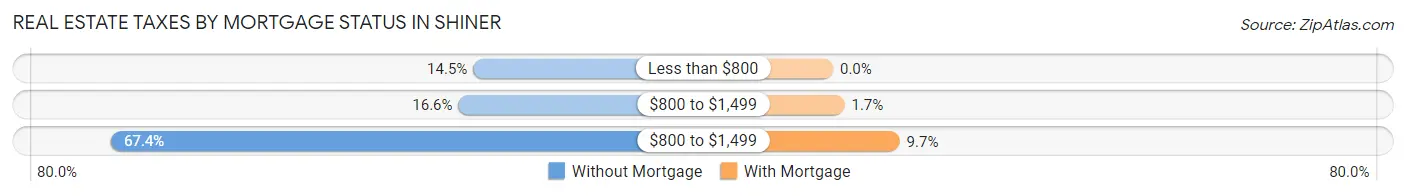
| Property Taxes | Without Mortgage | With Mortgage |
| Less than $800 | 47 (14.5%) | 0 (0.0%) |
| $800 to $1,499 | 54 (16.6%) | 5 (1.7%) |
| $800 to $1,499 | 219 (67.4%) | 29 (9.7%) |
| Total | 325 (100.0%) | 298 (100.0%) |
Health & Disability in Shiner
Health Insurance Coverage by Age in Shiner
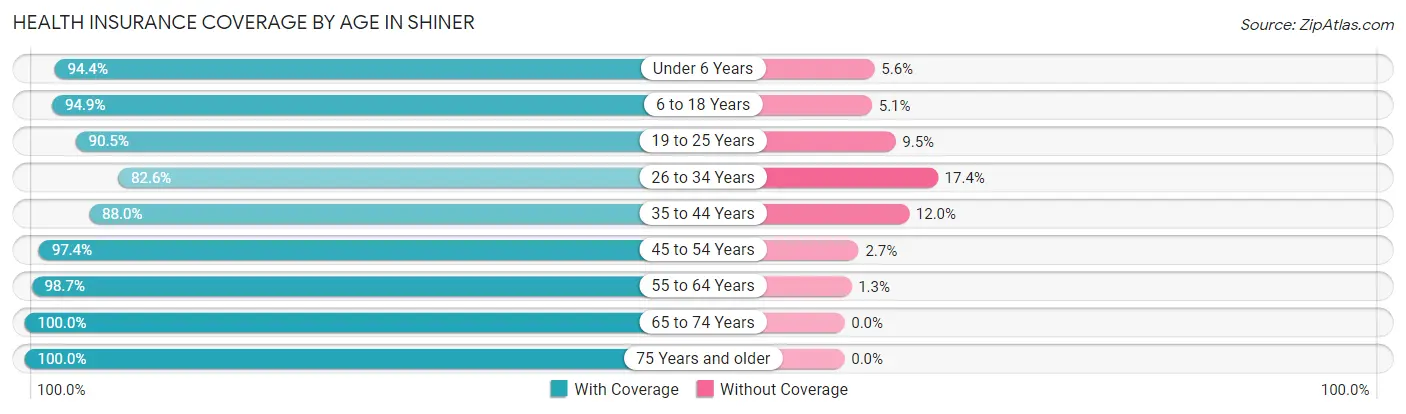
| Age Bracket | With Coverage | Without Coverage |
| Under 6 Years | 118 (94.4%) | 7 (5.6%) |
| 6 to 18 Years | 425 (94.9%) | 23 (5.1%) |
| 19 to 25 Years | 152 (90.5%) | 16 (9.5%) |
| 26 to 34 Years | 166 (82.6%) | 35 (17.4%) |
| 35 to 44 Years | 168 (88.0%) | 23 (12.0%) |
| 45 to 54 Years | 257 (97.4%) | 7 (2.6%) |
| 55 to 64 Years | 230 (98.7%) | 3 (1.3%) |
| 65 to 74 Years | 203 (100.0%) | 0 (0.0%) |
| 75 Years and older | 196 (100.0%) | 0 (0.0%) |
| Total | 1,915 (94.4%) | 114 (5.6%) |
Health Insurance Coverage by Citizenship Status in Shiner
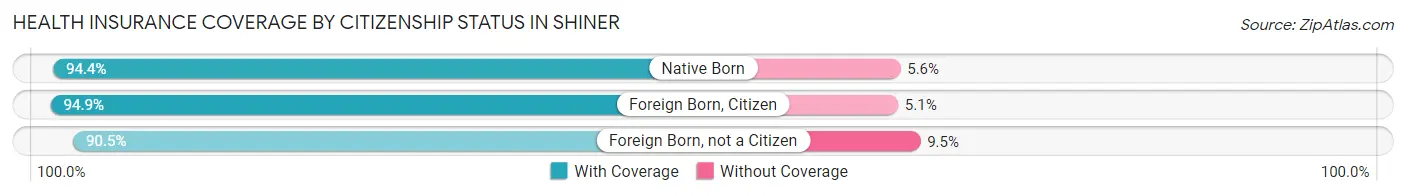
| Citizenship Status | With Coverage | Without Coverage |
| Native Born | 118 (94.4%) | 7 (5.6%) |
| Foreign Born, Citizen | 425 (94.9%) | 23 (5.1%) |
| Foreign Born, not a Citizen | 152 (90.5%) | 16 (9.5%) |
Health Insurance Coverage by Household Income in Shiner
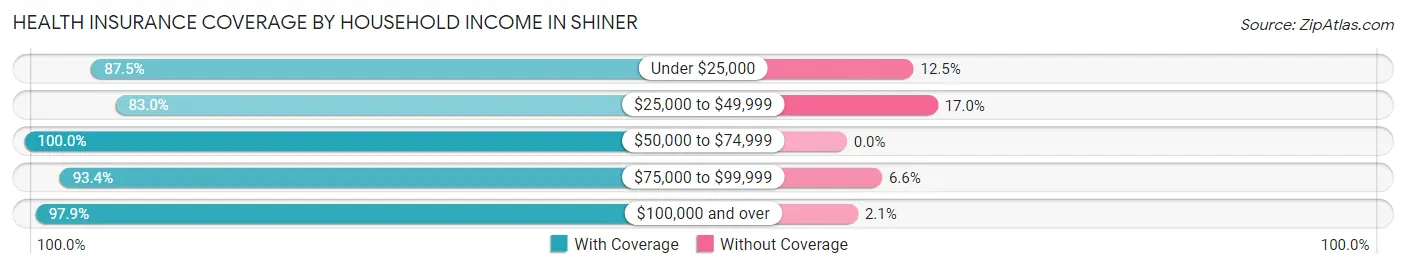
| Household Income | With Coverage | Without Coverage |
| Under $25,000 | 112 (87.5%) | 16 (12.5%) |
| $25,000 to $49,999 | 307 (83.0%) | 63 (17.0%) |
| $50,000 to $74,999 | 213 (100.0%) | 0 (0.0%) |
| $75,000 to $99,999 | 156 (93.4%) | 11 (6.6%) |
| $100,000 and over | 1,123 (97.9%) | 24 (2.1%) |
Public vs Private Health Insurance Coverage by Age in Shiner
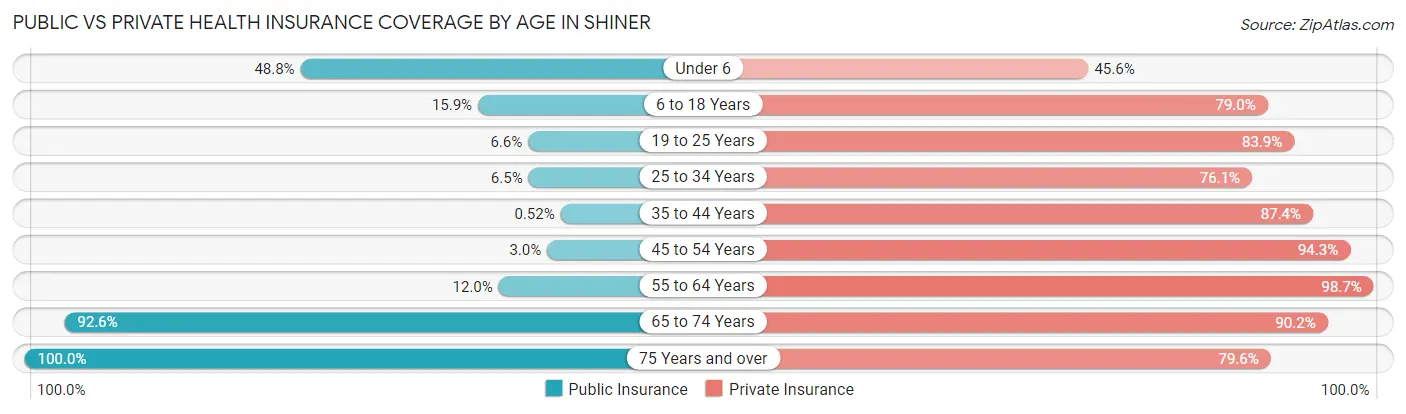
| Age Bracket | Public Insurance | Private Insurance |
| Under 6 | 61 (48.8%) | 57 (45.6%) |
| 6 to 18 Years | 71 (15.9%) | 354 (79.0%) |
| 19 to 25 Years | 11 (6.6%) | 141 (83.9%) |
| 25 to 34 Years | 13 (6.5%) | 153 (76.1%) |
| 35 to 44 Years | 1 (0.5%) | 167 (87.4%) |
| 45 to 54 Years | 8 (3.0%) | 249 (94.3%) |
| 55 to 64 Years | 28 (12.0%) | 230 (98.7%) |
| 65 to 74 Years | 188 (92.6%) | 183 (90.1%) |
| 75 Years and over | 196 (100.0%) | 156 (79.6%) |
| Total | 577 (28.4%) | 1,690 (83.3%) |
Disability Status by Sex by Age in Shiner
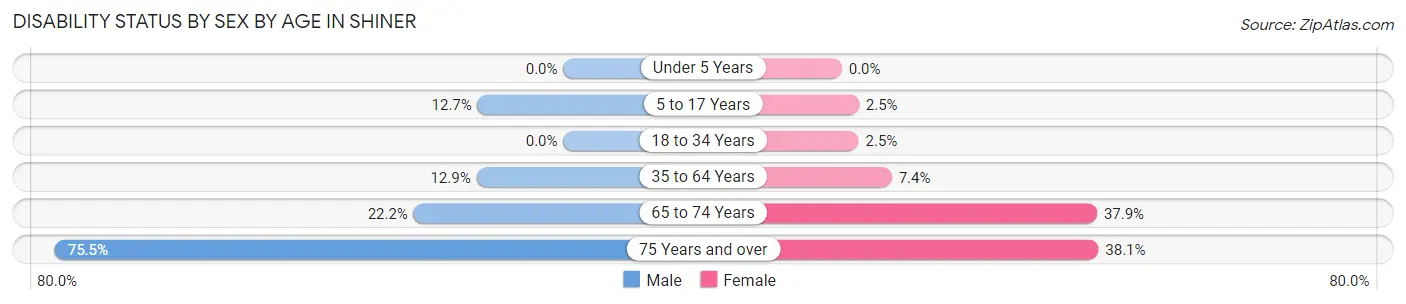
| Age Bracket | Male | Female |
| Under 5 Years | 0 (0.0%) | 0 (0.0%) |
| 5 to 17 Years | 28 (12.7%) | 6 (2.5%) |
| 18 to 34 Years | 0 (0.0%) | 5 (2.5%) |
| 35 to 64 Years | 40 (12.9%) | 28 (7.4%) |
| 65 to 74 Years | 24 (22.2%) | 36 (37.9%) |
| 75 Years and over | 37 (75.5%) | 56 (38.1%) |
Disability Class by Sex by Age in Shiner
Disability Class: Hearing Difficulty
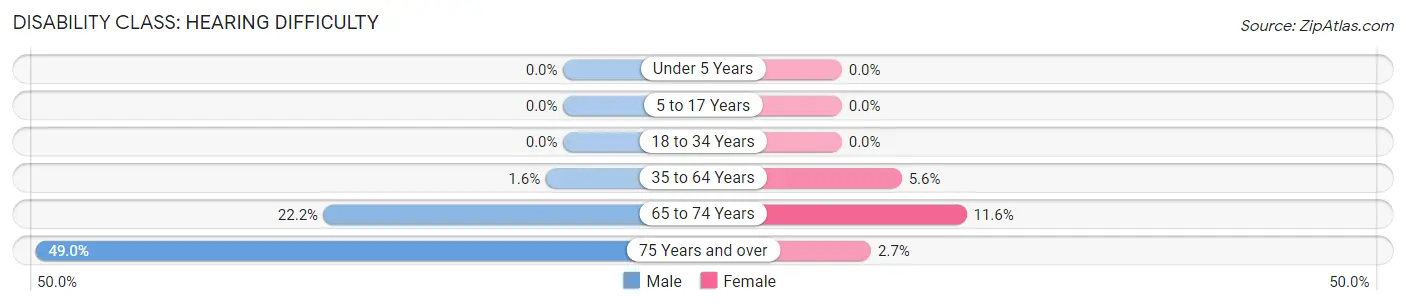
| Age Bracket | Male | Female |
| Under 5 Years | 0 (0.0%) | 0 (0.0%) |
| 5 to 17 Years | 0 (0.0%) | 0 (0.0%) |
| 18 to 34 Years | 0 (0.0%) | 0 (0.0%) |
| 35 to 64 Years | 5 (1.6%) | 21 (5.6%) |
| 65 to 74 Years | 24 (22.2%) | 11 (11.6%) |
| 75 Years and over | 24 (49.0%) | 4 (2.7%) |
Disability Class: Vision Difficulty
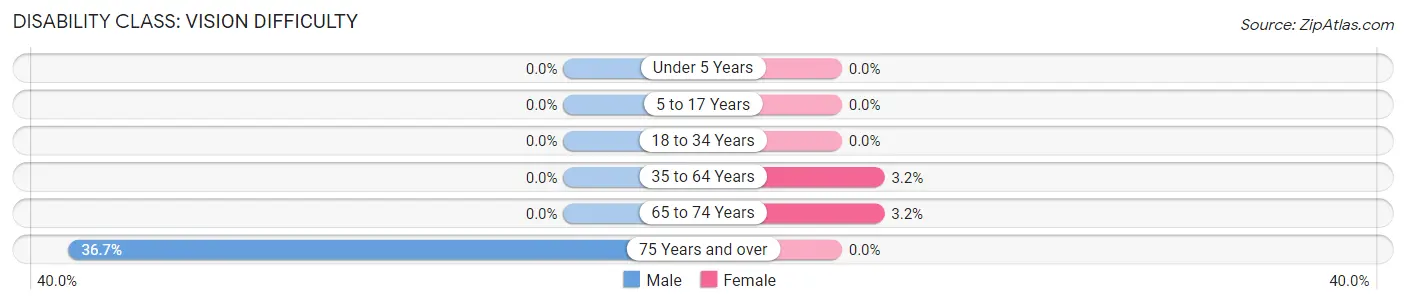
| Age Bracket | Male | Female |
| Under 5 Years | 0 (0.0%) | 0 (0.0%) |
| 5 to 17 Years | 0 (0.0%) | 0 (0.0%) |
| 18 to 34 Years | 0 (0.0%) | 0 (0.0%) |
| 35 to 64 Years | 0 (0.0%) | 12 (3.2%) |
| 65 to 74 Years | 0 (0.0%) | 3 (3.2%) |
| 75 Years and over | 18 (36.7%) | 0 (0.0%) |
Disability Class: Cognitive Difficulty
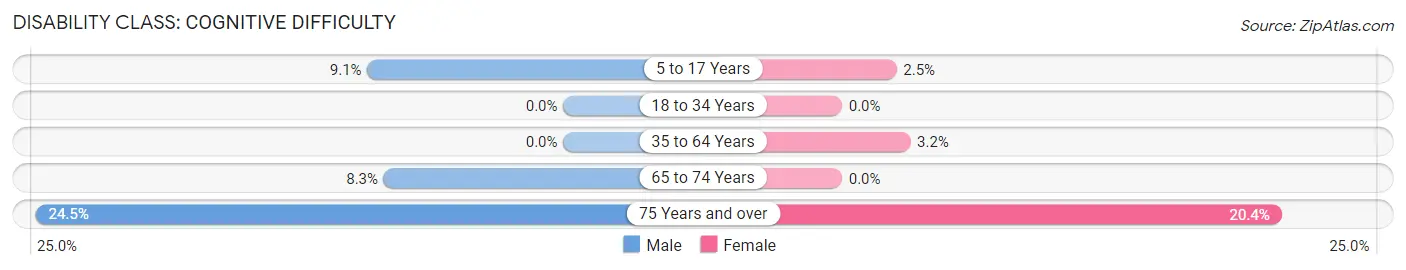
| Age Bracket | Male | Female |
| 5 to 17 Years | 20 (9.1%) | 6 (2.5%) |
| 18 to 34 Years | 0 (0.0%) | 0 (0.0%) |
| 35 to 64 Years | 0 (0.0%) | 12 (3.2%) |
| 65 to 74 Years | 9 (8.3%) | 0 (0.0%) |
| 75 Years and over | 12 (24.5%) | 30 (20.4%) |
Disability Class: Ambulatory Difficulty
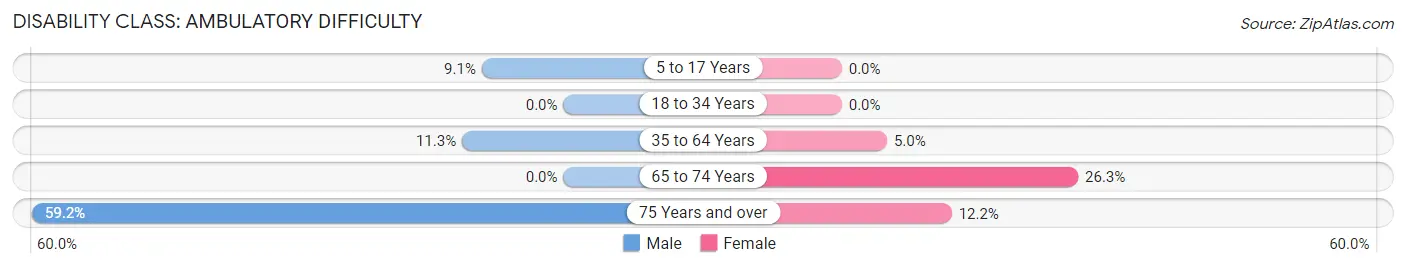
| Age Bracket | Male | Female |
| 5 to 17 Years | 20 (9.1%) | 0 (0.0%) |
| 18 to 34 Years | 0 (0.0%) | 0 (0.0%) |
| 35 to 64 Years | 35 (11.3%) | 19 (5.0%) |
| 65 to 74 Years | 0 (0.0%) | 25 (26.3%) |
| 75 Years and over | 29 (59.2%) | 18 (12.2%) |
Disability Class: Self-Care Difficulty
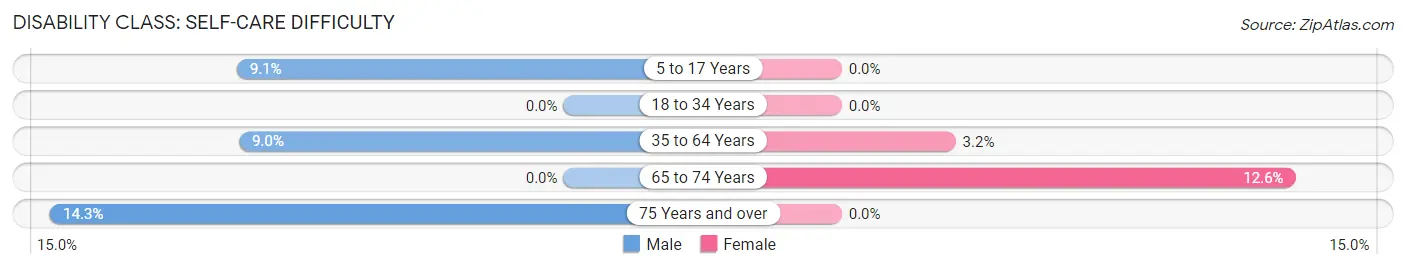
| Age Bracket | Male | Female |
| 5 to 17 Years | 20 (9.1%) | 0 (0.0%) |
| 18 to 34 Years | 0 (0.0%) | 0 (0.0%) |
| 35 to 64 Years | 28 (9.0%) | 12 (3.2%) |
| 65 to 74 Years | 0 (0.0%) | 12 (12.6%) |
| 75 Years and over | 7 (14.3%) | 0 (0.0%) |
Technology Access in Shiner
Computing Device Access in Shiner
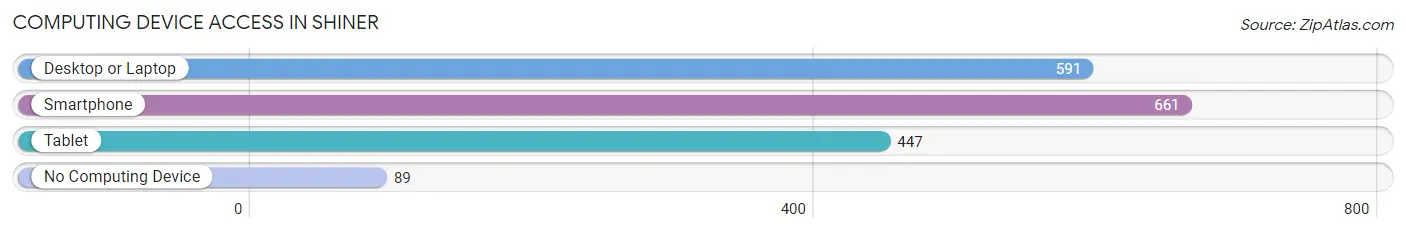
| Device Type | # Households | % Households |
| Desktop or Laptop | 591 | 76.5% |
| Smartphone | 661 | 85.6% |
| Tablet | 447 | 57.9% |
| No Computing Device | 89 | 11.5% |
| Total | 772 | 100.0% |
Internet Access in Shiner
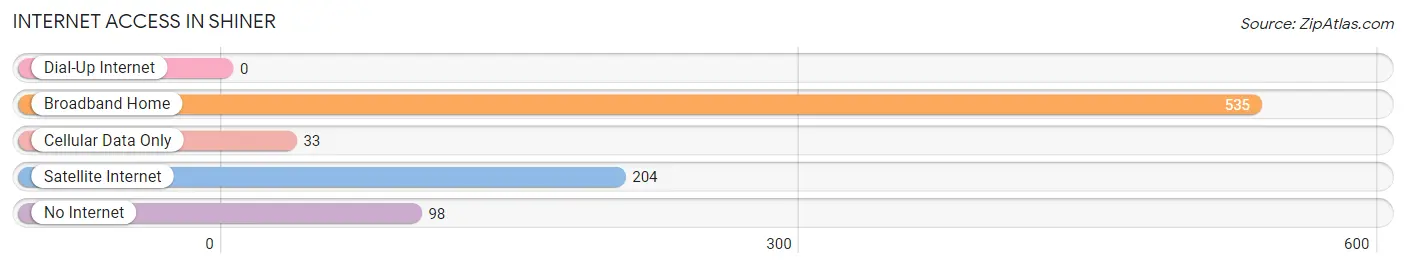
| Internet Type | # Households | % Households |
| Dial-Up Internet | 0 | 0.0% |
| Broadband Home | 535 | 69.3% |
| Cellular Data Only | 33 | 4.3% |
| Satellite Internet | 204 | 26.4% |
| No Internet | 98 | 12.7% |
| Total | 772 | 100.0% |
Shiner Summary
Shiner, Texas is a small town located in Lavaca County, Texas, United States. It is situated about halfway between Houston and San Antonio, and is part of the Victoria, Texas Metropolitan Statistical Area. The population of Shiner was 2,069 at the 2010 census.
History
Shiner was founded in 1887 by Czech and German immigrants who had come to the area to farm. The town was named after Henry B. Shiner, who donated land for the town site. The first post office was established in 1887, and the town was incorporated in 1890.
Shiner was a thriving agricultural center in the early 20th century, with cotton, corn, and sorghum being the main crops. The town also had a number of businesses, including a cotton gin, a bank, a hotel, and a brewery. The Spoetzl Brewery, which was founded in 1909, is still in operation today and is the oldest independent brewery in Texas.
Geography
Shiner is located at 29°25'25" North, 97°7'25" West (29.423, -97.123). The town is situated on the banks of the Lavaca River, about halfway between Houston and San Antonio.
The climate in Shiner is humid subtropical, with hot summers and mild winters. The average annual temperature is 68°F (20°C), and the average annual precipitation is 33 inches (84 cm).
Economy
The economy of Shiner is largely based on agriculture and tourism. The town is home to the Spoetzl Brewery, which produces a variety of beers, including Shiner Bock, the brewery's flagship beer. The brewery is a major employer in the area, and its products are sold throughout the United States.
Shiner is also home to a number of small businesses, including restaurants, shops, and a winery. The town is a popular tourist destination, and there are a number of bed and breakfasts in the area.
Demographics
As of the 2010 census, the population of Shiner was 2,069. The racial makeup of the town was 94.3% White, 0.7% African American, 0.3% Native American, 0.2% Asian, 0.1% Pacific Islander, 2.7% from other races, and 1.9% from two or more races. Hispanic or Latino of any race were 8.2% of the population.
The median income for a household in Shiner was $37,917, and the median income for a family was $45,625. The per capita income for the town was $19,945. About 11.2% of families and 14.2% of the population were below the poverty line, including 18.2% of those under age 18 and 11.2% of those age 65 or over.
Shiner is served by the Shiner Independent School District, which includes Shiner Elementary School, Shiner Middle School, and Shiner High School. The town is also home to the Shiner Public Library.
Common Questions
What is Per Capita Income in Shiner?
Per Capita income in Shiner is $39,180.
What is the Median Family Income in Shiner?
Median Family Income in Shiner is $111,827.
What is the Median Household income in Shiner?
Median Household Income in Shiner is $90,119.
What is Income or Wage Gap in Shiner?
Income or Wage Gap in Shiner is 40.7%.
Women in Shiner earn 59.3 cents for every dollar earned by a man.
What is Family Income Deficit in Shiner?
Family Income Deficit in Shiner is $11,192.
Families that are below poverty line in Shiner earn $11,192 less on average than the poverty threshold level.
What is Inequality or Gini Index in Shiner?
Inequality or Gini Index in Shiner is 0.38.
What is the Total Population of Shiner?
Total Population of Shiner is 2,095.
What is the Total Male Population of Shiner?
Total Male Population of Shiner is 962.
What is the Total Female Population of Shiner?
Total Female Population of Shiner is 1,133.
What is the Ratio of Males per 100 Females in Shiner?
There are 84.91 Males per 100 Females in Shiner.
What is the Ratio of Females per 100 Males in Shiner?
There are 117.78 Females per 100 Males in Shiner.
What is the Median Population Age in Shiner?
Median Population Age in Shiner is 40.5 Years.
What is the Average Family Size in Shiner
Average Family Size in Shiner is 3.0 People.
What is the Average Household Size in Shiner
Average Household Size in Shiner is 2.6 People.
How Large is the Labor Force in Shiner?
There are 1,013 People in the Labor Forcein in Shiner.
What is the Percentage of People in the Labor Force in Shiner?
63.1% of People are in the Labor Force in Shiner.
What is the Unemployment Rate in Shiner?
Unemployment Rate in Shiner is 2.0%.