Seymour, TX Map & Demographics
Seymour Map
Seymour Overview
$31,901
PER CAPITA INCOME
$74,295
AVG FAMILY INCOME
$53,077
AVG HOUSEHOLD INCOME
43.3%
WAGE / INCOME GAP [ % ]
56.7¢/ $1
WAGE / INCOME GAP [ $ ]
0.50
INEQUALITY / GINI INDEX
2,786
TOTAL POPULATION
1,395
MALE POPULATION
1,391
FEMALE POPULATION
100.29
MALES / 100 FEMALES
99.71
FEMALES / 100 MALES
47.0
MEDIAN AGE
2.9
AVG FAMILY SIZE
2.4
AVG HOUSEHOLD SIZE
1,121
LABOR FORCE [ PEOPLE ]
51.3%
PERCENT IN LABOR FORCE
0.5%
UNEMPLOYMENT RATE
Seymour Zip Codes
Seymour Area Codes
Income in Seymour
Income Overview in Seymour
Per Capita Income in Seymour is $31,901, while median incomes of families and households are $74,295 and $53,077 respectively.
| Characteristic | Number | Measure |
| Per Capita Income | 2,786 | $31,901 |
| Median Family Income | 760 | $74,295 |
| Mean Family Income | 760 | $97,403 |
| Median Household Income | 1,144 | $53,077 |
| Mean Household Income | 1,144 | $74,282 |
| Income Deficit | 760 | $0 |
| Wage / Income Gap (%) | 2,786 | 43.27% |
| Wage / Income Gap ($) | 2,786 | 56.73¢ per $1 |
| Gini / Inequality Index | 2,786 | 0.50 |
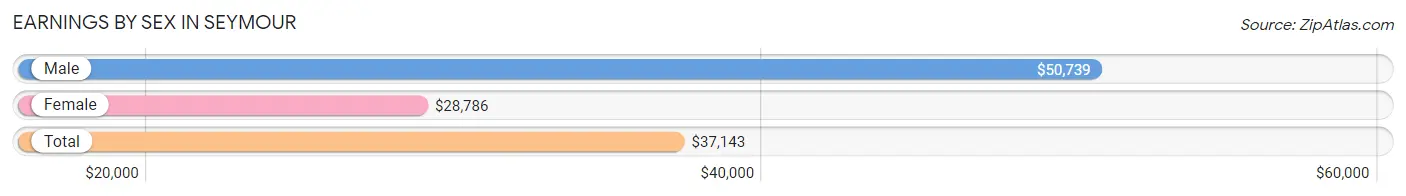
Earnings by Sex in Seymour
Average Earnings in Seymour are $37,143, $50,739 for men and $28,786 for women, a difference of 43.3%.
| Sex | Number | Average Earnings |
| Male | 631 (50.2%) | $50,739 |
| Female | 627 (49.8%) | $28,786 |
| Total | 1,258 (100.0%) | $37,143 |
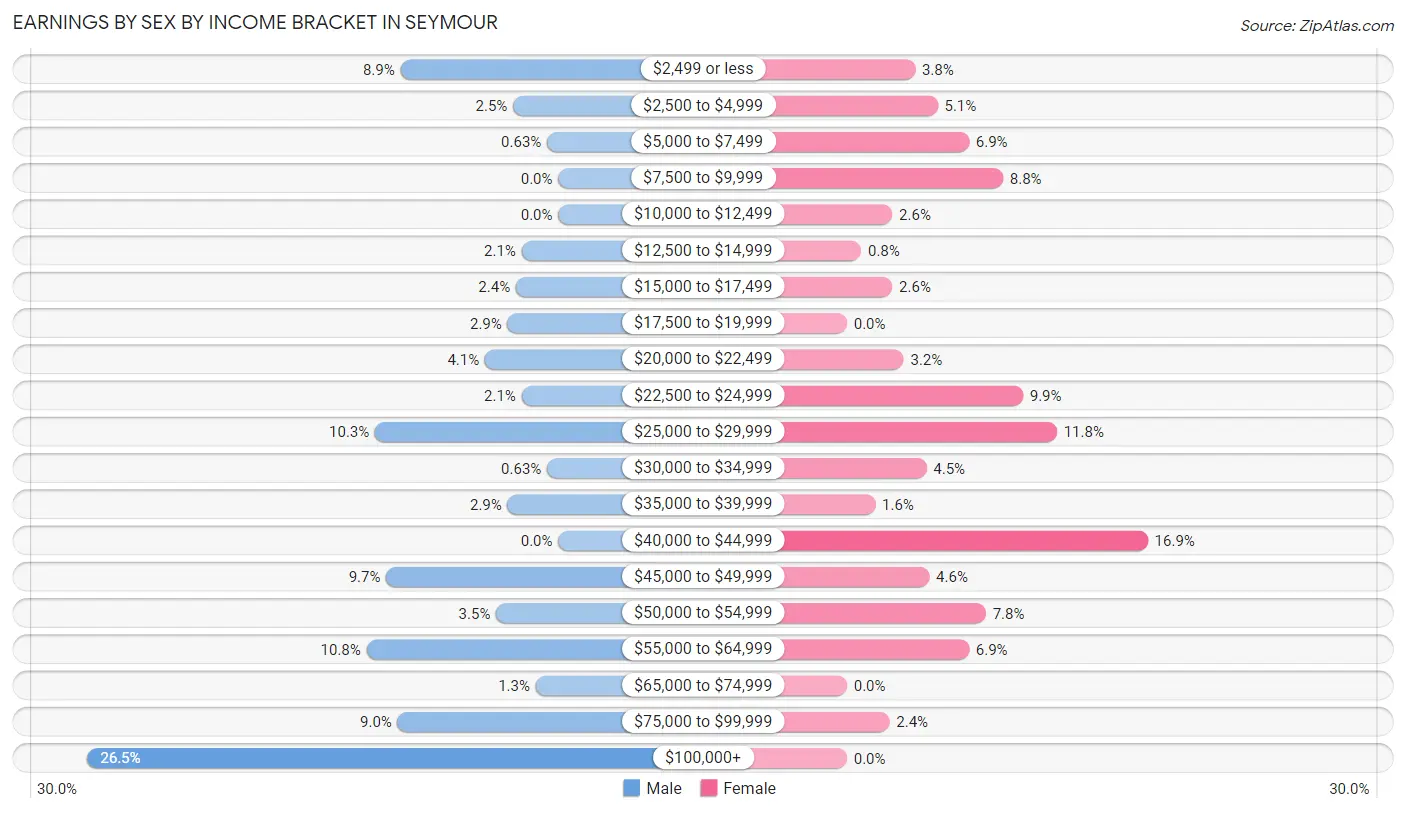
Earnings by Sex by Income Bracket in Seymour
The most common earnings brackets in Seymour are $100,000+ for men (167 | 26.5%) and $40,000 to $44,999 for women (106 | 16.9%).
| Income | Male | Female |
| $2,499 or less | 56 (8.9%) | 24 (3.8%) |
| $2,500 to $4,999 | 16 (2.5%) | 32 (5.1%) |
| $5,000 to $7,499 | 4 (0.6%) | 43 (6.9%) |
| $7,500 to $9,999 | 0 (0.0%) | 55 (8.8%) |
| $10,000 to $12,499 | 0 (0.0%) | 16 (2.5%) |
| $12,500 to $14,999 | 13 (2.1%) | 5 (0.8%) |
| $15,000 to $17,499 | 15 (2.4%) | 16 (2.5%) |
| $17,500 to $19,999 | 18 (2.9%) | 0 (0.0%) |
| $20,000 to $22,499 | 26 (4.1%) | 20 (3.2%) |
| $22,500 to $24,999 | 13 (2.1%) | 62 (9.9%) |
| $25,000 to $29,999 | 65 (10.3%) | 74 (11.8%) |
| $30,000 to $34,999 | 4 (0.6%) | 28 (4.5%) |
| $35,000 to $39,999 | 18 (2.9%) | 10 (1.6%) |
| $40,000 to $44,999 | 0 (0.0%) | 106 (16.9%) |
| $45,000 to $49,999 | 61 (9.7%) | 29 (4.6%) |
| $50,000 to $54,999 | 22 (3.5%) | 49 (7.8%) |
| $55,000 to $64,999 | 68 (10.8%) | 43 (6.9%) |
| $65,000 to $74,999 | 8 (1.3%) | 0 (0.0%) |
| $75,000 to $99,999 | 57 (9.0%) | 15 (2.4%) |
| $100,000+ | 167 (26.5%) | 0 (0.0%) |
| Total | 631 (100.0%) | 627 (100.0%) |
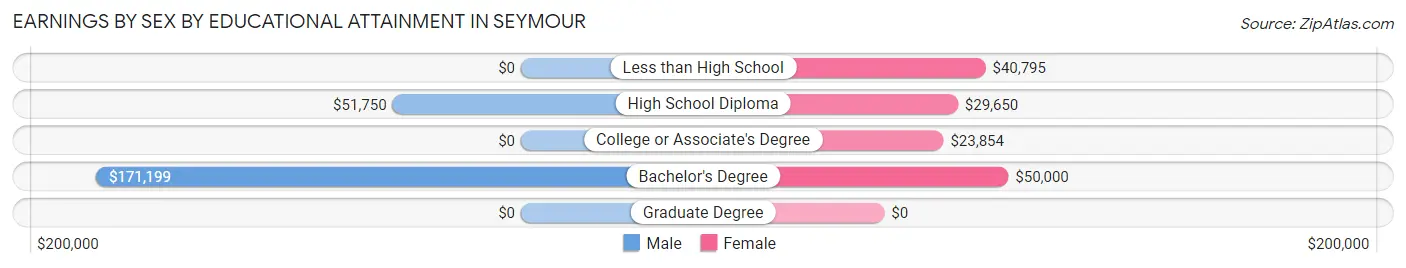
Earnings by Sex by Educational Attainment in Seymour
Average earnings in Seymour are $59,762 for men and $29,221 for women, a difference of 51.1%. Men with an educational attainment of bachelor's degree enjoy the highest average annual earnings of $171,199, while those with high school diploma education earn the least with $51,750. Women with an educational attainment of bachelor's degree earn the most with the average annual earnings of $50,000, while those with college or associate's degree education have the smallest earnings of $23,854.
| Educational Attainment | Male Income | Female Income |
| Less than High School | - | - |
| High School Diploma | $51,750 | $29,650 |
| College or Associate's Degree | - | - |
| Bachelor's Degree | $171,199 | $50,000 |
| Graduate Degree | - | - |
| Total | $59,762 | $29,221 |
Family Income in Seymour
Family Income Brackets in Seymour
According to the Seymour family income data, there are 180 families falling into the $50,000 to $74,999 income range, which is the most common income bracket and makes up 23.7% of all families. Conversely, the $10,000 to $14,999 income bracket is the least frequent group with only 14 families (1.8%) belonging to this category.
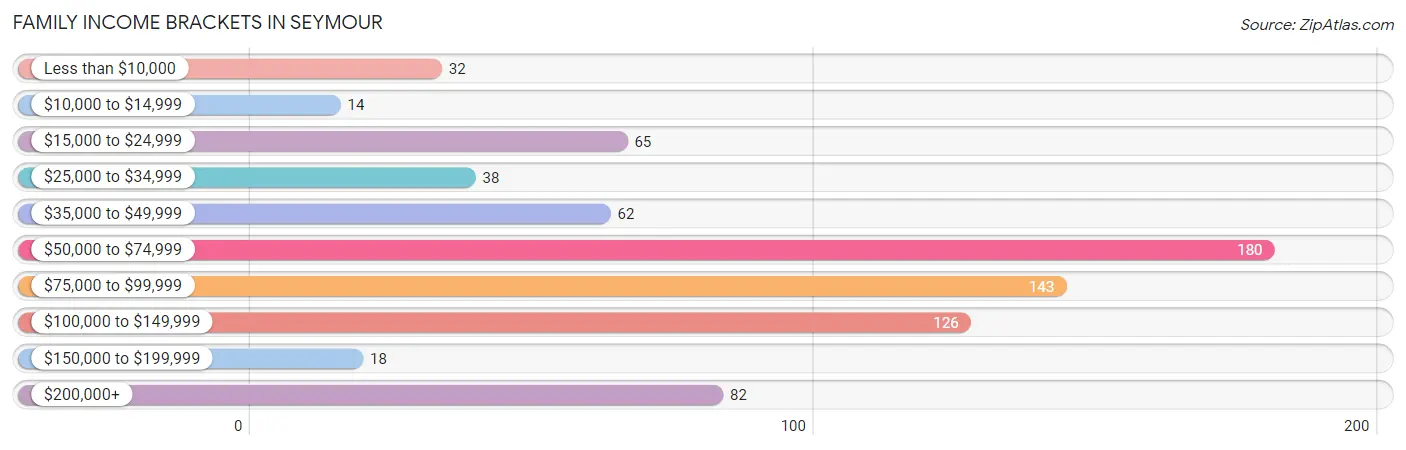
| Income Bracket | # Families | % Families |
| Less than $10,000 | 32 | 4.2% |
| $10,000 to $14,999 | 14 | 1.8% |
| $15,000 to $24,999 | 65 | 8.6% |
| $25,000 to $34,999 | 38 | 5.0% |
| $35,000 to $49,999 | 62 | 8.2% |
| $50,000 to $74,999 | 180 | 23.7% |
| $75,000 to $99,999 | 143 | 18.8% |
| $100,000 to $149,999 | 126 | 16.6% |
| $150,000 to $199,999 | 18 | 2.4% |
| $200,000+ | 82 | 10.8% |
Family Income by Famaliy Size in Seymour
4-person families (171 | 22.5%) account for the highest median family income in Seymour with $89,068 per family, while 2-person families (445 | 58.6%) have the highest median income of $33,320 per family member.
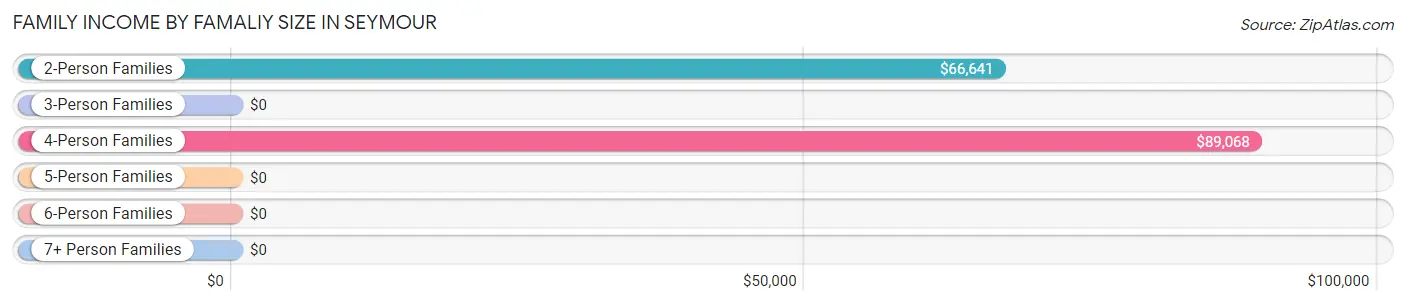
| Income Bracket | # Families | Median Income |
| 2-Person Families | 445 (58.6%) | $66,641 |
| 3-Person Families | 116 (15.3%) | $0 |
| 4-Person Families | 171 (22.5%) | $89,068 |
| 5-Person Families | 15 (2.0%) | $0 |
| 6-Person Families | 13 (1.7%) | $0 |
| 7+ Person Families | 0 (0.0%) | $0 |
| Total | 760 (100.0%) | $74,295 |
Family Income by Number of Earners in Seymour
The median family income in Seymour is $74,295, with families comprising 3+ earners (81) having the highest median family income of $143,346, while families with no earners (156) have the lowest median family income of $38,235, accounting for 10.7% and 20.5% of families, respectively.
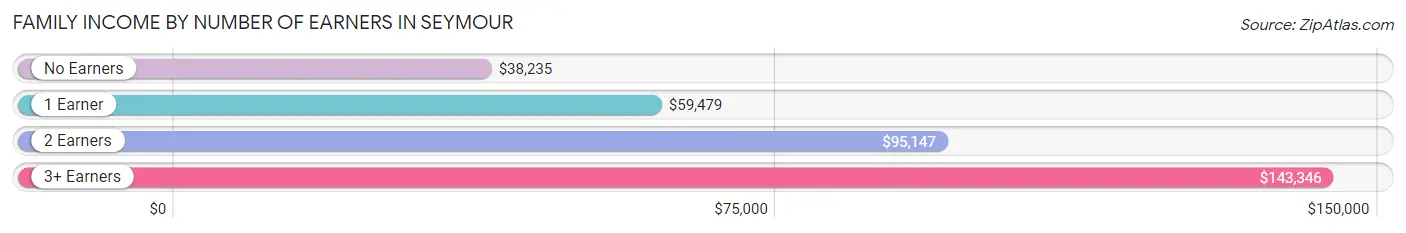
| Number of Earners | # Families | Median Income |
| No Earners | 156 (20.5%) | $38,235 |
| 1 Earner | 257 (33.8%) | $59,479 |
| 2 Earners | 266 (35.0%) | $95,147 |
| 3+ Earners | 81 (10.7%) | $143,346 |
| Total | 760 (100.0%) | $74,295 |
Household Income in Seymour
Household Income Brackets in Seymour
With 185 households falling in the category, the $50,000 to $74,999 income range is the most frequent in Seymour, accounting for 16.2% of all households. In contrast, only 18 households (1.6%) fall into the $150,000 to $199,999 income bracket, making it the least populous group.
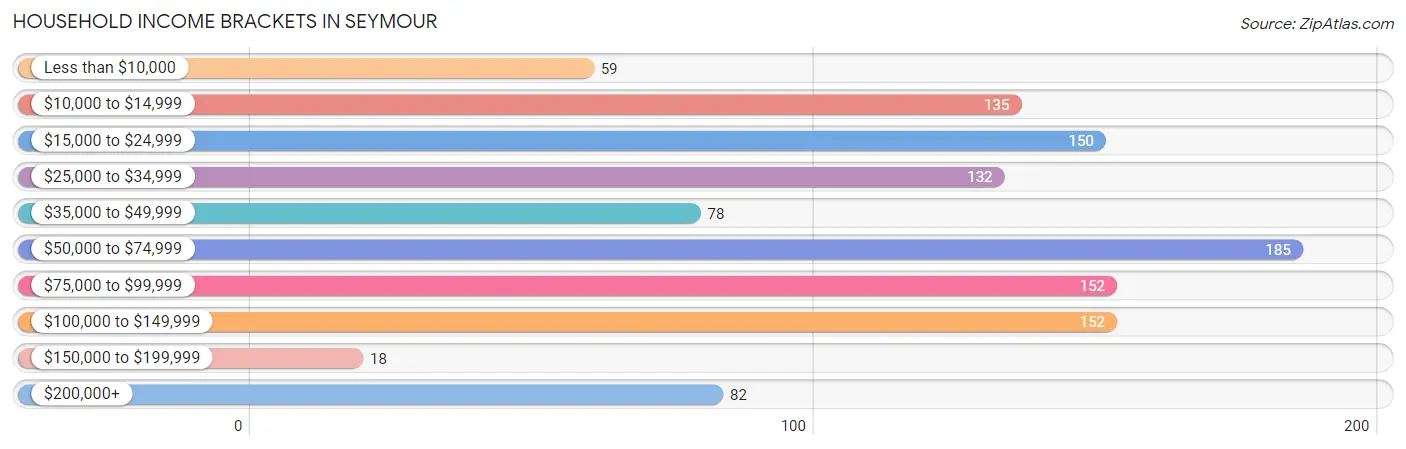
| Income Bracket | # Households | % Households |
| Less than $10,000 | 59 | 5.2% |
| $10,000 to $14,999 | 135 | 11.8% |
| $15,000 to $24,999 | 150 | 13.1% |
| $25,000 to $34,999 | 132 | 11.5% |
| $35,000 to $49,999 | 78 | 6.8% |
| $50,000 to $74,999 | 185 | 16.2% |
| $75,000 to $99,999 | 152 | 13.3% |
| $100,000 to $149,999 | 152 | 13.3% |
| $150,000 to $199,999 | 18 | 1.6% |
| $200,000+ | 82 | 7.2% |
Household Income by Householder Age in Seymour
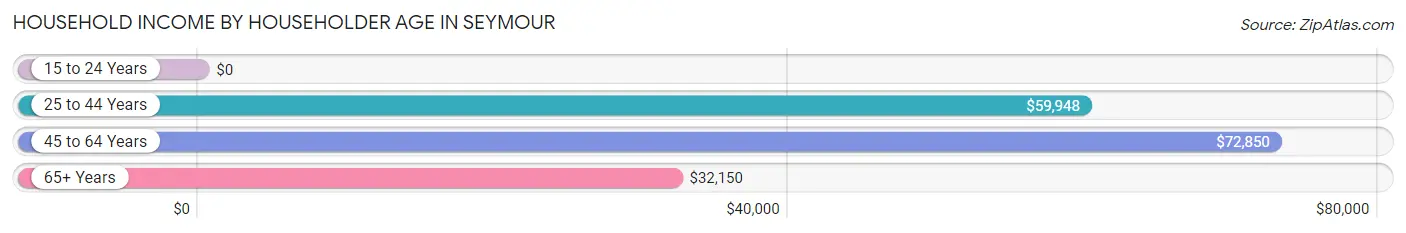
The median household income in Seymour is $53,077, with the highest median household income of $72,850 found in the 45 to 64 years age bracket for the primary householder. A total of 459 households (40.1%) fall into this category. Meanwhile, the 15 to 24 years age bracket for the primary householder has the lowest median household income of $0, with 55 households (4.8%) in this group.
| Income Bracket | # Households | Median Income |
| 15 to 24 Years | 55 (4.8%) | $0 |
| 25 to 44 Years | 263 (23.0%) | $59,948 |
| 45 to 64 Years | 459 (40.1%) | $72,850 |
| 65+ Years | 367 (32.1%) | $32,150 |
| Total | 1,144 (100.0%) | $53,077 |
Poverty in Seymour
Income Below Poverty by Sex and Age in Seymour
With 11.1% poverty level for males and 15.7% for females among the residents of Seymour, 65 to 74 year old males and 18 to 24 year old females are the most vulnerable to poverty, with 37 males (21.8%) and 32 females (53.3%) in their respective age groups living below the poverty level.
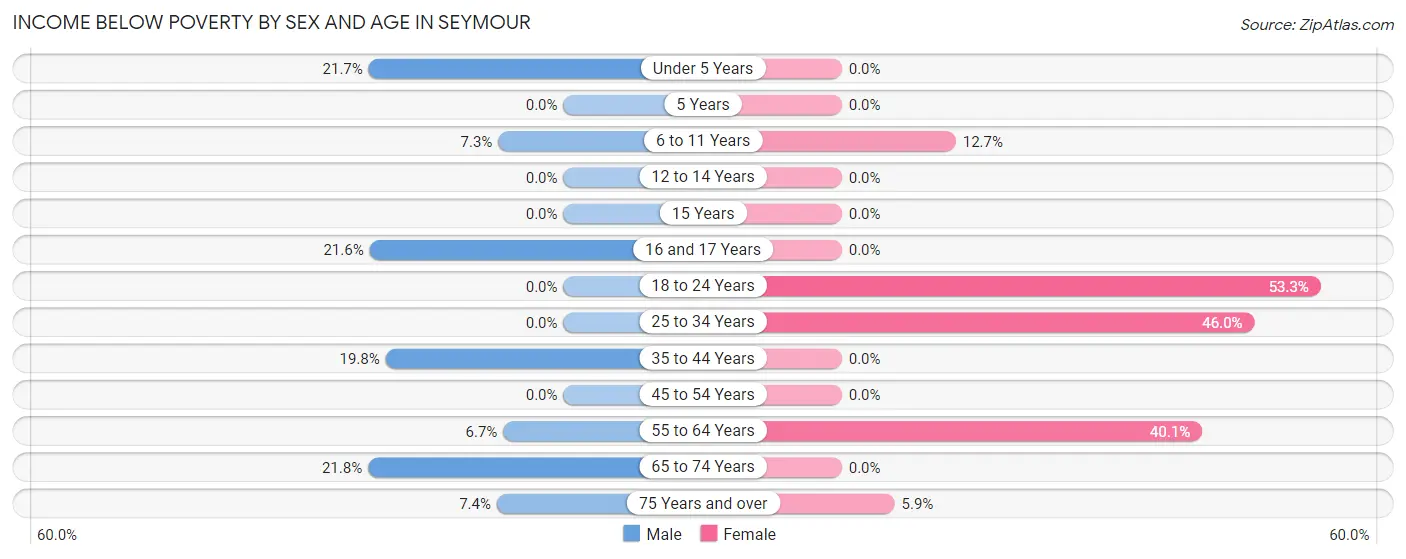
| Age Bracket | Male | Female |
| Under 5 Years | 18 (21.7%) | 0 (0.0%) |
| 5 Years | 0 (0.0%) | 0 (0.0%) |
| 6 to 11 Years | 17 (7.3%) | 8 (12.7%) |
| 12 to 14 Years | 0 (0.0%) | 0 (0.0%) |
| 15 Years | 0 (0.0%) | 0 (0.0%) |
| 16 and 17 Years | 19 (21.6%) | 0 (0.0%) |
| 18 to 24 Years | 0 (0.0%) | 32 (53.3%) |
| 25 to 34 Years | 0 (0.0%) | 34 (46.0%) |
| 35 to 44 Years | 39 (19.8%) | 0 (0.0%) |
| 45 to 54 Years | 0 (0.0%) | 0 (0.0%) |
| 55 to 64 Years | 14 (6.7%) | 126 (40.1%) |
| 65 to 74 Years | 37 (21.8%) | 0 (0.0%) |
| 75 Years and over | 10 (7.4%) | 8 (5.9%) |
| Total | 154 (11.1%) | 208 (15.7%) |
Income Above Poverty by Sex and Age in Seymour
According to the poverty statistics in Seymour, males aged 5 years and females aged under 5 years are the age groups that are most secure financially, with 100.0% of males and 100.0% of females in these age groups living above the poverty line.
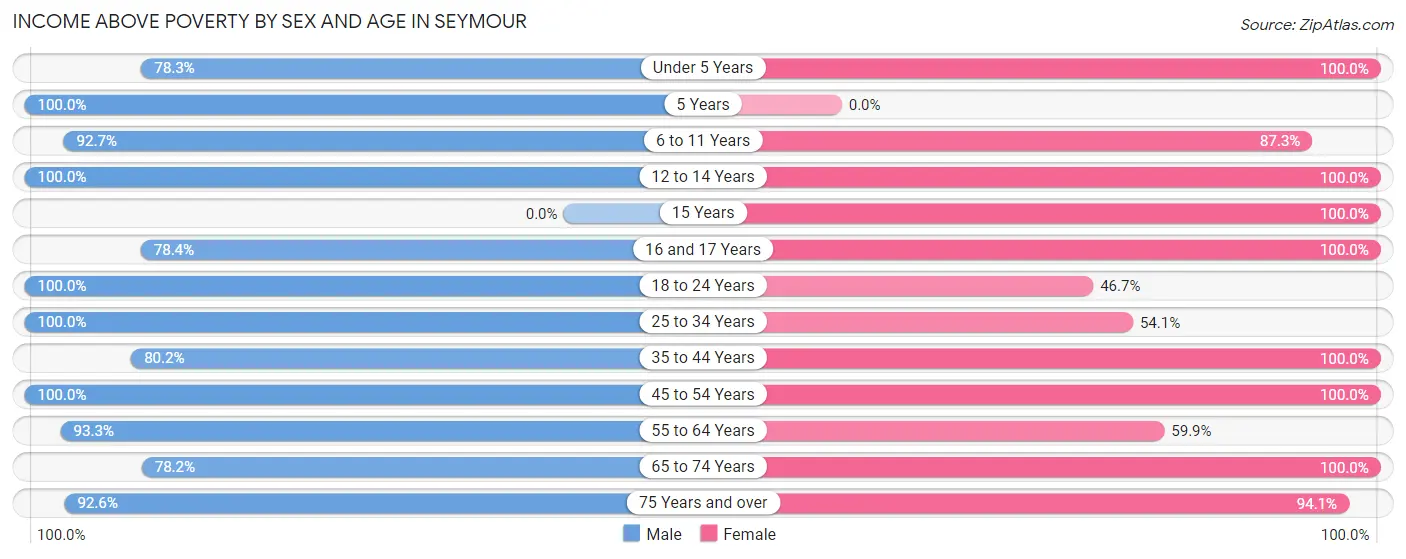
| Age Bracket | Male | Female |
| Under 5 Years | 65 (78.3%) | 19 (100.0%) |
| 5 Years | 11 (100.0%) | 0 (0.0%) |
| 6 to 11 Years | 217 (92.7%) | 55 (87.3%) |
| 12 to 14 Years | 44 (100.0%) | 134 (100.0%) |
| 15 Years | 0 (0.0%) | 12 (100.0%) |
| 16 and 17 Years | 69 (78.4%) | 32 (100.0%) |
| 18 to 24 Years | 38 (100.0%) | 28 (46.7%) |
| 25 to 34 Years | 61 (100.0%) | 40 (54.0%) |
| 35 to 44 Years | 158 (80.2%) | 188 (100.0%) |
| 45 to 54 Years | 112 (100.0%) | 161 (100.0%) |
| 55 to 64 Years | 195 (93.3%) | 188 (59.9%) |
| 65 to 74 Years | 133 (78.2%) | 132 (100.0%) |
| 75 Years and over | 125 (92.6%) | 128 (94.1%) |
| Total | 1,228 (88.9%) | 1,117 (84.3%) |
Income Below Poverty Among Married-Couple Families in Seymour
The poverty statistics for married-couple families in Seymour show that 2.6% or 17 of the total 645 families live below the poverty line. Families with no children have the highest poverty rate of 4.3%, comprising of 17 families. On the other hand, families with 1 or 2 children have the lowest poverty rate of 0.0%, which includes 0 families.
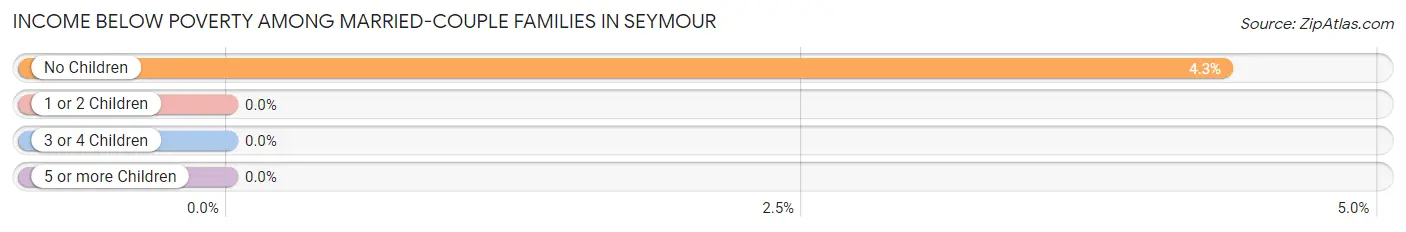
| Children | Above Poverty | Below Poverty |
| No Children | 376 (95.7%) | 17 (4.3%) |
| 1 or 2 Children | 224 (100.0%) | 0 (0.0%) |
| 3 or 4 Children | 28 (100.0%) | 0 (0.0%) |
| 5 or more Children | 0 (0.0%) | 0 (0.0%) |
| Total | 628 (97.4%) | 17 (2.6%) |
Income Below Poverty Among Single-Parent Households in Seymour
According to the poverty data in Seymour, 46.2% or 6 single-father households and 51.0% or 52 single-mother households are living below the poverty line. Among single-father households, those with no children have the highest poverty rate, with 6 households (46.2%) experiencing poverty. Likewise, among single-mother households, those with 1 or 2 children have the highest poverty rate, with 52 households (67.5%) falling below the poverty line.
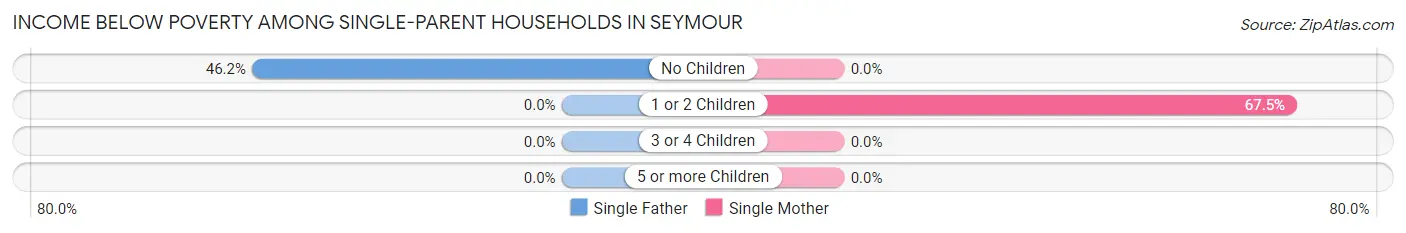
| Children | Single Father | Single Mother |
| No Children | 6 (46.2%) | 0 (0.0%) |
| 1 or 2 Children | 0 (0.0%) | 52 (67.5%) |
| 3 or 4 Children | 0 (0.0%) | 0 (0.0%) |
| 5 or more Children | 0 (0.0%) | 0 (0.0%) |
| Total | 6 (46.2%) | 52 (51.0%) |
Income Below Poverty Among Married-Couple vs Single-Parent Households in Seymour
The poverty data for Seymour shows that 17 of the married-couple family households (2.6%) and 58 of the single-parent households (50.4%) are living below the poverty level. Within the married-couple family households, those with no children have the highest poverty rate, with 17 households (4.3%) falling below the poverty line. Among the single-parent households, those with 1 or 2 children have the highest poverty rate, with 52 household (67.5%) living below poverty.
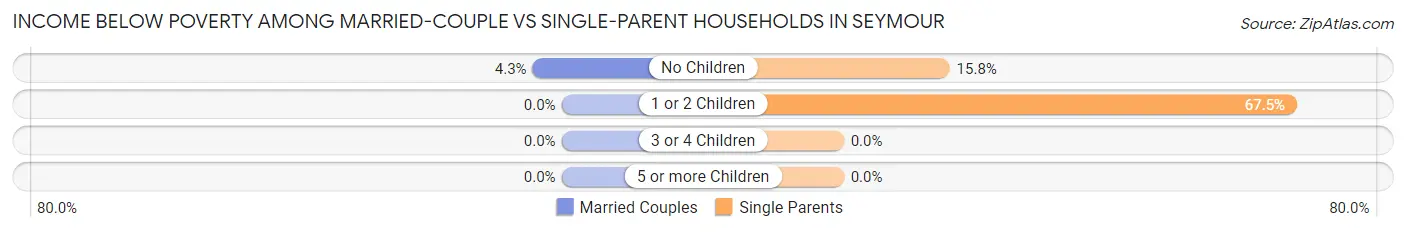
| Children | Married-Couple Families | Single-Parent Households |
| No Children | 17 (4.3%) | 6 (15.8%) |
| 1 or 2 Children | 0 (0.0%) | 52 (67.5%) |
| 3 or 4 Children | 0 (0.0%) | 0 (0.0%) |
| 5 or more Children | 0 (0.0%) | 0 (0.0%) |
| Total | 17 (2.6%) | 58 (50.4%) |
Race in Seymour
The most populous races in Seymour are White / Caucasian (2,415 | 86.7%), Hispanic or Latino (385 | 13.8%), and Two or more Races (241 | 8.6%).
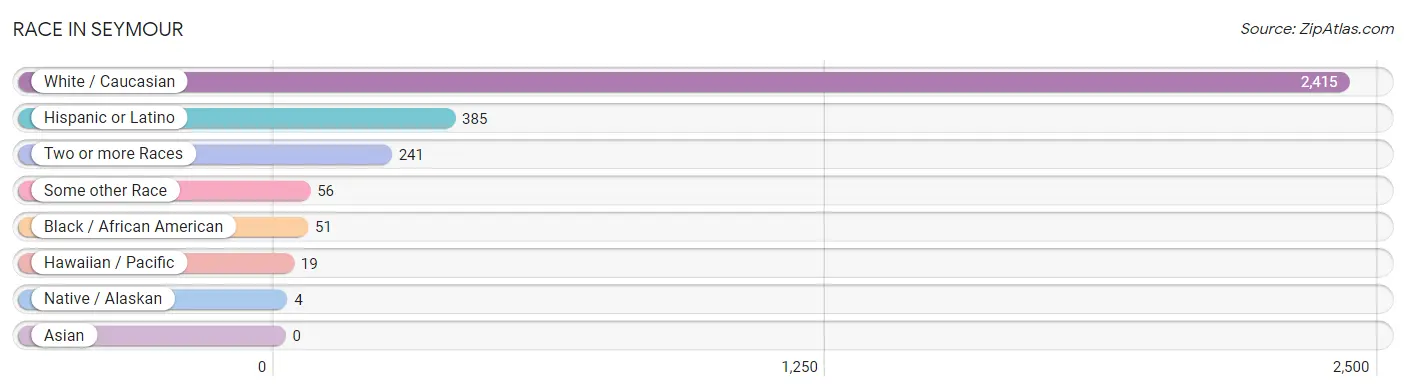
| Race | # Population | % Population |
| Asian | 0 | 0.0% |
| Black / African American | 51 | 1.8% |
| Hawaiian / Pacific | 19 | 0.7% |
| Hispanic or Latino | 385 | 13.8% |
| Native / Alaskan | 4 | 0.1% |
| White / Caucasian | 2,415 | 86.7% |
| Two or more Races | 241 | 8.6% |
| Some other Race | 56 | 2.0% |
| Total | 2,786 | 100.0% |
Ancestry in Seymour
The most populous ancestries reported in Seymour are German (500 | 17.9%), Mexican (338 | 12.1%), English (260 | 9.3%), Irish (217 | 7.8%), and Czech (186 | 6.7%), together accounting for 53.9% of all Seymour residents.
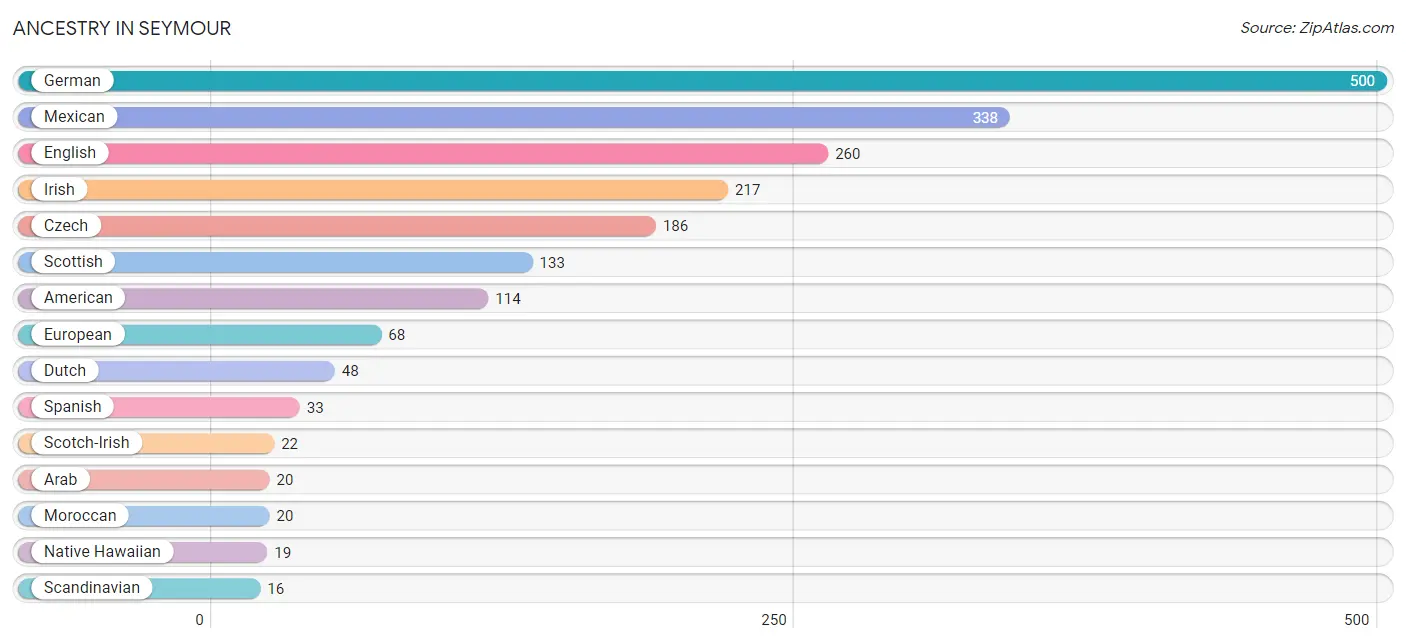
| Ancestry | # Population | % Population |
| American | 114 | 4.1% |
| Arab | 20 | 0.7% |
| Australian | 13 | 0.5% |
| Chickasaw | 4 | 0.1% |
| Czech | 186 | 6.7% |
| Dutch | 48 | 1.7% |
| English | 260 | 9.3% |
| European | 68 | 2.4% |
| French | 4 | 0.1% |
| German | 500 | 17.9% |
| Irish | 217 | 7.8% |
| Italian | 11 | 0.4% |
| Mexican | 338 | 12.1% |
| Moroccan | 20 | 0.7% |
| Native Hawaiian | 19 | 0.7% |
| Scandinavian | 16 | 0.6% |
| Scotch-Irish | 22 | 0.8% |
| Scottish | 133 | 4.8% |
| Sioux | 4 | 0.1% |
| Spanish | 33 | 1.2% | View All 20 Rows |
Immigrants in Seymour
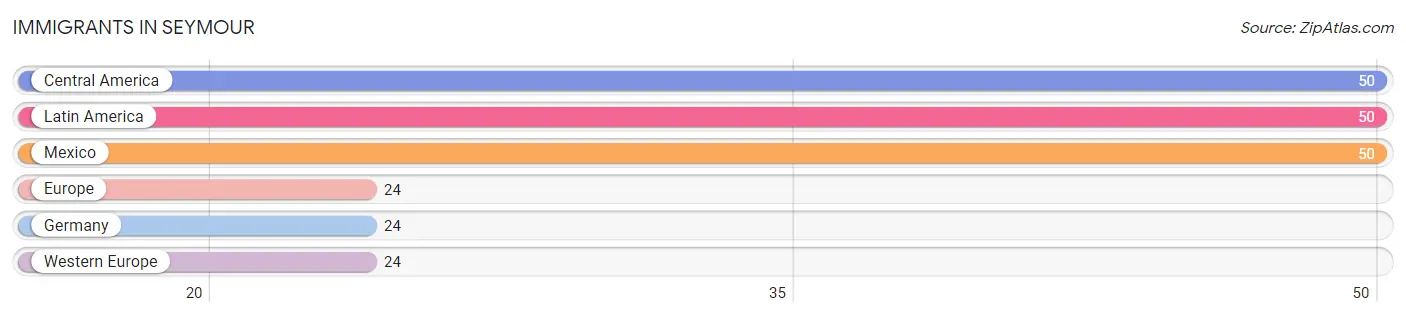
The most numerous immigrant groups reported in Seymour came from Central America (50 | 1.8%), Latin America (50 | 1.8%), Mexico (50 | 1.8%), Europe (24 | 0.9%), and Germany (24 | 0.9%), together accounting for 7.1% of all Seymour residents.
| Immigration Origin | # Population | % Population |
| Central America | 50 | 1.8% |
| Europe | 24 | 0.9% |
| Germany | 24 | 0.9% |
| Latin America | 50 | 1.8% |
| Mexico | 50 | 1.8% |
| Western Europe | 24 | 0.9% | View All 6 Rows |
Sex and Age in Seymour
Sex and Age in Seymour
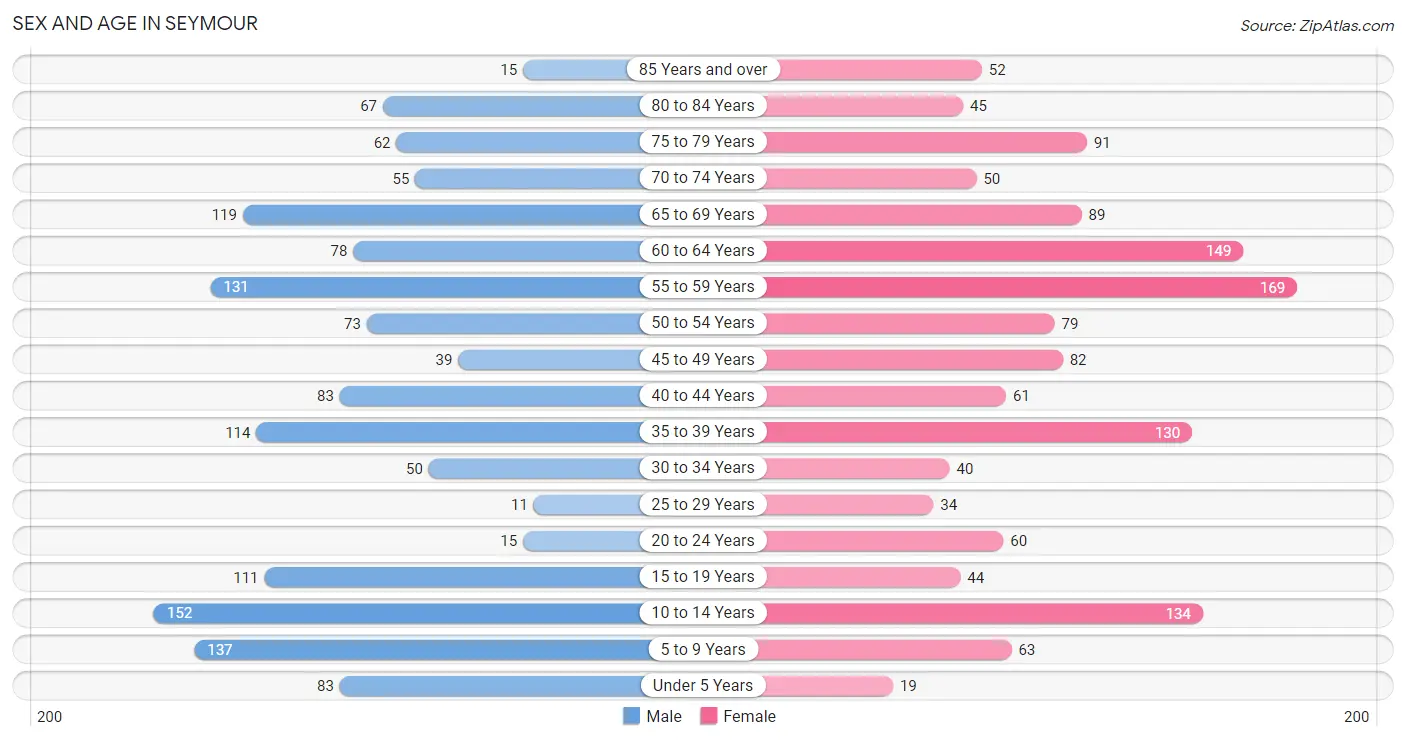
The most populous age groups in Seymour are 10 to 14 Years (152 | 10.9%) for men and 55 to 59 Years (169 | 12.1%) for women.
| Age Bracket | Male | Female |
| Under 5 Years | 83 (5.9%) | 19 (1.4%) |
| 5 to 9 Years | 137 (9.8%) | 63 (4.5%) |
| 10 to 14 Years | 152 (10.9%) | 134 (9.6%) |
| 15 to 19 Years | 111 (8.0%) | 44 (3.2%) |
| 20 to 24 Years | 15 (1.1%) | 60 (4.3%) |
| 25 to 29 Years | 11 (0.8%) | 34 (2.4%) |
| 30 to 34 Years | 50 (3.6%) | 40 (2.9%) |
| 35 to 39 Years | 114 (8.2%) | 130 (9.3%) |
| 40 to 44 Years | 83 (5.9%) | 61 (4.4%) |
| 45 to 49 Years | 39 (2.8%) | 82 (5.9%) |
| 50 to 54 Years | 73 (5.2%) | 79 (5.7%) |
| 55 to 59 Years | 131 (9.4%) | 169 (12.1%) |
| 60 to 64 Years | 78 (5.6%) | 149 (10.7%) |
| 65 to 69 Years | 119 (8.5%) | 89 (6.4%) |
| 70 to 74 Years | 55 (3.9%) | 50 (3.6%) |
| 75 to 79 Years | 62 (4.4%) | 91 (6.5%) |
| 80 to 84 Years | 67 (4.8%) | 45 (3.2%) |
| 85 Years and over | 15 (1.1%) | 52 (3.7%) |
| Total | 1,395 (100.0%) | 1,391 (100.0%) |
Families and Households in Seymour
Median Family Size in Seymour
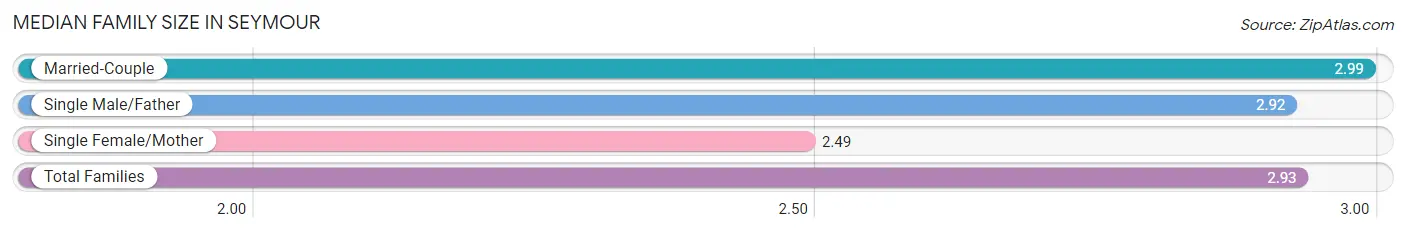
The median family size in Seymour is 2.93 persons per family, with married-couple families (645 | 84.9%) accounting for the largest median family size of 2.99 persons per family. On the other hand, single female/mother families (102 | 13.4%) represent the smallest median family size with 2.49 persons per family.
| Family Type | # Families | Family Size |
| Married-Couple | 645 (84.9%) | 2.99 |
| Single Male/Father | 13 (1.7%) | 2.92 |
| Single Female/Mother | 102 (13.4%) | 2.49 |
| Total Families | 760 (100.0%) | 2.93 |
Median Household Size in Seymour
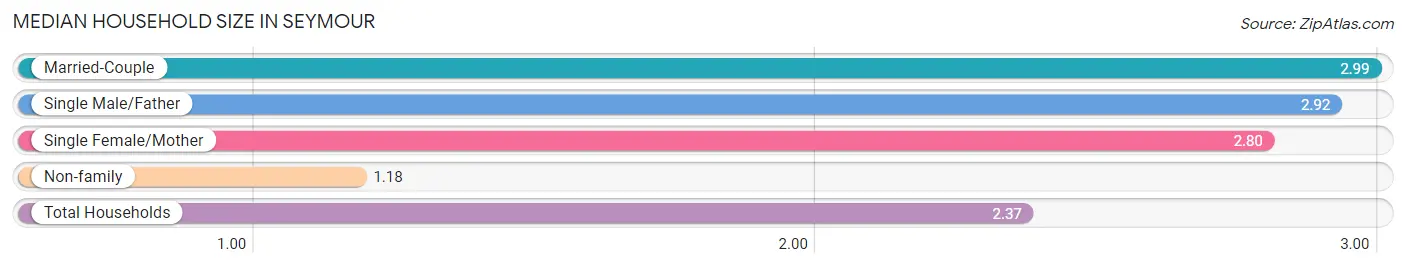
The median household size in Seymour is 2.37 persons per household, with married-couple households (645 | 56.4%) accounting for the largest median household size of 2.99 persons per household. non-family households (384 | 33.6%) represent the smallest median household size with 1.18 persons per household.
| Household Type | # Households | Household Size |
| Married-Couple | 645 (56.4%) | 2.99 |
| Single Male/Father | 13 (1.1%) | 2.92 |
| Single Female/Mother | 102 (8.9%) | 2.80 |
| Non-family | 384 (33.6%) | 1.18 |
| Total Households | 1,144 (100.0%) | 2.37 |
Household Size by Marriage Status in Seymour
Out of a total of 1,144 households in Seymour, 760 (66.4%) are family households, while 384 (33.6%) are nonfamily households. The most numerous type of family households are 2-person households, comprising 413, and the most common type of nonfamily households are 1-person households, comprising 347.
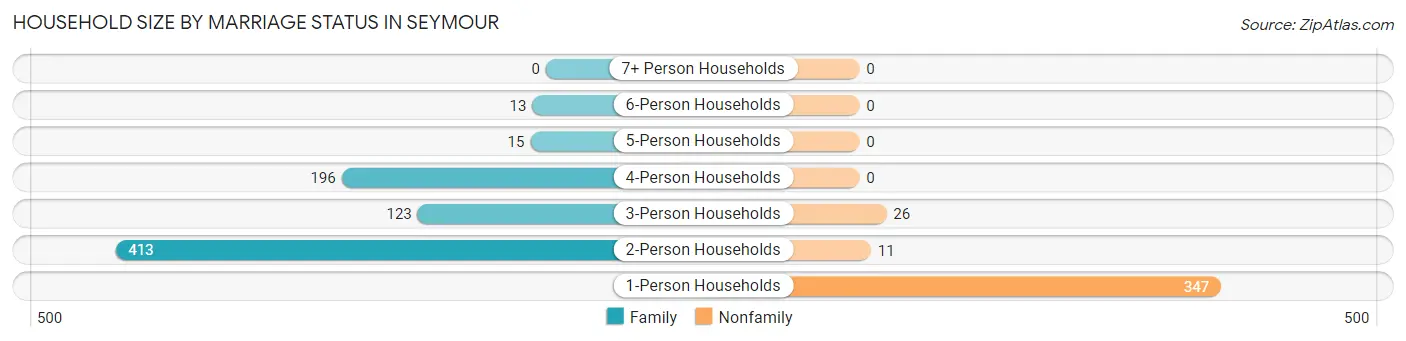
| Household Size | Family Households | Nonfamily Households |
| 1-Person Households | - | 347 (30.3%) |
| 2-Person Households | 413 (36.1%) | 11 (1.0%) |
| 3-Person Households | 123 (10.7%) | 26 (2.3%) |
| 4-Person Households | 196 (17.1%) | 0 (0.0%) |
| 5-Person Households | 15 (1.3%) | 0 (0.0%) |
| 6-Person Households | 13 (1.1%) | 0 (0.0%) |
| 7+ Person Households | 0 (0.0%) | 0 (0.0%) |
| Total | 760 (66.4%) | 384 (33.6%) |
Female Fertility in Seymour
Fertility by Age in Seymour
Average fertility rate in Seymour is 44.0 births per 1,000 women. Women in the age bracket of 20 to 34 years have the highest fertility rate with 149.0 births per 1,000 women. Women in the age bracket of 20 to 34 years acount for 100.0% of all women with births.
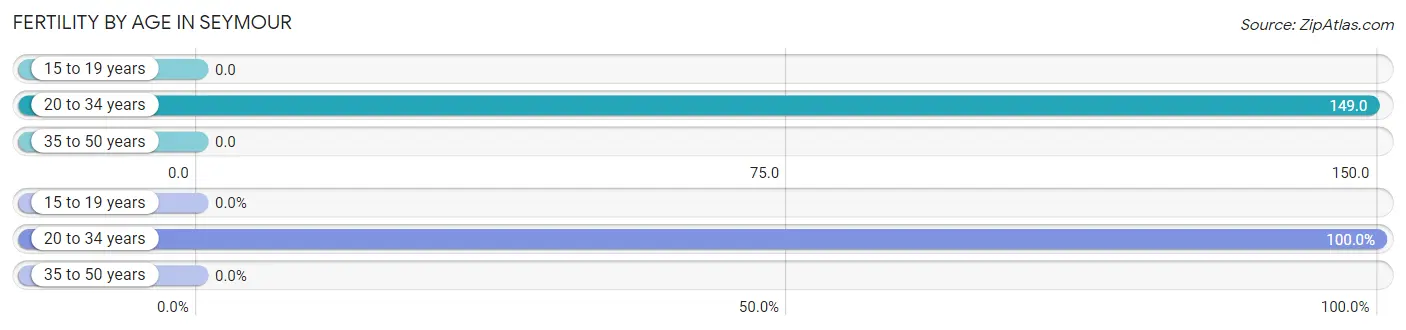
| Age Bracket | Women with Births | Births / 1,000 Women |
| 15 to 19 years | 0 (0.0%) | 0.0 |
| 20 to 34 years | 20 (100.0%) | 149.0 |
| 35 to 50 years | 0 (0.0%) | 0.0 |
| Total | 20 (100.0%) | 44.0 |
Fertility by Age by Marriage Status in Seymour
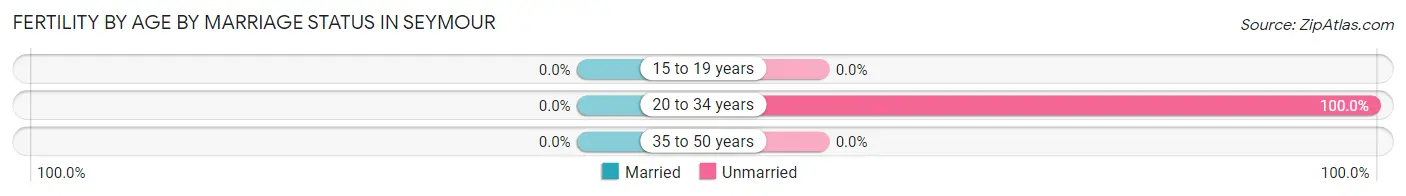
| Age Bracket | Married | Unmarried |
| 15 to 19 years | 0 (0.0%) | 0 (0.0%) |
| 20 to 34 years | 0 (0.0%) | 20 (100.0%) |
| 35 to 50 years | 0 (0.0%) | 0 (0.0%) |
| Total | 0 (0.0%) | 20 (100.0%) |
Fertility by Education in Seymour
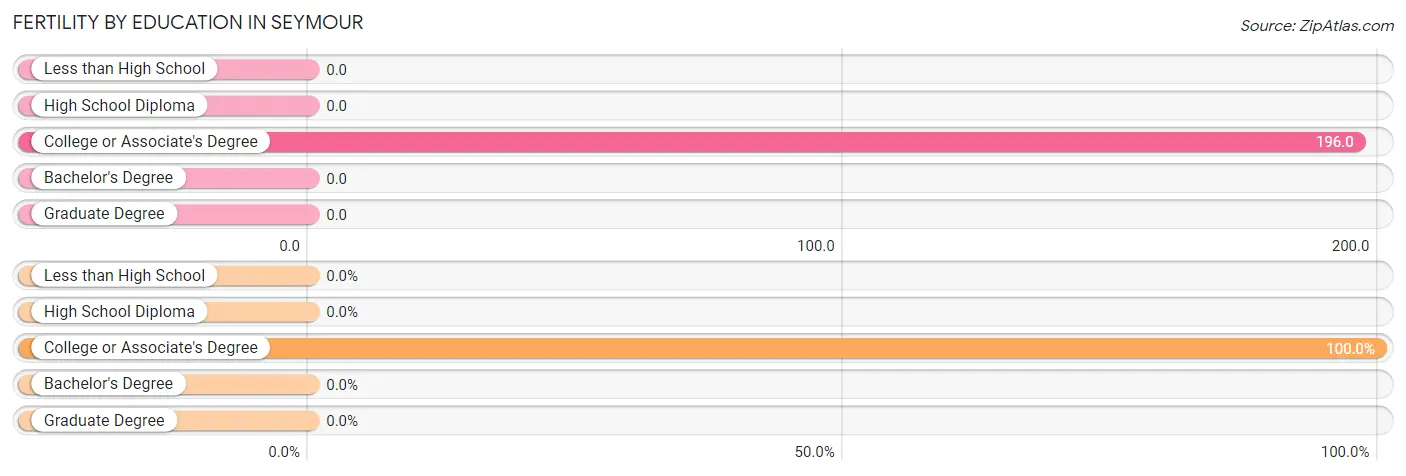
| Educational Attainment | Women with Births | Births / 1,000 Women |
| Less than High School | 0 (0.0%) | 0.0 |
| High School Diploma | 0 (0.0%) | 0.0 |
| College or Associate's Degree | 20 (100.0%) | 196.0 |
| Bachelor's Degree | 0 (0.0%) | 0.0 |
| Graduate Degree | 0 (0.0%) | 0.0 |
| Total | 20 (100.0%) | 44.0 |
Fertility by Education by Marriage Status in Seymour
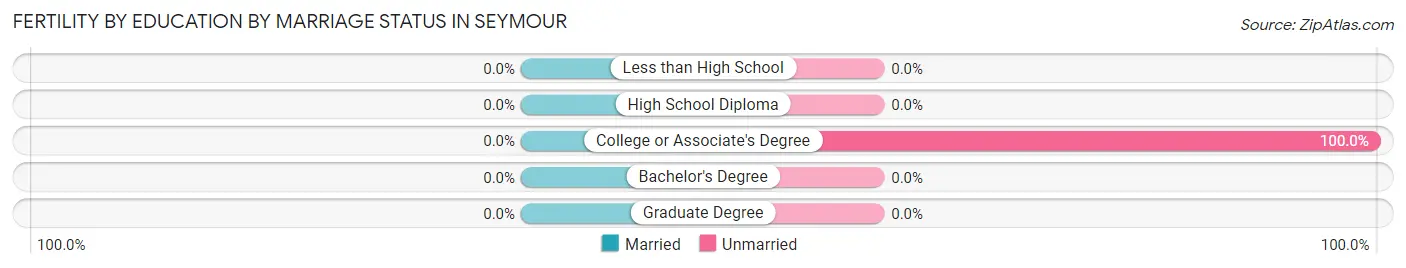
| Educational Attainment | Married | Unmarried |
| Less than High School | 0 (0.0%) | 0 (0.0%) |
| High School Diploma | 0 (0.0%) | 0 (0.0%) |
| College or Associate's Degree | 0 (0.0%) | 20 (100.0%) |
| Bachelor's Degree | 0 (0.0%) | 0 (0.0%) |
| Graduate Degree | 0 (0.0%) | 0 (0.0%) |
| Total | 0 (0.0%) | 20 (100.0%) |
Employment Characteristics in Seymour
Employment by Class of Employer in Seymour
Among the 1,092 employed individuals in Seymour, private company employees (603 | 55.2%), self-employed (not incorporated) (175 | 16.0%), and self-employed (incorporated) (114 | 10.4%) make up the most common classes of employment.
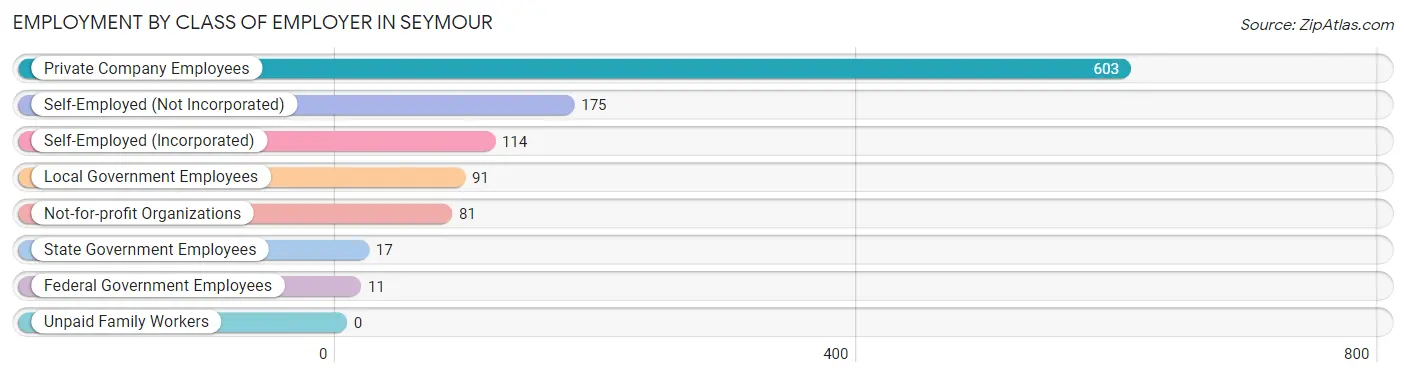
| Employer Class | # Employees | % Employees |
| Private Company Employees | 603 | 55.2% |
| Self-Employed (Incorporated) | 114 | 10.4% |
| Self-Employed (Not Incorporated) | 175 | 16.0% |
| Not-for-profit Organizations | 81 | 7.4% |
| Local Government Employees | 91 | 8.3% |
| State Government Employees | 17 | 1.6% |
| Federal Government Employees | 11 | 1.0% |
| Unpaid Family Workers | 0 | 0.0% |
| Total | 1,092 | 100.0% |
Employment Status by Age in Seymour
According to the labor force statistics for Seymour, out of the total population over 16 years of age (2,186), 51.3% or 1,121 individuals are in the labor force, with 0.5% or 6 of them unemployed. The age group with the highest labor force participation rate is 30 to 34 years, with 90.0% or 81 individuals in the labor force. Within the labor force, the 30 to 34 years age range has the highest percentage of unemployed individuals, with 7.4% or 6 of them being unemployed.
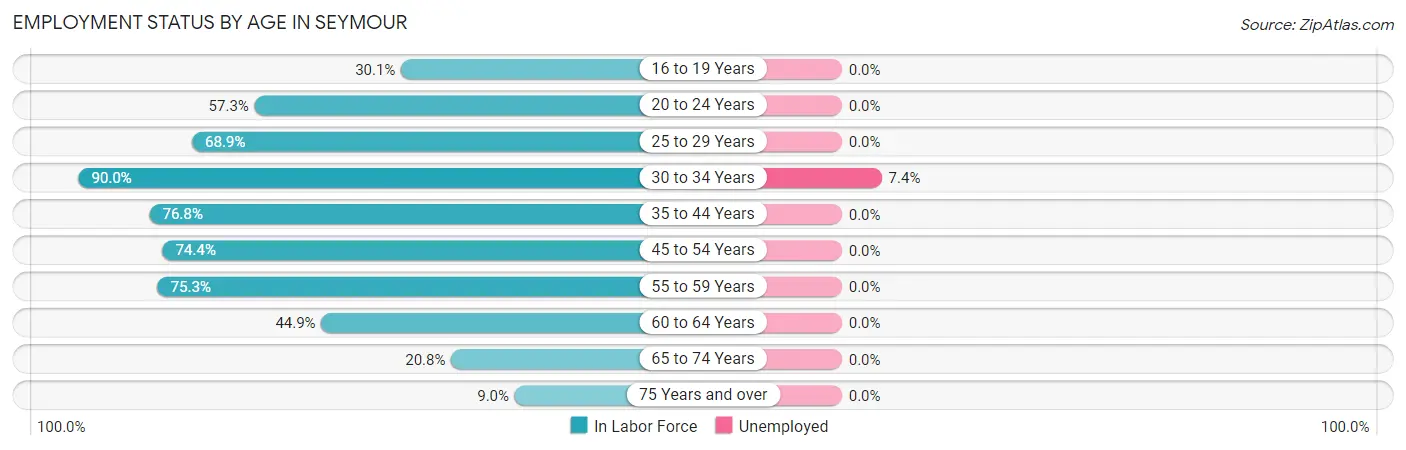
| Age Bracket | In Labor Force | Unemployed |
| 16 to 19 Years | 43 (30.1%) | 0 (0.0%) |
| 20 to 24 Years | 43 (57.3%) | 0 (0.0%) |
| 25 to 29 Years | 31 (68.9%) | 0 (0.0%) |
| 30 to 34 Years | 81 (90.0%) | 6 (7.4%) |
| 35 to 44 Years | 298 (76.8%) | 0 (0.0%) |
| 45 to 54 Years | 203 (74.4%) | 0 (0.0%) |
| 55 to 59 Years | 226 (75.3%) | 0 (0.0%) |
| 60 to 64 Years | 102 (44.9%) | 0 (0.0%) |
| 65 to 74 Years | 65 (20.8%) | 0 (0.0%) |
| 75 Years and over | 30 (9.0%) | 0 (0.0%) |
| Total | 1,121 (51.3%) | 6 (0.5%) |
Employment Status by Educational Attainment in Seymour
According to labor force statistics for Seymour, 71.1% of individuals (941) out of the total population between 25 and 64 years of age (1,323) are in the labor force, with 0.6% or 6 of them being unemployed. The group with the highest labor force participation rate are those with the educational attainment of bachelor's degree or higher, with 88.6% or 210 individuals in the labor force. Within the labor force, individuals with less than high school education have the highest percentage of unemployment, with 6.6% or 6 of them being unemployed.
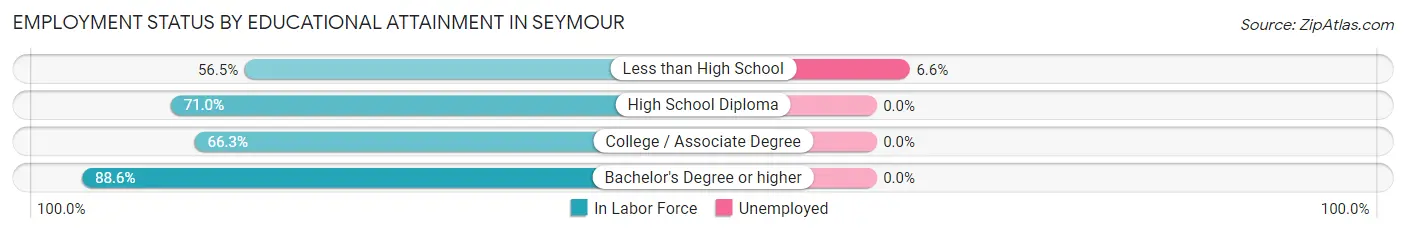
| Educational Attainment | In Labor Force | Unemployed |
| Less than High School | 91 (56.5%) | 11 (6.6%) |
| High School Diploma | 408 (71.0%) | 0 (0.0%) |
| College / Associate Degree | 232 (66.3%) | 0 (0.0%) |
| Bachelor's Degree or higher | 210 (88.6%) | 0 (0.0%) |
| Total | 941 (71.1%) | 8 (0.6%) |
Employment Occupations by Sex in Seymour
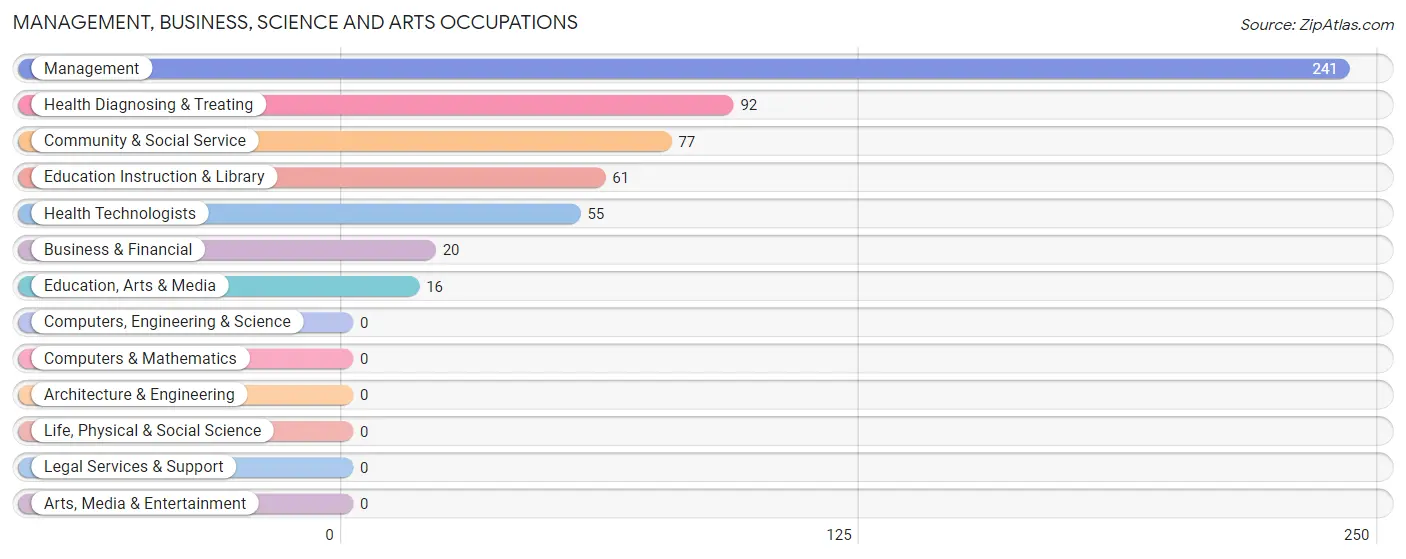
Management, Business, Science and Arts Occupations
The most common Management, Business, Science and Arts occupations in Seymour are Management (241 | 21.6%), Health Diagnosing & Treating (92 | 8.2%), Community & Social Service (77 | 6.9%), Education Instruction & Library (61 | 5.5%), and Health Technologists (55 | 4.9%).
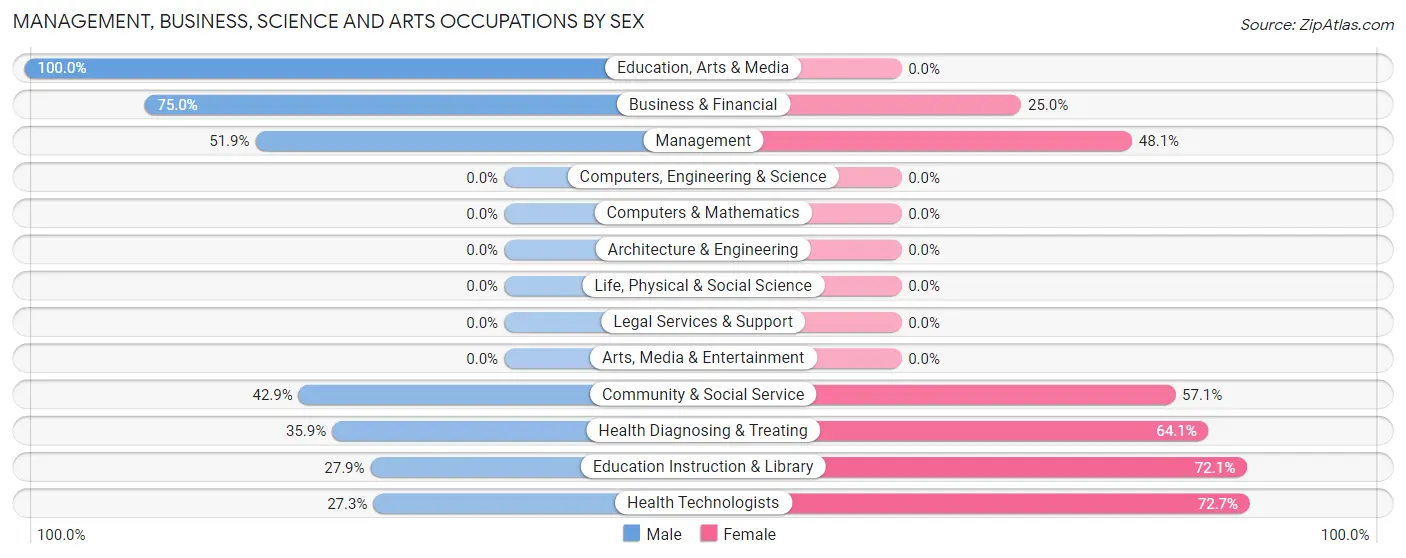
Management, Business, Science and Arts Occupations by Sex
Within the Management, Business, Science and Arts occupations in Seymour, the most male-oriented occupations are Education, Arts & Media (100.0%), Business & Financial (75.0%), and Management (51.9%), while the most female-oriented occupations are Health Technologists (72.7%), Education Instruction & Library (72.1%), and Health Diagnosing & Treating (64.1%).
| Occupation | Male | Female |
| Management | 125 (51.9%) | 116 (48.1%) |
| Business & Financial | 15 (75.0%) | 5 (25.0%) |
| Computers, Engineering & Science | 0 (0.0%) | 0 (0.0%) |
| Computers & Mathematics | 0 (0.0%) | 0 (0.0%) |
| Architecture & Engineering | 0 (0.0%) | 0 (0.0%) |
| Life, Physical & Social Science | 0 (0.0%) | 0 (0.0%) |
| Community & Social Service | 33 (42.9%) | 44 (57.1%) |
| Education, Arts & Media | 16 (100.0%) | 0 (0.0%) |
| Legal Services & Support | 0 (0.0%) | 0 (0.0%) |
| Education Instruction & Library | 17 (27.9%) | 44 (72.1%) |
| Arts, Media & Entertainment | 0 (0.0%) | 0 (0.0%) |
| Health Diagnosing & Treating | 33 (35.9%) | 59 (64.1%) |
| Health Technologists | 15 (27.3%) | 40 (72.7%) |
| Total (Category) | 206 (47.9%) | 224 (52.1%) |
| Total (Overall) | 556 (49.8%) | 560 (50.2%) |
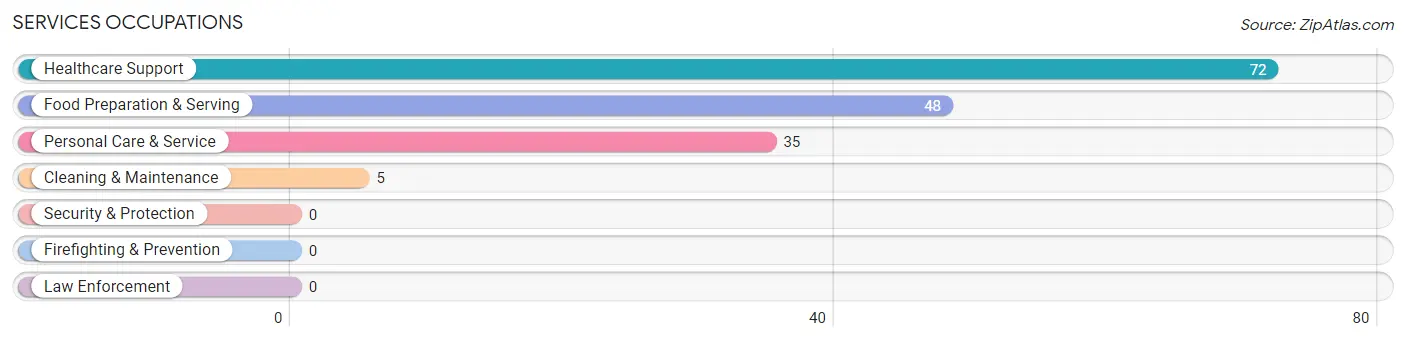
Services Occupations
The most common Services occupations in Seymour are Healthcare Support (72 | 6.5%), Food Preparation & Serving (48 | 4.3%), Personal Care & Service (35 | 3.1%), and Cleaning & Maintenance (5 | 0.4%).
Services Occupations by Sex
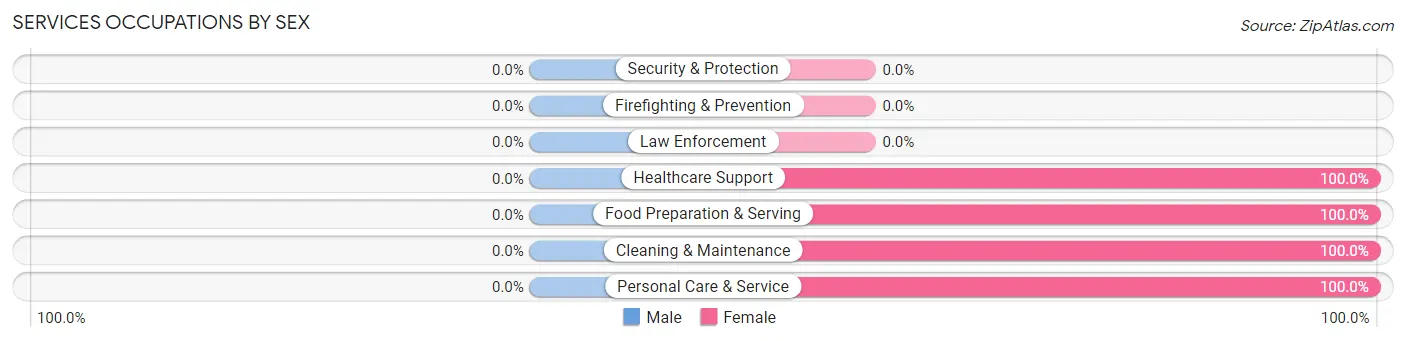
| Occupation | Male | Female |
| Healthcare Support | 0 (0.0%) | 72 (100.0%) |
| Security & Protection | 0 (0.0%) | 0 (0.0%) |
| Firefighting & Prevention | 0 (0.0%) | 0 (0.0%) |
| Law Enforcement | 0 (0.0%) | 0 (0.0%) |
| Food Preparation & Serving | 0 (0.0%) | 48 (100.0%) |
| Cleaning & Maintenance | 0 (0.0%) | 5 (100.0%) |
| Personal Care & Service | 0 (0.0%) | 35 (100.0%) |
| Total (Category) | 0 (0.0%) | 160 (100.0%) |
| Total (Overall) | 556 (49.8%) | 560 (50.2%) |
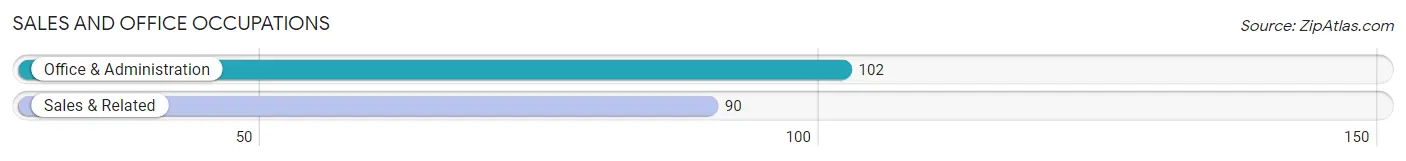
Sales and Office Occupations
The most common Sales and Office occupations in Seymour are Office & Administration (102 | 9.1%), and Sales & Related (90 | 8.1%).
Sales and Office Occupations by Sex
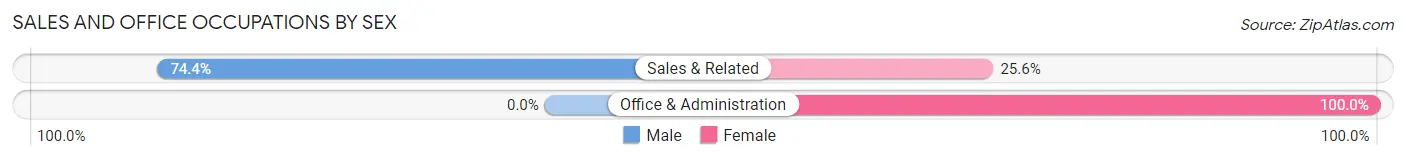
| Occupation | Male | Female |
| Sales & Related | 67 (74.4%) | 23 (25.6%) |
| Office & Administration | 0 (0.0%) | 102 (100.0%) |
| Total (Category) | 67 (34.9%) | 125 (65.1%) |
| Total (Overall) | 556 (49.8%) | 560 (50.2%) |
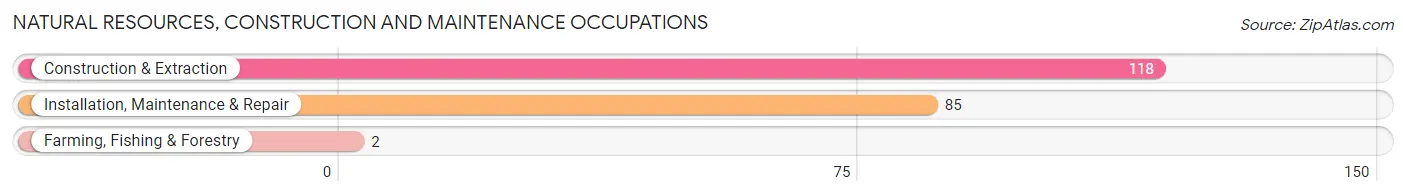
Natural Resources, Construction and Maintenance Occupations
The most common Natural Resources, Construction and Maintenance occupations in Seymour are Construction & Extraction (118 | 10.6%), Installation, Maintenance & Repair (85 | 7.6%), and Farming, Fishing & Forestry (2 | 0.2%).
Natural Resources, Construction and Maintenance Occupations by Sex
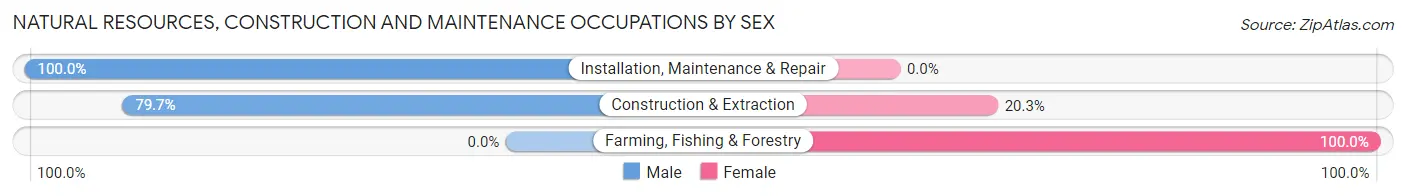
| Occupation | Male | Female |
| Farming, Fishing & Forestry | 0 (0.0%) | 2 (100.0%) |
| Construction & Extraction | 94 (79.7%) | 24 (20.3%) |
| Installation, Maintenance & Repair | 85 (100.0%) | 0 (0.0%) |
| Total (Category) | 179 (87.3%) | 26 (12.7%) |
| Total (Overall) | 556 (49.8%) | 560 (50.2%) |
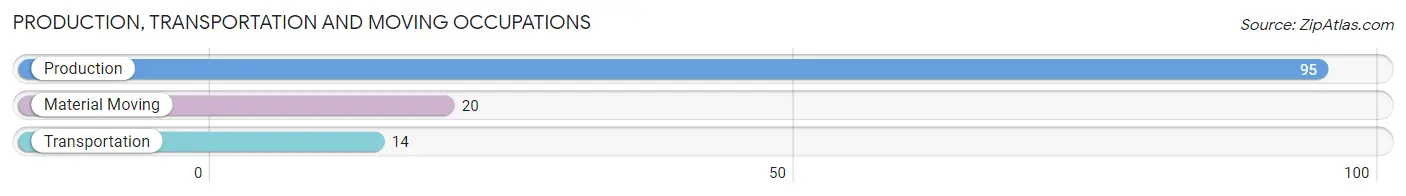
Production, Transportation and Moving Occupations
The most common Production, Transportation and Moving occupations in Seymour are Production (95 | 8.5%), Material Moving (20 | 1.8%), and Transportation (14 | 1.3%).
Production, Transportation and Moving Occupations by Sex
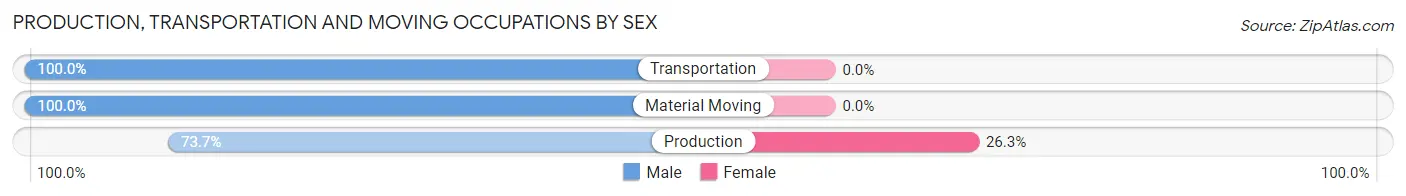
| Occupation | Male | Female |
| Production | 70 (73.7%) | 25 (26.3%) |
| Transportation | 14 (100.0%) | 0 (0.0%) |
| Material Moving | 20 (100.0%) | 0 (0.0%) |
| Total (Category) | 104 (80.6%) | 25 (19.4%) |
| Total (Overall) | 556 (49.8%) | 560 (50.2%) |
Employment Industries by Sex in Seymour
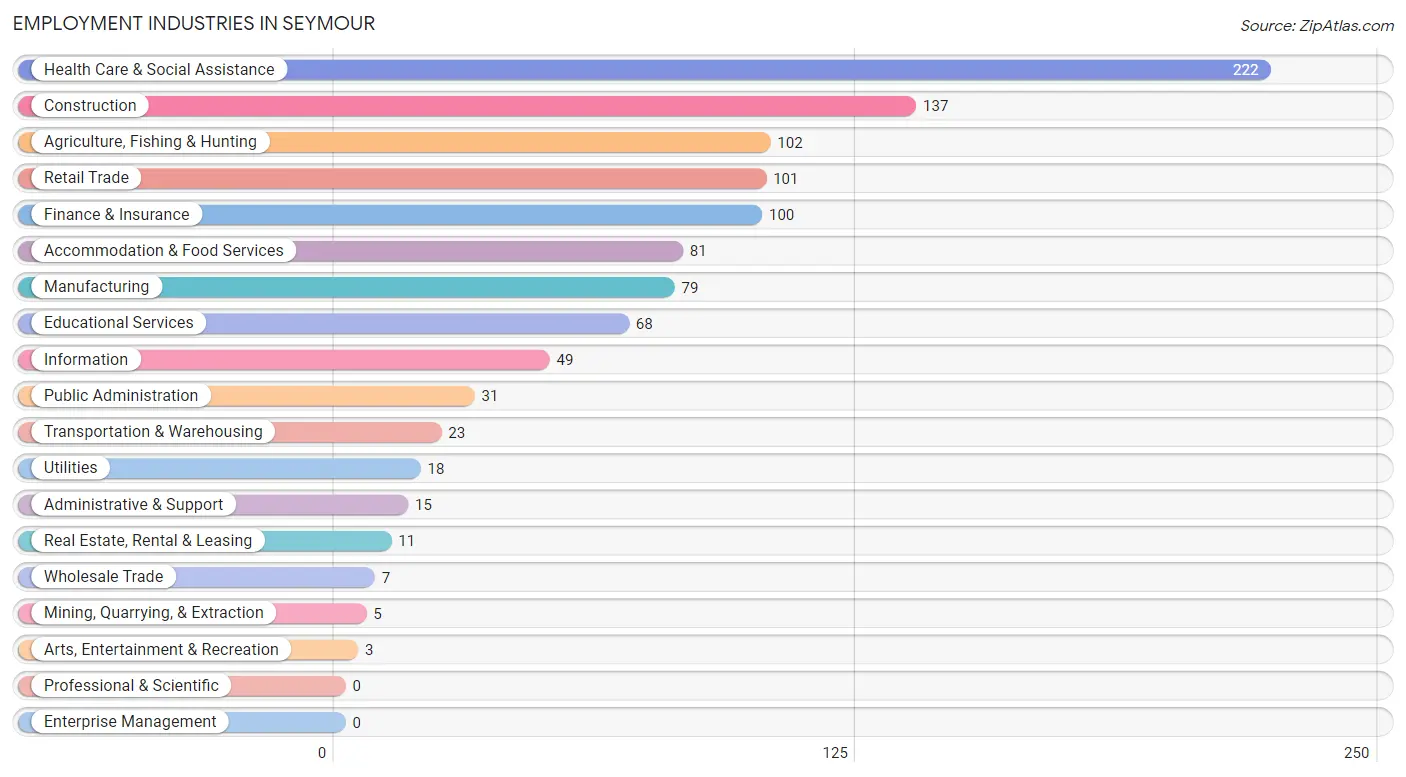
Employment Industries in Seymour
The major employment industries in Seymour include Health Care & Social Assistance (222 | 19.9%), Construction (137 | 12.3%), Agriculture, Fishing & Hunting (102 | 9.1%), Retail Trade (101 | 9.0%), and Finance & Insurance (100 | 9.0%).
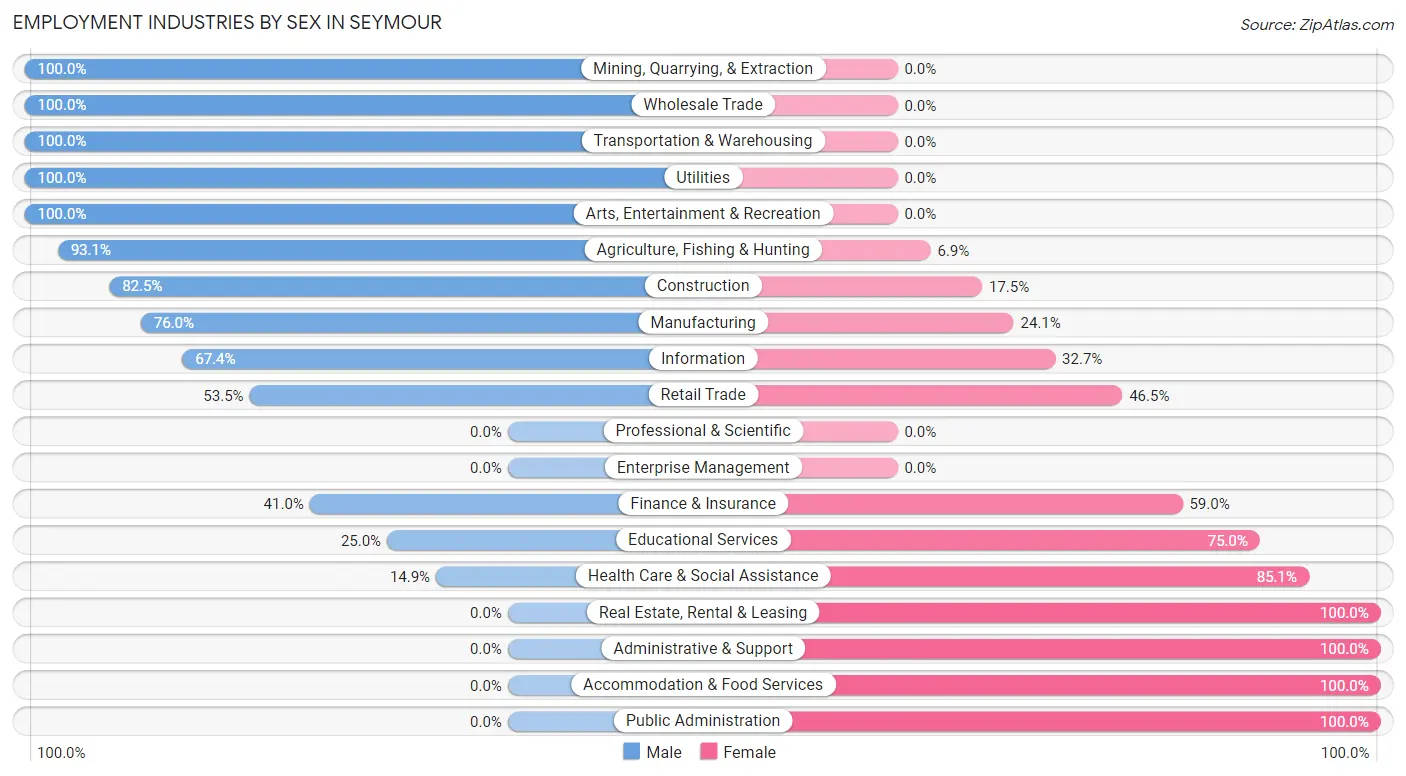
Employment Industries by Sex in Seymour
The Seymour industries that see more men than women are Mining, Quarrying, & Extraction (100.0%), Wholesale Trade (100.0%), and Transportation & Warehousing (100.0%), whereas the industries that tend to have a higher number of women are Real Estate, Rental & Leasing (100.0%), Administrative & Support (100.0%), and Accommodation & Food Services (100.0%).
| Industry | Male | Female |
| Agriculture, Fishing & Hunting | 95 (93.1%) | 7 (6.9%) |
| Mining, Quarrying, & Extraction | 5 (100.0%) | 0 (0.0%) |
| Construction | 113 (82.5%) | 24 (17.5%) |
| Manufacturing | 60 (75.9%) | 19 (24.0%) |
| Wholesale Trade | 7 (100.0%) | 0 (0.0%) |
| Retail Trade | 54 (53.5%) | 47 (46.5%) |
| Transportation & Warehousing | 23 (100.0%) | 0 (0.0%) |
| Utilities | 18 (100.0%) | 0 (0.0%) |
| Information | 33 (67.3%) | 16 (32.7%) |
| Finance & Insurance | 41 (41.0%) | 59 (59.0%) |
| Real Estate, Rental & Leasing | 0 (0.0%) | 11 (100.0%) |
| Professional & Scientific | 0 (0.0%) | 0 (0.0%) |
| Enterprise Management | 0 (0.0%) | 0 (0.0%) |
| Administrative & Support | 0 (0.0%) | 15 (100.0%) |
| Educational Services | 17 (25.0%) | 51 (75.0%) |
| Health Care & Social Assistance | 33 (14.9%) | 189 (85.1%) |
| Arts, Entertainment & Recreation | 3 (100.0%) | 0 (0.0%) |
| Accommodation & Food Services | 0 (0.0%) | 81 (100.0%) |
| Public Administration | 0 (0.0%) | 31 (100.0%) |
| Total | 556 (49.8%) | 560 (50.2%) |
Education in Seymour
School Enrollment in Seymour
The most common levels of schooling among the 628 students in Seymour are middle school (243 | 38.7%), elementary school (187 | 29.8%), and high school (138 | 22.0%).
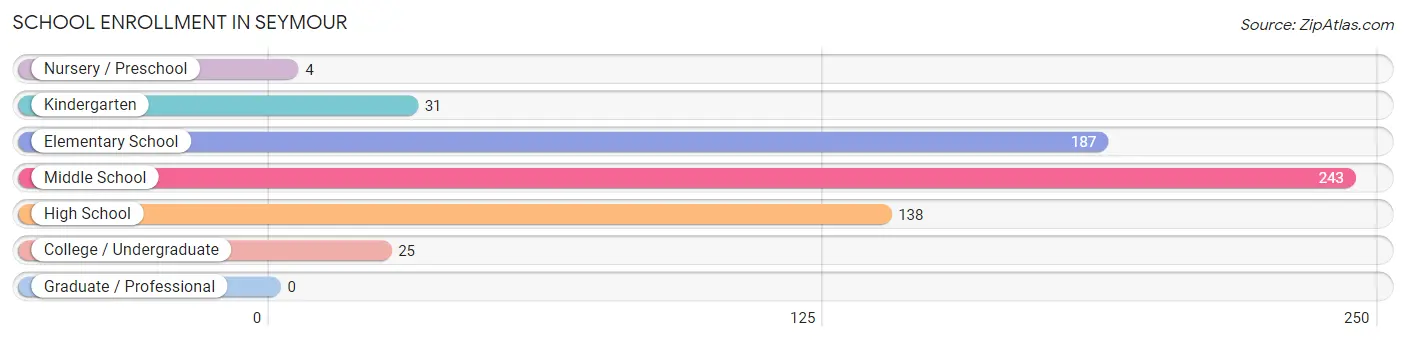
| School Level | # Students | % Students |
| Nursery / Preschool | 4 | 0.6% |
| Kindergarten | 31 | 4.9% |
| Elementary School | 187 | 29.8% |
| Middle School | 243 | 38.7% |
| High School | 138 | 22.0% |
| College / Undergraduate | 25 | 4.0% |
| Graduate / Professional | 0 | 0.0% |
| Total | 628 | 100.0% |
School Enrollment by Age by Funding Source in Seymour
Out of a total of 628 students who are enrolled in schools in Seymour, 47 (7.5%) attend a private institution, while the remaining 581 (92.5%) are enrolled in public schools. The age group of 5 to 9 year old has the highest likelihood of being enrolled in private schools, with 30 (15.0% in the age bracket) enrolled. Conversely, the age group of 3 to 4 year olds has the lowest likelihood of being enrolled in a private school, with 4 (100.0% in the age bracket) attending a public institution.
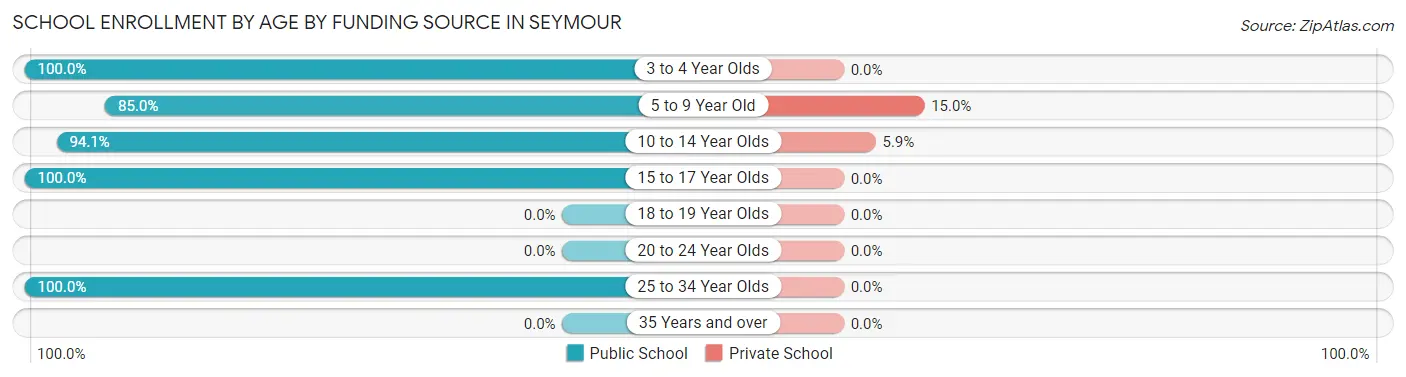
| Age Bracket | Public School | Private School |
| 3 to 4 Year Olds | 4 (100.0%) | 0 (0.0%) |
| 5 to 9 Year Old | 170 (85.0%) | 30 (15.0%) |
| 10 to 14 Year Olds | 269 (94.1%) | 17 (5.9%) |
| 15 to 17 Year Olds | 113 (100.0%) | 0 (0.0%) |
| 18 to 19 Year Olds | 0 (0.0%) | 0 (0.0%) |
| 20 to 24 Year Olds | 0 (0.0%) | 0 (0.0%) |
| 25 to 34 Year Olds | 25 (100.0%) | 0 (0.0%) |
| 35 Years and over | 0 (0.0%) | 0 (0.0%) |
| Total | 581 (92.5%) | 47 (7.5%) |
Educational Attainment by Field of Study in Seymour
Visual & performing arts (73 | 19.5%), business (70 | 18.7%), science & technology (57 | 15.2%), education (47 | 12.5%), and liberal arts & history (37 | 9.9%) are the most common fields of study among 375 individuals in Seymour who have obtained a bachelor's degree or higher.
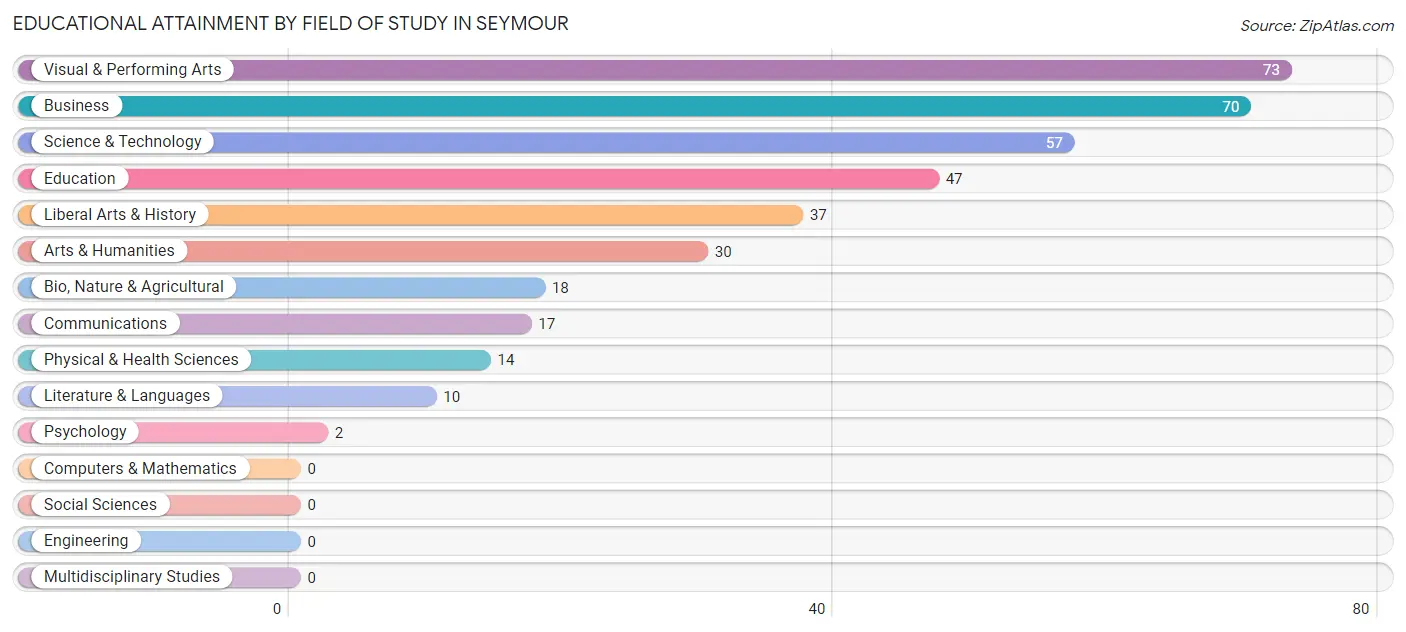
| Field of Study | # Graduates | % Graduates |
| Computers & Mathematics | 0 | 0.0% |
| Bio, Nature & Agricultural | 18 | 4.8% |
| Physical & Health Sciences | 14 | 3.7% |
| Psychology | 2 | 0.5% |
| Social Sciences | 0 | 0.0% |
| Engineering | 0 | 0.0% |
| Multidisciplinary Studies | 0 | 0.0% |
| Science & Technology | 57 | 15.2% |
| Business | 70 | 18.7% |
| Education | 47 | 12.5% |
| Literature & Languages | 10 | 2.7% |
| Liberal Arts & History | 37 | 9.9% |
| Visual & Performing Arts | 73 | 19.5% |
| Communications | 17 | 4.5% |
| Arts & Humanities | 30 | 8.0% |
| Total | 375 | 100.0% |
Transportation & Commute in Seymour
Vehicle Availability by Sex in Seymour
The most prevalent vehicle ownership categories in Seymour are males with 2 vehicles (211, accounting for 39.7%) and females with 2 vehicles (240, making up 37.7%).
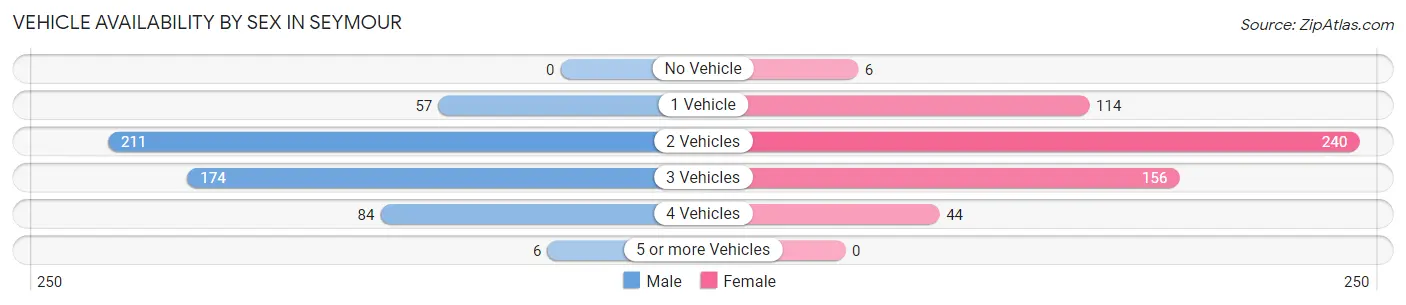
| Vehicles Available | Male | Female |
| No Vehicle | 0 (0.0%) | 6 (1.1%) |
| 1 Vehicle | 57 (10.7%) | 114 (20.4%) |
| 2 Vehicles | 211 (39.7%) | 240 (42.9%) |
| 3 Vehicles | 174 (32.7%) | 156 (27.9%) |
| 4 Vehicles | 84 (15.8%) | 44 (7.9%) |
| 5 or more Vehicles | 6 (1.1%) | 0 (0.0%) |
| Total | 532 (100.0%) | 560 (100.0%) |
Commute Time in Seymour
The most frequently occuring commute durations in Seymour are 5 to 9 minutes (408 commuters, 37.9%), less than 5 minutes (232 commuters, 21.6%), and 30 to 34 minutes (114 commuters, 10.6%).
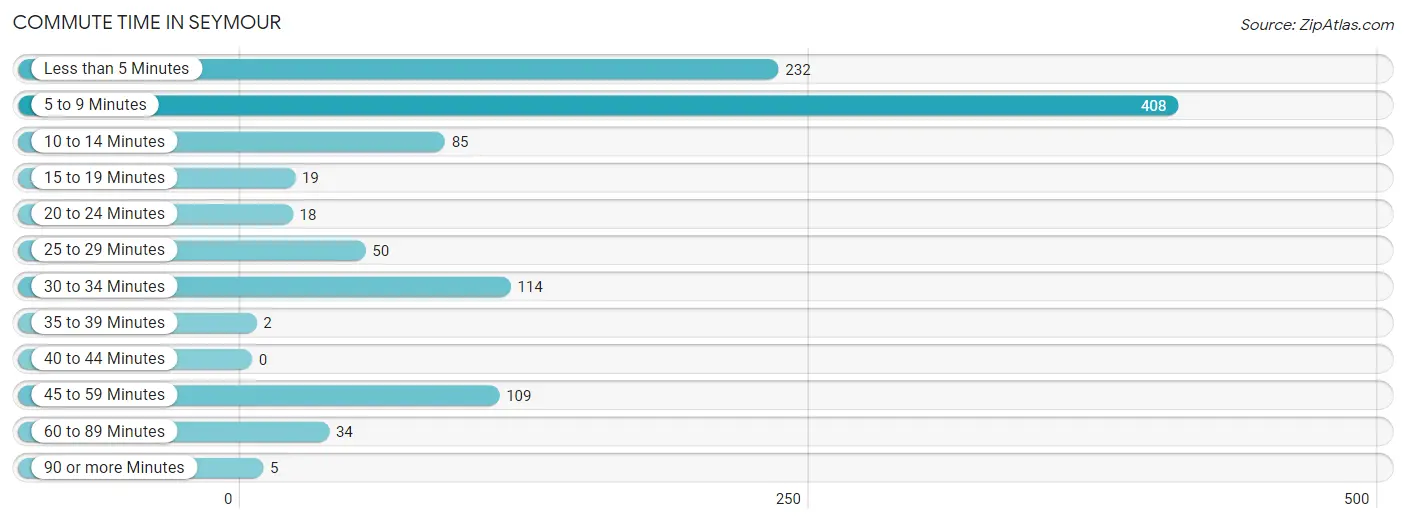
| Commute Time | # Commuters | % Commuters |
| Less than 5 Minutes | 232 | 21.6% |
| 5 to 9 Minutes | 408 | 37.9% |
| 10 to 14 Minutes | 85 | 7.9% |
| 15 to 19 Minutes | 19 | 1.8% |
| 20 to 24 Minutes | 18 | 1.7% |
| 25 to 29 Minutes | 50 | 4.6% |
| 30 to 34 Minutes | 114 | 10.6% |
| 35 to 39 Minutes | 2 | 0.2% |
| 40 to 44 Minutes | 0 | 0.0% |
| 45 to 59 Minutes | 109 | 10.1% |
| 60 to 89 Minutes | 34 | 3.2% |
| 90 or more Minutes | 5 | 0.5% |
Commute Time by Sex in Seymour
The most common commute times in Seymour are 5 to 9 minutes (228 commuters, 43.2%) for males and 5 to 9 minutes (180 commuters, 32.9%) for females.
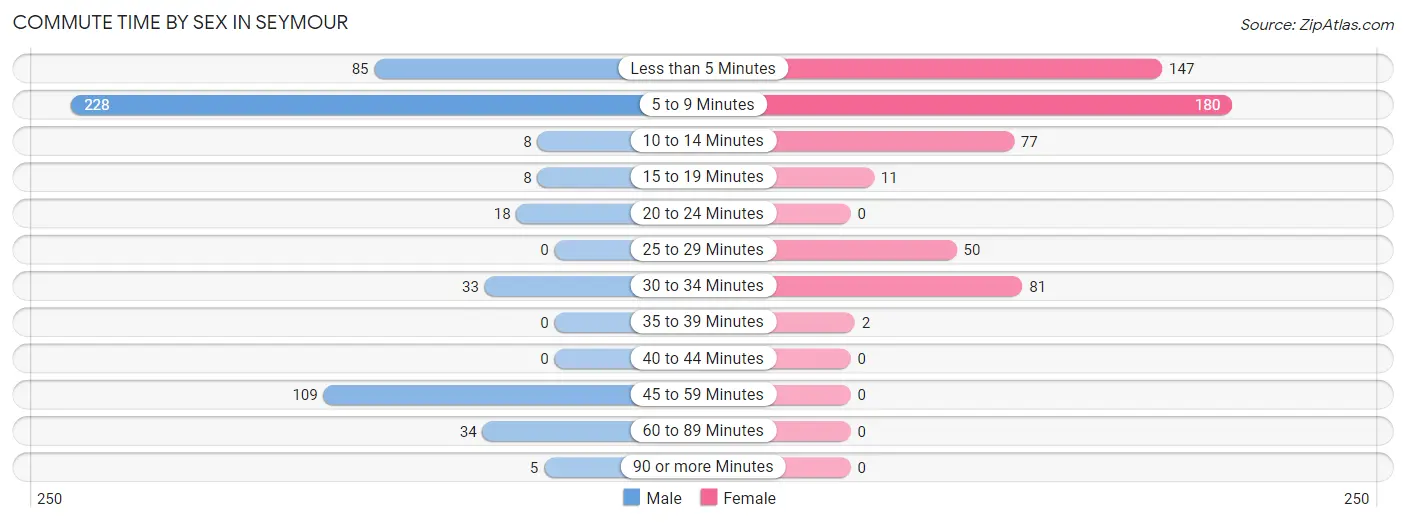
| Commute Time | Male | Female |
| Less than 5 Minutes | 85 (16.1%) | 147 (26.8%) |
| 5 to 9 Minutes | 228 (43.2%) | 180 (32.9%) |
| 10 to 14 Minutes | 8 (1.5%) | 77 (14.1%) |
| 15 to 19 Minutes | 8 (1.5%) | 11 (2.0%) |
| 20 to 24 Minutes | 18 (3.4%) | 0 (0.0%) |
| 25 to 29 Minutes | 0 (0.0%) | 50 (9.1%) |
| 30 to 34 Minutes | 33 (6.2%) | 81 (14.8%) |
| 35 to 39 Minutes | 0 (0.0%) | 2 (0.4%) |
| 40 to 44 Minutes | 0 (0.0%) | 0 (0.0%) |
| 45 to 59 Minutes | 109 (20.6%) | 0 (0.0%) |
| 60 to 89 Minutes | 34 (6.4%) | 0 (0.0%) |
| 90 or more Minutes | 5 (0.9%) | 0 (0.0%) |
Time of Departure to Work by Sex in Seymour
The most frequent times of departure to work in Seymour are 7:30 AM to 7:59 AM (135, 25.6%) for males and 7:30 AM to 7:59 AM (204, 37.2%) for females.
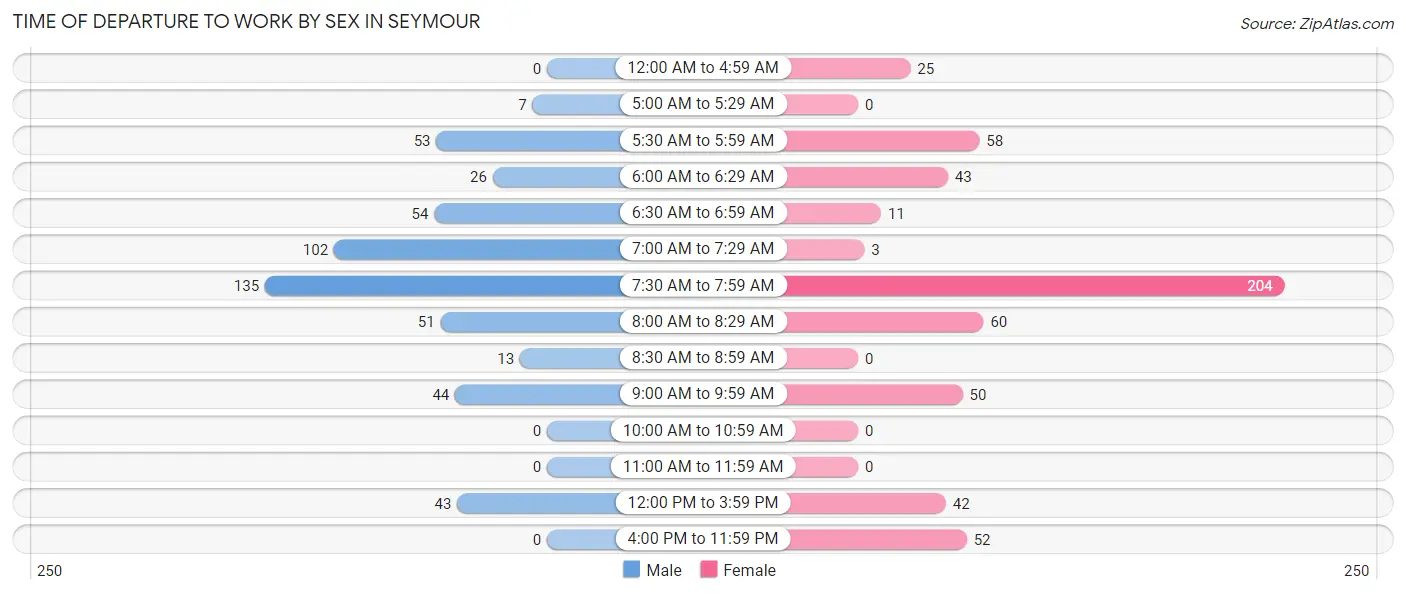
| Time of Departure | Male | Female |
| 12:00 AM to 4:59 AM | 0 (0.0%) | 25 (4.6%) |
| 5:00 AM to 5:29 AM | 7 (1.3%) | 0 (0.0%) |
| 5:30 AM to 5:59 AM | 53 (10.0%) | 58 (10.6%) |
| 6:00 AM to 6:29 AM | 26 (4.9%) | 43 (7.9%) |
| 6:30 AM to 6:59 AM | 54 (10.2%) | 11 (2.0%) |
| 7:00 AM to 7:29 AM | 102 (19.3%) | 3 (0.5%) |
| 7:30 AM to 7:59 AM | 135 (25.6%) | 204 (37.2%) |
| 8:00 AM to 8:29 AM | 51 (9.7%) | 60 (11.0%) |
| 8:30 AM to 8:59 AM | 13 (2.5%) | 0 (0.0%) |
| 9:00 AM to 9:59 AM | 44 (8.3%) | 50 (9.1%) |
| 10:00 AM to 10:59 AM | 0 (0.0%) | 0 (0.0%) |
| 11:00 AM to 11:59 AM | 0 (0.0%) | 0 (0.0%) |
| 12:00 PM to 3:59 PM | 43 (8.1%) | 42 (7.7%) |
| 4:00 PM to 11:59 PM | 0 (0.0%) | 52 (9.5%) |
| Total | 528 (100.0%) | 548 (100.0%) |
Housing Occupancy in Seymour
Occupancy by Ownership in Seymour
Of the total 1,144 dwellings in Seymour, owner-occupied units account for 786 (68.7%), while renter-occupied units make up 358 (31.3%).
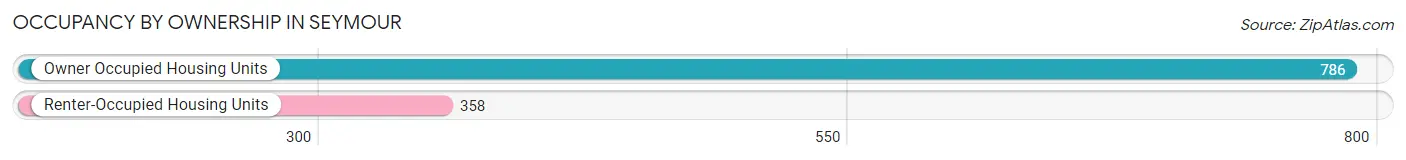
| Occupancy | # Housing Units | % Housing Units |
| Owner Occupied Housing Units | 786 | 68.7% |
| Renter-Occupied Housing Units | 358 | 31.3% |
| Total Occupied Housing Units | 1,144 | 100.0% |
Occupancy by Household Size in Seymour
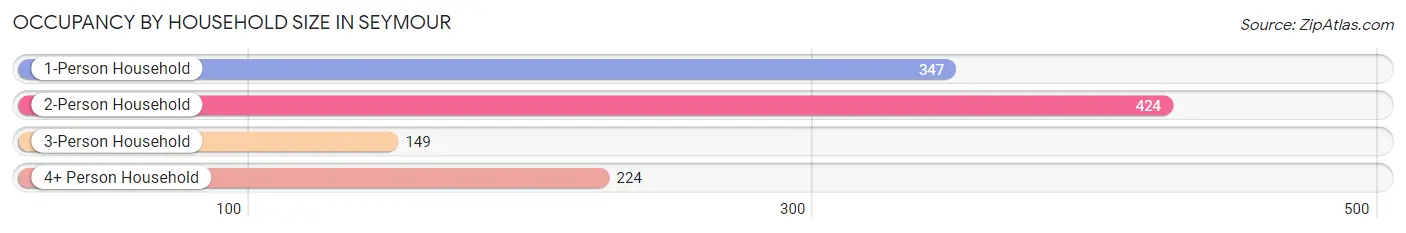
| Household Size | # Housing Units | % Housing Units |
| 1-Person Household | 347 | 30.3% |
| 2-Person Household | 424 | 37.1% |
| 3-Person Household | 149 | 13.0% |
| 4+ Person Household | 224 | 19.6% |
| Total Housing Units | 1,144 | 100.0% |
Occupancy by Ownership by Household Size in Seymour
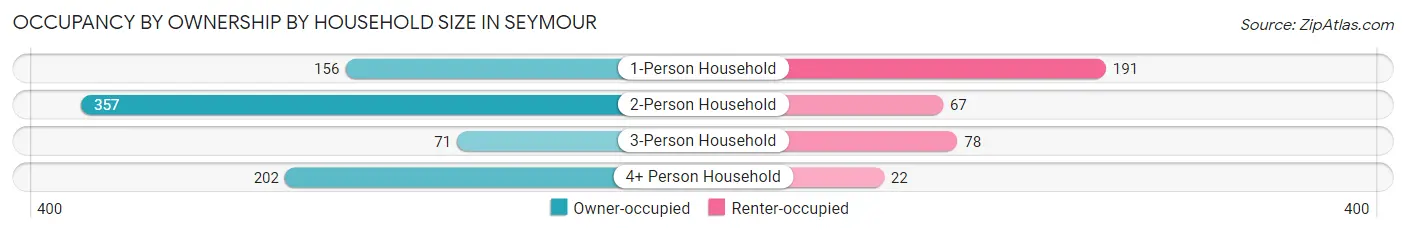
| Household Size | Owner-occupied | Renter-occupied |
| 1-Person Household | 156 (45.0%) | 191 (55.0%) |
| 2-Person Household | 357 (84.2%) | 67 (15.8%) |
| 3-Person Household | 71 (47.6%) | 78 (52.3%) |
| 4+ Person Household | 202 (90.2%) | 22 (9.8%) |
| Total Housing Units | 786 (68.7%) | 358 (31.3%) |
Occupancy by Educational Attainment in Seymour
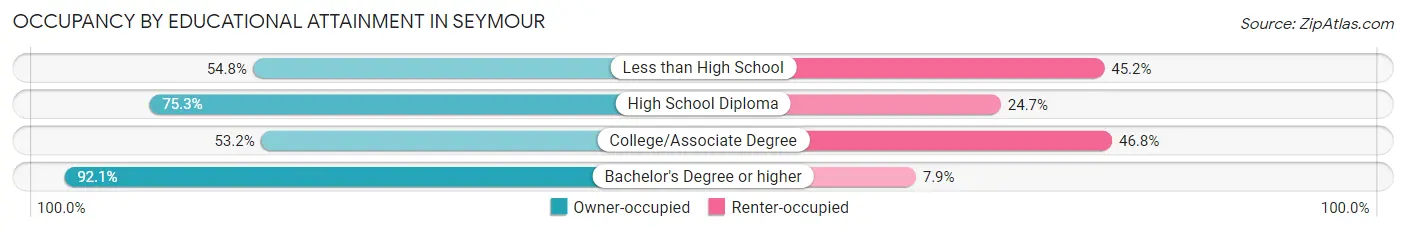
| Household Size | Owner-occupied | Renter-occupied |
| Less than High School | 109 (54.8%) | 90 (45.2%) |
| High School Diploma | 408 (75.3%) | 134 (24.7%) |
| College/Associate Degree | 140 (53.2%) | 123 (46.8%) |
| Bachelor's Degree or higher | 129 (92.1%) | 11 (7.9%) |
Occupancy by Age of Householder in Seymour
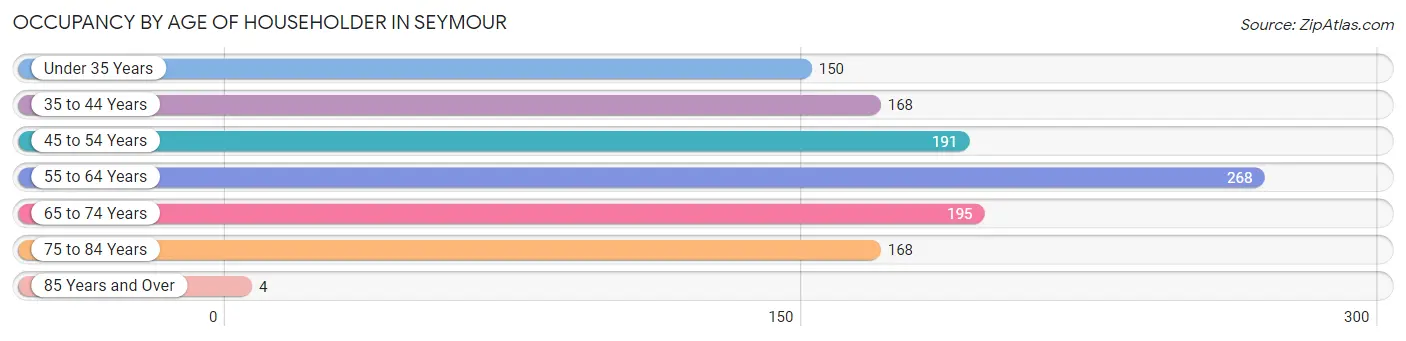
| Age Bracket | # Households | % Households |
| Under 35 Years | 150 | 13.1% |
| 35 to 44 Years | 168 | 14.7% |
| 45 to 54 Years | 191 | 16.7% |
| 55 to 64 Years | 268 | 23.4% |
| 65 to 74 Years | 195 | 17.1% |
| 75 to 84 Years | 168 | 14.7% |
| 85 Years and Over | 4 | 0.4% |
| Total | 1,144 | 100.0% |
Housing Finances in Seymour
Median Income by Occupancy in Seymour
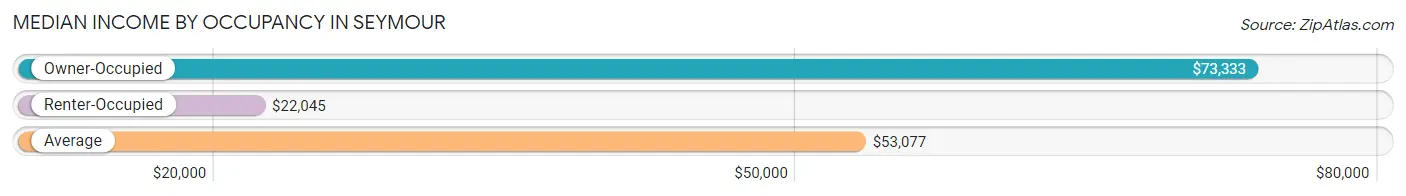
| Occupancy Type | # Households | Median Income |
| Owner-Occupied | 786 (68.7%) | $73,333 |
| Renter-Occupied | 358 (31.3%) | $22,045 |
| Average | 1,144 (100.0%) | $53,077 |
Occupancy by Householder Income Bracket in Seymour
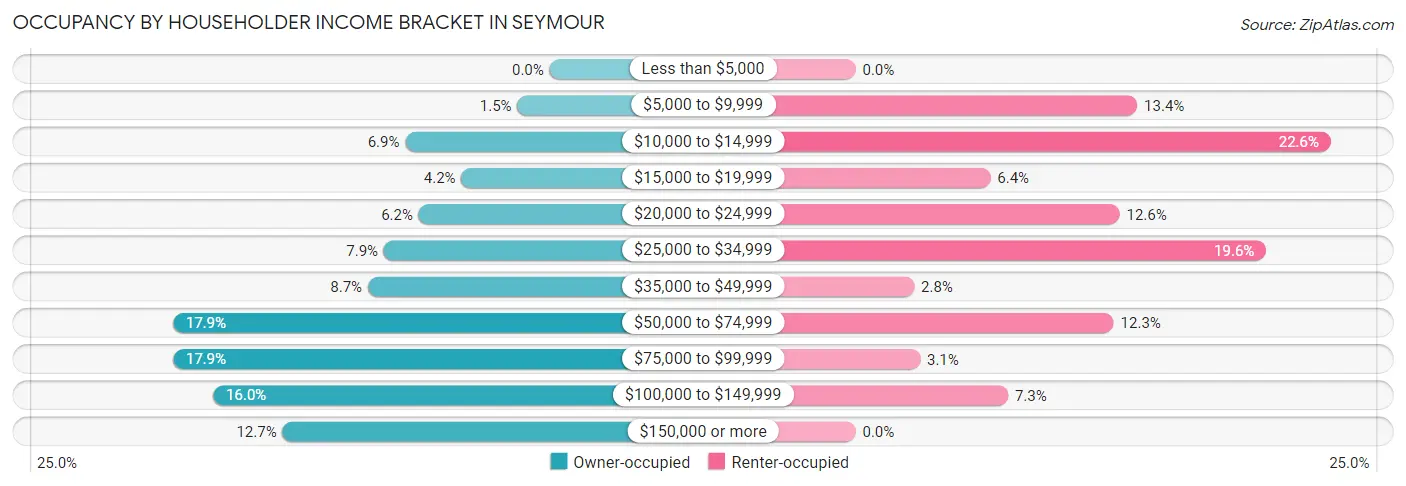
| Income Bracket | Owner-occupied | Renter-occupied |
| Less than $5,000 | 0 (0.0%) | 0 (0.0%) |
| $5,000 to $9,999 | 12 (1.5%) | 48 (13.4%) |
| $10,000 to $14,999 | 54 (6.9%) | 81 (22.6%) |
| $15,000 to $19,999 | 33 (4.2%) | 23 (6.4%) |
| $20,000 to $24,999 | 49 (6.2%) | 45 (12.6%) |
| $25,000 to $34,999 | 62 (7.9%) | 70 (19.6%) |
| $35,000 to $49,999 | 68 (8.6%) | 10 (2.8%) |
| $50,000 to $74,999 | 141 (17.9%) | 44 (12.3%) |
| $75,000 to $99,999 | 141 (17.9%) | 11 (3.1%) |
| $100,000 to $149,999 | 126 (16.0%) | 26 (7.3%) |
| $150,000 or more | 100 (12.7%) | 0 (0.0%) |
| Total | 786 (100.0%) | 358 (100.0%) |
Monthly Housing Cost Tiers in Seymour
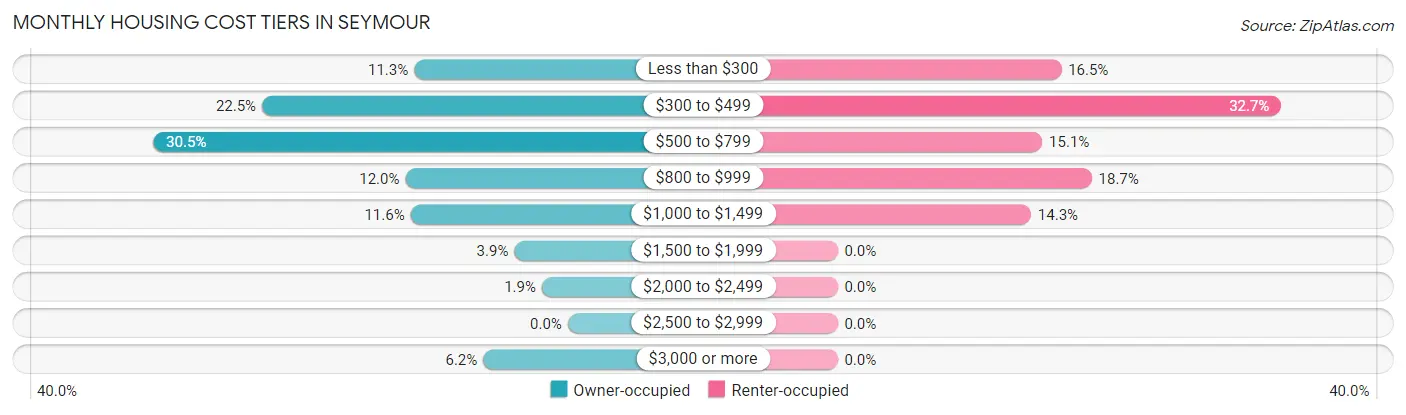
| Monthly Cost | Owner-occupied | Renter-occupied |
| Less than $300 | 89 (11.3%) | 59 (16.5%) |
| $300 to $499 | 177 (22.5%) | 117 (32.7%) |
| $500 to $799 | 240 (30.5%) | 54 (15.1%) |
| $800 to $999 | 94 (12.0%) | 67 (18.7%) |
| $1,000 to $1,499 | 91 (11.6%) | 51 (14.2%) |
| $1,500 to $1,999 | 31 (3.9%) | 0 (0.0%) |
| $2,000 to $2,499 | 15 (1.9%) | 0 (0.0%) |
| $2,500 to $2,999 | 0 (0.0%) | 0 (0.0%) |
| $3,000 or more | 49 (6.2%) | 0 (0.0%) |
| Total | 786 (100.0%) | 358 (100.0%) |
Physical Housing Characteristics in Seymour
Housing Structures in Seymour
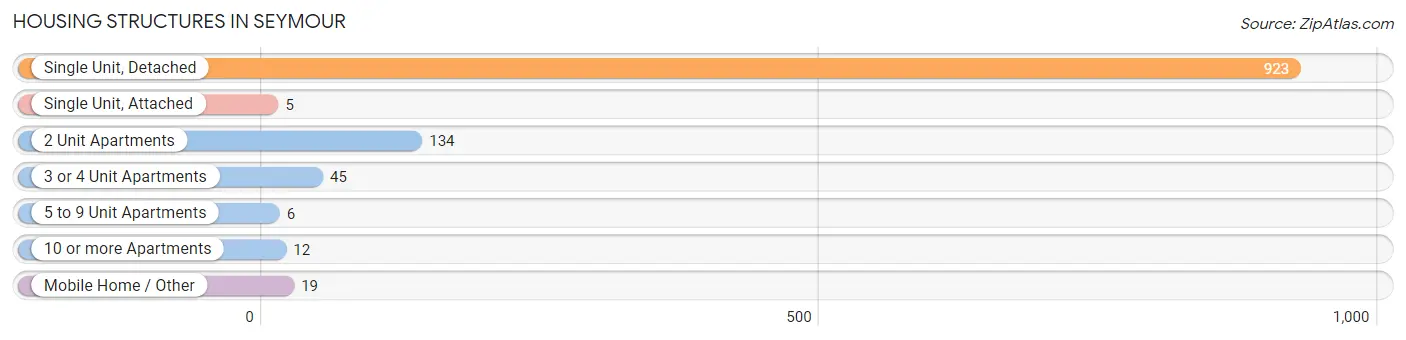
| Structure Type | # Housing Units | % Housing Units |
| Single Unit, Detached | 923 | 80.7% |
| Single Unit, Attached | 5 | 0.4% |
| 2 Unit Apartments | 134 | 11.7% |
| 3 or 4 Unit Apartments | 45 | 3.9% |
| 5 to 9 Unit Apartments | 6 | 0.5% |
| 10 or more Apartments | 12 | 1.1% |
| Mobile Home / Other | 19 | 1.7% |
| Total | 1,144 | 100.0% |
Housing Structures by Occupancy in Seymour
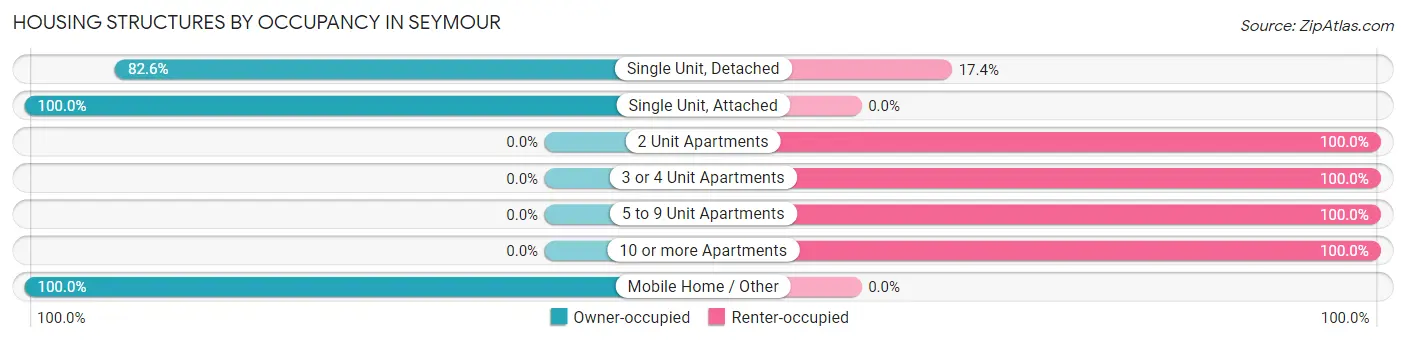
| Structure Type | Owner-occupied | Renter-occupied |
| Single Unit, Detached | 762 (82.6%) | 161 (17.4%) |
| Single Unit, Attached | 5 (100.0%) | 0 (0.0%) |
| 2 Unit Apartments | 0 (0.0%) | 134 (100.0%) |
| 3 or 4 Unit Apartments | 0 (0.0%) | 45 (100.0%) |
| 5 to 9 Unit Apartments | 0 (0.0%) | 6 (100.0%) |
| 10 or more Apartments | 0 (0.0%) | 12 (100.0%) |
| Mobile Home / Other | 19 (100.0%) | 0 (0.0%) |
| Total | 786 (68.7%) | 358 (31.3%) |
Housing Structures by Number of Rooms in Seymour
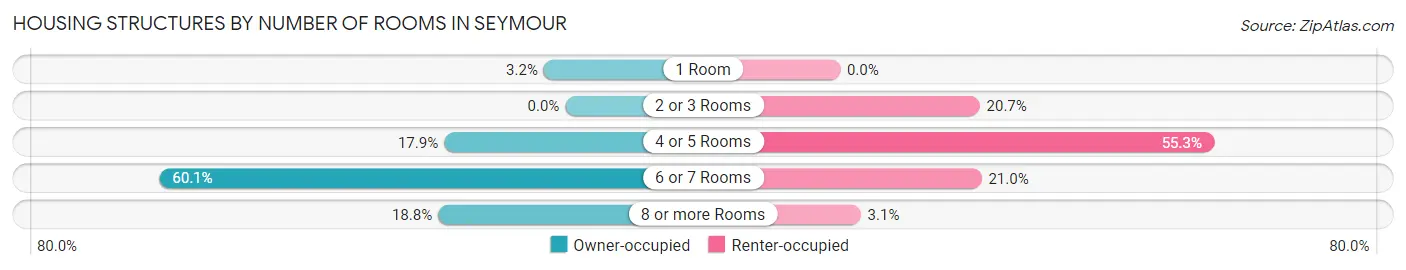
| Number of Rooms | Owner-occupied | Renter-occupied |
| 1 Room | 25 (3.2%) | 0 (0.0%) |
| 2 or 3 Rooms | 0 (0.0%) | 74 (20.7%) |
| 4 or 5 Rooms | 141 (17.9%) | 198 (55.3%) |
| 6 or 7 Rooms | 472 (60.1%) | 75 (20.9%) |
| 8 or more Rooms | 148 (18.8%) | 11 (3.1%) |
| Total | 786 (100.0%) | 358 (100.0%) |
Housing Structure by Heating Type in Seymour
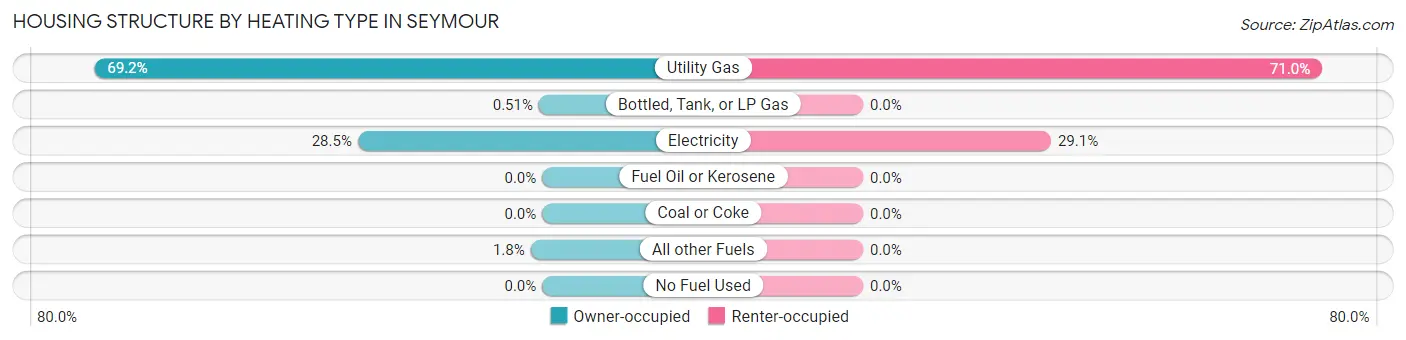
| Heating Type | Owner-occupied | Renter-occupied |
| Utility Gas | 544 (69.2%) | 254 (71.0%) |
| Bottled, Tank, or LP Gas | 4 (0.5%) | 0 (0.0%) |
| Electricity | 224 (28.5%) | 104 (29.0%) |
| Fuel Oil or Kerosene | 0 (0.0%) | 0 (0.0%) |
| Coal or Coke | 0 (0.0%) | 0 (0.0%) |
| All other Fuels | 14 (1.8%) | 0 (0.0%) |
| No Fuel Used | 0 (0.0%) | 0 (0.0%) |
| Total | 786 (100.0%) | 358 (100.0%) |
Household Vehicle Usage in Seymour
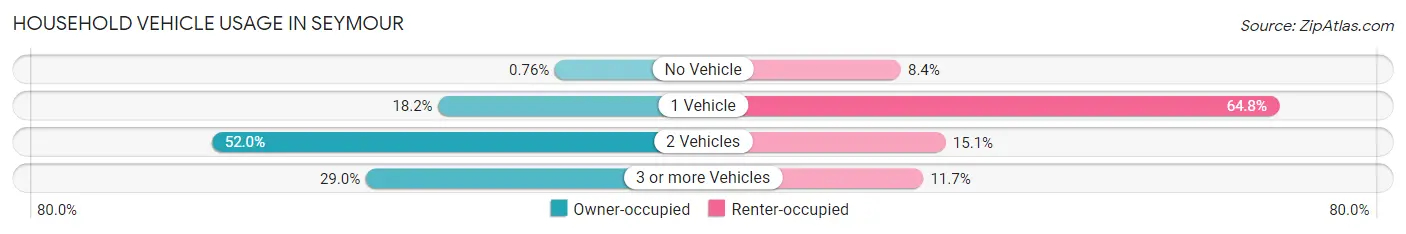
| Vehicles per Household | Owner-occupied | Renter-occupied |
| No Vehicle | 6 (0.8%) | 30 (8.4%) |
| 1 Vehicle | 143 (18.2%) | 232 (64.8%) |
| 2 Vehicles | 409 (52.0%) | 54 (15.1%) |
| 3 or more Vehicles | 228 (29.0%) | 42 (11.7%) |
| Total | 786 (100.0%) | 358 (100.0%) |
Real Estate & Mortgages in Seymour
Real Estate and Mortgage Overview in Seymour
| Characteristic | Without Mortgage | With Mortgage |
| Housing Units | 610 | 176 |
| Median Property Value | $83,500 | $240,300 |
| Median Household Income | $59,000 | $33 |
| Monthly Housing Costs | $530 | $49 |
| Real Estate Taxes | $1,233 | $6 |
Property Value by Mortgage Status in Seymour
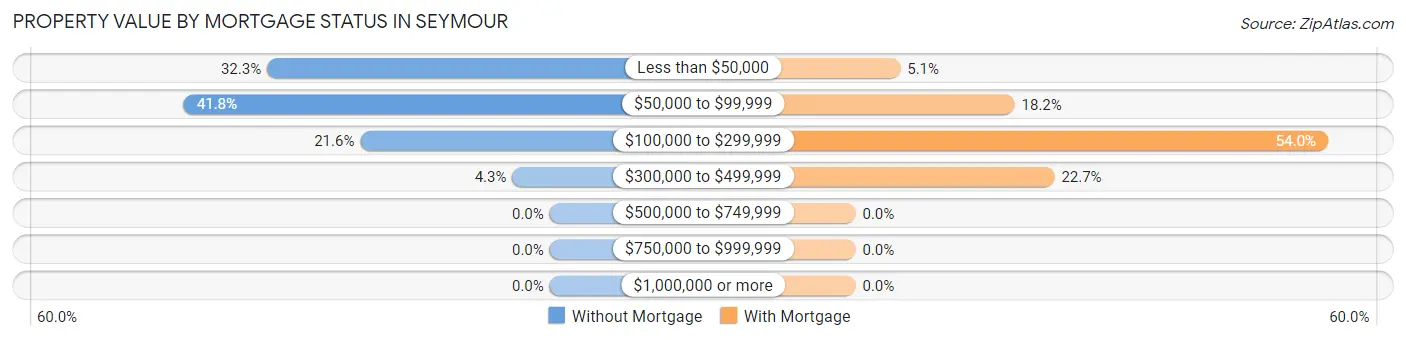
| Property Value | Without Mortgage | With Mortgage |
| Less than $50,000 | 197 (32.3%) | 9 (5.1%) |
| $50,000 to $99,999 | 255 (41.8%) | 32 (18.2%) |
| $100,000 to $299,999 | 132 (21.6%) | 95 (54.0%) |
| $300,000 to $499,999 | 26 (4.3%) | 40 (22.7%) |
| $500,000 to $749,999 | 0 (0.0%) | 0 (0.0%) |
| $750,000 to $999,999 | 0 (0.0%) | 0 (0.0%) |
| $1,000,000 or more | 0 (0.0%) | 0 (0.0%) |
| Total | 610 (100.0%) | 176 (100.0%) |
Household Income by Mortgage Status in Seymour
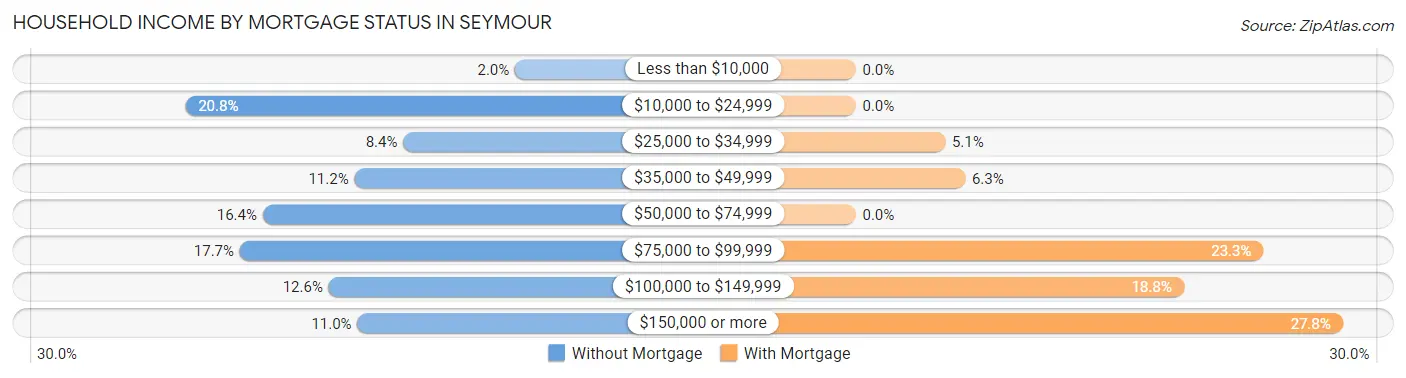
| Household Income | Without Mortgage | With Mortgage |
| Less than $10,000 | 12 (2.0%) | 0 (0.0%) |
| $10,000 to $24,999 | 127 (20.8%) | 0 (0.0%) |
| $25,000 to $34,999 | 51 (8.4%) | 9 (5.1%) |
| $35,000 to $49,999 | 68 (11.2%) | 11 (6.2%) |
| $50,000 to $74,999 | 100 (16.4%) | 0 (0.0%) |
| $75,000 to $99,999 | 108 (17.7%) | 41 (23.3%) |
| $100,000 to $149,999 | 77 (12.6%) | 33 (18.8%) |
| $150,000 or more | 67 (11.0%) | 49 (27.8%) |
| Total | 610 (100.0%) | 176 (100.0%) |
Property Value to Household Income Ratio in Seymour
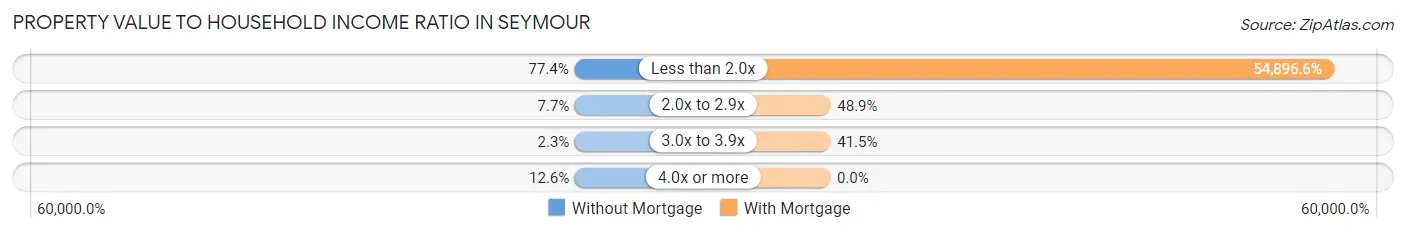
| Value-to-Income Ratio | Without Mortgage | With Mortgage |
| Less than 2.0x | 472 (77.4%) | 96,618 (54,896.6%) |
| 2.0x to 2.9x | 47 (7.7%) | 86 (48.9%) |
| 3.0x to 3.9x | 14 (2.3%) | 73 (41.5%) |
| 4.0x or more | 77 (12.6%) | 0 (0.0%) |
| Total | 610 (100.0%) | 176 (100.0%) |
Real Estate Taxes by Mortgage Status in Seymour
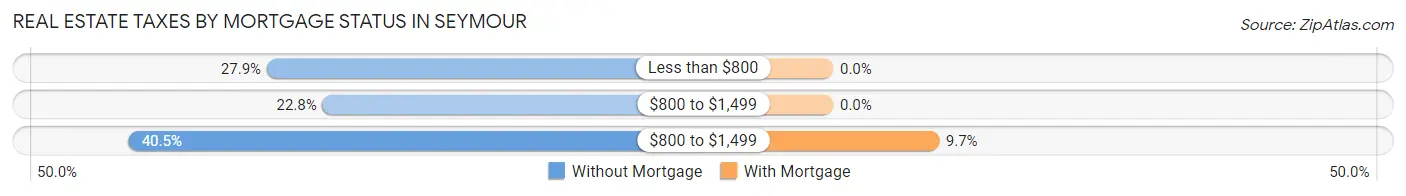
| Property Taxes | Without Mortgage | With Mortgage |
| Less than $800 | 170 (27.9%) | 0 (0.0%) |
| $800 to $1,499 | 139 (22.8%) | 0 (0.0%) |
| $800 to $1,499 | 247 (40.5%) | 17 (9.7%) |
| Total | 610 (100.0%) | 176 (100.0%) |
Health & Disability in Seymour
Health Insurance Coverage by Age in Seymour
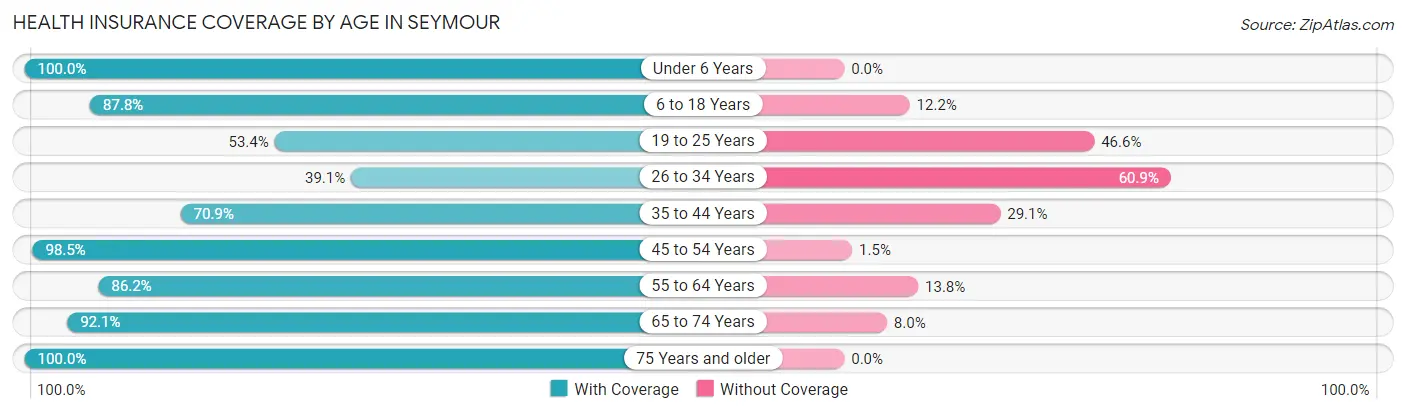
| Age Bracket | With Coverage | Without Coverage |
| Under 6 Years | 113 (100.0%) | 0 (0.0%) |
| 6 to 18 Years | 533 (87.8%) | 74 (12.2%) |
| 19 to 25 Years | 63 (53.4%) | 55 (46.6%) |
| 26 to 34 Years | 45 (39.1%) | 70 (60.9%) |
| 35 to 44 Years | 273 (70.9%) | 112 (29.1%) |
| 45 to 54 Years | 269 (98.5%) | 4 (1.5%) |
| 55 to 64 Years | 451 (86.2%) | 72 (13.8%) |
| 65 to 74 Years | 278 (92.0%) | 24 (8.0%) |
| 75 Years and older | 271 (100.0%) | 0 (0.0%) |
| Total | 2,296 (84.8%) | 411 (15.2%) |
Health Insurance Coverage by Citizenship Status in Seymour
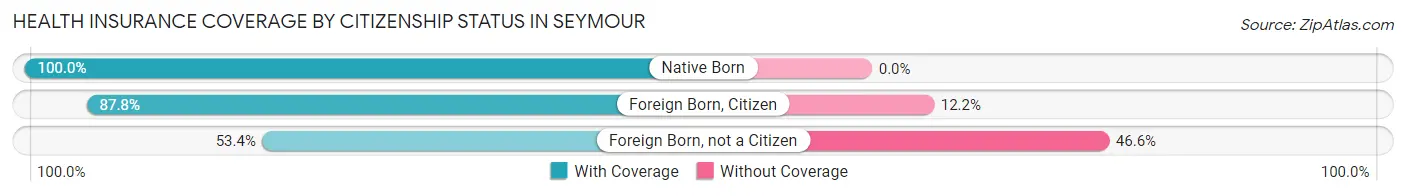
| Citizenship Status | With Coverage | Without Coverage |
| Native Born | 113 (100.0%) | 0 (0.0%) |
| Foreign Born, Citizen | 533 (87.8%) | 74 (12.2%) |
| Foreign Born, not a Citizen | 63 (53.4%) | 55 (46.6%) |
Health Insurance Coverage by Household Income in Seymour
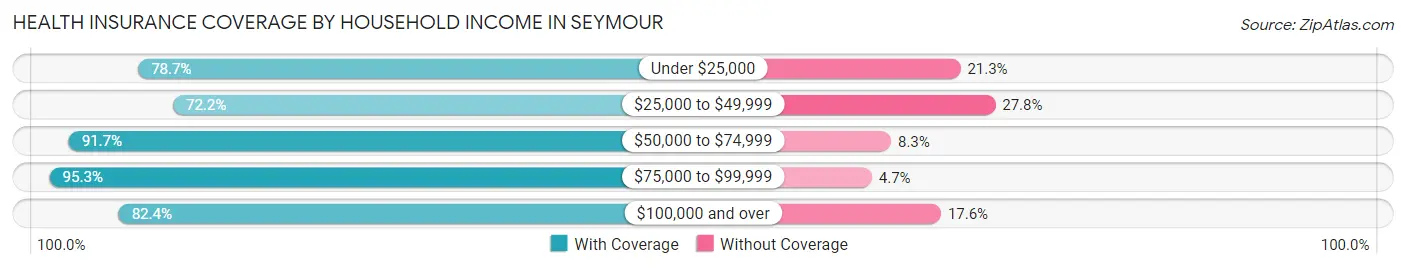
| Household Income | With Coverage | Without Coverage |
| Under $25,000 | 366 (78.7%) | 99 (21.3%) |
| $25,000 to $49,999 | 288 (72.2%) | 111 (27.8%) |
| $50,000 to $74,999 | 542 (91.7%) | 49 (8.3%) |
| $75,000 to $99,999 | 507 (95.3%) | 25 (4.7%) |
| $100,000 and over | 593 (82.4%) | 127 (17.6%) |
Public vs Private Health Insurance Coverage by Age in Seymour
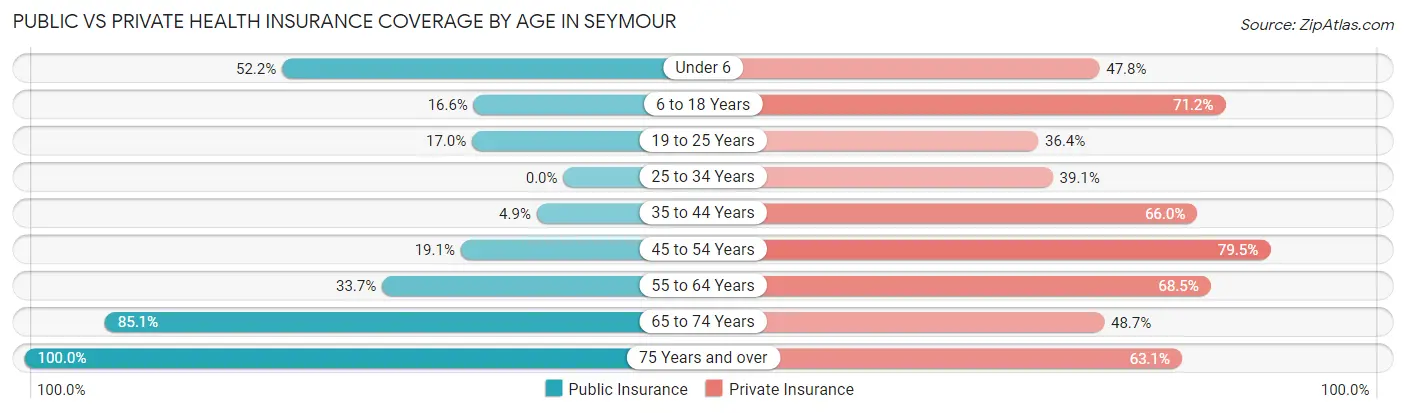
| Age Bracket | Public Insurance | Private Insurance |
| Under 6 | 59 (52.2%) | 54 (47.8%) |
| 6 to 18 Years | 101 (16.6%) | 432 (71.2%) |
| 19 to 25 Years | 20 (17.0%) | 43 (36.4%) |
| 25 to 34 Years | 0 (0.0%) | 45 (39.1%) |
| 35 to 44 Years | 19 (4.9%) | 254 (66.0%) |
| 45 to 54 Years | 52 (19.1%) | 217 (79.5%) |
| 55 to 64 Years | 176 (33.7%) | 358 (68.4%) |
| 65 to 74 Years | 257 (85.1%) | 147 (48.7%) |
| 75 Years and over | 271 (100.0%) | 171 (63.1%) |
| Total | 955 (35.3%) | 1,721 (63.6%) |
Disability Status by Sex by Age in Seymour
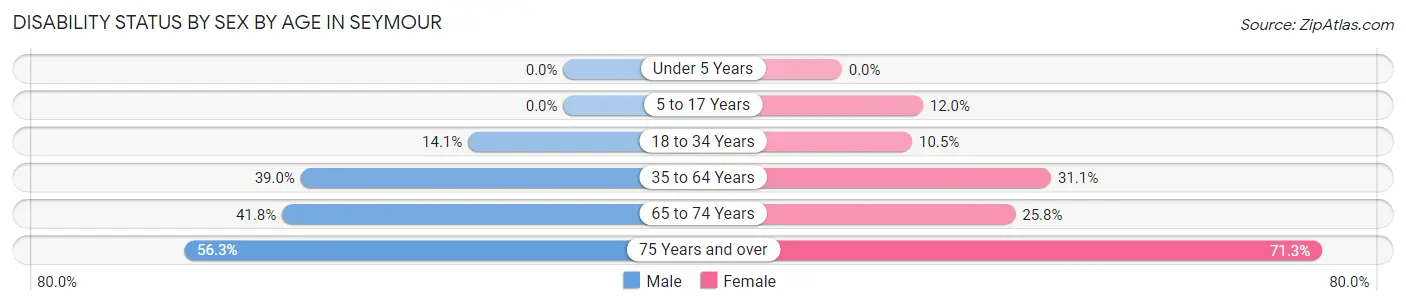
| Age Bracket | Male | Female |
| Under 5 Years | 0 (0.0%) | 0 (0.0%) |
| 5 to 17 Years | 0 (0.0%) | 29 (12.0%) |
| 18 to 34 Years | 14 (14.1%) | 14 (10.4%) |
| 35 to 64 Years | 202 (39.0%) | 206 (31.1%) |
| 65 to 74 Years | 71 (41.8%) | 34 (25.8%) |
| 75 Years and over | 76 (56.3%) | 97 (71.3%) |
Disability Class by Sex by Age in Seymour
Disability Class: Hearing Difficulty
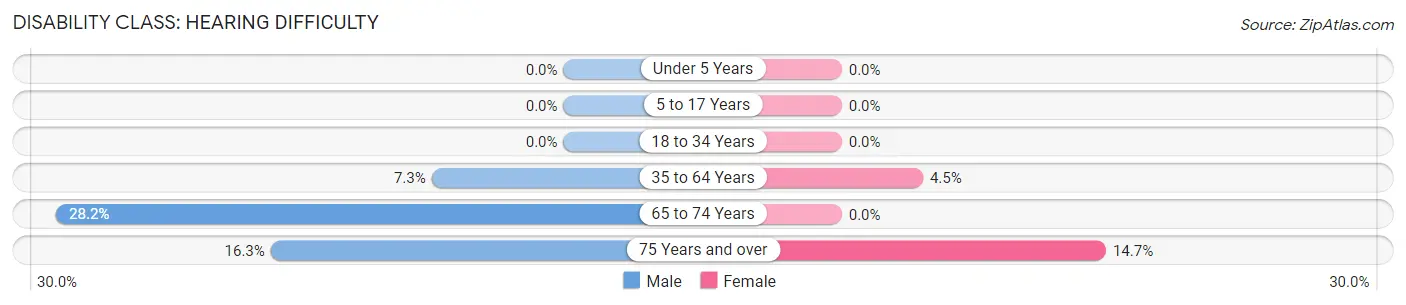
| Age Bracket | Male | Female |
| Under 5 Years | 0 (0.0%) | 0 (0.0%) |
| 5 to 17 Years | 0 (0.0%) | 0 (0.0%) |
| 18 to 34 Years | 0 (0.0%) | 0 (0.0%) |
| 35 to 64 Years | 38 (7.3%) | 30 (4.5%) |
| 65 to 74 Years | 48 (28.2%) | 0 (0.0%) |
| 75 Years and over | 22 (16.3%) | 20 (14.7%) |
Disability Class: Vision Difficulty
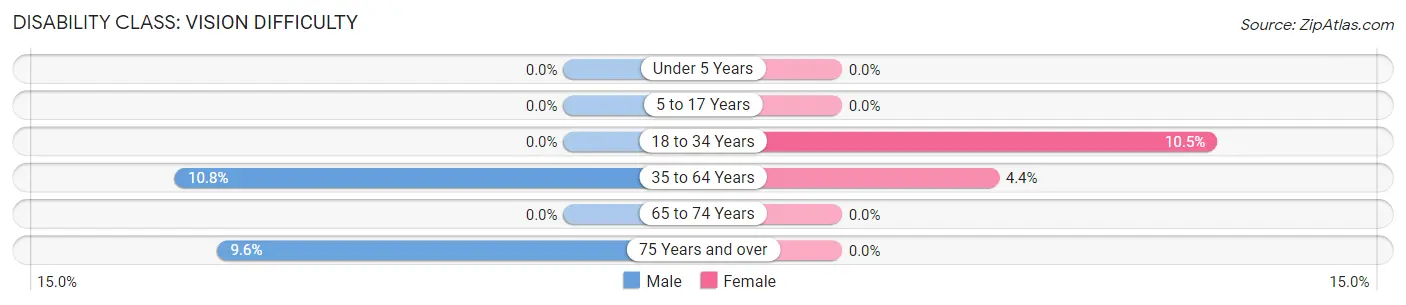
| Age Bracket | Male | Female |
| Under 5 Years | 0 (0.0%) | 0 (0.0%) |
| 5 to 17 Years | 0 (0.0%) | 0 (0.0%) |
| 18 to 34 Years | 0 (0.0%) | 14 (10.4%) |
| 35 to 64 Years | 56 (10.8%) | 29 (4.4%) |
| 65 to 74 Years | 0 (0.0%) | 0 (0.0%) |
| 75 Years and over | 13 (9.6%) | 0 (0.0%) |
Disability Class: Cognitive Difficulty
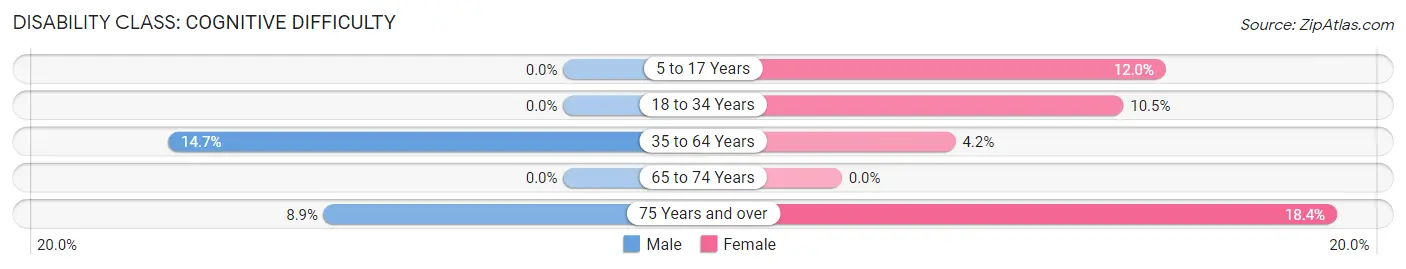
| Age Bracket | Male | Female |
| 5 to 17 Years | 0 (0.0%) | 29 (12.0%) |
| 18 to 34 Years | 0 (0.0%) | 14 (10.4%) |
| 35 to 64 Years | 76 (14.7%) | 28 (4.2%) |
| 65 to 74 Years | 0 (0.0%) | 0 (0.0%) |
| 75 Years and over | 12 (8.9%) | 25 (18.4%) |
Disability Class: Ambulatory Difficulty
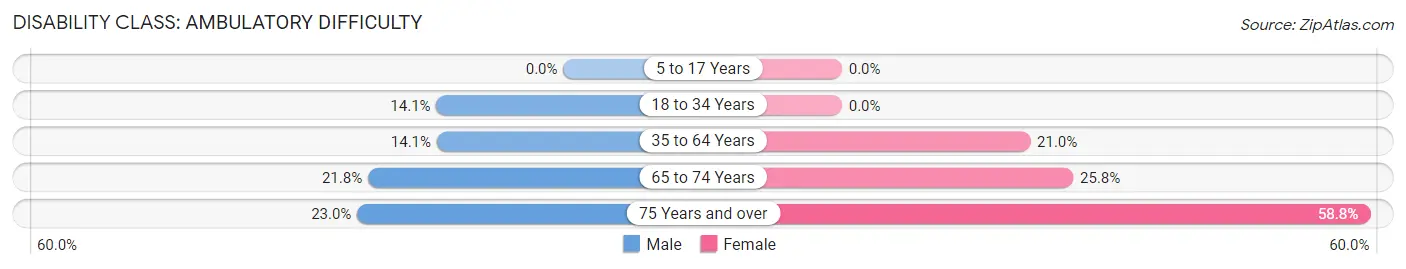
| Age Bracket | Male | Female |
| 5 to 17 Years | 0 (0.0%) | 0 (0.0%) |
| 18 to 34 Years | 14 (14.1%) | 0 (0.0%) |
| 35 to 64 Years | 73 (14.1%) | 139 (21.0%) |
| 65 to 74 Years | 37 (21.8%) | 34 (25.8%) |
| 75 Years and over | 31 (23.0%) | 80 (58.8%) |
Disability Class: Self-Care Difficulty
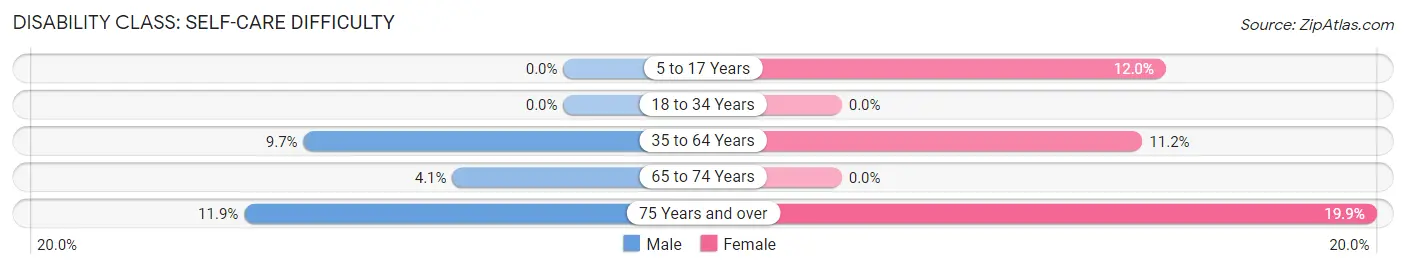
| Age Bracket | Male | Female |
| 5 to 17 Years | 0 (0.0%) | 29 (12.0%) |
| 18 to 34 Years | 0 (0.0%) | 0 (0.0%) |
| 35 to 64 Years | 50 (9.7%) | 74 (11.2%) |
| 65 to 74 Years | 7 (4.1%) | 0 (0.0%) |
| 75 Years and over | 16 (11.8%) | 27 (19.9%) |
Technology Access in Seymour
Computing Device Access in Seymour
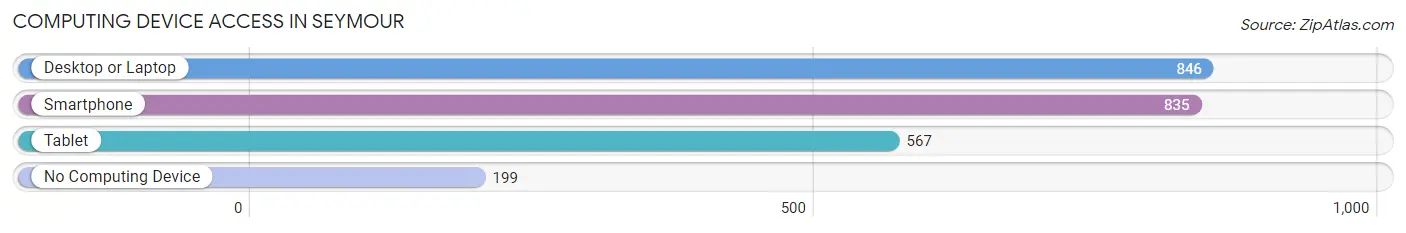
| Device Type | # Households | % Households |
| Desktop or Laptop | 846 | 74.0% |
| Smartphone | 835 | 73.0% |
| Tablet | 567 | 49.6% |
| No Computing Device | 199 | 17.4% |
| Total | 1,144 | 100.0% |
Internet Access in Seymour
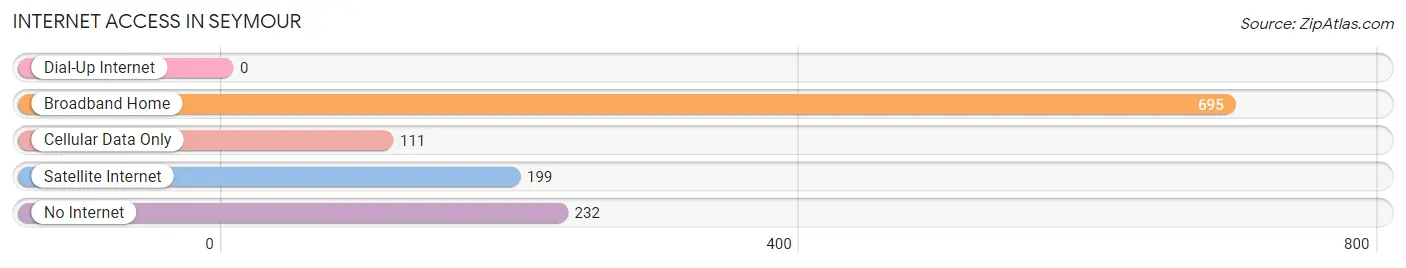
| Internet Type | # Households | % Households |
| Dial-Up Internet | 0 | 0.0% |
| Broadband Home | 695 | 60.8% |
| Cellular Data Only | 111 | 9.7% |
| Satellite Internet | 199 | 17.4% |
| No Internet | 232 | 20.3% |
| Total | 1,144 | 100.0% |
Seymour Summary
Seymour, Texas is a small city located in Baylor County in the north-central part of the state. It is situated on the banks of the Brazos River, about 90 miles northwest of Dallas and about 70 miles southeast of Amarillo. The city has a population of approximately 2,700 people and covers an area of about 4.5 square miles.
History
Seymour was founded in 1876 by a group of settlers from Missouri. The town was named after the first postmaster, John Seymour. The town was originally located on the banks of the Brazos River, but was moved to its current location in 1882 when the railroad came through. The railroad brought with it a new era of growth and prosperity for the town.
In the early 1900s, Seymour was a thriving agricultural center, with cotton, corn, and wheat being the main crops. The town also had a number of businesses, including a bank, a hotel, a newspaper, and a variety of stores.
In the 1920s, the town began to decline as the railroad moved away and the agricultural industry shifted to other parts of the state. The Great Depression further exacerbated the decline, and by the 1940s, the population had dropped to just over 1,000 people.
In the 1950s, the town began to experience a resurgence as the oil and gas industry moved into the area. This brought new jobs and economic growth to the town, and the population began to grow again.
Geography
Seymour is located in the north-central part of Texas, about 90 miles northwest of Dallas and about 70 miles southeast of Amarillo. The city is situated on the banks of the Brazos River, and is surrounded by rolling hills and prairies. The climate is semi-arid, with hot summers and mild winters.
Economy
Seymour’s economy is largely based on agriculture and oil and gas production. The town is home to a number of farms, which produce cotton, corn, wheat, and other crops. The oil and gas industry is also a major employer in the area, with several oil and gas companies operating in the area.
In addition to agriculture and oil and gas, Seymour also has a number of other businesses, including a bank, a hotel, a newspaper, and a variety of stores. The town also has a number of manufacturing companies, including a furniture factory and a plastics factory.
Demographics
As of the 2010 census, the population of Seymour was 2,717. The racial makeup of the town was 87.3% White, 0.7% African American, 0.3% Native American, 0.2% Asian, 0.1% Pacific Islander, 9.7% from other races, and 1.9% from two or more races. Hispanic or Latino of any race were 16.3% of the population.
The median household income in Seymour was $35,938, and the median family income was $41,250. The per capita income was $17,845. About 16.3% of the population was below the poverty line.
Seymour is a small town with a rich history and a bright future. The town has a strong agricultural and oil and gas industry, and is home to a diverse population. With its close proximity to Dallas and Amarillo, Seymour is an ideal place to live and work.
Common Questions
What is Per Capita Income in Seymour?
Per Capita income in Seymour is $31,901.
What is the Median Family Income in Seymour?
Median Family Income in Seymour is $74,295.
What is the Median Household income in Seymour?
Median Household Income in Seymour is $53,077.
What is Income or Wage Gap in Seymour?
Income or Wage Gap in Seymour is 43.3%.
Women in Seymour earn 56.7 cents for every dollar earned by a man.
What is Inequality or Gini Index in Seymour?
Inequality or Gini Index in Seymour is 0.50.
What is the Total Population of Seymour?
Total Population of Seymour is 2,786.
What is the Total Male Population of Seymour?
Total Male Population of Seymour is 1,395.
What is the Total Female Population of Seymour?
Total Female Population of Seymour is 1,391.
What is the Ratio of Males per 100 Females in Seymour?
There are 100.29 Males per 100 Females in Seymour.
What is the Ratio of Females per 100 Males in Seymour?
There are 99.71 Females per 100 Males in Seymour.
What is the Median Population Age in Seymour?
Median Population Age in Seymour is 47.0 Years.
What is the Average Family Size in Seymour
Average Family Size in Seymour is 2.9 People.
What is the Average Household Size in Seymour
Average Household Size in Seymour is 2.4 People.
How Large is the Labor Force in Seymour?
There are 1,121 People in the Labor Forcein in Seymour.
What is the Percentage of People in the Labor Force in Seymour?
51.3% of People are in the Labor Force in Seymour.
What is the Unemployment Rate in Seymour?
Unemployment Rate in Seymour is 0.5%.