Seguin, TX Map & Demographics
Seguin Map
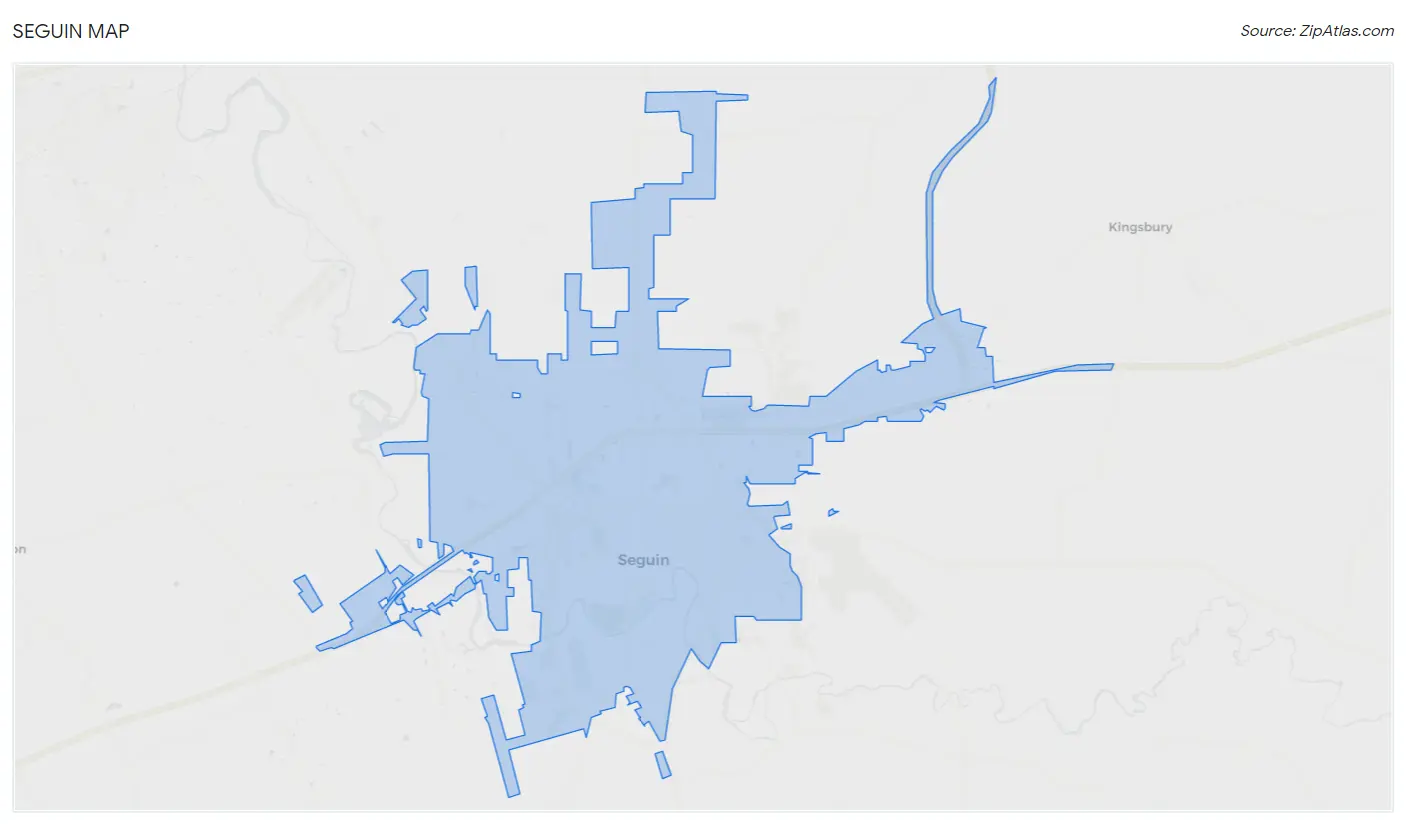
Seguin Overview
$28,564
PER CAPITA INCOME
$71,604
AVG FAMILY INCOME
$58,165
AVG HOUSEHOLD INCOME
9.5%
WAGE / INCOME GAP [ % ]
90.5¢/ $1
WAGE / INCOME GAP [ $ ]
0.45
INEQUALITY / GINI INDEX
30,318
TOTAL POPULATION
14,377
MALE POPULATION
15,941
FEMALE POPULATION
90.19
MALES / 100 FEMALES
110.88
FEMALES / 100 MALES
36.2
MEDIAN AGE
3.3
AVG FAMILY SIZE
2.7
AVG HOUSEHOLD SIZE
14,644
LABOR FORCE [ PEOPLE ]
59.7%
PERCENT IN LABOR FORCE
4.4%
UNEMPLOYMENT RATE
Seguin Zip Codes
Seguin Area Codes
Income in Seguin
Income Overview in Seguin
Per Capita Income in Seguin is $28,564, while median incomes of families and households are $71,604 and $58,165 respectively.
| Characteristic | Number | Measure |
| Per Capita Income | 30,318 | $28,564 |
| Median Family Income | 6,744 | $71,604 |
| Mean Family Income | 6,744 | $90,034 |
| Median Household Income | 10,786 | $58,165 |
| Mean Household Income | 10,786 | $77,511 |
| Income Deficit | 6,744 | $0 |
| Wage / Income Gap (%) | 30,318 | 9.54% |
| Wage / Income Gap ($) | 30,318 | 90.46¢ per $1 |
| Gini / Inequality Index | 30,318 | 0.45 |
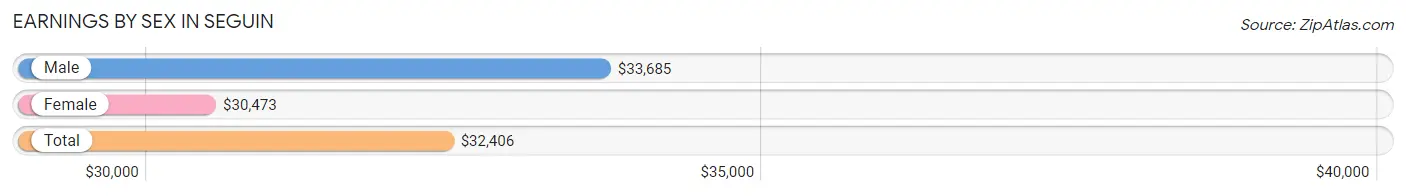
Earnings by Sex in Seguin
Average Earnings in Seguin are $32,406, $33,685 for men and $30,473 for women, a difference of 9.5%.
| Sex | Number | Average Earnings |
| Male | 8,016 (51.3%) | $33,685 |
| Female | 7,609 (48.7%) | $30,473 |
| Total | 15,625 (100.0%) | $32,406 |
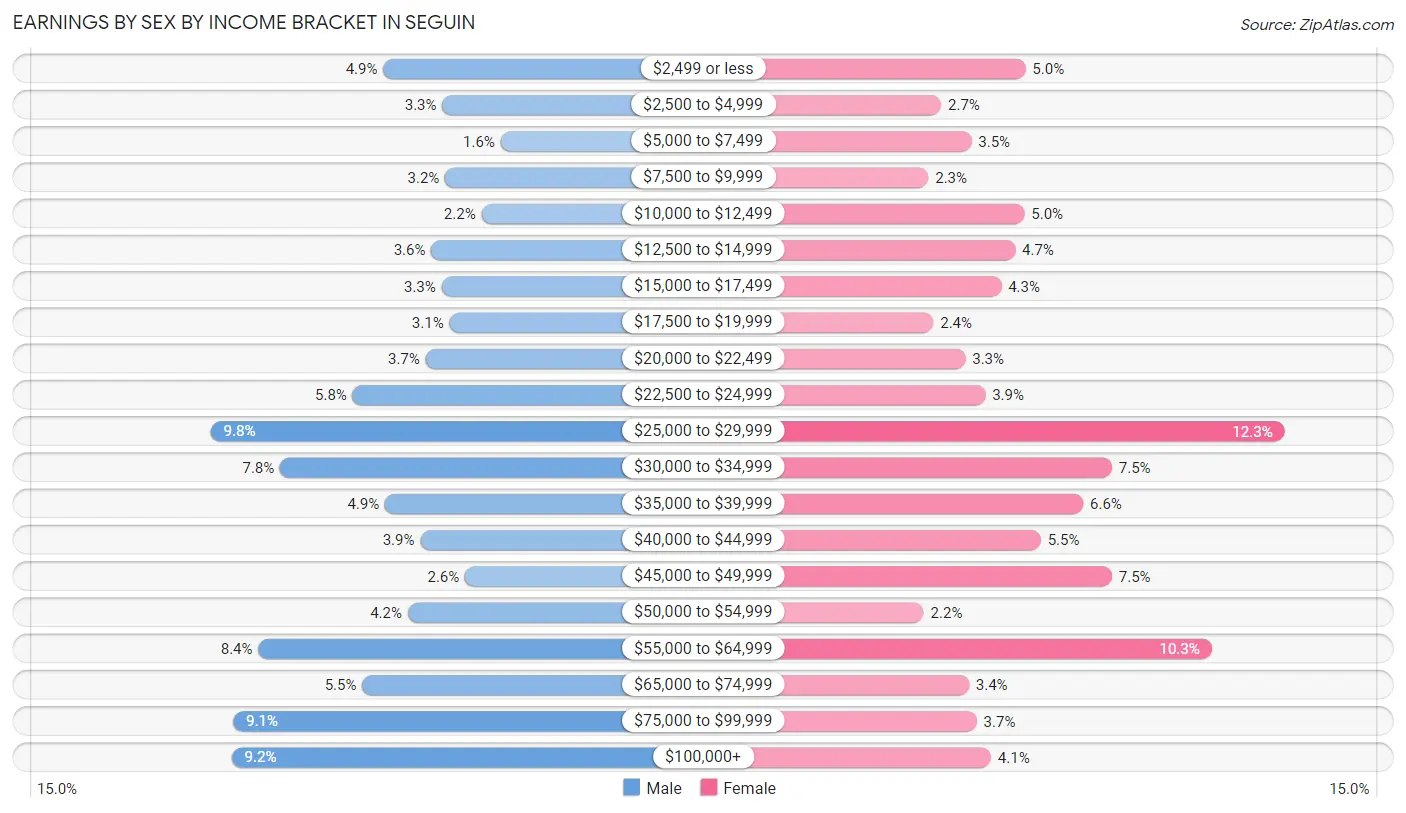
Earnings by Sex by Income Bracket in Seguin
The most common earnings brackets in Seguin are $25,000 to $29,999 for men (783 | 9.8%) and $25,000 to $29,999 for women (936 | 12.3%).
| Income | Male | Female |
| $2,499 or less | 394 (4.9%) | 382 (5.0%) |
| $2,500 to $4,999 | 261 (3.3%) | 202 (2.6%) |
| $5,000 to $7,499 | 130 (1.6%) | 266 (3.5%) |
| $7,500 to $9,999 | 255 (3.2%) | 174 (2.3%) |
| $10,000 to $12,499 | 173 (2.2%) | 380 (5.0%) |
| $12,500 to $14,999 | 286 (3.6%) | 360 (4.7%) |
| $15,000 to $17,499 | 263 (3.3%) | 330 (4.3%) |
| $17,500 to $19,999 | 245 (3.1%) | 185 (2.4%) |
| $20,000 to $22,499 | 299 (3.7%) | 253 (3.3%) |
| $22,500 to $24,999 | 463 (5.8%) | 296 (3.9%) |
| $25,000 to $29,999 | 783 (9.8%) | 936 (12.3%) |
| $30,000 to $34,999 | 627 (7.8%) | 567 (7.4%) |
| $35,000 to $39,999 | 390 (4.9%) | 505 (6.6%) |
| $40,000 to $44,999 | 311 (3.9%) | 415 (5.4%) |
| $45,000 to $49,999 | 210 (2.6%) | 567 (7.4%) |
| $50,000 to $54,999 | 339 (4.2%) | 164 (2.2%) |
| $55,000 to $64,999 | 676 (8.4%) | 780 (10.2%) |
| $65,000 to $74,999 | 442 (5.5%) | 261 (3.4%) |
| $75,000 to $99,999 | 733 (9.1%) | 278 (3.6%) |
| $100,000+ | 736 (9.2%) | 308 (4.1%) |
| Total | 8,016 (100.0%) | 7,609 (100.0%) |
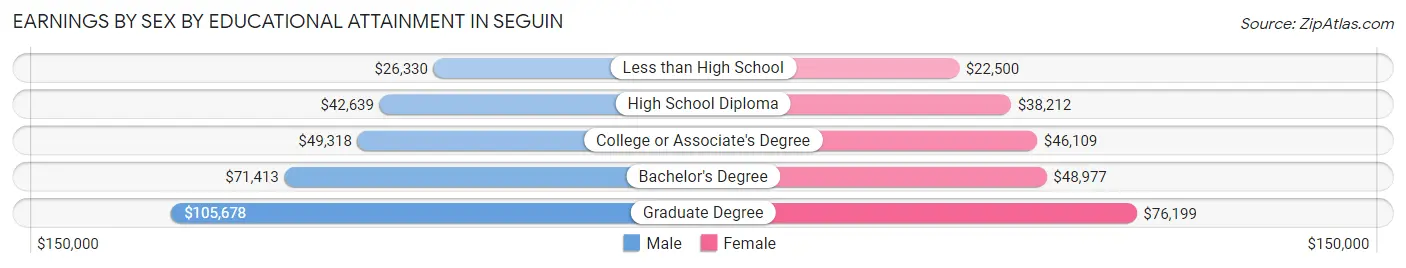
Earnings by Sex by Educational Attainment in Seguin
Average earnings in Seguin are $40,684 for men and $37,893 for women, a difference of 6.9%. Men with an educational attainment of graduate degree enjoy the highest average annual earnings of $105,678, while those with less than high school education earn the least with $26,330. Women with an educational attainment of graduate degree earn the most with the average annual earnings of $76,199, while those with less than high school education have the smallest earnings of $22,500.
| Educational Attainment | Male Income | Female Income |
| Less than High School | $26,330 | $22,500 |
| High School Diploma | $42,639 | $38,212 |
| College or Associate's Degree | $49,318 | $46,109 |
| Bachelor's Degree | $71,413 | $48,977 |
| Graduate Degree | $105,678 | $76,199 |
| Total | $40,684 | $37,893 |
Family Income in Seguin
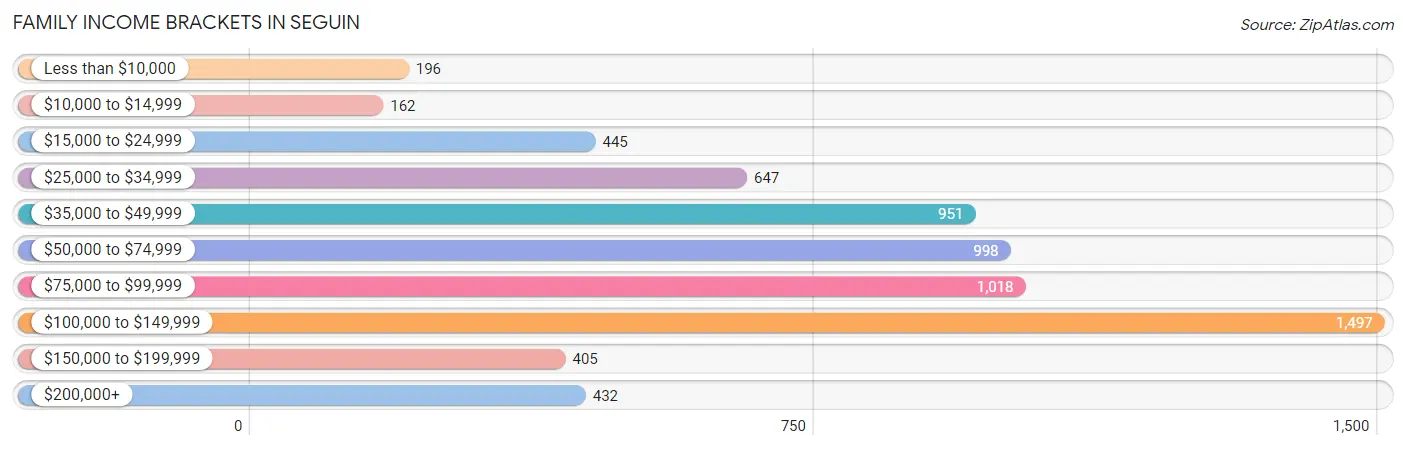
Family Income Brackets in Seguin
According to the Seguin family income data, there are 1,497 families falling into the $100,000 to $149,999 income range, which is the most common income bracket and makes up 22.2% of all families. Conversely, the $10,000 to $14,999 income bracket is the least frequent group with only 162 families (2.4%) belonging to this category.
| Income Bracket | # Families | % Families |
| Less than $10,000 | 196 | 2.9% |
| $10,000 to $14,999 | 162 | 2.4% |
| $15,000 to $24,999 | 445 | 6.6% |
| $25,000 to $34,999 | 647 | 9.6% |
| $35,000 to $49,999 | 951 | 14.1% |
| $50,000 to $74,999 | 998 | 14.8% |
| $75,000 to $99,999 | 1,018 | 15.1% |
| $100,000 to $149,999 | 1,497 | 22.2% |
| $150,000 to $199,999 | 405 | 6.0% |
| $200,000+ | 432 | 6.4% |
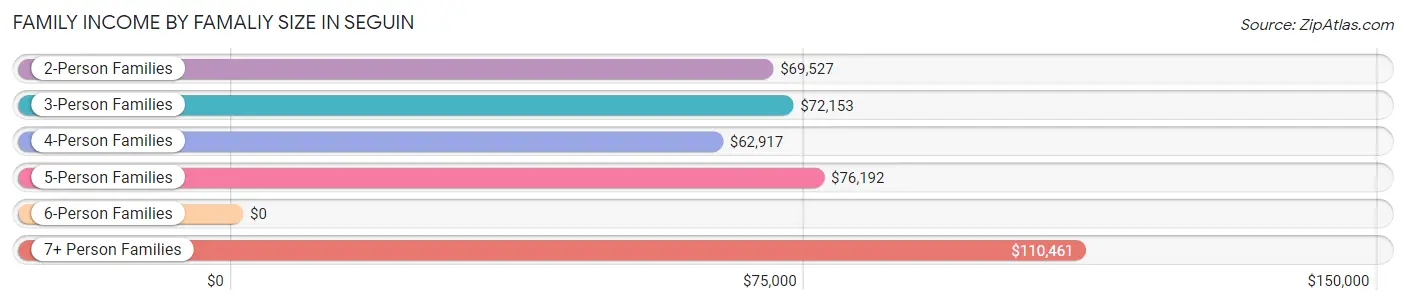
Family Income by Famaliy Size in Seguin
7+ person families (354 | 5.2%) account for the highest median family income in Seguin with $110,461 per family, while 2-person families (2,958 | 43.9%) have the highest median income of $34,764 per family member.
| Income Bracket | # Families | Median Income |
| 2-Person Families | 2,958 (43.9%) | $69,527 |
| 3-Person Families | 1,312 (19.5%) | $72,153 |
| 4-Person Families | 1,217 (18.0%) | $62,917 |
| 5-Person Families | 651 (9.7%) | $76,192 |
| 6-Person Families | 252 (3.7%) | $0 |
| 7+ Person Families | 354 (5.2%) | $110,461 |
| Total | 6,744 (100.0%) | $71,604 |
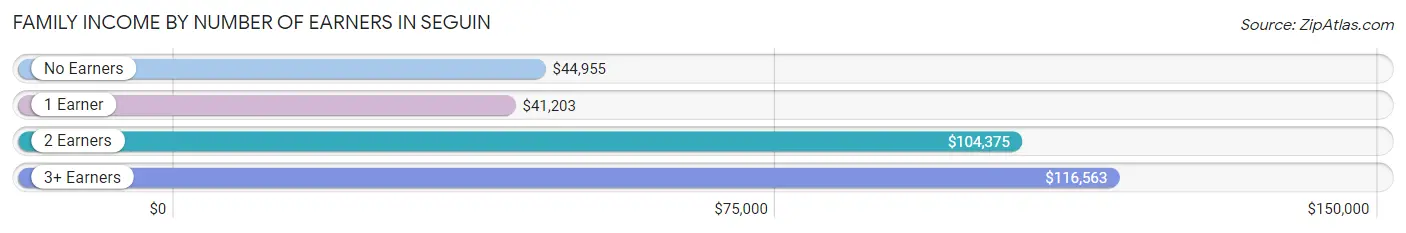
Family Income by Number of Earners in Seguin
The median family income in Seguin is $71,604, with families comprising 3+ earners (885) having the highest median family income of $116,563, while families with 1 earner (2,494) have the lowest median family income of $41,203, accounting for 13.1% and 37.0% of families, respectively.
| Number of Earners | # Families | Median Income |
| No Earners | 1,003 (14.9%) | $44,955 |
| 1 Earner | 2,494 (37.0%) | $41,203 |
| 2 Earners | 2,362 (35.0%) | $104,375 |
| 3+ Earners | 885 (13.1%) | $116,563 |
| Total | 6,744 (100.0%) | $71,604 |
Household Income in Seguin
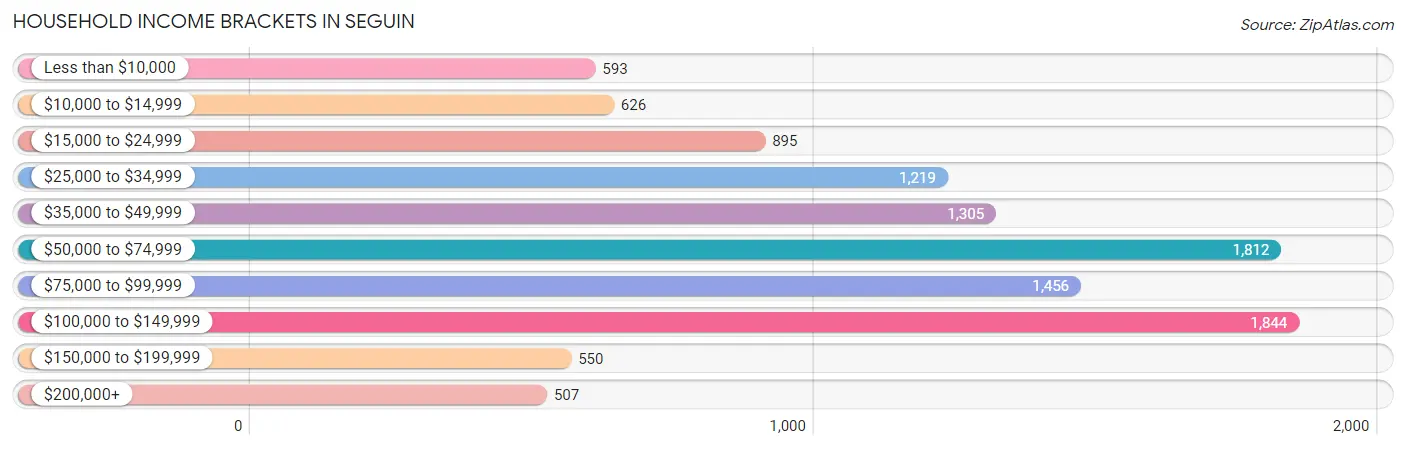
Household Income Brackets in Seguin
With 1,844 households falling in the category, the $100,000 to $149,999 income range is the most frequent in Seguin, accounting for 17.1% of all households. In contrast, only 507 households (4.7%) fall into the $200,000+ income bracket, making it the least populous group.
| Income Bracket | # Households | % Households |
| Less than $10,000 | 593 | 5.5% |
| $10,000 to $14,999 | 626 | 5.8% |
| $15,000 to $24,999 | 895 | 8.3% |
| $25,000 to $34,999 | 1,219 | 11.3% |
| $35,000 to $49,999 | 1,305 | 12.1% |
| $50,000 to $74,999 | 1,812 | 16.8% |
| $75,000 to $99,999 | 1,456 | 13.5% |
| $100,000 to $149,999 | 1,844 | 17.1% |
| $150,000 to $199,999 | 550 | 5.1% |
| $200,000+ | 507 | 4.7% |
Household Income by Householder Age in Seguin
The median household income in Seguin is $58,165, with the highest median household income of $73,410 found in the 25 to 44 years age bracket for the primary householder. A total of 3,969 households (36.8%) fall into this category. Meanwhile, the 65+ years age bracket for the primary householder has the lowest median household income of $36,774, with 3,046 households (28.2%) in this group.
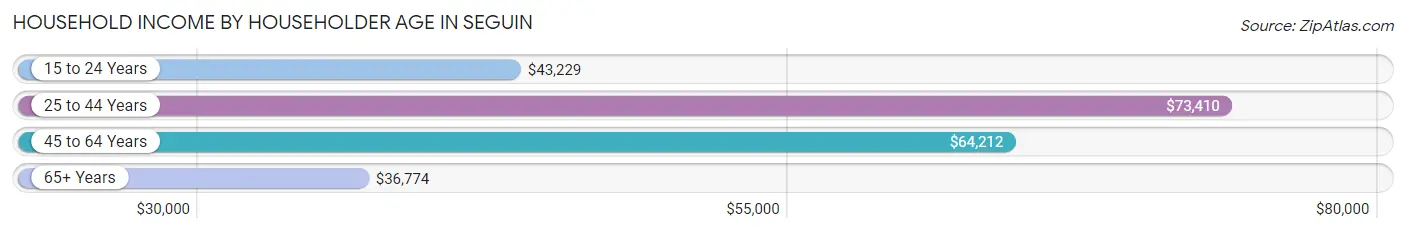
| Income Bracket | # Households | Median Income |
| 15 to 24 Years | 269 (2.5%) | $43,229 |
| 25 to 44 Years | 3,969 (36.8%) | $73,410 |
| 45 to 64 Years | 3,502 (32.5%) | $64,212 |
| 65+ Years | 3,046 (28.2%) | $36,774 |
| Total | 10,786 (100.0%) | $58,165 |
Poverty in Seguin
Income Below Poverty by Sex and Age in Seguin
With 15.8% poverty level for males and 19.7% for females among the residents of Seguin, 16 and 17 year old males and 5 year old females are the most vulnerable to poverty, with 112 males (40.0%) and 85 females (66.9%) in their respective age groups living below the poverty level.
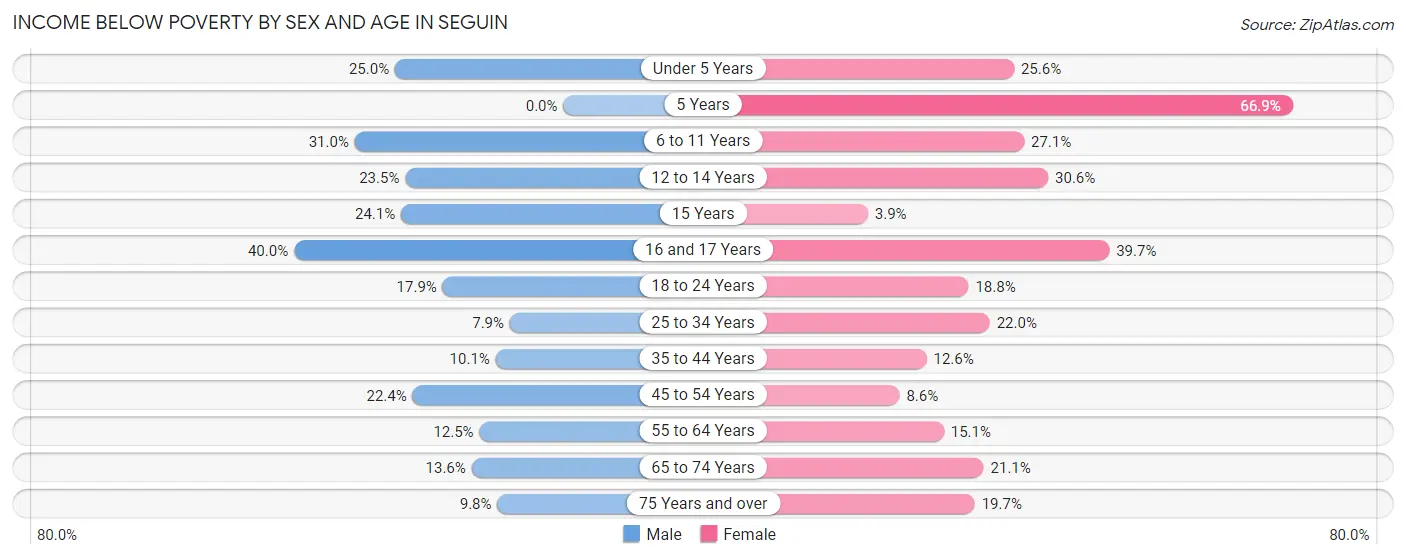
| Age Bracket | Male | Female |
| Under 5 Years | 209 (25.0%) | 247 (25.6%) |
| 5 Years | 0 (0.0%) | 85 (66.9%) |
| 6 to 11 Years | 299 (31.0%) | 272 (27.1%) |
| 12 to 14 Years | 85 (23.5%) | 205 (30.6%) |
| 15 Years | 47 (24.1%) | 7 (3.9%) |
| 16 and 17 Years | 112 (40.0%) | 193 (39.7%) |
| 18 to 24 Years | 266 (17.9%) | 304 (18.8%) |
| 25 to 34 Years | 155 (7.9%) | 495 (22.0%) |
| 35 to 44 Years | 184 (10.1%) | 226 (12.6%) |
| 45 to 54 Years | 289 (22.4%) | 141 (8.6%) |
| 55 to 64 Years | 232 (12.5%) | 264 (15.1%) |
| 65 to 74 Years | 185 (13.6%) | 274 (21.1%) |
| 75 Years and over | 68 (9.8%) | 291 (19.7%) |
| Total | 2,131 (15.8%) | 3,004 (19.7%) |
Income Above Poverty by Sex and Age in Seguin
According to the poverty statistics in Seguin, males aged 5 years and females aged 15 years are the age groups that are most secure financially, with 100.0% of males and 96.1% of females in these age groups living above the poverty line.
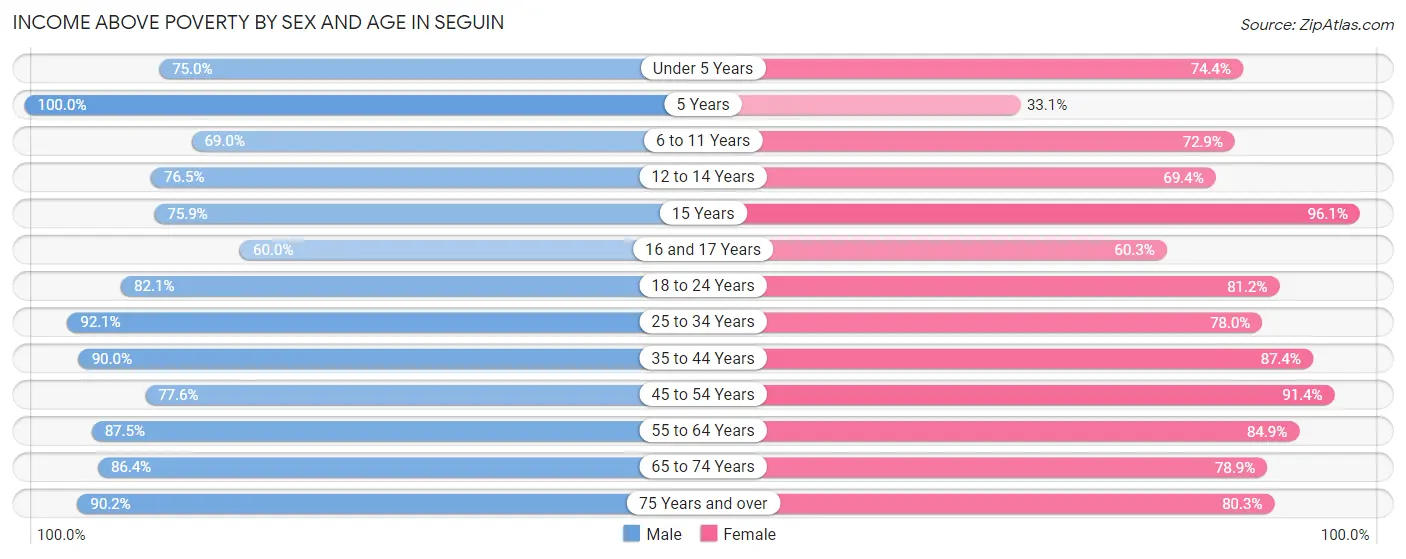
| Age Bracket | Male | Female |
| Under 5 Years | 627 (75.0%) | 719 (74.4%) |
| 5 Years | 348 (100.0%) | 42 (33.1%) |
| 6 to 11 Years | 666 (69.0%) | 733 (72.9%) |
| 12 to 14 Years | 277 (76.5%) | 464 (69.4%) |
| 15 Years | 148 (75.9%) | 174 (96.1%) |
| 16 and 17 Years | 168 (60.0%) | 293 (60.3%) |
| 18 to 24 Years | 1,218 (82.1%) | 1,312 (81.2%) |
| 25 to 34 Years | 1,796 (92.1%) | 1,758 (78.0%) |
| 35 to 44 Years | 1,647 (89.9%) | 1,570 (87.4%) |
| 45 to 54 Years | 1,002 (77.6%) | 1,507 (91.4%) |
| 55 to 64 Years | 1,630 (87.5%) | 1,480 (84.9%) |
| 65 to 74 Years | 1,173 (86.4%) | 1,027 (78.9%) |
| 75 Years and over | 626 (90.2%) | 1,183 (80.3%) |
| Total | 11,326 (84.2%) | 12,262 (80.3%) |
Income Below Poverty Among Married-Couple Families in Seguin
The poverty statistics for married-couple families in Seguin show that 10.4% or 432 of the total 4,137 families live below the poverty line. Families with 3 or 4 children have the highest poverty rate of 22.5%, comprising of 69 families. On the other hand, families with no children have the lowest poverty rate of 4.1%, which includes 95 families.
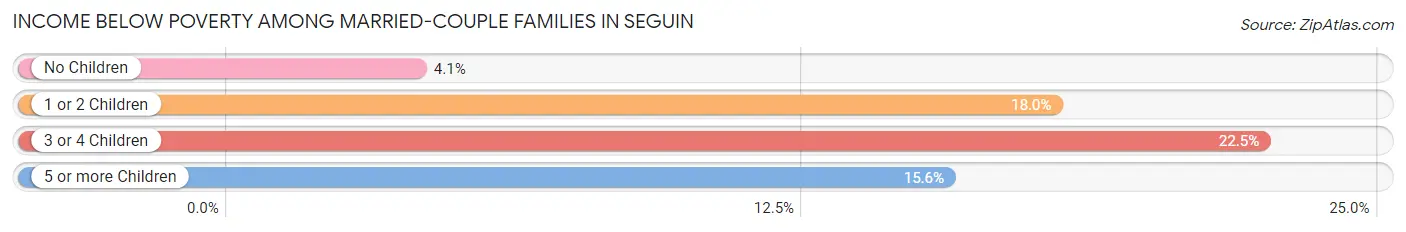
| Children | Above Poverty | Below Poverty |
| No Children | 2,218 (95.9%) | 95 (4.1%) |
| 1 or 2 Children | 1,087 (82.0%) | 238 (18.0%) |
| 3 or 4 Children | 238 (77.5%) | 69 (22.5%) |
| 5 or more Children | 162 (84.4%) | 30 (15.6%) |
| Total | 3,705 (89.6%) | 432 (10.4%) |
Income Below Poverty Among Single-Parent Households in Seguin
According to the poverty data in Seguin, 5.2% or 25 single-father households and 21.0% or 448 single-mother households are living below the poverty line. Among single-father households, those with 1 or 2 children have the highest poverty rate, with 12 households (9.0%) experiencing poverty. Likewise, among single-mother households, those with 5 or more children have the highest poverty rate, with 25 households (100.0%) falling below the poverty line.
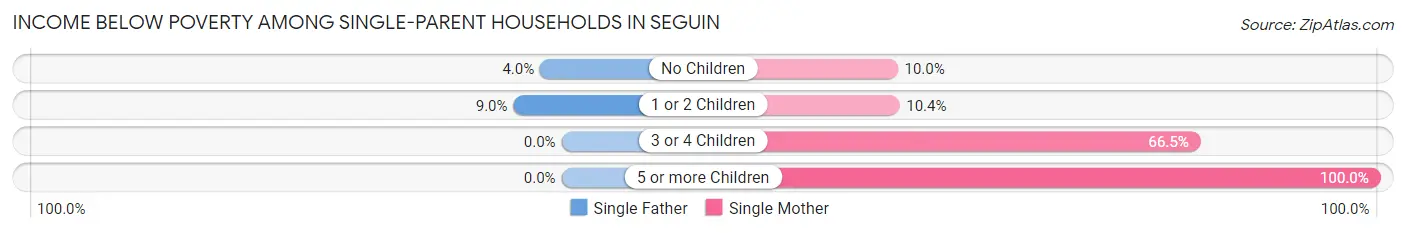
| Children | Single Father | Single Mother |
| No Children | 13 (4.0%) | 79 (10.0%) |
| 1 or 2 Children | 12 (9.0%) | 98 (10.4%) |
| 3 or 4 Children | 0 (0.0%) | 246 (66.5%) |
| 5 or more Children | 0 (0.0%) | 25 (100.0%) |
| Total | 25 (5.2%) | 448 (21.0%) |
Income Below Poverty Among Married-Couple vs Single-Parent Households in Seguin
The poverty data for Seguin shows that 432 of the married-couple family households (10.4%) and 473 of the single-parent households (18.1%) are living below the poverty level. Within the married-couple family households, those with 3 or 4 children have the highest poverty rate, with 69 households (22.5%) falling below the poverty line. Among the single-parent households, those with 5 or more children have the highest poverty rate, with 25 household (100.0%) living below poverty.
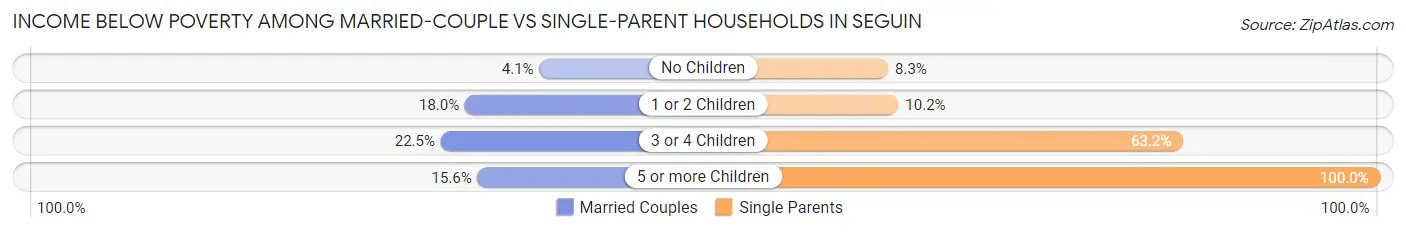
| Children | Married-Couple Families | Single-Parent Households |
| No Children | 95 (4.1%) | 92 (8.3%) |
| 1 or 2 Children | 238 (18.0%) | 110 (10.2%) |
| 3 or 4 Children | 69 (22.5%) | 246 (63.2%) |
| 5 or more Children | 30 (15.6%) | 25 (100.0%) |
| Total | 432 (10.4%) | 473 (18.1%) |
Race in Seguin
The most populous races in Seguin are Hispanic or Latino (17,143 | 56.5%), White / Caucasian (16,760 | 55.3%), and Two or more Races (7,440 | 24.5%).
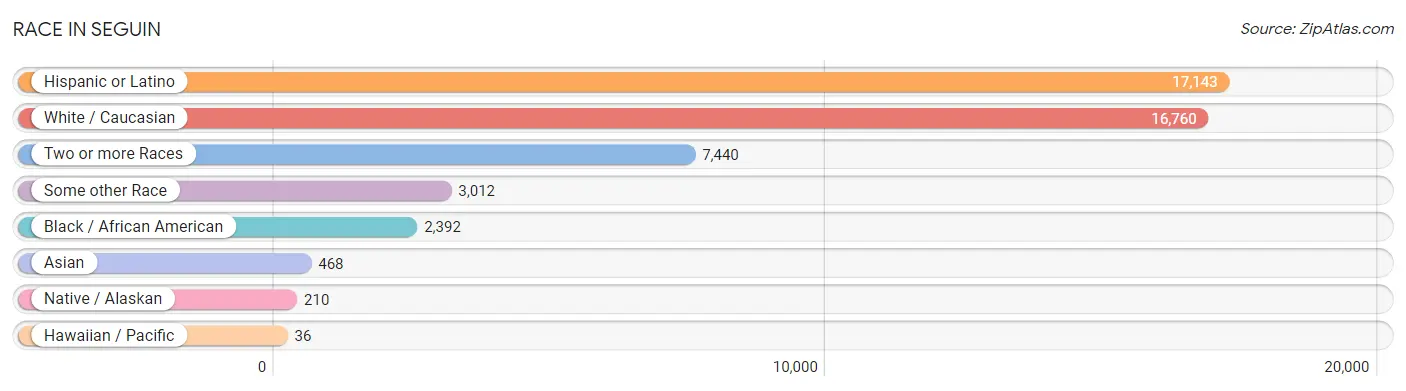
| Race | # Population | % Population |
| Asian | 468 | 1.5% |
| Black / African American | 2,392 | 7.9% |
| Hawaiian / Pacific | 36 | 0.1% |
| Hispanic or Latino | 17,143 | 56.5% |
| Native / Alaskan | 210 | 0.7% |
| White / Caucasian | 16,760 | 55.3% |
| Two or more Races | 7,440 | 24.5% |
| Some other Race | 3,012 | 9.9% |
| Total | 30,318 | 100.0% |
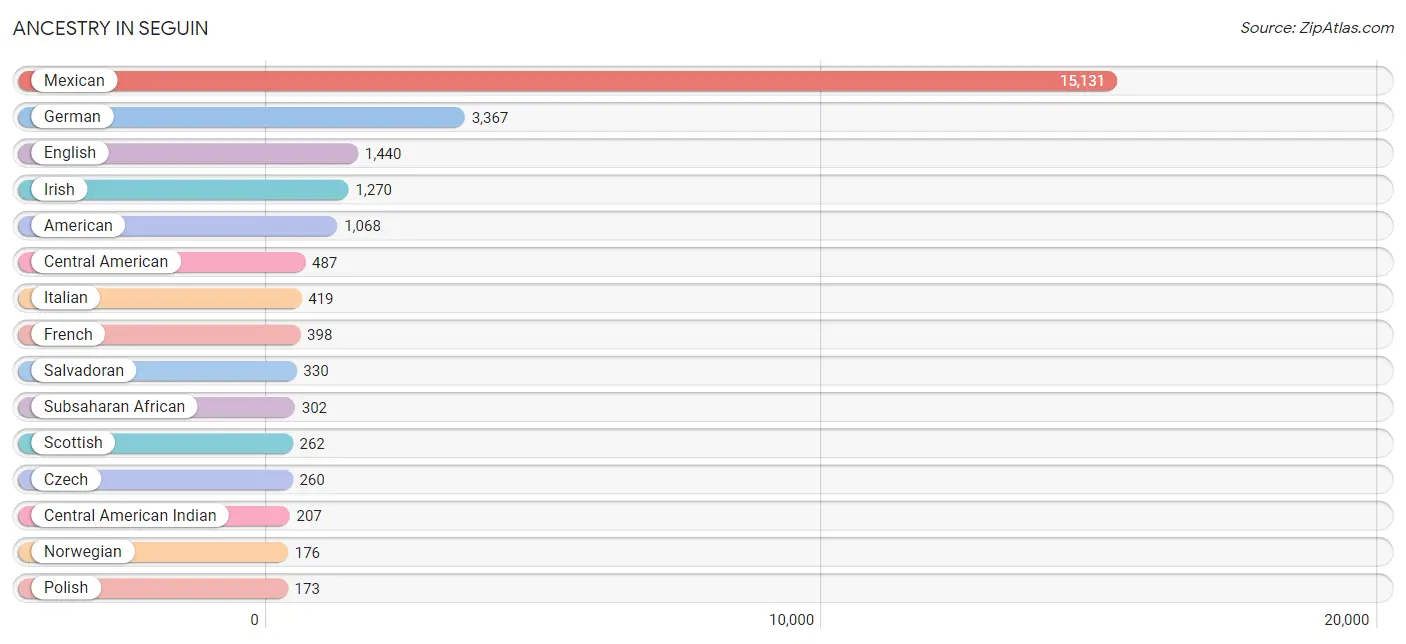
Ancestry in Seguin
The most populous ancestries reported in Seguin are Mexican (15,131 | 49.9%), German (3,367 | 11.1%), English (1,440 | 4.8%), Irish (1,270 | 4.2%), and American (1,068 | 3.5%), together accounting for 73.5% of all Seguin residents.
| Ancestry | # Population | % Population |
| African | 74 | 0.2% |
| Alaska Native | 3 | 0.0% |
| American | 1,068 | 3.5% |
| Arab | 12 | 0.0% |
| Argentinean | 14 | 0.1% |
| Australian | 40 | 0.1% |
| Austrian | 60 | 0.2% |
| Bhutanese | 97 | 0.3% |
| Blackfeet | 10 | 0.0% |
| Brazilian | 19 | 0.1% |
| British | 69 | 0.2% |
| Burmese | 26 | 0.1% |
| Canadian | 32 | 0.1% |
| Central American | 487 | 1.6% |
| Central American Indian | 207 | 0.7% |
| Cherokee | 50 | 0.2% |
| Choctaw | 22 | 0.1% |
| Cuban | 146 | 0.5% |
| Czech | 260 | 0.9% |
| Czechoslovakian | 7 | 0.0% |
| Danish | 46 | 0.2% |
| Dutch | 52 | 0.2% |
| Eastern European | 17 | 0.1% |
| Egyptian | 1 | 0.0% |
| English | 1,440 | 4.8% |
| Ethiopian | 45 | 0.2% |
| European | 137 | 0.4% |
| Finnish | 28 | 0.1% |
| French | 398 | 1.3% |
| French Canadian | 37 | 0.1% |
| German | 3,367 | 11.1% |
| Ghanaian | 107 | 0.4% |
| Greek | 28 | 0.1% |
| Honduran | 157 | 0.5% |
| Indian (Asian) | 166 | 0.5% |
| Iranian | 21 | 0.1% |
| Irish | 1,270 | 4.2% |
| Italian | 419 | 1.4% |
| Jamaican | 5 | 0.0% |
| Korean | 43 | 0.1% |
| Lebanese | 11 | 0.0% |
| Mexican | 15,131 | 49.9% |
| Mexican American Indian | 77 | 0.3% |
| Native Hawaiian | 4 | 0.0% |
| Nigerian | 10 | 0.0% |
| Norwegian | 176 | 0.6% |
| Peruvian | 57 | 0.2% |
| Polish | 173 | 0.6% |
| Portuguese | 73 | 0.2% |
| Puerto Rican | 90 | 0.3% |
| Russian | 150 | 0.5% |
| Salvadoran | 330 | 1.1% |
| Scandinavian | 46 | 0.2% |
| Scotch-Irish | 172 | 0.6% |
| Scottish | 262 | 0.9% |
| Sioux | 6 | 0.0% |
| Slovene | 22 | 0.1% |
| South American | 71 | 0.2% |
| Spaniard | 104 | 0.3% |
| Spanish | 39 | 0.1% |
| Spanish American | 17 | 0.1% |
| Subsaharan African | 302 | 1.0% |
| Swiss | 7 | 0.0% |
| Thai | 131 | 0.4% |
| Ukrainian | 16 | 0.1% |
| Welsh | 144 | 0.5% | View All 66 Rows |
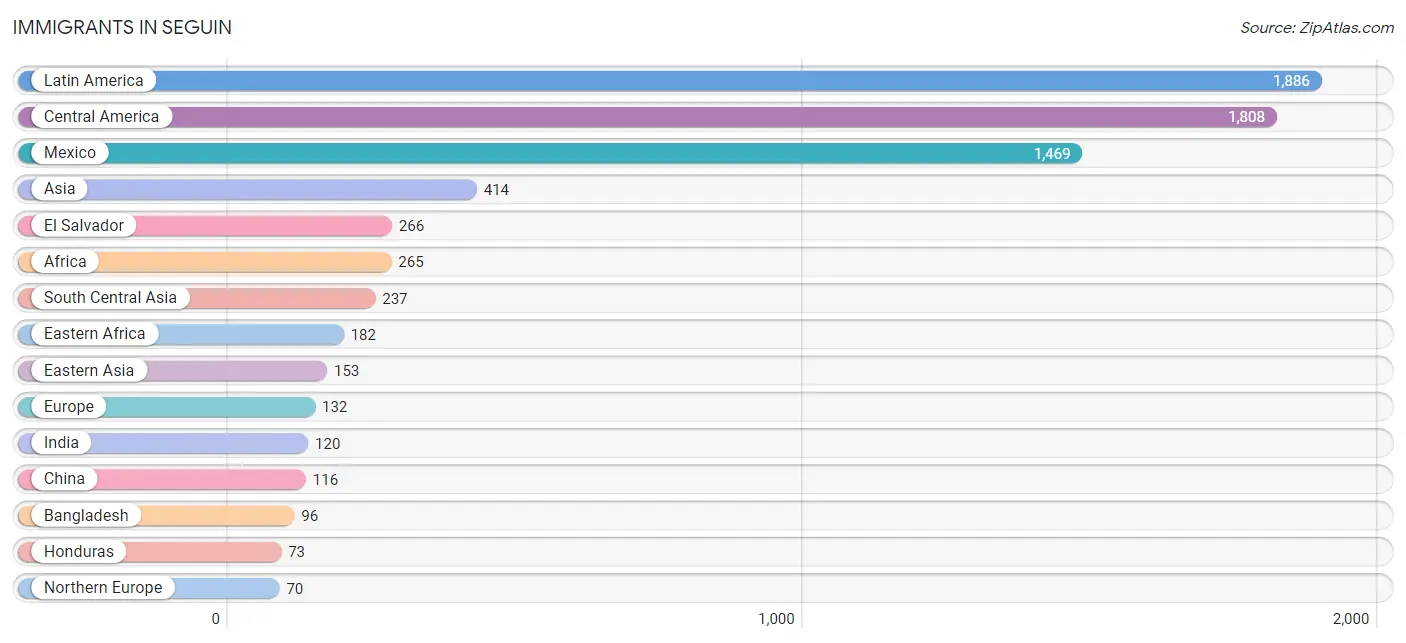
Immigrants in Seguin
The most numerous immigrant groups reported in Seguin came from Latin America (1,886 | 6.2%), Central America (1,808 | 6.0%), Mexico (1,469 | 4.9%), Asia (414 | 1.4%), and El Salvador (266 | 0.9%), together accounting for 19.3% of all Seguin residents.
| Immigration Origin | # Population | % Population |
| Africa | 265 | 0.9% |
| Argentina | 14 | 0.1% |
| Asia | 414 | 1.4% |
| Bangladesh | 96 | 0.3% |
| Brazil | 7 | 0.0% |
| Canada | 29 | 0.1% |
| Caribbean | 57 | 0.2% |
| Central America | 1,808 | 6.0% |
| China | 116 | 0.4% |
| Cuba | 52 | 0.2% |
| Eastern Africa | 182 | 0.6% |
| Eastern Asia | 153 | 0.5% |
| Eastern Europe | 32 | 0.1% |
| Egypt | 1 | 0.0% |
| El Salvador | 266 | 0.9% |
| Ethiopia | 45 | 0.2% |
| Europe | 132 | 0.4% |
| Germany | 24 | 0.1% |
| Ghana | 69 | 0.2% |
| Honduras | 73 | 0.2% |
| India | 120 | 0.4% |
| Iran | 21 | 0.1% |
| Jamaica | 5 | 0.0% |
| Korea | 37 | 0.1% |
| Latin America | 1,886 | 6.2% |
| Mexico | 1,469 | 4.9% |
| Northern Africa | 1 | 0.0% |
| Northern Europe | 70 | 0.2% |
| Norway | 60 | 0.2% |
| Philippines | 24 | 0.1% |
| Russia | 32 | 0.1% |
| South Africa | 13 | 0.0% |
| South America | 21 | 0.1% |
| South Central Asia | 237 | 0.8% |
| South Eastern Asia | 24 | 0.1% |
| Southern Europe | 6 | 0.0% |
| Spain | 6 | 0.0% |
| Western Africa | 69 | 0.2% |
| Western Europe | 24 | 0.1% | View All 39 Rows |
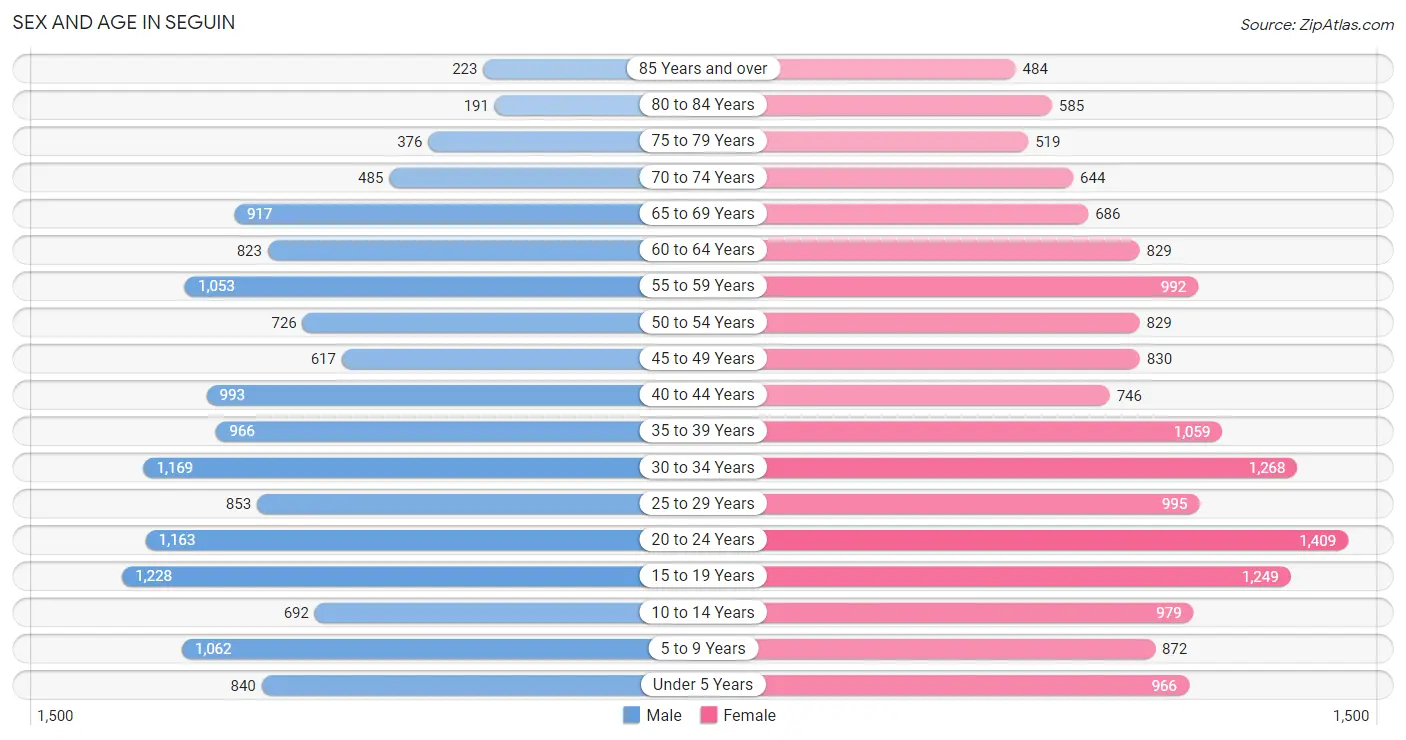
Sex and Age in Seguin
Sex and Age in Seguin
The most populous age groups in Seguin are 15 to 19 Years (1,228 | 8.5%) for men and 20 to 24 Years (1,409 | 8.8%) for women.
| Age Bracket | Male | Female |
| Under 5 Years | 840 (5.8%) | 966 (6.1%) |
| 5 to 9 Years | 1,062 (7.4%) | 872 (5.5%) |
| 10 to 14 Years | 692 (4.8%) | 979 (6.1%) |
| 15 to 19 Years | 1,228 (8.5%) | 1,249 (7.8%) |
| 20 to 24 Years | 1,163 (8.1%) | 1,409 (8.8%) |
| 25 to 29 Years | 853 (5.9%) | 995 (6.2%) |
| 30 to 34 Years | 1,169 (8.1%) | 1,268 (8.0%) |
| 35 to 39 Years | 966 (6.7%) | 1,059 (6.6%) |
| 40 to 44 Years | 993 (6.9%) | 746 (4.7%) |
| 45 to 49 Years | 617 (4.3%) | 830 (5.2%) |
| 50 to 54 Years | 726 (5.1%) | 829 (5.2%) |
| 55 to 59 Years | 1,053 (7.3%) | 992 (6.2%) |
| 60 to 64 Years | 823 (5.7%) | 829 (5.2%) |
| 65 to 69 Years | 917 (6.4%) | 686 (4.3%) |
| 70 to 74 Years | 485 (3.4%) | 644 (4.0%) |
| 75 to 79 Years | 376 (2.6%) | 519 (3.3%) |
| 80 to 84 Years | 191 (1.3%) | 585 (3.7%) |
| 85 Years and over | 223 (1.5%) | 484 (3.0%) |
| Total | 14,377 (100.0%) | 15,941 (100.0%) |
Families and Households in Seguin
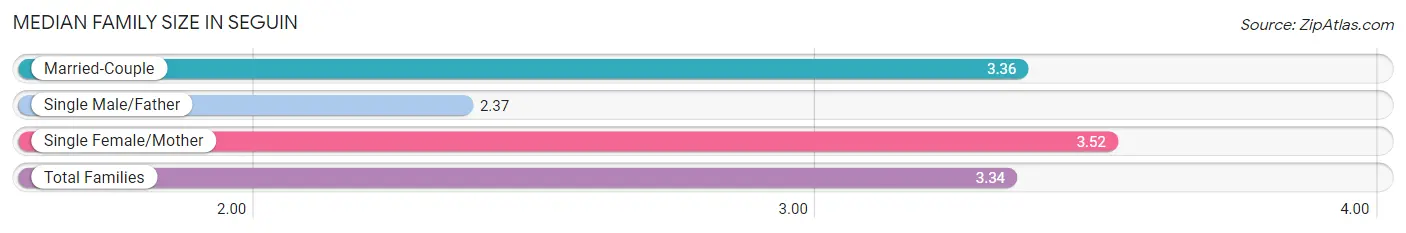
Median Family Size in Seguin
The median family size in Seguin is 3.34 persons per family, with single female/mother families (2,128 | 31.6%) accounting for the largest median family size of 3.52 persons per family. On the other hand, single male/father families (479 | 7.1%) represent the smallest median family size with 2.37 persons per family.
| Family Type | # Families | Family Size |
| Married-Couple | 4,137 (61.3%) | 3.36 |
| Single Male/Father | 479 (7.1%) | 2.37 |
| Single Female/Mother | 2,128 (31.6%) | 3.52 |
| Total Families | 6,744 (100.0%) | 3.34 |
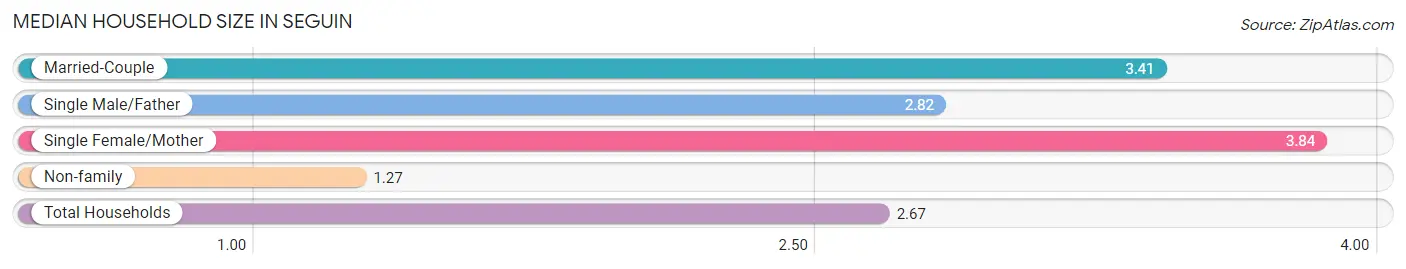
Median Household Size in Seguin
The median household size in Seguin is 2.67 persons per household, with single female/mother households (2,128 | 19.7%) accounting for the largest median household size of 3.84 persons per household. non-family households (4,042 | 37.5%) represent the smallest median household size with 1.27 persons per household.
| Household Type | # Households | Household Size |
| Married-Couple | 4,137 (38.4%) | 3.41 |
| Single Male/Father | 479 (4.4%) | 2.82 |
| Single Female/Mother | 2,128 (19.7%) | 3.84 |
| Non-family | 4,042 (37.5%) | 1.27 |
| Total Households | 10,786 (100.0%) | 2.67 |
Household Size by Marriage Status in Seguin
Out of a total of 10,786 households in Seguin, 6,744 (62.5%) are family households, while 4,042 (37.5%) are nonfamily households. The most numerous type of family households are 2-person households, comprising 2,554, and the most common type of nonfamily households are 1-person households, comprising 3,197.
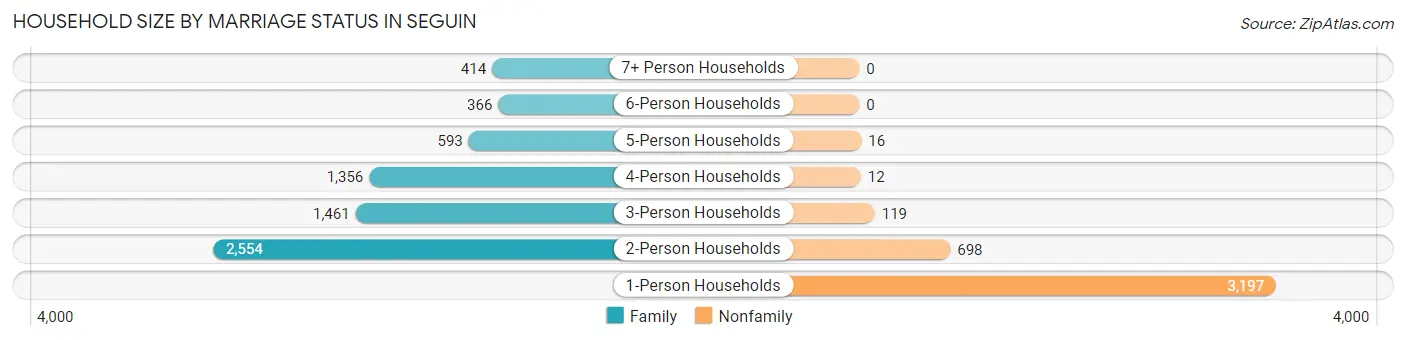
| Household Size | Family Households | Nonfamily Households |
| 1-Person Households | - | 3,197 (29.6%) |
| 2-Person Households | 2,554 (23.7%) | 698 (6.5%) |
| 3-Person Households | 1,461 (13.6%) | 119 (1.1%) |
| 4-Person Households | 1,356 (12.6%) | 12 (0.1%) |
| 5-Person Households | 593 (5.5%) | 16 (0.2%) |
| 6-Person Households | 366 (3.4%) | 0 (0.0%) |
| 7+ Person Households | 414 (3.8%) | 0 (0.0%) |
| Total | 6,744 (62.5%) | 4,042 (37.5%) |
Female Fertility in Seguin
Fertility by Age in Seguin
Average fertility rate in Seguin is 74.0 births per 1,000 women. Women in the age bracket of 20 to 34 years have the highest fertility rate with 124.0 births per 1,000 women. Women in the age bracket of 20 to 34 years acount for 79.5% of all women with births.
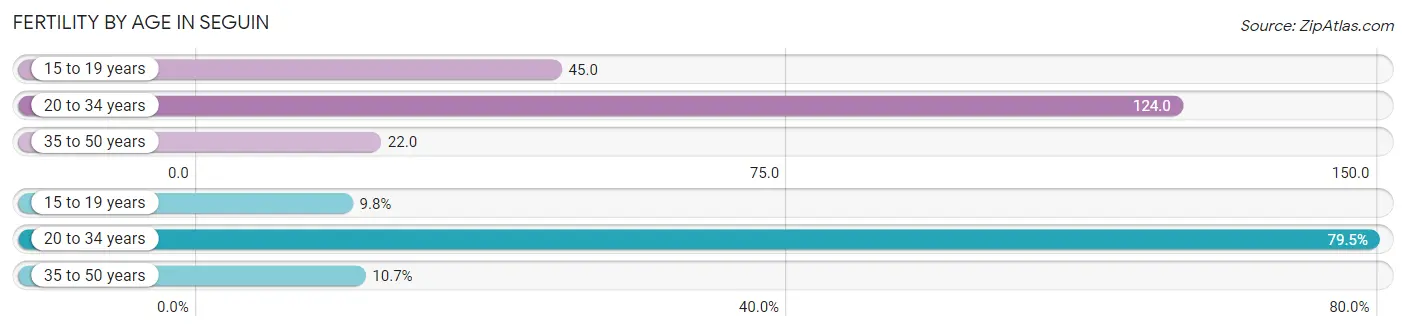
| Age Bracket | Women with Births | Births / 1,000 Women |
| 15 to 19 years | 56 (9.8%) | 45.0 |
| 20 to 34 years | 454 (79.5%) | 124.0 |
| 35 to 50 years | 61 (10.7%) | 22.0 |
| Total | 571 (100.0%) | 74.0 |
Fertility by Age by Marriage Status in Seguin
66.2% of women with births (571) in Seguin are married. The highest percentage of unmarried women with births falls into 15 to 19 years age bracket with 100.0% of them unmarried at the time of birth, while the lowest percentage of unmarried women with births belong to 20 to 34 years age bracket with 25.8% of them unmarried.
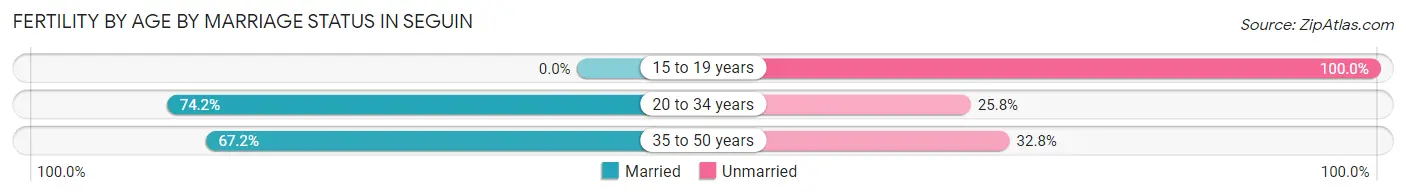
| Age Bracket | Married | Unmarried |
| 15 to 19 years | 0 (0.0%) | 56 (100.0%) |
| 20 to 34 years | 337 (74.2%) | 117 (25.8%) |
| 35 to 50 years | 41 (67.2%) | 20 (32.8%) |
| Total | 378 (66.2%) | 193 (33.8%) |
Fertility by Education in Seguin
Average fertility rate in Seguin is 74.0 births per 1,000 women. Women with the education attainment of bachelor's degree have the highest fertility rate of 214.0 births per 1,000 women, while women with the education attainment of college or associate's degree have the lowest fertility at 16.0 births per 1,000 women. Women with the education attainment of bachelor's degree represent 36.6% of all women with births.
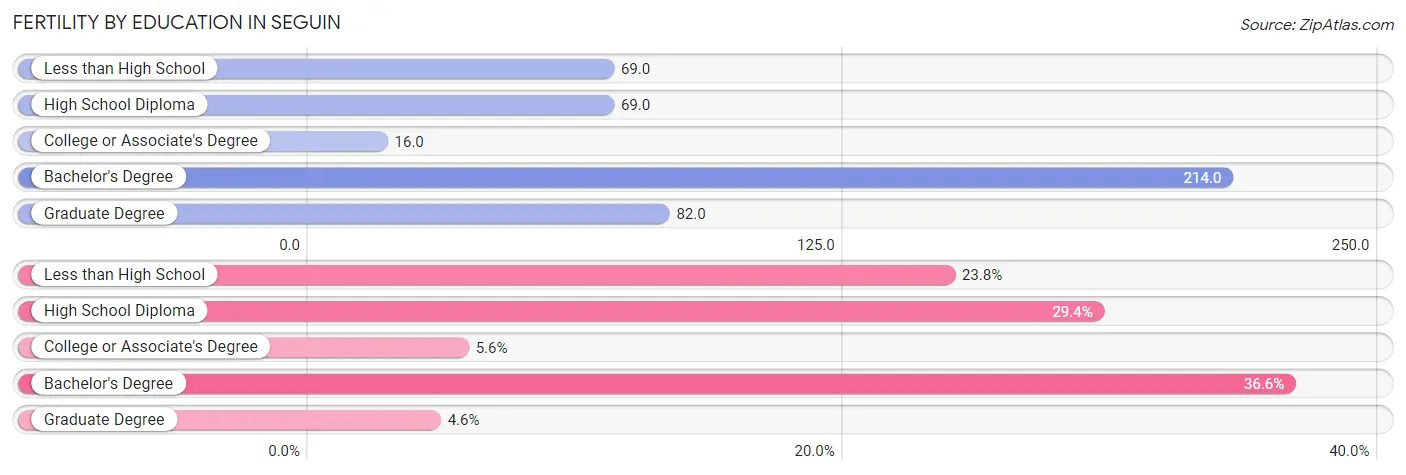
| Educational Attainment | Women with Births | Births / 1,000 Women |
| Less than High School | 136 (23.8%) | 69.0 |
| High School Diploma | 168 (29.4%) | 69.0 |
| College or Associate's Degree | 32 (5.6%) | 16.0 |
| Bachelor's Degree | 209 (36.6%) | 214.0 |
| Graduate Degree | 26 (4.5%) | 82.0 |
| Total | 571 (100.0%) | 74.0 |
Fertility by Education by Marriage Status in Seguin
33.8% of women with births in Seguin are unmarried. Women with the educational attainment of college or associate's degree are most likely to be married with 100.0% of them married at childbirth, while women with the educational attainment of high school diploma are least likely to be married with 74.4% of them unmarried at childbirth.
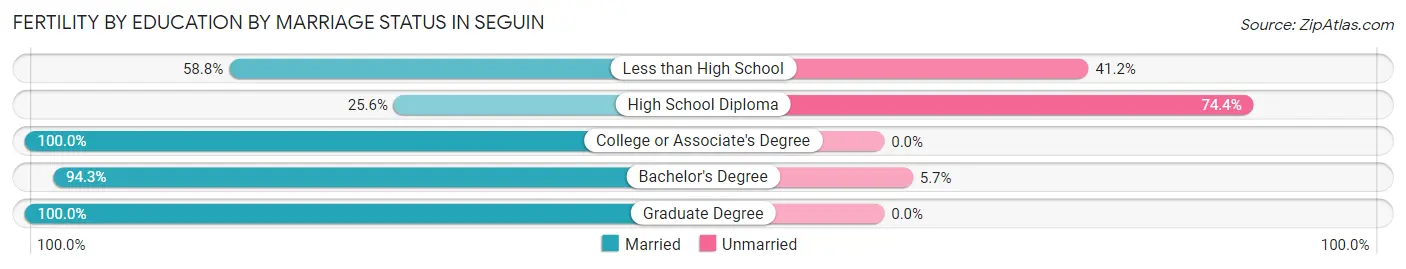
| Educational Attainment | Married | Unmarried |
| Less than High School | 80 (58.8%) | 56 (41.2%) |
| High School Diploma | 43 (25.6%) | 125 (74.4%) |
| College or Associate's Degree | 32 (100.0%) | 0 (0.0%) |
| Bachelor's Degree | 197 (94.3%) | 12 (5.7%) |
| Graduate Degree | 26 (100.0%) | 0 (0.0%) |
| Total | 378 (66.2%) | 193 (33.8%) |
Employment Characteristics in Seguin
Employment by Class of Employer in Seguin
Among the 13,828 employed individuals in Seguin, private company employees (10,248 | 74.1%), local government employees (1,169 | 8.5%), and self-employed (not incorporated) (1,079 | 7.8%) make up the most common classes of employment.
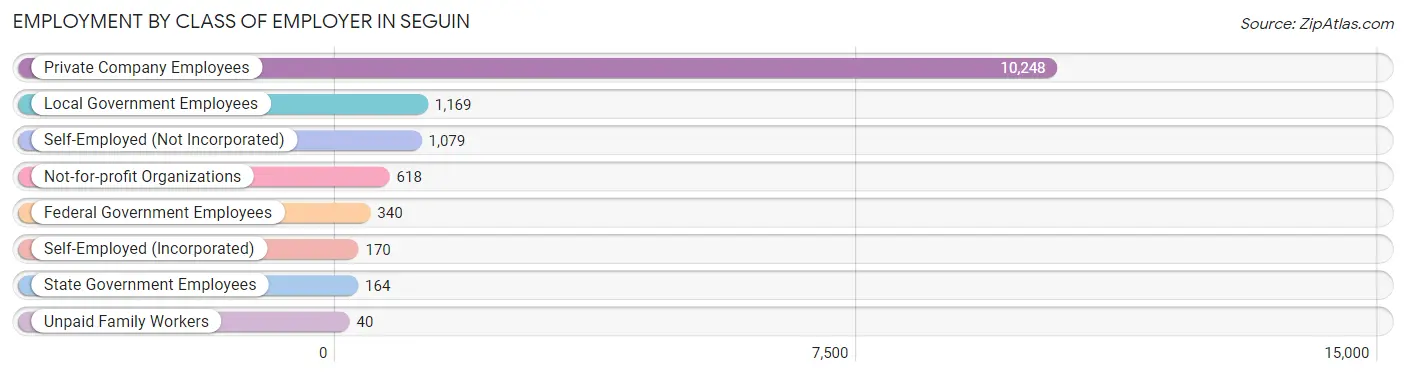
| Employer Class | # Employees | % Employees |
| Private Company Employees | 10,248 | 74.1% |
| Self-Employed (Incorporated) | 170 | 1.2% |
| Self-Employed (Not Incorporated) | 1,079 | 7.8% |
| Not-for-profit Organizations | 618 | 4.5% |
| Local Government Employees | 1,169 | 8.5% |
| State Government Employees | 164 | 1.2% |
| Federal Government Employees | 340 | 2.5% |
| Unpaid Family Workers | 40 | 0.3% |
| Total | 13,828 | 100.0% |
Employment Status by Age in Seguin
According to the labor force statistics for Seguin, out of the total population over 16 years of age (24,529), 59.7% or 14,644 individuals are in the labor force, with 4.4% or 644 of them unemployed. The age group with the highest labor force participation rate is 45 to 54 years, with 83.6% or 2,510 individuals in the labor force. Within the labor force, the 16 to 19 years age range has the highest percentage of unemployed individuals, with 14.2% or 103 of them being unemployed.
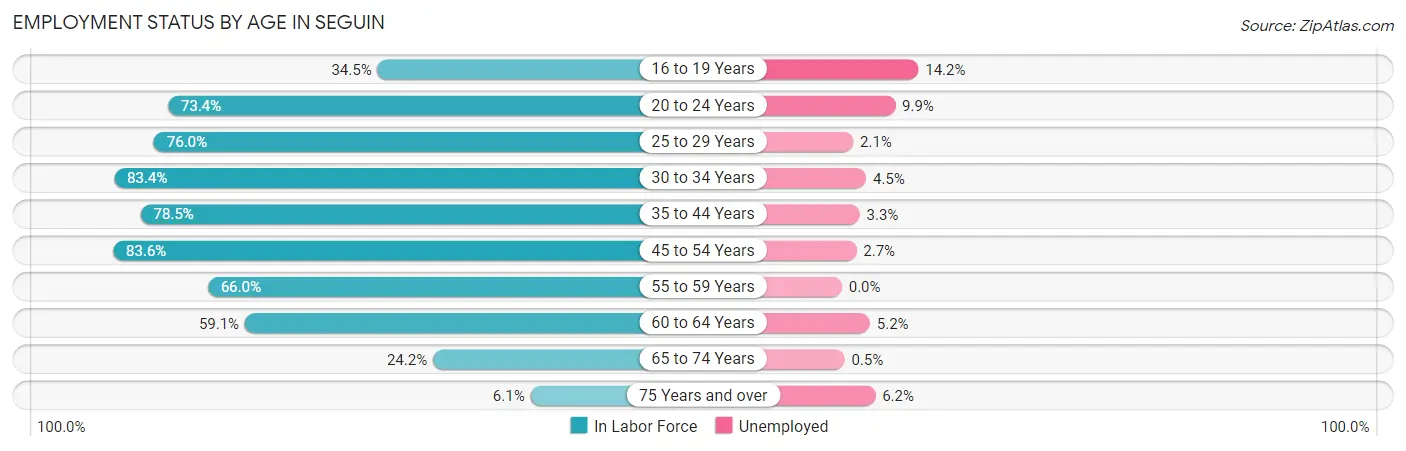
| Age Bracket | In Labor Force | Unemployed |
| 16 to 19 Years | 724 (34.5%) | 103 (14.2%) |
| 20 to 24 Years | 1,888 (73.4%) | 187 (9.9%) |
| 25 to 29 Years | 1,404 (76.0%) | 29 (2.1%) |
| 30 to 34 Years | 2,032 (83.4%) | 91 (4.5%) |
| 35 to 44 Years | 2,955 (78.5%) | 98 (3.3%) |
| 45 to 54 Years | 2,510 (83.6%) | 68 (2.7%) |
| 55 to 59 Years | 1,350 (66.0%) | 0 (0.0%) |
| 60 to 64 Years | 976 (59.1%) | 51 (5.2%) |
| 65 to 74 Years | 661 (24.2%) | 3 (0.5%) |
| 75 Years and over | 145 (6.1%) | 9 (6.2%) |
| Total | 14,644 (59.7%) | 644 (4.4%) |
Employment Status by Educational Attainment in Seguin
According to labor force statistics for Seguin, 76.2% of individuals (11,238) out of the total population between 25 and 64 years of age (14,748) are in the labor force, with 3.0% or 337 of them being unemployed. The group with the highest labor force participation rate are those with the educational attainment of bachelor's degree or higher, with 84.1% or 2,122 individuals in the labor force. Within the labor force, individuals with high school diploma education have the highest percentage of unemployment, with 4.7% or 224 of them being unemployed.
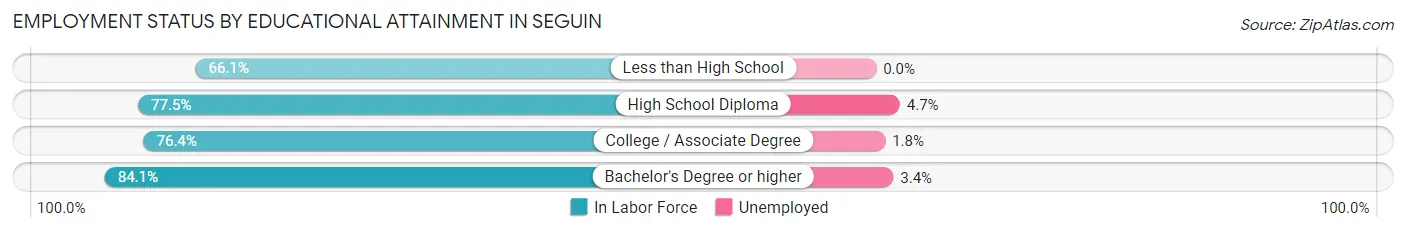
| Educational Attainment | In Labor Force | Unemployed |
| Less than High School | 1,925 (66.1%) | 0 (0.0%) |
| High School Diploma | 4,765 (77.5%) | 289 (4.7%) |
| College / Associate Degree | 2,417 (76.4%) | 57 (1.8%) |
| Bachelor's Degree or higher | 2,122 (84.1%) | 86 (3.4%) |
| Total | 11,238 (76.2%) | 442 (3.0%) |
Employment Occupations by Sex in Seguin
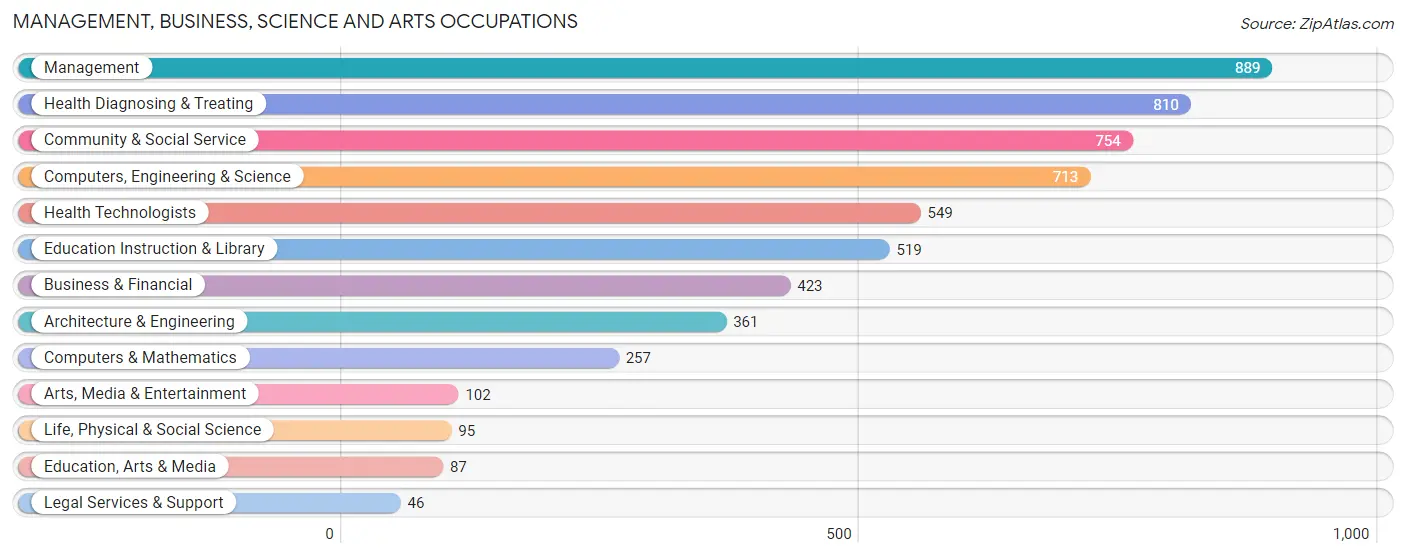
Management, Business, Science and Arts Occupations
The most common Management, Business, Science and Arts occupations in Seguin are Management (889 | 6.4%), Health Diagnosing & Treating (810 | 5.8%), Community & Social Service (754 | 5.4%), Computers, Engineering & Science (713 | 5.1%), and Health Technologists (549 | 3.9%).
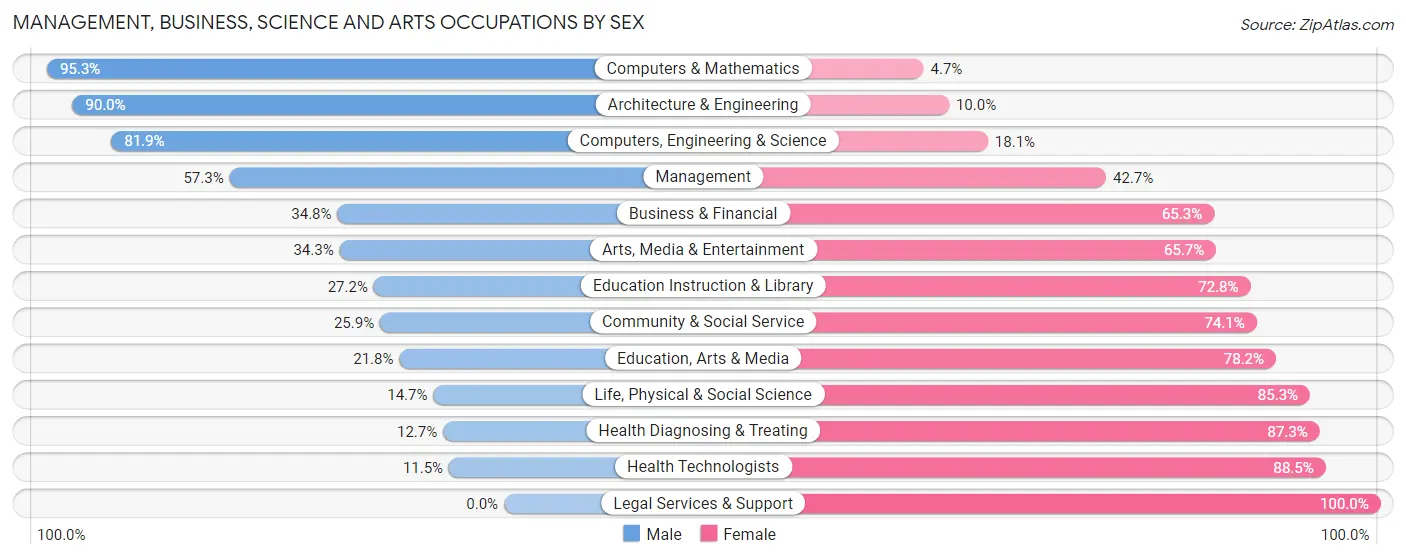
Management, Business, Science and Arts Occupations by Sex
Within the Management, Business, Science and Arts occupations in Seguin, the most male-oriented occupations are Computers & Mathematics (95.3%), Architecture & Engineering (90.0%), and Computers, Engineering & Science (81.9%), while the most female-oriented occupations are Legal Services & Support (100.0%), Health Technologists (88.5%), and Health Diagnosing & Treating (87.3%).
| Occupation | Male | Female |
| Management | 509 (57.3%) | 380 (42.7%) |
| Business & Financial | 147 (34.7%) | 276 (65.2%) |
| Computers, Engineering & Science | 584 (81.9%) | 129 (18.1%) |
| Computers & Mathematics | 245 (95.3%) | 12 (4.7%) |
| Architecture & Engineering | 325 (90.0%) | 36 (10.0%) |
| Life, Physical & Social Science | 14 (14.7%) | 81 (85.3%) |
| Community & Social Service | 195 (25.9%) | 559 (74.1%) |
| Education, Arts & Media | 19 (21.8%) | 68 (78.2%) |
| Legal Services & Support | 0 (0.0%) | 46 (100.0%) |
| Education Instruction & Library | 141 (27.2%) | 378 (72.8%) |
| Arts, Media & Entertainment | 35 (34.3%) | 67 (65.7%) |
| Health Diagnosing & Treating | 103 (12.7%) | 707 (87.3%) |
| Health Technologists | 63 (11.5%) | 486 (88.5%) |
| Total (Category) | 1,538 (42.8%) | 2,051 (57.2%) |
| Total (Overall) | 7,135 (50.9%) | 6,869 (49.0%) |
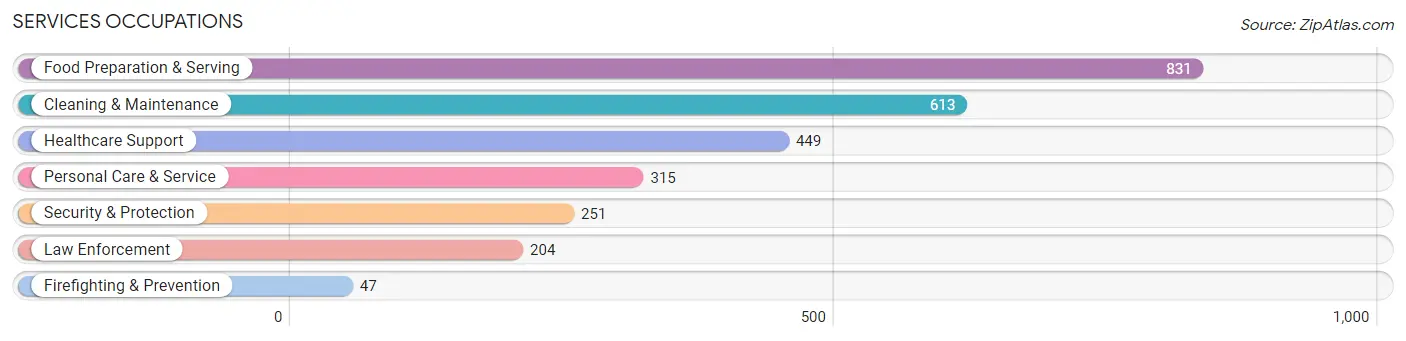
Services Occupations
The most common Services occupations in Seguin are Food Preparation & Serving (831 | 5.9%), Cleaning & Maintenance (613 | 4.4%), Healthcare Support (449 | 3.2%), Personal Care & Service (315 | 2.2%), and Security & Protection (251 | 1.8%).
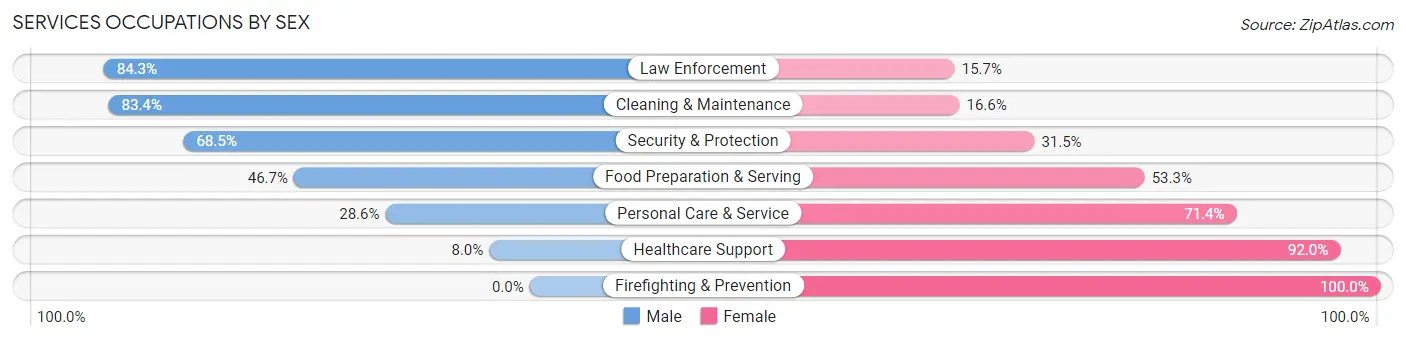
Services Occupations by Sex
Within the Services occupations in Seguin, the most male-oriented occupations are Law Enforcement (84.3%), Cleaning & Maintenance (83.4%), and Security & Protection (68.5%), while the most female-oriented occupations are Firefighting & Prevention (100.0%), Healthcare Support (92.0%), and Personal Care & Service (71.4%).
| Occupation | Male | Female |
| Healthcare Support | 36 (8.0%) | 413 (92.0%) |
| Security & Protection | 172 (68.5%) | 79 (31.5%) |
| Firefighting & Prevention | 0 (0.0%) | 47 (100.0%) |
| Law Enforcement | 172 (84.3%) | 32 (15.7%) |
| Food Preparation & Serving | 388 (46.7%) | 443 (53.3%) |
| Cleaning & Maintenance | 511 (83.4%) | 102 (16.6%) |
| Personal Care & Service | 90 (28.6%) | 225 (71.4%) |
| Total (Category) | 1,197 (48.7%) | 1,262 (51.3%) |
| Total (Overall) | 7,135 (50.9%) | 6,869 (49.0%) |
Sales and Office Occupations
The most common Sales and Office occupations in Seguin are Office & Administration (2,264 | 16.2%), and Sales & Related (1,442 | 10.3%).

Sales and Office Occupations by Sex
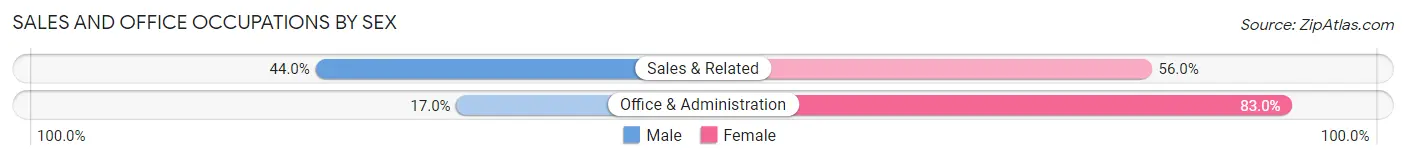
| Occupation | Male | Female |
| Sales & Related | 635 (44.0%) | 807 (56.0%) |
| Office & Administration | 384 (17.0%) | 1,880 (83.0%) |
| Total (Category) | 1,019 (27.5%) | 2,687 (72.5%) |
| Total (Overall) | 7,135 (50.9%) | 6,869 (49.0%) |
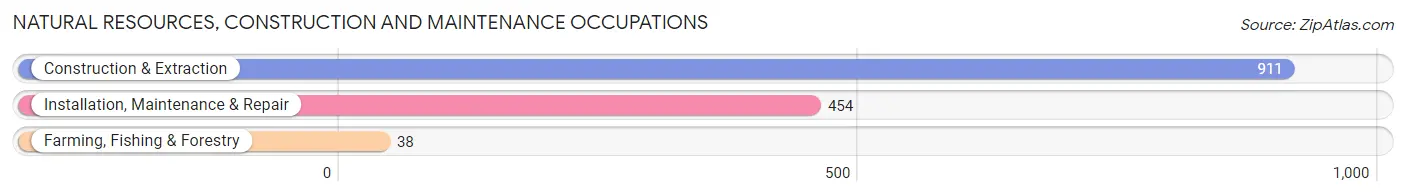
Natural Resources, Construction and Maintenance Occupations
The most common Natural Resources, Construction and Maintenance occupations in Seguin are Construction & Extraction (911 | 6.5%), Installation, Maintenance & Repair (454 | 3.2%), and Farming, Fishing & Forestry (38 | 0.3%).
Natural Resources, Construction and Maintenance Occupations by Sex
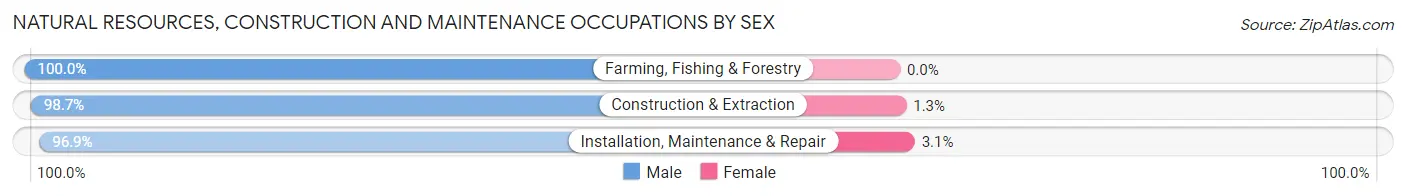
| Occupation | Male | Female |
| Farming, Fishing & Forestry | 38 (100.0%) | 0 (0.0%) |
| Construction & Extraction | 899 (98.7%) | 12 (1.3%) |
| Installation, Maintenance & Repair | 440 (96.9%) | 14 (3.1%) |
| Total (Category) | 1,377 (98.2%) | 26 (1.8%) |
| Total (Overall) | 7,135 (50.9%) | 6,869 (49.0%) |
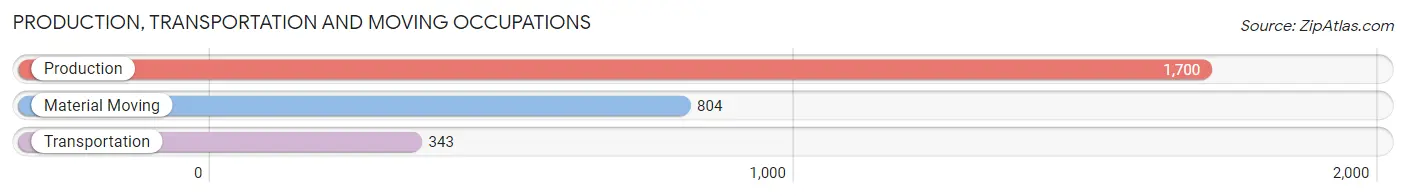
Production, Transportation and Moving Occupations
The most common Production, Transportation and Moving occupations in Seguin are Production (1,700 | 12.1%), Material Moving (804 | 5.7%), and Transportation (343 | 2.5%).
Production, Transportation and Moving Occupations by Sex
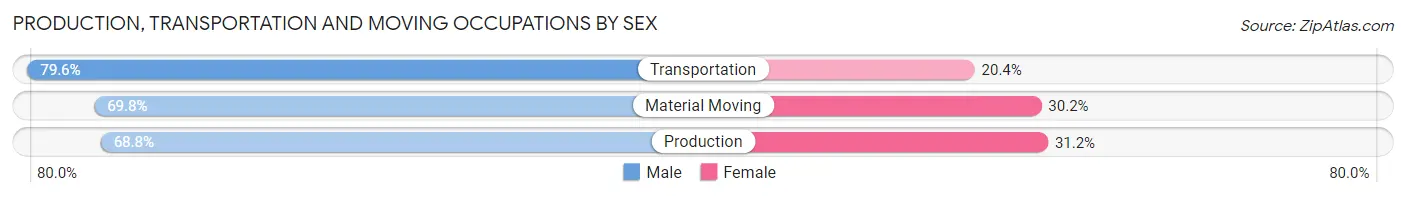
| Occupation | Male | Female |
| Production | 1,170 (68.8%) | 530 (31.2%) |
| Transportation | 273 (79.6%) | 70 (20.4%) |
| Material Moving | 561 (69.8%) | 243 (30.2%) |
| Total (Category) | 2,004 (70.4%) | 843 (29.6%) |
| Total (Overall) | 7,135 (50.9%) | 6,869 (49.0%) |
Employment Industries by Sex in Seguin
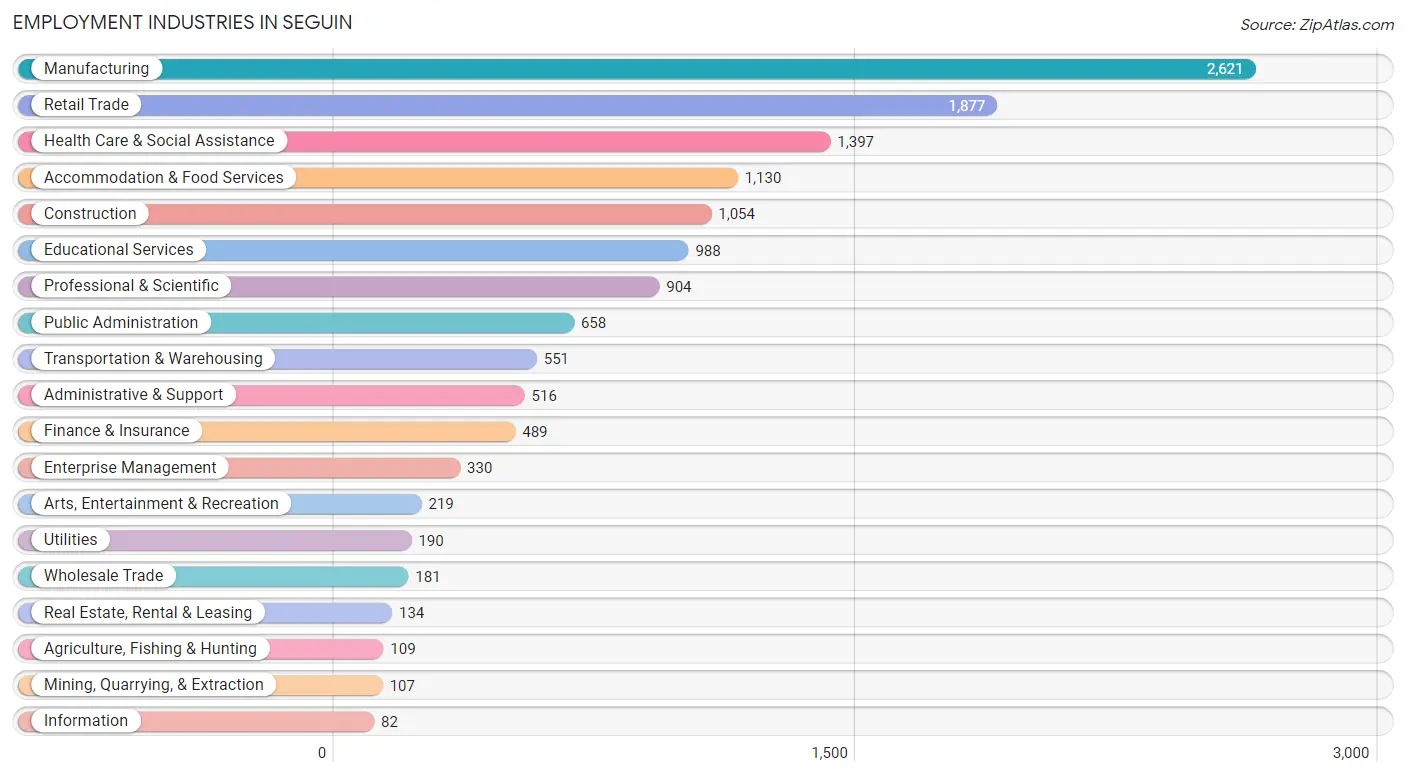
Employment Industries in Seguin
The major employment industries in Seguin include Manufacturing (2,621 | 18.7%), Retail Trade (1,877 | 13.4%), Health Care & Social Assistance (1,397 | 10.0%), Accommodation & Food Services (1,130 | 8.1%), and Construction (1,054 | 7.5%).
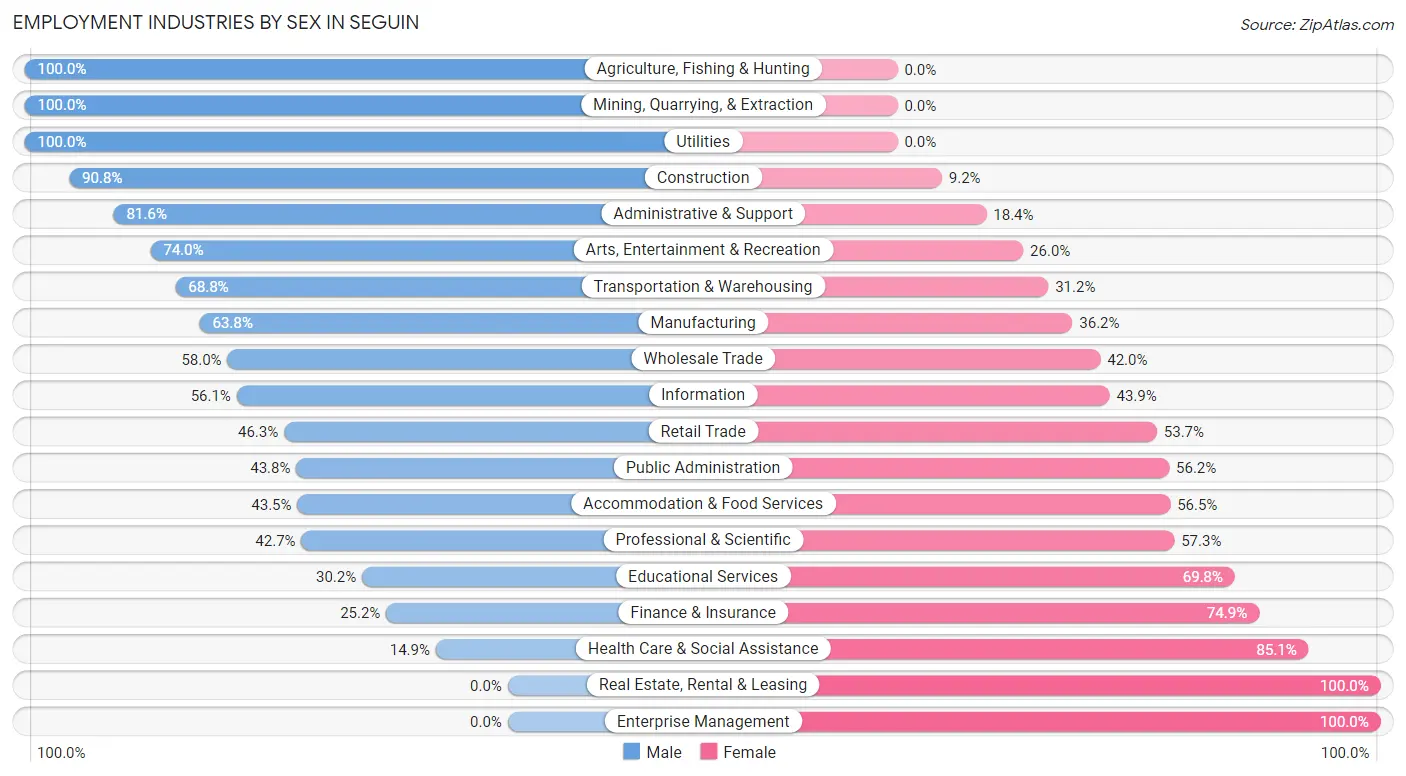
Employment Industries by Sex in Seguin
The Seguin industries that see more men than women are Agriculture, Fishing & Hunting (100.0%), Mining, Quarrying, & Extraction (100.0%), and Utilities (100.0%), whereas the industries that tend to have a higher number of women are Real Estate, Rental & Leasing (100.0%), Enterprise Management (100.0%), and Health Care & Social Assistance (85.1%).
| Industry | Male | Female |
| Agriculture, Fishing & Hunting | 109 (100.0%) | 0 (0.0%) |
| Mining, Quarrying, & Extraction | 107 (100.0%) | 0 (0.0%) |
| Construction | 957 (90.8%) | 97 (9.2%) |
| Manufacturing | 1,672 (63.8%) | 949 (36.2%) |
| Wholesale Trade | 105 (58.0%) | 76 (42.0%) |
| Retail Trade | 869 (46.3%) | 1,008 (53.7%) |
| Transportation & Warehousing | 379 (68.8%) | 172 (31.2%) |
| Utilities | 190 (100.0%) | 0 (0.0%) |
| Information | 46 (56.1%) | 36 (43.9%) |
| Finance & Insurance | 123 (25.2%) | 366 (74.9%) |
| Real Estate, Rental & Leasing | 0 (0.0%) | 134 (100.0%) |
| Professional & Scientific | 386 (42.7%) | 518 (57.3%) |
| Enterprise Management | 0 (0.0%) | 330 (100.0%) |
| Administrative & Support | 421 (81.6%) | 95 (18.4%) |
| Educational Services | 298 (30.2%) | 690 (69.8%) |
| Health Care & Social Assistance | 208 (14.9%) | 1,189 (85.1%) |
| Arts, Entertainment & Recreation | 162 (74.0%) | 57 (26.0%) |
| Accommodation & Food Services | 492 (43.5%) | 638 (56.5%) |
| Public Administration | 288 (43.8%) | 370 (56.2%) |
| Total | 7,135 (50.9%) | 6,869 (49.0%) |
Education in Seguin
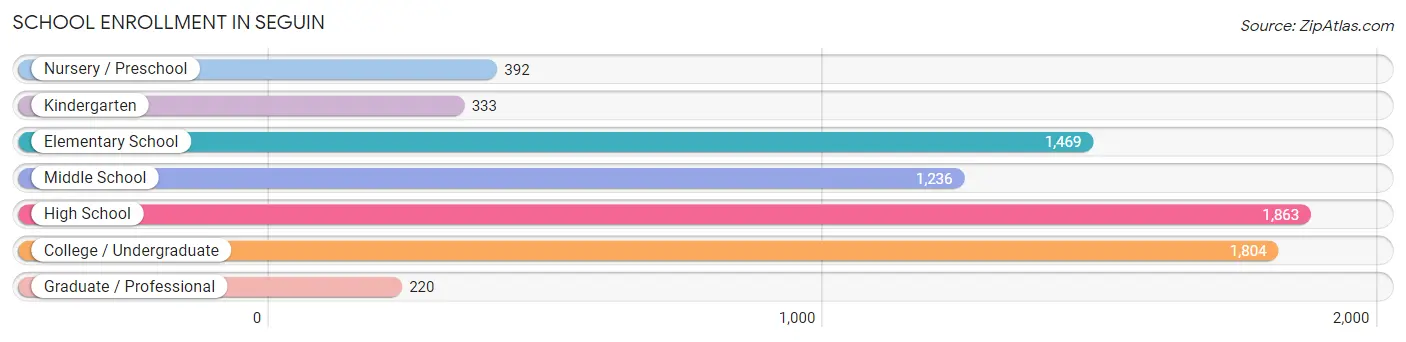
School Enrollment in Seguin
The most common levels of schooling among the 7,317 students in Seguin are high school (1,863 | 25.5%), college / undergraduate (1,804 | 24.6%), and elementary school (1,469 | 20.1%).
| School Level | # Students | % Students |
| Nursery / Preschool | 392 | 5.4% |
| Kindergarten | 333 | 4.5% |
| Elementary School | 1,469 | 20.1% |
| Middle School | 1,236 | 16.9% |
| High School | 1,863 | 25.5% |
| College / Undergraduate | 1,804 | 24.6% |
| Graduate / Professional | 220 | 3.0% |
| Total | 7,317 | 100.0% |
School Enrollment by Age by Funding Source in Seguin
Out of a total of 7,317 students who are enrolled in schools in Seguin, 1,310 (17.9%) attend a private institution, while the remaining 6,007 (82.1%) are enrolled in public schools. The age group of 18 to 19 year olds has the highest likelihood of being enrolled in private schools, with 373 (42.8% in the age bracket) enrolled. Conversely, the age group of 15 to 17 year olds has the lowest likelihood of being enrolled in a private school, with 1,094 (98.1% in the age bracket) attending a public institution.
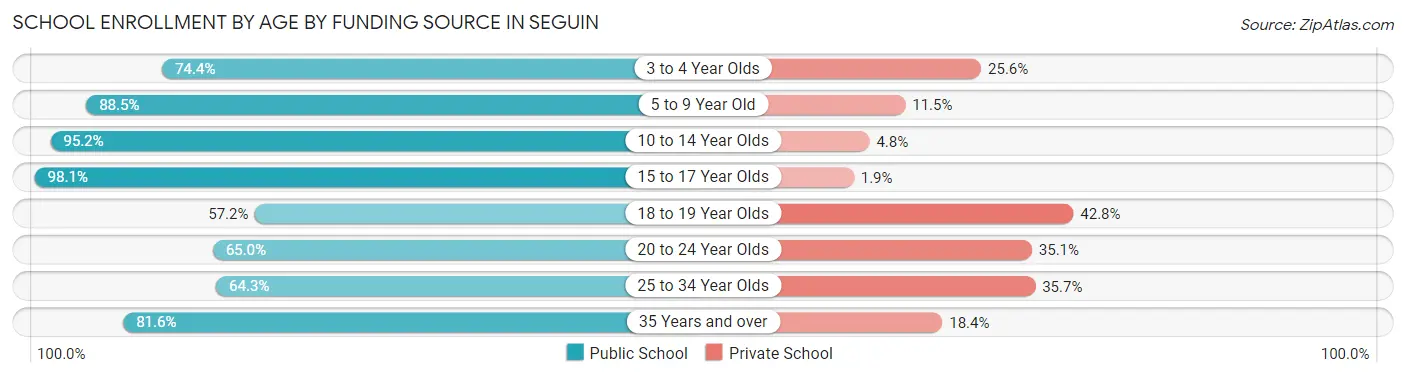
| Age Bracket | Public School | Private School |
| 3 to 4 Year Olds | 247 (74.4%) | 85 (25.6%) |
| 5 to 9 Year Old | 1,450 (88.5%) | 188 (11.5%) |
| 10 to 14 Year Olds | 1,566 (95.2%) | 79 (4.8%) |
| 15 to 17 Year Olds | 1,094 (98.1%) | 21 (1.9%) |
| 18 to 19 Year Olds | 499 (57.2%) | 373 (42.8%) |
| 20 to 24 Year Olds | 669 (64.9%) | 361 (35.0%) |
| 25 to 34 Year Olds | 283 (64.3%) | 157 (35.7%) |
| 35 Years and over | 200 (81.6%) | 45 (18.4%) |
| Total | 6,007 (82.1%) | 1,310 (17.9%) |
Educational Attainment by Field of Study in Seguin
Education (691 | 17.8%), business (505 | 13.0%), science & technology (473 | 12.2%), arts & humanities (379 | 9.8%), and engineering (309 | 8.0%) are the most common fields of study among 3,889 individuals in Seguin who have obtained a bachelor's degree or higher.
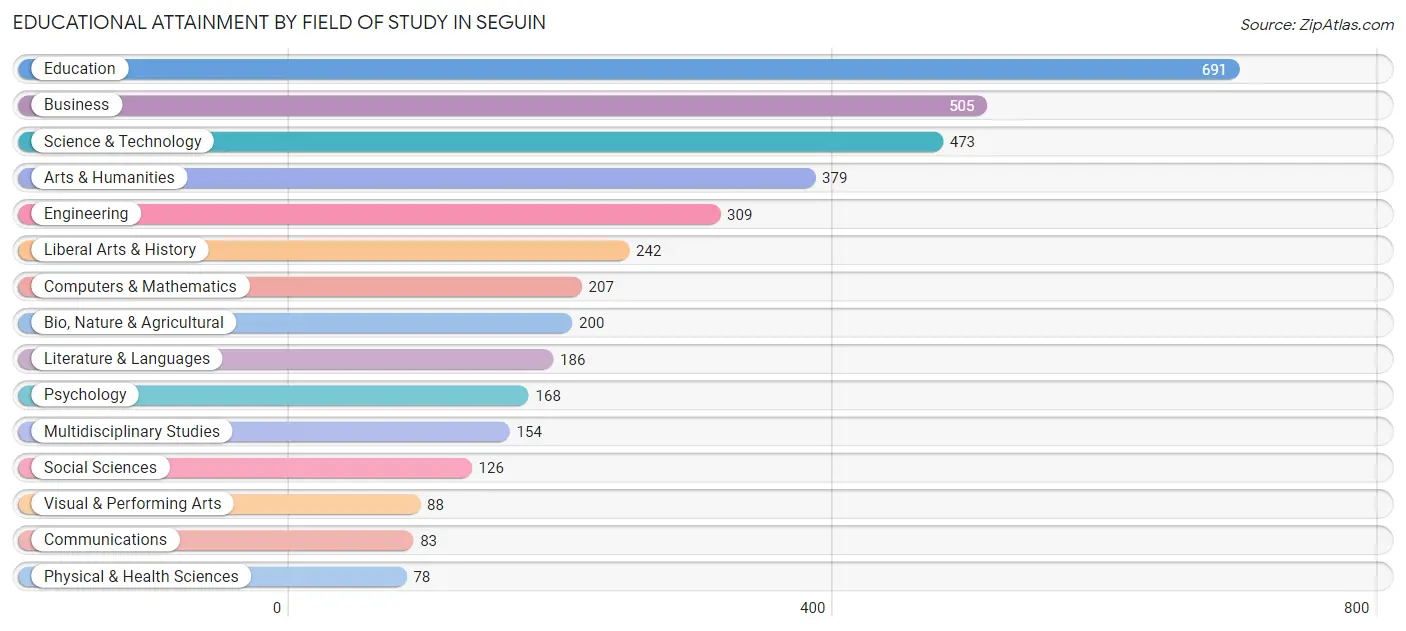
| Field of Study | # Graduates | % Graduates |
| Computers & Mathematics | 207 | 5.3% |
| Bio, Nature & Agricultural | 200 | 5.1% |
| Physical & Health Sciences | 78 | 2.0% |
| Psychology | 168 | 4.3% |
| Social Sciences | 126 | 3.2% |
| Engineering | 309 | 8.0% |
| Multidisciplinary Studies | 154 | 4.0% |
| Science & Technology | 473 | 12.2% |
| Business | 505 | 13.0% |
| Education | 691 | 17.8% |
| Literature & Languages | 186 | 4.8% |
| Liberal Arts & History | 242 | 6.2% |
| Visual & Performing Arts | 88 | 2.3% |
| Communications | 83 | 2.1% |
| Arts & Humanities | 379 | 9.8% |
| Total | 3,889 | 100.0% |
Transportation & Commute in Seguin
Vehicle Availability by Sex in Seguin
The most prevalent vehicle ownership categories in Seguin are males with 2 vehicles (2,943, accounting for 42.0%) and females with 2 vehicles (2,865, making up 44.3%).
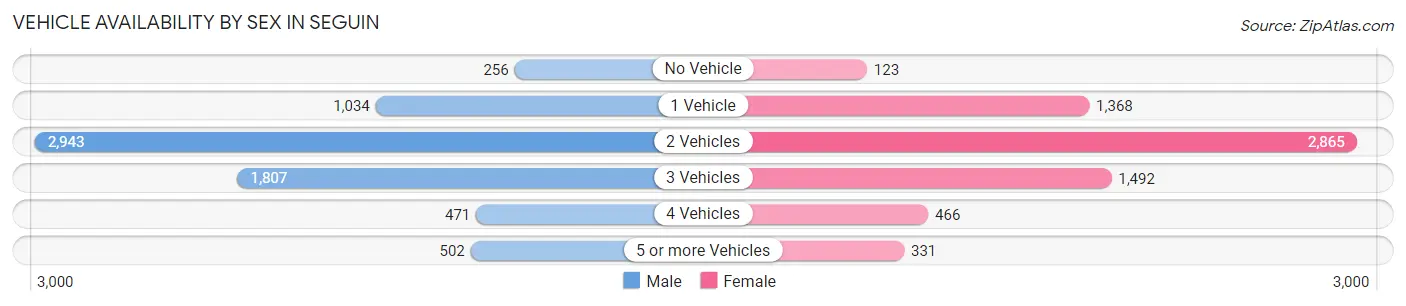
| Vehicles Available | Male | Female |
| No Vehicle | 256 (3.6%) | 123 (1.8%) |
| 1 Vehicle | 1,034 (14.7%) | 1,368 (20.6%) |
| 2 Vehicles | 2,943 (42.0%) | 2,865 (43.1%) |
| 3 Vehicles | 1,807 (25.8%) | 1,492 (22.5%) |
| 4 Vehicles | 471 (6.7%) | 466 (7.0%) |
| 5 or more Vehicles | 502 (7.2%) | 331 (5.0%) |
| Total | 7,013 (100.0%) | 6,645 (100.0%) |
Commute Time in Seguin
The most frequently occuring commute durations in Seguin are 10 to 14 minutes (3,619 commuters, 27.7%), 15 to 19 minutes (2,057 commuters, 15.8%), and 5 to 9 minutes (1,884 commuters, 14.4%).
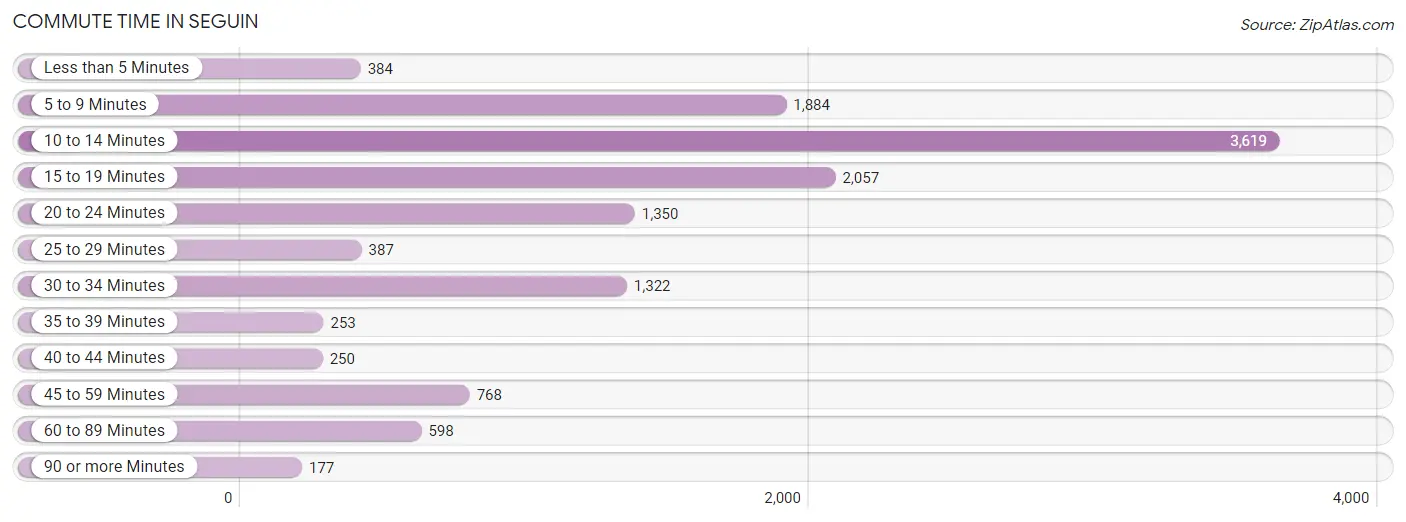
| Commute Time | # Commuters | % Commuters |
| Less than 5 Minutes | 384 | 2.9% |
| 5 to 9 Minutes | 1,884 | 14.4% |
| 10 to 14 Minutes | 3,619 | 27.7% |
| 15 to 19 Minutes | 2,057 | 15.8% |
| 20 to 24 Minutes | 1,350 | 10.3% |
| 25 to 29 Minutes | 387 | 3.0% |
| 30 to 34 Minutes | 1,322 | 10.1% |
| 35 to 39 Minutes | 253 | 1.9% |
| 40 to 44 Minutes | 250 | 1.9% |
| 45 to 59 Minutes | 768 | 5.9% |
| 60 to 89 Minutes | 598 | 4.6% |
| 90 or more Minutes | 177 | 1.4% |
Commute Time by Sex in Seguin
The most common commute times in Seguin are 10 to 14 minutes (1,690 commuters, 25.7%) for males and 10 to 14 minutes (1,929 commuters, 29.8%) for females.
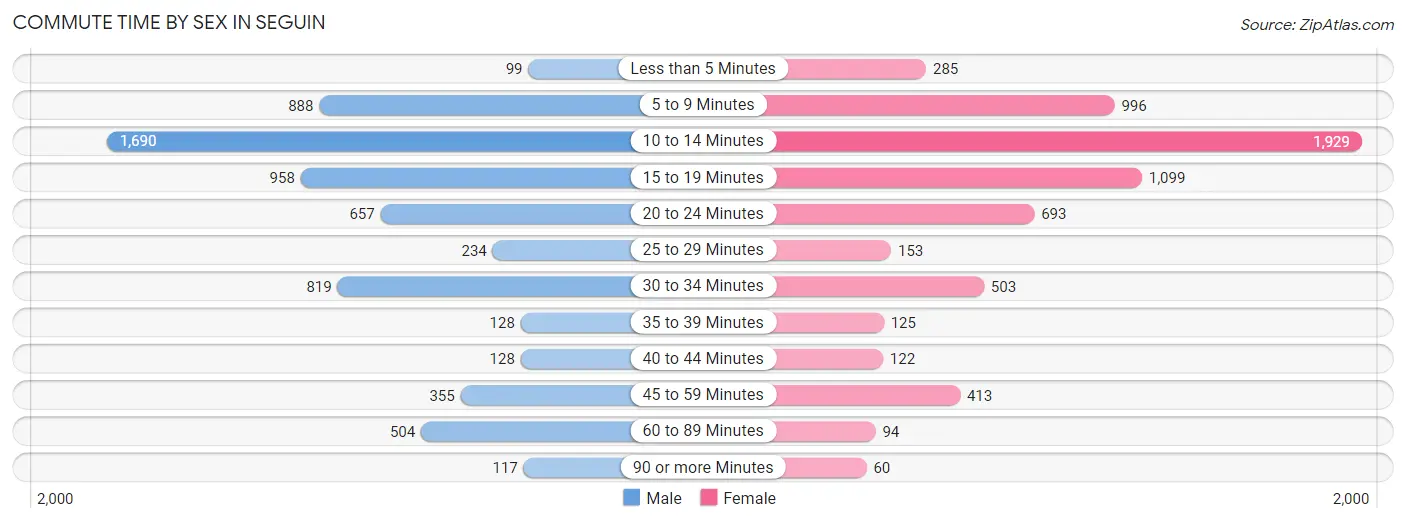
| Commute Time | Male | Female |
| Less than 5 Minutes | 99 (1.5%) | 285 (4.4%) |
| 5 to 9 Minutes | 888 (13.5%) | 996 (15.4%) |
| 10 to 14 Minutes | 1,690 (25.7%) | 1,929 (29.8%) |
| 15 to 19 Minutes | 958 (14.6%) | 1,099 (17.0%) |
| 20 to 24 Minutes | 657 (10.0%) | 693 (10.7%) |
| 25 to 29 Minutes | 234 (3.6%) | 153 (2.4%) |
| 30 to 34 Minutes | 819 (12.4%) | 503 (7.8%) |
| 35 to 39 Minutes | 128 (1.9%) | 125 (1.9%) |
| 40 to 44 Minutes | 128 (1.9%) | 122 (1.9%) |
| 45 to 59 Minutes | 355 (5.4%) | 413 (6.4%) |
| 60 to 89 Minutes | 504 (7.7%) | 94 (1.5%) |
| 90 or more Minutes | 117 (1.8%) | 60 (0.9%) |
Time of Departure to Work by Sex in Seguin
The most frequent times of departure to work in Seguin are 7:00 AM to 7:29 AM (963, 14.6%) for males and 8:00 AM to 8:29 AM (882, 13.6%) for females.
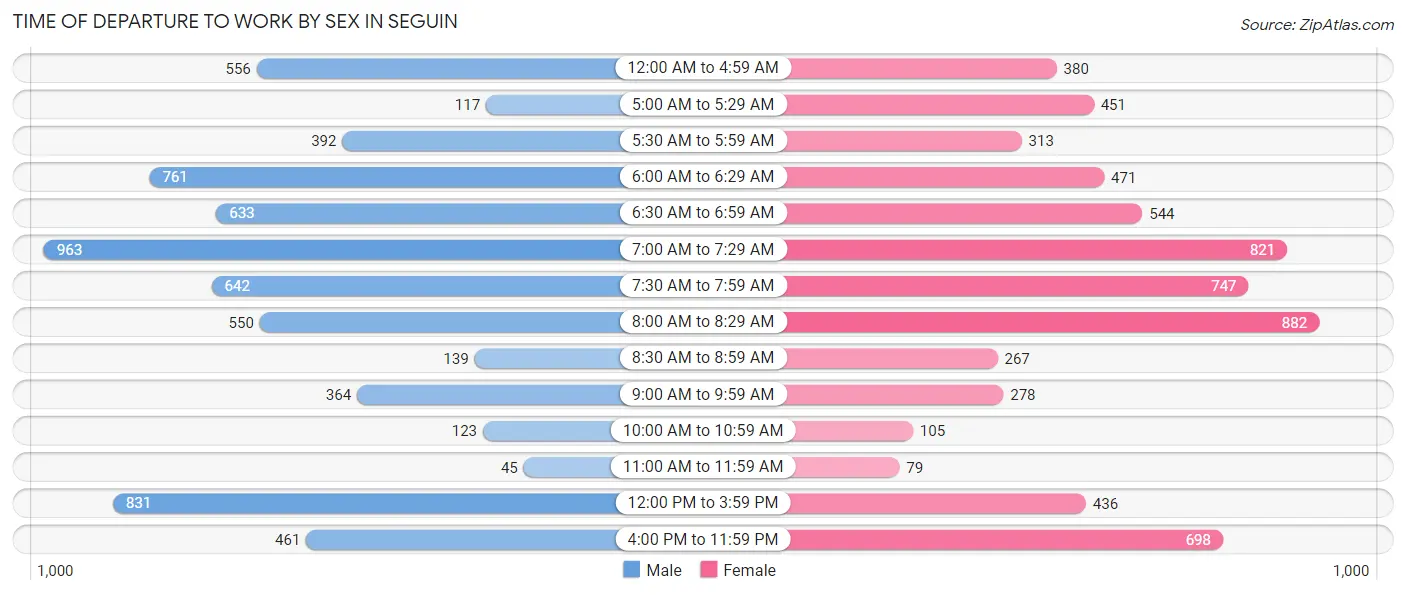
| Time of Departure | Male | Female |
| 12:00 AM to 4:59 AM | 556 (8.5%) | 380 (5.9%) |
| 5:00 AM to 5:29 AM | 117 (1.8%) | 451 (7.0%) |
| 5:30 AM to 5:59 AM | 392 (6.0%) | 313 (4.8%) |
| 6:00 AM to 6:29 AM | 761 (11.6%) | 471 (7.3%) |
| 6:30 AM to 6:59 AM | 633 (9.6%) | 544 (8.4%) |
| 7:00 AM to 7:29 AM | 963 (14.6%) | 821 (12.7%) |
| 7:30 AM to 7:59 AM | 642 (9.8%) | 747 (11.5%) |
| 8:00 AM to 8:29 AM | 550 (8.4%) | 882 (13.6%) |
| 8:30 AM to 8:59 AM | 139 (2.1%) | 267 (4.1%) |
| 9:00 AM to 9:59 AM | 364 (5.5%) | 278 (4.3%) |
| 10:00 AM to 10:59 AM | 123 (1.9%) | 105 (1.6%) |
| 11:00 AM to 11:59 AM | 45 (0.7%) | 79 (1.2%) |
| 12:00 PM to 3:59 PM | 831 (12.6%) | 436 (6.7%) |
| 4:00 PM to 11:59 PM | 461 (7.0%) | 698 (10.8%) |
| Total | 6,577 (100.0%) | 6,472 (100.0%) |
Housing Occupancy in Seguin
Occupancy by Ownership in Seguin
Of the total 10,786 dwellings in Seguin, owner-occupied units account for 6,924 (64.2%), while renter-occupied units make up 3,862 (35.8%).
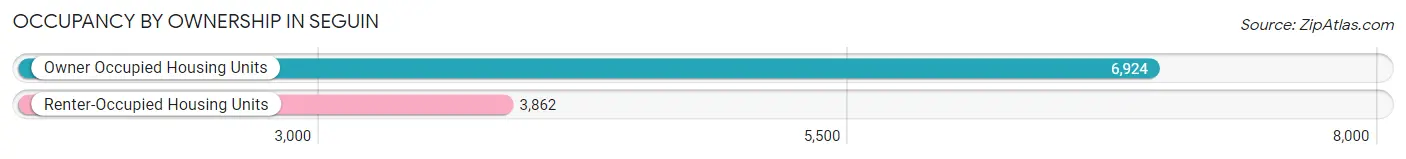
| Occupancy | # Housing Units | % Housing Units |
| Owner Occupied Housing Units | 6,924 | 64.2% |
| Renter-Occupied Housing Units | 3,862 | 35.8% |
| Total Occupied Housing Units | 10,786 | 100.0% |
Occupancy by Household Size in Seguin
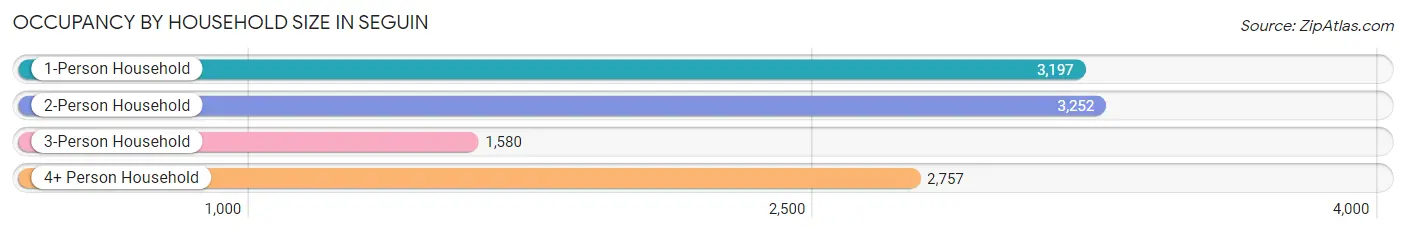
| Household Size | # Housing Units | % Housing Units |
| 1-Person Household | 3,197 | 29.6% |
| 2-Person Household | 3,252 | 30.1% |
| 3-Person Household | 1,580 | 14.6% |
| 4+ Person Household | 2,757 | 25.6% |
| Total Housing Units | 10,786 | 100.0% |
Occupancy by Ownership by Household Size in Seguin
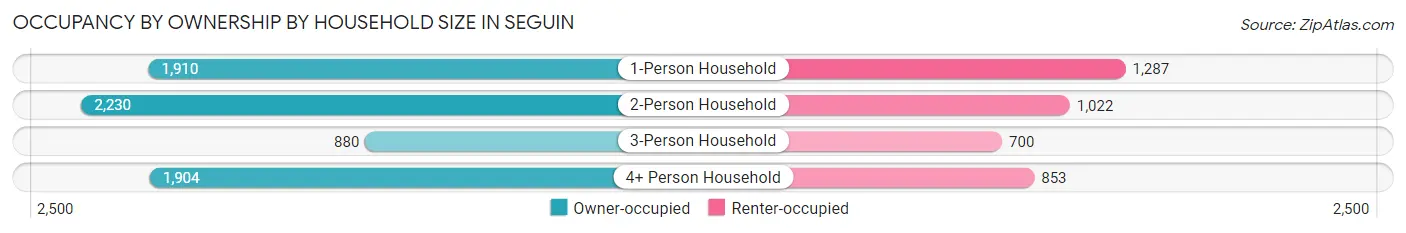
| Household Size | Owner-occupied | Renter-occupied |
| 1-Person Household | 1,910 (59.7%) | 1,287 (40.3%) |
| 2-Person Household | 2,230 (68.6%) | 1,022 (31.4%) |
| 3-Person Household | 880 (55.7%) | 700 (44.3%) |
| 4+ Person Household | 1,904 (69.1%) | 853 (30.9%) |
| Total Housing Units | 6,924 (64.2%) | 3,862 (35.8%) |
Occupancy by Educational Attainment in Seguin
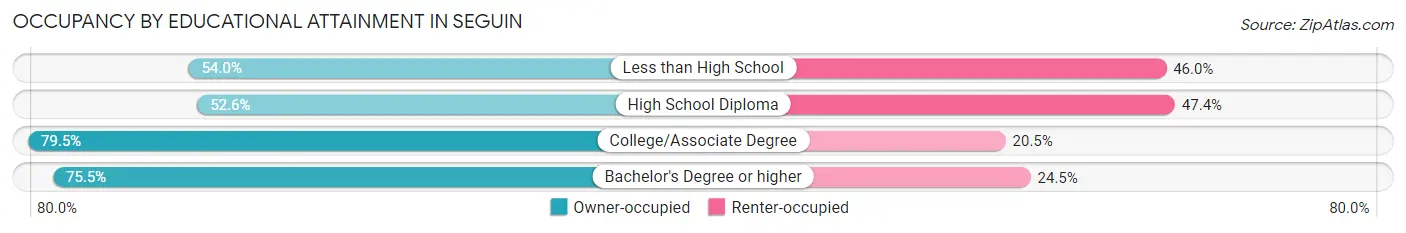
| Household Size | Owner-occupied | Renter-occupied |
| Less than High School | 1,140 (54.0%) | 971 (46.0%) |
| High School Diploma | 1,995 (52.6%) | 1,796 (47.4%) |
| College/Associate Degree | 2,032 (79.5%) | 525 (20.5%) |
| Bachelor's Degree or higher | 1,757 (75.5%) | 570 (24.5%) |
Occupancy by Age of Householder in Seguin
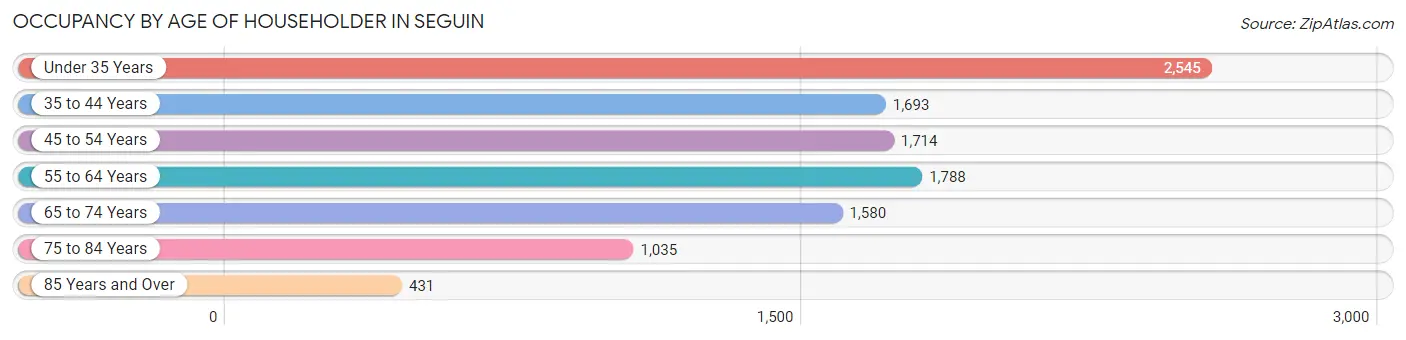
| Age Bracket | # Households | % Households |
| Under 35 Years | 2,545 | 23.6% |
| 35 to 44 Years | 1,693 | 15.7% |
| 45 to 54 Years | 1,714 | 15.9% |
| 55 to 64 Years | 1,788 | 16.6% |
| 65 to 74 Years | 1,580 | 14.6% |
| 75 to 84 Years | 1,035 | 9.6% |
| 85 Years and Over | 431 | 4.0% |
| Total | 10,786 | 100.0% |
Housing Finances in Seguin
Median Income by Occupancy in Seguin
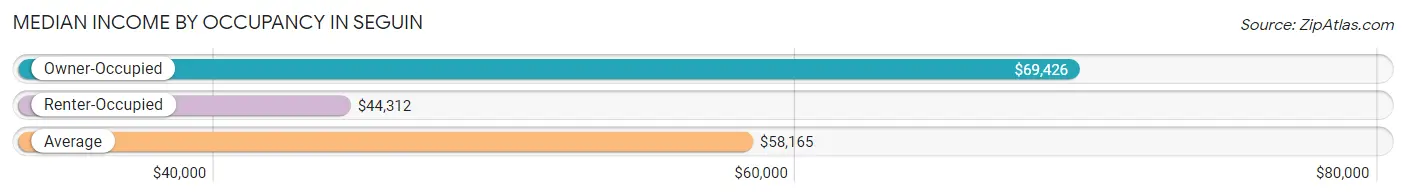
| Occupancy Type | # Households | Median Income |
| Owner-Occupied | 6,924 (64.2%) | $69,426 |
| Renter-Occupied | 3,862 (35.8%) | $44,312 |
| Average | 10,786 (100.0%) | $58,165 |
Occupancy by Householder Income Bracket in Seguin
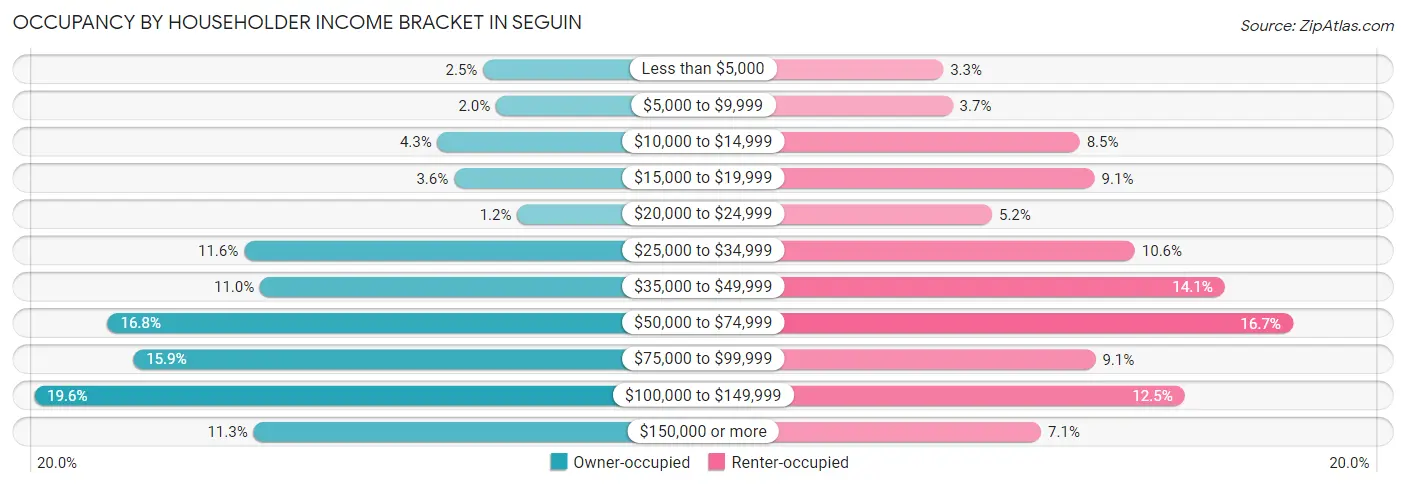
| Income Bracket | Owner-occupied | Renter-occupied |
| Less than $5,000 | 175 (2.5%) | 129 (3.3%) |
| $5,000 to $9,999 | 141 (2.0%) | 143 (3.7%) |
| $10,000 to $14,999 | 296 (4.3%) | 330 (8.5%) |
| $15,000 to $19,999 | 252 (3.6%) | 352 (9.1%) |
| $20,000 to $24,999 | 85 (1.2%) | 201 (5.2%) |
| $25,000 to $34,999 | 806 (11.6%) | 411 (10.6%) |
| $35,000 to $49,999 | 764 (11.0%) | 543 (14.1%) |
| $50,000 to $74,999 | 1,166 (16.8%) | 643 (16.7%) |
| $75,000 to $99,999 | 1,098 (15.9%) | 353 (9.1%) |
| $100,000 to $149,999 | 1,360 (19.6%) | 484 (12.5%) |
| $150,000 or more | 781 (11.3%) | 273 (7.1%) |
| Total | 6,924 (100.0%) | 3,862 (100.0%) |
Monthly Housing Cost Tiers in Seguin
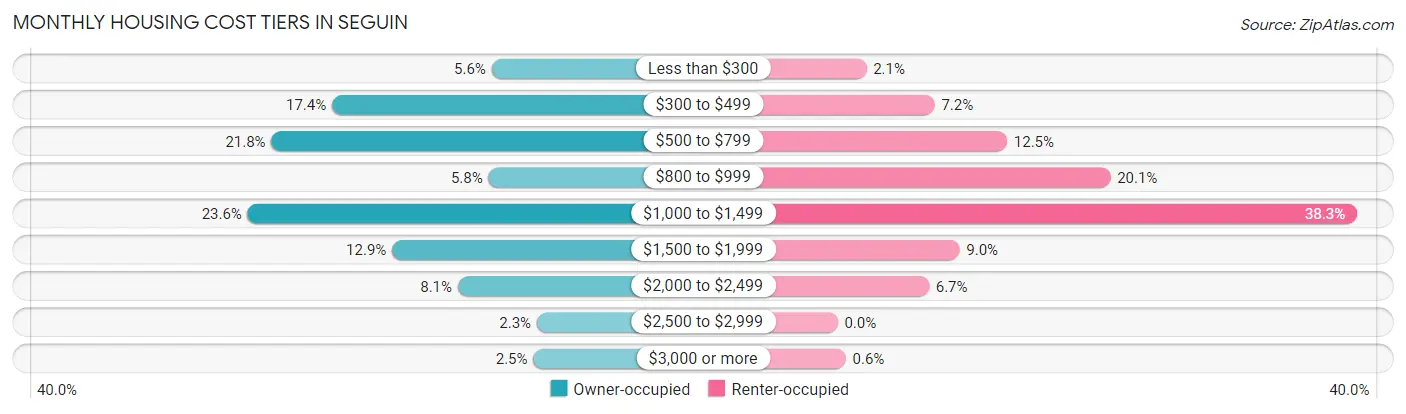
| Monthly Cost | Owner-occupied | Renter-occupied |
| Less than $300 | 388 (5.6%) | 82 (2.1%) |
| $300 to $499 | 1,202 (17.4%) | 276 (7.1%) |
| $500 to $799 | 1,511 (21.8%) | 482 (12.5%) |
| $800 to $999 | 404 (5.8%) | 776 (20.1%) |
| $1,000 to $1,499 | 1,632 (23.6%) | 1,478 (38.3%) |
| $1,500 to $1,999 | 895 (12.9%) | 347 (9.0%) |
| $2,000 to $2,499 | 560 (8.1%) | 260 (6.7%) |
| $2,500 to $2,999 | 157 (2.3%) | 0 (0.0%) |
| $3,000 or more | 175 (2.5%) | 23 (0.6%) |
| Total | 6,924 (100.0%) | 3,862 (100.0%) |
Physical Housing Characteristics in Seguin
Housing Structures in Seguin
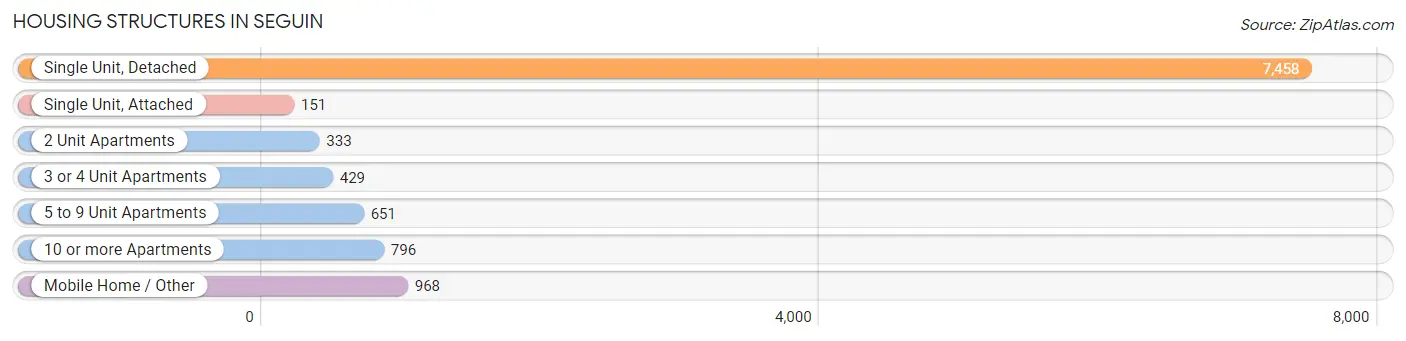
| Structure Type | # Housing Units | % Housing Units |
| Single Unit, Detached | 7,458 | 69.2% |
| Single Unit, Attached | 151 | 1.4% |
| 2 Unit Apartments | 333 | 3.1% |
| 3 or 4 Unit Apartments | 429 | 4.0% |
| 5 to 9 Unit Apartments | 651 | 6.0% |
| 10 or more Apartments | 796 | 7.4% |
| Mobile Home / Other | 968 | 9.0% |
| Total | 10,786 | 100.0% |
Housing Structures by Occupancy in Seguin
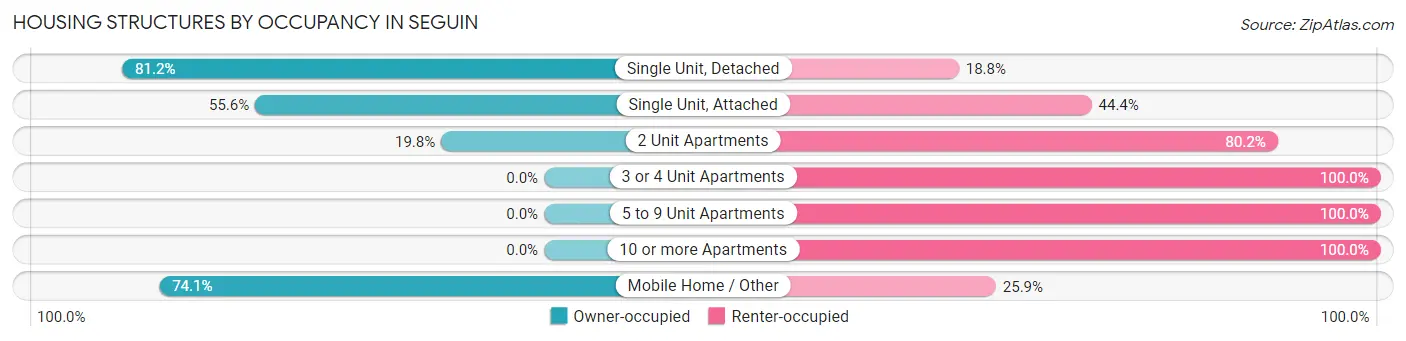
| Structure Type | Owner-occupied | Renter-occupied |
| Single Unit, Detached | 6,057 (81.2%) | 1,401 (18.8%) |
| Single Unit, Attached | 84 (55.6%) | 67 (44.4%) |
| 2 Unit Apartments | 66 (19.8%) | 267 (80.2%) |
| 3 or 4 Unit Apartments | 0 (0.0%) | 429 (100.0%) |
| 5 to 9 Unit Apartments | 0 (0.0%) | 651 (100.0%) |
| 10 or more Apartments | 0 (0.0%) | 796 (100.0%) |
| Mobile Home / Other | 717 (74.1%) | 251 (25.9%) |
| Total | 6,924 (64.2%) | 3,862 (35.8%) |
Housing Structures by Number of Rooms in Seguin
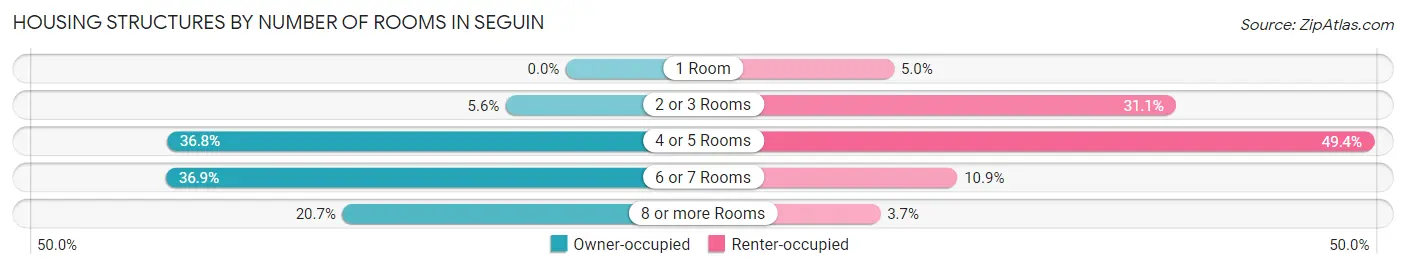
| Number of Rooms | Owner-occupied | Renter-occupied |
| 1 Room | 0 (0.0%) | 193 (5.0%) |
| 2 or 3 Rooms | 384 (5.6%) | 1,199 (31.0%) |
| 4 or 5 Rooms | 2,551 (36.8%) | 1,907 (49.4%) |
| 6 or 7 Rooms | 2,558 (36.9%) | 419 (10.8%) |
| 8 or more Rooms | 1,431 (20.7%) | 144 (3.7%) |
| Total | 6,924 (100.0%) | 3,862 (100.0%) |
Housing Structure by Heating Type in Seguin
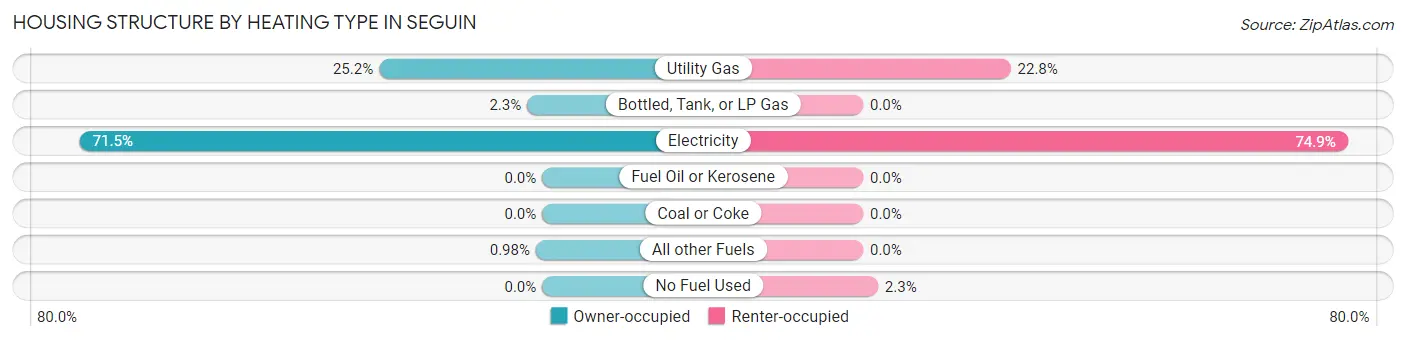
| Heating Type | Owner-occupied | Renter-occupied |
| Utility Gas | 1,746 (25.2%) | 881 (22.8%) |
| Bottled, Tank, or LP Gas | 161 (2.3%) | 0 (0.0%) |
| Electricity | 4,949 (71.5%) | 2,892 (74.9%) |
| Fuel Oil or Kerosene | 0 (0.0%) | 0 (0.0%) |
| Coal or Coke | 0 (0.0%) | 0 (0.0%) |
| All other Fuels | 68 (1.0%) | 0 (0.0%) |
| No Fuel Used | 0 (0.0%) | 89 (2.3%) |
| Total | 6,924 (100.0%) | 3,862 (100.0%) |
Household Vehicle Usage in Seguin
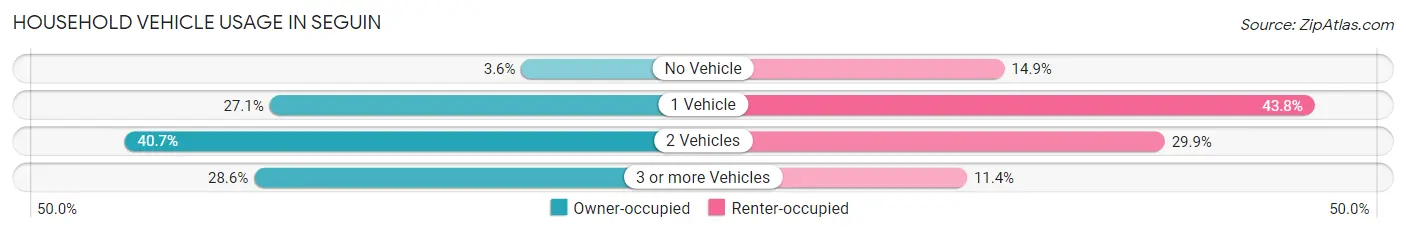
| Vehicles per Household | Owner-occupied | Renter-occupied |
| No Vehicle | 251 (3.6%) | 576 (14.9%) |
| 1 Vehicle | 1,879 (27.1%) | 1,693 (43.8%) |
| 2 Vehicles | 2,815 (40.7%) | 1,153 (29.8%) |
| 3 or more Vehicles | 1,979 (28.6%) | 440 (11.4%) |
| Total | 6,924 (100.0%) | 3,862 (100.0%) |
Real Estate & Mortgages in Seguin
Real Estate and Mortgage Overview in Seguin
| Characteristic | Without Mortgage | With Mortgage |
| Housing Units | 3,418 | 3,506 |
| Median Property Value | $157,200 | $230,100 |
| Median Household Income | $43,641 | $596 |
| Monthly Housing Costs | $540 | $175 |
| Real Estate Taxes | $1,434 | $248 |
Property Value by Mortgage Status in Seguin
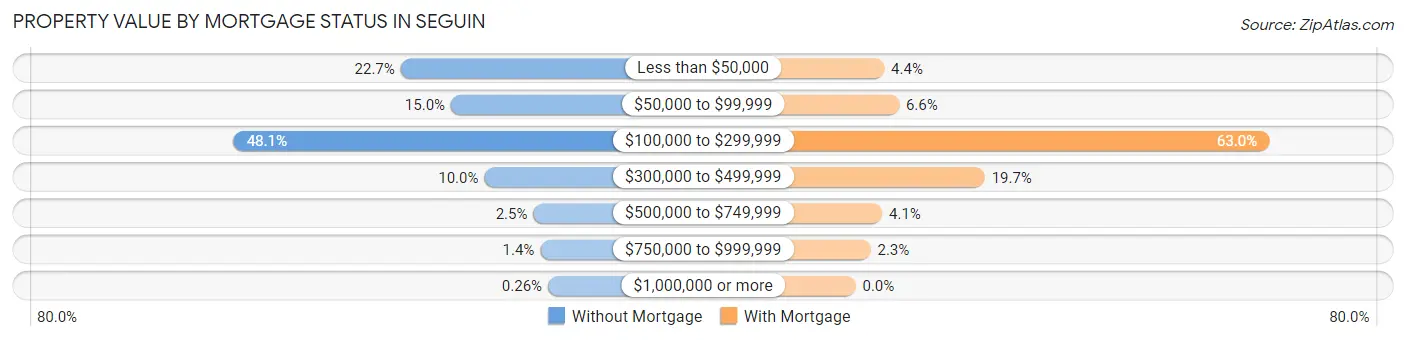
| Property Value | Without Mortgage | With Mortgage |
| Less than $50,000 | 776 (22.7%) | 153 (4.4%) |
| $50,000 to $99,999 | 514 (15.0%) | 232 (6.6%) |
| $100,000 to $299,999 | 1,645 (48.1%) | 2,209 (63.0%) |
| $300,000 to $499,999 | 340 (10.0%) | 690 (19.7%) |
| $500,000 to $749,999 | 85 (2.5%) | 142 (4.1%) |
| $750,000 to $999,999 | 49 (1.4%) | 80 (2.3%) |
| $1,000,000 or more | 9 (0.3%) | 0 (0.0%) |
| Total | 3,418 (100.0%) | 3,506 (100.0%) |
Household Income by Mortgage Status in Seguin
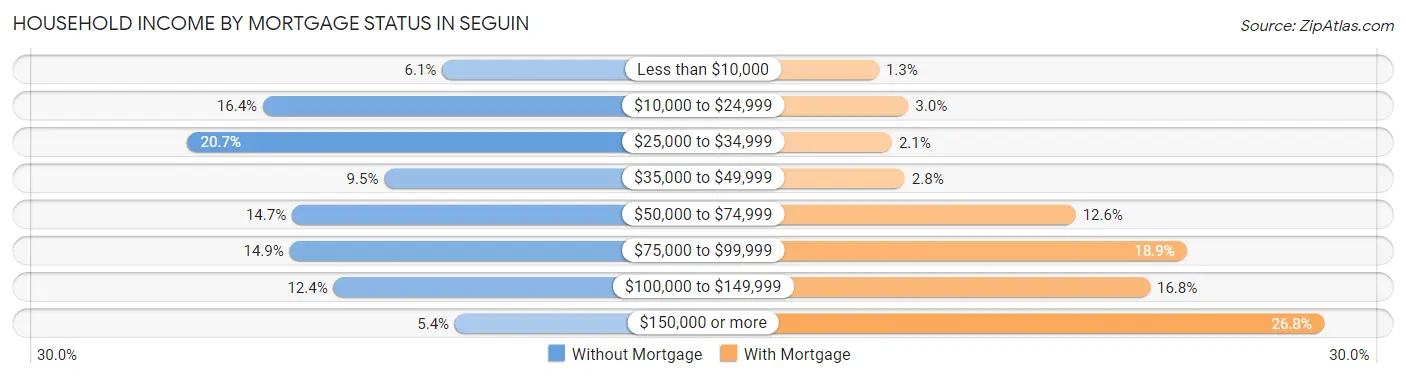
| Household Income | Without Mortgage | With Mortgage |
| Less than $10,000 | 210 (6.1%) | 47 (1.3%) |
| $10,000 to $24,999 | 560 (16.4%) | 106 (3.0%) |
| $25,000 to $34,999 | 707 (20.7%) | 73 (2.1%) |
| $35,000 to $49,999 | 323 (9.5%) | 99 (2.8%) |
| $50,000 to $74,999 | 503 (14.7%) | 441 (12.6%) |
| $75,000 to $99,999 | 508 (14.9%) | 663 (18.9%) |
| $100,000 to $149,999 | 422 (12.3%) | 590 (16.8%) |
| $150,000 or more | 185 (5.4%) | 938 (26.8%) |
| Total | 3,418 (100.0%) | 3,506 (100.0%) |
Property Value to Household Income Ratio in Seguin
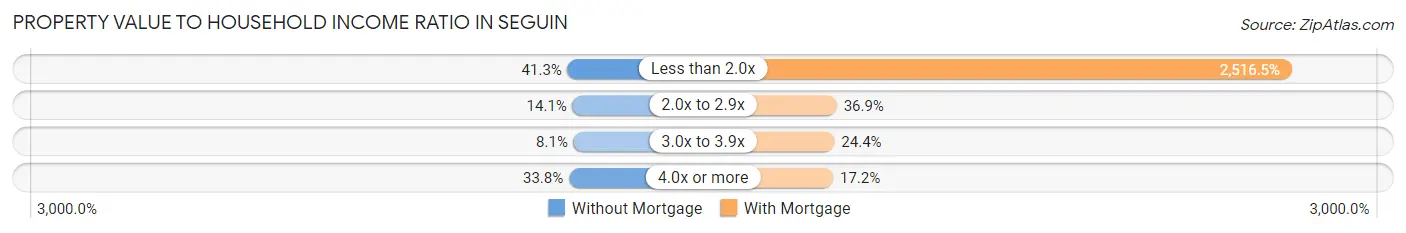
| Value-to-Income Ratio | Without Mortgage | With Mortgage |
| Less than 2.0x | 1,412 (41.3%) | 88,229 (2,516.5%) |
| 2.0x to 2.9x | 482 (14.1%) | 1,293 (36.9%) |
| 3.0x to 3.9x | 276 (8.1%) | 855 (24.4%) |
| 4.0x or more | 1,156 (33.8%) | 603 (17.2%) |
| Total | 3,418 (100.0%) | 3,506 (100.0%) |
Real Estate Taxes by Mortgage Status in Seguin
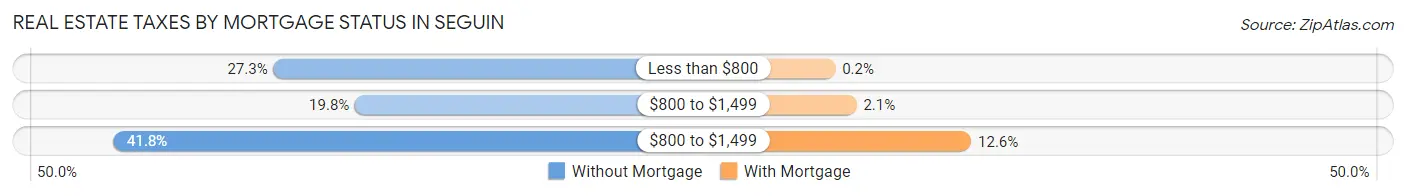
| Property Taxes | Without Mortgage | With Mortgage |
| Less than $800 | 932 (27.3%) | 7 (0.2%) |
| $800 to $1,499 | 677 (19.8%) | 75 (2.1%) |
| $800 to $1,499 | 1,430 (41.8%) | 442 (12.6%) |
| Total | 3,418 (100.0%) | 3,506 (100.0%) |
Health & Disability in Seguin
Health Insurance Coverage by Age in Seguin
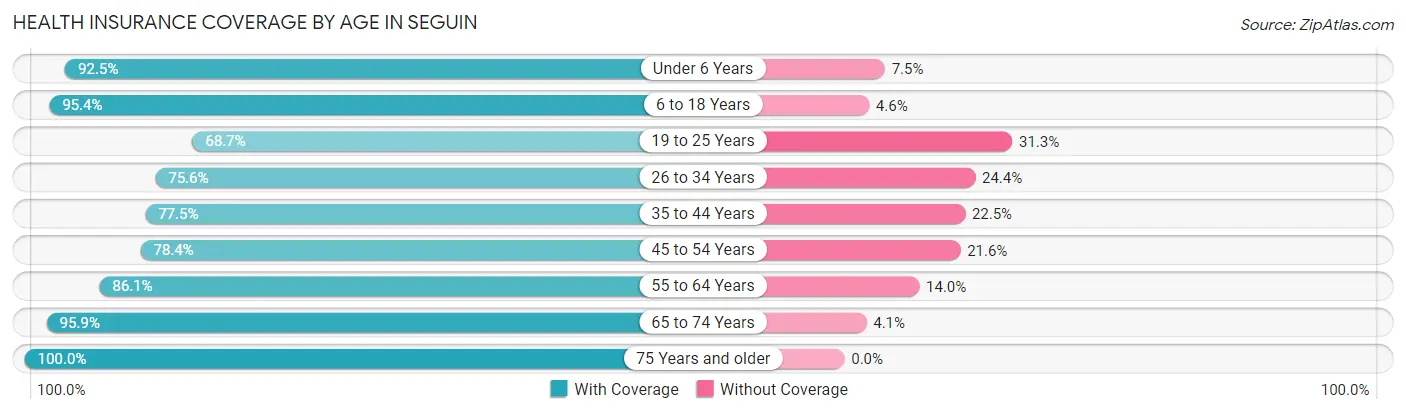
| Age Bracket | With Coverage | Without Coverage |
| Under 6 Years | 2,109 (92.5%) | 172 (7.5%) |
| 6 to 18 Years | 4,653 (95.4%) | 224 (4.6%) |
| 19 to 25 Years | 2,459 (68.7%) | 1,120 (31.3%) |
| 26 to 34 Years | 2,881 (75.6%) | 929 (24.4%) |
| 35 to 44 Years | 2,808 (77.5%) | 815 (22.5%) |
| 45 to 54 Years | 2,304 (78.4%) | 635 (21.6%) |
| 55 to 64 Years | 3,103 (86.1%) | 503 (14.0%) |
| 65 to 74 Years | 2,550 (95.9%) | 109 (4.1%) |
| 75 Years and older | 2,168 (100.0%) | 0 (0.0%) |
| Total | 25,035 (84.7%) | 4,507 (15.3%) |
Health Insurance Coverage by Citizenship Status in Seguin
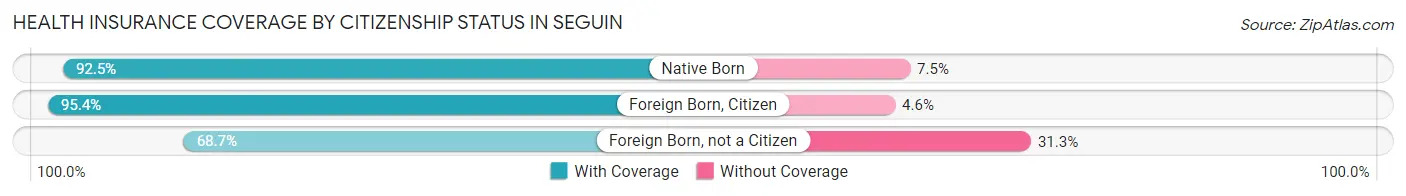
| Citizenship Status | With Coverage | Without Coverage |
| Native Born | 2,109 (92.5%) | 172 (7.5%) |
| Foreign Born, Citizen | 4,653 (95.4%) | 224 (4.6%) |
| Foreign Born, not a Citizen | 2,459 (68.7%) | 1,120 (31.3%) |
Health Insurance Coverage by Household Income in Seguin
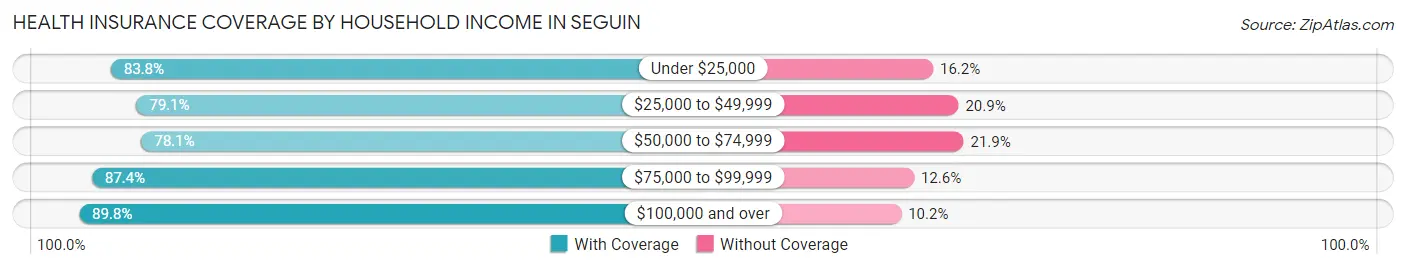
| Household Income | With Coverage | Without Coverage |
| Under $25,000 | 3,253 (83.8%) | 627 (16.2%) |
| $25,000 to $49,999 | 4,610 (79.1%) | 1,220 (20.9%) |
| $50,000 to $74,999 | 3,904 (78.1%) | 1,093 (21.9%) |
| $75,000 to $99,999 | 3,970 (87.4%) | 572 (12.6%) |
| $100,000 and over | 8,541 (89.8%) | 970 (10.2%) |
Public vs Private Health Insurance Coverage by Age in Seguin
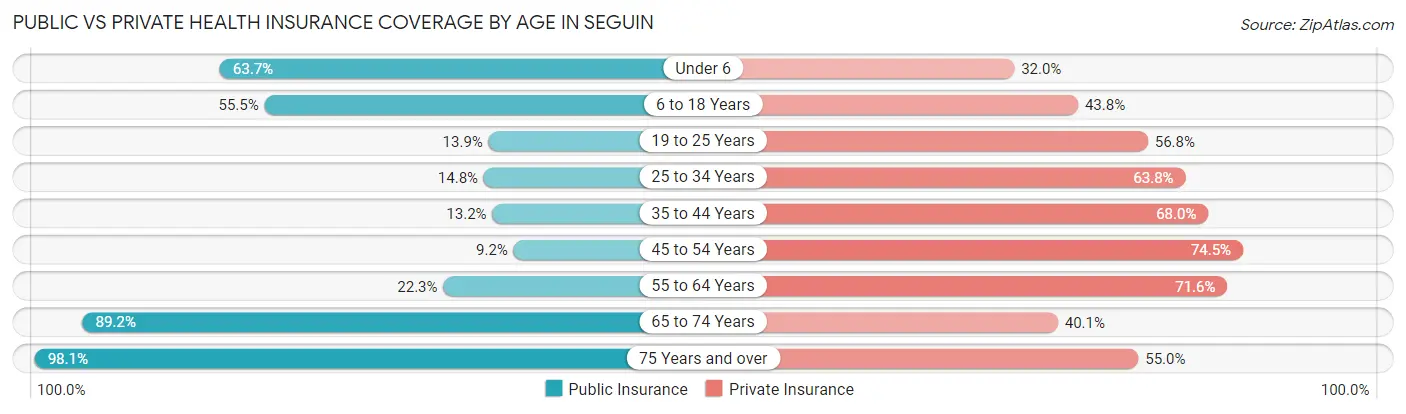
| Age Bracket | Public Insurance | Private Insurance |
| Under 6 | 1,454 (63.7%) | 730 (32.0%) |
| 6 to 18 Years | 2,705 (55.5%) | 2,138 (43.8%) |
| 19 to 25 Years | 496 (13.9%) | 2,033 (56.8%) |
| 25 to 34 Years | 562 (14.7%) | 2,430 (63.8%) |
| 35 to 44 Years | 477 (13.2%) | 2,464 (68.0%) |
| 45 to 54 Years | 271 (9.2%) | 2,188 (74.5%) |
| 55 to 64 Years | 803 (22.3%) | 2,580 (71.6%) |
| 65 to 74 Years | 2,373 (89.2%) | 1,066 (40.1%) |
| 75 Years and over | 2,127 (98.1%) | 1,193 (55.0%) |
| Total | 11,268 (38.1%) | 16,822 (56.9%) |
Disability Status by Sex by Age in Seguin
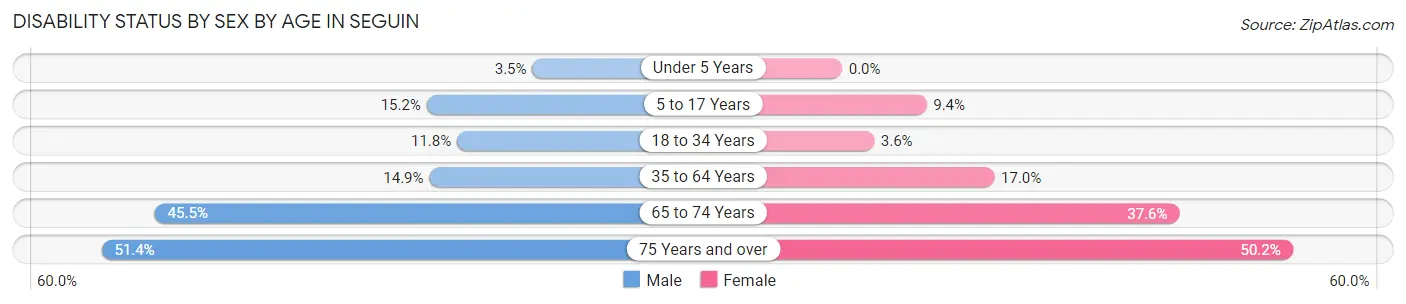
| Age Bracket | Male | Female |
| Under 5 Years | 29 (3.5%) | 0 (0.0%) |
| 5 to 17 Years | 338 (15.2%) | 237 (9.4%) |
| 18 to 34 Years | 446 (11.8%) | 151 (3.6%) |
| 35 to 64 Years | 743 (14.9%) | 880 (17.0%) |
| 65 to 74 Years | 618 (45.5%) | 489 (37.6%) |
| 75 Years and over | 357 (51.4%) | 740 (50.2%) |
Disability Class by Sex by Age in Seguin
Disability Class: Hearing Difficulty
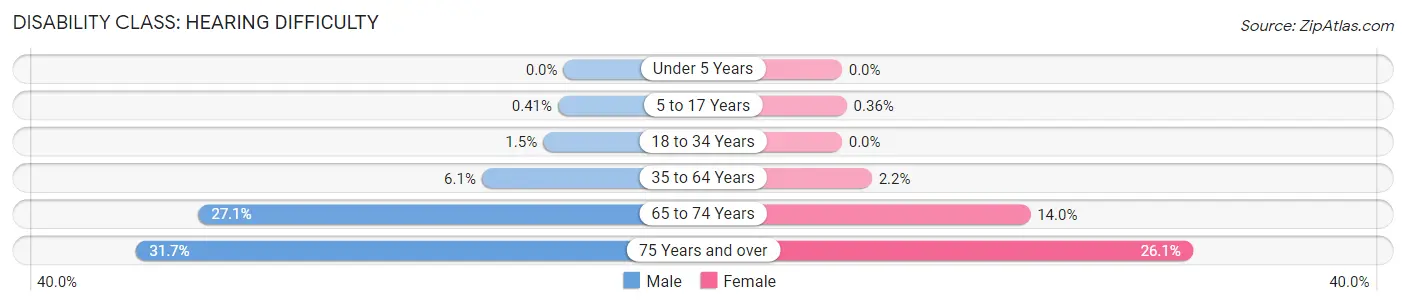
| Age Bracket | Male | Female |
| Under 5 Years | 0 (0.0%) | 0 (0.0%) |
| 5 to 17 Years | 9 (0.4%) | 9 (0.4%) |
| 18 to 34 Years | 57 (1.5%) | 0 (0.0%) |
| 35 to 64 Years | 302 (6.1%) | 115 (2.2%) |
| 65 to 74 Years | 368 (27.1%) | 182 (14.0%) |
| 75 Years and over | 220 (31.7%) | 384 (26.1%) |
Disability Class: Vision Difficulty
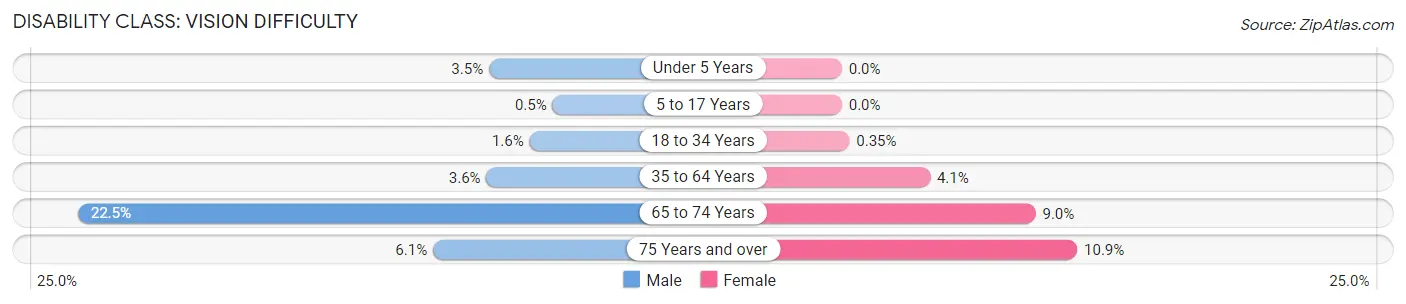
| Age Bracket | Male | Female |
| Under 5 Years | 29 (3.5%) | 0 (0.0%) |
| 5 to 17 Years | 11 (0.5%) | 0 (0.0%) |
| 18 to 34 Years | 59 (1.6%) | 15 (0.4%) |
| 35 to 64 Years | 178 (3.6%) | 212 (4.1%) |
| 65 to 74 Years | 306 (22.5%) | 117 (9.0%) |
| 75 Years and over | 42 (6.0%) | 161 (10.9%) |
Disability Class: Cognitive Difficulty
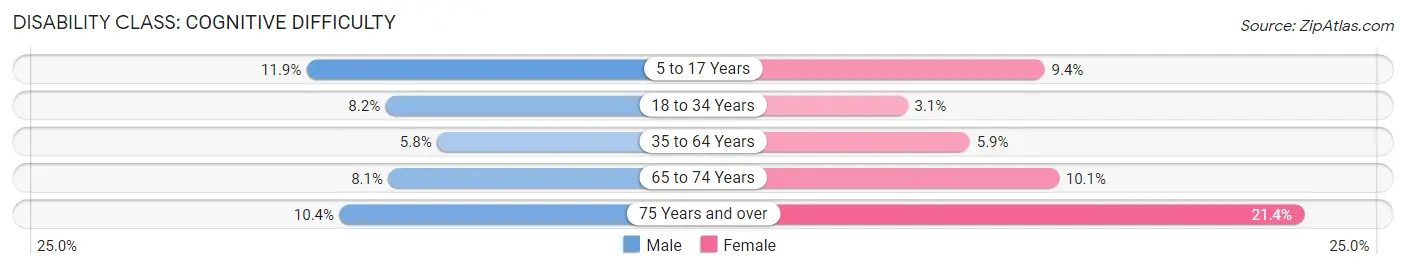
| Age Bracket | Male | Female |
| 5 to 17 Years | 264 (11.9%) | 237 (9.4%) |
| 18 to 34 Years | 310 (8.2%) | 129 (3.0%) |
| 35 to 64 Years | 291 (5.8%) | 308 (5.9%) |
| 65 to 74 Years | 110 (8.1%) | 131 (10.1%) |
| 75 Years and over | 72 (10.4%) | 316 (21.4%) |
Disability Class: Ambulatory Difficulty
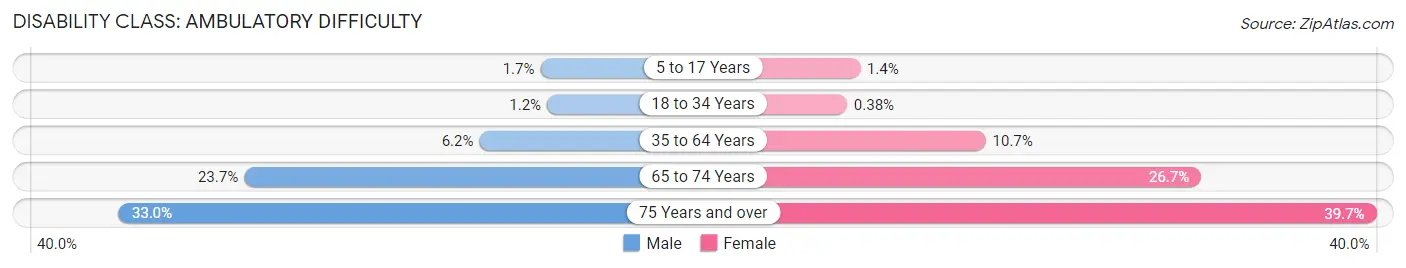
| Age Bracket | Male | Female |
| 5 to 17 Years | 38 (1.7%) | 34 (1.3%) |
| 18 to 34 Years | 46 (1.2%) | 16 (0.4%) |
| 35 to 64 Years | 311 (6.2%) | 554 (10.7%) |
| 65 to 74 Years | 322 (23.7%) | 347 (26.7%) |
| 75 Years and over | 229 (33.0%) | 585 (39.7%) |
Disability Class: Self-Care Difficulty
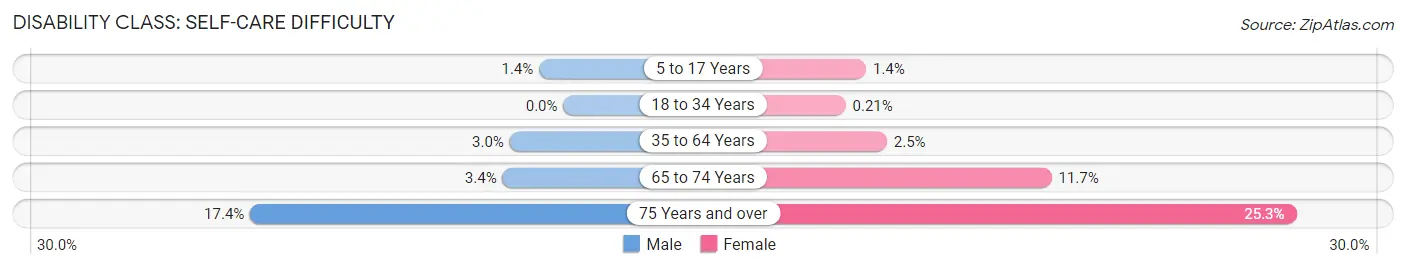
| Age Bracket | Male | Female |
| 5 to 17 Years | 30 (1.3%) | 34 (1.3%) |
| 18 to 34 Years | 0 (0.0%) | 9 (0.2%) |
| 35 to 64 Years | 149 (3.0%) | 130 (2.5%) |
| 65 to 74 Years | 46 (3.4%) | 152 (11.7%) |
| 75 Years and over | 121 (17.4%) | 373 (25.3%) |
Technology Access in Seguin
Computing Device Access in Seguin
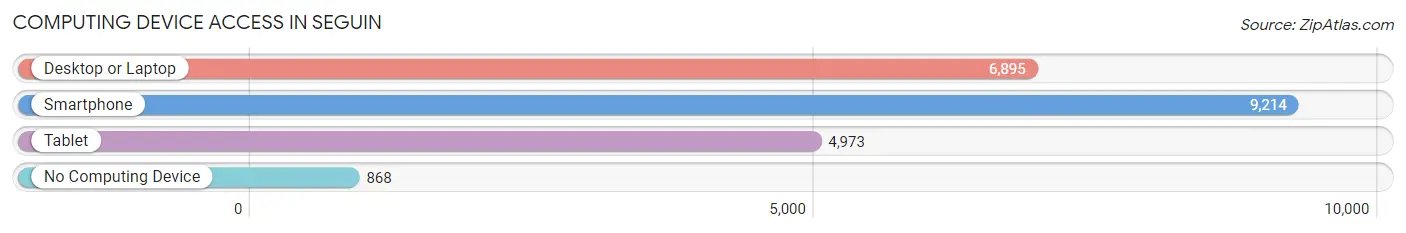
| Device Type | # Households | % Households |
| Desktop or Laptop | 6,895 | 63.9% |
| Smartphone | 9,214 | 85.4% |
| Tablet | 4,973 | 46.1% |
| No Computing Device | 868 | 8.1% |
| Total | 10,786 | 100.0% |
Internet Access in Seguin
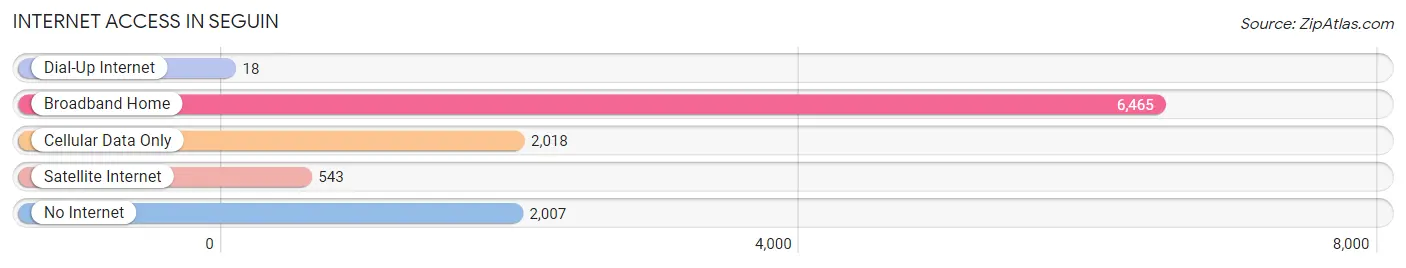
| Internet Type | # Households | % Households |
| Dial-Up Internet | 18 | 0.2% |
| Broadband Home | 6,465 | 59.9% |
| Cellular Data Only | 2,018 | 18.7% |
| Satellite Internet | 543 | 5.0% |
| No Internet | 2,007 | 18.6% |
| Total | 10,786 | 100.0% |
Seguin Summary
Seguin, Texas is a city located in Guadalupe County, Texas, United States. It is the county seat of Guadalupe County and is located about 30 miles east of San Antonio. The population of Seguin was 25,175 at the 2010 census, making it the 26th-largest city in the state of Texas.
History
Seguin was founded in 1838 by a group of settlers from Matagorda, Texas. The settlers named the town after Juan Seguín, a Tejano leader who fought alongside the Texians during the Texas Revolution. Seguin was the first Anglo-American settlement in the area and was the site of the Battle of Plum Creek in 1840.
In 1845, Seguin became the county seat of Guadalupe County. The town was incorporated in 1853 and was the site of the first public school in Texas. Seguin was also the site of the first cotton gin in Texas, which was built in 1858.
During the Civil War, Seguin was the site of a Confederate camp and was the site of a skirmish between Confederate and Union forces in 1862. After the war, Seguin experienced a period of growth and prosperity. The town was connected to San Antonio by rail in 1876 and was home to several cotton gins, a flour mill, and a brewery.
Geography
Seguin is located at 29°31'N 97°56'W (29.5179, -97.9361). According to the United States Census Bureau, the city has a total area of 16.2 square miles (41.8 km2), of which 16.1 square miles (41.6 km2) is land and 0.1 square miles (0.2 km2) (0.62%) is water.
Economy
Seguin's economy is largely based on agriculture and manufacturing. The city is home to several large manufacturing companies, including Alamo Group, Inc., a manufacturer of agricultural and industrial equipment, and CMC Steel Texas, a steel mill.
The city is also home to several large agricultural operations, including the Seguin Livestock Auction, which is the largest livestock auction in Texas. The city is also home to several wineries and vineyards, including the Texas Hill Country Winery and the Seguin Winery.
Demographics
As of the 2010 census, there were 25,175 people, 8,717 households, and 5,945 families residing in the city. The population density was 1,564.2 people per square mile (604.7/km2). There were 9,541 housing units at an average density of 593.3 per square mile (229.2/km2). The racial makeup of the city was 74.2% White, 5.3% African American, 0.7% Native American, 0.7% Asian, 0.1% Pacific Islander, 16.7% from other races, and 2.3% from two or more races. Hispanic or Latino of any race were 43.2% of the population.
There were 8,717 households, out of which 34.2% had children under the age of 18 living with them, 48.2% were married couples living together, 15.3% had a female householder with no husband present, and 30.7% were non-families. 25.2% of all households were made up of individuals, and 11.2% had someone living alone who was 65 years of age or older. The average household size was 2.76 and the average family size was 3.33.
In the city, the population was spread out, with 28.2% under the age of 18, 9.7% from 18 to 24, 27.2% from 25 to 44, 21.2% from 45 to 64, and 13.7% who were 65 years of age or older. The median age was 33 years. For every 100 females, there were 93.2 males. For every 100 females age 18 and over, there were 89.2 males.
The median income for a household in the city was $35,945, and the median income for a family was $41,945. Males had a median income of $30,945 versus $22,945 for females. The per capita income for the city was $17,945. About 14.2% of families and 17.2% of the population were below the poverty line, including 22.2% of those under age 18 and 13.2% of those age 65 or over.
Common Questions
What is Per Capita Income in Seguin?
Per Capita income in Seguin is $28,564.
What is the Median Family Income in Seguin?
Median Family Income in Seguin is $71,604.
What is the Median Household income in Seguin?
Median Household Income in Seguin is $58,165.
What is Income or Wage Gap in Seguin?
Income or Wage Gap in Seguin is 9.5%.
Women in Seguin earn 90.5 cents for every dollar earned by a man.
What is Inequality or Gini Index in Seguin?
Inequality or Gini Index in Seguin is 0.45.
What is the Total Population of Seguin?
Total Population of Seguin is 30,318.
What is the Total Male Population of Seguin?
Total Male Population of Seguin is 14,377.
What is the Total Female Population of Seguin?
Total Female Population of Seguin is 15,941.
What is the Ratio of Males per 100 Females in Seguin?
There are 90.19 Males per 100 Females in Seguin.
What is the Ratio of Females per 100 Males in Seguin?
There are 110.88 Females per 100 Males in Seguin.
What is the Median Population Age in Seguin?
Median Population Age in Seguin is 36.2 Years.
What is the Average Family Size in Seguin
Average Family Size in Seguin is 3.3 People.
What is the Average Household Size in Seguin
Average Household Size in Seguin is 2.7 People.
How Large is the Labor Force in Seguin?
There are 14,644 People in the Labor Forcein in Seguin.
What is the Percentage of People in the Labor Force in Seguin?
59.7% of People are in the Labor Force in Seguin.
What is the Unemployment Rate in Seguin?
Unemployment Rate in Seguin is 4.4%.