Seagraves, TX Map & Demographics
Seagraves Map
Seagraves Overview
$31,756
PER CAPITA INCOME
$90,217
AVG FAMILY INCOME
$49,049
AVG HOUSEHOLD INCOME
43.3%
WAGE / INCOME GAP [ % ]
56.7¢/ $1
WAGE / INCOME GAP [ $ ]
0.53
INEQUALITY / GINI INDEX
2,772
TOTAL POPULATION
1,329
MALE POPULATION
1,443
FEMALE POPULATION
92.10
MALES / 100 FEMALES
108.58
FEMALES / 100 MALES
35.5
MEDIAN AGE
3.3
AVG FAMILY SIZE
2.6
AVG HOUSEHOLD SIZE
1,164
LABOR FORCE [ PEOPLE ]
56.4%
PERCENT IN LABOR FORCE
2.5%
UNEMPLOYMENT RATE
Seagraves Zip Codes
Seagraves Area Codes
Income in Seagraves
Income Overview in Seagraves
Per Capita Income in Seagraves is $31,756, while median incomes of families and households are $90,217 and $49,049 respectively.
| Characteristic | Number | Measure |
| Per Capita Income | 2,772 | $31,756 |
| Median Family Income | 692 | $90,217 |
| Mean Family Income | 692 | $116,441 |
| Median Household Income | 1,071 | $49,049 |
| Mean Household Income | 1,071 | $84,249 |
| Income Deficit | 692 | $0 |
| Wage / Income Gap (%) | 2,772 | 43.26% |
| Wage / Income Gap ($) | 2,772 | 56.74¢ per $1 |
| Gini / Inequality Index | 2,772 | 0.53 |
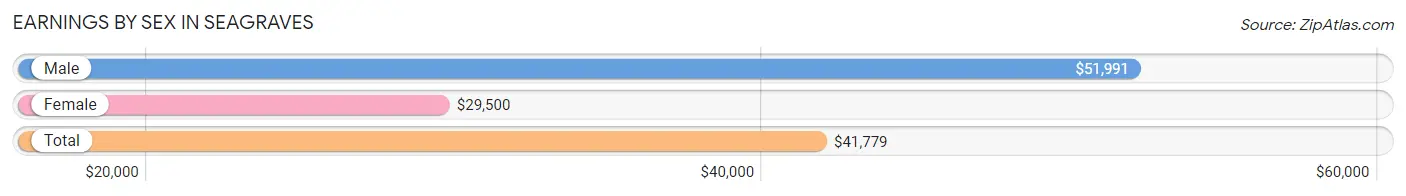
Earnings by Sex in Seagraves
Average Earnings in Seagraves are $41,779, $51,991 for men and $29,500 for women, a difference of 43.3%.
| Sex | Number | Average Earnings |
| Male | 753 (58.3%) | $51,991 |
| Female | 538 (41.7%) | $29,500 |
| Total | 1,291 (100.0%) | $41,779 |
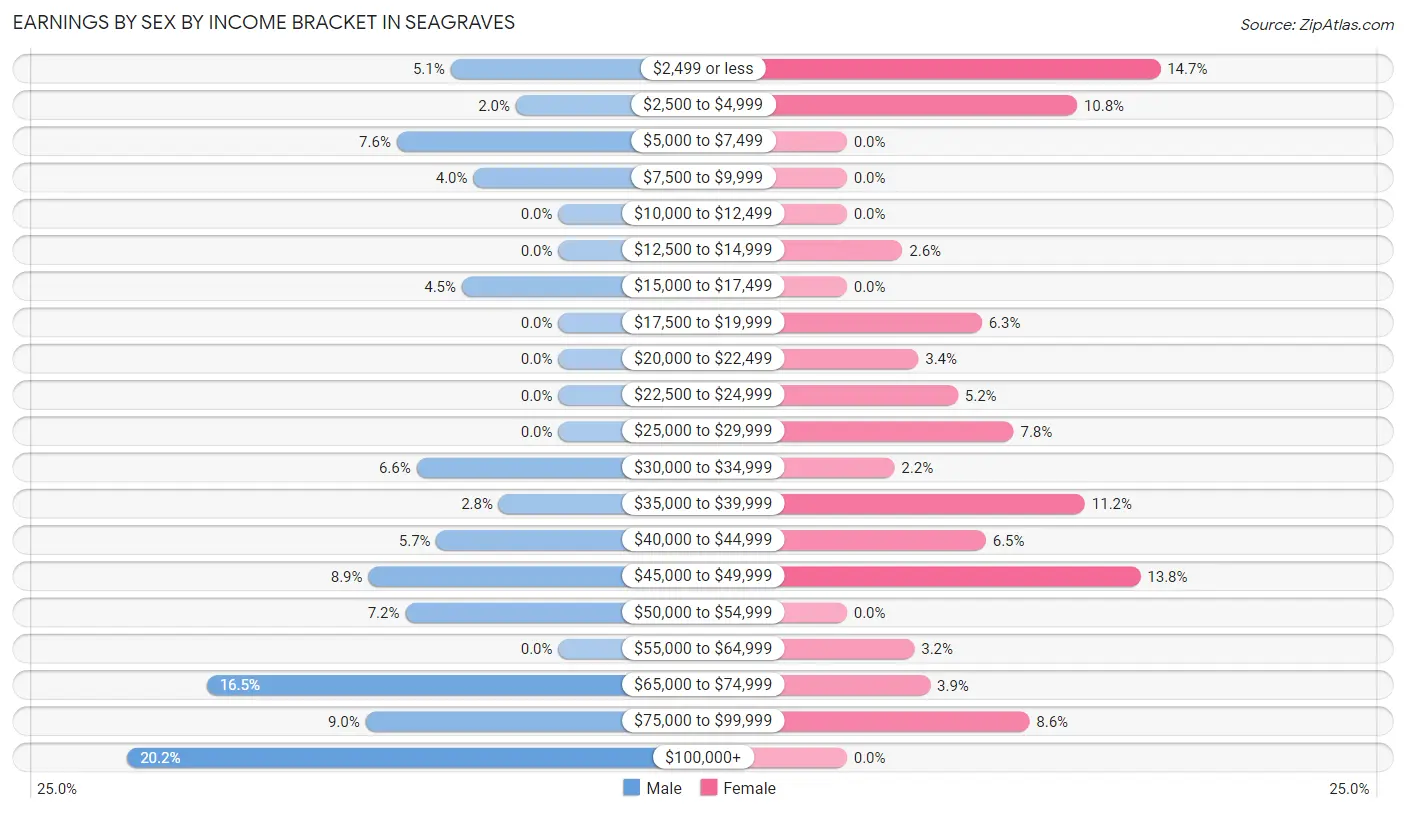
Earnings by Sex by Income Bracket in Seagraves
The most common earnings brackets in Seagraves are $100,000+ for men (152 | 20.2%) and $2,499 or less for women (79 | 14.7%).
| Income | Male | Female |
| $2,499 or less | 38 (5.1%) | 79 (14.7%) |
| $2,500 to $4,999 | 15 (2.0%) | 58 (10.8%) |
| $5,000 to $7,499 | 57 (7.6%) | 0 (0.0%) |
| $7,500 to $9,999 | 30 (4.0%) | 0 (0.0%) |
| $10,000 to $12,499 | 0 (0.0%) | 0 (0.0%) |
| $12,500 to $14,999 | 0 (0.0%) | 14 (2.6%) |
| $15,000 to $17,499 | 34 (4.5%) | 0 (0.0%) |
| $17,500 to $19,999 | 0 (0.0%) | 34 (6.3%) |
| $20,000 to $22,499 | 0 (0.0%) | 18 (3.4%) |
| $22,500 to $24,999 | 0 (0.0%) | 28 (5.2%) |
| $25,000 to $29,999 | 0 (0.0%) | 42 (7.8%) |
| $30,000 to $34,999 | 50 (6.6%) | 12 (2.2%) |
| $35,000 to $39,999 | 21 (2.8%) | 60 (11.2%) |
| $40,000 to $44,999 | 43 (5.7%) | 35 (6.5%) |
| $45,000 to $49,999 | 67 (8.9%) | 74 (13.8%) |
| $50,000 to $54,999 | 54 (7.2%) | 0 (0.0%) |
| $55,000 to $64,999 | 0 (0.0%) | 17 (3.2%) |
| $65,000 to $74,999 | 124 (16.5%) | 21 (3.9%) |
| $75,000 to $99,999 | 68 (9.0%) | 46 (8.6%) |
| $100,000+ | 152 (20.2%) | 0 (0.0%) |
| Total | 753 (100.0%) | 538 (100.0%) |
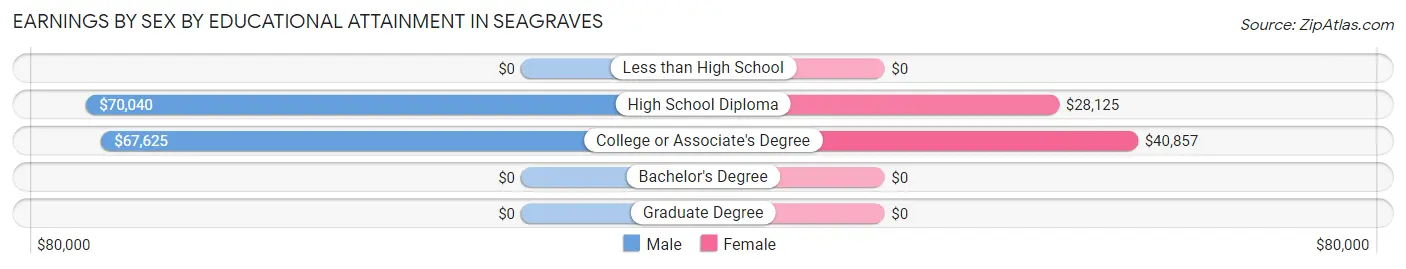
Earnings by Sex by Educational Attainment in Seagraves
Average earnings in Seagraves are $68,125 for men and $36,801 for women, a difference of 46.0%. Men with an educational attainment of high school diploma enjoy the highest average annual earnings of $70,040, while those with college or associate's degree education earn the least with $67,625. Women with an educational attainment of college or associate's degree earn the most with the average annual earnings of $40,857, while those with high school diploma education have the smallest earnings of $28,125.
| Educational Attainment | Male Income | Female Income |
| Less than High School | - | - |
| High School Diploma | $70,040 | $28,125 |
| College or Associate's Degree | $67,625 | $40,857 |
| Bachelor's Degree | - | - |
| Graduate Degree | - | - |
| Total | $68,125 | $36,801 |
Family Income in Seagraves
Family Income Brackets in Seagraves
According to the Seagraves family income data, there are 194 families falling into the $100,000 to $149,999 income range, which is the most common income bracket and makes up 28.0% of all families.
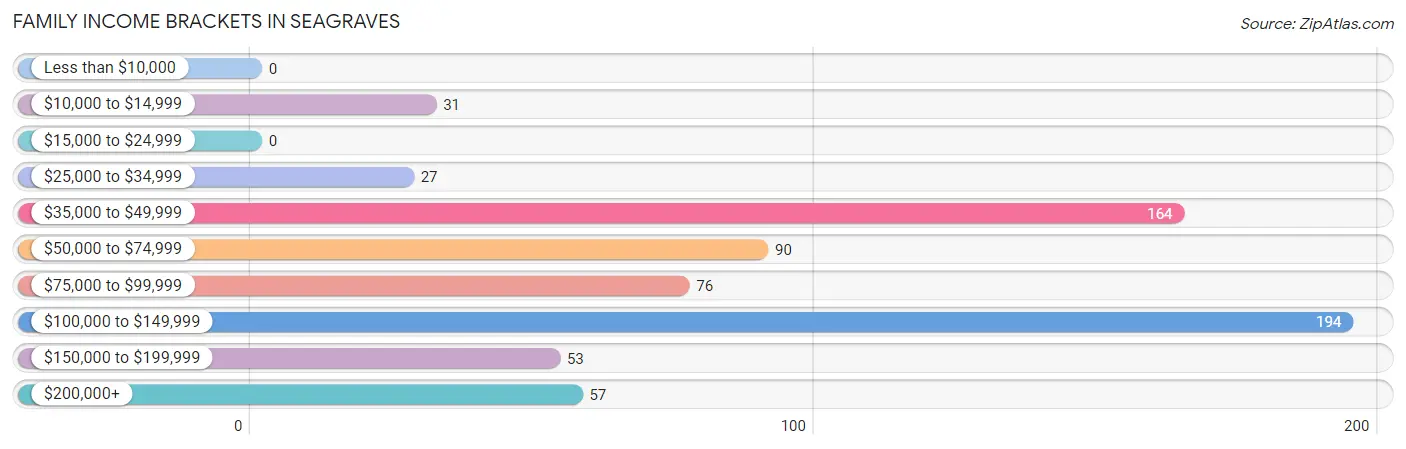
| Income Bracket | # Families | % Families |
| Less than $10,000 | 0 | 0.0% |
| $10,000 to $14,999 | 31 | 4.5% |
| $15,000 to $24,999 | 0 | 0.0% |
| $25,000 to $34,999 | 27 | 3.9% |
| $35,000 to $49,999 | 164 | 23.7% |
| $50,000 to $74,999 | 90 | 13.0% |
| $75,000 to $99,999 | 76 | 11.0% |
| $100,000 to $149,999 | 194 | 28.0% |
| $150,000 to $199,999 | 53 | 7.7% |
| $200,000+ | 57 | 8.2% |
Family Income by Famaliy Size in Seagraves
3-person families (109 | 15.8%) account for the highest median family income in Seagraves with $138,723 per family, while 3-person families (109 | 15.8%) have the highest median income of $46,241 per family member.
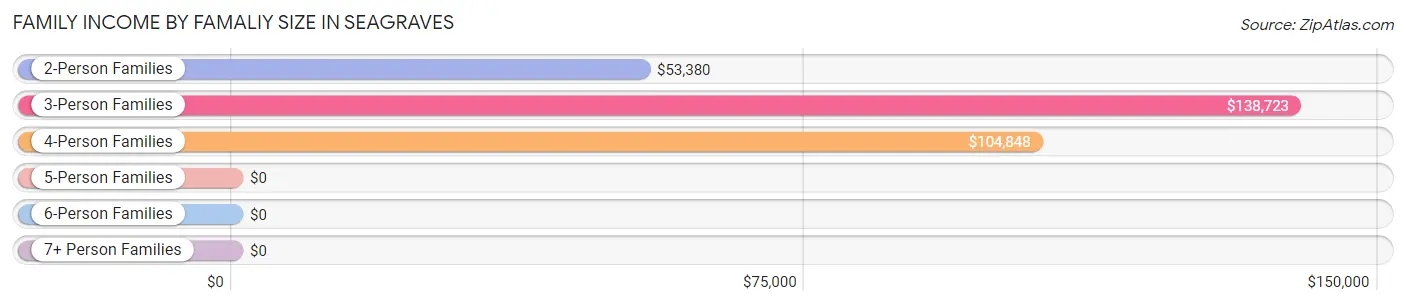
| Income Bracket | # Families | Median Income |
| 2-Person Families | 277 (40.0%) | $53,380 |
| 3-Person Families | 109 (15.8%) | $138,723 |
| 4-Person Families | 168 (24.3%) | $104,848 |
| 5-Person Families | 70 (10.1%) | $0 |
| 6-Person Families | 20 (2.9%) | $0 |
| 7+ Person Families | 48 (6.9%) | $0 |
| Total | 692 (100.0%) | $90,217 |
Family Income by Number of Earners in Seagraves
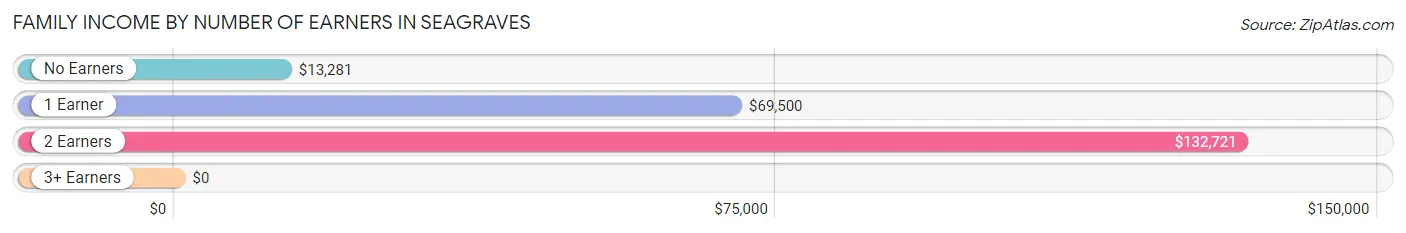
| Number of Earners | # Families | Median Income |
| No Earners | 40 (5.8%) | $13,281 |
| 1 Earner | 280 (40.5%) | $69,500 |
| 2 Earners | 273 (39.5%) | $132,721 |
| 3+ Earners | 99 (14.3%) | $0 |
| Total | 692 (100.0%) | $90,217 |
Household Income in Seagraves
Household Income Brackets in Seagraves
With 233 households falling in the category, the $100,000 to $149,999 income range is the most frequent in Seagraves, accounting for 21.8% of all households. In contrast, only 52 households (4.9%) fall into the $150,000 to $199,999 income bracket, making it the least populous group.
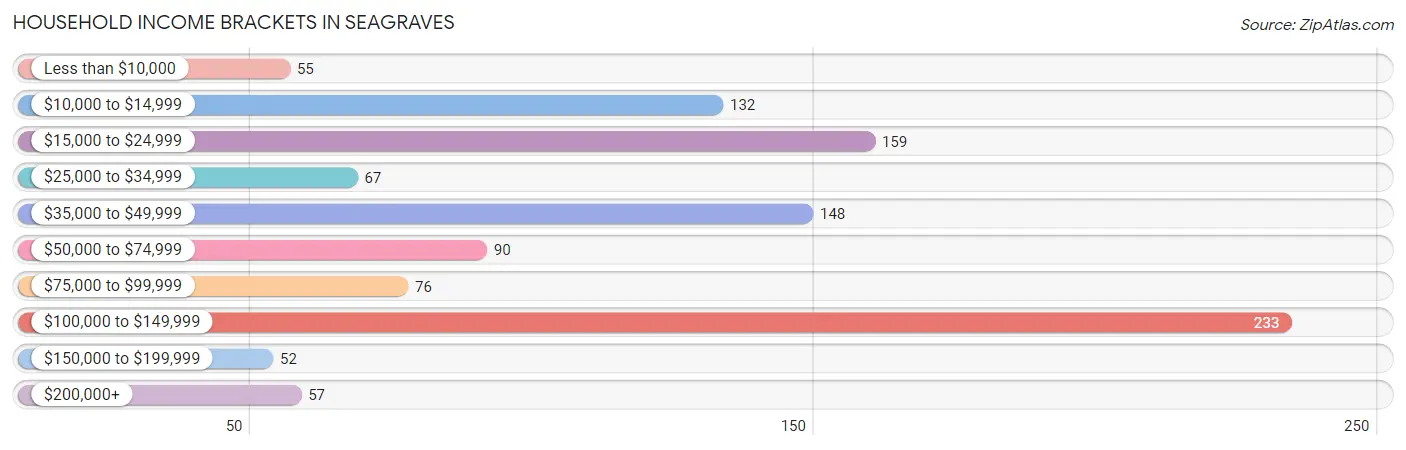
| Income Bracket | # Households | % Households |
| Less than $10,000 | 55 | 5.1% |
| $10,000 to $14,999 | 132 | 12.3% |
| $15,000 to $24,999 | 159 | 14.8% |
| $25,000 to $34,999 | 67 | 6.3% |
| $35,000 to $49,999 | 148 | 13.8% |
| $50,000 to $74,999 | 90 | 8.4% |
| $75,000 to $99,999 | 76 | 7.1% |
| $100,000 to $149,999 | 233 | 21.8% |
| $150,000 to $199,999 | 52 | 4.9% |
| $200,000+ | 57 | 5.3% |
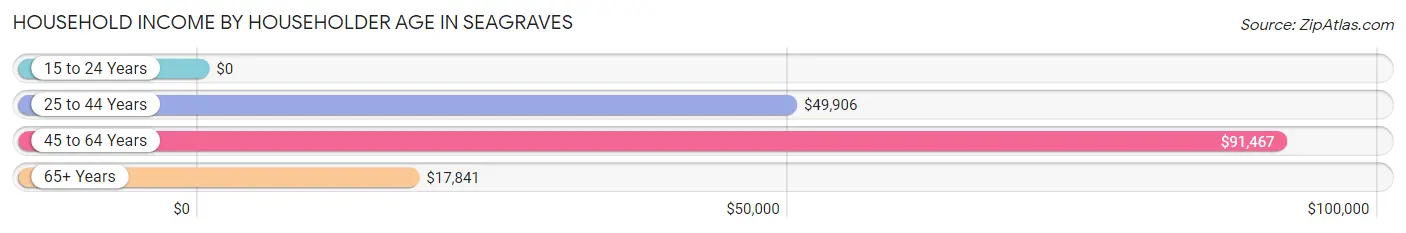
Household Income by Householder Age in Seagraves
The median household income in Seagraves is $49,049, with the highest median household income of $91,467 found in the 45 to 64 years age bracket for the primary householder. A total of 472 households (44.1%) fall into this category.
| Income Bracket | # Households | Median Income |
| 15 to 24 Years | 0 (0.0%) | $0 |
| 25 to 44 Years | 328 (30.6%) | $49,906 |
| 45 to 64 Years | 472 (44.1%) | $91,467 |
| 65+ Years | 271 (25.3%) | $17,841 |
| Total | 1,071 (100.0%) | $49,049 |
Poverty in Seagraves
Income Below Poverty by Sex and Age in Seagraves
With 9.1% poverty level for males and 21.9% for females among the residents of Seagraves, 18 to 24 year old males and under 5 year old females are the most vulnerable to poverty, with 29 males (22.1%) and 40 females (62.5%) in their respective age groups living below the poverty level.
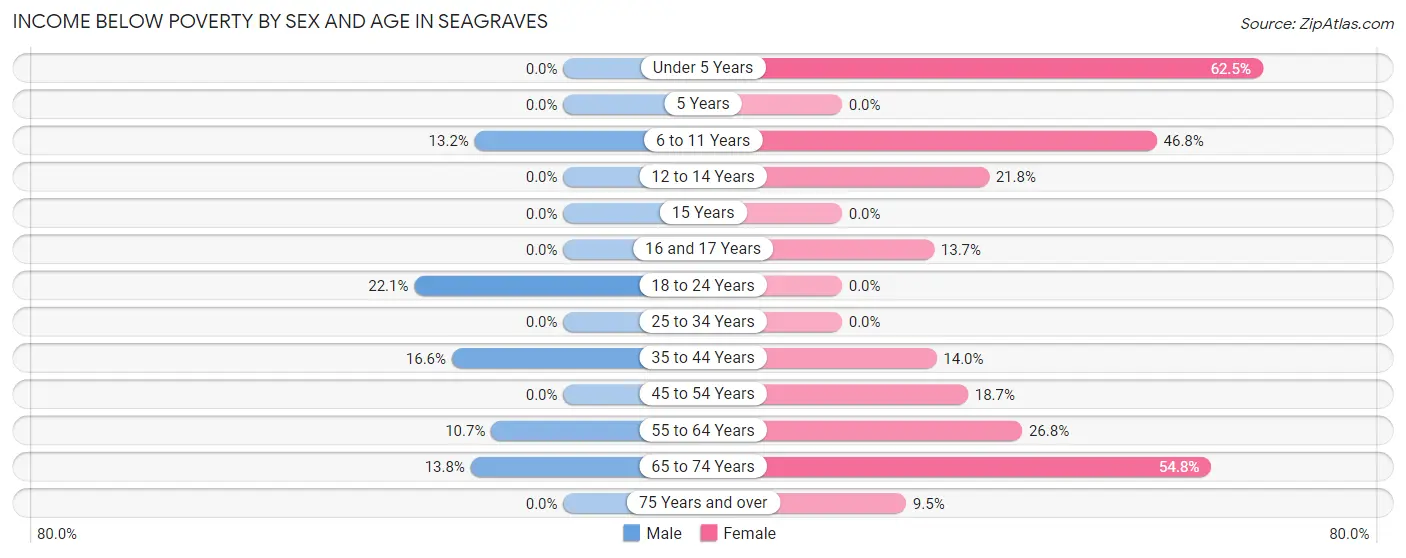
| Age Bracket | Male | Female |
| Under 5 Years | 0 (0.0%) | 40 (62.5%) |
| 5 Years | 0 (0.0%) | 0 (0.0%) |
| 6 to 11 Years | 27 (13.2%) | 72 (46.8%) |
| 12 to 14 Years | 0 (0.0%) | 24 (21.8%) |
| 15 Years | 0 (0.0%) | 0 (0.0%) |
| 16 and 17 Years | 0 (0.0%) | 19 (13.7%) |
| 18 to 24 Years | 29 (22.1%) | 0 (0.0%) |
| 25 to 34 Years | 0 (0.0%) | 0 (0.0%) |
| 35 to 44 Years | 26 (16.6%) | 25 (14.0%) |
| 45 to 54 Years | 0 (0.0%) | 29 (18.7%) |
| 55 to 64 Years | 24 (10.7%) | 57 (26.8%) |
| 65 to 74 Years | 15 (13.8%) | 34 (54.8%) |
| 75 Years and over | 0 (0.0%) | 16 (9.5%) |
| Total | 121 (9.1%) | 316 (21.9%) |
Income Above Poverty by Sex and Age in Seagraves
According to the poverty statistics in Seagraves, males aged under 5 years and females aged 5 years are the age groups that are most secure financially, with 100.0% of males and 100.0% of females in these age groups living above the poverty line.
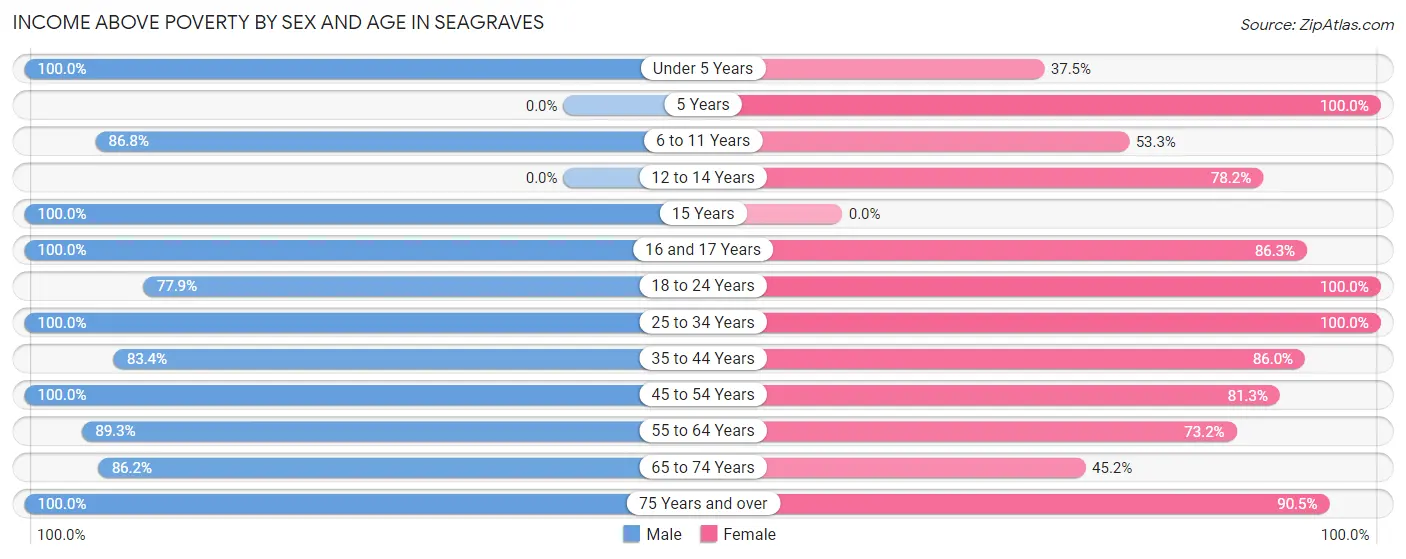
| Age Bracket | Male | Female |
| Under 5 Years | 118 (100.0%) | 24 (37.5%) |
| 5 Years | 0 (0.0%) | 31 (100.0%) |
| 6 to 11 Years | 178 (86.8%) | 82 (53.2%) |
| 12 to 14 Years | 0 (0.0%) | 86 (78.2%) |
| 15 Years | 27 (100.0%) | 0 (0.0%) |
| 16 and 17 Years | 49 (100.0%) | 120 (86.3%) |
| 18 to 24 Years | 102 (77.9%) | 23 (100.0%) |
| 25 to 34 Years | 159 (100.0%) | 146 (100.0%) |
| 35 to 44 Years | 131 (83.4%) | 153 (86.0%) |
| 45 to 54 Years | 111 (100.0%) | 126 (81.3%) |
| 55 to 64 Years | 200 (89.3%) | 156 (73.2%) |
| 65 to 74 Years | 94 (86.2%) | 28 (45.2%) |
| 75 Years and over | 39 (100.0%) | 152 (90.5%) |
| Total | 1,208 (90.9%) | 1,127 (78.1%) |
Income Below Poverty Among Married-Couple Families in Seagraves
The poverty statistics for married-couple families in Seagraves show that 3.0% or 15 of the total 503 families live below the poverty line. Families with 1 or 2 children have the highest poverty rate of 8.2%, comprising of 15 families. On the other hand, families with no children have the lowest poverty rate of 0.0%, which includes 0 families.
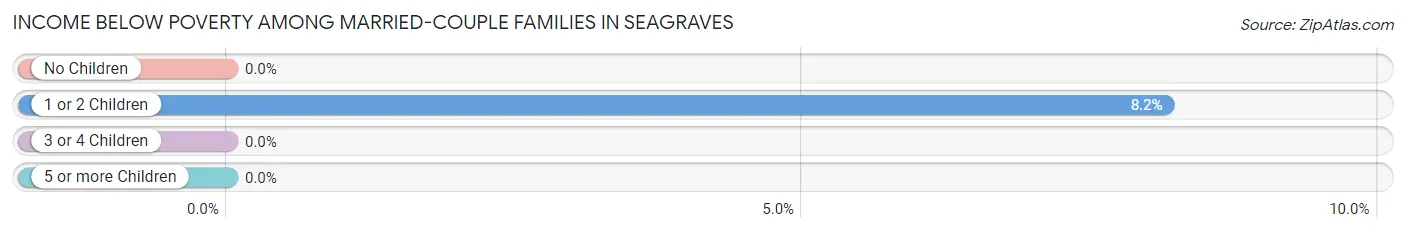
| Children | Above Poverty | Below Poverty |
| No Children | 256 (100.0%) | 0 (0.0%) |
| 1 or 2 Children | 169 (91.8%) | 15 (8.2%) |
| 3 or 4 Children | 63 (100.0%) | 0 (0.0%) |
| 5 or more Children | 0 (0.0%) | 0 (0.0%) |
| Total | 488 (97.0%) | 15 (3.0%) |
Income Below Poverty Among Single-Parent Households in Seagraves
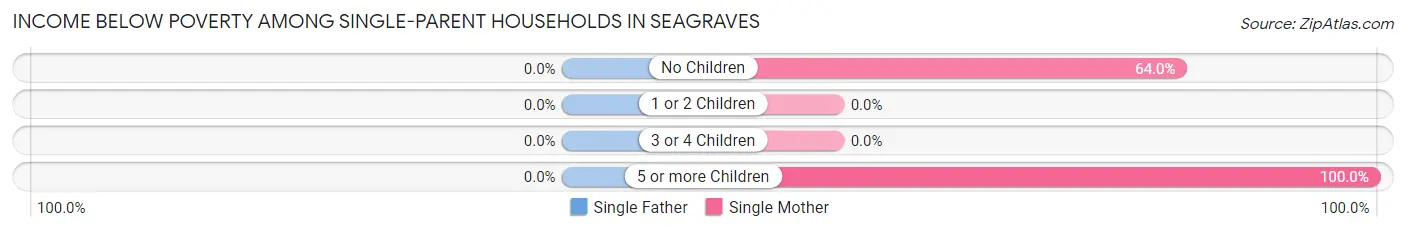
| Children | Single Father | Single Mother |
| No Children | 0 (0.0%) | 16 (64.0%) |
| 1 or 2 Children | 0 (0.0%) | 0 (0.0%) |
| 3 or 4 Children | 0 (0.0%) | 0 (0.0%) |
| 5 or more Children | 0 (0.0%) | 25 (100.0%) |
| Total | 0 (0.0%) | 41 (35.3%) |
Income Below Poverty Among Married-Couple vs Single-Parent Households in Seagraves
The poverty data for Seagraves shows that 15 of the married-couple family households (3.0%) and 41 of the single-parent households (21.7%) are living below the poverty level. Within the married-couple family households, those with 1 or 2 children have the highest poverty rate, with 15 households (8.2%) falling below the poverty line. Among the single-parent households, those with 5 or more children have the highest poverty rate, with 25 household (100.0%) living below poverty.
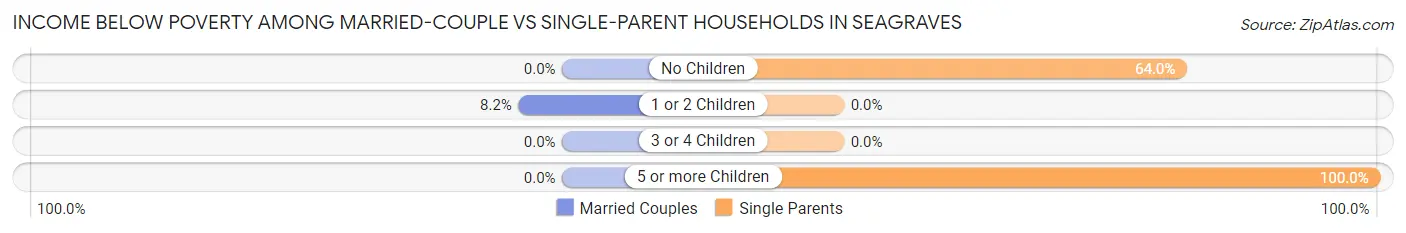
| Children | Married-Couple Families | Single-Parent Households |
| No Children | 0 (0.0%) | 16 (64.0%) |
| 1 or 2 Children | 15 (8.2%) | 0 (0.0%) |
| 3 or 4 Children | 0 (0.0%) | 0 (0.0%) |
| 5 or more Children | 0 (0.0%) | 25 (100.0%) |
| Total | 15 (3.0%) | 41 (21.7%) |
Race in Seagraves
The most populous races in Seagraves are Hispanic or Latino (1,848 | 66.7%), White / Caucasian (1,644 | 59.3%), and Two or more Races (551 | 19.9%).
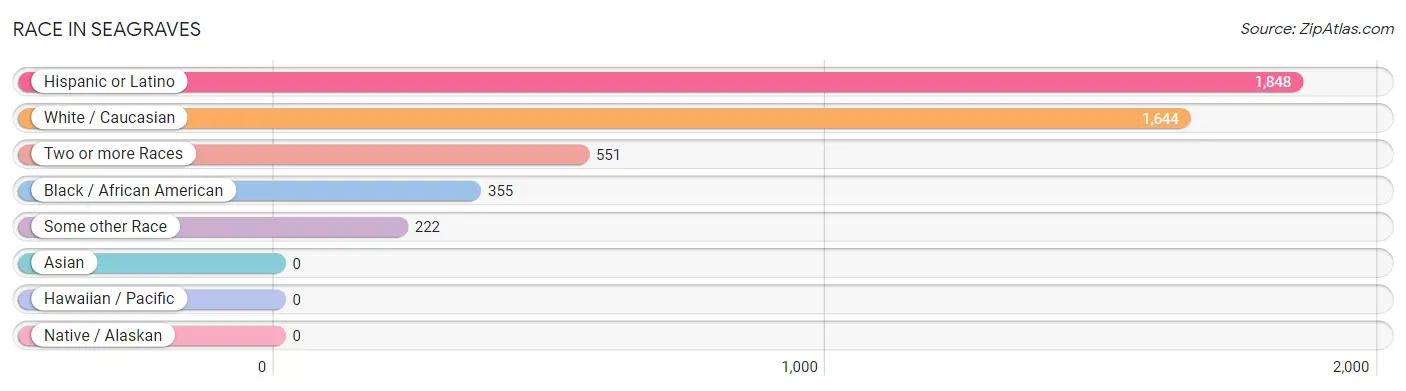
| Race | # Population | % Population |
| Asian | 0 | 0.0% |
| Black / African American | 355 | 12.8% |
| Hawaiian / Pacific | 0 | 0.0% |
| Hispanic or Latino | 1,848 | 66.7% |
| Native / Alaskan | 0 | 0.0% |
| White / Caucasian | 1,644 | 59.3% |
| Two or more Races | 551 | 19.9% |
| Some other Race | 222 | 8.0% |
| Total | 2,772 | 100.0% |
Ancestry in Seagraves
The most populous ancestries reported in Seagraves are Mexican (1,771 | 63.9%), American (118 | 4.3%), English (59 | 2.1%), Scotch-Irish (55 | 2.0%), and Irish (45 | 1.6%), together accounting for 73.9% of all Seagraves residents.
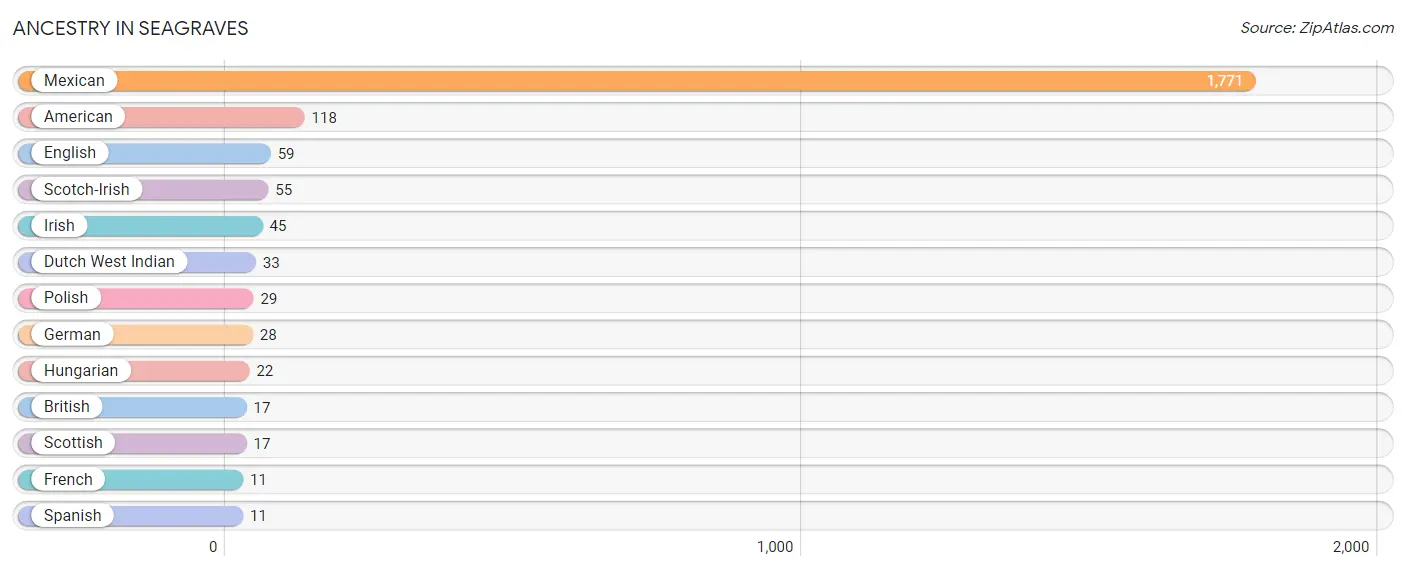
| Ancestry | # Population | % Population |
| American | 118 | 4.3% |
| British | 17 | 0.6% |
| Dutch West Indian | 33 | 1.2% |
| English | 59 | 2.1% |
| French | 11 | 0.4% |
| German | 28 | 1.0% |
| Hungarian | 22 | 0.8% |
| Irish | 45 | 1.6% |
| Mexican | 1,771 | 63.9% |
| Polish | 29 | 1.1% |
| Scotch-Irish | 55 | 2.0% |
| Scottish | 17 | 0.6% |
| Spanish | 11 | 0.4% | View All 13 Rows |
Immigrants in Seagraves
The most numerous immigrant groups reported in Seagraves came from Central America (315 | 11.4%), Latin America (315 | 11.4%), Mexico (315 | 11.4%), Belgium (22 | 0.8%), and Europe (22 | 0.8%), together accounting for 35.7% of all Seagraves residents.
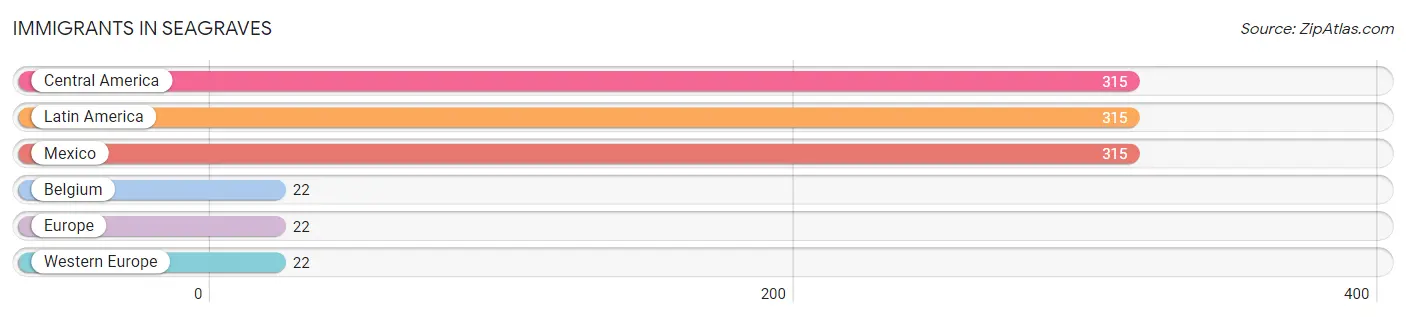
| Immigration Origin | # Population | % Population |
| Belgium | 22 | 0.8% |
| Central America | 315 | 11.4% |
| Europe | 22 | 0.8% |
| Latin America | 315 | 11.4% |
| Mexico | 315 | 11.4% |
| Western Europe | 22 | 0.8% | View All 6 Rows |
Sex and Age in Seagraves
Sex and Age in Seagraves
The most populous age groups in Seagraves are 5 to 9 Years (178 | 13.4%) for men and 5 to 9 Years (161 | 11.2%) for women.
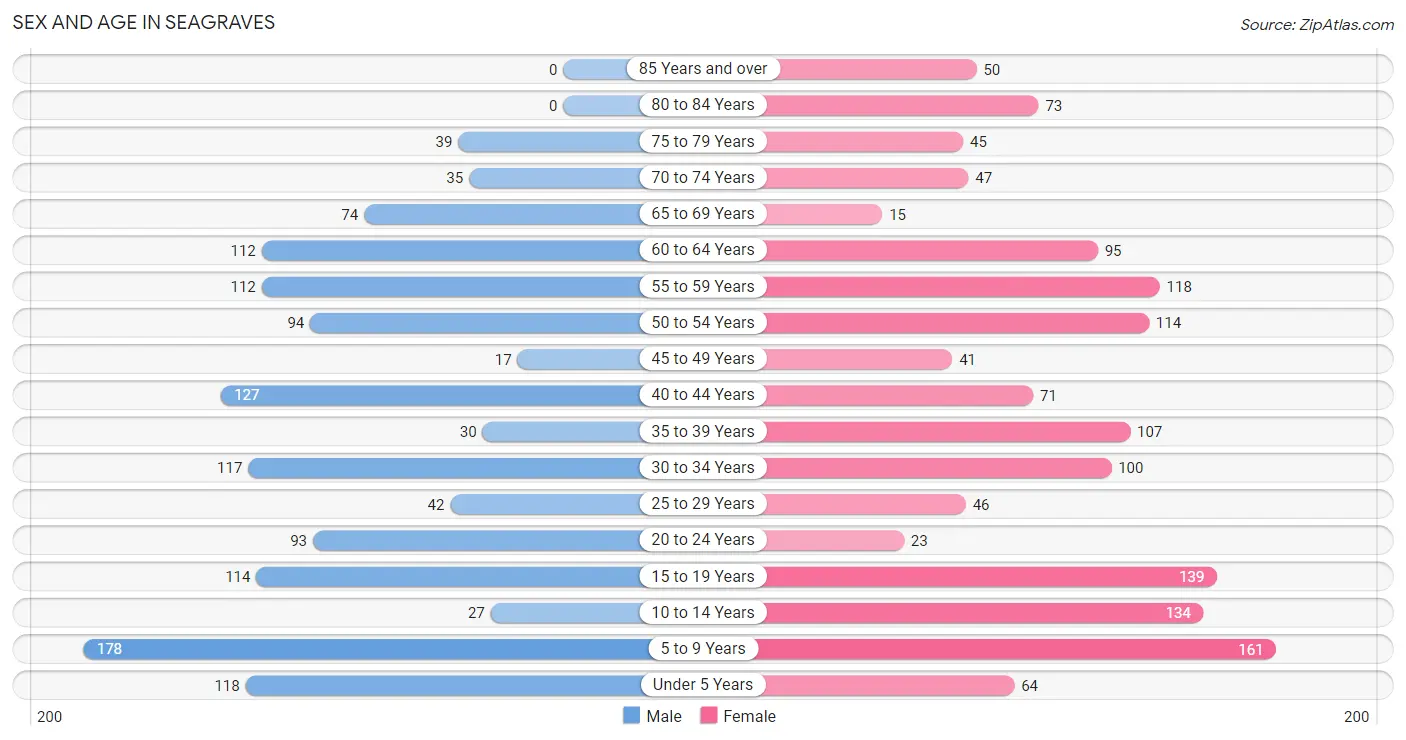
| Age Bracket | Male | Female |
| Under 5 Years | 118 (8.9%) | 64 (4.4%) |
| 5 to 9 Years | 178 (13.4%) | 161 (11.2%) |
| 10 to 14 Years | 27 (2.0%) | 134 (9.3%) |
| 15 to 19 Years | 114 (8.6%) | 139 (9.6%) |
| 20 to 24 Years | 93 (7.0%) | 23 (1.6%) |
| 25 to 29 Years | 42 (3.2%) | 46 (3.2%) |
| 30 to 34 Years | 117 (8.8%) | 100 (6.9%) |
| 35 to 39 Years | 30 (2.3%) | 107 (7.4%) |
| 40 to 44 Years | 127 (9.6%) | 71 (4.9%) |
| 45 to 49 Years | 17 (1.3%) | 41 (2.8%) |
| 50 to 54 Years | 94 (7.1%) | 114 (7.9%) |
| 55 to 59 Years | 112 (8.4%) | 118 (8.2%) |
| 60 to 64 Years | 112 (8.4%) | 95 (6.6%) |
| 65 to 69 Years | 74 (5.6%) | 15 (1.0%) |
| 70 to 74 Years | 35 (2.6%) | 47 (3.3%) |
| 75 to 79 Years | 39 (2.9%) | 45 (3.1%) |
| 80 to 84 Years | 0 (0.0%) | 73 (5.1%) |
| 85 Years and over | 0 (0.0%) | 50 (3.5%) |
| Total | 1,329 (100.0%) | 1,443 (100.0%) |
Families and Households in Seagraves
Median Family Size in Seagraves
The median family size in Seagraves is 3.30 persons per family, with single male/father families (73 | 10.5%) accounting for the largest median family size of 3.97 persons per family. On the other hand, married-couple families (503 | 72.7%) represent the smallest median family size with 3.12 persons per family.
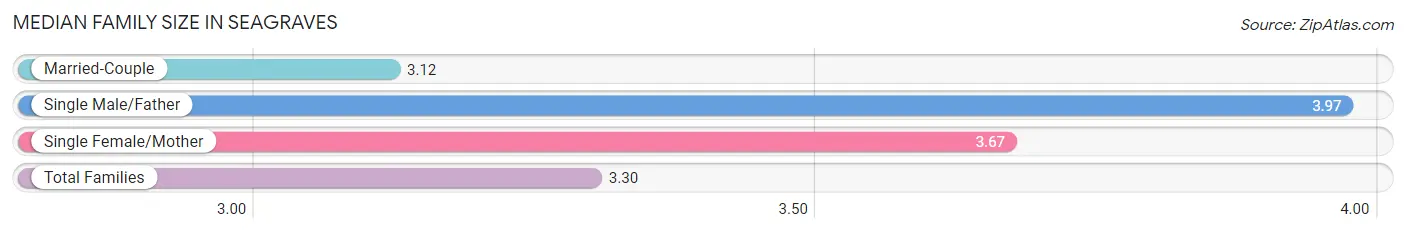
| Family Type | # Families | Family Size |
| Married-Couple | 503 (72.7%) | 3.12 |
| Single Male/Father | 73 (10.5%) | 3.97 |
| Single Female/Mother | 116 (16.8%) | 3.67 |
| Total Families | 692 (100.0%) | 3.30 |
Median Household Size in Seagraves
The median household size in Seagraves is 2.59 persons per household, with single female/mother households (116 | 10.8%) accounting for the largest median household size of 4.03 persons per household. non-family households (379 | 35.4%) represent the smallest median household size with 1.06 persons per household.
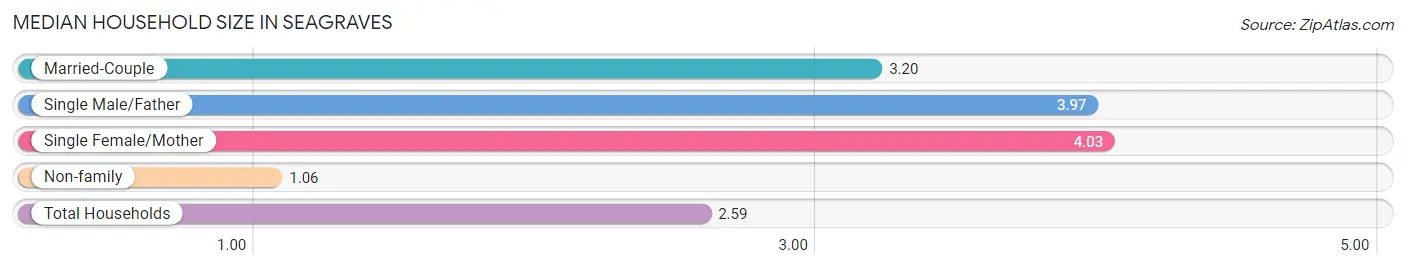
| Household Type | # Households | Household Size |
| Married-Couple | 503 (47.0%) | 3.20 |
| Single Male/Father | 73 (6.8%) | 3.97 |
| Single Female/Mother | 116 (10.8%) | 4.03 |
| Non-family | 379 (35.4%) | 1.06 |
| Total Households | 1,071 (100.0%) | 2.59 |
Household Size by Marriage Status in Seagraves
Out of a total of 1,071 households in Seagraves, 692 (64.6%) are family households, while 379 (35.4%) are nonfamily households. The most numerous type of family households are 2-person households, comprising 262, and the most common type of nonfamily households are 1-person households, comprising 350.
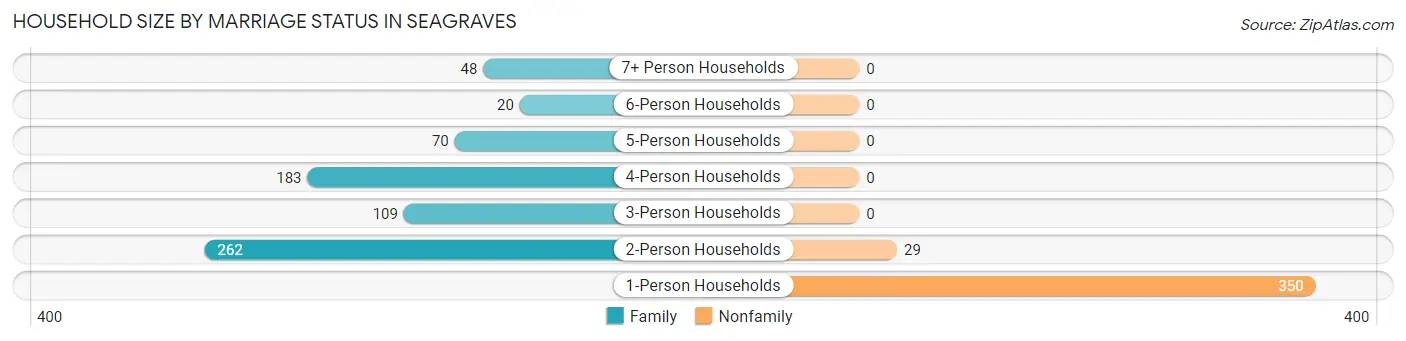
| Household Size | Family Households | Nonfamily Households |
| 1-Person Households | - | 350 (32.7%) |
| 2-Person Households | 262 (24.5%) | 29 (2.7%) |
| 3-Person Households | 109 (10.2%) | 0 (0.0%) |
| 4-Person Households | 183 (17.1%) | 0 (0.0%) |
| 5-Person Households | 70 (6.5%) | 0 (0.0%) |
| 6-Person Households | 20 (1.9%) | 0 (0.0%) |
| 7+ Person Households | 48 (4.5%) | 0 (0.0%) |
| Total | 692 (64.6%) | 379 (35.4%) |
Female Fertility in Seagraves
Fertility by Age in Seagraves
Average fertility rate in Seagraves is 136.0 births per 1,000 women. Women in the age bracket of 35 to 50 years have the highest fertility rate with 213.0 births per 1,000 women. Women in the age bracket of 35 to 50 years acount for 69.7% of all women with births.
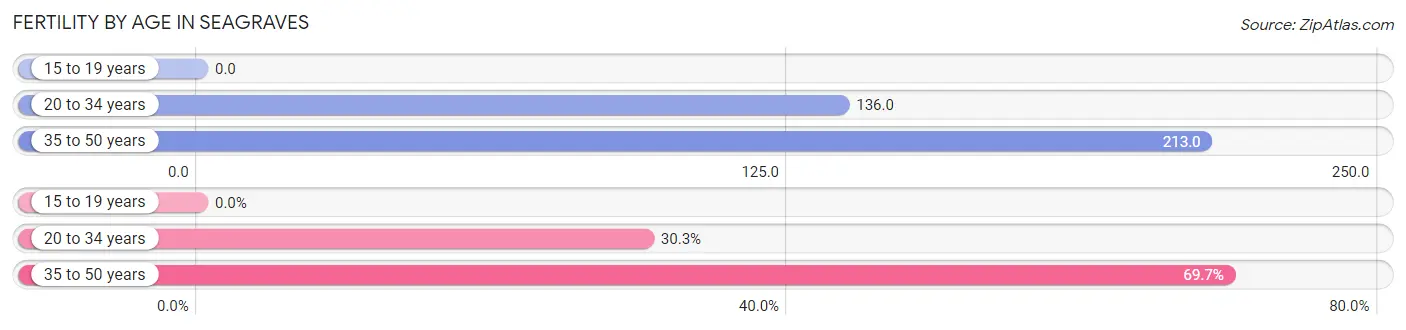
| Age Bracket | Women with Births | Births / 1,000 Women |
| 15 to 19 years | 0 (0.0%) | 0.0 |
| 20 to 34 years | 23 (30.3%) | 136.0 |
| 35 to 50 years | 53 (69.7%) | 213.0 |
| Total | 76 (100.0%) | 136.0 |
Fertility by Age by Marriage Status in Seagraves
67.1% of women with births (76) in Seagraves are married. The highest percentage of unmarried women with births falls into 35 to 50 years age bracket with 47.2% of them unmarried at the time of birth, while the lowest percentage of unmarried women with births belong to 20 to 34 years age bracket with 0.0% of them unmarried.
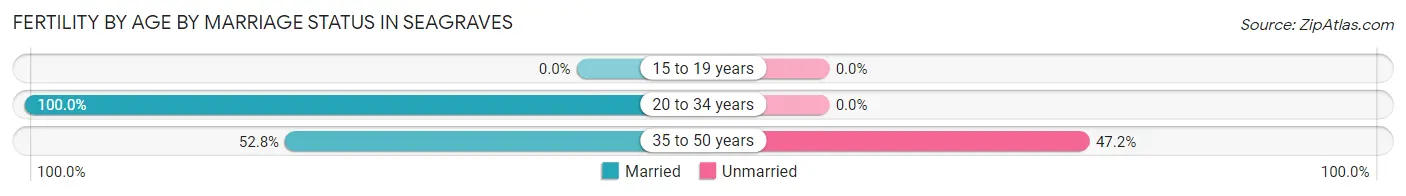
| Age Bracket | Married | Unmarried |
| 15 to 19 years | 0 (0.0%) | 0 (0.0%) |
| 20 to 34 years | 23 (100.0%) | 0 (0.0%) |
| 35 to 50 years | 28 (52.8%) | 25 (47.2%) |
| Total | 51 (67.1%) | 25 (32.9%) |
Fertility by Education in Seagraves
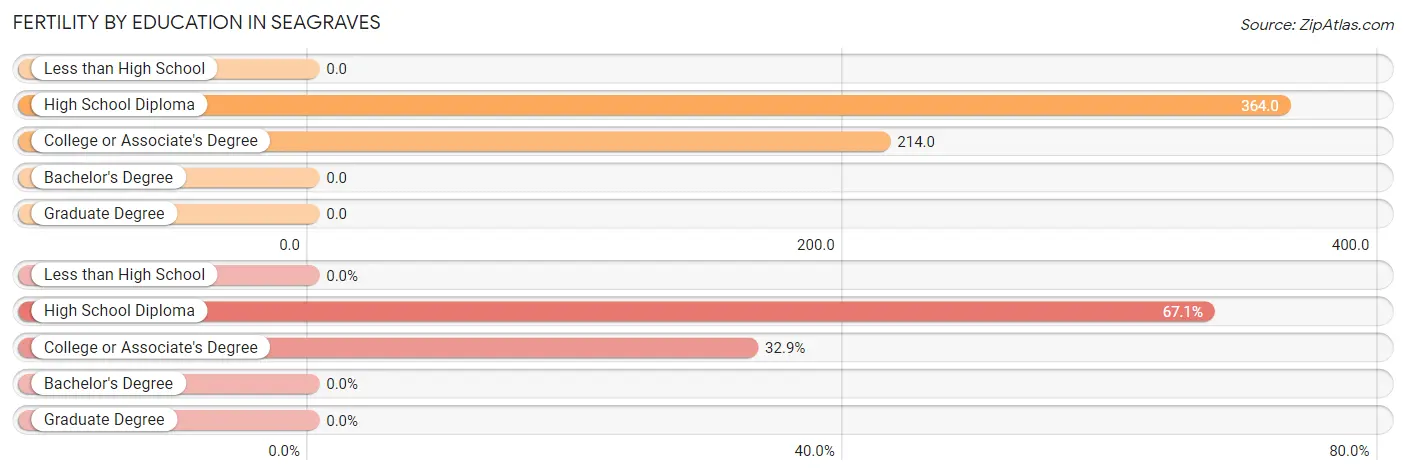
| Educational Attainment | Women with Births | Births / 1,000 Women |
| Less than High School | 0 (0.0%) | 0.0 |
| High School Diploma | 51 (67.1%) | 364.0 |
| College or Associate's Degree | 25 (32.9%) | 214.0 |
| Bachelor's Degree | 0 (0.0%) | 0.0 |
| Graduate Degree | 0 (0.0%) | 0.0 |
| Total | 76 (100.0%) | 136.0 |
Fertility by Education by Marriage Status in Seagraves
32.9% of women with births in Seagraves are unmarried. Women with the educational attainment of high school diploma are most likely to be married with 100.0% of them married at childbirth, while women with the educational attainment of college or associate's degree are least likely to be married with 100.0% of them unmarried at childbirth.
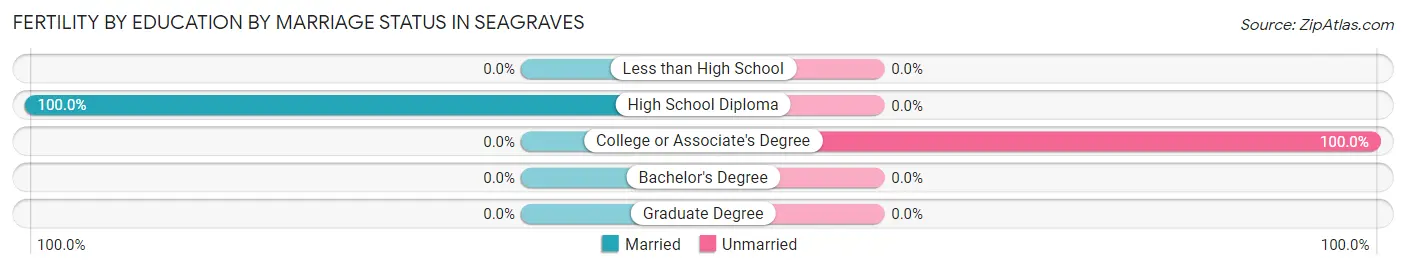
| Educational Attainment | Married | Unmarried |
| Less than High School | 0 (0.0%) | 0 (0.0%) |
| High School Diploma | 51 (100.0%) | 0 (0.0%) |
| College or Associate's Degree | 0 (0.0%) | 25 (100.0%) |
| Bachelor's Degree | 0 (0.0%) | 0 (0.0%) |
| Graduate Degree | 0 (0.0%) | 0 (0.0%) |
| Total | 51 (67.1%) | 25 (32.9%) |
Employment Characteristics in Seagraves
Employment by Class of Employer in Seagraves
Among the 1,097 employed individuals in Seagraves, private company employees (810 | 73.8%), local government employees (183 | 16.7%), and self-employed (not incorporated) (44 | 4.0%) make up the most common classes of employment.
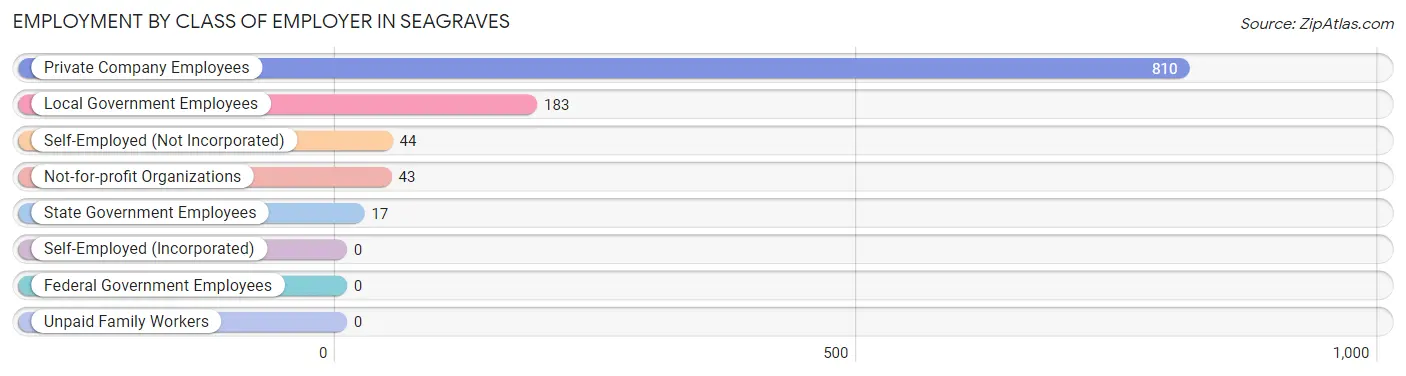
| Employer Class | # Employees | % Employees |
| Private Company Employees | 810 | 73.8% |
| Self-Employed (Incorporated) | 0 | 0.0% |
| Self-Employed (Not Incorporated) | 44 | 4.0% |
| Not-for-profit Organizations | 43 | 3.9% |
| Local Government Employees | 183 | 16.7% |
| State Government Employees | 17 | 1.5% |
| Federal Government Employees | 0 | 0.0% |
| Unpaid Family Workers | 0 | 0.0% |
| Total | 1,097 | 100.0% |
Employment Status by Age in Seagraves
According to the labor force statistics for Seagraves, out of the total population over 16 years of age (2,063), 56.4% or 1,164 individuals are in the labor force, with 2.5% or 29 of them unemployed. The age group with the highest labor force participation rate is 35 to 44 years, with 100.0% or 335 individuals in the labor force. Within the labor force, the 25 to 29 years age range has the highest percentage of unemployed individuals, with 35.4% or 23 of them being unemployed.
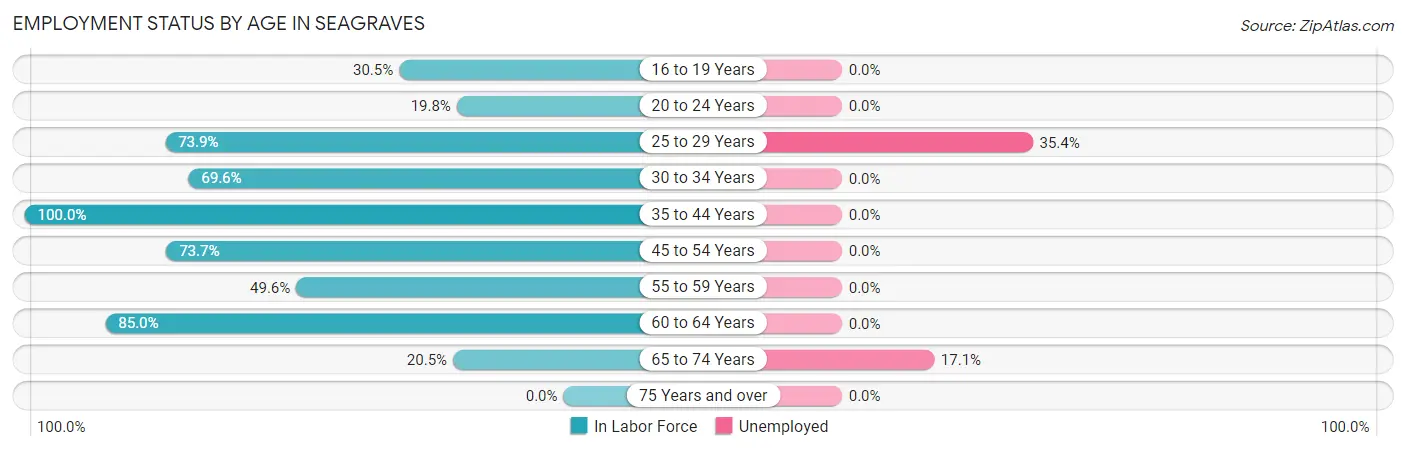
| Age Bracket | In Labor Force | Unemployed |
| 16 to 19 Years | 69 (30.5%) | 0 (0.0%) |
| 20 to 24 Years | 23 (19.8%) | 0 (0.0%) |
| 25 to 29 Years | 65 (73.9%) | 23 (35.4%) |
| 30 to 34 Years | 151 (69.6%) | 0 (0.0%) |
| 35 to 44 Years | 335 (100.0%) | 0 (0.0%) |
| 45 to 54 Years | 196 (73.7%) | 0 (0.0%) |
| 55 to 59 Years | 114 (49.6%) | 0 (0.0%) |
| 60 to 64 Years | 176 (85.0%) | 0 (0.0%) |
| 65 to 74 Years | 35 (20.5%) | 6 (17.1%) |
| 75 Years and over | 0 (0.0%) | 0 (0.0%) |
| Total | 1,164 (56.4%) | 29 (2.5%) |
Employment Status by Educational Attainment in Seagraves
According to labor force statistics for Seagraves, 77.2% of individuals (1,037) out of the total population between 25 and 64 years of age (1,343) are in the labor force, with 2.2% or 23 of them being unemployed. The group with the highest labor force participation rate are those with the educational attainment of high school diploma, with 89.3% or 453 individuals in the labor force. Within the labor force, individuals with college / associate degree education have the highest percentage of unemployment, with 7.1% or 23 of them being unemployed.
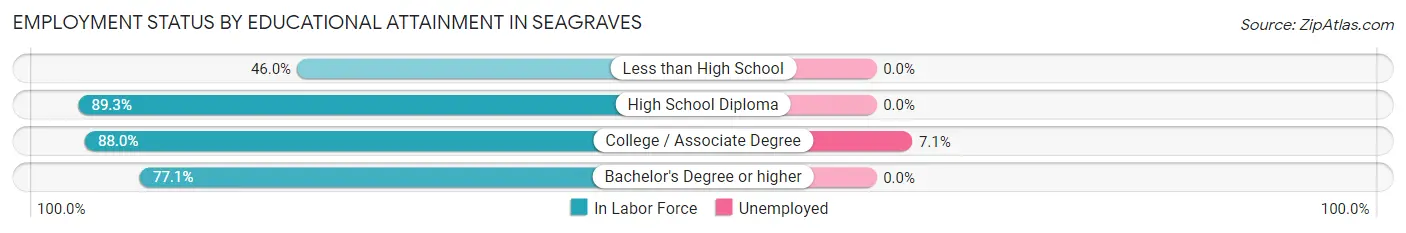
| Educational Attainment | In Labor Force | Unemployed |
| Less than High School | 149 (46.0%) | 0 (0.0%) |
| High School Diploma | 453 (89.3%) | 0 (0.0%) |
| College / Associate Degree | 324 (88.0%) | 26 (7.1%) |
| Bachelor's Degree or higher | 111 (77.1%) | 0 (0.0%) |
| Total | 1,037 (77.2%) | 30 (2.2%) |
Employment Occupations by Sex in Seagraves
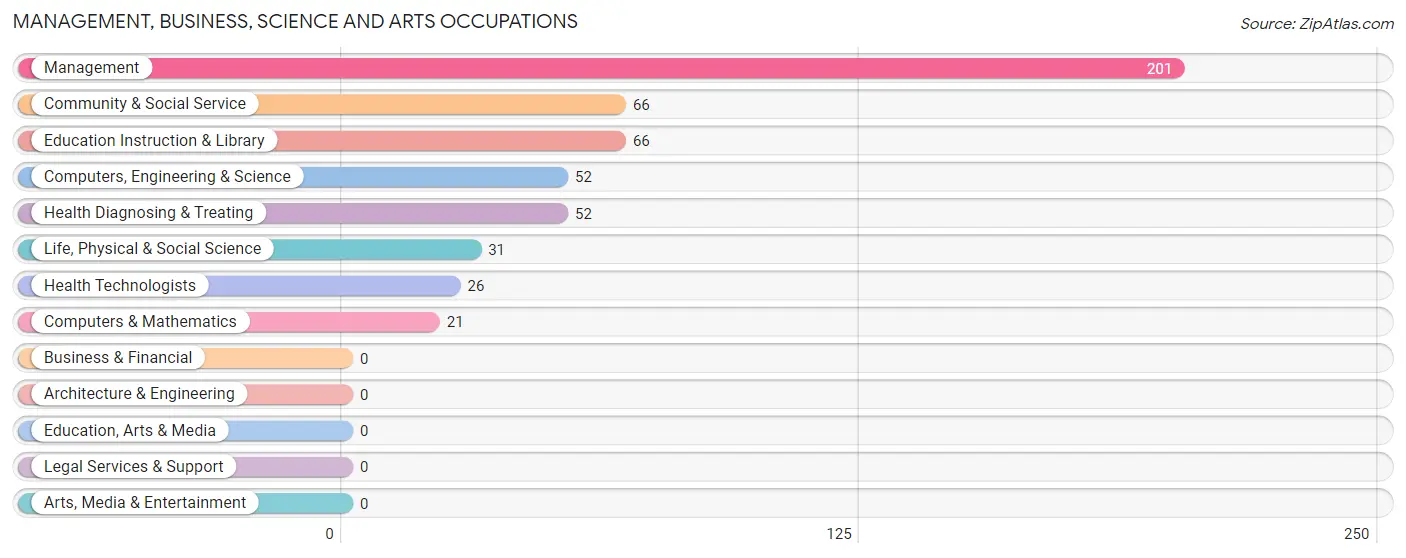
Management, Business, Science and Arts Occupations
The most common Management, Business, Science and Arts occupations in Seagraves are Management (201 | 17.7%), Community & Social Service (66 | 5.8%), Education Instruction & Library (66 | 5.8%), Computers, Engineering & Science (52 | 4.6%), and Health Diagnosing & Treating (52 | 4.6%).
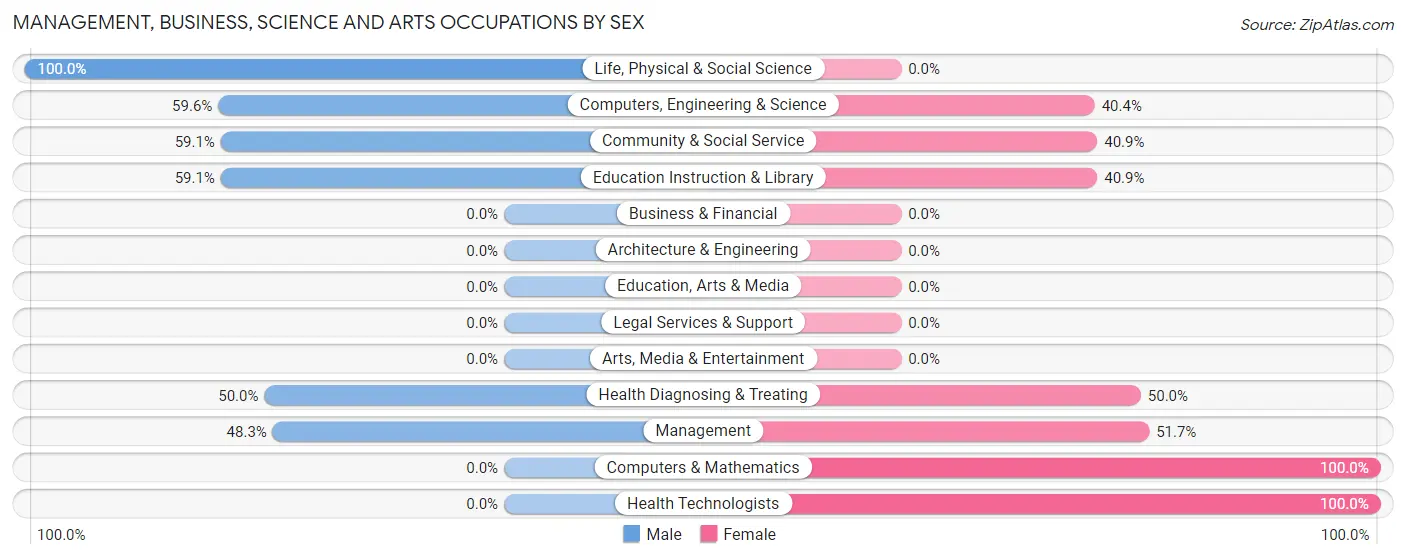
Management, Business, Science and Arts Occupations by Sex
Within the Management, Business, Science and Arts occupations in Seagraves, the most male-oriented occupations are Life, Physical & Social Science (100.0%), Computers, Engineering & Science (59.6%), and Community & Social Service (59.1%), while the most female-oriented occupations are Computers & Mathematics (100.0%), Health Technologists (100.0%), and Management (51.7%).
| Occupation | Male | Female |
| Management | 97 (48.3%) | 104 (51.7%) |
| Business & Financial | 0 (0.0%) | 0 (0.0%) |
| Computers, Engineering & Science | 31 (59.6%) | 21 (40.4%) |
| Computers & Mathematics | 0 (0.0%) | 21 (100.0%) |
| Architecture & Engineering | 0 (0.0%) | 0 (0.0%) |
| Life, Physical & Social Science | 31 (100.0%) | 0 (0.0%) |
| Community & Social Service | 39 (59.1%) | 27 (40.9%) |
| Education, Arts & Media | 0 (0.0%) | 0 (0.0%) |
| Legal Services & Support | 0 (0.0%) | 0 (0.0%) |
| Education Instruction & Library | 39 (59.1%) | 27 (40.9%) |
| Arts, Media & Entertainment | 0 (0.0%) | 0 (0.0%) |
| Health Diagnosing & Treating | 26 (50.0%) | 26 (50.0%) |
| Health Technologists | 0 (0.0%) | 26 (100.0%) |
| Total (Category) | 193 (52.0%) | 178 (48.0%) |
| Total (Overall) | 711 (62.6%) | 424 (37.4%) |
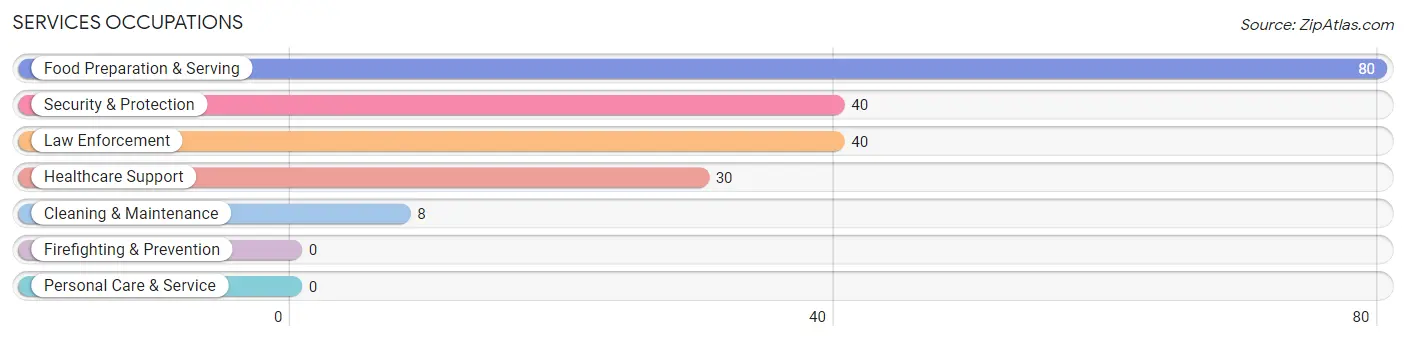
Services Occupations
The most common Services occupations in Seagraves are Food Preparation & Serving (80 | 7.0%), Security & Protection (40 | 3.5%), Law Enforcement (40 | 3.5%), Healthcare Support (30 | 2.6%), and Cleaning & Maintenance (8 | 0.7%).
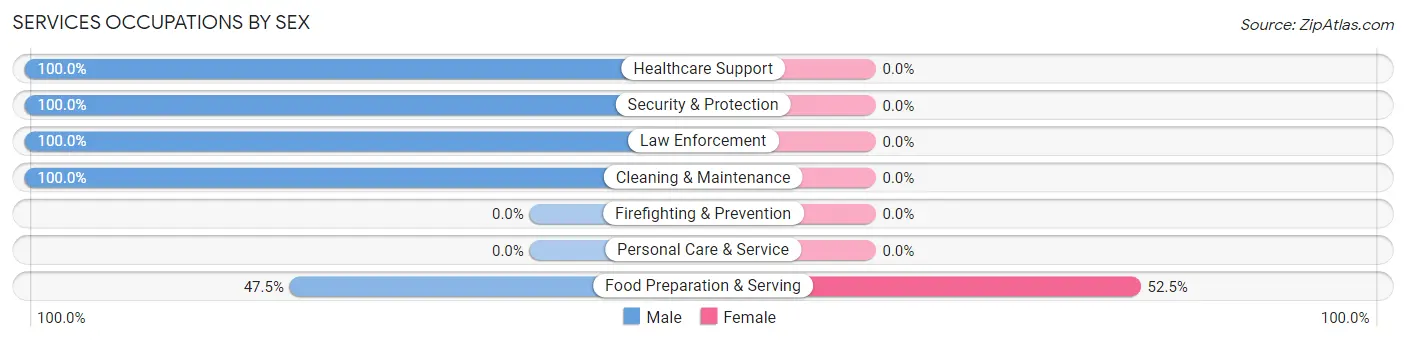
Services Occupations by Sex
| Occupation | Male | Female |
| Healthcare Support | 30 (100.0%) | 0 (0.0%) |
| Security & Protection | 40 (100.0%) | 0 (0.0%) |
| Firefighting & Prevention | 0 (0.0%) | 0 (0.0%) |
| Law Enforcement | 40 (100.0%) | 0 (0.0%) |
| Food Preparation & Serving | 38 (47.5%) | 42 (52.5%) |
| Cleaning & Maintenance | 8 (100.0%) | 0 (0.0%) |
| Personal Care & Service | 0 (0.0%) | 0 (0.0%) |
| Total (Category) | 116 (73.4%) | 42 (26.6%) |
| Total (Overall) | 711 (62.6%) | 424 (37.4%) |
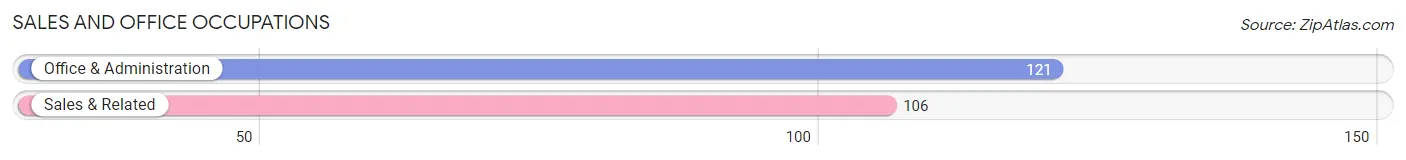
Sales and Office Occupations
The most common Sales and Office occupations in Seagraves are Office & Administration (121 | 10.7%), and Sales & Related (106 | 9.3%).
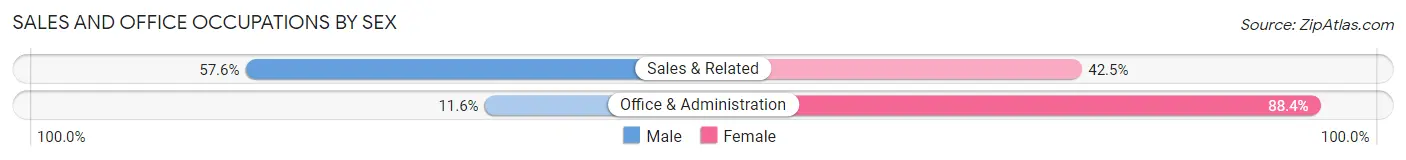
Sales and Office Occupations by Sex
| Occupation | Male | Female |
| Sales & Related | 61 (57.6%) | 45 (42.4%) |
| Office & Administration | 14 (11.6%) | 107 (88.4%) |
| Total (Category) | 75 (33.0%) | 152 (67.0%) |
| Total (Overall) | 711 (62.6%) | 424 (37.4%) |
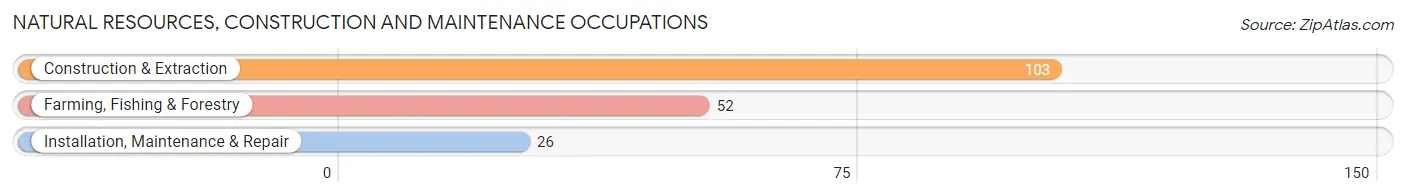
Natural Resources, Construction and Maintenance Occupations
The most common Natural Resources, Construction and Maintenance occupations in Seagraves are Construction & Extraction (103 | 9.1%), Farming, Fishing & Forestry (52 | 4.6%), and Installation, Maintenance & Repair (26 | 2.3%).
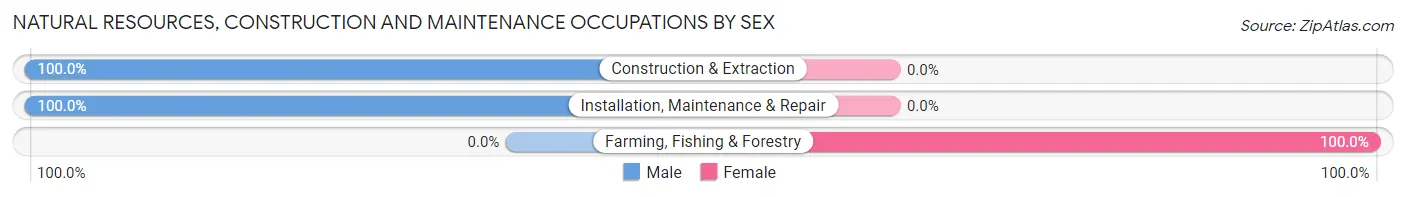
Natural Resources, Construction and Maintenance Occupations by Sex
| Occupation | Male | Female |
| Farming, Fishing & Forestry | 0 (0.0%) | 52 (100.0%) |
| Construction & Extraction | 103 (100.0%) | 0 (0.0%) |
| Installation, Maintenance & Repair | 26 (100.0%) | 0 (0.0%) |
| Total (Category) | 129 (71.3%) | 52 (28.7%) |
| Total (Overall) | 711 (62.6%) | 424 (37.4%) |
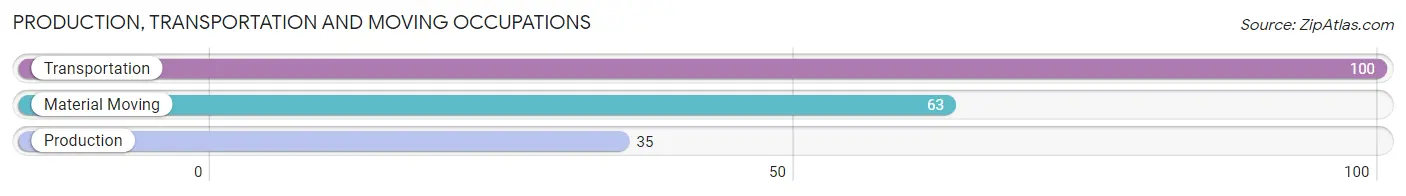
Production, Transportation and Moving Occupations
The most common Production, Transportation and Moving occupations in Seagraves are Transportation (100 | 8.8%), Material Moving (63 | 5.6%), and Production (35 | 3.1%).
Production, Transportation and Moving Occupations by Sex
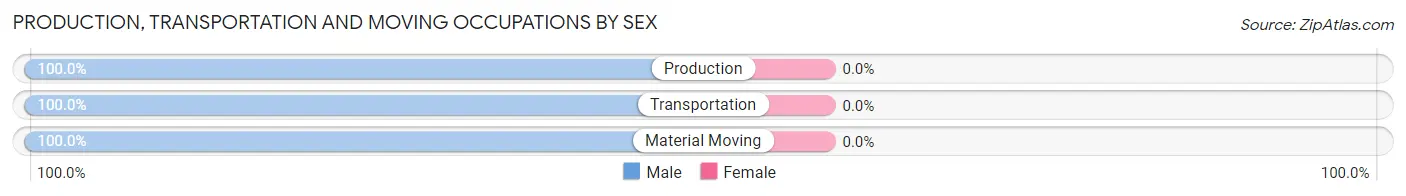
| Occupation | Male | Female |
| Production | 35 (100.0%) | 0 (0.0%) |
| Transportation | 100 (100.0%) | 0 (0.0%) |
| Material Moving | 63 (100.0%) | 0 (0.0%) |
| Total (Category) | 198 (100.0%) | 0 (0.0%) |
| Total (Overall) | 711 (62.6%) | 424 (37.4%) |
Employment Industries by Sex in Seagraves
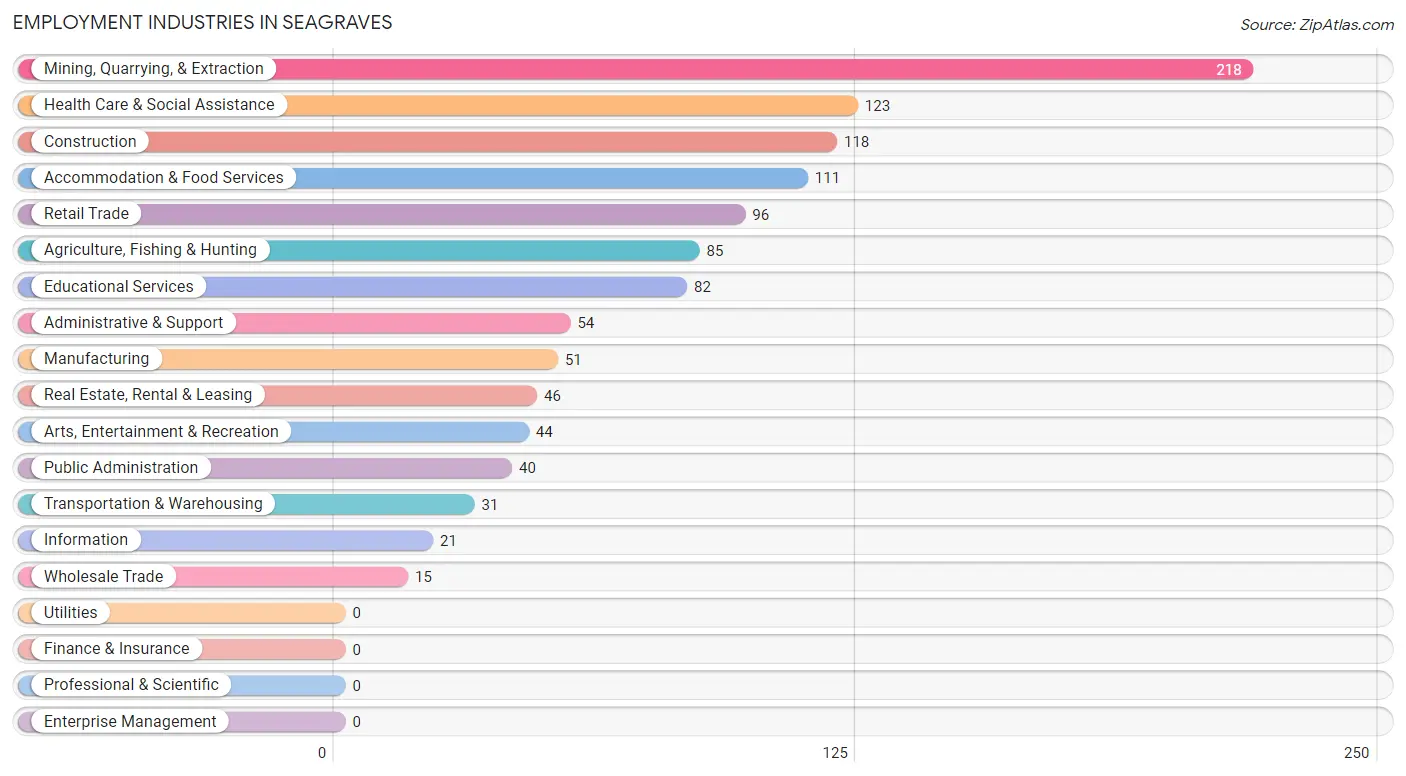
Employment Industries in Seagraves
The major employment industries in Seagraves include Mining, Quarrying, & Extraction (218 | 19.2%), Health Care & Social Assistance (123 | 10.8%), Construction (118 | 10.4%), Accommodation & Food Services (111 | 9.8%), and Retail Trade (96 | 8.5%).
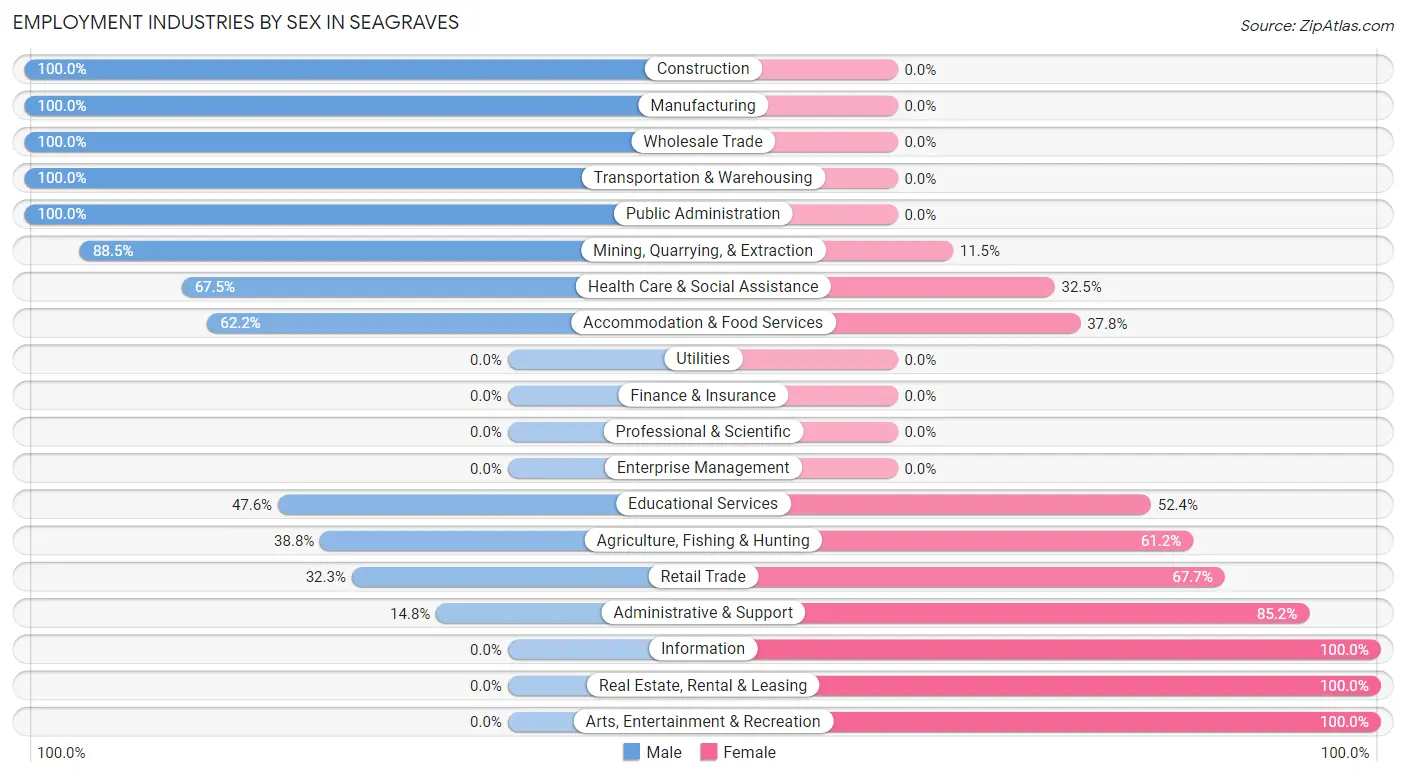
Employment Industries by Sex in Seagraves
The Seagraves industries that see more men than women are Construction (100.0%), Manufacturing (100.0%), and Wholesale Trade (100.0%), whereas the industries that tend to have a higher number of women are Information (100.0%), Real Estate, Rental & Leasing (100.0%), and Arts, Entertainment & Recreation (100.0%).
| Industry | Male | Female |
| Agriculture, Fishing & Hunting | 33 (38.8%) | 52 (61.2%) |
| Mining, Quarrying, & Extraction | 193 (88.5%) | 25 (11.5%) |
| Construction | 118 (100.0%) | 0 (0.0%) |
| Manufacturing | 51 (100.0%) | 0 (0.0%) |
| Wholesale Trade | 15 (100.0%) | 0 (0.0%) |
| Retail Trade | 31 (32.3%) | 65 (67.7%) |
| Transportation & Warehousing | 31 (100.0%) | 0 (0.0%) |
| Utilities | 0 (0.0%) | 0 (0.0%) |
| Information | 0 (0.0%) | 21 (100.0%) |
| Finance & Insurance | 0 (0.0%) | 0 (0.0%) |
| Real Estate, Rental & Leasing | 0 (0.0%) | 46 (100.0%) |
| Professional & Scientific | 0 (0.0%) | 0 (0.0%) |
| Enterprise Management | 0 (0.0%) | 0 (0.0%) |
| Administrative & Support | 8 (14.8%) | 46 (85.2%) |
| Educational Services | 39 (47.6%) | 43 (52.4%) |
| Health Care & Social Assistance | 83 (67.5%) | 40 (32.5%) |
| Arts, Entertainment & Recreation | 0 (0.0%) | 44 (100.0%) |
| Accommodation & Food Services | 69 (62.2%) | 42 (37.8%) |
| Public Administration | 40 (100.0%) | 0 (0.0%) |
| Total | 711 (62.6%) | 424 (37.4%) |
Education in Seagraves
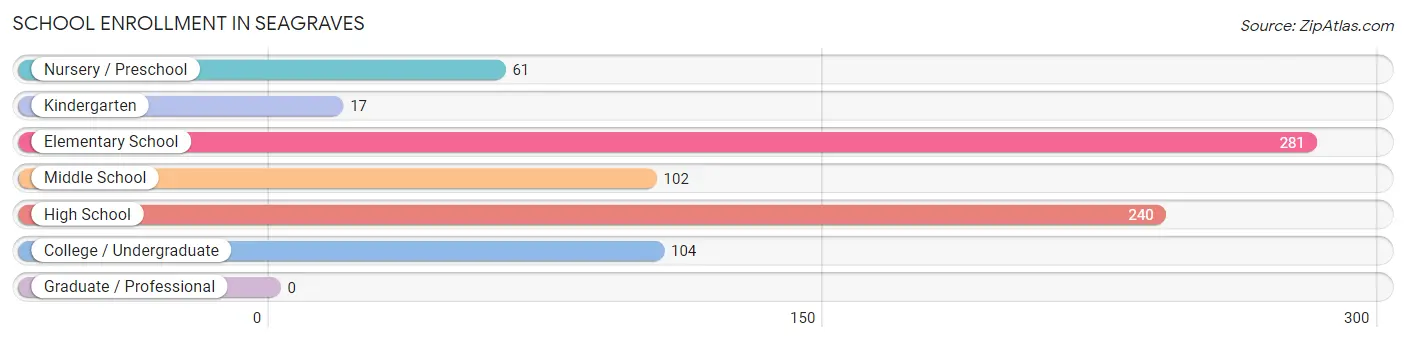
School Enrollment in Seagraves
The most common levels of schooling among the 805 students in Seagraves are elementary school (281 | 34.9%), high school (240 | 29.8%), and college / undergraduate (104 | 12.9%).
| School Level | # Students | % Students |
| Nursery / Preschool | 61 | 7.6% |
| Kindergarten | 17 | 2.1% |
| Elementary School | 281 | 34.9% |
| Middle School | 102 | 12.7% |
| High School | 240 | 29.8% |
| College / Undergraduate | 104 | 12.9% |
| Graduate / Professional | 0 | 0.0% |
| Total | 805 | 100.0% |
School Enrollment by Age by Funding Source in Seagraves
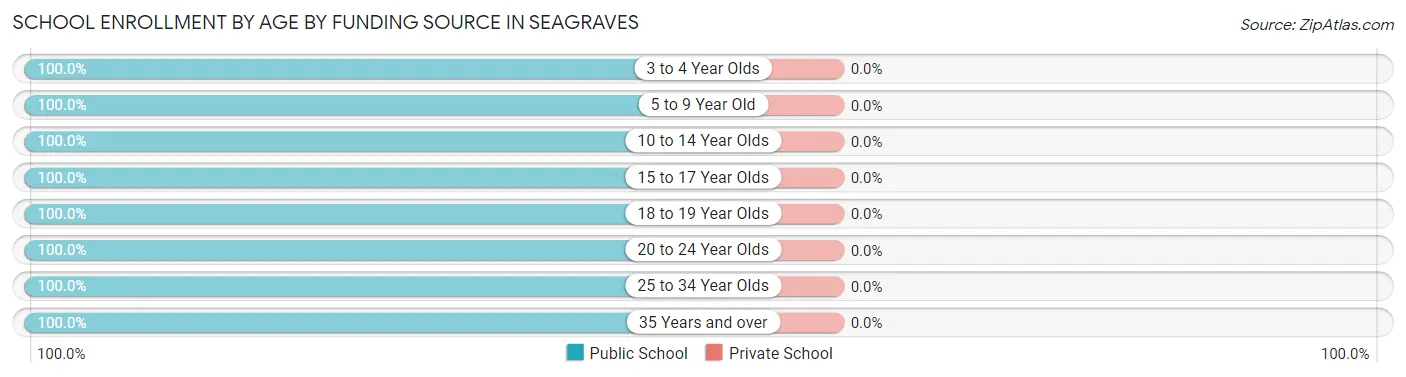
| Age Bracket | Public School | Private School |
| 3 to 4 Year Olds | 30 (100.0%) | 0 (0.0%) |
| 5 to 9 Year Old | 302 (100.0%) | 0 (0.0%) |
| 10 to 14 Year Olds | 161 (100.0%) | 0 (0.0%) |
| 15 to 17 Year Olds | 188 (100.0%) | 0 (0.0%) |
| 18 to 19 Year Olds | 38 (100.0%) | 0 (0.0%) |
| 20 to 24 Year Olds | 29 (100.0%) | 0 (0.0%) |
| 25 to 34 Year Olds | 23 (100.0%) | 0 (0.0%) |
| 35 Years and over | 34 (100.0%) | 0 (0.0%) |
| Total | 805 (100.0%) | 0 (0.0%) |
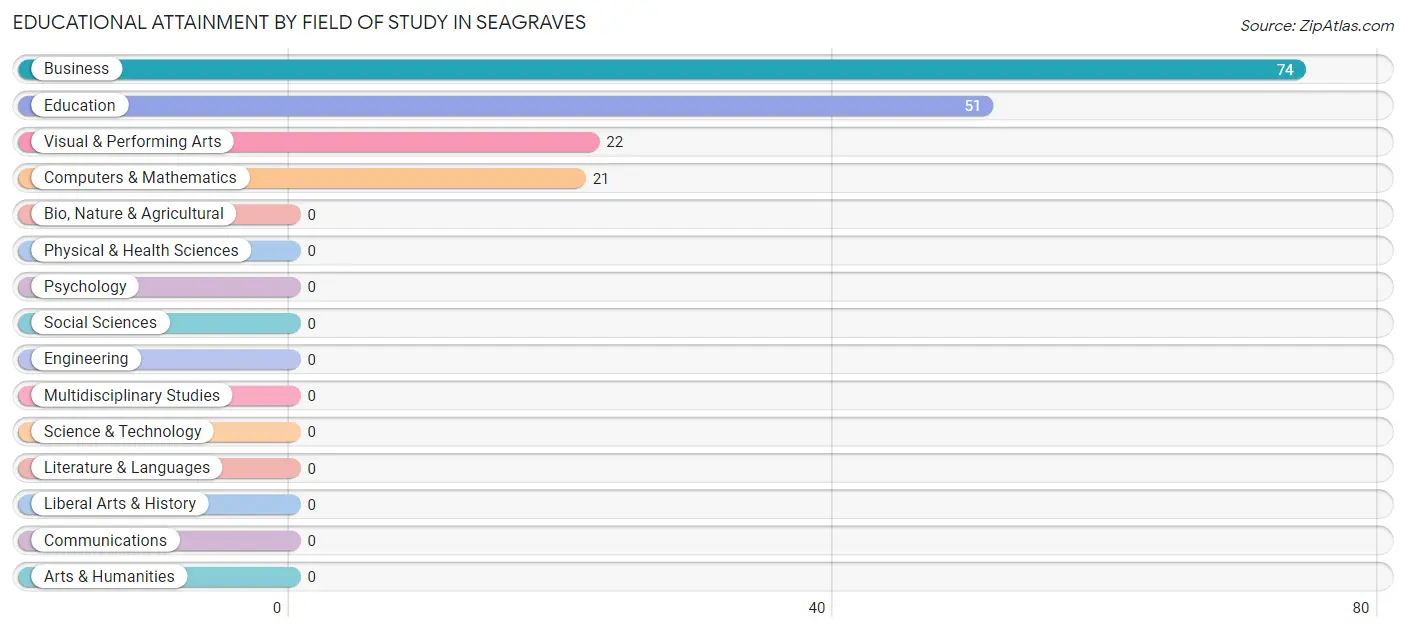
Educational Attainment by Field of Study in Seagraves
Business (74 | 44.1%), education (51 | 30.4%), visual & performing arts (22 | 13.1%), and computers & mathematics (21 | 12.5%) are the most common fields of study among 168 individuals in Seagraves who have obtained a bachelor's degree or higher.
| Field of Study | # Graduates | % Graduates |
| Computers & Mathematics | 21 | 12.5% |
| Bio, Nature & Agricultural | 0 | 0.0% |
| Physical & Health Sciences | 0 | 0.0% |
| Psychology | 0 | 0.0% |
| Social Sciences | 0 | 0.0% |
| Engineering | 0 | 0.0% |
| Multidisciplinary Studies | 0 | 0.0% |
| Science & Technology | 0 | 0.0% |
| Business | 74 | 44.1% |
| Education | 51 | 30.4% |
| Literature & Languages | 0 | 0.0% |
| Liberal Arts & History | 0 | 0.0% |
| Visual & Performing Arts | 22 | 13.1% |
| Communications | 0 | 0.0% |
| Arts & Humanities | 0 | 0.0% |
| Total | 168 | 100.0% |
Transportation & Commute in Seagraves
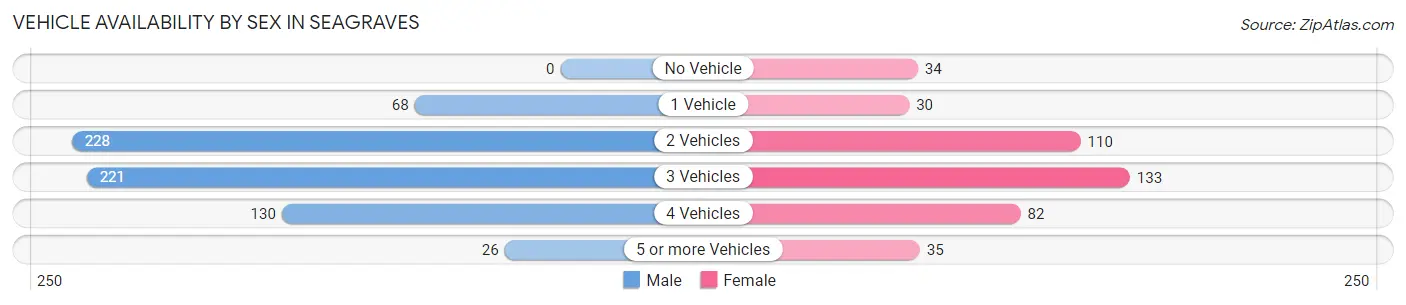
Vehicle Availability by Sex in Seagraves
The most prevalent vehicle ownership categories in Seagraves are males with 2 vehicles (228, accounting for 33.9%) and females with 2 vehicles (110, making up 53.8%).
| Vehicles Available | Male | Female |
| No Vehicle | 0 (0.0%) | 34 (8.0%) |
| 1 Vehicle | 68 (10.1%) | 30 (7.1%) |
| 2 Vehicles | 228 (33.9%) | 110 (25.9%) |
| 3 Vehicles | 221 (32.8%) | 133 (31.4%) |
| 4 Vehicles | 130 (19.3%) | 82 (19.3%) |
| 5 or more Vehicles | 26 (3.9%) | 35 (8.3%) |
| Total | 673 (100.0%) | 424 (100.0%) |
Commute Time in Seagraves
The most frequently occuring commute durations in Seagraves are less than 5 minutes (234 commuters, 22.4%), 20 to 24 minutes (221 commuters, 21.1%), and 15 to 19 minutes (146 commuters, 14.0%).
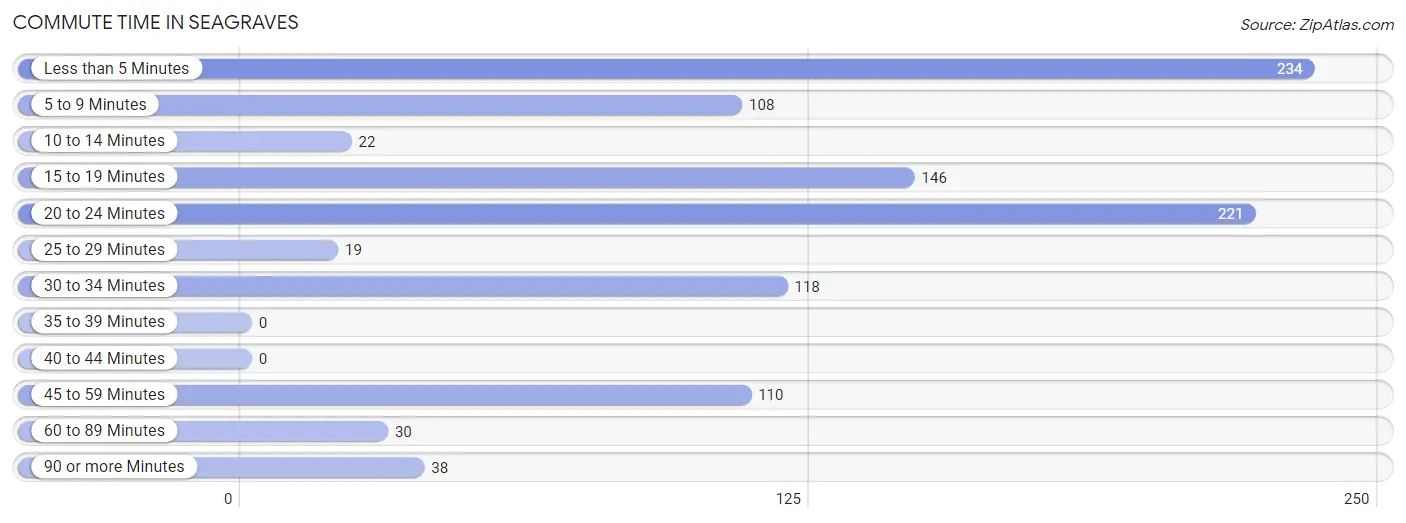
| Commute Time | # Commuters | % Commuters |
| Less than 5 Minutes | 234 | 22.4% |
| 5 to 9 Minutes | 108 | 10.3% |
| 10 to 14 Minutes | 22 | 2.1% |
| 15 to 19 Minutes | 146 | 14.0% |
| 20 to 24 Minutes | 221 | 21.1% |
| 25 to 29 Minutes | 19 | 1.8% |
| 30 to 34 Minutes | 118 | 11.3% |
| 35 to 39 Minutes | 0 | 0.0% |
| 40 to 44 Minutes | 0 | 0.0% |
| 45 to 59 Minutes | 110 | 10.5% |
| 60 to 89 Minutes | 30 | 2.9% |
| 90 or more Minutes | 38 | 3.6% |
Commute Time by Sex in Seagraves
The most common commute times in Seagraves are 20 to 24 minutes (174 commuters, 27.1%) for males and less than 5 minutes (124 commuters, 30.8%) for females.
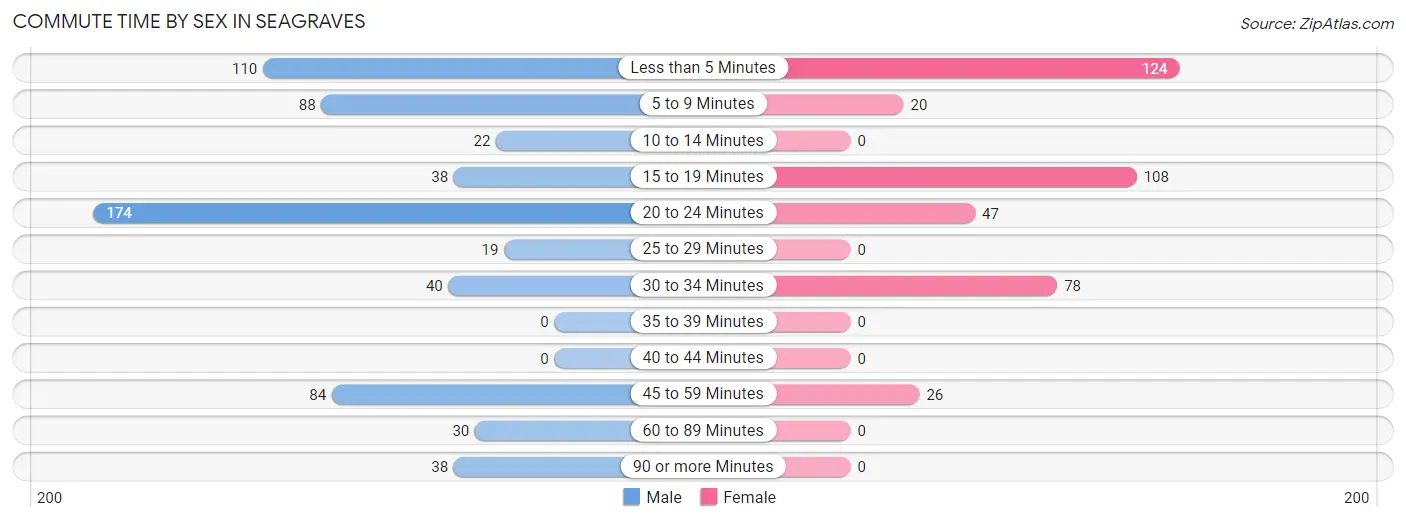
| Commute Time | Male | Female |
| Less than 5 Minutes | 110 (17.1%) | 124 (30.8%) |
| 5 to 9 Minutes | 88 (13.7%) | 20 (5.0%) |
| 10 to 14 Minutes | 22 (3.4%) | 0 (0.0%) |
| 15 to 19 Minutes | 38 (5.9%) | 108 (26.8%) |
| 20 to 24 Minutes | 174 (27.1%) | 47 (11.7%) |
| 25 to 29 Minutes | 19 (2.9%) | 0 (0.0%) |
| 30 to 34 Minutes | 40 (6.2%) | 78 (19.4%) |
| 35 to 39 Minutes | 0 (0.0%) | 0 (0.0%) |
| 40 to 44 Minutes | 0 (0.0%) | 0 (0.0%) |
| 45 to 59 Minutes | 84 (13.1%) | 26 (6.5%) |
| 60 to 89 Minutes | 30 (4.7%) | 0 (0.0%) |
| 90 or more Minutes | 38 (5.9%) | 0 (0.0%) |
Time of Departure to Work by Sex in Seagraves
The most frequent times of departure to work in Seagraves are 6:30 AM to 6:59 AM (232, 36.1%) for males and 8:00 AM to 8:29 AM (80, 19.9%) for females.
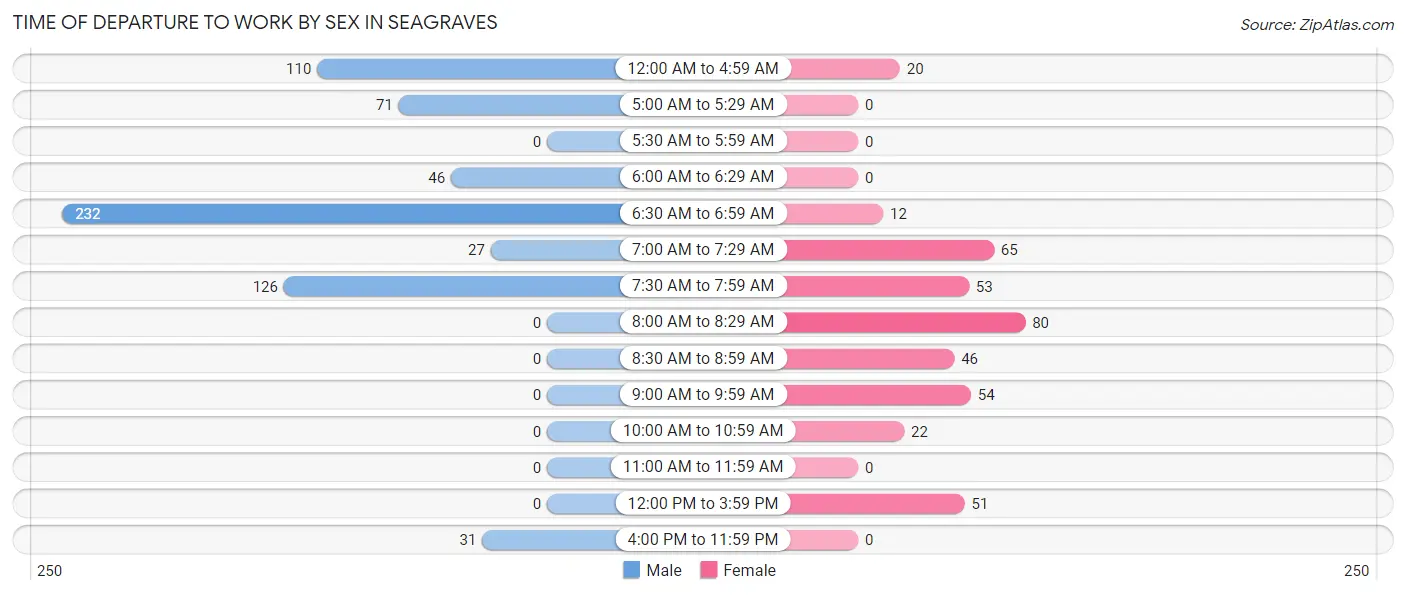
| Time of Departure | Male | Female |
| 12:00 AM to 4:59 AM | 110 (17.1%) | 20 (5.0%) |
| 5:00 AM to 5:29 AM | 71 (11.0%) | 0 (0.0%) |
| 5:30 AM to 5:59 AM | 0 (0.0%) | 0 (0.0%) |
| 6:00 AM to 6:29 AM | 46 (7.1%) | 0 (0.0%) |
| 6:30 AM to 6:59 AM | 232 (36.1%) | 12 (3.0%) |
| 7:00 AM to 7:29 AM | 27 (4.2%) | 65 (16.1%) |
| 7:30 AM to 7:59 AM | 126 (19.6%) | 53 (13.2%) |
| 8:00 AM to 8:29 AM | 0 (0.0%) | 80 (19.9%) |
| 8:30 AM to 8:59 AM | 0 (0.0%) | 46 (11.4%) |
| 9:00 AM to 9:59 AM | 0 (0.0%) | 54 (13.4%) |
| 10:00 AM to 10:59 AM | 0 (0.0%) | 22 (5.5%) |
| 11:00 AM to 11:59 AM | 0 (0.0%) | 0 (0.0%) |
| 12:00 PM to 3:59 PM | 0 (0.0%) | 51 (12.7%) |
| 4:00 PM to 11:59 PM | 31 (4.8%) | 0 (0.0%) |
| Total | 643 (100.0%) | 403 (100.0%) |
Housing Occupancy in Seagraves
Occupancy by Ownership in Seagraves
Of the total 1,071 dwellings in Seagraves, owner-occupied units account for 694 (64.8%), while renter-occupied units make up 377 (35.2%).
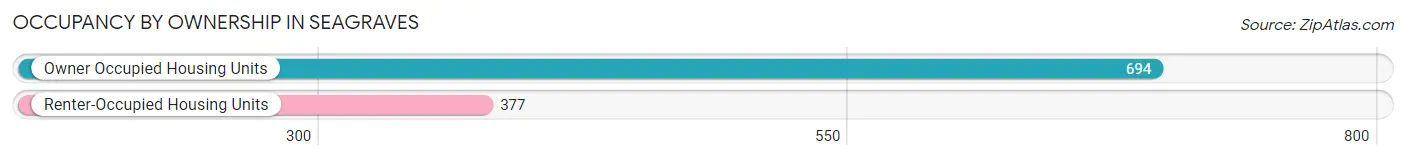
| Occupancy | # Housing Units | % Housing Units |
| Owner Occupied Housing Units | 694 | 64.8% |
| Renter-Occupied Housing Units | 377 | 35.2% |
| Total Occupied Housing Units | 1,071 | 100.0% |
Occupancy by Household Size in Seagraves
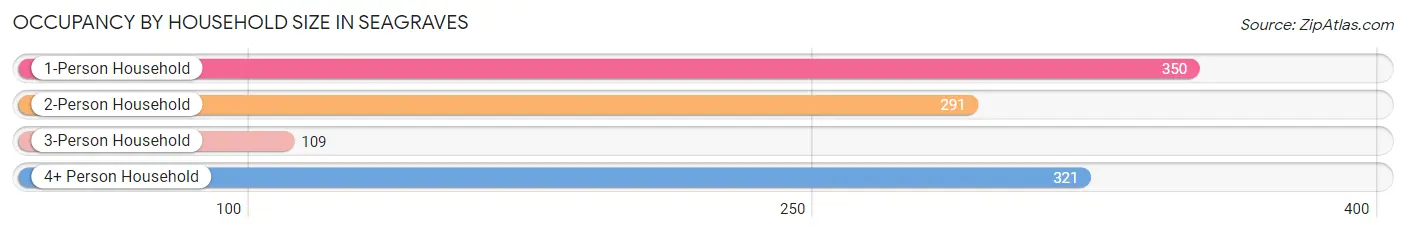
| Household Size | # Housing Units | % Housing Units |
| 1-Person Household | 350 | 32.7% |
| 2-Person Household | 291 | 27.2% |
| 3-Person Household | 109 | 10.2% |
| 4+ Person Household | 321 | 30.0% |
| Total Housing Units | 1,071 | 100.0% |
Occupancy by Ownership by Household Size in Seagraves
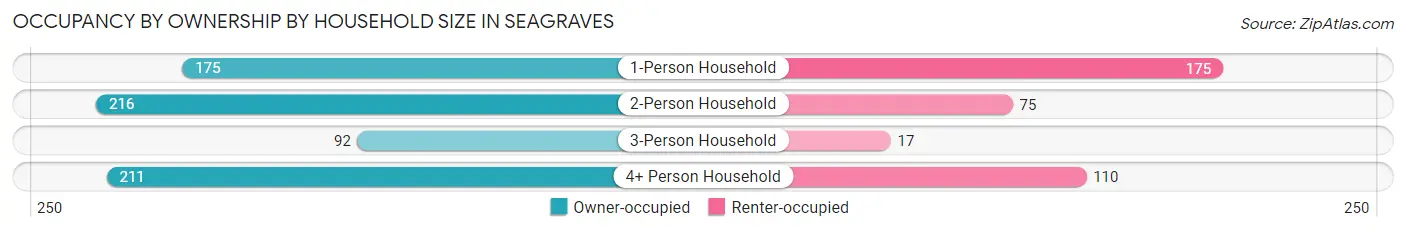
| Household Size | Owner-occupied | Renter-occupied |
| 1-Person Household | 175 (50.0%) | 175 (50.0%) |
| 2-Person Household | 216 (74.2%) | 75 (25.8%) |
| 3-Person Household | 92 (84.4%) | 17 (15.6%) |
| 4+ Person Household | 211 (65.7%) | 110 (34.3%) |
| Total Housing Units | 694 (64.8%) | 377 (35.2%) |
Occupancy by Educational Attainment in Seagraves
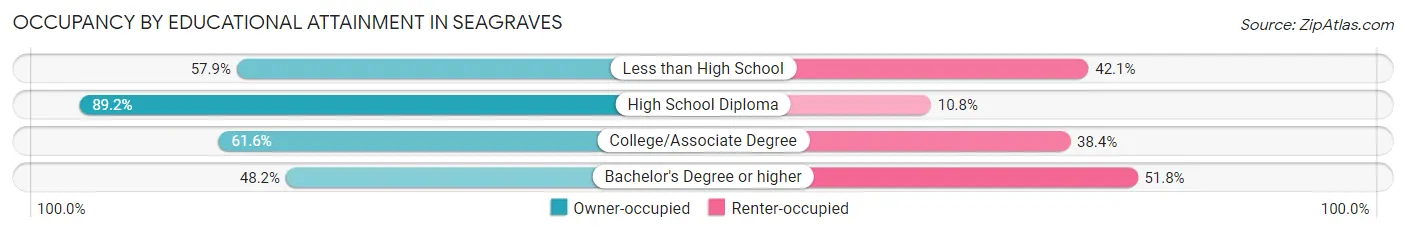
| Household Size | Owner-occupied | Renter-occupied |
| Less than High School | 208 (57.9%) | 151 (42.1%) |
| High School Diploma | 214 (89.2%) | 26 (10.8%) |
| College/Associate Degree | 205 (61.6%) | 128 (38.4%) |
| Bachelor's Degree or higher | 67 (48.2%) | 72 (51.8%) |
Occupancy by Age of Householder in Seagraves
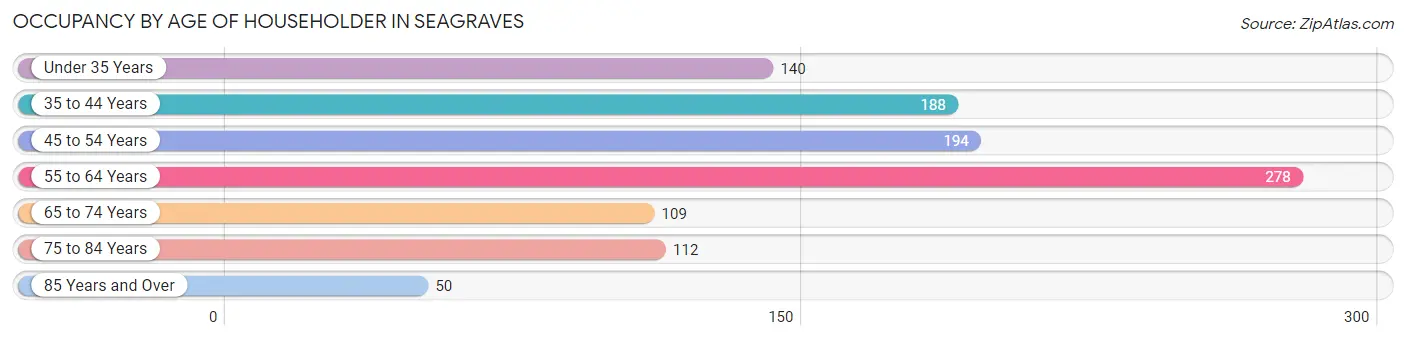
| Age Bracket | # Households | % Households |
| Under 35 Years | 140 | 13.1% |
| 35 to 44 Years | 188 | 17.5% |
| 45 to 54 Years | 194 | 18.1% |
| 55 to 64 Years | 278 | 26.0% |
| 65 to 74 Years | 109 | 10.2% |
| 75 to 84 Years | 112 | 10.5% |
| 85 Years and Over | 50 | 4.7% |
| Total | 1,071 | 100.0% |
Housing Finances in Seagraves
Median Income by Occupancy in Seagraves
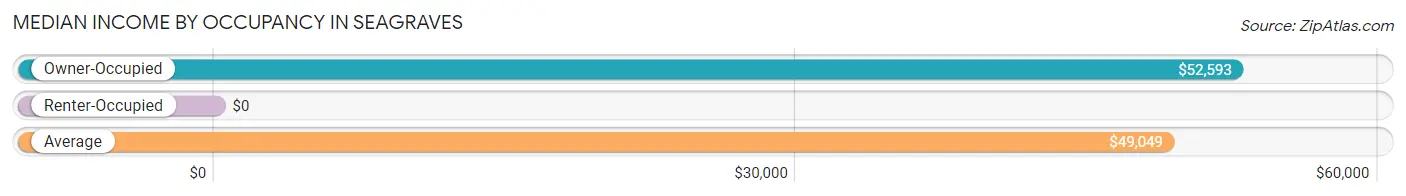
| Occupancy Type | # Households | Median Income |
| Owner-Occupied | 694 (64.8%) | $52,593 |
| Renter-Occupied | 377 (35.2%) | $0 |
| Average | 1,071 (100.0%) | $49,049 |
Occupancy by Householder Income Bracket in Seagraves
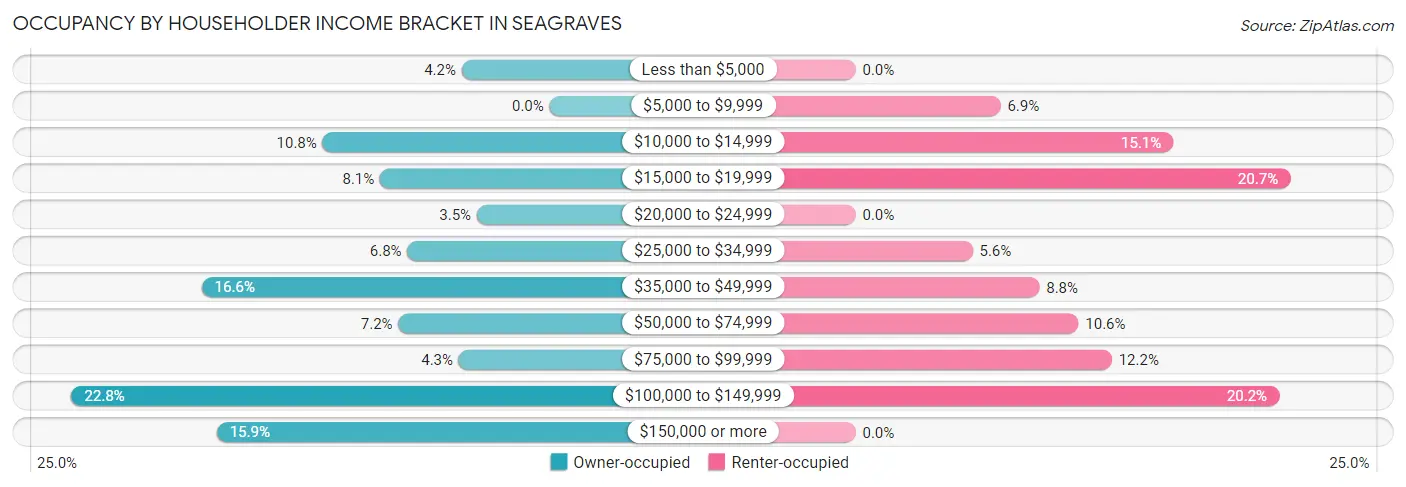
| Income Bracket | Owner-occupied | Renter-occupied |
| Less than $5,000 | 29 (4.2%) | 0 (0.0%) |
| $5,000 to $9,999 | 0 (0.0%) | 26 (6.9%) |
| $10,000 to $14,999 | 75 (10.8%) | 57 (15.1%) |
| $15,000 to $19,999 | 56 (8.1%) | 78 (20.7%) |
| $20,000 to $24,999 | 24 (3.5%) | 0 (0.0%) |
| $25,000 to $34,999 | 47 (6.8%) | 21 (5.6%) |
| $35,000 to $49,999 | 115 (16.6%) | 33 (8.7%) |
| $50,000 to $74,999 | 50 (7.2%) | 40 (10.6%) |
| $75,000 to $99,999 | 30 (4.3%) | 46 (12.2%) |
| $100,000 to $149,999 | 158 (22.8%) | 76 (20.2%) |
| $150,000 or more | 110 (15.9%) | 0 (0.0%) |
| Total | 694 (100.0%) | 377 (100.0%) |
Monthly Housing Cost Tiers in Seagraves
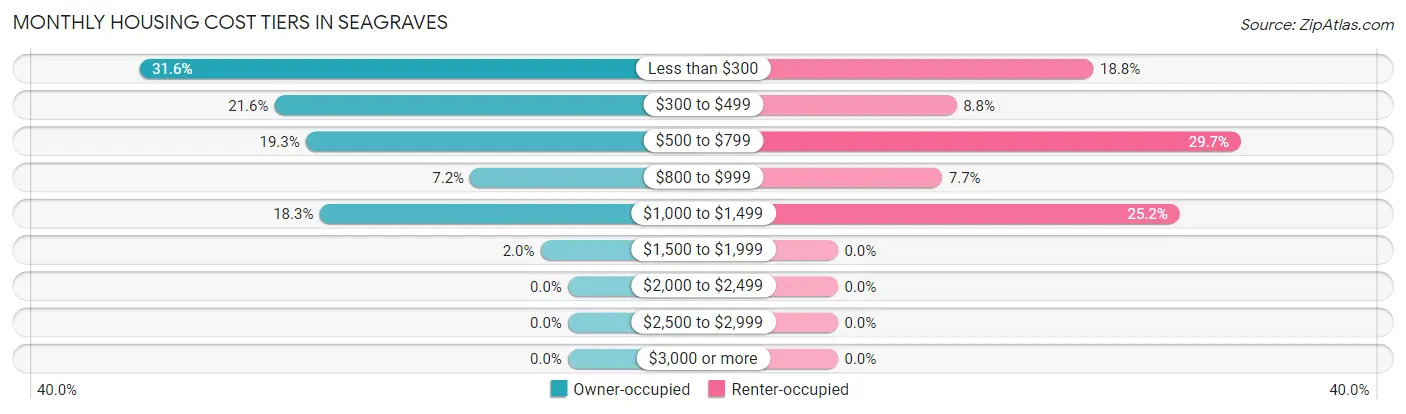
| Monthly Cost | Owner-occupied | Renter-occupied |
| Less than $300 | 219 (31.6%) | 71 (18.8%) |
| $300 to $499 | 150 (21.6%) | 33 (8.7%) |
| $500 to $799 | 134 (19.3%) | 112 (29.7%) |
| $800 to $999 | 50 (7.2%) | 29 (7.7%) |
| $1,000 to $1,499 | 127 (18.3%) | 95 (25.2%) |
| $1,500 to $1,999 | 14 (2.0%) | 0 (0.0%) |
| $2,000 to $2,499 | 0 (0.0%) | 0 (0.0%) |
| $2,500 to $2,999 | 0 (0.0%) | 0 (0.0%) |
| $3,000 or more | 0 (0.0%) | 0 (0.0%) |
| Total | 694 (100.0%) | 377 (100.0%) |
Physical Housing Characteristics in Seagraves
Housing Structures in Seagraves
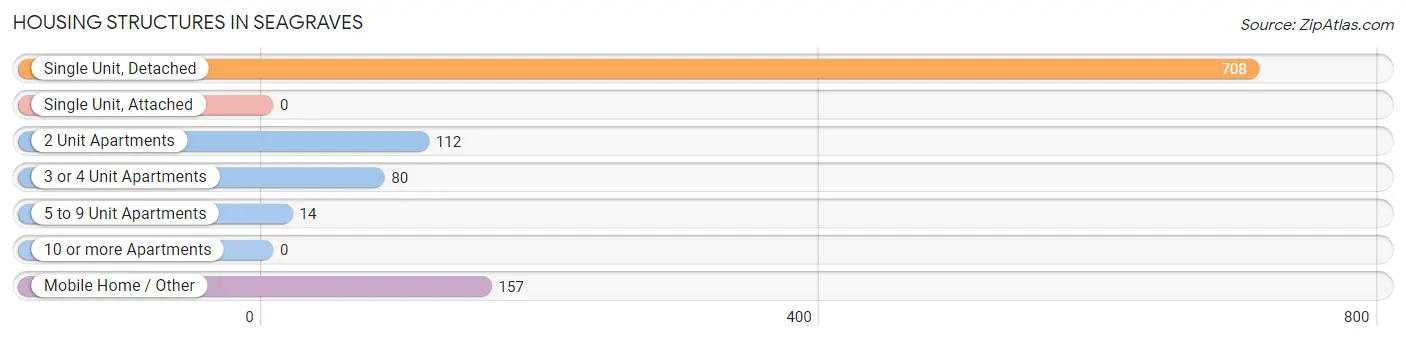
| Structure Type | # Housing Units | % Housing Units |
| Single Unit, Detached | 708 | 66.1% |
| Single Unit, Attached | 0 | 0.0% |
| 2 Unit Apartments | 112 | 10.5% |
| 3 or 4 Unit Apartments | 80 | 7.5% |
| 5 to 9 Unit Apartments | 14 | 1.3% |
| 10 or more Apartments | 0 | 0.0% |
| Mobile Home / Other | 157 | 14.7% |
| Total | 1,071 | 100.0% |
Housing Structures by Occupancy in Seagraves
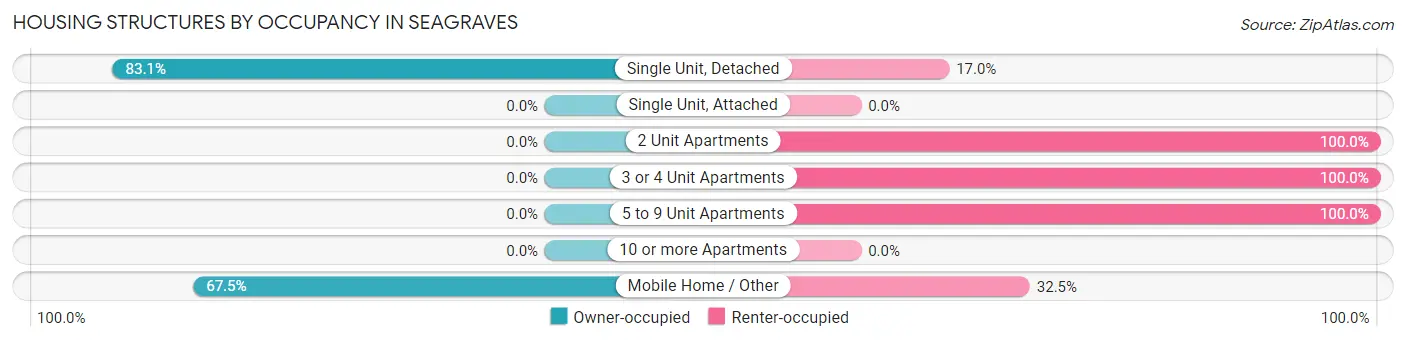
| Structure Type | Owner-occupied | Renter-occupied |
| Single Unit, Detached | 588 (83.1%) | 120 (17.0%) |
| Single Unit, Attached | 0 (0.0%) | 0 (0.0%) |
| 2 Unit Apartments | 0 (0.0%) | 112 (100.0%) |
| 3 or 4 Unit Apartments | 0 (0.0%) | 80 (100.0%) |
| 5 to 9 Unit Apartments | 0 (0.0%) | 14 (100.0%) |
| 10 or more Apartments | 0 (0.0%) | 0 (0.0%) |
| Mobile Home / Other | 106 (67.5%) | 51 (32.5%) |
| Total | 694 (64.8%) | 377 (35.2%) |
Housing Structures by Number of Rooms in Seagraves
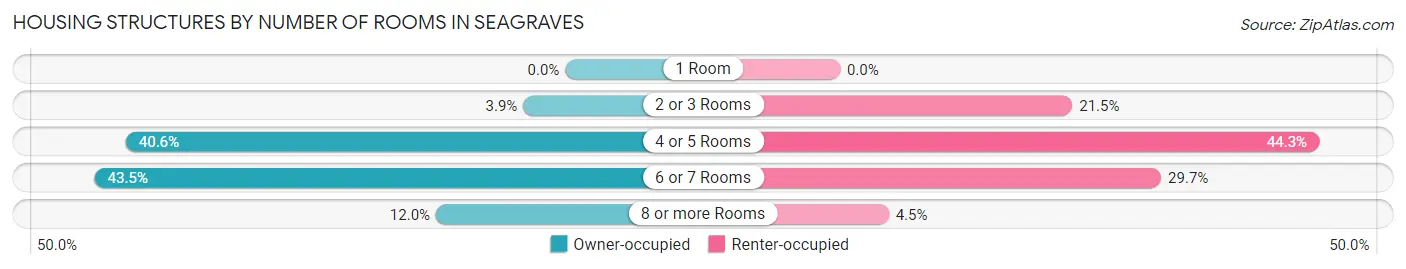
| Number of Rooms | Owner-occupied | Renter-occupied |
| 1 Room | 0 (0.0%) | 0 (0.0%) |
| 2 or 3 Rooms | 27 (3.9%) | 81 (21.5%) |
| 4 or 5 Rooms | 282 (40.6%) | 167 (44.3%) |
| 6 or 7 Rooms | 302 (43.5%) | 112 (29.7%) |
| 8 or more Rooms | 83 (12.0%) | 17 (4.5%) |
| Total | 694 (100.0%) | 377 (100.0%) |
Housing Structure by Heating Type in Seagraves
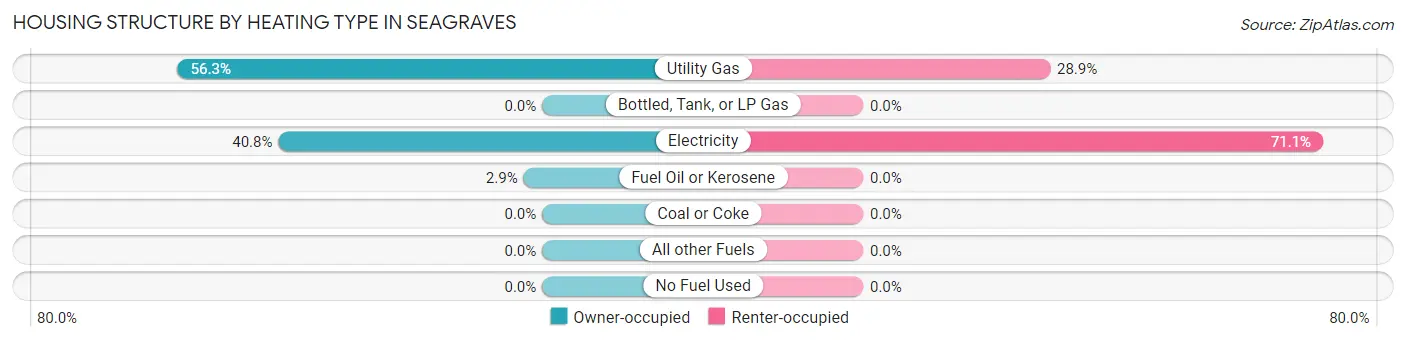
| Heating Type | Owner-occupied | Renter-occupied |
| Utility Gas | 391 (56.3%) | 109 (28.9%) |
| Bottled, Tank, or LP Gas | 0 (0.0%) | 0 (0.0%) |
| Electricity | 283 (40.8%) | 268 (71.1%) |
| Fuel Oil or Kerosene | 20 (2.9%) | 0 (0.0%) |
| Coal or Coke | 0 (0.0%) | 0 (0.0%) |
| All other Fuels | 0 (0.0%) | 0 (0.0%) |
| No Fuel Used | 0 (0.0%) | 0 (0.0%) |
| Total | 694 (100.0%) | 377 (100.0%) |
Household Vehicle Usage in Seagraves
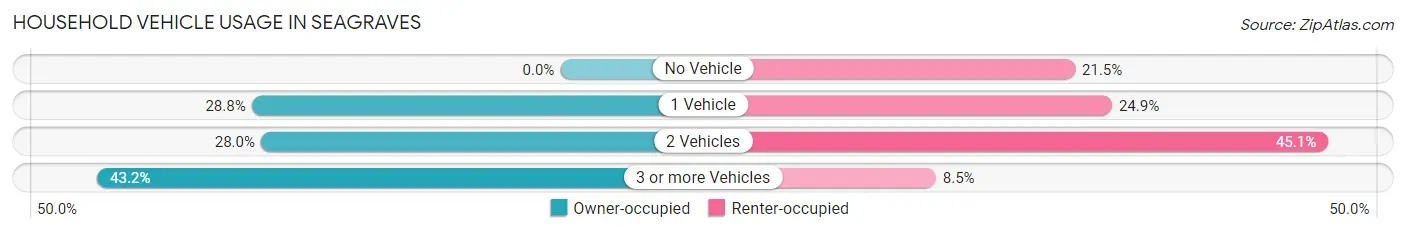
| Vehicles per Household | Owner-occupied | Renter-occupied |
| No Vehicle | 0 (0.0%) | 81 (21.5%) |
| 1 Vehicle | 200 (28.8%) | 94 (24.9%) |
| 2 Vehicles | 194 (28.0%) | 170 (45.1%) |
| 3 or more Vehicles | 300 (43.2%) | 32 (8.5%) |
| Total | 694 (100.0%) | 377 (100.0%) |
Real Estate & Mortgages in Seagraves
Real Estate and Mortgage Overview in Seagraves
| Characteristic | Without Mortgage | With Mortgage |
| Housing Units | 500 | 194 |
| Median Property Value | $52,800 | $184,100 |
| Median Household Income | $73,043 | $0 |
| Monthly Housing Costs | $334 | $0 |
| Real Estate Taxes | $961 | $0 |
Property Value by Mortgage Status in Seagraves
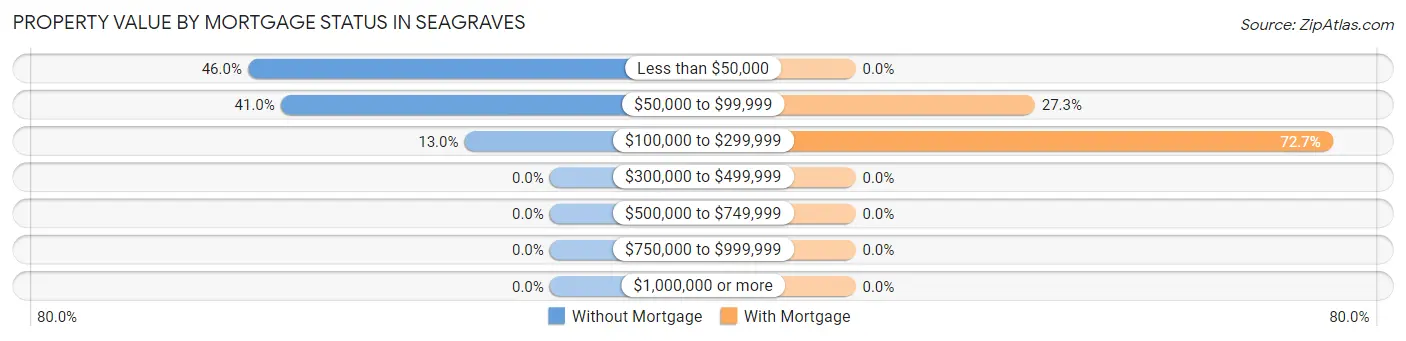
| Property Value | Without Mortgage | With Mortgage |
| Less than $50,000 | 230 (46.0%) | 0 (0.0%) |
| $50,000 to $99,999 | 205 (41.0%) | 53 (27.3%) |
| $100,000 to $299,999 | 65 (13.0%) | 141 (72.7%) |
| $300,000 to $499,999 | 0 (0.0%) | 0 (0.0%) |
| $500,000 to $749,999 | 0 (0.0%) | 0 (0.0%) |
| $750,000 to $999,999 | 0 (0.0%) | 0 (0.0%) |
| $1,000,000 or more | 0 (0.0%) | 0 (0.0%) |
| Total | 500 (100.0%) | 194 (100.0%) |
Household Income by Mortgage Status in Seagraves
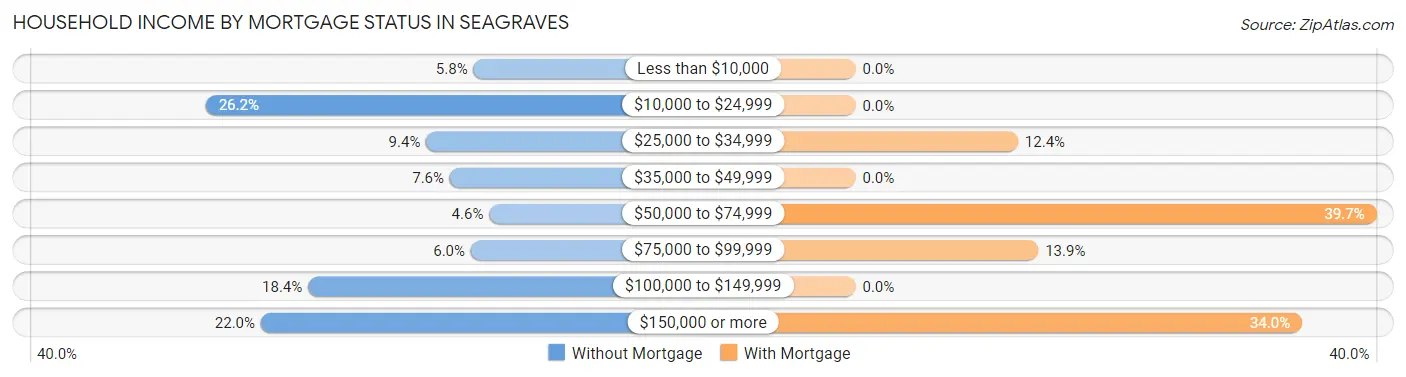
| Household Income | Without Mortgage | With Mortgage |
| Less than $10,000 | 29 (5.8%) | 0 (0.0%) |
| $10,000 to $24,999 | 131 (26.2%) | 0 (0.0%) |
| $25,000 to $34,999 | 47 (9.4%) | 24 (12.4%) |
| $35,000 to $49,999 | 38 (7.6%) | 0 (0.0%) |
| $50,000 to $74,999 | 23 (4.6%) | 77 (39.7%) |
| $75,000 to $99,999 | 30 (6.0%) | 27 (13.9%) |
| $100,000 to $149,999 | 92 (18.4%) | 0 (0.0%) |
| $150,000 or more | 110 (22.0%) | 66 (34.0%) |
| Total | 500 (100.0%) | 194 (100.0%) |
Property Value to Household Income Ratio in Seagraves
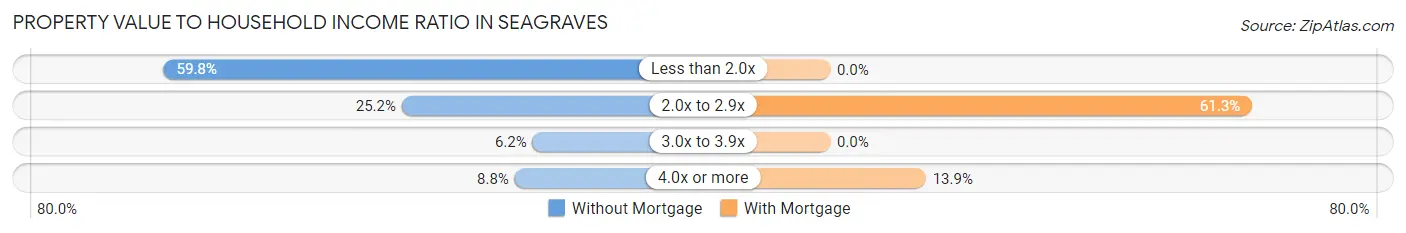
| Value-to-Income Ratio | Without Mortgage | With Mortgage |
| Less than 2.0x | 299 (59.8%) | 0 (0.0%) |
| 2.0x to 2.9x | 126 (25.2%) | 119 (61.3%) |
| 3.0x to 3.9x | 31 (6.2%) | 0 (0.0%) |
| 4.0x or more | 44 (8.8%) | 27 (13.9%) |
| Total | 500 (100.0%) | 194 (100.0%) |
Real Estate Taxes by Mortgage Status in Seagraves
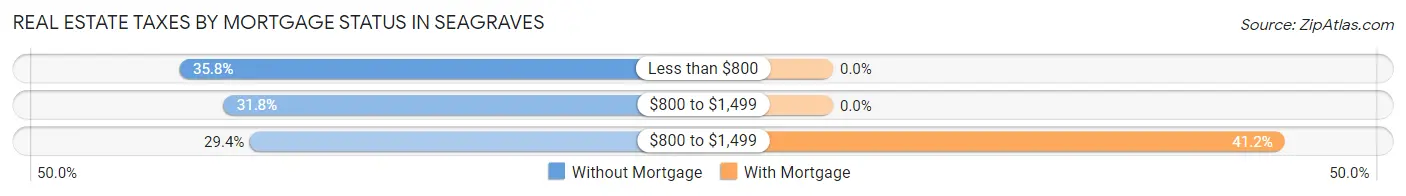
| Property Taxes | Without Mortgage | With Mortgage |
| Less than $800 | 179 (35.8%) | 0 (0.0%) |
| $800 to $1,499 | 159 (31.8%) | 0 (0.0%) |
| $800 to $1,499 | 147 (29.4%) | 80 (41.2%) |
| Total | 500 (100.0%) | 194 (100.0%) |
Health & Disability in Seagraves
Health Insurance Coverage by Age in Seagraves
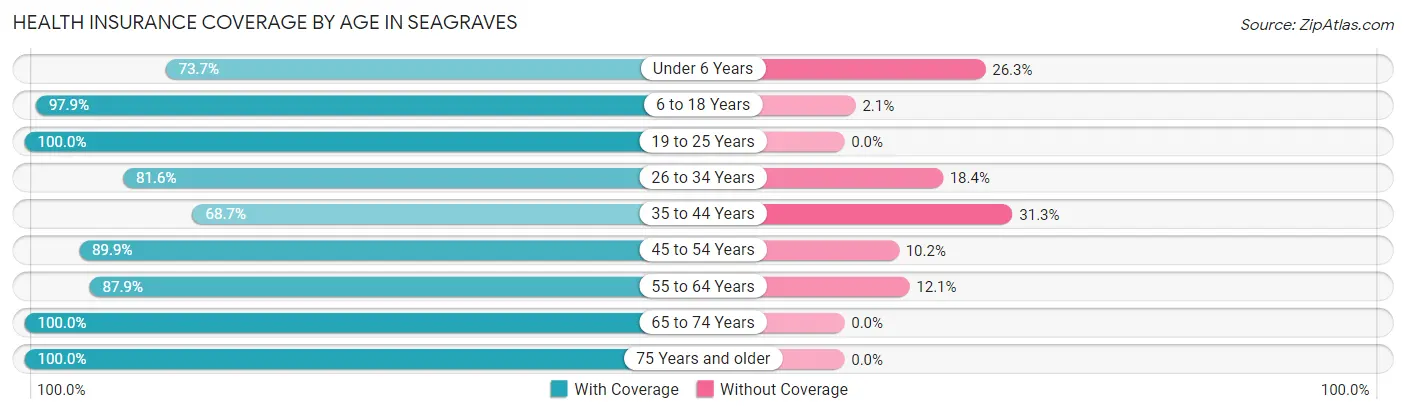
| Age Bracket | With Coverage | Without Coverage |
| Under 6 Years | 157 (73.7%) | 56 (26.3%) |
| 6 to 18 Years | 707 (97.9%) | 15 (2.1%) |
| 19 to 25 Years | 116 (100.0%) | 0 (0.0%) |
| 26 to 34 Years | 249 (81.6%) | 56 (18.4%) |
| 35 to 44 Years | 230 (68.7%) | 105 (31.3%) |
| 45 to 54 Years | 239 (89.8%) | 27 (10.2%) |
| 55 to 64 Years | 384 (87.9%) | 53 (12.1%) |
| 65 to 74 Years | 171 (100.0%) | 0 (0.0%) |
| 75 Years and older | 207 (100.0%) | 0 (0.0%) |
| Total | 2,460 (88.7%) | 312 (11.3%) |
Health Insurance Coverage by Citizenship Status in Seagraves
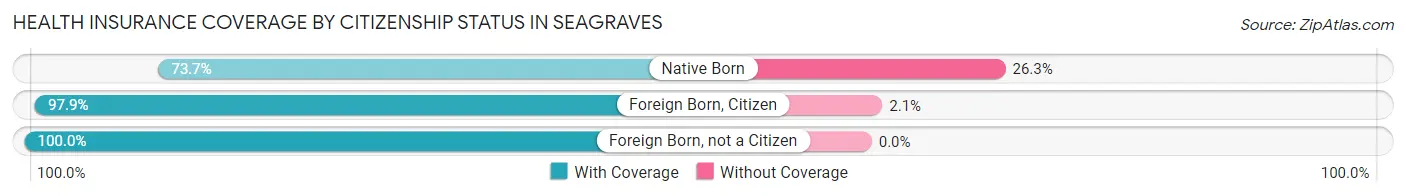
| Citizenship Status | With Coverage | Without Coverage |
| Native Born | 157 (73.7%) | 56 (26.3%) |
| Foreign Born, Citizen | 707 (97.9%) | 15 (2.1%) |
| Foreign Born, not a Citizen | 116 (100.0%) | 0 (0.0%) |
Health Insurance Coverage by Household Income in Seagraves
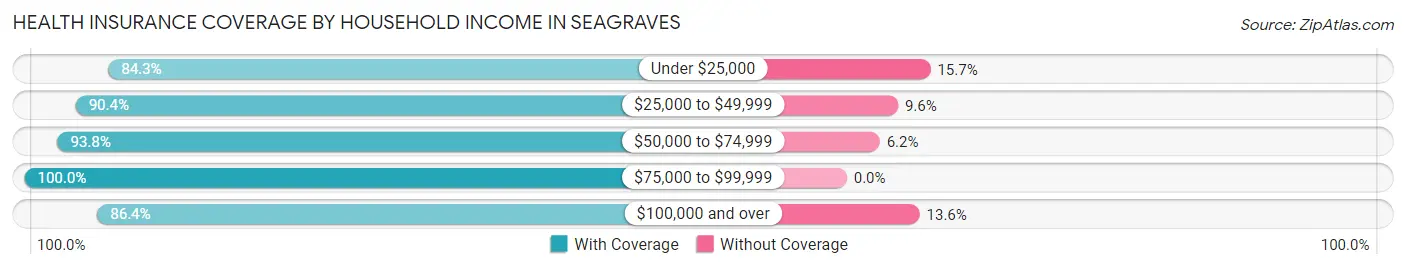
| Household Income | With Coverage | Without Coverage |
| Under $25,000 | 371 (84.3%) | 69 (15.7%) |
| $25,000 to $49,999 | 396 (90.4%) | 42 (9.6%) |
| $50,000 to $74,999 | 350 (93.8%) | 23 (6.2%) |
| $75,000 to $99,999 | 216 (100.0%) | 0 (0.0%) |
| $100,000 and over | 1,127 (86.4%) | 178 (13.6%) |
Public vs Private Health Insurance Coverage by Age in Seagraves
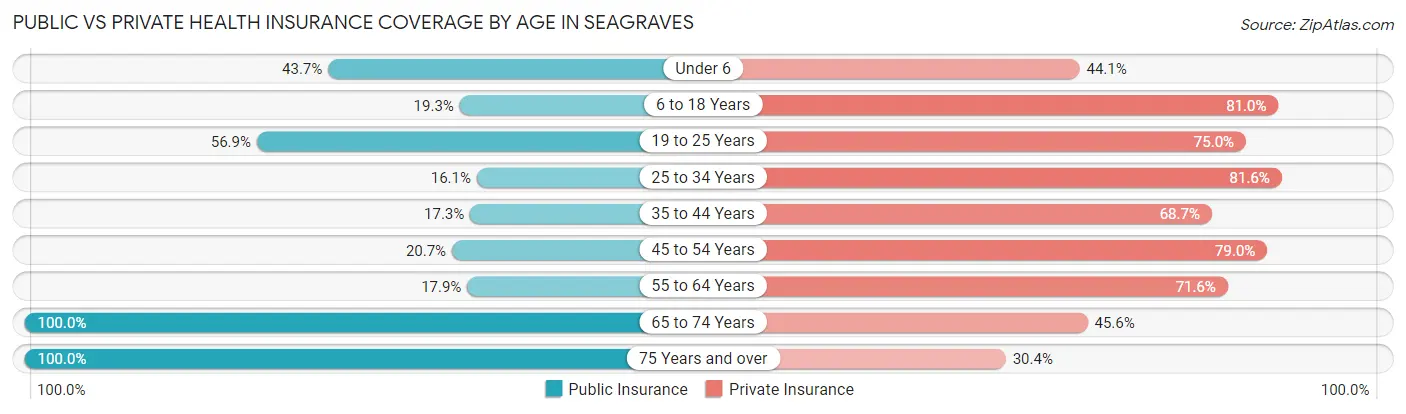
| Age Bracket | Public Insurance | Private Insurance |
| Under 6 | 93 (43.7%) | 94 (44.1%) |
| 6 to 18 Years | 139 (19.3%) | 585 (81.0%) |
| 19 to 25 Years | 66 (56.9%) | 87 (75.0%) |
| 25 to 34 Years | 49 (16.1%) | 249 (81.6%) |
| 35 to 44 Years | 58 (17.3%) | 230 (68.7%) |
| 45 to 54 Years | 55 (20.7%) | 210 (78.9%) |
| 55 to 64 Years | 78 (17.8%) | 313 (71.6%) |
| 65 to 74 Years | 171 (100.0%) | 78 (45.6%) |
| 75 Years and over | 207 (100.0%) | 63 (30.4%) |
| Total | 916 (33.0%) | 1,909 (68.9%) |
Disability Status by Sex by Age in Seagraves
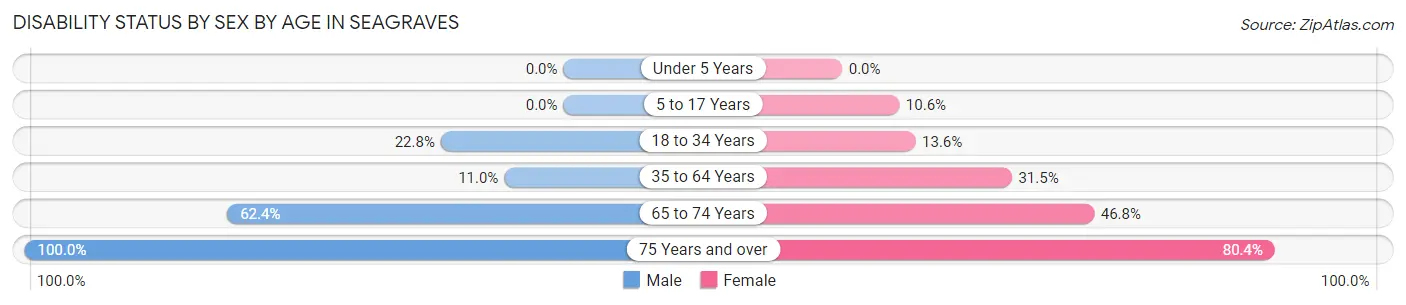
| Age Bracket | Male | Female |
| Under 5 Years | 0 (0.0%) | 0 (0.0%) |
| 5 to 17 Years | 0 (0.0%) | 46 (10.6%) |
| 18 to 34 Years | 66 (22.8%) | 23 (13.6%) |
| 35 to 64 Years | 54 (11.0%) | 172 (31.5%) |
| 65 to 74 Years | 68 (62.4%) | 29 (46.8%) |
| 75 Years and over | 39 (100.0%) | 135 (80.4%) |
Disability Class by Sex by Age in Seagraves
Disability Class: Hearing Difficulty
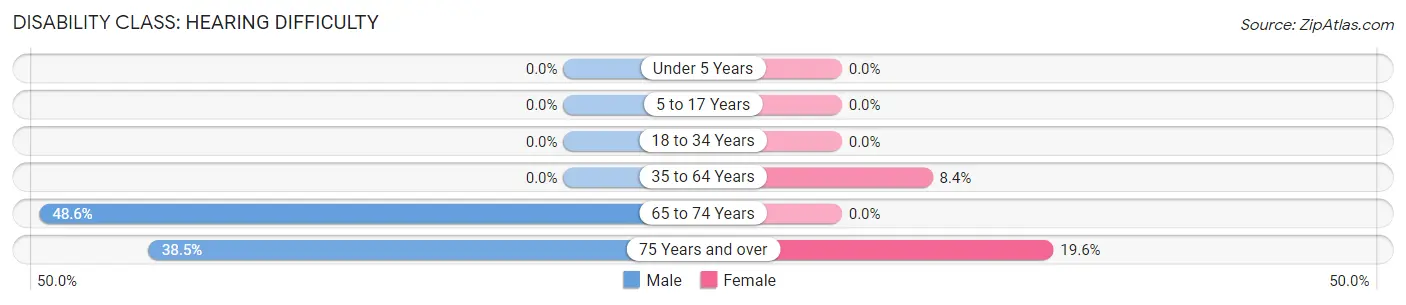
| Age Bracket | Male | Female |
| Under 5 Years | 0 (0.0%) | 0 (0.0%) |
| 5 to 17 Years | 0 (0.0%) | 0 (0.0%) |
| 18 to 34 Years | 0 (0.0%) | 0 (0.0%) |
| 35 to 64 Years | 0 (0.0%) | 46 (8.4%) |
| 65 to 74 Years | 53 (48.6%) | 0 (0.0%) |
| 75 Years and over | 15 (38.5%) | 33 (19.6%) |
Disability Class: Vision Difficulty
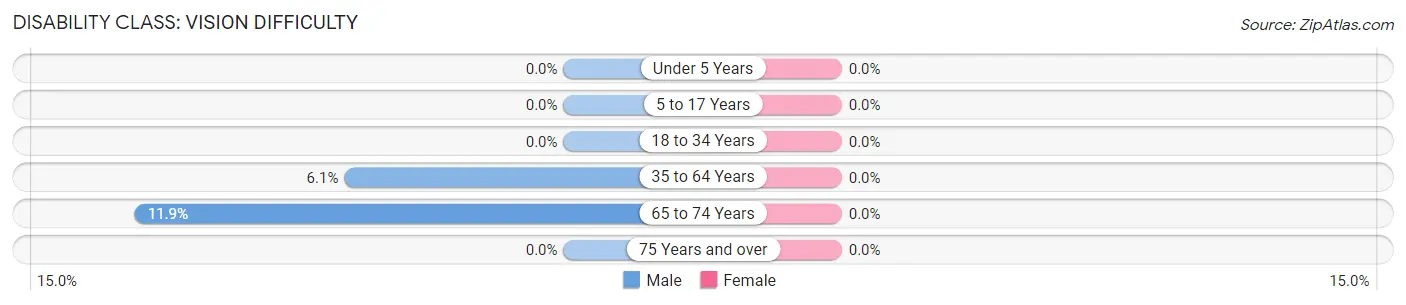
| Age Bracket | Male | Female |
| Under 5 Years | 0 (0.0%) | 0 (0.0%) |
| 5 to 17 Years | 0 (0.0%) | 0 (0.0%) |
| 18 to 34 Years | 0 (0.0%) | 0 (0.0%) |
| 35 to 64 Years | 30 (6.1%) | 0 (0.0%) |
| 65 to 74 Years | 13 (11.9%) | 0 (0.0%) |
| 75 Years and over | 0 (0.0%) | 0 (0.0%) |
Disability Class: Cognitive Difficulty
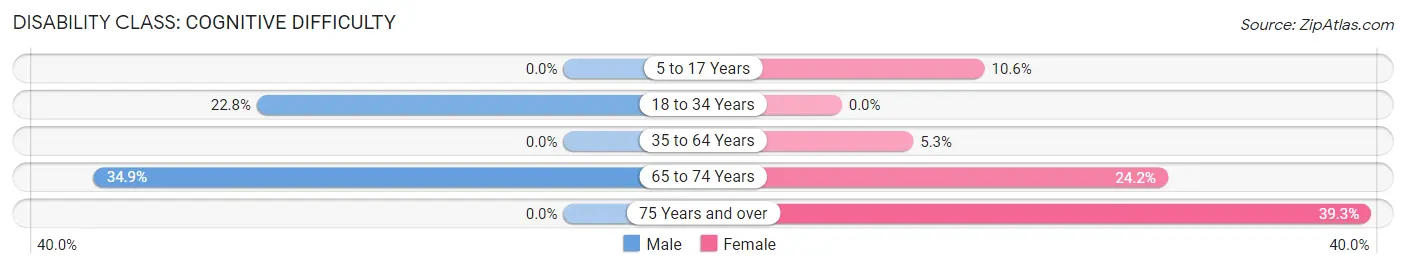
| Age Bracket | Male | Female |
| 5 to 17 Years | 0 (0.0%) | 46 (10.6%) |
| 18 to 34 Years | 66 (22.8%) | 0 (0.0%) |
| 35 to 64 Years | 0 (0.0%) | 29 (5.3%) |
| 65 to 74 Years | 38 (34.9%) | 15 (24.2%) |
| 75 Years and over | 0 (0.0%) | 66 (39.3%) |
Disability Class: Ambulatory Difficulty
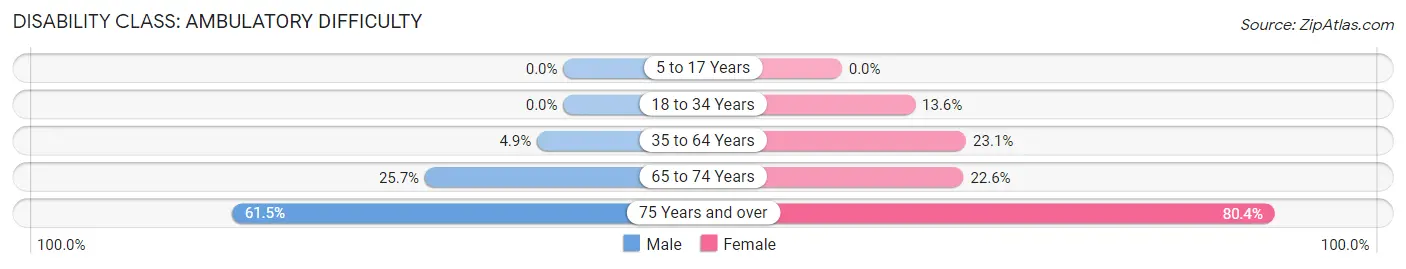
| Age Bracket | Male | Female |
| 5 to 17 Years | 0 (0.0%) | 0 (0.0%) |
| 18 to 34 Years | 0 (0.0%) | 23 (13.6%) |
| 35 to 64 Years | 24 (4.9%) | 126 (23.1%) |
| 65 to 74 Years | 28 (25.7%) | 14 (22.6%) |
| 75 Years and over | 24 (61.5%) | 135 (80.4%) |
Disability Class: Self-Care Difficulty
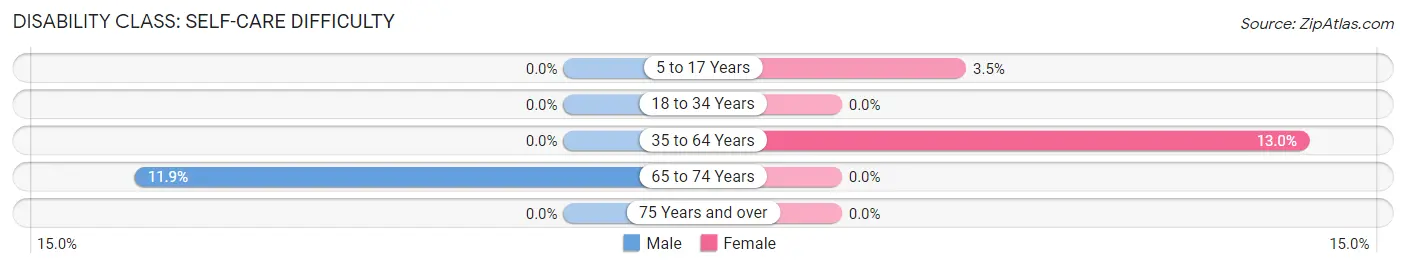
| Age Bracket | Male | Female |
| 5 to 17 Years | 0 (0.0%) | 15 (3.5%) |
| 18 to 34 Years | 0 (0.0%) | 0 (0.0%) |
| 35 to 64 Years | 0 (0.0%) | 71 (13.0%) |
| 65 to 74 Years | 13 (11.9%) | 0 (0.0%) |
| 75 Years and over | 0 (0.0%) | 0 (0.0%) |
Technology Access in Seagraves
Computing Device Access in Seagraves
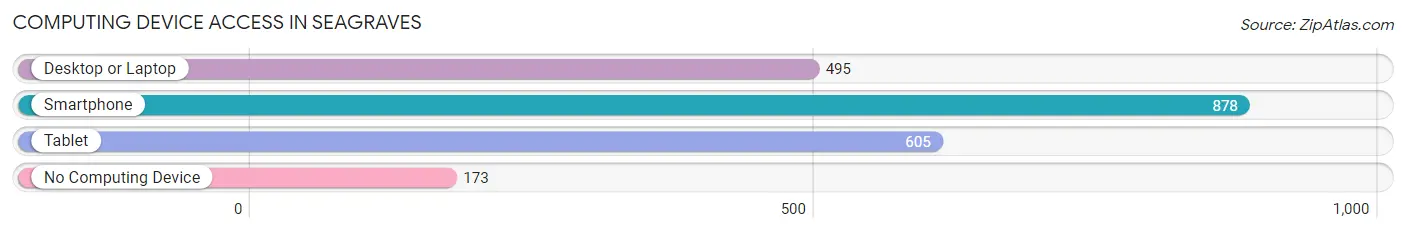
| Device Type | # Households | % Households |
| Desktop or Laptop | 495 | 46.2% |
| Smartphone | 878 | 82.0% |
| Tablet | 605 | 56.5% |
| No Computing Device | 173 | 16.2% |
| Total | 1,071 | 100.0% |
Internet Access in Seagraves
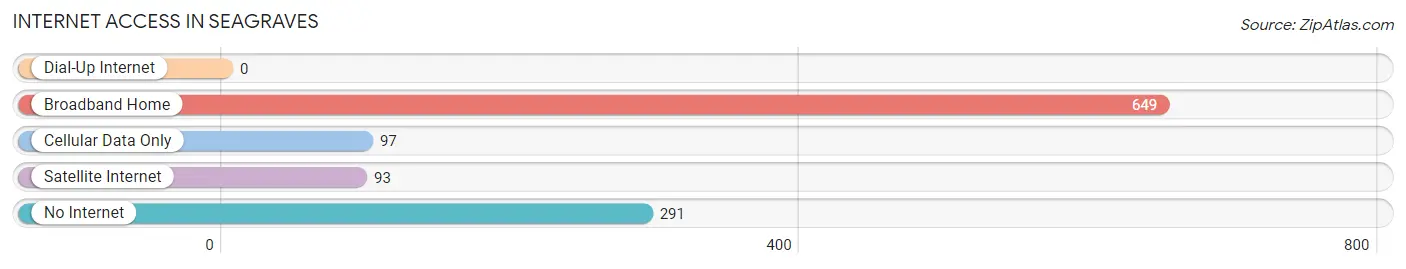
| Internet Type | # Households | % Households |
| Dial-Up Internet | 0 | 0.0% |
| Broadband Home | 649 | 60.6% |
| Cellular Data Only | 97 | 9.1% |
| Satellite Internet | 93 | 8.7% |
| No Internet | 291 | 27.2% |
| Total | 1,071 | 100.0% |
Seagraves Summary
History
Seagraves, Texas is a small town located in Gaines County in the western part of the state. It was founded in 1909 by the Seagraves family, who had moved to the area from Arkansas. The town was named after the family, and it quickly grew to become a thriving agricultural and ranching community.
The town was incorporated in 1911, and the first mayor was J.W. Seagraves. The town quickly grew, and by the 1920s it had a population of over 1,000 people. The town was home to several businesses, including a bank, a hotel, a cotton gin, and a movie theater.
In the 1930s, the Great Depression hit the town hard, and many of the businesses closed. However, the town was able to survive, and by the 1940s it had recovered and was once again thriving.
During World War II, the town was home to an Army Air Corps base, which provided training for pilots. After the war, the base was closed, and the town returned to its agricultural roots.
In the 1950s, the town began to experience a population decline, as many of the younger residents moved away in search of better opportunities. However, the town was able to remain stable, and by the 2000s it had a population of around 1,500 people.
Geography
Seagraves is located in western Texas, in Gaines County. It is situated at the intersection of U.S. Highway 62 and State Highway 83. The town is located about 30 miles east of Lubbock, and about 90 miles west of Abilene.
The town is situated in a flat, semi-arid region of the state, and the climate is generally hot and dry. The average annual temperature is around 70 degrees Fahrenheit, and the average annual precipitation is around 18 inches.
Economy
The economy of Seagraves is largely based on agriculture and ranching. The town is home to several large farms and ranches, which produce a variety of crops, including cotton, corn, wheat, and sorghum.
The town is also home to several small businesses, including a grocery store, a hardware store, and a few restaurants. The town is also home to a few manufacturing companies, which produce a variety of products, including furniture, clothing, and electronics.
Demographics
As of the 2010 census, the population of Seagraves was 1,521. The racial makeup of the town was 79.3% White, 0.2% African American, 0.2% Native American, 0.2% Asian, 0.1% Pacific Islander, 18.7% from other races, and 1.3% from two or more races. Hispanic or Latino of any race were 33.2% of the population.
The median household income in Seagraves was $31,250, and the median family income was $37,500. The per capita income was $15,945. About 18.2% of the population was below the poverty line.
Common Questions
What is Per Capita Income in Seagraves?
Per Capita income in Seagraves is $31,756.
What is the Median Family Income in Seagraves?
Median Family Income in Seagraves is $90,217.
What is the Median Household income in Seagraves?
Median Household Income in Seagraves is $49,049.
What is Income or Wage Gap in Seagraves?
Income or Wage Gap in Seagraves is 43.3%.
Women in Seagraves earn 56.7 cents for every dollar earned by a man.
What is Inequality or Gini Index in Seagraves?
Inequality or Gini Index in Seagraves is 0.53.
What is the Total Population of Seagraves?
Total Population of Seagraves is 2,772.
What is the Total Male Population of Seagraves?
Total Male Population of Seagraves is 1,329.
What is the Total Female Population of Seagraves?
Total Female Population of Seagraves is 1,443.
What is the Ratio of Males per 100 Females in Seagraves?
There are 92.10 Males per 100 Females in Seagraves.
What is the Ratio of Females per 100 Males in Seagraves?
There are 108.58 Females per 100 Males in Seagraves.
What is the Median Population Age in Seagraves?
Median Population Age in Seagraves is 35.5 Years.
What is the Average Family Size in Seagraves
Average Family Size in Seagraves is 3.3 People.
What is the Average Household Size in Seagraves
Average Household Size in Seagraves is 2.6 People.
How Large is the Labor Force in Seagraves?
There are 1,164 People in the Labor Forcein in Seagraves.
What is the Percentage of People in the Labor Force in Seagraves?
56.4% of People are in the Labor Force in Seagraves.
What is the Unemployment Rate in Seagraves?
Unemployment Rate in Seagraves is 2.5%.