Seadrift, TX Map & Demographics
Seadrift Map
Seadrift Overview
$34,082
PER CAPITA INCOME
$95,931
AVG FAMILY INCOME
$46,701
AVG HOUSEHOLD INCOME
62.9%
WAGE / INCOME GAP [ % ]
37.1¢/ $1
WAGE / INCOME GAP [ $ ]
0.42
INEQUALITY / GINI INDEX
1,577
TOTAL POPULATION
889
MALE POPULATION
688
FEMALE POPULATION
129.22
MALES / 100 FEMALES
77.39
FEMALES / 100 MALES
36.3
MEDIAN AGE
3.1
AVG FAMILY SIZE
2.4
AVG HOUSEHOLD SIZE
693
LABOR FORCE [ PEOPLE ]
60.3%
PERCENT IN LABOR FORCE
1.7%
UNEMPLOYMENT RATE
Seadrift Zip Codes
Seadrift Area Codes
Income in Seadrift
Income Overview in Seadrift
Per Capita Income in Seadrift is $34,082, while median incomes of families and households are $95,931 and $46,701 respectively.
| Characteristic | Number | Measure |
| Per Capita Income | 1,577 | $34,082 |
| Median Family Income | 430 | $95,931 |
| Mean Family Income | 430 | $98,881 |
| Median Household Income | 665 | $46,701 |
| Mean Household Income | 665 | $78,972 |
| Income Deficit | 430 | $0 |
| Wage / Income Gap (%) | 1,577 | 62.87% |
| Wage / Income Gap ($) | 1,577 | 37.13¢ per $1 |
| Gini / Inequality Index | 1,577 | 0.42 |
Earnings by Sex in Seadrift
Average Earnings in Seadrift are $43,083, $90,885 for men and $33,750 for women, a difference of 62.9%.
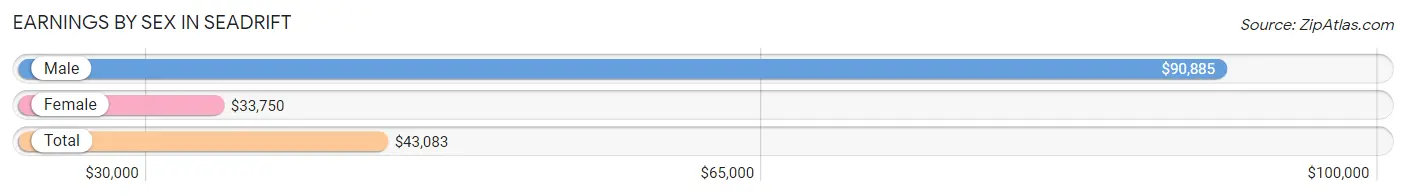
| Sex | Number | Average Earnings |
| Male | 461 (62.9%) | $90,885 |
| Female | 272 (37.1%) | $33,750 |
| Total | 733 (100.0%) | $43,083 |
Earnings by Sex by Income Bracket in Seadrift
The most common earnings brackets in Seadrift are $75,000 to $99,999 for men (165 | 35.8%) and $30,000 to $34,999 for women (78 | 28.7%).
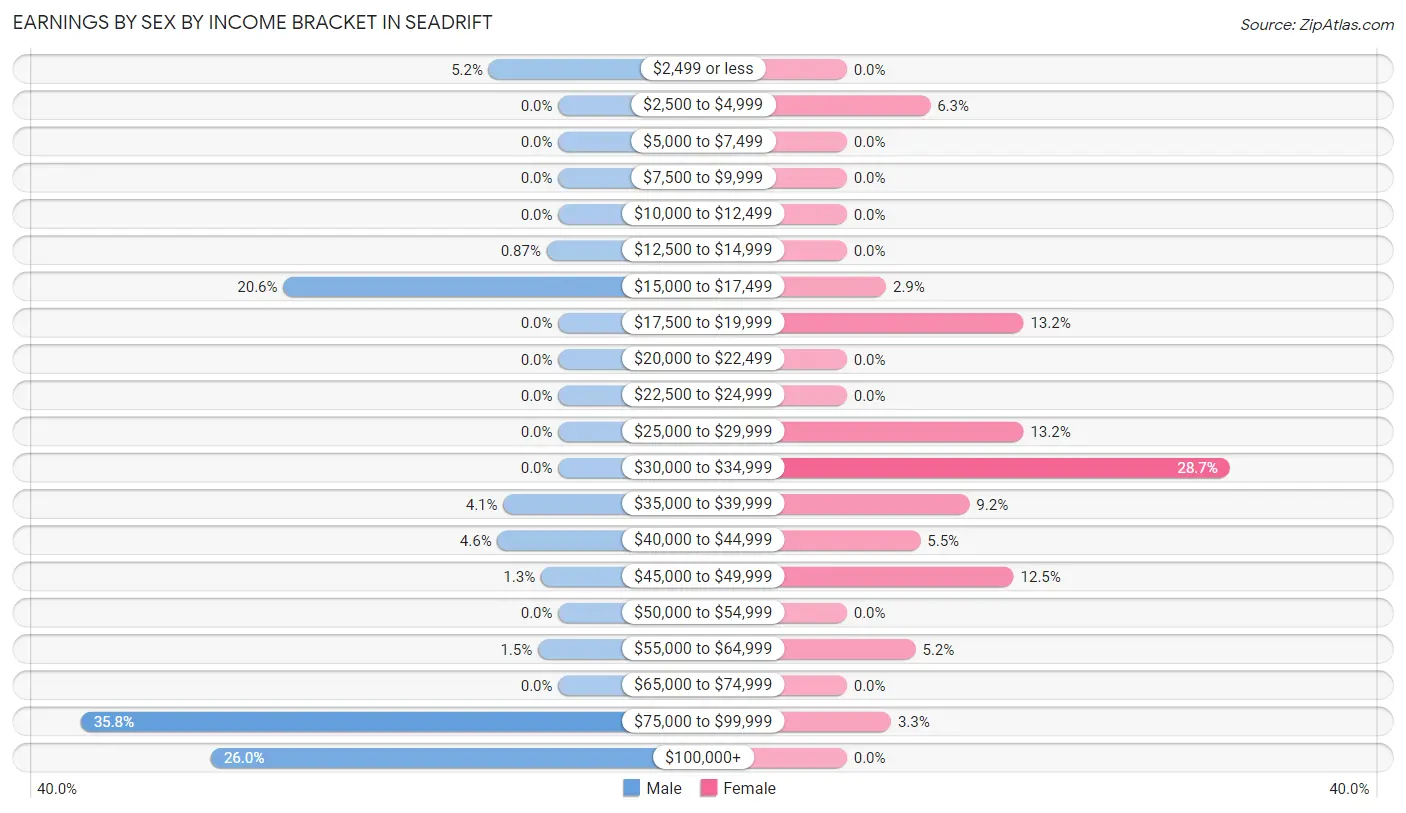
| Income | Male | Female |
| $2,499 or less | 24 (5.2%) | 0 (0.0%) |
| $2,500 to $4,999 | 0 (0.0%) | 17 (6.2%) |
| $5,000 to $7,499 | 0 (0.0%) | 0 (0.0%) |
| $7,500 to $9,999 | 0 (0.0%) | 0 (0.0%) |
| $10,000 to $12,499 | 0 (0.0%) | 0 (0.0%) |
| $12,500 to $14,999 | 4 (0.9%) | 0 (0.0%) |
| $15,000 to $17,499 | 95 (20.6%) | 8 (2.9%) |
| $17,500 to $19,999 | 0 (0.0%) | 36 (13.2%) |
| $20,000 to $22,499 | 0 (0.0%) | 0 (0.0%) |
| $22,500 to $24,999 | 0 (0.0%) | 0 (0.0%) |
| $25,000 to $29,999 | 0 (0.0%) | 36 (13.2%) |
| $30,000 to $34,999 | 0 (0.0%) | 78 (28.7%) |
| $35,000 to $39,999 | 19 (4.1%) | 25 (9.2%) |
| $40,000 to $44,999 | 21 (4.6%) | 15 (5.5%) |
| $45,000 to $49,999 | 6 (1.3%) | 34 (12.5%) |
| $50,000 to $54,999 | 0 (0.0%) | 0 (0.0%) |
| $55,000 to $64,999 | 7 (1.5%) | 14 (5.1%) |
| $65,000 to $74,999 | 0 (0.0%) | 0 (0.0%) |
| $75,000 to $99,999 | 165 (35.8%) | 9 (3.3%) |
| $100,000+ | 120 (26.0%) | 0 (0.0%) |
| Total | 461 (100.0%) | 272 (100.0%) |
Earnings by Sex by Educational Attainment in Seadrift
Average earnings in Seadrift are $92,381 for men and $34,359 for women, a difference of 62.8%. Men with an educational attainment of college or associate's degree enjoy the highest average annual earnings of $138,393, while those with high school diploma education earn the least with $82,100. Women with an educational attainment of college or associate's degree earn the most with the average annual earnings of $34,183, while those with less than high school education have the smallest earnings of $26,910.
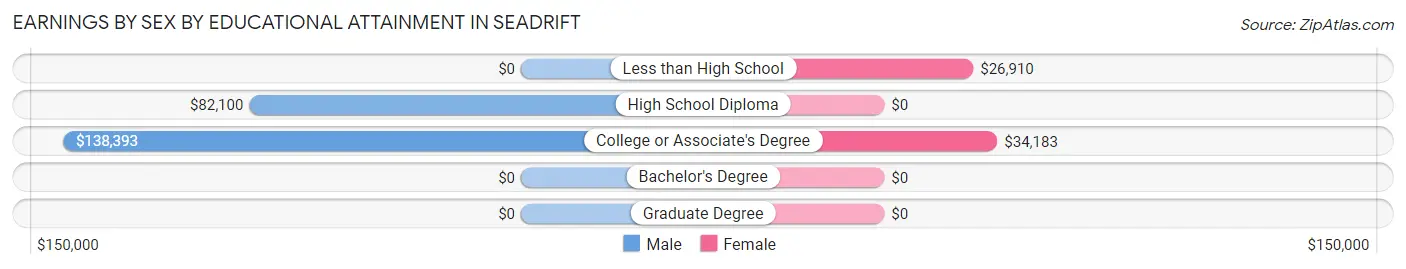
| Educational Attainment | Male Income | Female Income |
| Less than High School | - | - |
| High School Diploma | $82,100 | $0 |
| College or Associate's Degree | $138,393 | $34,183 |
| Bachelor's Degree | - | - |
| Graduate Degree | - | - |
| Total | $92,381 | $34,359 |
Family Income in Seadrift
Family Income Brackets in Seadrift
According to the Seadrift family income data, there are 140 families falling into the $100,000 to $149,999 income range, which is the most common income bracket and makes up 32.6% of all families.
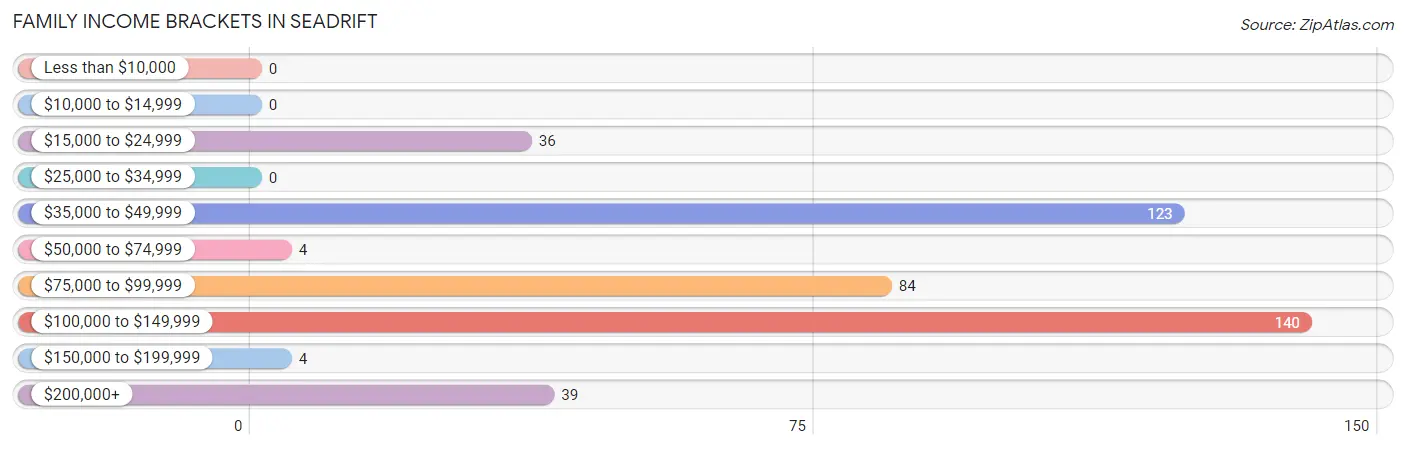
| Income Bracket | # Families | % Families |
| Less than $10,000 | 0 | 0.0% |
| $10,000 to $14,999 | 0 | 0.0% |
| $15,000 to $24,999 | 36 | 8.4% |
| $25,000 to $34,999 | 0 | 0.0% |
| $35,000 to $49,999 | 123 | 28.6% |
| $50,000 to $74,999 | 4 | 0.9% |
| $75,000 to $99,999 | 84 | 19.5% |
| $100,000 to $149,999 | 140 | 32.6% |
| $150,000 to $199,999 | 4 | 0.9% |
| $200,000+ | 39 | 9.1% |
Family Income by Famaliy Size in Seadrift
3-person families (84 | 19.5%) account for the highest median family income in Seadrift with $130,217 per family, while 3-person families (84 | 19.5%) have the highest median income of $43,406 per family member.
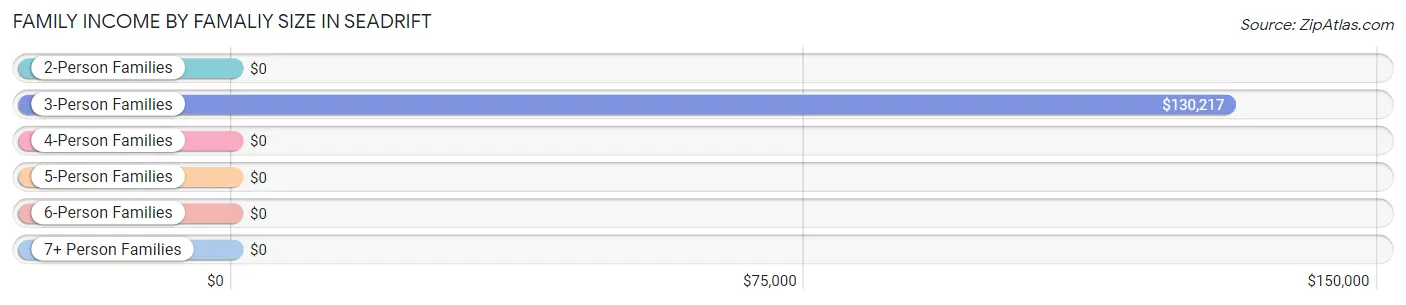
| Income Bracket | # Families | Median Income |
| 2-Person Families | 218 (50.7%) | $0 |
| 3-Person Families | 84 (19.5%) | $130,217 |
| 4-Person Families | 85 (19.8%) | $0 |
| 5-Person Families | 25 (5.8%) | $0 |
| 6-Person Families | 6 (1.4%) | $0 |
| 7+ Person Families | 12 (2.8%) | $0 |
| Total | 430 (100.0%) | $95,931 |
Family Income by Number of Earners in Seadrift
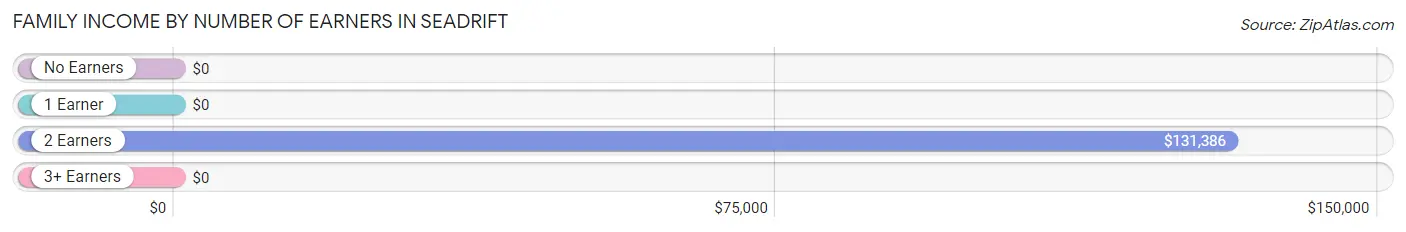
| Number of Earners | # Families | Median Income |
| No Earners | 27 (6.3%) | $0 |
| 1 Earner | 229 (53.3%) | $0 |
| 2 Earners | 117 (27.2%) | $131,386 |
| 3+ Earners | 57 (13.3%) | $0 |
| Total | 430 (100.0%) | $95,931 |
Household Income in Seadrift
Household Income Brackets in Seadrift
With 223 households falling in the category, the $35,000 to $49,999 income range is the most frequent in Seadrift, accounting for 33.5% of all households.
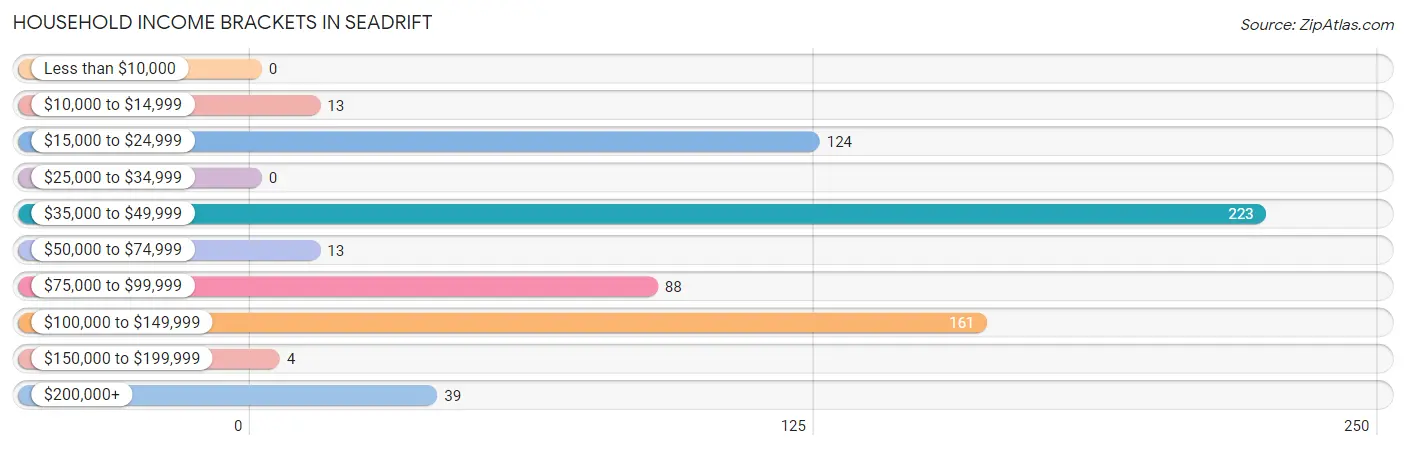
| Income Bracket | # Households | % Households |
| Less than $10,000 | 0 | 0.0% |
| $10,000 to $14,999 | 13 | 2.0% |
| $15,000 to $24,999 | 124 | 18.6% |
| $25,000 to $34,999 | 0 | 0.0% |
| $35,000 to $49,999 | 223 | 33.5% |
| $50,000 to $74,999 | 13 | 2.0% |
| $75,000 to $99,999 | 88 | 13.2% |
| $100,000 to $149,999 | 161 | 24.2% |
| $150,000 to $199,999 | 4 | 0.6% |
| $200,000+ | 39 | 5.9% |
Household Income by Householder Age in Seadrift
The median household income in Seadrift is $46,701, with the highest median household income of $137,964 found in the 45 to 64 years age bracket for the primary householder. A total of 143 households (21.5%) fall into this category. Meanwhile, the 15 to 24 years age bracket for the primary householder has the lowest median household income of $0, with 72 households (10.8%) in this group.
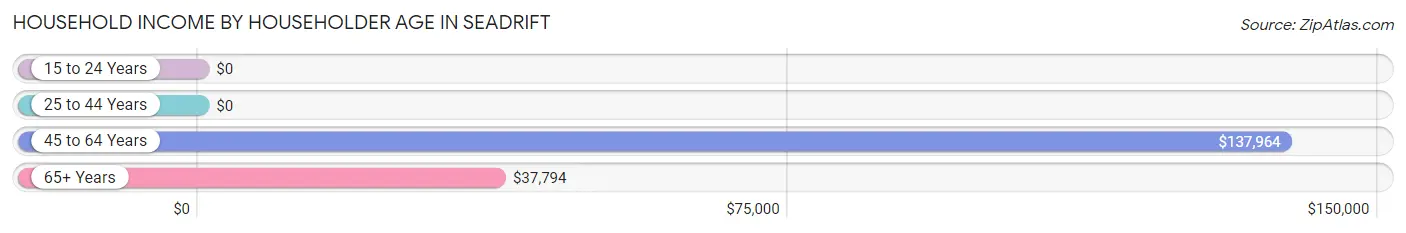
| Income Bracket | # Households | Median Income |
| 15 to 24 Years | 72 (10.8%) | $0 |
| 25 to 44 Years | 244 (36.7%) | $0 |
| 45 to 64 Years | 143 (21.5%) | $137,964 |
| 65+ Years | 206 (31.0%) | $37,794 |
| Total | 665 (100.0%) | $46,701 |
Poverty in Seadrift
Income Below Poverty by Sex and Age in Seadrift
With 10.7% poverty level for males and 5.7% for females among the residents of Seadrift, 45 to 54 year old males and 55 to 64 year old females are the most vulnerable to poverty, with 95 males (59.4%) and 26 females (41.9%) in their respective age groups living below the poverty level.
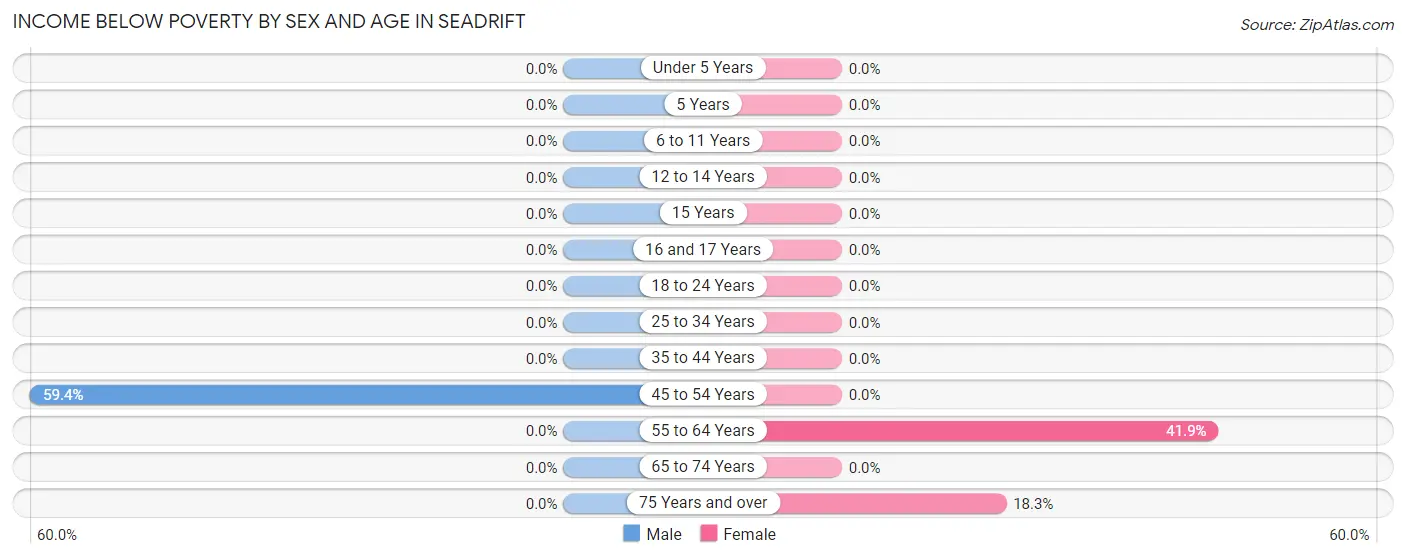
| Age Bracket | Male | Female |
| Under 5 Years | 0 (0.0%) | 0 (0.0%) |
| 5 Years | 0 (0.0%) | 0 (0.0%) |
| 6 to 11 Years | 0 (0.0%) | 0 (0.0%) |
| 12 to 14 Years | 0 (0.0%) | 0 (0.0%) |
| 15 Years | 0 (0.0%) | 0 (0.0%) |
| 16 and 17 Years | 0 (0.0%) | 0 (0.0%) |
| 18 to 24 Years | 0 (0.0%) | 0 (0.0%) |
| 25 to 34 Years | 0 (0.0%) | 0 (0.0%) |
| 35 to 44 Years | 0 (0.0%) | 0 (0.0%) |
| 45 to 54 Years | 95 (59.4%) | 0 (0.0%) |
| 55 to 64 Years | 0 (0.0%) | 26 (41.9%) |
| 65 to 74 Years | 0 (0.0%) | 0 (0.0%) |
| 75 Years and over | 0 (0.0%) | 13 (18.3%) |
| Total | 95 (10.7%) | 39 (5.7%) |
Income Above Poverty by Sex and Age in Seadrift
According to the poverty statistics in Seadrift, males aged under 5 years and females aged under 5 years are the age groups that are most secure financially, with 100.0% of males and 100.0% of females in these age groups living above the poverty line.
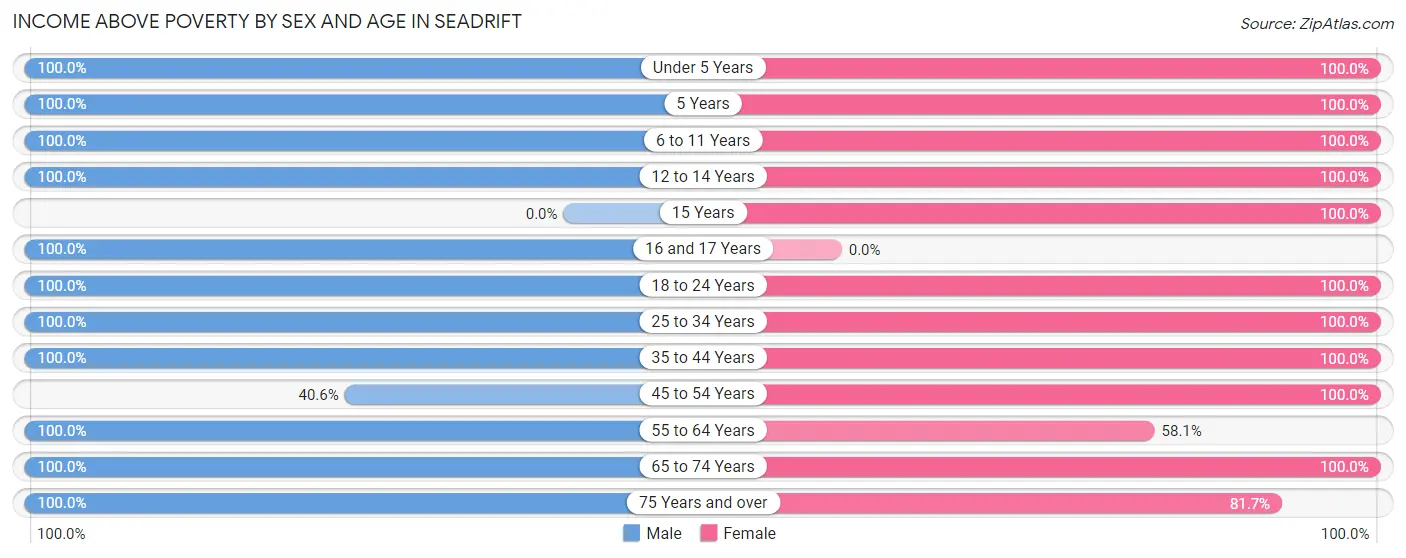
| Age Bracket | Male | Female |
| Under 5 Years | 77 (100.0%) | 68 (100.0%) |
| 5 Years | 20 (100.0%) | 14 (100.0%) |
| 6 to 11 Years | 107 (100.0%) | 60 (100.0%) |
| 12 to 14 Years | 17 (100.0%) | 30 (100.0%) |
| 15 Years | 0 (0.0%) | 34 (100.0%) |
| 16 and 17 Years | 18 (100.0%) | 0 (0.0%) |
| 18 to 24 Years | 109 (100.0%) | 67 (100.0%) |
| 25 to 34 Years | 33 (100.0%) | 124 (100.0%) |
| 35 to 44 Years | 138 (100.0%) | 110 (100.0%) |
| 45 to 54 Years | 65 (40.6%) | 31 (100.0%) |
| 55 to 64 Years | 60 (100.0%) | 36 (58.1%) |
| 65 to 74 Years | 41 (100.0%) | 17 (100.0%) |
| 75 Years and over | 109 (100.0%) | 58 (81.7%) |
| Total | 794 (89.3%) | 649 (94.3%) |
Income Below Poverty Among Married-Couple Families in Seadrift
The poverty statistics for married-couple families in Seadrift show that 8.4% or 26 of the total 308 families live below the poverty line. Families with no children have the highest poverty rate of 17.3%, comprising of 26 families. On the other hand, families with 1 or 2 children have the lowest poverty rate of 0.0%, which includes 0 families.
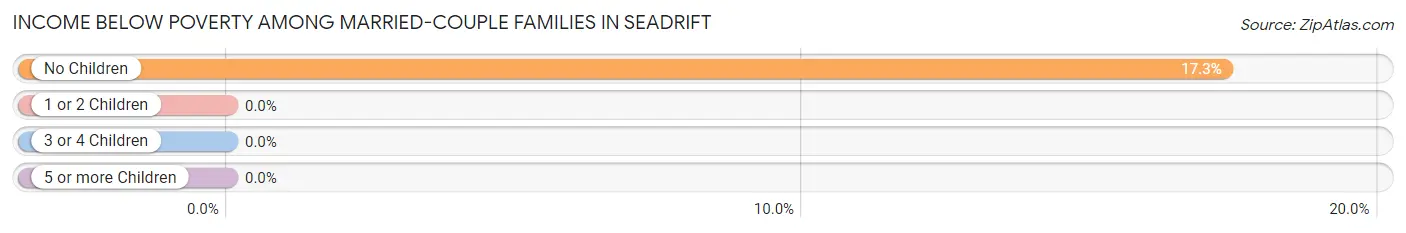
| Children | Above Poverty | Below Poverty |
| No Children | 124 (82.7%) | 26 (17.3%) |
| 1 or 2 Children | 137 (100.0%) | 0 (0.0%) |
| 3 or 4 Children | 21 (100.0%) | 0 (0.0%) |
| 5 or more Children | 0 (0.0%) | 0 (0.0%) |
| Total | 282 (91.6%) | 26 (8.4%) |
Income Below Poverty Among Single-Parent Households in Seadrift
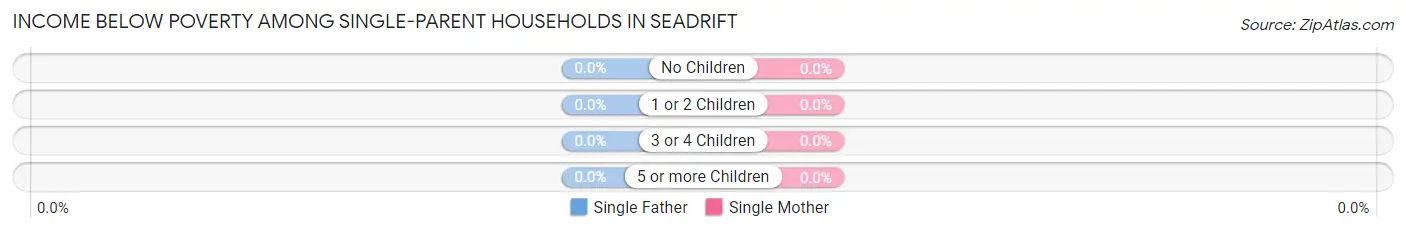
| Children | Single Father | Single Mother |
| No Children | 0 (0.0%) | 0 (0.0%) |
| 1 or 2 Children | 0 (0.0%) | 0 (0.0%) |
| 3 or 4 Children | 0 (0.0%) | 0 (0.0%) |
| 5 or more Children | 0 (0.0%) | 0 (0.0%) |
| Total | 0 (0.0%) | 0 (0.0%) |
Income Below Poverty Among Married-Couple vs Single-Parent Households in Seadrift
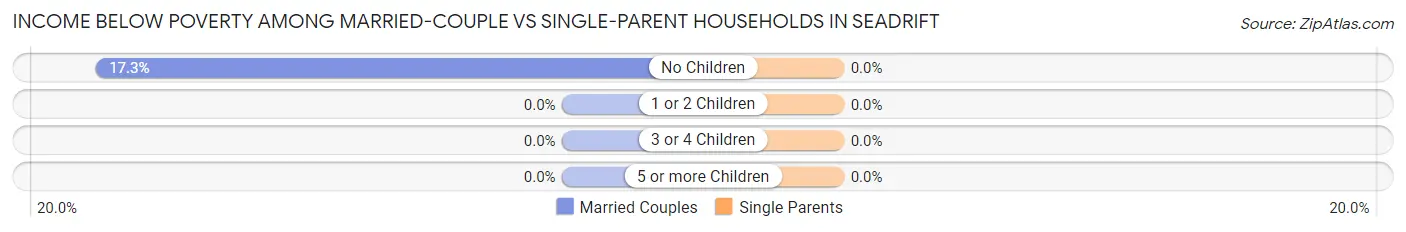
| Children | Married-Couple Families | Single-Parent Households |
| No Children | 26 (17.3%) | 0 (0.0%) |
| 1 or 2 Children | 0 (0.0%) | 0 (0.0%) |
| 3 or 4 Children | 0 (0.0%) | 0 (0.0%) |
| 5 or more Children | 0 (0.0%) | 0 (0.0%) |
| Total | 26 (8.4%) | 0 (0.0%) |
Race in Seadrift
The most populous races in Seadrift are White / Caucasian (1,126 | 71.4%), Hispanic or Latino (796 | 50.5%), and Two or more Races (349 | 22.1%).
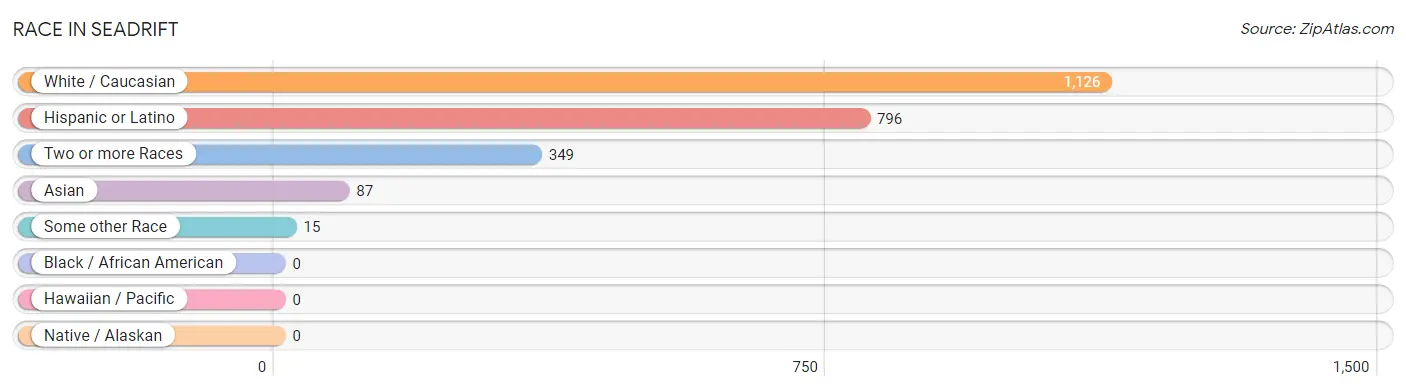
| Race | # Population | % Population |
| Asian | 87 | 5.5% |
| Black / African American | 0 | 0.0% |
| Hawaiian / Pacific | 0 | 0.0% |
| Hispanic or Latino | 796 | 50.5% |
| Native / Alaskan | 0 | 0.0% |
| White / Caucasian | 1,126 | 71.4% |
| Two or more Races | 349 | 22.1% |
| Some other Race | 15 | 0.9% |
| Total | 1,577 | 100.0% |
Ancestry in Seadrift
The most populous ancestries reported in Seadrift are Mexican (769 | 48.8%), German (406 | 25.8%), Irish (157 | 10.0%), English (150 | 9.5%), and Cherokee (94 | 6.0%), together accounting for 99.9% of all Seadrift residents.
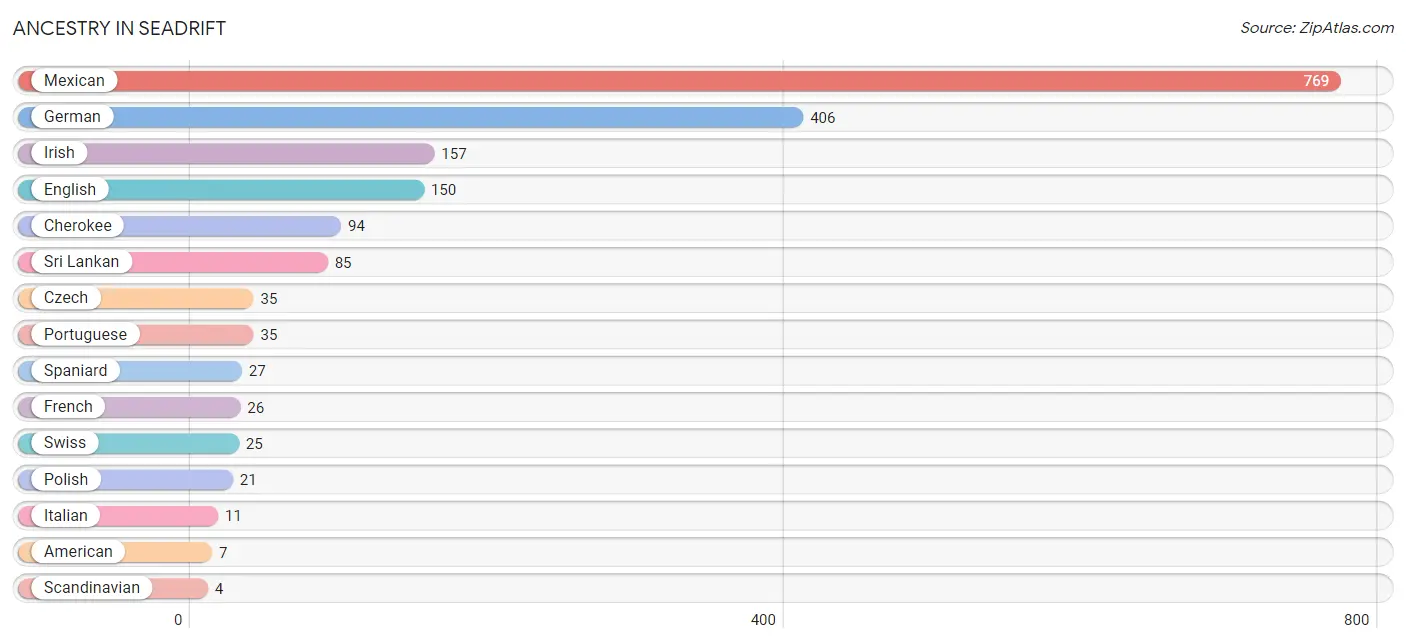
| Ancestry | # Population | % Population |
| American | 7 | 0.4% |
| Cherokee | 94 | 6.0% |
| Czech | 35 | 2.2% |
| English | 150 | 9.5% |
| French | 26 | 1.7% |
| German | 406 | 25.8% |
| Irish | 157 | 10.0% |
| Italian | 11 | 0.7% |
| Mexican | 769 | 48.8% |
| Polish | 21 | 1.3% |
| Portuguese | 35 | 2.2% |
| Scandinavian | 4 | 0.3% |
| Spaniard | 27 | 1.7% |
| Sri Lankan | 85 | 5.4% |
| Swiss | 25 | 1.6% |
| Thai | 2 | 0.1% | View All 16 Rows |
Immigrants in Seadrift
The most numerous immigrant groups reported in Seadrift came from Central America (203 | 12.9%), Latin America (203 | 12.9%), Mexico (203 | 12.9%), Asia (85 | 5.4%), and China (68 | 4.3%), together accounting for 48.3% of all Seadrift residents.
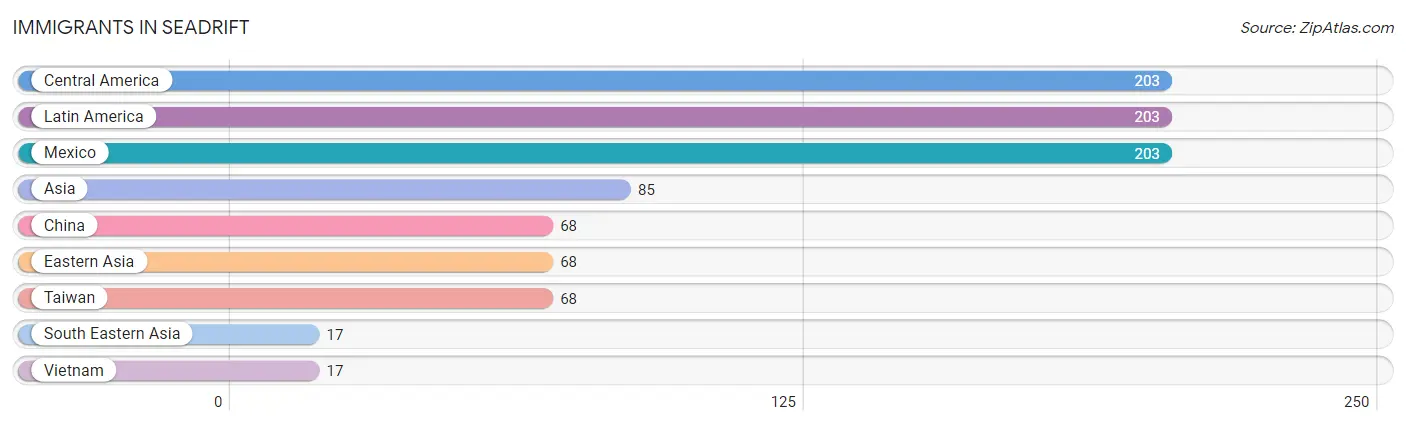
| Immigration Origin | # Population | % Population |
| Asia | 85 | 5.4% |
| Central America | 203 | 12.9% |
| China | 68 | 4.3% |
| Eastern Asia | 68 | 4.3% |
| Latin America | 203 | 12.9% |
| Mexico | 203 | 12.9% |
| South Eastern Asia | 17 | 1.1% |
| Taiwan | 68 | 4.3% |
| Vietnam | 17 | 1.1% | View All 9 Rows |
Sex and Age in Seadrift
Sex and Age in Seadrift
The most populous age groups in Seadrift are 50 to 54 Years (136 | 15.3%) for men and 30 to 34 Years (124 | 18.0%) for women.
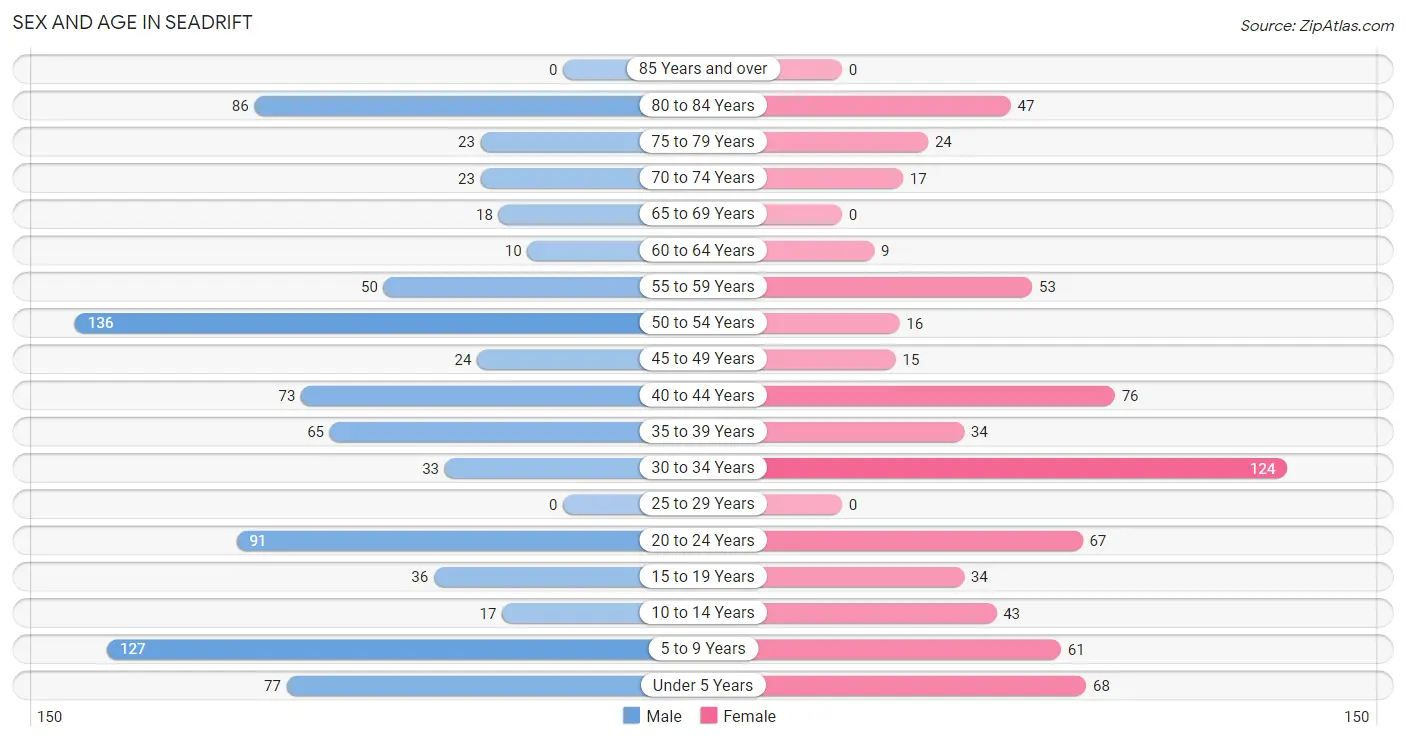
| Age Bracket | Male | Female |
| Under 5 Years | 77 (8.7%) | 68 (9.9%) |
| 5 to 9 Years | 127 (14.3%) | 61 (8.9%) |
| 10 to 14 Years | 17 (1.9%) | 43 (6.2%) |
| 15 to 19 Years | 36 (4.1%) | 34 (4.9%) |
| 20 to 24 Years | 91 (10.2%) | 67 (9.7%) |
| 25 to 29 Years | 0 (0.0%) | 0 (0.0%) |
| 30 to 34 Years | 33 (3.7%) | 124 (18.0%) |
| 35 to 39 Years | 65 (7.3%) | 34 (4.9%) |
| 40 to 44 Years | 73 (8.2%) | 76 (11.1%) |
| 45 to 49 Years | 24 (2.7%) | 15 (2.2%) |
| 50 to 54 Years | 136 (15.3%) | 16 (2.3%) |
| 55 to 59 Years | 50 (5.6%) | 53 (7.7%) |
| 60 to 64 Years | 10 (1.1%) | 9 (1.3%) |
| 65 to 69 Years | 18 (2.0%) | 0 (0.0%) |
| 70 to 74 Years | 23 (2.6%) | 17 (2.5%) |
| 75 to 79 Years | 23 (2.6%) | 24 (3.5%) |
| 80 to 84 Years | 86 (9.7%) | 47 (6.8%) |
| 85 Years and over | 0 (0.0%) | 0 (0.0%) |
| Total | 889 (100.0%) | 688 (100.0%) |
Families and Households in Seadrift
Median Family Size in Seadrift
The median family size in Seadrift is 3.09 persons per family, with married-couple families (308 | 71.6%) accounting for the largest median family size of 3.13 persons per family. On the other hand, single male/father families (21 | 4.9%) represent the smallest median family size with 2.24 persons per family.
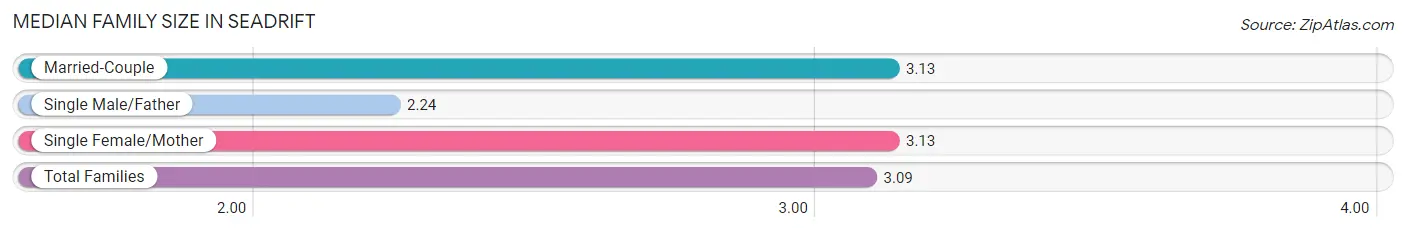
| Family Type | # Families | Family Size |
| Married-Couple | 308 (71.6%) | 3.13 |
| Single Male/Father | 21 (4.9%) | 2.24 |
| Single Female/Mother | 101 (23.5%) | 3.13 |
| Total Families | 430 (100.0%) | 3.09 |
Median Household Size in Seadrift
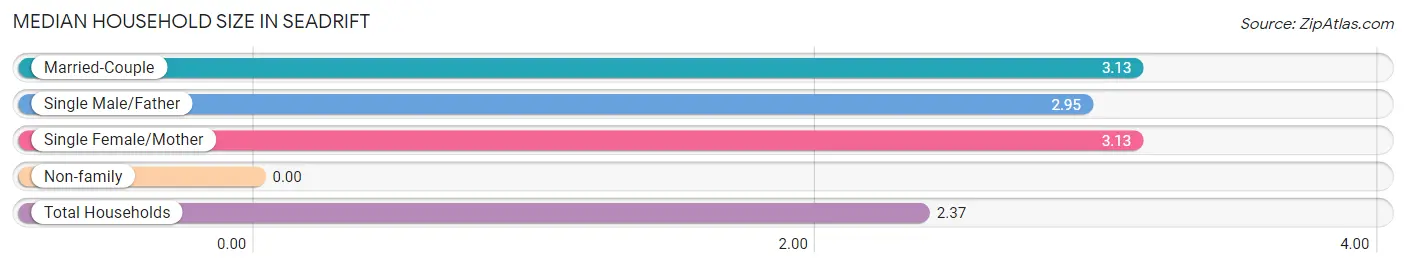
| Household Type | # Households | Household Size |
| Married-Couple | 308 (46.3%) | 3.13 |
| Single Male/Father | 21 (3.2%) | 2.95 |
| Single Female/Mother | 101 (15.2%) | 3.13 |
| Non-family | 235 (35.3%) | - |
| Total Households | 665 (100.0%) | 2.37 |
Household Size by Marriage Status in Seadrift
Out of a total of 665 households in Seadrift, 430 (64.7%) are family households, while 235 (35.3%) are nonfamily households. The most numerous type of family households are 2-person households, comprising 218, and the most common type of nonfamily households are 1-person households, comprising 235.
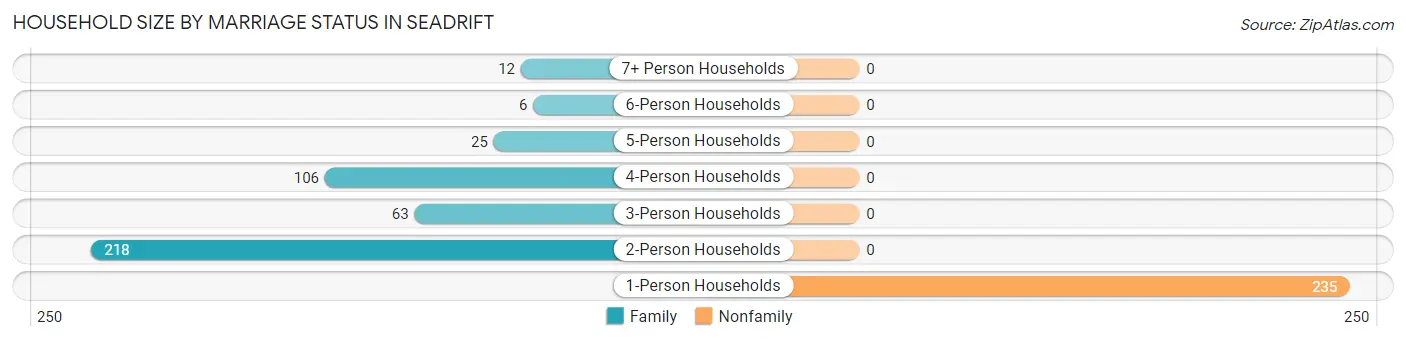
| Household Size | Family Households | Nonfamily Households |
| 1-Person Households | - | 235 (35.3%) |
| 2-Person Households | 218 (32.8%) | 0 (0.0%) |
| 3-Person Households | 63 (9.5%) | 0 (0.0%) |
| 4-Person Households | 106 (15.9%) | 0 (0.0%) |
| 5-Person Households | 25 (3.8%) | 0 (0.0%) |
| 6-Person Households | 6 (0.9%) | 0 (0.0%) |
| 7+ Person Households | 12 (1.8%) | 0 (0.0%) |
| Total | 430 (64.7%) | 235 (35.3%) |
Female Fertility in Seadrift
Fertility by Age in Seadrift
Average fertility rate in Seadrift is 43.0 births per 1,000 women. Women in the age bracket of 20 to 34 years have the highest fertility rate with 79.0 births per 1,000 women. Women in the age bracket of 20 to 34 years acount for 100.0% of all women with births.
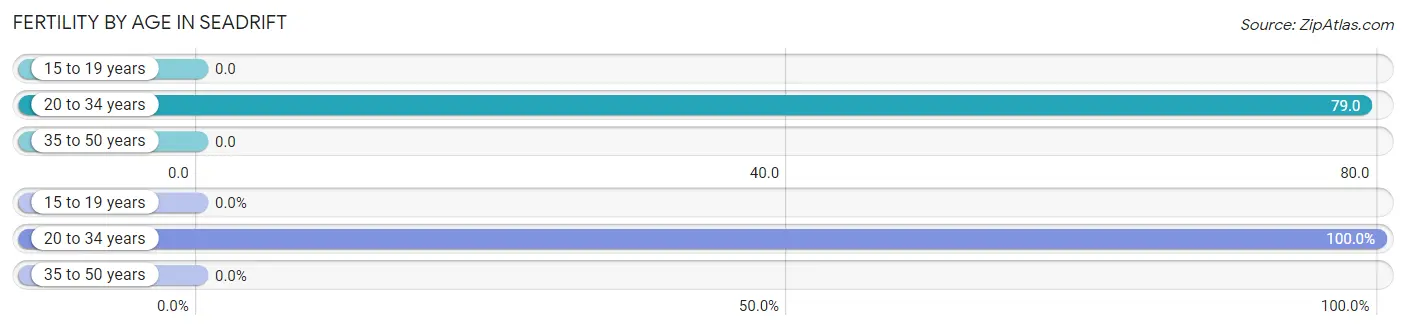
| Age Bracket | Women with Births | Births / 1,000 Women |
| 15 to 19 years | 0 (0.0%) | 0.0 |
| 20 to 34 years | 15 (100.0%) | 79.0 |
| 35 to 50 years | 0 (0.0%) | 0.0 |
| Total | 15 (100.0%) | 43.0 |
Fertility by Age by Marriage Status in Seadrift
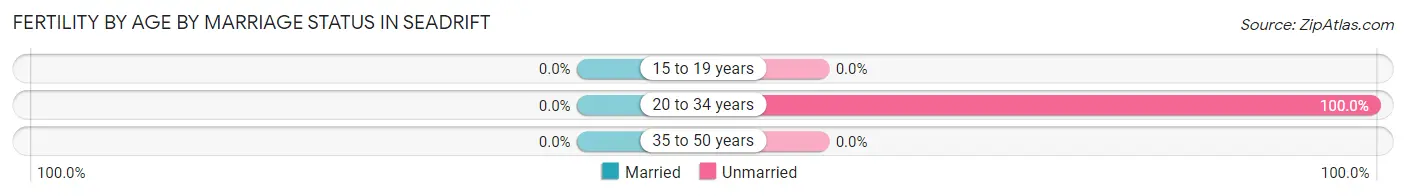
| Age Bracket | Married | Unmarried |
| 15 to 19 years | 0 (0.0%) | 0 (0.0%) |
| 20 to 34 years | 0 (0.0%) | 15 (100.0%) |
| 35 to 50 years | 0 (0.0%) | 0 (0.0%) |
| Total | 0 (0.0%) | 15 (100.0%) |
Fertility by Education in Seadrift
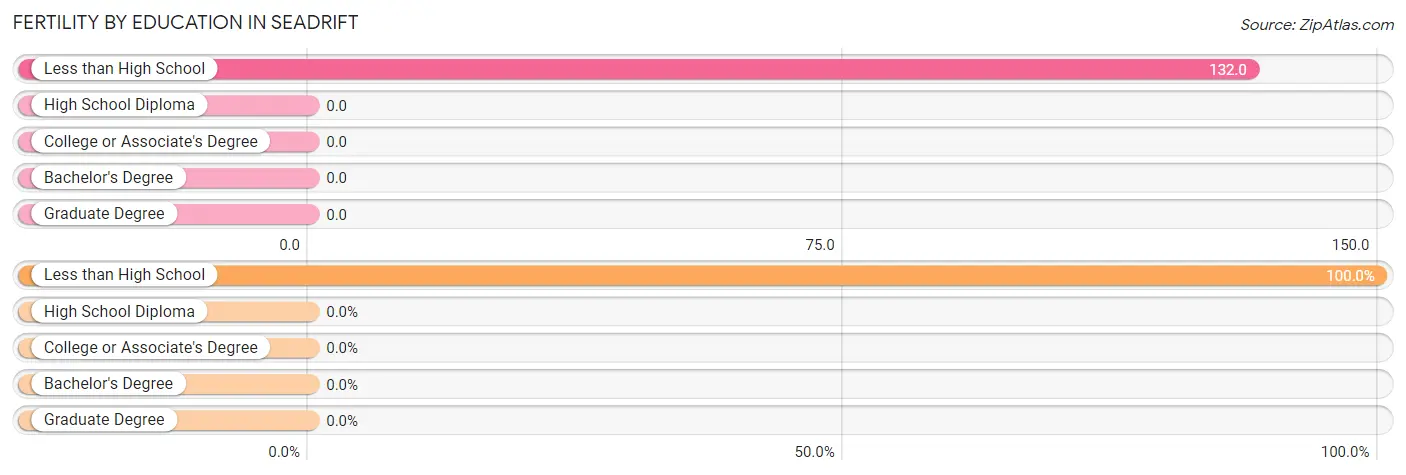
| Educational Attainment | Women with Births | Births / 1,000 Women |
| Less than High School | 15 (100.0%) | 132.0 |
| High School Diploma | 0 (0.0%) | 0.0 |
| College or Associate's Degree | 0 (0.0%) | 0.0 |
| Bachelor's Degree | 0 (0.0%) | 0.0 |
| Graduate Degree | 0 (0.0%) | 0.0 |
| Total | 15 (100.0%) | 43.0 |
Fertility by Education by Marriage Status in Seadrift
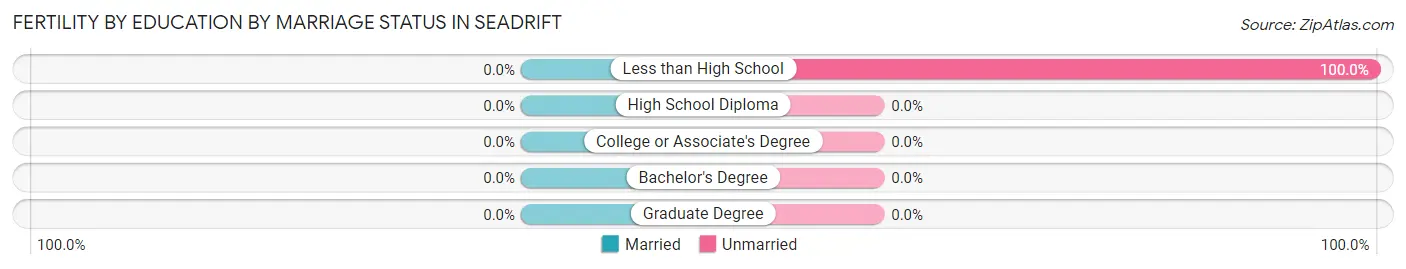
| Educational Attainment | Married | Unmarried |
| Less than High School | 0 (0.0%) | 15 (100.0%) |
| High School Diploma | 0 (0.0%) | 0 (0.0%) |
| College or Associate's Degree | 0 (0.0%) | 0 (0.0%) |
| Bachelor's Degree | 0 (0.0%) | 0 (0.0%) |
| Graduate Degree | 0 (0.0%) | 0 (0.0%) |
| Total | 0 (0.0%) | 15 (100.0%) |
Employment Characteristics in Seadrift
Employment by Class of Employer in Seadrift
Among the 657 employed individuals in Seadrift, private company employees (442 | 67.3%), self-employed (not incorporated) (143 | 21.8%), and local government employees (49 | 7.5%) make up the most common classes of employment.
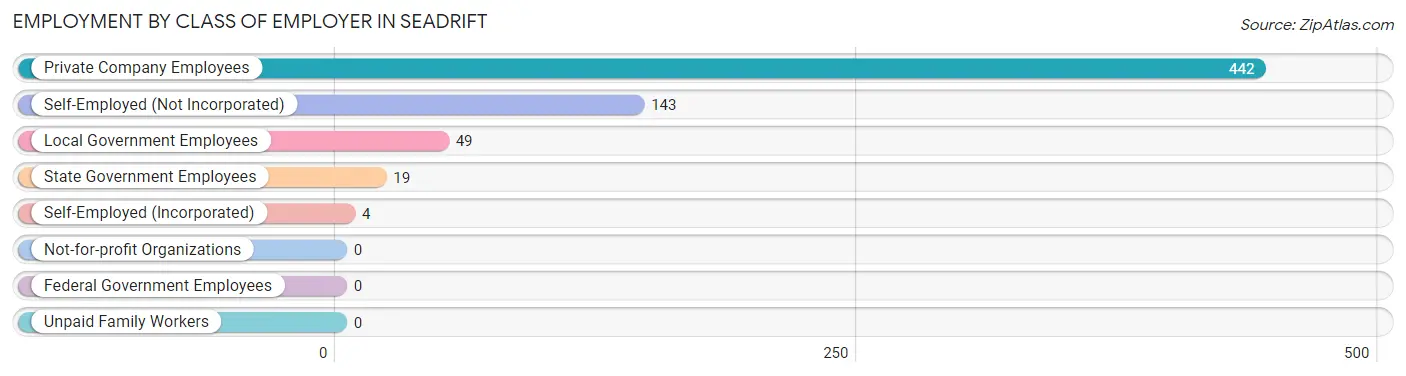
| Employer Class | # Employees | % Employees |
| Private Company Employees | 442 | 67.3% |
| Self-Employed (Incorporated) | 4 | 0.6% |
| Self-Employed (Not Incorporated) | 143 | 21.8% |
| Not-for-profit Organizations | 0 | 0.0% |
| Local Government Employees | 49 | 7.5% |
| State Government Employees | 19 | 2.9% |
| Federal Government Employees | 0 | 0.0% |
| Unpaid Family Workers | 0 | 0.0% |
| Total | 657 | 100.0% |
Employment Status by Age in Seadrift
According to the labor force statistics for Seadrift, out of the total population over 16 years of age (1,150), 60.3% or 693 individuals are in the labor force, with 1.7% or 12 of them unemployed. The age group with the highest labor force participation rate is 45 to 54 years, with 100.0% or 191 individuals in the labor force. Within the labor force, the 45 to 54 years age range has the highest percentage of unemployed individuals, with 6.3% or 12 of them being unemployed.
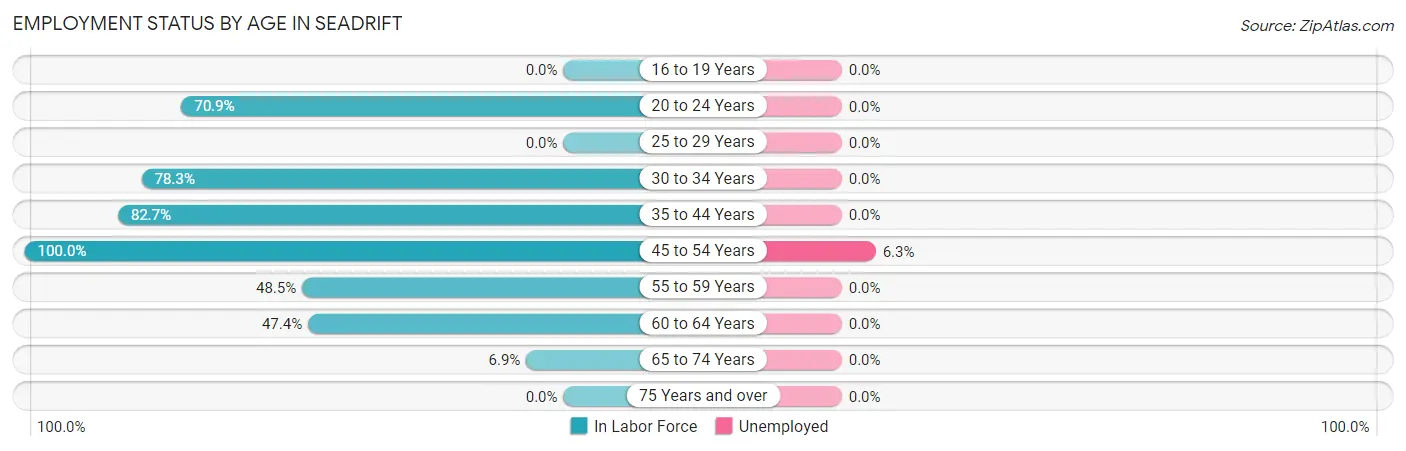
| Age Bracket | In Labor Force | Unemployed |
| 16 to 19 Years | 0 (0.0%) | 0 (0.0%) |
| 20 to 24 Years | 112 (70.9%) | 0 (0.0%) |
| 25 to 29 Years | 0 (0.0%) | 0 (0.0%) |
| 30 to 34 Years | 123 (78.3%) | 0 (0.0%) |
| 35 to 44 Years | 205 (82.7%) | 0 (0.0%) |
| 45 to 54 Years | 191 (100.0%) | 12 (6.3%) |
| 55 to 59 Years | 50 (48.5%) | 0 (0.0%) |
| 60 to 64 Years | 9 (47.4%) | 0 (0.0%) |
| 65 to 74 Years | 4 (6.9%) | 0 (0.0%) |
| 75 Years and over | 0 (0.0%) | 0 (0.0%) |
| Total | 693 (60.3%) | 12 (1.7%) |
Employment Status by Educational Attainment in Seadrift
According to labor force statistics for Seadrift, 80.5% of individuals (578) out of the total population between 25 and 64 years of age (718) are in the labor force, with 2.1% or 12 of them being unemployed. The group with the highest labor force participation rate are those with the educational attainment of bachelor's degree or higher, with 100.0% or 112 individuals in the labor force. Within the labor force, individuals with college / associate degree education have the highest percentage of unemployment, with 7.2% or 12 of them being unemployed.
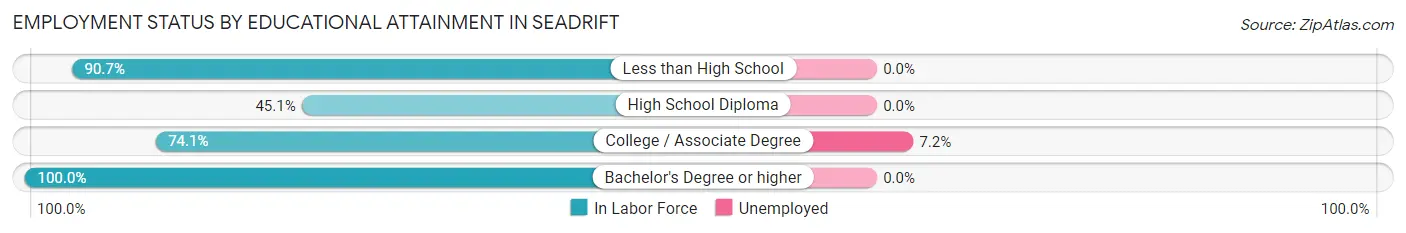
| Educational Attainment | In Labor Force | Unemployed |
| Less than High School | 254 (90.7%) | 0 (0.0%) |
| High School Diploma | 46 (45.1%) | 0 (0.0%) |
| College / Associate Degree | 166 (74.1%) | 16 (7.2%) |
| Bachelor's Degree or higher | 112 (100.0%) | 0 (0.0%) |
| Total | 578 (80.5%) | 15 (2.1%) |
Employment Occupations by Sex in Seadrift
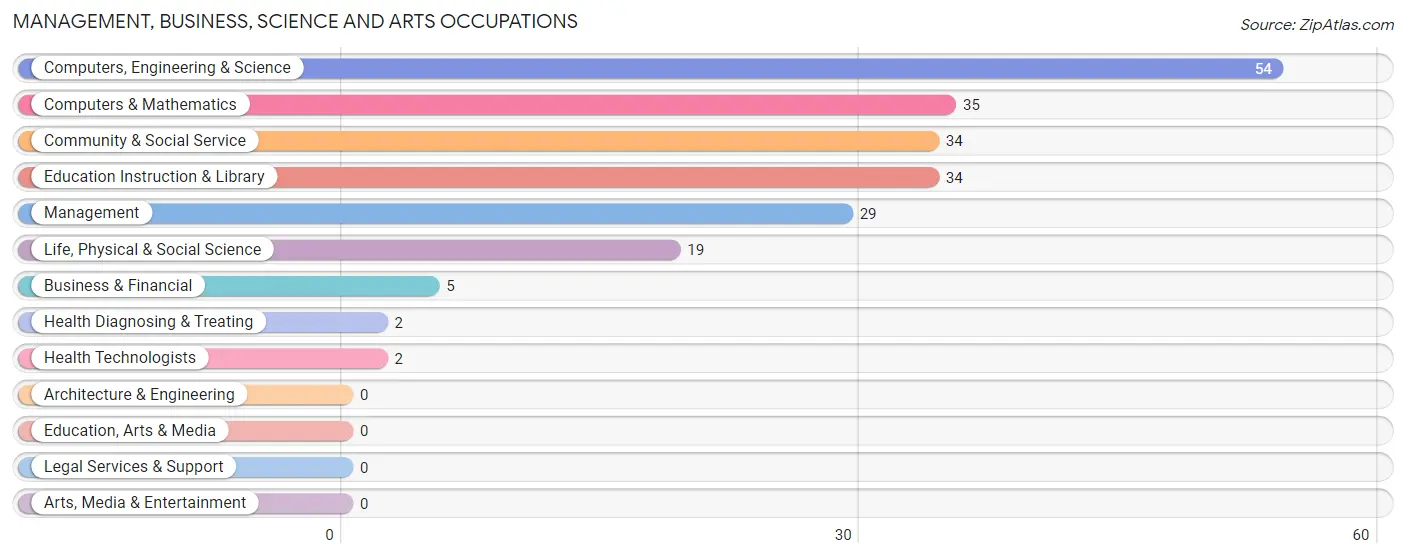
Management, Business, Science and Arts Occupations
The most common Management, Business, Science and Arts occupations in Seadrift are Computers, Engineering & Science (54 | 7.9%), Computers & Mathematics (35 | 5.1%), Community & Social Service (34 | 5.0%), Education Instruction & Library (34 | 5.0%), and Management (29 | 4.3%).
Management, Business, Science and Arts Occupations by Sex
Within the Management, Business, Science and Arts occupations in Seadrift, the most male-oriented occupations are Computers, Engineering & Science (100.0%), Computers & Mathematics (100.0%), and Life, Physical & Social Science (100.0%), while the most female-oriented occupations are Business & Financial (100.0%), Community & Social Service (100.0%), and Education Instruction & Library (100.0%).
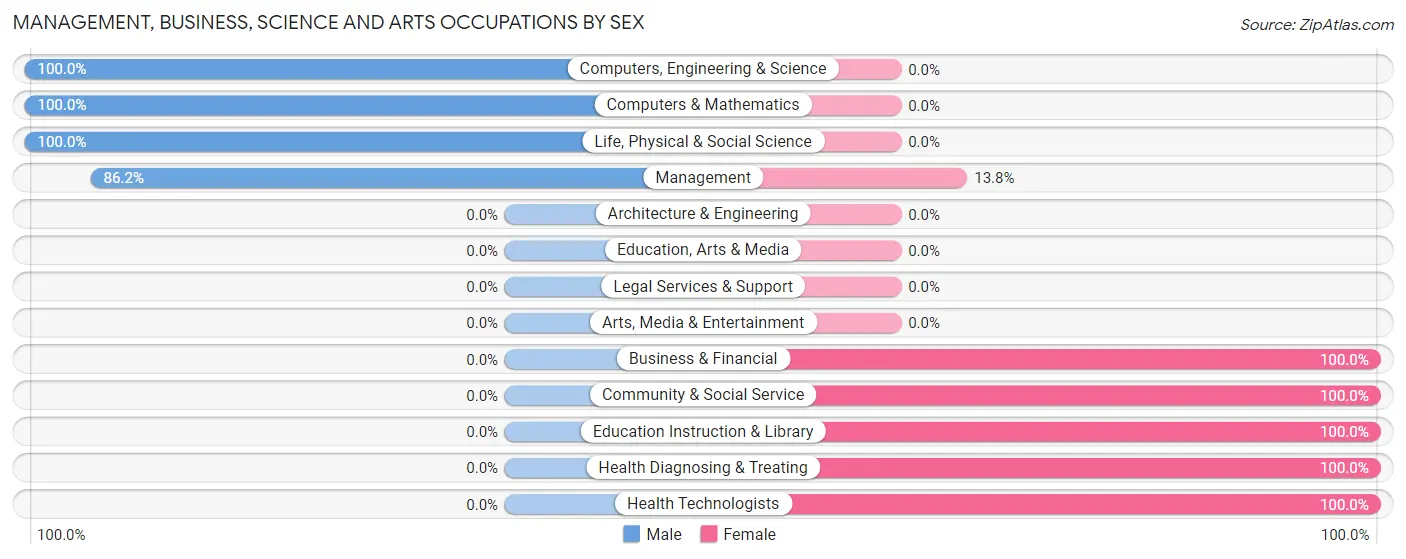
| Occupation | Male | Female |
| Management | 25 (86.2%) | 4 (13.8%) |
| Business & Financial | 0 (0.0%) | 5 (100.0%) |
| Computers, Engineering & Science | 54 (100.0%) | 0 (0.0%) |
| Computers & Mathematics | 35 (100.0%) | 0 (0.0%) |
| Architecture & Engineering | 0 (0.0%) | 0 (0.0%) |
| Life, Physical & Social Science | 19 (100.0%) | 0 (0.0%) |
| Community & Social Service | 0 (0.0%) | 34 (100.0%) |
| Education, Arts & Media | 0 (0.0%) | 0 (0.0%) |
| Legal Services & Support | 0 (0.0%) | 0 (0.0%) |
| Education Instruction & Library | 0 (0.0%) | 34 (100.0%) |
| Arts, Media & Entertainment | 0 (0.0%) | 0 (0.0%) |
| Health Diagnosing & Treating | 0 (0.0%) | 2 (100.0%) |
| Health Technologists | 0 (0.0%) | 2 (100.0%) |
| Total (Category) | 79 (63.7%) | 45 (36.3%) |
| Total (Overall) | 461 (67.6%) | 221 (32.4%) |
Services Occupations
The most common Services occupations in Seadrift are Food Preparation & Serving (40 | 5.9%), and Personal Care & Service (32 | 4.7%).
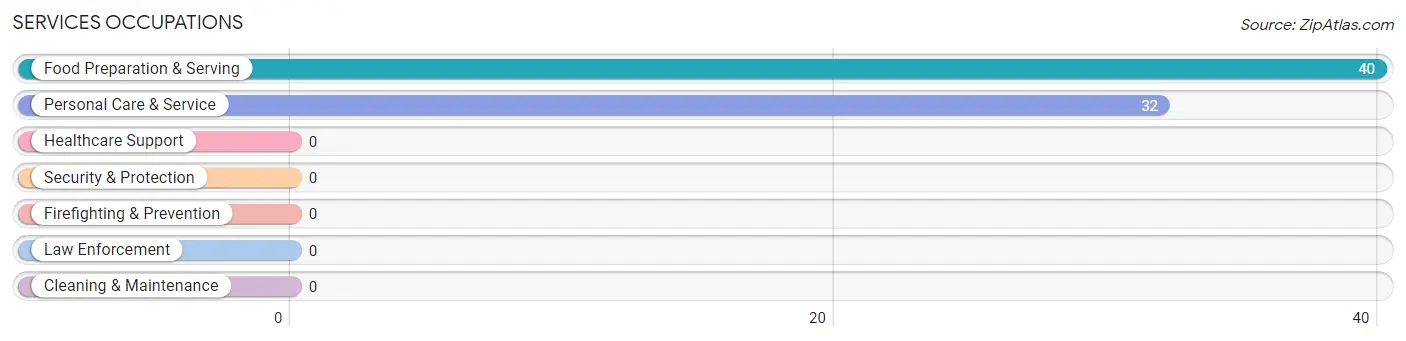
Services Occupations by Sex
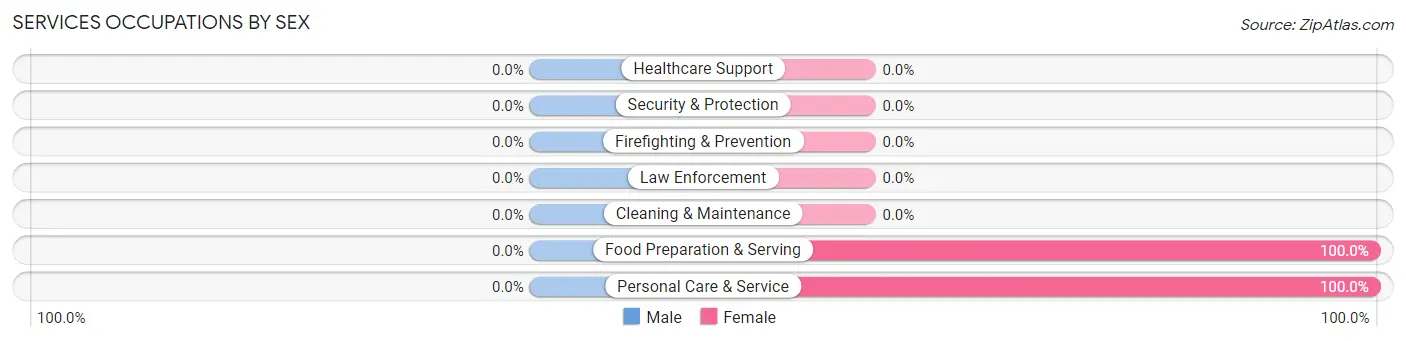
| Occupation | Male | Female |
| Healthcare Support | 0 (0.0%) | 0 (0.0%) |
| Security & Protection | 0 (0.0%) | 0 (0.0%) |
| Firefighting & Prevention | 0 (0.0%) | 0 (0.0%) |
| Law Enforcement | 0 (0.0%) | 0 (0.0%) |
| Food Preparation & Serving | 0 (0.0%) | 40 (100.0%) |
| Cleaning & Maintenance | 0 (0.0%) | 0 (0.0%) |
| Personal Care & Service | 0 (0.0%) | 32 (100.0%) |
| Total (Category) | 0 (0.0%) | 72 (100.0%) |
| Total (Overall) | 461 (67.6%) | 221 (32.4%) |
Sales and Office Occupations
The most common Sales and Office occupations in Seadrift are Office & Administration (131 | 19.2%), and Sales & Related (37 | 5.4%).
Sales and Office Occupations by Sex
| Occupation | Male | Female |
| Sales & Related | 37 (100.0%) | 0 (0.0%) |
| Office & Administration | 27 (20.6%) | 104 (79.4%) |
| Total (Category) | 64 (38.1%) | 104 (61.9%) |
| Total (Overall) | 461 (67.6%) | 221 (32.4%) |
Natural Resources, Construction and Maintenance Occupations
The most common Natural Resources, Construction and Maintenance occupations in Seadrift are Construction & Extraction (220 | 32.3%), Installation, Maintenance & Repair (49 | 7.2%), and Farming, Fishing & Forestry (24 | 3.5%).
Natural Resources, Construction and Maintenance Occupations by Sex
| Occupation | Male | Female |
| Farming, Fishing & Forestry | 24 (100.0%) | 0 (0.0%) |
| Construction & Extraction | 220 (100.0%) | 0 (0.0%) |
| Installation, Maintenance & Repair | 49 (100.0%) | 0 (0.0%) |
| Total (Category) | 293 (100.0%) | 0 (0.0%) |
| Total (Overall) | 461 (67.6%) | 221 (32.4%) |
Production, Transportation and Moving Occupations
The most common Production, Transportation and Moving occupations in Seadrift are , and Production (25 | 3.7%).
Production, Transportation and Moving Occupations by Sex
| Occupation | Male | Female |
| Production | 25 (100.0%) | 0 (0.0%) |
| Transportation | 0 (0.0%) | 0 (0.0%) |
| Material Moving | 0 (0.0%) | 0 (0.0%) |
| Total (Category) | 25 (100.0%) | 0 (0.0%) |
| Total (Overall) | 461 (67.6%) | 221 (32.4%) |
Employment Industries by Sex in Seadrift
Employment Industries in Seadrift
The major employment industries in Seadrift include Construction (173 | 25.4%), Manufacturing (92 | 13.5%), Finance & Insurance (85 | 12.5%), Educational Services (53 | 7.8%), and Mining, Quarrying, & Extraction (51 | 7.5%).
Employment Industries by Sex in Seadrift
The Seadrift industries that see more men than women are Agriculture, Fishing & Hunting (100.0%), Mining, Quarrying, & Extraction (100.0%), and Construction (100.0%), whereas the industries that tend to have a higher number of women are Finance & Insurance (100.0%), Administrative & Support (100.0%), and Health Care & Social Assistance (100.0%).
| Industry | Male | Female |
| Agriculture, Fishing & Hunting | 24 (100.0%) | 0 (0.0%) |
| Mining, Quarrying, & Extraction | 51 (100.0%) | 0 (0.0%) |
| Construction | 173 (100.0%) | 0 (0.0%) |
| Manufacturing | 87 (94.6%) | 5 (5.4%) |
| Wholesale Trade | 39 (100.0%) | 0 (0.0%) |
| Retail Trade | 37 (94.9%) | 2 (5.1%) |
| Transportation & Warehousing | 0 (0.0%) | 0 (0.0%) |
| Utilities | 0 (0.0%) | 0 (0.0%) |
| Information | 0 (0.0%) | 0 (0.0%) |
| Finance & Insurance | 0 (0.0%) | 85 (100.0%) |
| Real Estate, Rental & Leasing | 0 (0.0%) | 0 (0.0%) |
| Professional & Scientific | 27 (100.0%) | 0 (0.0%) |
| Enterprise Management | 0 (0.0%) | 0 (0.0%) |
| Administrative & Support | 0 (0.0%) | 19 (100.0%) |
| Educational Services | 19 (35.8%) | 34 (64.1%) |
| Health Care & Social Assistance | 0 (0.0%) | 32 (100.0%) |
| Arts, Entertainment & Recreation | 0 (0.0%) | 0 (0.0%) |
| Accommodation & Food Services | 4 (8.3%) | 44 (91.7%) |
| Public Administration | 0 (0.0%) | 0 (0.0%) |
| Total | 461 (67.6%) | 221 (32.4%) |
Education in Seadrift
School Enrollment in Seadrift
The most common levels of schooling among the 235 students in Seadrift are college / undergraduate (70 | 29.8%), high school (65 | 27.7%), and elementary school (46 | 19.6%).
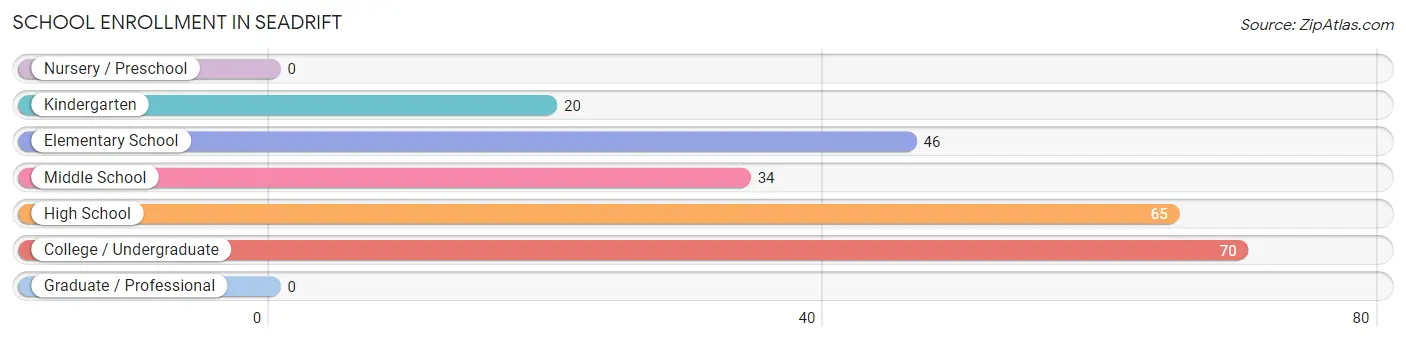
| School Level | # Students | % Students |
| Nursery / Preschool | 0 | 0.0% |
| Kindergarten | 20 | 8.5% |
| Elementary School | 46 | 19.6% |
| Middle School | 34 | 14.5% |
| High School | 65 | 27.7% |
| College / Undergraduate | 70 | 29.8% |
| Graduate / Professional | 0 | 0.0% |
| Total | 235 | 100.0% |
School Enrollment by Age by Funding Source in Seadrift
Out of a total of 235 students who are enrolled in schools in Seadrift, 13 (5.5%) attend a private institution, while the remaining 222 (94.5%) are enrolled in public schools. The age group of 10 to 14 year olds has the highest likelihood of being enrolled in private schools, with 13 (27.7% in the age bracket) enrolled. Conversely, the age group of 5 to 9 year old has the lowest likelihood of being enrolled in a private school, with 66 (100.0% in the age bracket) attending a public institution.
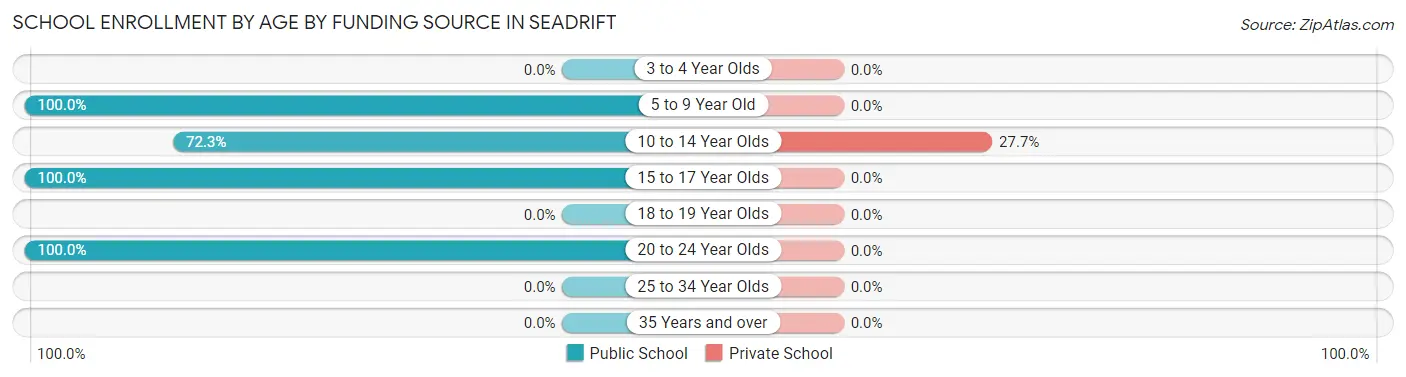
| Age Bracket | Public School | Private School |
| 3 to 4 Year Olds | 0 (0.0%) | 0 (0.0%) |
| 5 to 9 Year Old | 66 (100.0%) | 0 (0.0%) |
| 10 to 14 Year Olds | 34 (72.3%) | 13 (27.7%) |
| 15 to 17 Year Olds | 52 (100.0%) | 0 (0.0%) |
| 18 to 19 Year Olds | 0 (0.0%) | 0 (0.0%) |
| 20 to 24 Year Olds | 70 (100.0%) | 0 (0.0%) |
| 25 to 34 Year Olds | 0 (0.0%) | 0 (0.0%) |
| 35 Years and over | 0 (0.0%) | 0 (0.0%) |
| Total | 222 (94.5%) | 13 (5.5%) |
Educational Attainment by Field of Study in Seadrift
Business (50 | 40.0%), liberal arts & history (39 | 31.2%), education (34 | 27.2%), and multidisciplinary studies (2 | 1.6%) are the most common fields of study among 125 individuals in Seadrift who have obtained a bachelor's degree or higher.
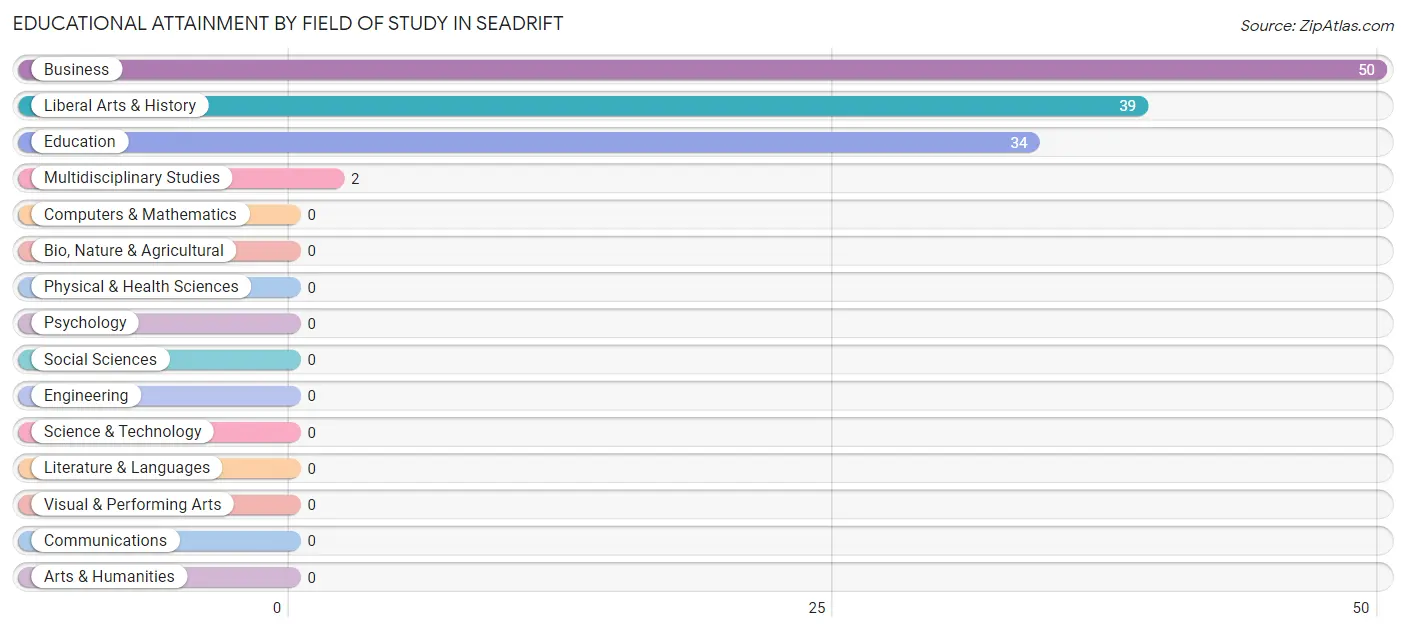
| Field of Study | # Graduates | % Graduates |
| Computers & Mathematics | 0 | 0.0% |
| Bio, Nature & Agricultural | 0 | 0.0% |
| Physical & Health Sciences | 0 | 0.0% |
| Psychology | 0 | 0.0% |
| Social Sciences | 0 | 0.0% |
| Engineering | 0 | 0.0% |
| Multidisciplinary Studies | 2 | 1.6% |
| Science & Technology | 0 | 0.0% |
| Business | 50 | 40.0% |
| Education | 34 | 27.2% |
| Literature & Languages | 0 | 0.0% |
| Liberal Arts & History | 39 | 31.2% |
| Visual & Performing Arts | 0 | 0.0% |
| Communications | 0 | 0.0% |
| Arts & Humanities | 0 | 0.0% |
| Total | 125 | 100.0% |
Transportation & Commute in Seadrift
Vehicle Availability by Sex in Seadrift
The most prevalent vehicle ownership categories in Seadrift are males with 2 vehicles (201, accounting for 46.1%) and females with 2 vehicles (86, making up 90.9%).
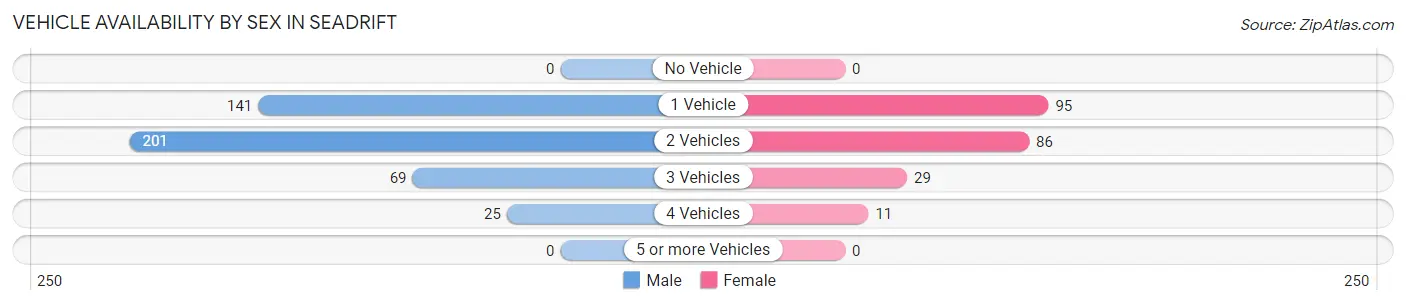
| Vehicles Available | Male | Female |
| No Vehicle | 0 (0.0%) | 0 (0.0%) |
| 1 Vehicle | 141 (32.3%) | 95 (43.0%) |
| 2 Vehicles | 201 (46.1%) | 86 (38.9%) |
| 3 Vehicles | 69 (15.8%) | 29 (13.1%) |
| 4 Vehicles | 25 (5.7%) | 11 (5.0%) |
| 5 or more Vehicles | 0 (0.0%) | 0 (0.0%) |
| Total | 436 (100.0%) | 221 (100.0%) |
Commute Time in Seadrift
The most frequently occuring commute durations in Seadrift are 45 to 59 minutes (198 commuters, 30.1%), 20 to 24 minutes (128 commuters, 19.5%), and less than 5 minutes (78 commuters, 11.9%).
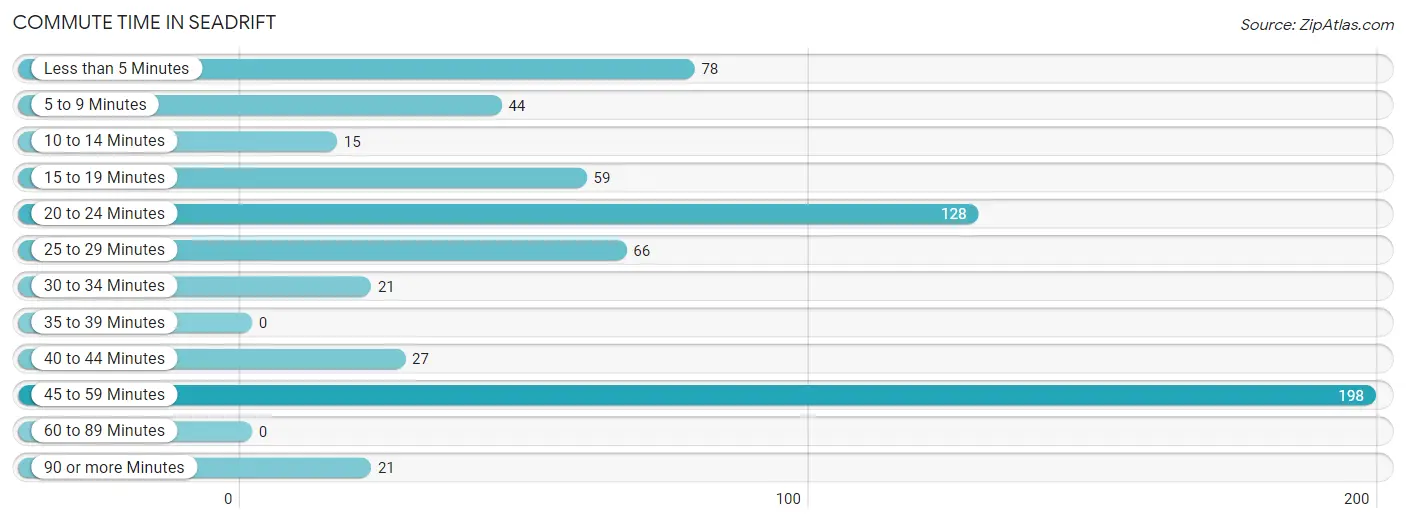
| Commute Time | # Commuters | % Commuters |
| Less than 5 Minutes | 78 | 11.9% |
| 5 to 9 Minutes | 44 | 6.7% |
| 10 to 14 Minutes | 15 | 2.3% |
| 15 to 19 Minutes | 59 | 9.0% |
| 20 to 24 Minutes | 128 | 19.5% |
| 25 to 29 Minutes | 66 | 10.1% |
| 30 to 34 Minutes | 21 | 3.2% |
| 35 to 39 Minutes | 0 | 0.0% |
| 40 to 44 Minutes | 27 | 4.1% |
| 45 to 59 Minutes | 198 | 30.1% |
| 60 to 89 Minutes | 0 | 0.0% |
| 90 or more Minutes | 21 | 3.2% |
Commute Time by Sex in Seadrift
The most common commute times in Seadrift are 45 to 59 minutes (196 commuters, 45.0%) for males and less than 5 minutes (78 commuters, 35.3%) for females.
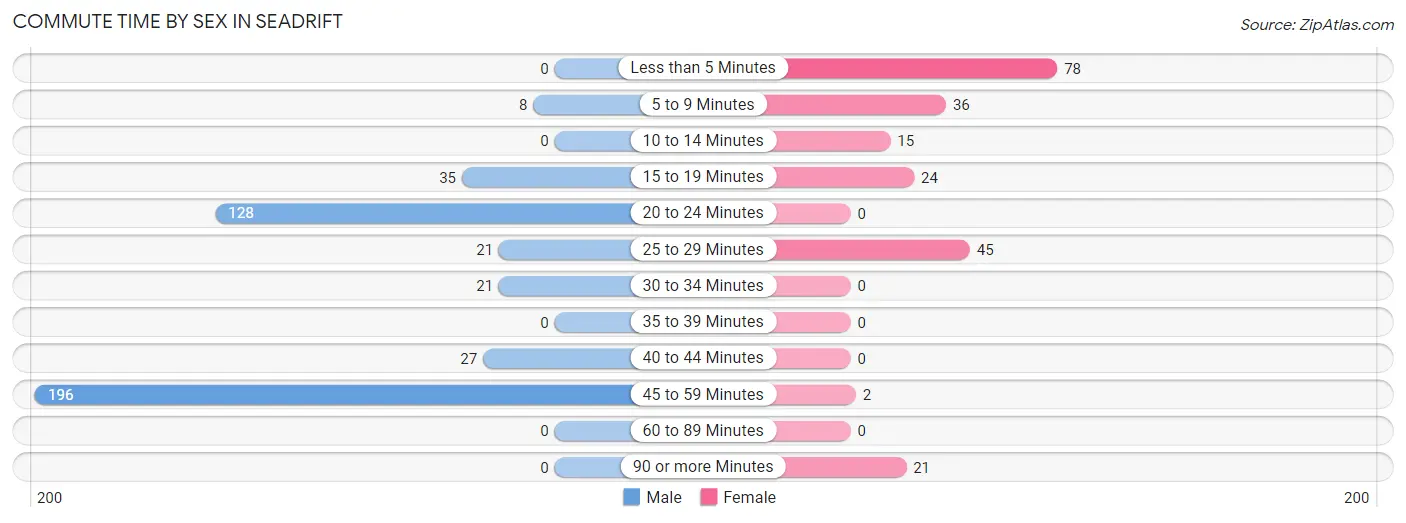
| Commute Time | Male | Female |
| Less than 5 Minutes | 0 (0.0%) | 78 (35.3%) |
| 5 to 9 Minutes | 8 (1.8%) | 36 (16.3%) |
| 10 to 14 Minutes | 0 (0.0%) | 15 (6.8%) |
| 15 to 19 Minutes | 35 (8.0%) | 24 (10.9%) |
| 20 to 24 Minutes | 128 (29.4%) | 0 (0.0%) |
| 25 to 29 Minutes | 21 (4.8%) | 45 (20.4%) |
| 30 to 34 Minutes | 21 (4.8%) | 0 (0.0%) |
| 35 to 39 Minutes | 0 (0.0%) | 0 (0.0%) |
| 40 to 44 Minutes | 27 (6.2%) | 0 (0.0%) |
| 45 to 59 Minutes | 196 (45.0%) | 2 (0.9%) |
| 60 to 89 Minutes | 0 (0.0%) | 0 (0.0%) |
| 90 or more Minutes | 0 (0.0%) | 21 (9.5%) |
Time of Departure to Work by Sex in Seadrift
The most frequent times of departure to work in Seadrift are 8:00 AM to 8:29 AM (169, 38.8%) for males and 8:00 AM to 8:29 AM (78, 35.3%) for females.
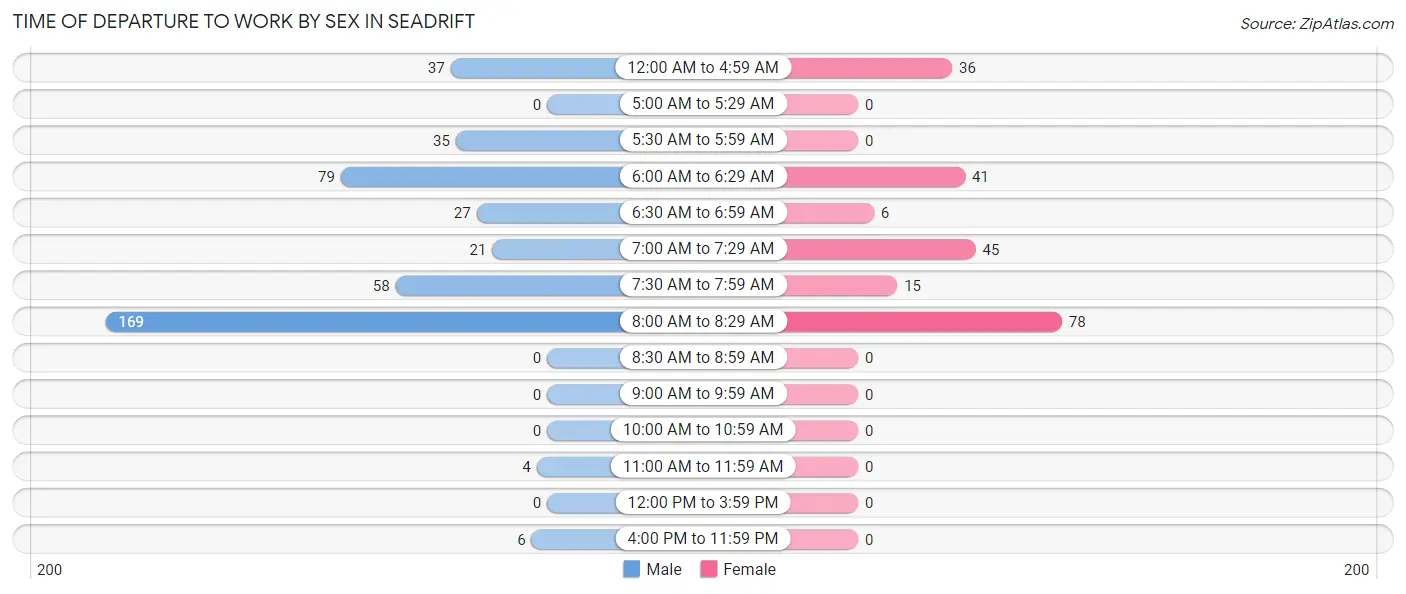
| Time of Departure | Male | Female |
| 12:00 AM to 4:59 AM | 37 (8.5%) | 36 (16.3%) |
| 5:00 AM to 5:29 AM | 0 (0.0%) | 0 (0.0%) |
| 5:30 AM to 5:59 AM | 35 (8.0%) | 0 (0.0%) |
| 6:00 AM to 6:29 AM | 79 (18.1%) | 41 (18.5%) |
| 6:30 AM to 6:59 AM | 27 (6.2%) | 6 (2.7%) |
| 7:00 AM to 7:29 AM | 21 (4.8%) | 45 (20.4%) |
| 7:30 AM to 7:59 AM | 58 (13.3%) | 15 (6.8%) |
| 8:00 AM to 8:29 AM | 169 (38.8%) | 78 (35.3%) |
| 8:30 AM to 8:59 AM | 0 (0.0%) | 0 (0.0%) |
| 9:00 AM to 9:59 AM | 0 (0.0%) | 0 (0.0%) |
| 10:00 AM to 10:59 AM | 0 (0.0%) | 0 (0.0%) |
| 11:00 AM to 11:59 AM | 4 (0.9%) | 0 (0.0%) |
| 12:00 PM to 3:59 PM | 0 (0.0%) | 0 (0.0%) |
| 4:00 PM to 11:59 PM | 6 (1.4%) | 0 (0.0%) |
| Total | 436 (100.0%) | 221 (100.0%) |
Housing Occupancy in Seadrift
Occupancy by Ownership in Seadrift
Of the total 665 dwellings in Seadrift, owner-occupied units account for 515 (77.4%), while renter-occupied units make up 150 (22.6%).
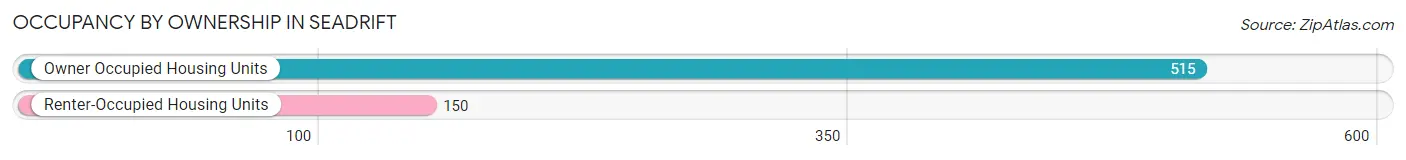
| Occupancy | # Housing Units | % Housing Units |
| Owner Occupied Housing Units | 515 | 77.4% |
| Renter-Occupied Housing Units | 150 | 22.6% |
| Total Occupied Housing Units | 665 | 100.0% |
Occupancy by Household Size in Seadrift
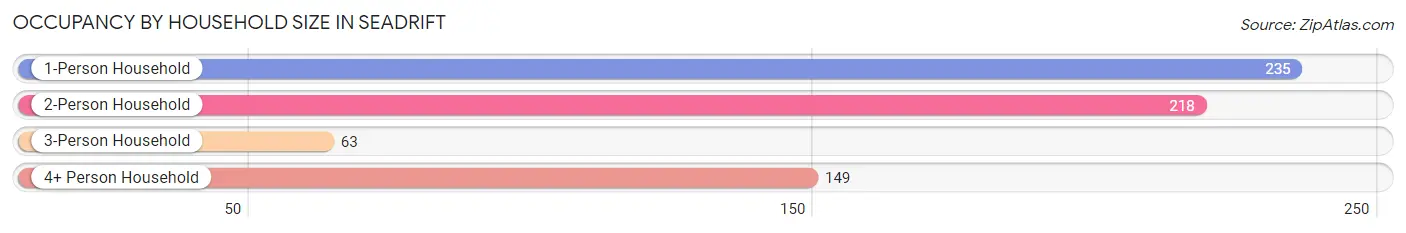
| Household Size | # Housing Units | % Housing Units |
| 1-Person Household | 235 | 35.3% |
| 2-Person Household | 218 | 32.8% |
| 3-Person Household | 63 | 9.5% |
| 4+ Person Household | 149 | 22.4% |
| Total Housing Units | 665 | 100.0% |
Occupancy by Ownership by Household Size in Seadrift
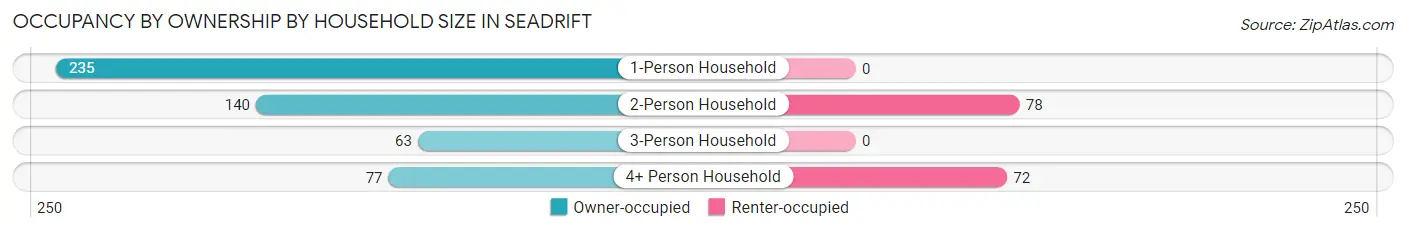
| Household Size | Owner-occupied | Renter-occupied |
| 1-Person Household | 235 (100.0%) | 0 (0.0%) |
| 2-Person Household | 140 (64.2%) | 78 (35.8%) |
| 3-Person Household | 63 (100.0%) | 0 (0.0%) |
| 4+ Person Household | 77 (51.7%) | 72 (48.3%) |
| Total Housing Units | 515 (77.4%) | 150 (22.6%) |
Occupancy by Educational Attainment in Seadrift
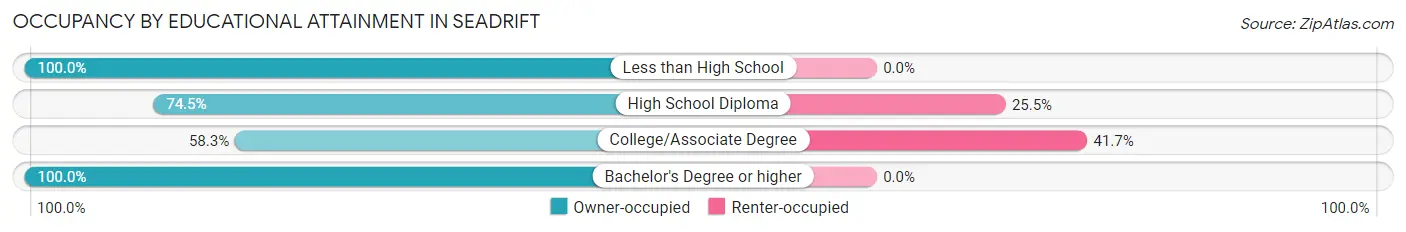
| Household Size | Owner-occupied | Renter-occupied |
| Less than High School | 108 (100.0%) | 0 (0.0%) |
| High School Diploma | 210 (74.5%) | 72 (25.5%) |
| College/Associate Degree | 109 (58.3%) | 78 (41.7%) |
| Bachelor's Degree or higher | 88 (100.0%) | 0 (0.0%) |
Occupancy by Age of Householder in Seadrift
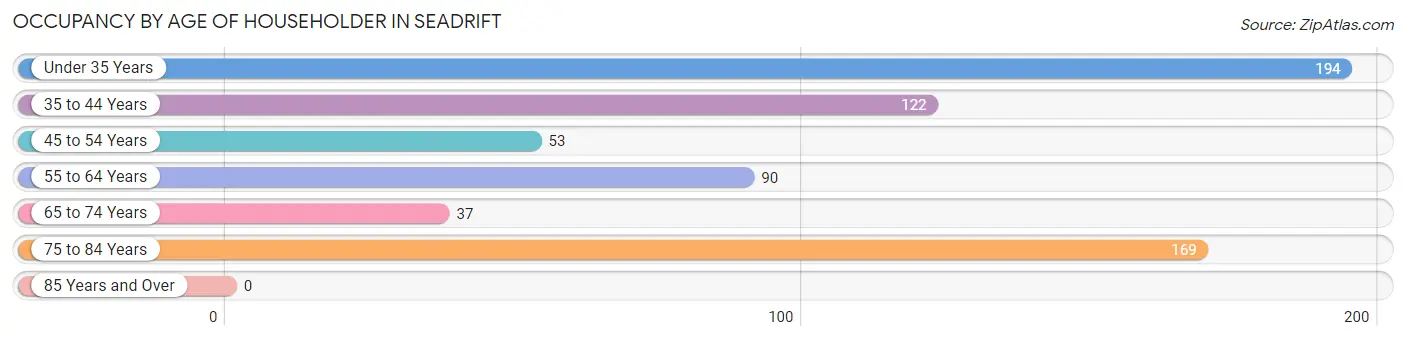
| Age Bracket | # Households | % Households |
| Under 35 Years | 194 | 29.2% |
| 35 to 44 Years | 122 | 18.3% |
| 45 to 54 Years | 53 | 8.0% |
| 55 to 64 Years | 90 | 13.5% |
| 65 to 74 Years | 37 | 5.6% |
| 75 to 84 Years | 169 | 25.4% |
| 85 Years and Over | 0 | 0.0% |
| Total | 665 | 100.0% |
Housing Finances in Seadrift
Median Income by Occupancy in Seadrift
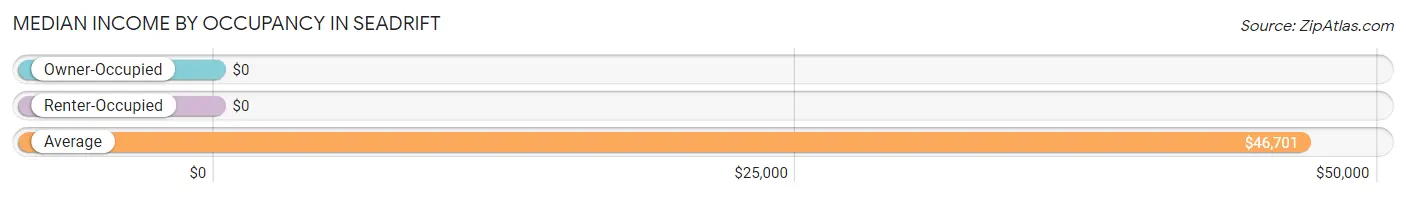
| Occupancy Type | # Households | Median Income |
| Owner-Occupied | 515 (77.4%) | $0 |
| Renter-Occupied | 150 (22.6%) | $0 |
| Average | 665 (100.0%) | $46,701 |
Occupancy by Householder Income Bracket in Seadrift
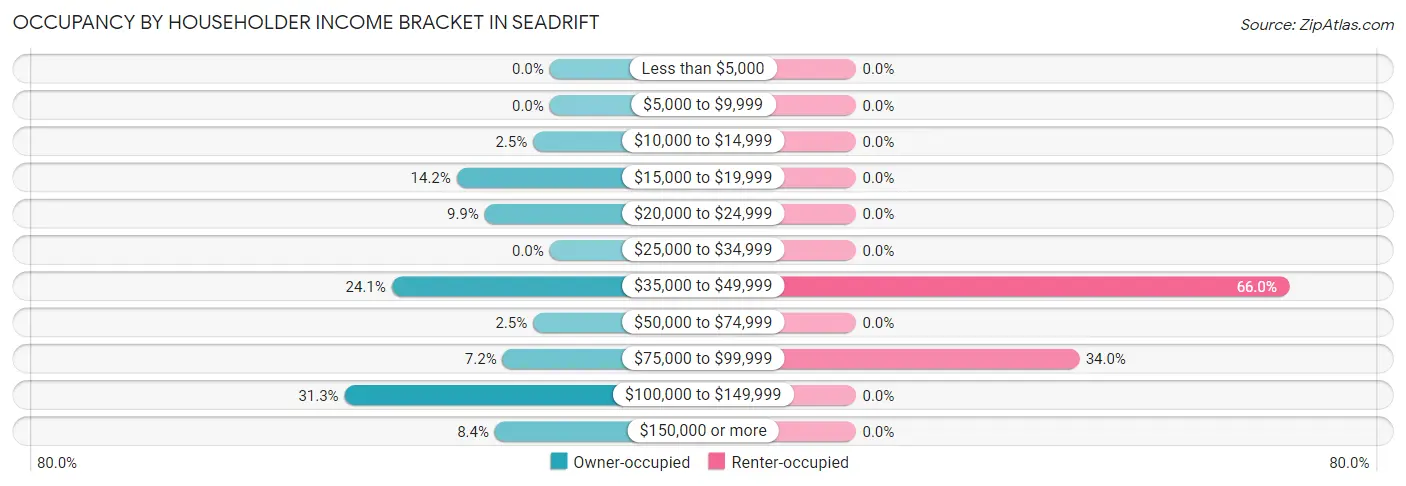
| Income Bracket | Owner-occupied | Renter-occupied |
| Less than $5,000 | 0 (0.0%) | 0 (0.0%) |
| $5,000 to $9,999 | 0 (0.0%) | 0 (0.0%) |
| $10,000 to $14,999 | 13 (2.5%) | 0 (0.0%) |
| $15,000 to $19,999 | 73 (14.2%) | 0 (0.0%) |
| $20,000 to $24,999 | 51 (9.9%) | 0 (0.0%) |
| $25,000 to $34,999 | 0 (0.0%) | 0 (0.0%) |
| $35,000 to $49,999 | 124 (24.1%) | 99 (66.0%) |
| $50,000 to $74,999 | 13 (2.5%) | 0 (0.0%) |
| $75,000 to $99,999 | 37 (7.2%) | 51 (34.0%) |
| $100,000 to $149,999 | 161 (31.3%) | 0 (0.0%) |
| $150,000 or more | 43 (8.4%) | 0 (0.0%) |
| Total | 515 (100.0%) | 150 (100.0%) |
Monthly Housing Cost Tiers in Seadrift
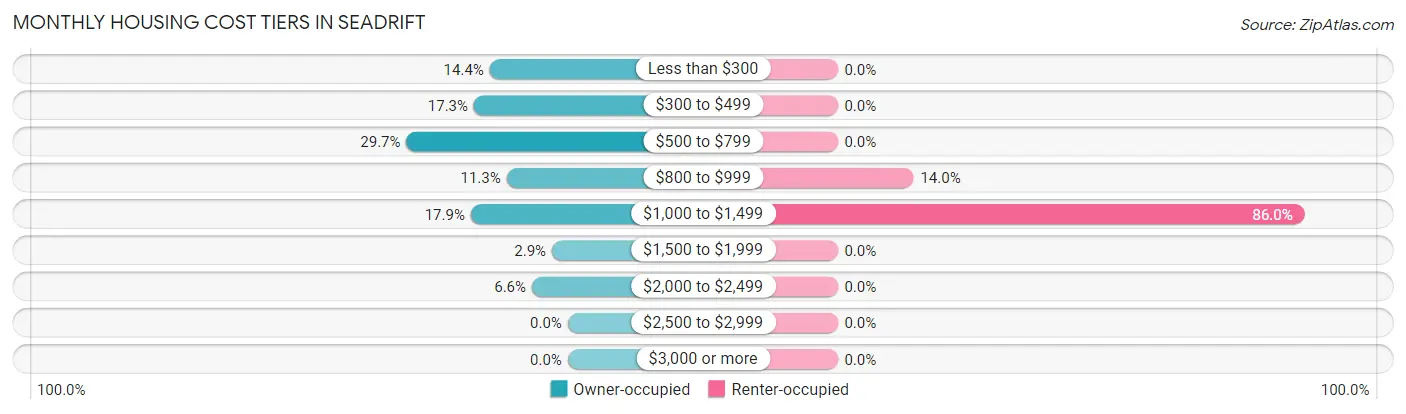
| Monthly Cost | Owner-occupied | Renter-occupied |
| Less than $300 | 74 (14.4%) | 0 (0.0%) |
| $300 to $499 | 89 (17.3%) | 0 (0.0%) |
| $500 to $799 | 153 (29.7%) | 0 (0.0%) |
| $800 to $999 | 58 (11.3%) | 21 (14.0%) |
| $1,000 to $1,499 | 92 (17.9%) | 129 (86.0%) |
| $1,500 to $1,999 | 15 (2.9%) | 0 (0.0%) |
| $2,000 to $2,499 | 34 (6.6%) | 0 (0.0%) |
| $2,500 to $2,999 | 0 (0.0%) | 0 (0.0%) |
| $3,000 or more | 0 (0.0%) | 0 (0.0%) |
| Total | 515 (100.0%) | 150 (100.0%) |
Physical Housing Characteristics in Seadrift
Housing Structures in Seadrift
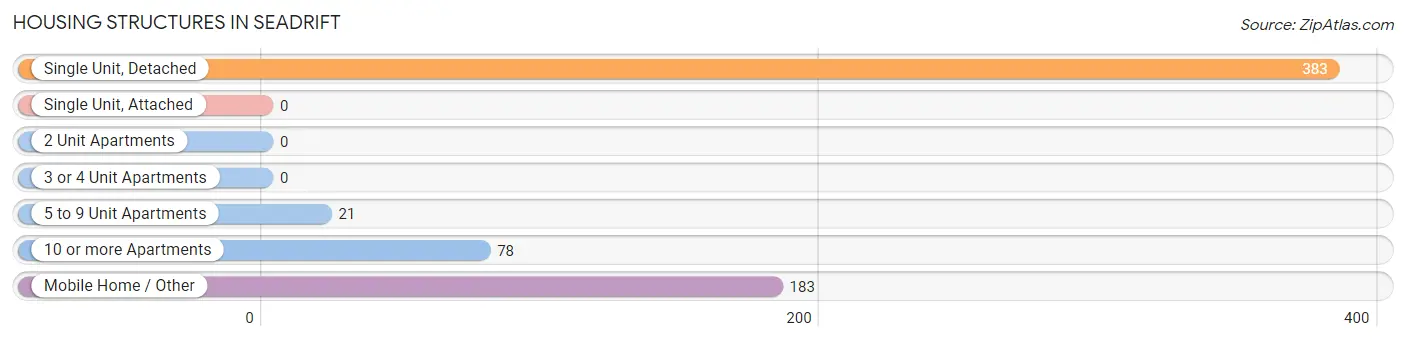
| Structure Type | # Housing Units | % Housing Units |
| Single Unit, Detached | 383 | 57.6% |
| Single Unit, Attached | 0 | 0.0% |
| 2 Unit Apartments | 0 | 0.0% |
| 3 or 4 Unit Apartments | 0 | 0.0% |
| 5 to 9 Unit Apartments | 21 | 3.2% |
| 10 or more Apartments | 78 | 11.7% |
| Mobile Home / Other | 183 | 27.5% |
| Total | 665 | 100.0% |
Housing Structures by Occupancy in Seadrift
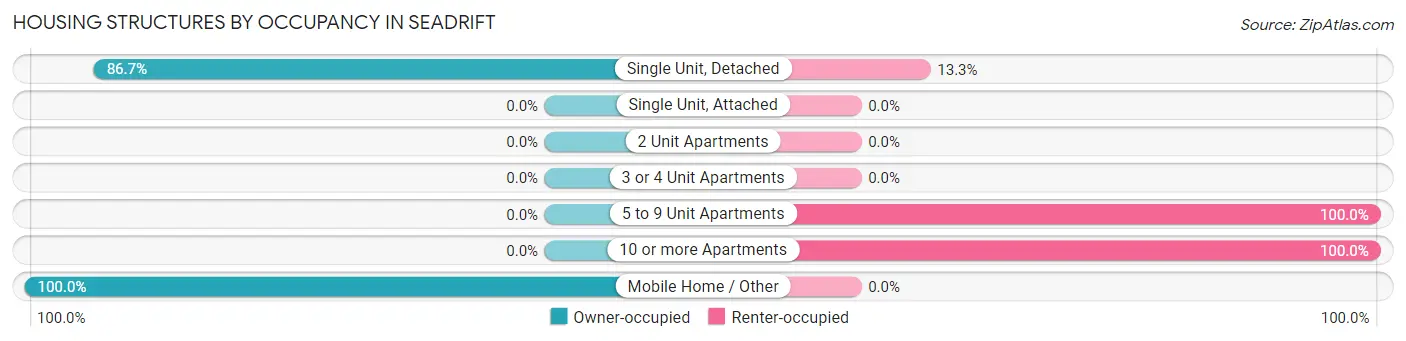
| Structure Type | Owner-occupied | Renter-occupied |
| Single Unit, Detached | 332 (86.7%) | 51 (13.3%) |
| Single Unit, Attached | 0 (0.0%) | 0 (0.0%) |
| 2 Unit Apartments | 0 (0.0%) | 0 (0.0%) |
| 3 or 4 Unit Apartments | 0 (0.0%) | 0 (0.0%) |
| 5 to 9 Unit Apartments | 0 (0.0%) | 21 (100.0%) |
| 10 or more Apartments | 0 (0.0%) | 78 (100.0%) |
| Mobile Home / Other | 183 (100.0%) | 0 (0.0%) |
| Total | 515 (77.4%) | 150 (22.6%) |
Housing Structures by Number of Rooms in Seadrift
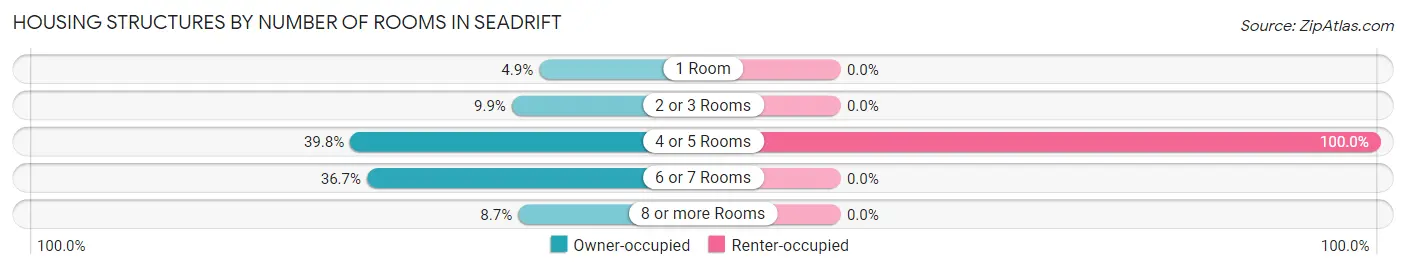
| Number of Rooms | Owner-occupied | Renter-occupied |
| 1 Room | 25 (4.9%) | 0 (0.0%) |
| 2 or 3 Rooms | 51 (9.9%) | 0 (0.0%) |
| 4 or 5 Rooms | 205 (39.8%) | 150 (100.0%) |
| 6 or 7 Rooms | 189 (36.7%) | 0 (0.0%) |
| 8 or more Rooms | 45 (8.7%) | 0 (0.0%) |
| Total | 515 (100.0%) | 150 (100.0%) |
Housing Structure by Heating Type in Seadrift
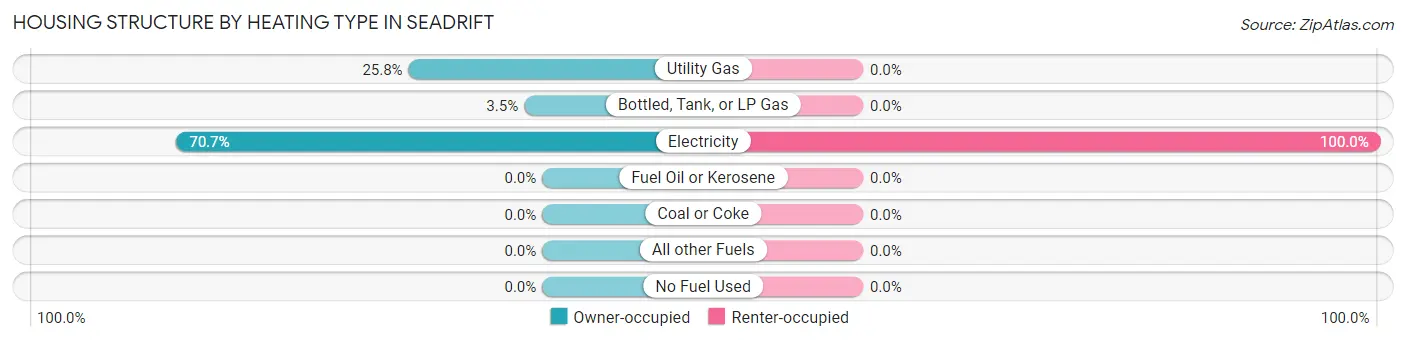
| Heating Type | Owner-occupied | Renter-occupied |
| Utility Gas | 133 (25.8%) | 0 (0.0%) |
| Bottled, Tank, or LP Gas | 18 (3.5%) | 0 (0.0%) |
| Electricity | 364 (70.7%) | 150 (100.0%) |
| Fuel Oil or Kerosene | 0 (0.0%) | 0 (0.0%) |
| Coal or Coke | 0 (0.0%) | 0 (0.0%) |
| All other Fuels | 0 (0.0%) | 0 (0.0%) |
| No Fuel Used | 0 (0.0%) | 0 (0.0%) |
| Total | 515 (100.0%) | 150 (100.0%) |
Household Vehicle Usage in Seadrift
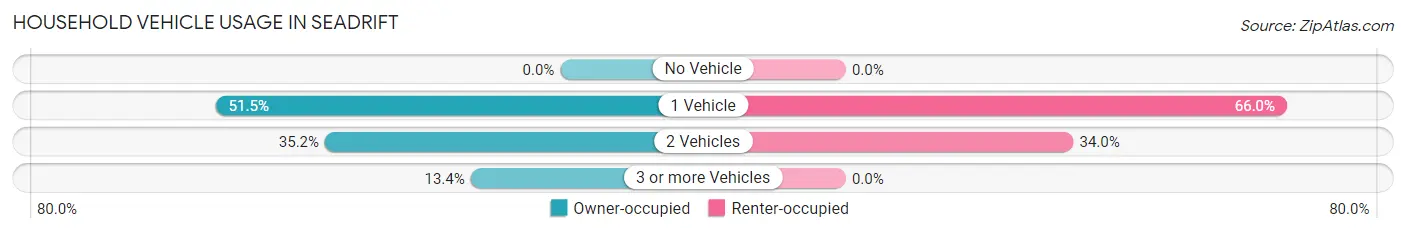
| Vehicles per Household | Owner-occupied | Renter-occupied |
| No Vehicle | 0 (0.0%) | 0 (0.0%) |
| 1 Vehicle | 265 (51.5%) | 99 (66.0%) |
| 2 Vehicles | 181 (35.1%) | 51 (34.0%) |
| 3 or more Vehicles | 69 (13.4%) | 0 (0.0%) |
| Total | 515 (100.0%) | 150 (100.0%) |
Real Estate & Mortgages in Seadrift
Real Estate and Mortgage Overview in Seadrift
| Characteristic | Without Mortgage | With Mortgage |
| Housing Units | 306 | 209 |
| Median Property Value | $111,600 | $108,800 |
| Median Household Income | $45,262 | $39 |
| Monthly Housing Costs | $476 | $0 |
| Real Estate Taxes | - | - |
Property Value by Mortgage Status in Seadrift
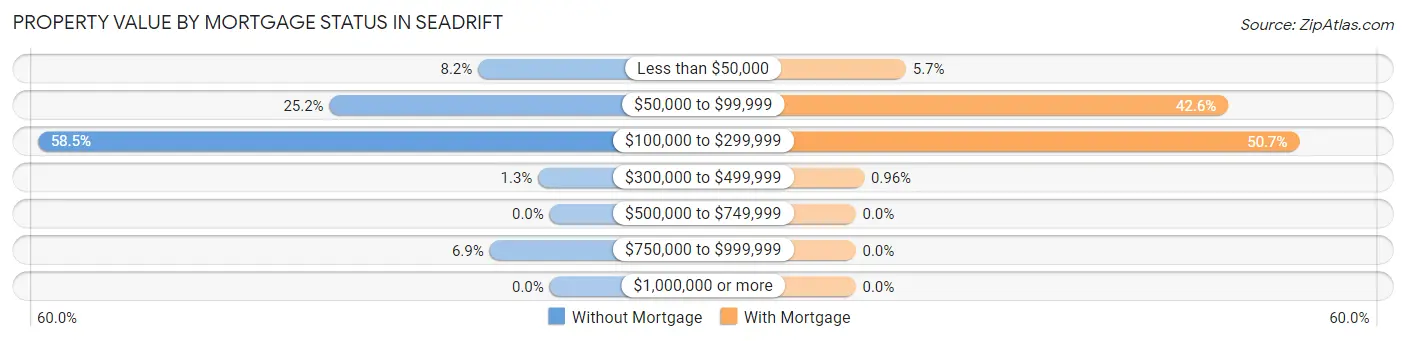
| Property Value | Without Mortgage | With Mortgage |
| Less than $50,000 | 25 (8.2%) | 12 (5.7%) |
| $50,000 to $99,999 | 77 (25.2%) | 89 (42.6%) |
| $100,000 to $299,999 | 179 (58.5%) | 106 (50.7%) |
| $300,000 to $499,999 | 4 (1.3%) | 2 (1.0%) |
| $500,000 to $749,999 | 0 (0.0%) | 0 (0.0%) |
| $750,000 to $999,999 | 21 (6.9%) | 0 (0.0%) |
| $1,000,000 or more | 0 (0.0%) | 0 (0.0%) |
| Total | 306 (100.0%) | 209 (100.0%) |
Household Income by Mortgage Status in Seadrift
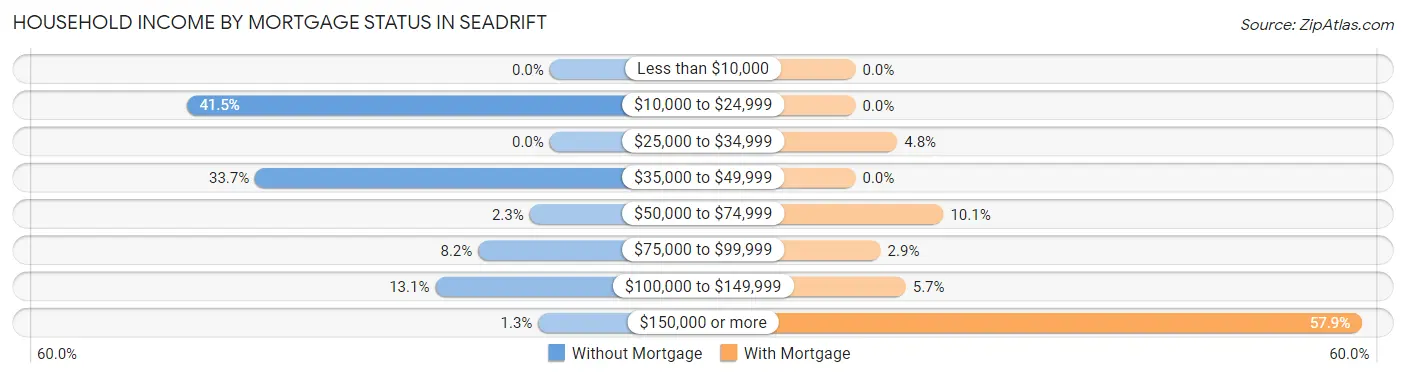
| Household Income | Without Mortgage | With Mortgage |
| Less than $10,000 | 0 (0.0%) | 0 (0.0%) |
| $10,000 to $24,999 | 127 (41.5%) | 0 (0.0%) |
| $25,000 to $34,999 | 0 (0.0%) | 10 (4.8%) |
| $35,000 to $49,999 | 103 (33.7%) | 0 (0.0%) |
| $50,000 to $74,999 | 7 (2.3%) | 21 (10.1%) |
| $75,000 to $99,999 | 25 (8.2%) | 6 (2.9%) |
| $100,000 to $149,999 | 40 (13.1%) | 12 (5.7%) |
| $150,000 or more | 4 (1.3%) | 121 (57.9%) |
| Total | 306 (100.0%) | 209 (100.0%) |
Property Value to Household Income Ratio in Seadrift
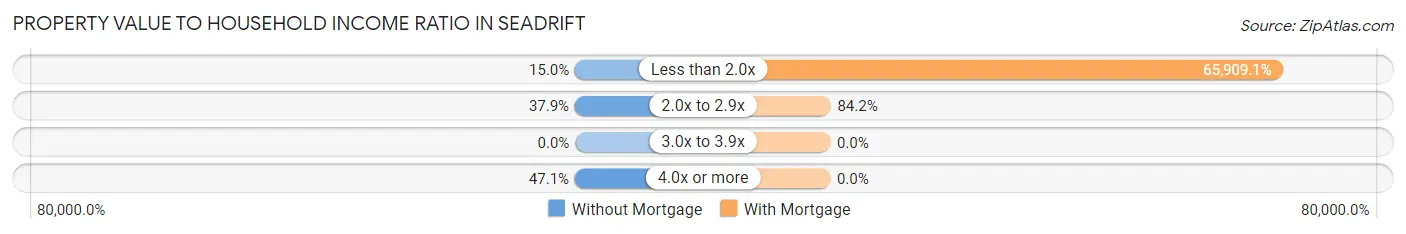
| Value-to-Income Ratio | Without Mortgage | With Mortgage |
| Less than 2.0x | 46 (15.0%) | 137,750 (65,909.1%) |
| 2.0x to 2.9x | 116 (37.9%) | 176 (84.2%) |
| 3.0x to 3.9x | 0 (0.0%) | 0 (0.0%) |
| 4.0x or more | 144 (47.1%) | 0 (0.0%) |
| Total | 306 (100.0%) | 209 (100.0%) |
Real Estate Taxes by Mortgage Status in Seadrift
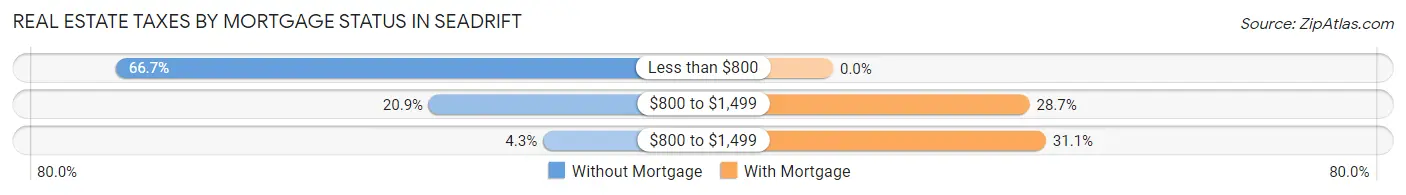
| Property Taxes | Without Mortgage | With Mortgage |
| Less than $800 | 204 (66.7%) | 0 (0.0%) |
| $800 to $1,499 | 64 (20.9%) | 60 (28.7%) |
| $800 to $1,499 | 13 (4.3%) | 65 (31.1%) |
| Total | 306 (100.0%) | 209 (100.0%) |
Health & Disability in Seadrift
Health Insurance Coverage by Age in Seadrift
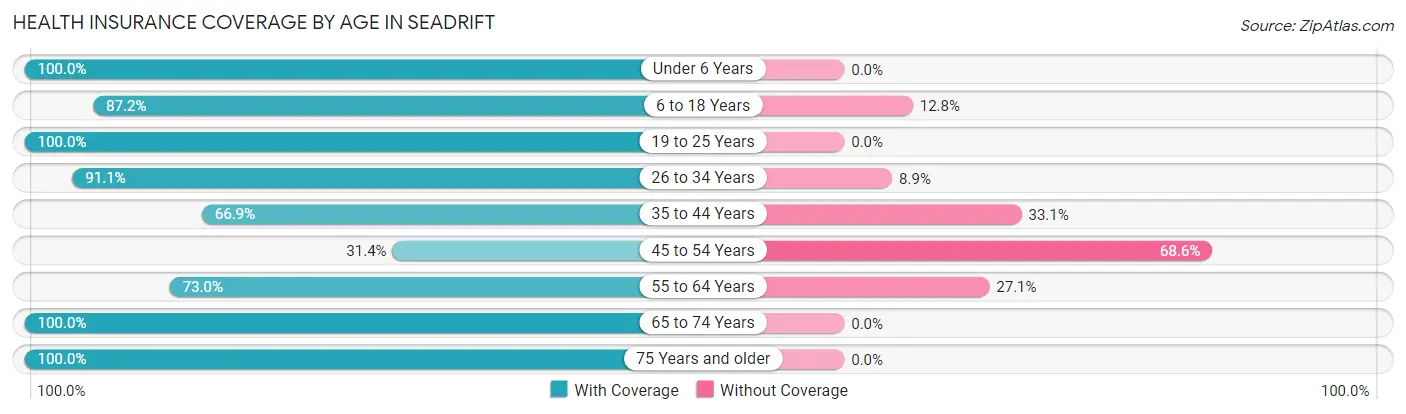
| Age Bracket | With Coverage | Without Coverage |
| Under 6 Years | 179 (100.0%) | 0 (0.0%) |
| 6 to 18 Years | 232 (87.2%) | 34 (12.8%) |
| 19 to 25 Years | 176 (100.0%) | 0 (0.0%) |
| 26 to 34 Years | 143 (91.1%) | 14 (8.9%) |
| 35 to 44 Years | 166 (66.9%) | 82 (33.1%) |
| 45 to 54 Years | 60 (31.4%) | 131 (68.6%) |
| 55 to 64 Years | 89 (73.0%) | 33 (27.1%) |
| 65 to 74 Years | 58 (100.0%) | 0 (0.0%) |
| 75 Years and older | 180 (100.0%) | 0 (0.0%) |
| Total | 1,283 (81.4%) | 294 (18.6%) |
Health Insurance Coverage by Citizenship Status in Seadrift
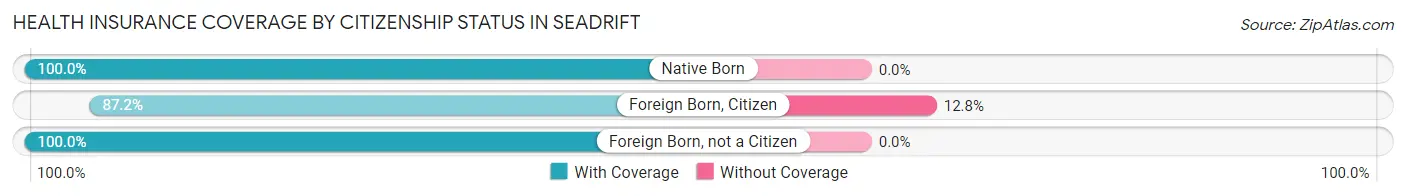
| Citizenship Status | With Coverage | Without Coverage |
| Native Born | 179 (100.0%) | 0 (0.0%) |
| Foreign Born, Citizen | 232 (87.2%) | 34 (12.8%) |
| Foreign Born, not a Citizen | 176 (100.0%) | 0 (0.0%) |
Health Insurance Coverage by Household Income in Seadrift
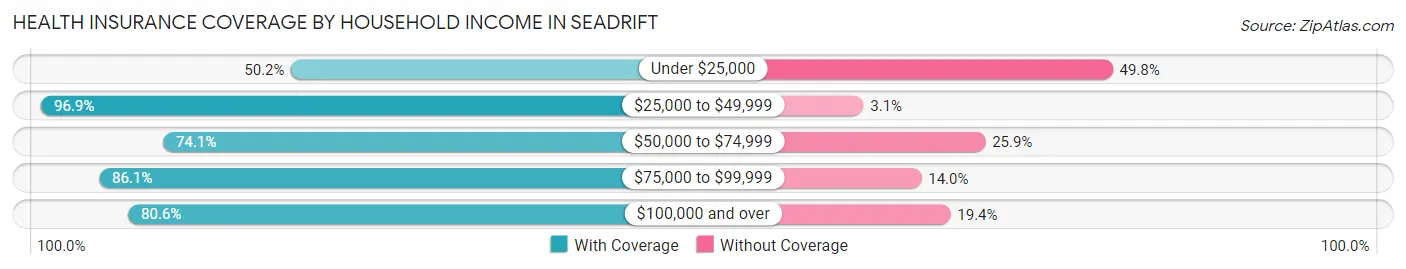
| Household Income | With Coverage | Without Coverage |
| Under $25,000 | 122 (50.2%) | 121 (49.8%) |
| $25,000 to $49,999 | 437 (96.9%) | 14 (3.1%) |
| $50,000 to $74,999 | 20 (74.1%) | 7 (25.9%) |
| $75,000 to $99,999 | 222 (86.1%) | 36 (14.0%) |
| $100,000 and over | 482 (80.6%) | 116 (19.4%) |
Public vs Private Health Insurance Coverage by Age in Seadrift
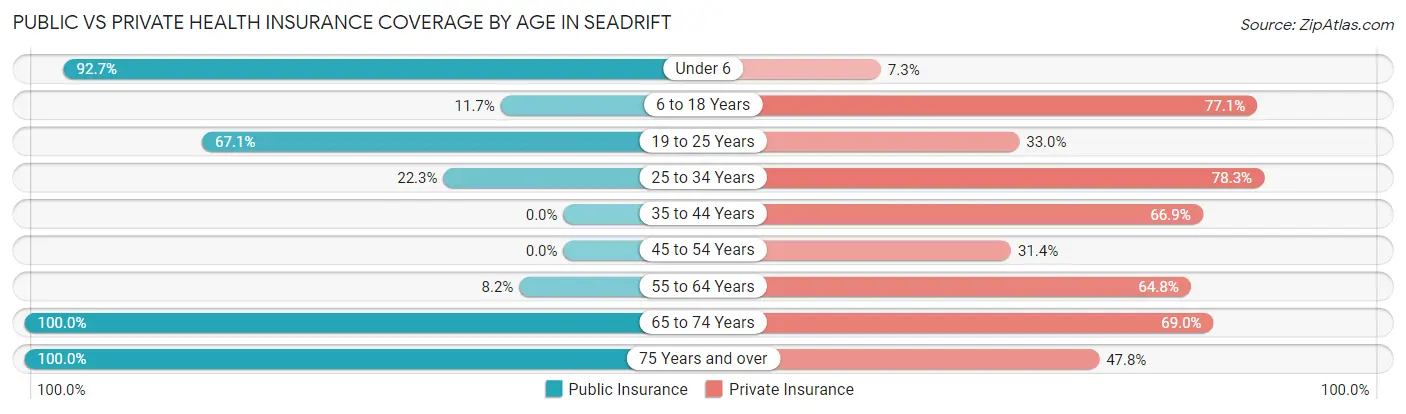
| Age Bracket | Public Insurance | Private Insurance |
| Under 6 | 166 (92.7%) | 13 (7.3%) |
| 6 to 18 Years | 31 (11.7%) | 205 (77.1%) |
| 19 to 25 Years | 118 (67.0%) | 58 (33.0%) |
| 25 to 34 Years | 35 (22.3%) | 123 (78.3%) |
| 35 to 44 Years | 0 (0.0%) | 166 (66.9%) |
| 45 to 54 Years | 0 (0.0%) | 60 (31.4%) |
| 55 to 64 Years | 10 (8.2%) | 79 (64.7%) |
| 65 to 74 Years | 58 (100.0%) | 40 (69.0%) |
| 75 Years and over | 180 (100.0%) | 86 (47.8%) |
| Total | 598 (37.9%) | 830 (52.6%) |
Disability Status by Sex by Age in Seadrift
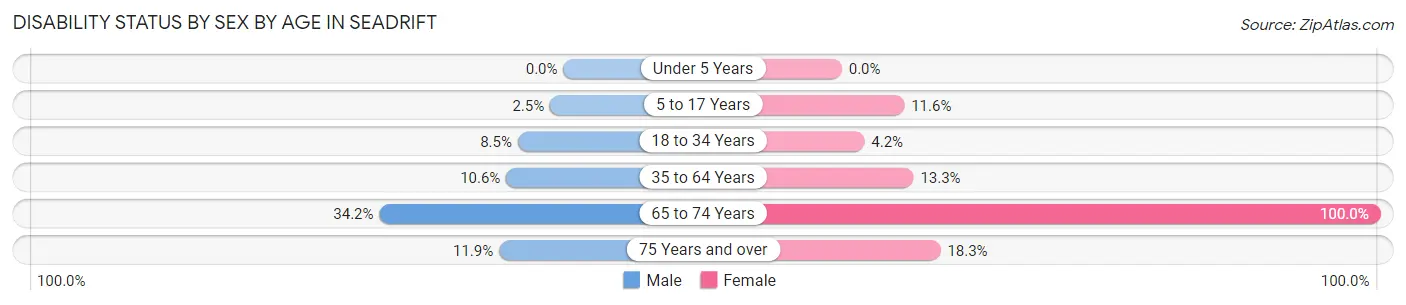
| Age Bracket | Male | Female |
| Under 5 Years | 0 (0.0%) | 0 (0.0%) |
| 5 to 17 Years | 4 (2.5%) | 16 (11.6%) |
| 18 to 34 Years | 12 (8.5%) | 8 (4.2%) |
| 35 to 64 Years | 38 (10.6%) | 27 (13.3%) |
| 65 to 74 Years | 14 (34.2%) | 17 (100.0%) |
| 75 Years and over | 13 (11.9%) | 13 (18.3%) |
Disability Class by Sex by Age in Seadrift
Disability Class: Hearing Difficulty
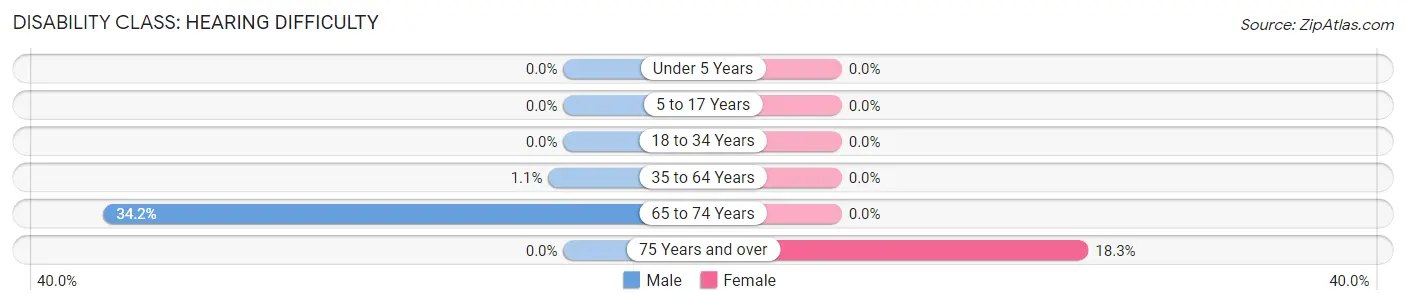
| Age Bracket | Male | Female |
| Under 5 Years | 0 (0.0%) | 0 (0.0%) |
| 5 to 17 Years | 0 (0.0%) | 0 (0.0%) |
| 18 to 34 Years | 0 (0.0%) | 0 (0.0%) |
| 35 to 64 Years | 4 (1.1%) | 0 (0.0%) |
| 65 to 74 Years | 14 (34.2%) | 0 (0.0%) |
| 75 Years and over | 0 (0.0%) | 13 (18.3%) |
Disability Class: Vision Difficulty
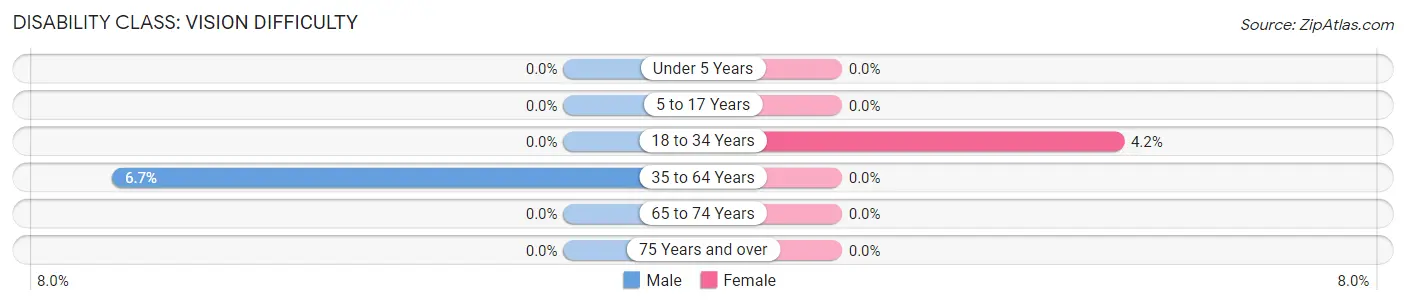
| Age Bracket | Male | Female |
| Under 5 Years | 0 (0.0%) | 0 (0.0%) |
| 5 to 17 Years | 0 (0.0%) | 0 (0.0%) |
| 18 to 34 Years | 0 (0.0%) | 8 (4.2%) |
| 35 to 64 Years | 24 (6.7%) | 0 (0.0%) |
| 65 to 74 Years | 0 (0.0%) | 0 (0.0%) |
| 75 Years and over | 0 (0.0%) | 0 (0.0%) |
Disability Class: Cognitive Difficulty
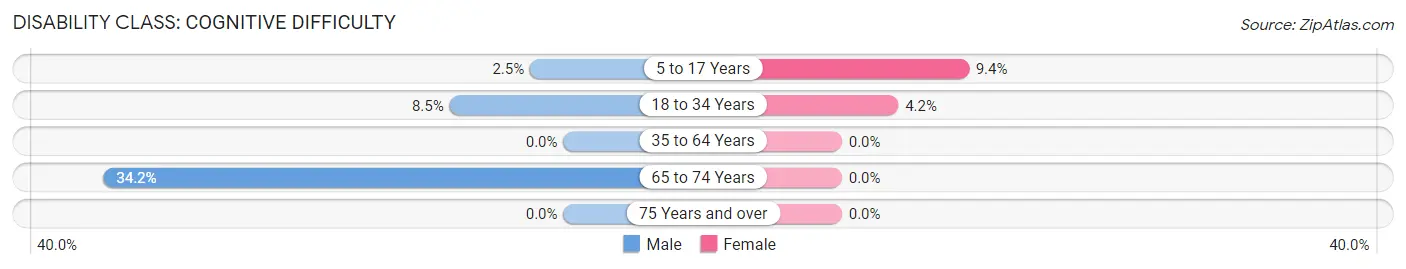
| Age Bracket | Male | Female |
| 5 to 17 Years | 4 (2.5%) | 13 (9.4%) |
| 18 to 34 Years | 12 (8.5%) | 8 (4.2%) |
| 35 to 64 Years | 0 (0.0%) | 0 (0.0%) |
| 65 to 74 Years | 14 (34.2%) | 0 (0.0%) |
| 75 Years and over | 0 (0.0%) | 0 (0.0%) |
Disability Class: Ambulatory Difficulty
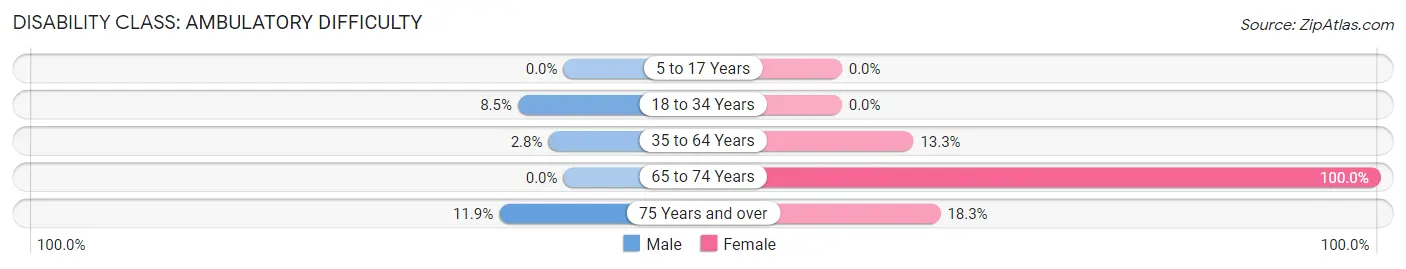
| Age Bracket | Male | Female |
| 5 to 17 Years | 0 (0.0%) | 0 (0.0%) |
| 18 to 34 Years | 12 (8.5%) | 0 (0.0%) |
| 35 to 64 Years | 10 (2.8%) | 27 (13.3%) |
| 65 to 74 Years | 0 (0.0%) | 17 (100.0%) |
| 75 Years and over | 13 (11.9%) | 13 (18.3%) |
Disability Class: Self-Care Difficulty
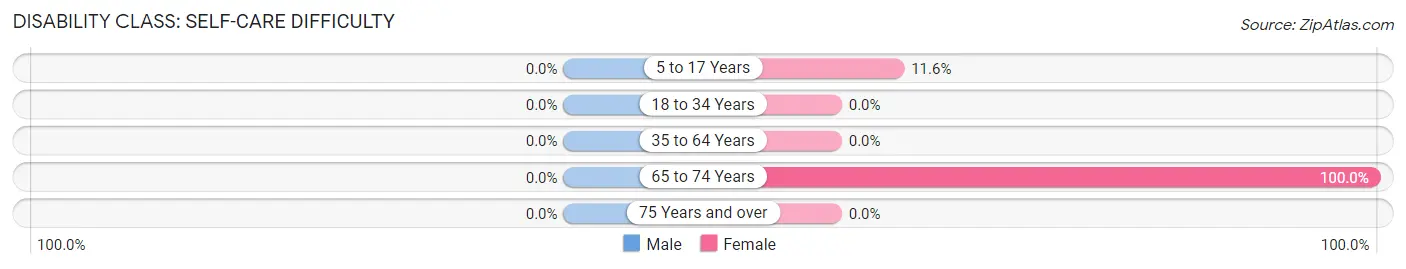
| Age Bracket | Male | Female |
| 5 to 17 Years | 0 (0.0%) | 16 (11.6%) |
| 18 to 34 Years | 0 (0.0%) | 0 (0.0%) |
| 35 to 64 Years | 0 (0.0%) | 0 (0.0%) |
| 65 to 74 Years | 0 (0.0%) | 17 (100.0%) |
| 75 Years and over | 0 (0.0%) | 0 (0.0%) |
Technology Access in Seadrift
Computing Device Access in Seadrift
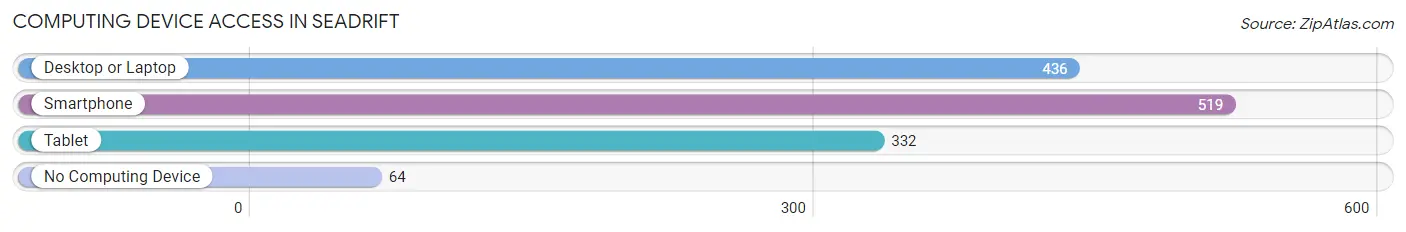
| Device Type | # Households | % Households |
| Desktop or Laptop | 436 | 65.6% |
| Smartphone | 519 | 78.0% |
| Tablet | 332 | 49.9% |
| No Computing Device | 64 | 9.6% |
| Total | 665 | 100.0% |
Internet Access in Seadrift
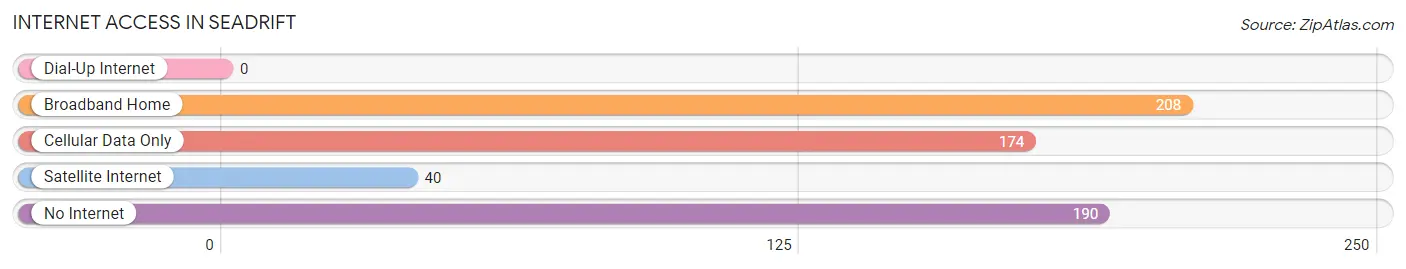
| Internet Type | # Households | % Households |
| Dial-Up Internet | 0 | 0.0% |
| Broadband Home | 208 | 31.3% |
| Cellular Data Only | 174 | 26.2% |
| Satellite Internet | 40 | 6.0% |
| No Internet | 190 | 28.6% |
| Total | 665 | 100.0% |
Seadrift Summary
Seadrift, Texas is a small town located in Calhoun County, Texas, United States. It is situated on the western shore of San Antonio Bay, approximately halfway between Port O'Connor and Port Lavaca. The population of Seadrift was 1,717 at the 2010 census.
History
Seadrift was founded in the late 19th century by a group of fishermen from the nearby town of Port Lavaca. The fishermen were attracted to the area by the abundance of fish in the bay and the easy access to the Gulf of Mexico. The town was originally called "Fisherman's Point" and was later renamed Seadrift.
The town was incorporated in 1909 and has since grown to become a popular tourist destination. The town is known for its fishing, crabbing, and shrimping industries, as well as its beautiful beaches.
Geography
Seadrift is located at 28°41'25"N 96°45'45"W (28.690278, -96.762500). It is situated on the western shore of San Antonio Bay, approximately halfway between Port O'Connor and Port Lavaca. The town is bordered by the Gulf of Mexico to the south and the San Antonio Bay to the north.
The town has a total area of 2.2 square miles, all of which is land. The terrain is mostly flat and the soil is sandy.
Economy
Seadrift's economy is largely based on fishing, crabbing, and shrimping. The town is home to several seafood processing plants, as well as a number of restaurants and seafood markets. Tourism is also an important part of the local economy, with many visitors coming to the area to enjoy the beaches and fishing opportunities.
Demographics
As of the 2010 census, there were 1,717 people, 690 households, and 463 families residing in Seadrift. The population density was 776.4 people per square mile. The racial makeup of the town was 81.2% White, 0.5% African American, 0.6% Native American, 0.2% Asian, 0.1% Pacific Islander, 15.2% from other races, and 2.3% from two or more races. Hispanic or Latino of any race were 33.2% of the population.
The median income for a household in Seadrift was $31,250, and the median income for a family was $37,500. Males had a median income of $30,000 versus $20,000 for females. The per capita income for the town was $15,845. About 17.2% of families and 20.2% of the population were below the poverty line, including 28.2% of those under age 18 and 10.2% of those age 65 or over.
Conclusion
Seadrift, Texas is a small town located in Calhoun County, Texas, United States. It is situated on the western shore of San Antonio Bay, approximately halfway between Port O'Connor and Port Lavaca. The population of Seadrift was 1,717 at the 2010 census. The town is known for its fishing, crabbing, and shrimping industries, as well as its beautiful beaches. The economy of Seadrift is largely based on fishing, crabbing, and shrimping, as well as tourism. The racial makeup of the town was 81.2% White, 0.5% African American, 0.6% Native American, 0.2% Asian, 0.1% Pacific Islander, 15.2% from other races, and 2.3% from two or more races. The median income for a household in Seadrift was $31,250, and the median income for a family was $37,500. About 17.2% of families and 20.2% of the population were below the poverty line.
Common Questions
What is Per Capita Income in Seadrift?
Per Capita income in Seadrift is $34,082.
What is the Median Family Income in Seadrift?
Median Family Income in Seadrift is $95,931.
What is the Median Household income in Seadrift?
Median Household Income in Seadrift is $46,701.
What is Income or Wage Gap in Seadrift?
Income or Wage Gap in Seadrift is 62.9%.
Women in Seadrift earn 37.1 cents for every dollar earned by a man.
What is Inequality or Gini Index in Seadrift?
Inequality or Gini Index in Seadrift is 0.42.
What is the Total Population of Seadrift?
Total Population of Seadrift is 1,577.
What is the Total Male Population of Seadrift?
Total Male Population of Seadrift is 889.
What is the Total Female Population of Seadrift?
Total Female Population of Seadrift is 688.
What is the Ratio of Males per 100 Females in Seadrift?
There are 129.22 Males per 100 Females in Seadrift.
What is the Ratio of Females per 100 Males in Seadrift?
There are 77.39 Females per 100 Males in Seadrift.
What is the Median Population Age in Seadrift?
Median Population Age in Seadrift is 36.3 Years.
What is the Average Family Size in Seadrift
Average Family Size in Seadrift is 3.1 People.
What is the Average Household Size in Seadrift
Average Household Size in Seadrift is 2.4 People.
How Large is the Labor Force in Seadrift?
There are 693 People in the Labor Forcein in Seadrift.
What is the Percentage of People in the Labor Force in Seadrift?
60.3% of People are in the Labor Force in Seadrift.
What is the Unemployment Rate in Seadrift?
Unemployment Rate in Seadrift is 1.7%.