Santa Maria, TX Map & Demographics
Santa Maria Map
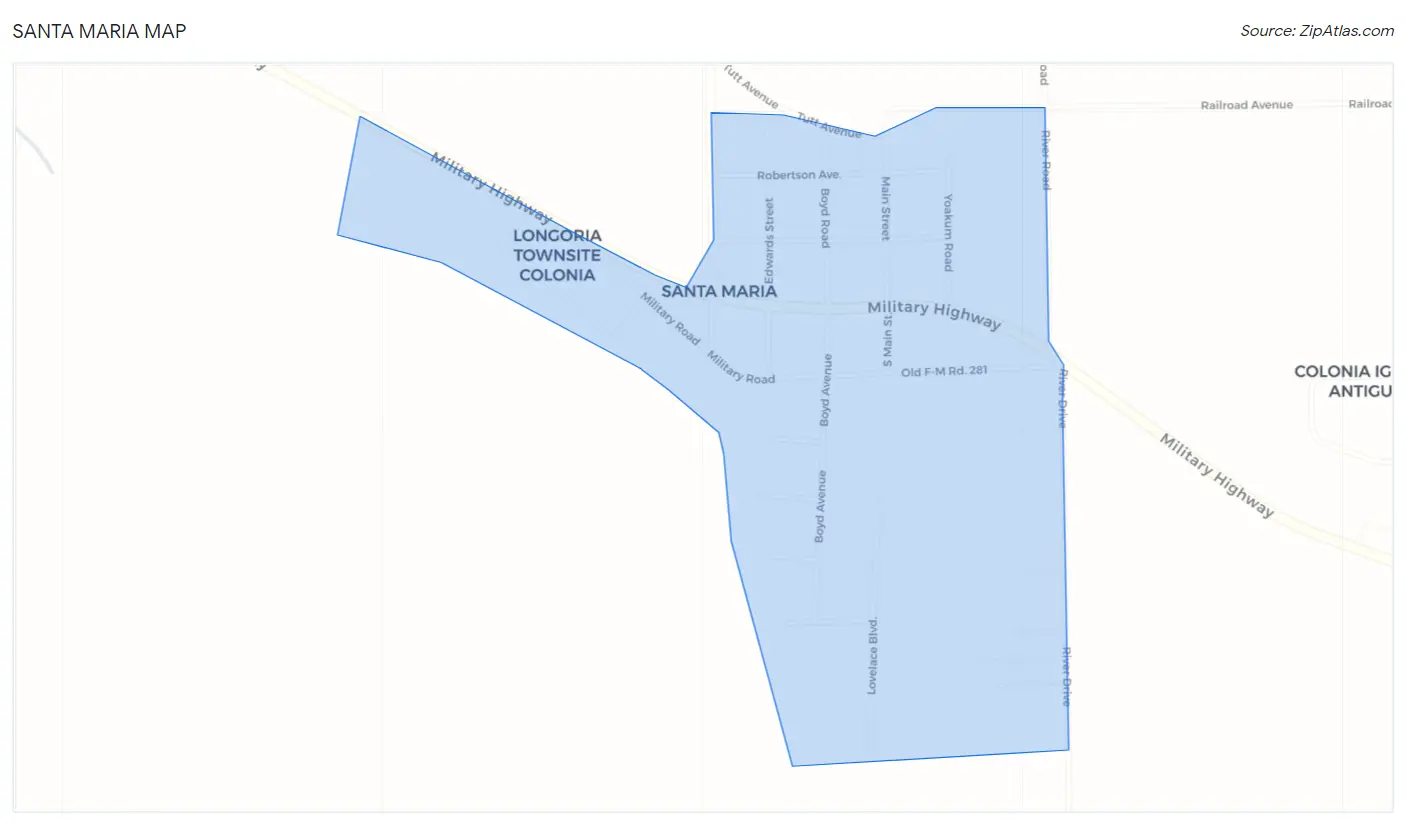
Santa Maria Overview
$14,120
PER CAPITA INCOME
$30,156
AVG HOUSEHOLD INCOME
35.6%
WAGE / INCOME GAP [ % ]
64.4¢/ $1
WAGE / INCOME GAP [ $ ]
0.44
INEQUALITY / GINI INDEX
587
TOTAL POPULATION
301
MALE POPULATION
286
FEMALE POPULATION
105.24
MALES / 100 FEMALES
95.02
FEMALES / 100 MALES
48.3
MEDIAN AGE
4.0
AVG FAMILY SIZE
3.5
AVG HOUSEHOLD SIZE
196
LABOR FORCE [ PEOPLE ]
37.9%
PERCENT IN LABOR FORCE
Santa Maria Zip Codes
Santa Maria Area Codes
Income in Santa Maria
Income Overview in Santa Maria
| Characteristic | Number | Measure |
| Per Capita Income | 587 | $14,120 |
| Median Family Income | 140 | $0 |
| Mean Family Income | 140 | $46,094 |
| Median Household Income | 166 | $30,156 |
| Mean Household Income | 166 | $42,367 |
| Income Deficit | 140 | $0 |
| Wage / Income Gap (%) | 587 | 35.58% |
| Wage / Income Gap ($) | 587 | 64.42¢ per $1 |
| Gini / Inequality Index | 587 | 0.44 |
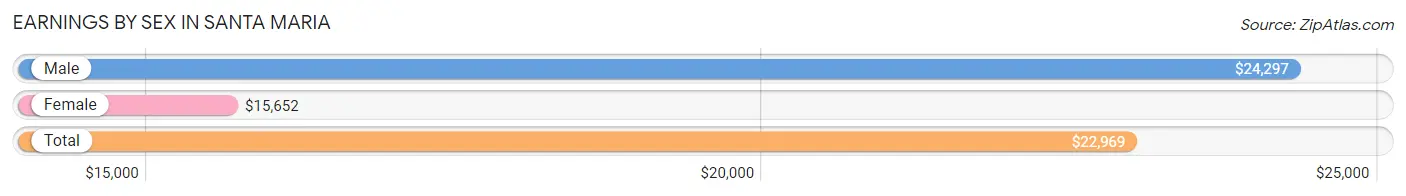
Earnings by Sex in Santa Maria
Average Earnings in Santa Maria are $22,969, $24,297 for men and $15,652 for women, a difference of 35.6%.
| Sex | Number | Average Earnings |
| Male | 166 (63.8%) | $24,297 |
| Female | 94 (36.1%) | $15,652 |
| Total | 260 (100.0%) | $22,969 |
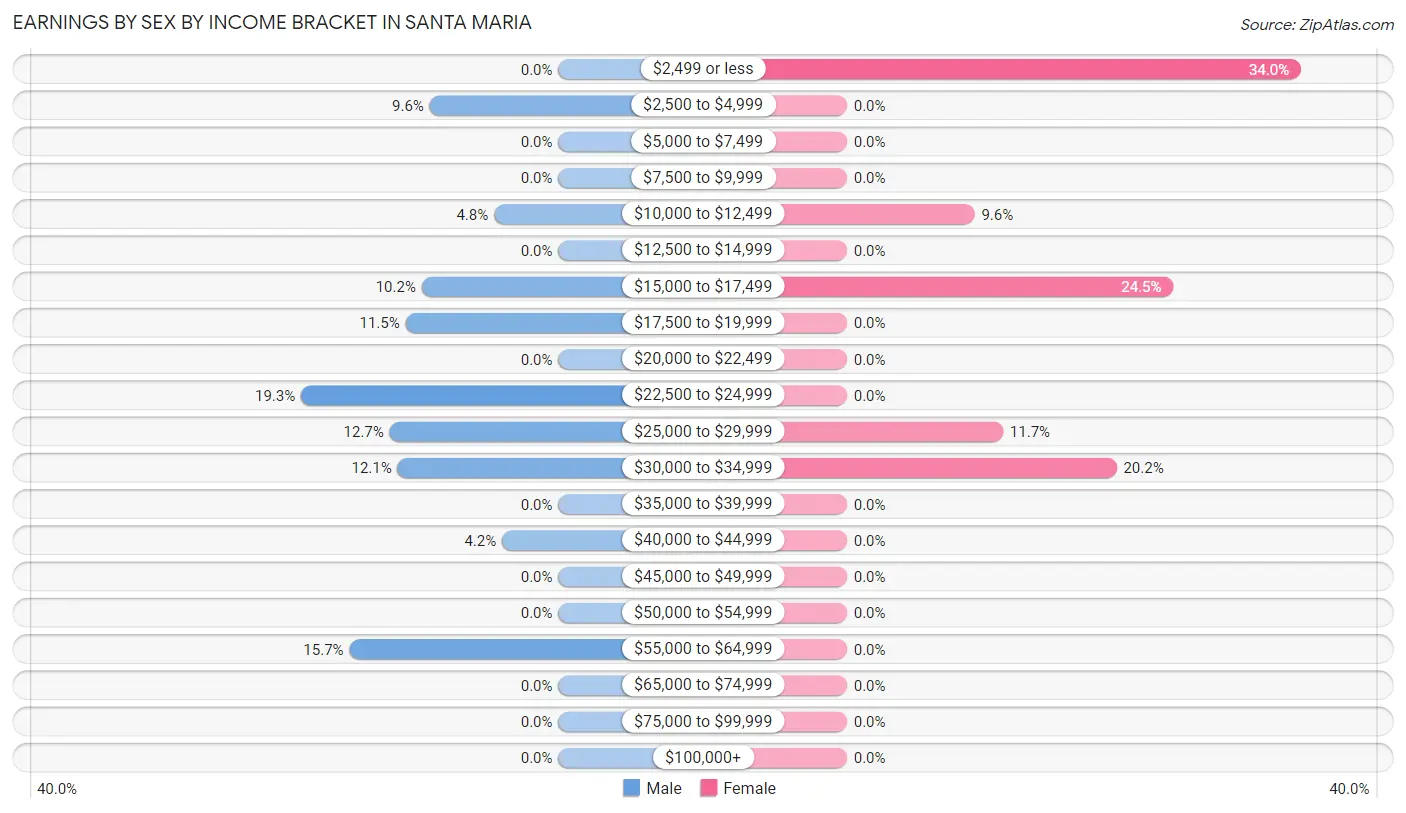
Earnings by Sex by Income Bracket in Santa Maria
The most common earnings brackets in Santa Maria are $22,500 to $24,999 for men (32 | 19.3%) and $2,499 or less for women (32 | 34.0%).
| Income | Male | Female |
| $2,499 or less | 0 (0.0%) | 32 (34.0%) |
| $2,500 to $4,999 | 16 (9.6%) | 0 (0.0%) |
| $5,000 to $7,499 | 0 (0.0%) | 0 (0.0%) |
| $7,500 to $9,999 | 0 (0.0%) | 0 (0.0%) |
| $10,000 to $12,499 | 8 (4.8%) | 9 (9.6%) |
| $12,500 to $14,999 | 0 (0.0%) | 0 (0.0%) |
| $15,000 to $17,499 | 17 (10.2%) | 23 (24.5%) |
| $17,500 to $19,999 | 19 (11.5%) | 0 (0.0%) |
| $20,000 to $22,499 | 0 (0.0%) | 0 (0.0%) |
| $22,500 to $24,999 | 32 (19.3%) | 0 (0.0%) |
| $25,000 to $29,999 | 21 (12.7%) | 11 (11.7%) |
| $30,000 to $34,999 | 20 (12.0%) | 19 (20.2%) |
| $35,000 to $39,999 | 0 (0.0%) | 0 (0.0%) |
| $40,000 to $44,999 | 7 (4.2%) | 0 (0.0%) |
| $45,000 to $49,999 | 0 (0.0%) | 0 (0.0%) |
| $50,000 to $54,999 | 0 (0.0%) | 0 (0.0%) |
| $55,000 to $64,999 | 26 (15.7%) | 0 (0.0%) |
| $65,000 to $74,999 | 0 (0.0%) | 0 (0.0%) |
| $75,000 to $99,999 | 0 (0.0%) | 0 (0.0%) |
| $100,000+ | 0 (0.0%) | 0 (0.0%) |
| Total | 166 (100.0%) | 94 (100.0%) |
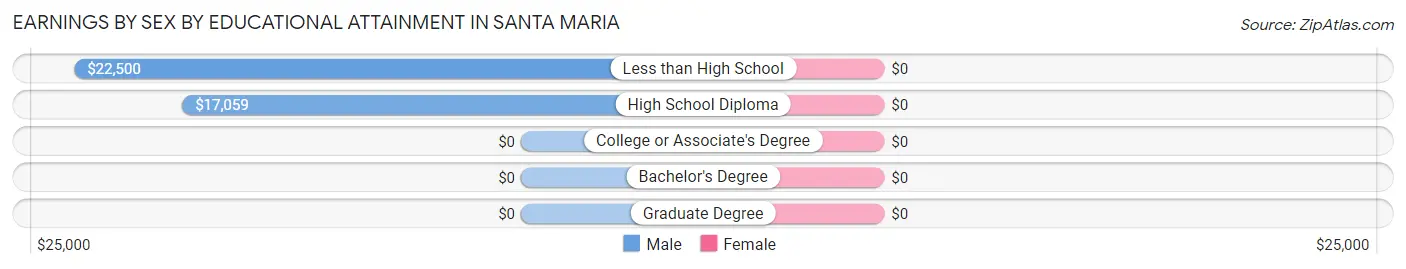
Earnings by Sex by Educational Attainment in Santa Maria
| Educational Attainment | Male Income | Female Income |
| Less than High School | $22,500 | $0 |
| High School Diploma | $17,059 | $0 |
| College or Associate's Degree | - | - |
| Bachelor's Degree | - | - |
| Graduate Degree | - | - |
| Total | $27,727 | $0 |
Family Income in Santa Maria
Family Income Brackets in Santa Maria
According to the Santa Maria family income data, there are 40 families falling into the $15,000 to $24,999 income range, which is the most common income bracket and makes up 28.6% of all families.
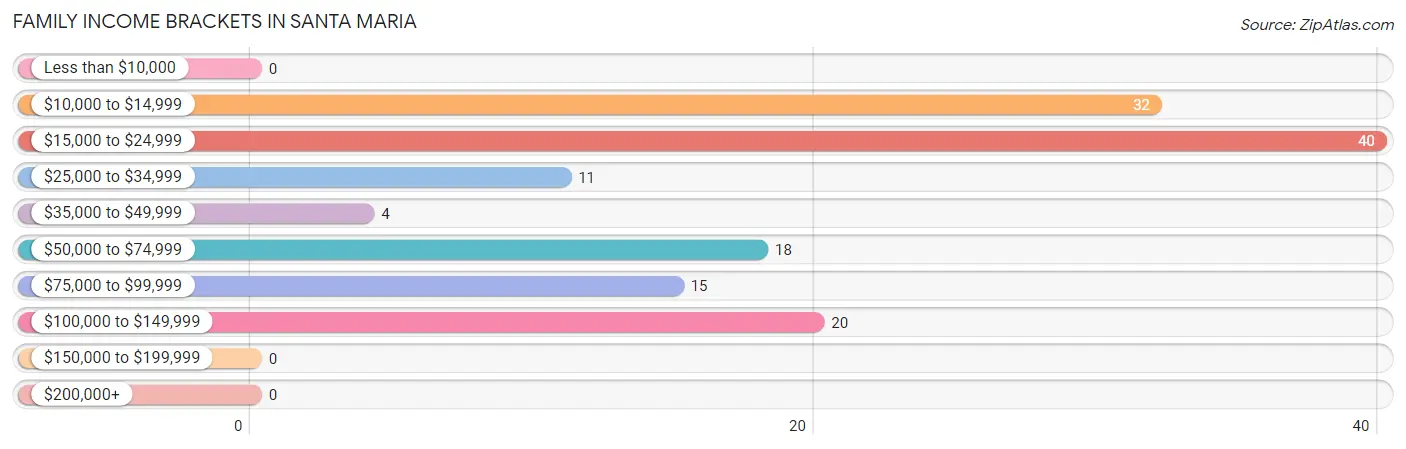
| Income Bracket | # Families | % Families |
| Less than $10,000 | 0 | 0.0% |
| $10,000 to $14,999 | 32 | 22.9% |
| $15,000 to $24,999 | 40 | 28.6% |
| $25,000 to $34,999 | 11 | 7.9% |
| $35,000 to $49,999 | 4 | 2.9% |
| $50,000 to $74,999 | 18 | 12.9% |
| $75,000 to $99,999 | 15 | 10.7% |
| $100,000 to $149,999 | 20 | 14.3% |
| $150,000 to $199,999 | 0 | 0.0% |
| $200,000+ | 0 | 0.0% |
Family Income by Famaliy Size in Santa Maria
4-person families (38 | 27.1%) account for the highest median family income in Santa Maria with $117,625 per family, while 4-person families (38 | 27.1%) have the highest median income of $29,406 per family member.
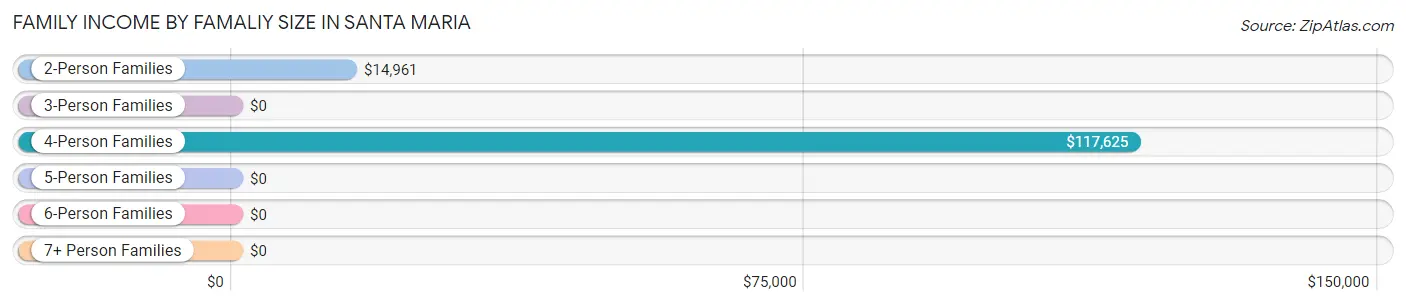
| Income Bracket | # Families | Median Income |
| 2-Person Families | 63 (45.0%) | $14,961 |
| 3-Person Families | 9 (6.4%) | $0 |
| 4-Person Families | 38 (27.1%) | $117,625 |
| 5-Person Families | 20 (14.3%) | $0 |
| 6-Person Families | 10 (7.1%) | $0 |
| 7+ Person Families | 0 (0.0%) | $0 |
| Total | 140 (100.0%) | $0 |
Family Income by Number of Earners in Santa Maria
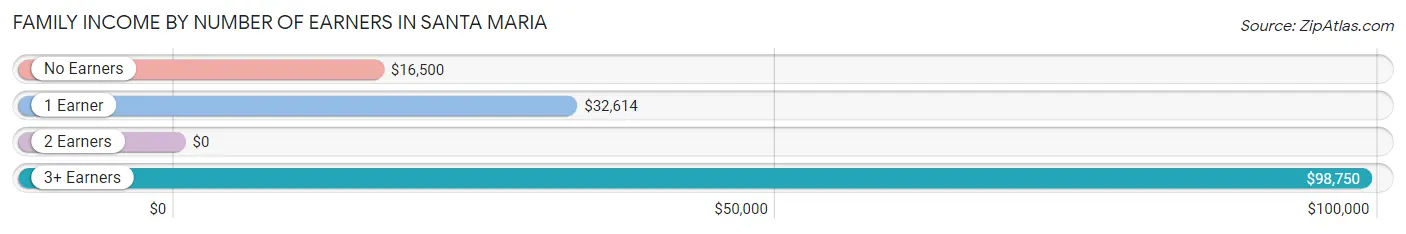
| Number of Earners | # Families | Median Income |
| No Earners | 50 (35.7%) | $16,500 |
| 1 Earner | 45 (32.1%) | $32,614 |
| 2 Earners | 0 (0.0%) | $0 |
| 3+ Earners | 45 (32.1%) | $98,750 |
| Total | 140 (100.0%) | $0 |
Household Income in Santa Maria
Household Income Brackets in Santa Maria
With 40 households falling in the category, the $15,000 to $24,999 income range is the most frequent in Santa Maria, accounting for 24.1% of all households.
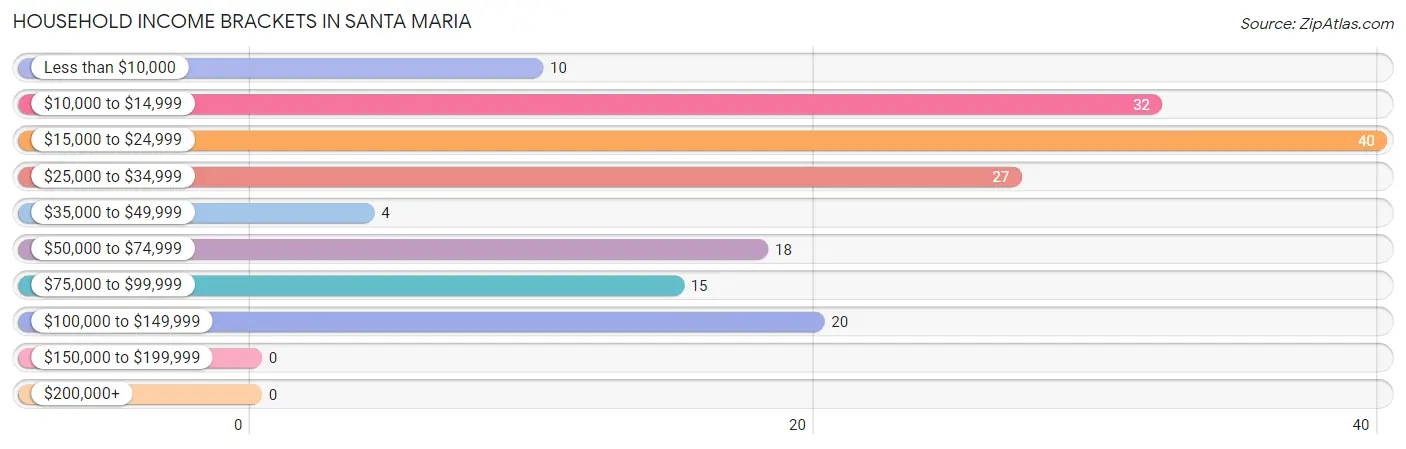
| Income Bracket | # Households | % Households |
| Less than $10,000 | 10 | 6.0% |
| $10,000 to $14,999 | 32 | 19.3% |
| $15,000 to $24,999 | 40 | 24.1% |
| $25,000 to $34,999 | 27 | 16.3% |
| $35,000 to $49,999 | 4 | 2.4% |
| $50,000 to $74,999 | 18 | 10.8% |
| $75,000 to $99,999 | 15 | 9.0% |
| $100,000 to $149,999 | 20 | 12.0% |
| $150,000 to $199,999 | 0 | 0.0% |
| $200,000+ | 0 | 0.0% |
Household Income by Householder Age in Santa Maria
The median household income in Santa Maria is $30,156, with the highest median household income of $18,690 found in the 65+ years age bracket for the primary householder. A total of 98 households (59.0%) fall into this category.
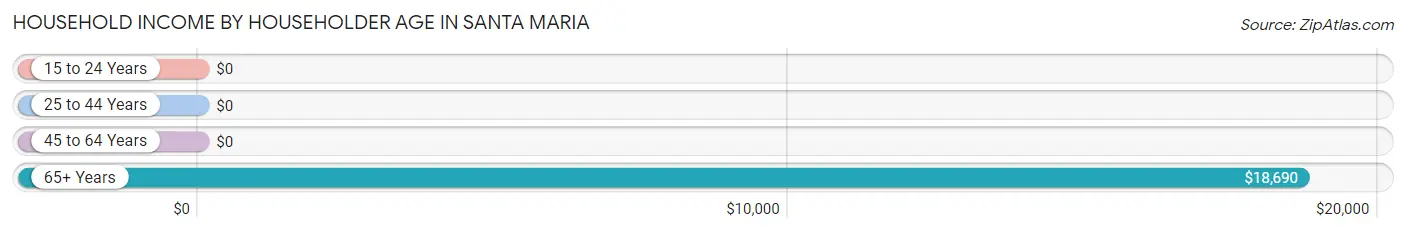
| Income Bracket | # Households | Median Income |
| 15 to 24 Years | 0 (0.0%) | $0 |
| 25 to 44 Years | 11 (6.6%) | $0 |
| 45 to 64 Years | 57 (34.3%) | $0 |
| 65+ Years | 98 (59.0%) | $18,690 |
| Total | 166 (100.0%) | $30,156 |
Poverty in Santa Maria
Income Below Poverty by Sex and Age in Santa Maria
With 25.9% poverty level for males and 44.8% for females among the residents of Santa Maria, 65 to 74 year old males and under 5 year old females are the most vulnerable to poverty, with 19 males (100.0%) and 21 females (100.0%) in their respective age groups living below the poverty level.
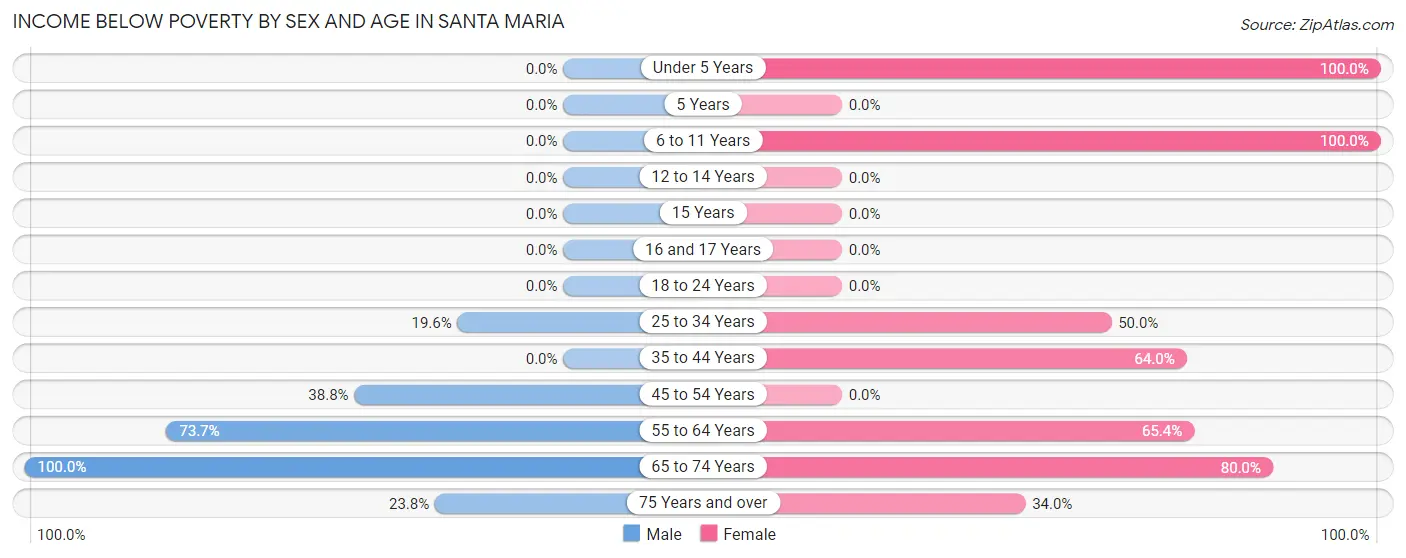
| Age Bracket | Male | Female |
| Under 5 Years | 0 (0.0%) | 21 (100.0%) |
| 5 Years | 0 (0.0%) | 0 (0.0%) |
| 6 to 11 Years | 0 (0.0%) | 15 (100.0%) |
| 12 to 14 Years | 0 (0.0%) | 0 (0.0%) |
| 15 Years | 0 (0.0%) | 0 (0.0%) |
| 16 and 17 Years | 0 (0.0%) | 0 (0.0%) |
| 18 to 24 Years | 0 (0.0%) | 0 (0.0%) |
| 25 to 34 Years | 11 (19.6%) | 11 (50.0%) |
| 35 to 44 Years | 0 (0.0%) | 16 (64.0%) |
| 45 to 54 Years | 19 (38.8%) | 0 (0.0%) |
| 55 to 64 Years | 14 (73.7%) | 17 (65.4%) |
| 65 to 74 Years | 19 (100.0%) | 32 (80.0%) |
| 75 Years and over | 15 (23.8%) | 16 (34.0%) |
| Total | 78 (25.9%) | 128 (44.8%) |
Income Above Poverty by Sex and Age in Santa Maria
According to the poverty statistics in Santa Maria, males aged under 5 years and females aged 16 and 17 years are the age groups that are most secure financially, with 100.0% of males and 100.0% of females in these age groups living above the poverty line.
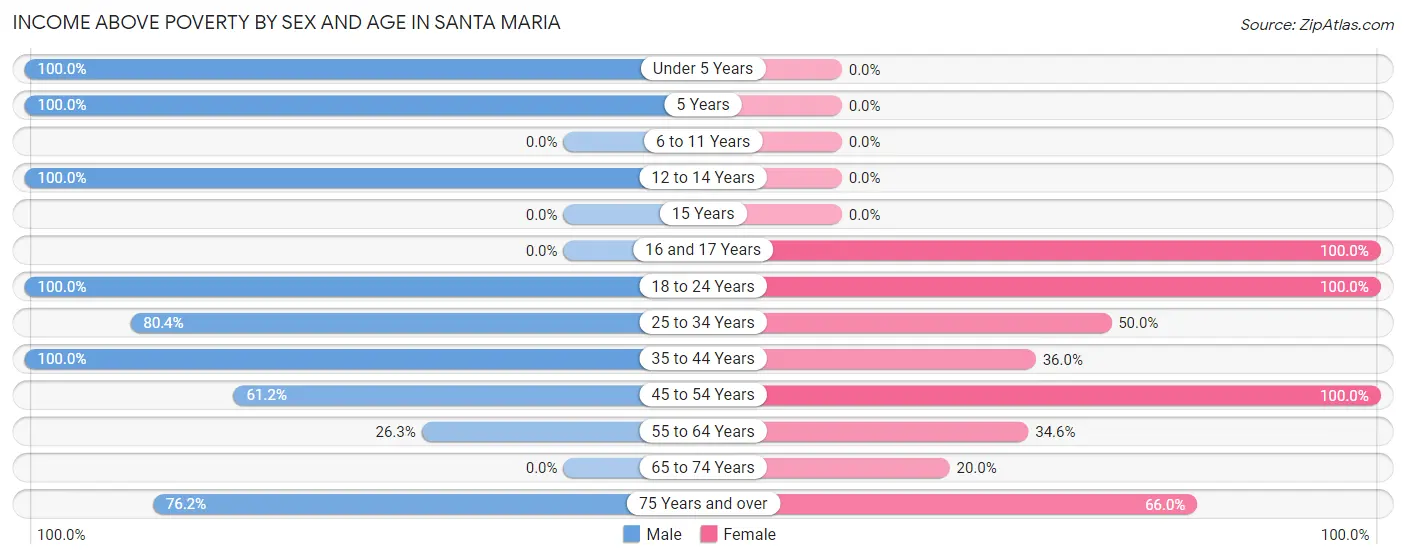
| Age Bracket | Male | Female |
| Under 5 Years | 13 (100.0%) | 0 (0.0%) |
| 5 Years | 10 (100.0%) | 0 (0.0%) |
| 6 to 11 Years | 0 (0.0%) | 0 (0.0%) |
| 12 to 14 Years | 11 (100.0%) | 0 (0.0%) |
| 15 Years | 0 (0.0%) | 0 (0.0%) |
| 16 and 17 Years | 0 (0.0%) | 19 (100.0%) |
| 18 to 24 Years | 50 (100.0%) | 38 (100.0%) |
| 25 to 34 Years | 45 (80.4%) | 11 (50.0%) |
| 35 to 44 Years | 11 (100.0%) | 9 (36.0%) |
| 45 to 54 Years | 30 (61.2%) | 33 (100.0%) |
| 55 to 64 Years | 5 (26.3%) | 9 (34.6%) |
| 65 to 74 Years | 0 (0.0%) | 8 (20.0%) |
| 75 Years and over | 48 (76.2%) | 31 (66.0%) |
| Total | 223 (74.1%) | 158 (55.2%) |
Income Below Poverty Among Married-Couple Families in Santa Maria
The poverty statistics for married-couple families in Santa Maria show that 37.2% or 38 of the total 102 families live below the poverty line. Families with no children have the highest poverty rate of 40.4%, comprising of 38 families. On the other hand, families with 1 or 2 children have the lowest poverty rate of 0.0%, which includes 0 families.
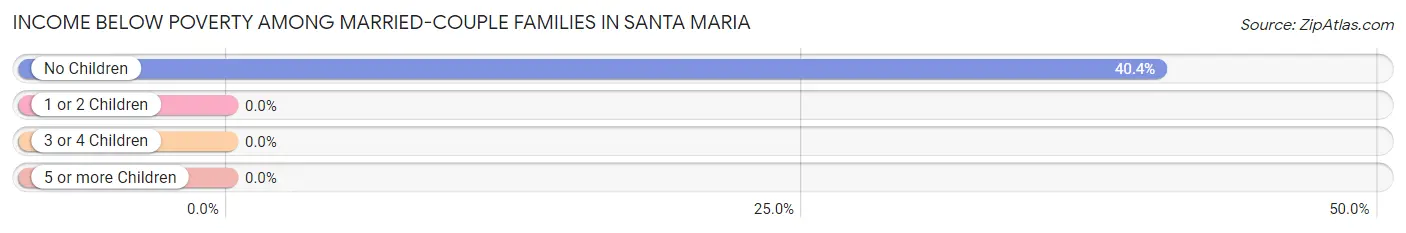
| Children | Above Poverty | Below Poverty |
| No Children | 56 (59.6%) | 38 (40.4%) |
| 1 or 2 Children | 8 (100.0%) | 0 (0.0%) |
| 3 or 4 Children | 0 (0.0%) | 0 (0.0%) |
| 5 or more Children | 0 (0.0%) | 0 (0.0%) |
| Total | 64 (62.7%) | 38 (37.2%) |
Income Below Poverty Among Single-Parent Households in Santa Maria
According to the poverty data in Santa Maria, 100.0% or 5 single-father households and 36.4% or 12 single-mother households are living below the poverty line. Among single-father households, those with no children have the highest poverty rate, with 5 households (100.0%) experiencing poverty. Likewise, among single-mother households, those with 1 or 2 children have the highest poverty rate, with 4 households (100.0%) falling below the poverty line.
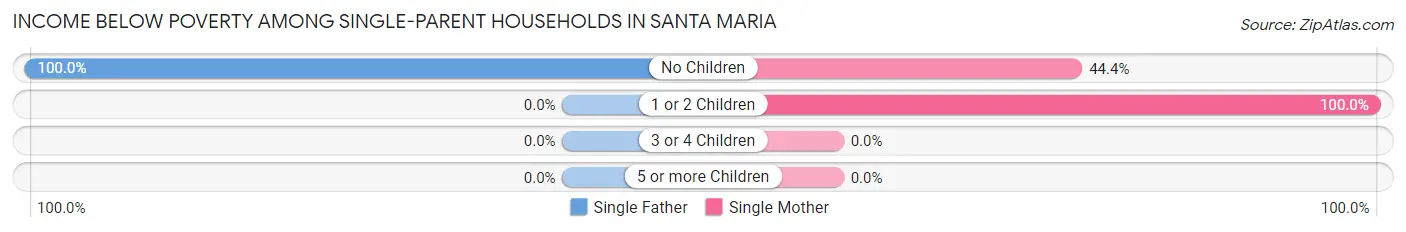
| Children | Single Father | Single Mother |
| No Children | 5 (100.0%) | 8 (44.4%) |
| 1 or 2 Children | 0 (0.0%) | 4 (100.0%) |
| 3 or 4 Children | 0 (0.0%) | 0 (0.0%) |
| 5 or more Children | 0 (0.0%) | 0 (0.0%) |
| Total | 5 (100.0%) | 12 (36.4%) |
Income Below Poverty Among Married-Couple vs Single-Parent Households in Santa Maria
The poverty data for Santa Maria shows that 38 of the married-couple family households (37.2%) and 17 of the single-parent households (44.7%) are living below the poverty level. Within the married-couple family households, those with no children have the highest poverty rate, with 38 households (40.4%) falling below the poverty line. Among the single-parent households, those with 1 or 2 children have the highest poverty rate, with 4 household (100.0%) living below poverty.
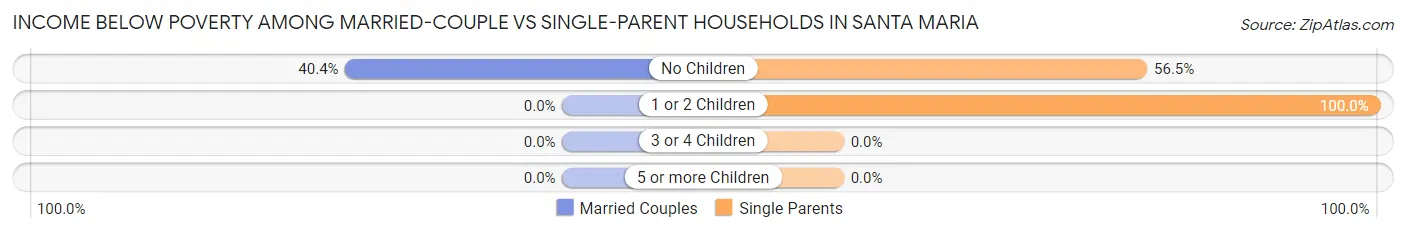
| Children | Married-Couple Families | Single-Parent Households |
| No Children | 38 (40.4%) | 13 (56.5%) |
| 1 or 2 Children | 0 (0.0%) | 4 (100.0%) |
| 3 or 4 Children | 0 (0.0%) | 0 (0.0%) |
| 5 or more Children | 0 (0.0%) | 0 (0.0%) |
| Total | 38 (37.2%) | 17 (44.7%) |
Race in Santa Maria
The most populous races in Santa Maria are Hispanic or Latino (587 | 100.0%), White / Caucasian (451 | 76.8%), and Two or more Races (136 | 23.2%).
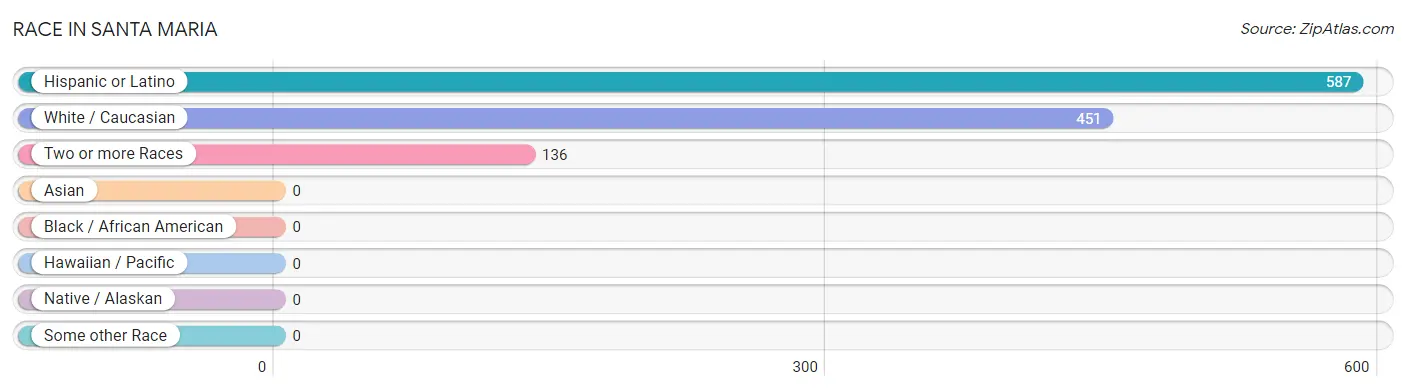
| Race | # Population | % Population |
| Asian | 0 | 0.0% |
| Black / African American | 0 | 0.0% |
| Hawaiian / Pacific | 0 | 0.0% |
| Hispanic or Latino | 587 | 100.0% |
| Native / Alaskan | 0 | 0.0% |
| White / Caucasian | 451 | 76.8% |
| Two or more Races | 136 | 23.2% |
| Some other Race | 0 | 0.0% |
| Total | 587 | 100.0% |
Ancestry in Santa Maria
The most populous ancestries reported in Santa Maria are , and Mexican (587 | 100.0%), together accounting for 100.0% of all Santa Maria residents.

| Ancestry | # Population | % Population |
| Mexican | 587 | 100.0% | View All 1 Rows |
Immigrants in Santa Maria
The most numerous immigrant groups reported in Santa Maria came from Central America (177 | 30.1%), Latin America (177 | 30.1%), and Mexico (177 | 30.1%), together accounting for 90.4% of all Santa Maria residents.
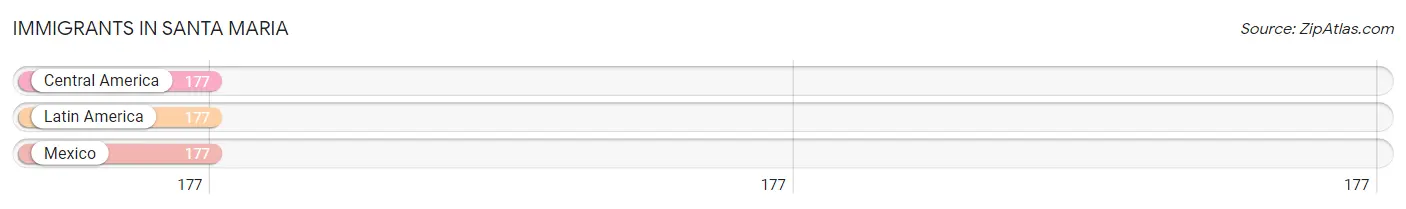
| Immigration Origin | # Population | % Population |
| Central America | 177 | 30.1% |
| Latin America | 177 | 30.1% |
| Mexico | 177 | 30.1% | View All 3 Rows |
Sex and Age in Santa Maria
Sex and Age in Santa Maria
The most populous age groups in Santa Maria are 75 to 79 Years (63 | 20.9%) for men and 15 to 19 Years (45 | 15.7%) for women.
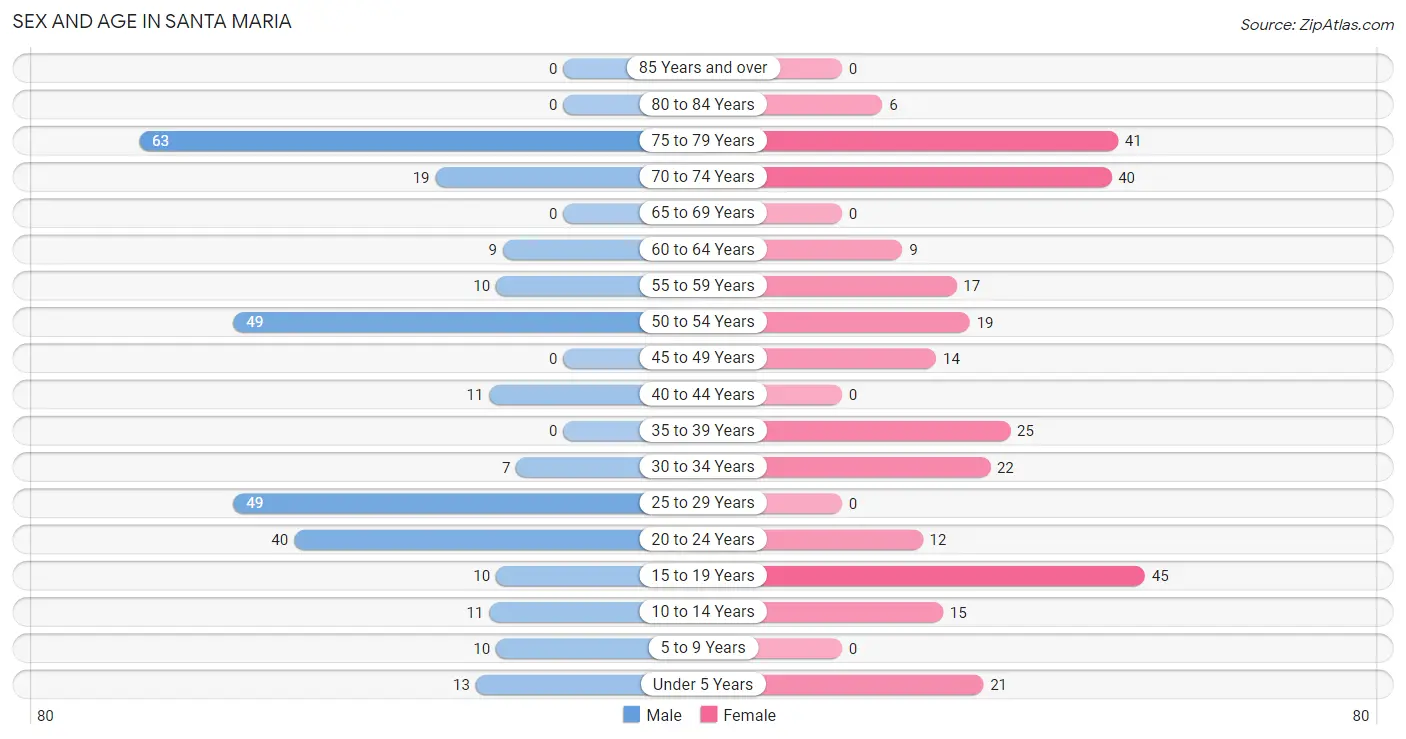
| Age Bracket | Male | Female |
| Under 5 Years | 13 (4.3%) | 21 (7.3%) |
| 5 to 9 Years | 10 (3.3%) | 0 (0.0%) |
| 10 to 14 Years | 11 (3.6%) | 15 (5.2%) |
| 15 to 19 Years | 10 (3.3%) | 45 (15.7%) |
| 20 to 24 Years | 40 (13.3%) | 12 (4.2%) |
| 25 to 29 Years | 49 (16.3%) | 0 (0.0%) |
| 30 to 34 Years | 7 (2.3%) | 22 (7.7%) |
| 35 to 39 Years | 0 (0.0%) | 25 (8.7%) |
| 40 to 44 Years | 11 (3.6%) | 0 (0.0%) |
| 45 to 49 Years | 0 (0.0%) | 14 (4.9%) |
| 50 to 54 Years | 49 (16.3%) | 19 (6.6%) |
| 55 to 59 Years | 10 (3.3%) | 17 (5.9%) |
| 60 to 64 Years | 9 (3.0%) | 9 (3.2%) |
| 65 to 69 Years | 0 (0.0%) | 0 (0.0%) |
| 70 to 74 Years | 19 (6.3%) | 40 (14.0%) |
| 75 to 79 Years | 63 (20.9%) | 41 (14.3%) |
| 80 to 84 Years | 0 (0.0%) | 6 (2.1%) |
| 85 Years and over | 0 (0.0%) | 0 (0.0%) |
| Total | 301 (100.0%) | 286 (100.0%) |
Families and Households in Santa Maria
Median Family Size in Santa Maria
The median family size in Santa Maria is 4.01 persons per family, with single female/mother families (33 | 23.6%) accounting for the largest median family size of 6.33 persons per family. On the other hand, single male/father families (5 | 3.6%) represent the smallest median family size with 2.20 persons per family.
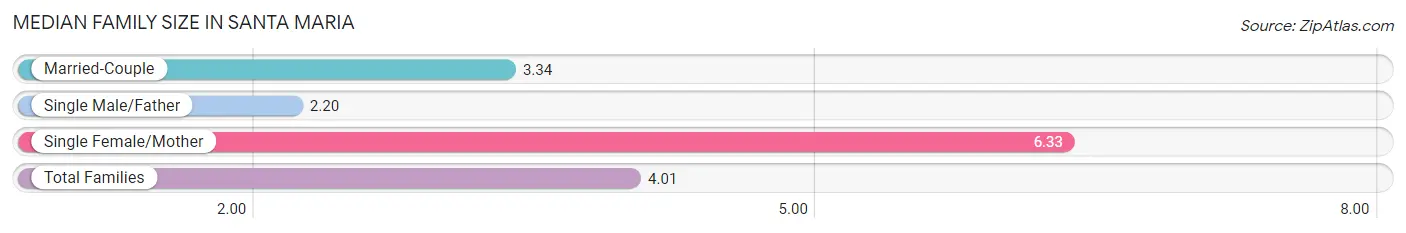
| Family Type | # Families | Family Size |
| Married-Couple | 102 (72.9%) | 3.34 |
| Single Male/Father | 5 (3.6%) | 2.20 |
| Single Female/Mother | 33 (23.6%) | 6.33 |
| Total Families | 140 (100.0%) | 4.01 |
Median Household Size in Santa Maria
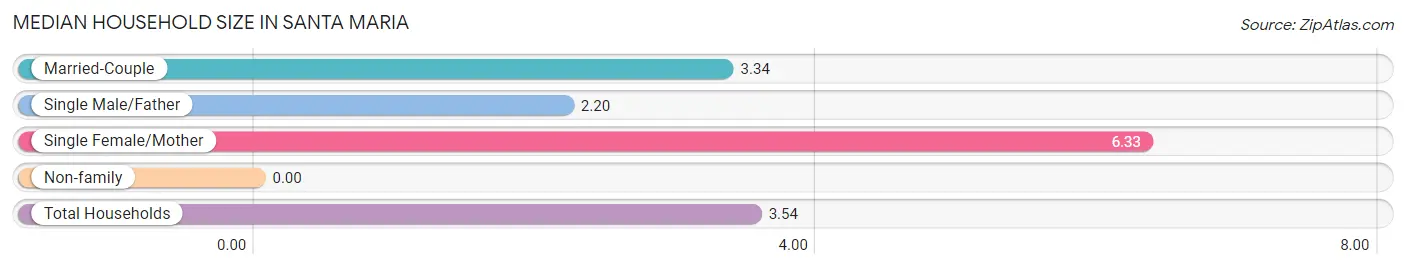
| Household Type | # Households | Household Size |
| Married-Couple | 102 (61.5%) | 3.34 |
| Single Male/Father | 5 (3.0%) | 2.20 |
| Single Female/Mother | 33 (19.9%) | 6.33 |
| Non-family | 26 (15.7%) | - |
| Total Households | 166 (100.0%) | 3.54 |
Household Size by Marriage Status in Santa Maria
Out of a total of 166 households in Santa Maria, 140 (84.3%) are family households, while 26 (15.7%) are nonfamily households. The most numerous type of family households are 2-person households, comprising 63, and the most common type of nonfamily households are 1-person households, comprising 26.
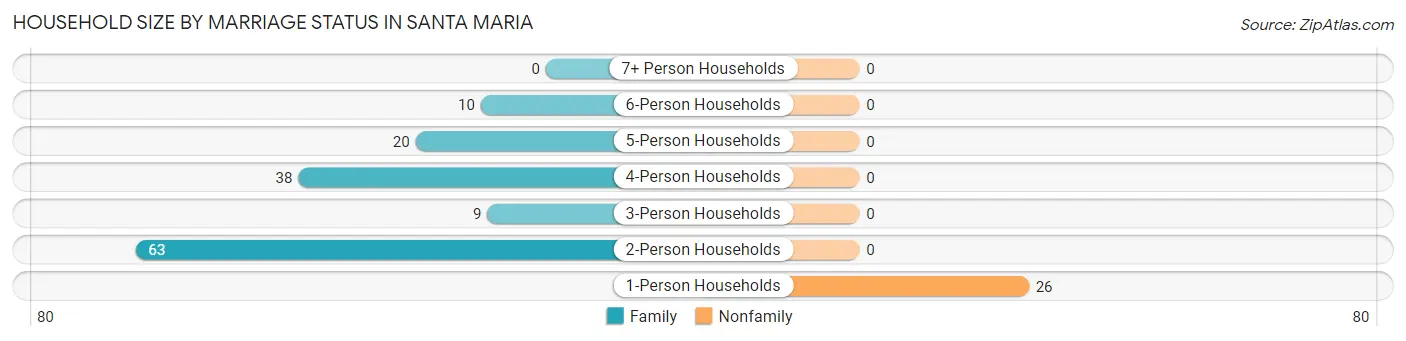
| Household Size | Family Households | Nonfamily Households |
| 1-Person Households | - | 26 (15.7%) |
| 2-Person Households | 63 (38.0%) | 0 (0.0%) |
| 3-Person Households | 9 (5.4%) | 0 (0.0%) |
| 4-Person Households | 38 (22.9%) | 0 (0.0%) |
| 5-Person Households | 20 (12.0%) | 0 (0.0%) |
| 6-Person Households | 10 (6.0%) | 0 (0.0%) |
| 7+ Person Households | 0 (0.0%) | 0 (0.0%) |
| Total | 140 (84.3%) | 26 (15.7%) |
Female Fertility in Santa Maria
Fertility by Age in Santa Maria
| Age Bracket | Women with Births | Births / 1,000 Women |
| 15 to 19 years | 0 (0.0%) | 0.0 |
| 20 to 34 years | 0 (0.0%) | 0.0 |
| 35 to 50 years | 0 (0.0%) | 0.0 |
| Total | 0 (0.0%) | 0.0 |
Fertility by Age by Marriage Status in Santa Maria
| Age Bracket | Married | Unmarried |
| 15 to 19 years | 0 (0.0%) | 0 (0.0%) |
| 20 to 34 years | 0 (0.0%) | 0 (0.0%) |
| 35 to 50 years | 0 (0.0%) | 0 (0.0%) |
| Total | 0 (0.0%) | 0 (0.0%) |
Fertility by Education in Santa Maria
| Educational Attainment | Women with Births | Births / 1,000 Women |
| Less than High School | 0 (0.0%) | 0.0 |
| High School Diploma | 0 (0.0%) | 0.0 |
| College or Associate's Degree | 0 (0.0%) | 0.0 |
| Bachelor's Degree | 0 (0.0%) | 0.0 |
| Graduate Degree | 0 (0.0%) | 0.0 |
| Total | 0 (0.0%) | 0.0 |
Fertility by Education by Marriage Status in Santa Maria
| Educational Attainment | Married | Unmarried |
| Less than High School | 0 (0.0%) | 0 (0.0%) |
| High School Diploma | 0 (0.0%) | 0 (0.0%) |
| College or Associate's Degree | 0 (0.0%) | 0 (0.0%) |
| Bachelor's Degree | 0 (0.0%) | 0 (0.0%) |
| Graduate Degree | 0 (0.0%) | 0 (0.0%) |
| Total | 0 (0.0%) | 0 (0.0%) |
Employment Characteristics in Santa Maria
Employment by Class of Employer in Santa Maria
Among the 196 employed individuals in Santa Maria, private company employees (165 | 84.2%), local government employees (11 | 5.6%), and federal government employees (11 | 5.6%) make up the most common classes of employment.
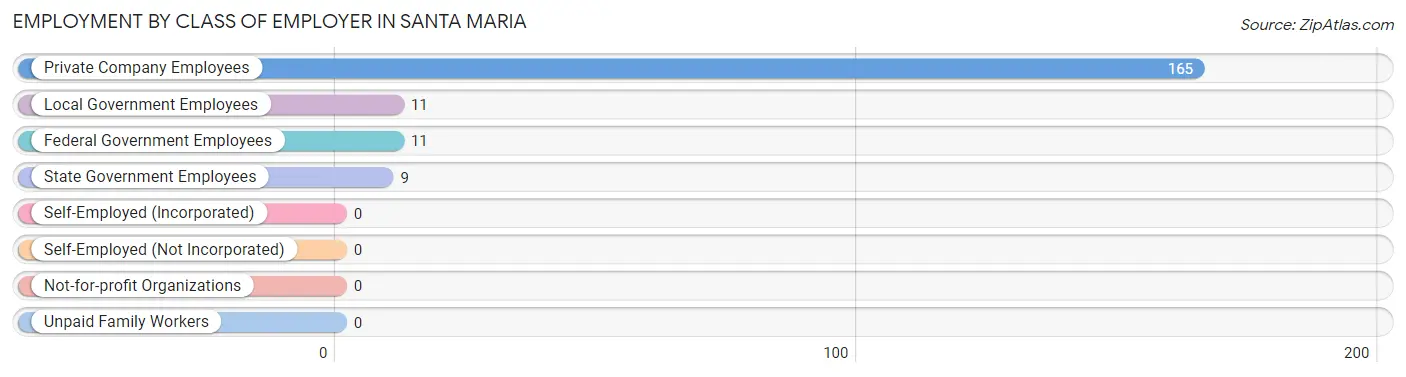
| Employer Class | # Employees | % Employees |
| Private Company Employees | 165 | 84.2% |
| Self-Employed (Incorporated) | 0 | 0.0% |
| Self-Employed (Not Incorporated) | 0 | 0.0% |
| Not-for-profit Organizations | 0 | 0.0% |
| Local Government Employees | 11 | 5.6% |
| State Government Employees | 9 | 4.6% |
| Federal Government Employees | 11 | 5.6% |
| Unpaid Family Workers | 0 | 0.0% |
| Total | 196 | 100.0% |
Employment Status by Age in Santa Maria
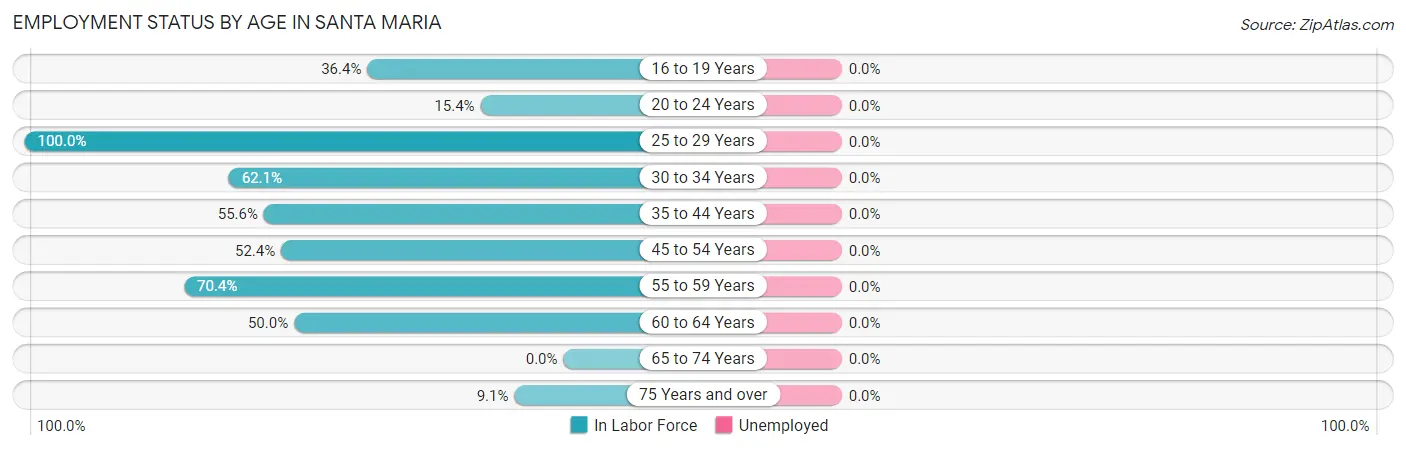
| Age Bracket | In Labor Force | Unemployed |
| 16 to 19 Years | 20 (36.4%) | 0 (0.0%) |
| 20 to 24 Years | 8 (15.4%) | 0 (0.0%) |
| 25 to 29 Years | 49 (100.0%) | 0 (0.0%) |
| 30 to 34 Years | 18 (62.1%) | 0 (0.0%) |
| 35 to 44 Years | 20 (55.6%) | 0 (0.0%) |
| 45 to 54 Years | 43 (52.4%) | 0 (0.0%) |
| 55 to 59 Years | 19 (70.4%) | 0 (0.0%) |
| 60 to 64 Years | 9 (50.0%) | 0 (0.0%) |
| 65 to 74 Years | 0 (0.0%) | 0 (0.0%) |
| 75 Years and over | 10 (9.1%) | 0 (0.0%) |
| Total | 196 (37.9%) | 0 (0.0%) |
Employment Status by Educational Attainment in Santa Maria
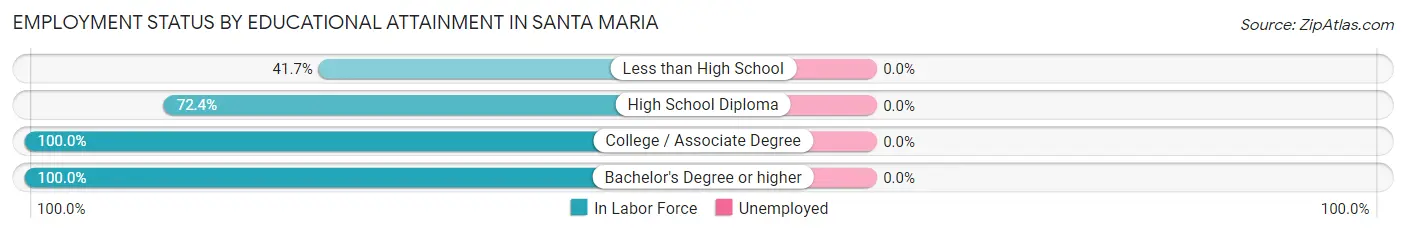
| Educational Attainment | In Labor Force | Unemployed |
| Less than High School | 40 (41.7%) | 0 (0.0%) |
| High School Diploma | 71 (72.4%) | 0 (0.0%) |
| College / Associate Degree | 40 (100.0%) | 0 (0.0%) |
| Bachelor's Degree or higher | 7 (100.0%) | 0 (0.0%) |
| Total | 158 (65.6%) | 0 (0.0%) |
Employment Occupations by Sex in Santa Maria
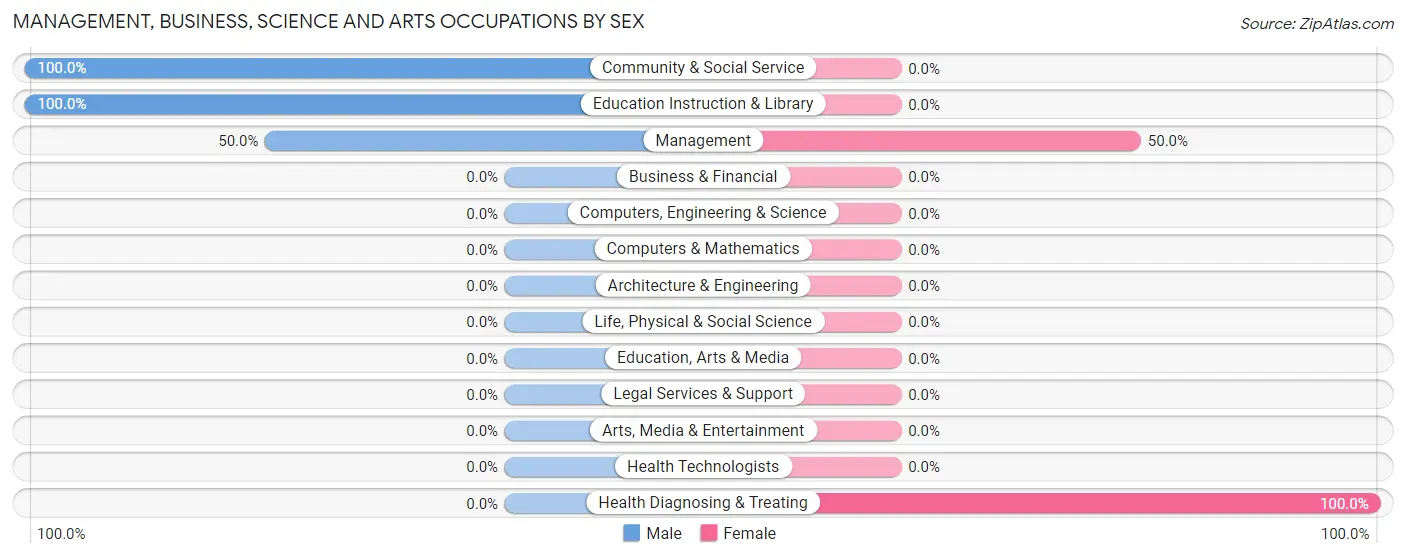
Management, Business, Science and Arts Occupations
The most common Management, Business, Science and Arts occupations in Santa Maria are Management (20 | 10.2%), Health Diagnosing & Treating (9 | 4.6%), Community & Social Service (7 | 3.6%), and Education Instruction & Library (7 | 3.6%).
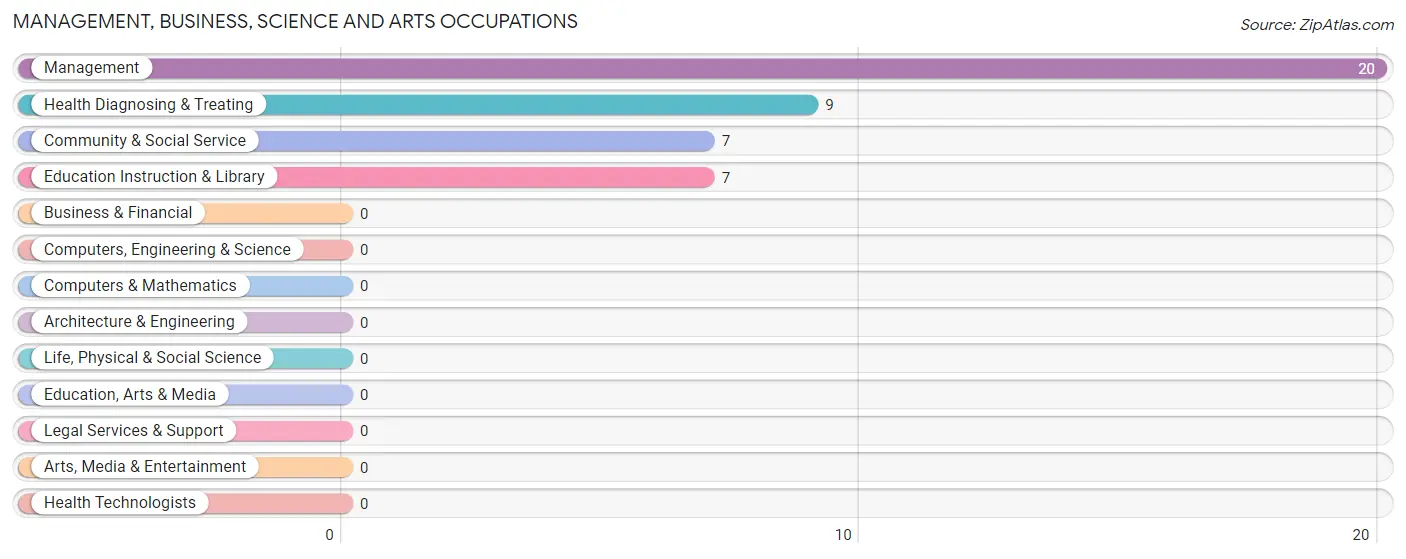
Management, Business, Science and Arts Occupations by Sex
Within the Management, Business, Science and Arts occupations in Santa Maria, the most male-oriented occupations are Community & Social Service (100.0%), Education Instruction & Library (100.0%), and Management (50.0%), while the most female-oriented occupations are Health Diagnosing & Treating (100.0%), and Management (50.0%).
| Occupation | Male | Female |
| Management | 10 (50.0%) | 10 (50.0%) |
| Business & Financial | 0 (0.0%) | 0 (0.0%) |
| Computers, Engineering & Science | 0 (0.0%) | 0 (0.0%) |
| Computers & Mathematics | 0 (0.0%) | 0 (0.0%) |
| Architecture & Engineering | 0 (0.0%) | 0 (0.0%) |
| Life, Physical & Social Science | 0 (0.0%) | 0 (0.0%) |
| Community & Social Service | 7 (100.0%) | 0 (0.0%) |
| Education, Arts & Media | 0 (0.0%) | 0 (0.0%) |
| Legal Services & Support | 0 (0.0%) | 0 (0.0%) |
| Education Instruction & Library | 7 (100.0%) | 0 (0.0%) |
| Arts, Media & Entertainment | 0 (0.0%) | 0 (0.0%) |
| Health Diagnosing & Treating | 0 (0.0%) | 9 (100.0%) |
| Health Technologists | 0 (0.0%) | 0 (0.0%) |
| Total (Category) | 17 (47.2%) | 19 (52.8%) |
| Total (Overall) | 114 (58.2%) | 82 (41.8%) |
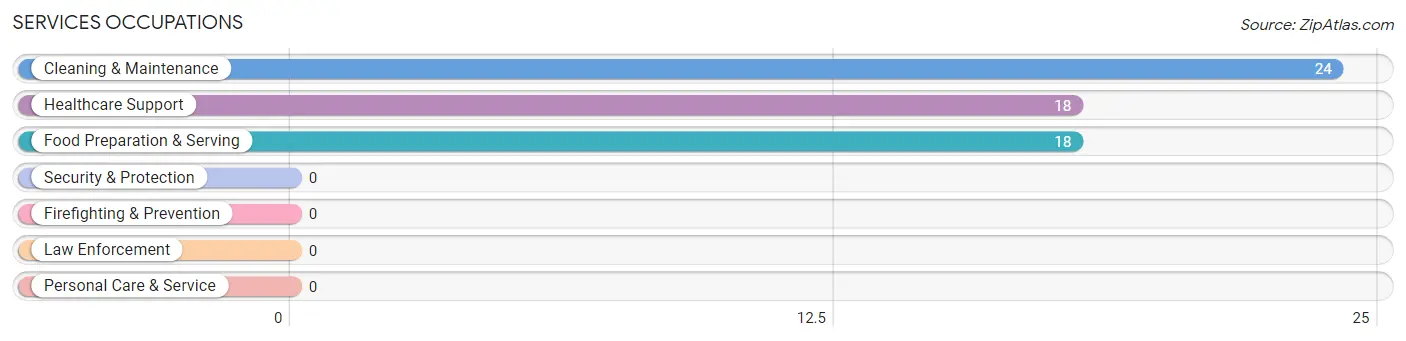
Services Occupations
The most common Services occupations in Santa Maria are Cleaning & Maintenance (24 | 12.2%), Healthcare Support (18 | 9.2%), and Food Preparation & Serving (18 | 9.2%).
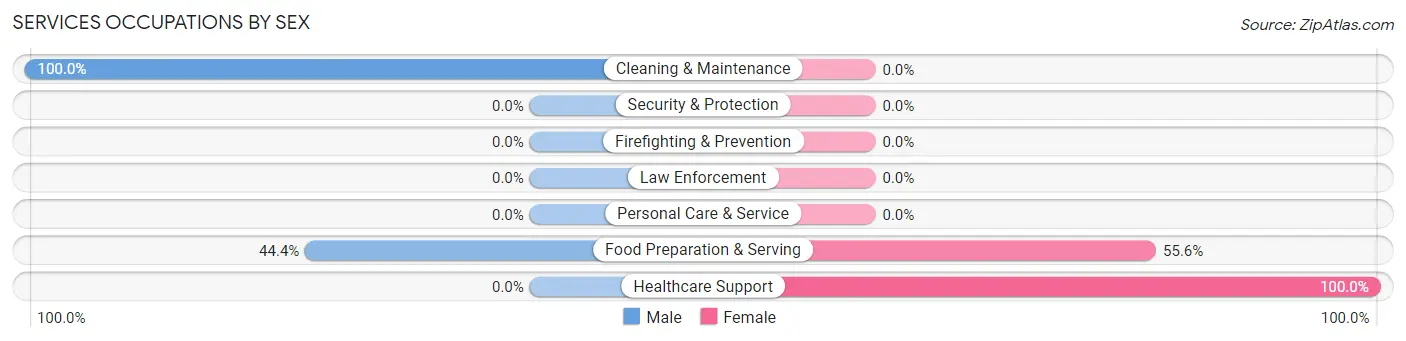
Services Occupations by Sex
Within the Services occupations in Santa Maria, the most male-oriented occupations are Cleaning & Maintenance (100.0%), and Food Preparation & Serving (44.4%), while the most female-oriented occupations are Healthcare Support (100.0%), and Food Preparation & Serving (55.6%).
| Occupation | Male | Female |
| Healthcare Support | 0 (0.0%) | 18 (100.0%) |
| Security & Protection | 0 (0.0%) | 0 (0.0%) |
| Firefighting & Prevention | 0 (0.0%) | 0 (0.0%) |
| Law Enforcement | 0 (0.0%) | 0 (0.0%) |
| Food Preparation & Serving | 8 (44.4%) | 10 (55.6%) |
| Cleaning & Maintenance | 24 (100.0%) | 0 (0.0%) |
| Personal Care & Service | 0 (0.0%) | 0 (0.0%) |
| Total (Category) | 32 (53.3%) | 28 (46.7%) |
| Total (Overall) | 114 (58.2%) | 82 (41.8%) |
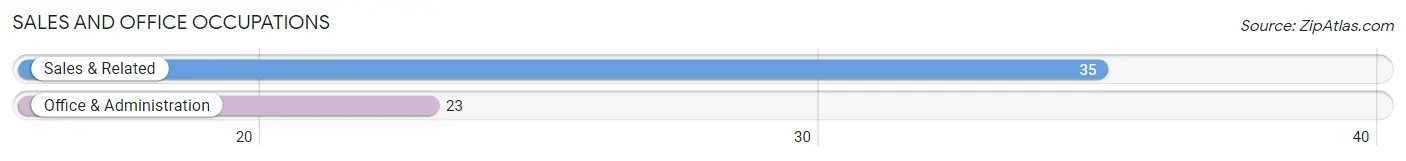
Sales and Office Occupations
The most common Sales and Office occupations in Santa Maria are Sales & Related (35 | 17.9%), and Office & Administration (23 | 11.7%).
Sales and Office Occupations by Sex
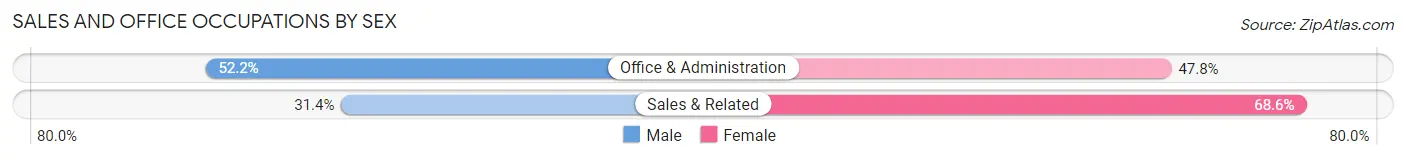
| Occupation | Male | Female |
| Sales & Related | 11 (31.4%) | 24 (68.6%) |
| Office & Administration | 12 (52.2%) | 11 (47.8%) |
| Total (Category) | 23 (39.7%) | 35 (60.3%) |
| Total (Overall) | 114 (58.2%) | 82 (41.8%) |
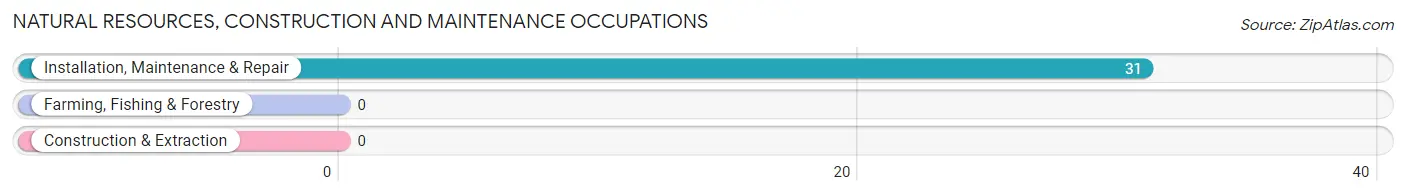
Natural Resources, Construction and Maintenance Occupations
The most common Natural Resources, Construction and Maintenance occupations in Santa Maria are , and Installation, Maintenance & Repair (31 | 15.8%).
Natural Resources, Construction and Maintenance Occupations by Sex
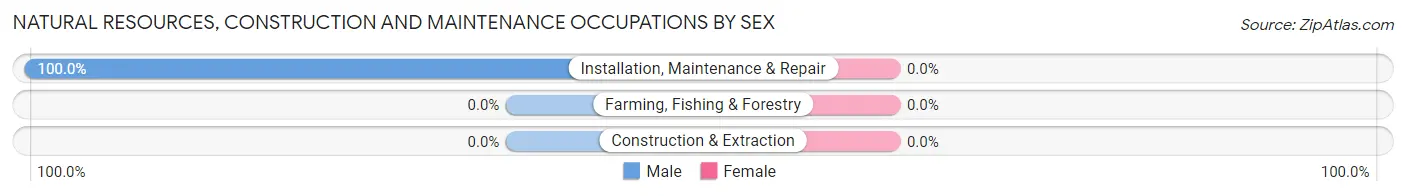
| Occupation | Male | Female |
| Farming, Fishing & Forestry | 0 (0.0%) | 0 (0.0%) |
| Construction & Extraction | 0 (0.0%) | 0 (0.0%) |
| Installation, Maintenance & Repair | 31 (100.0%) | 0 (0.0%) |
| Total (Category) | 31 (100.0%) | 0 (0.0%) |
| Total (Overall) | 114 (58.2%) | 82 (41.8%) |
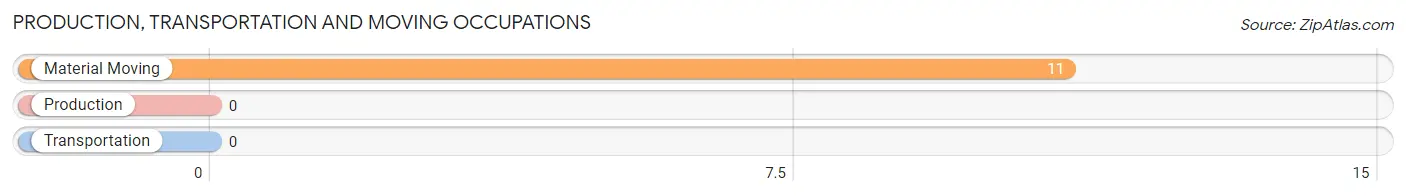
Production, Transportation and Moving Occupations
The most common Production, Transportation and Moving occupations in Santa Maria are , and Material Moving (11 | 5.6%).
Production, Transportation and Moving Occupations by Sex
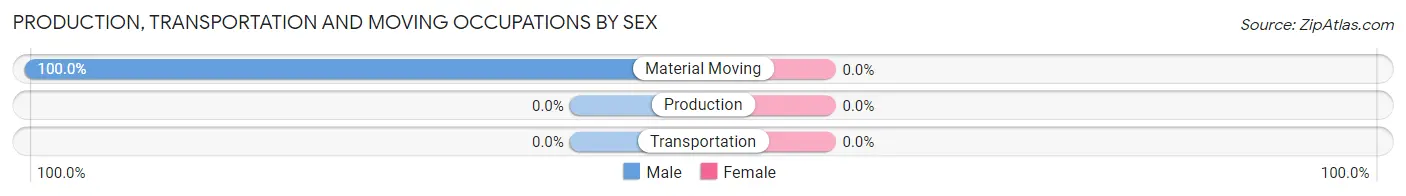
| Occupation | Male | Female |
| Production | 0 (0.0%) | 0 (0.0%) |
| Transportation | 0 (0.0%) | 0 (0.0%) |
| Material Moving | 11 (100.0%) | 0 (0.0%) |
| Total (Category) | 11 (100.0%) | 0 (0.0%) |
| Total (Overall) | 114 (58.2%) | 82 (41.8%) |
Employment Industries by Sex in Santa Maria
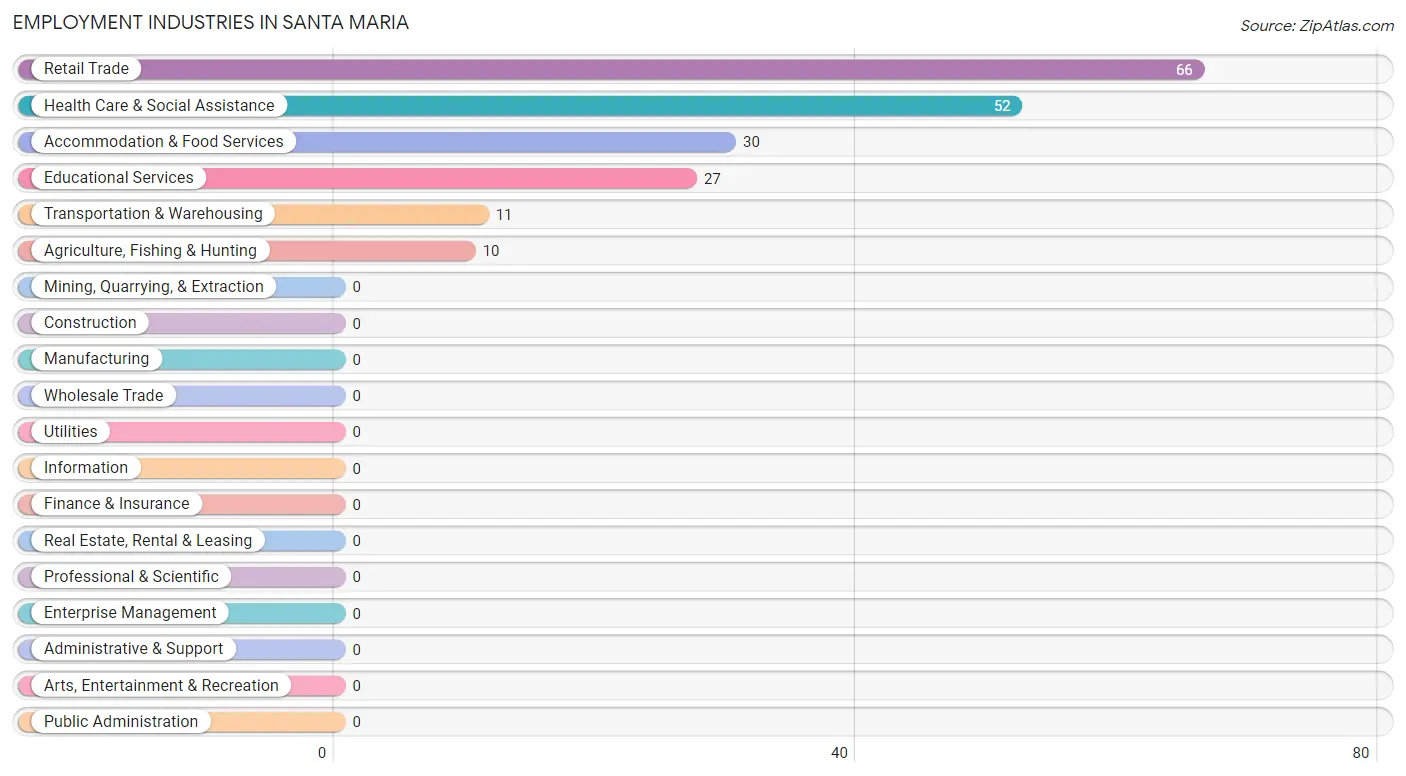
Employment Industries in Santa Maria
The major employment industries in Santa Maria include Retail Trade (66 | 33.7%), Health Care & Social Assistance (52 | 26.5%), Accommodation & Food Services (30 | 15.3%), Educational Services (27 | 13.8%), and Transportation & Warehousing (11 | 5.6%).
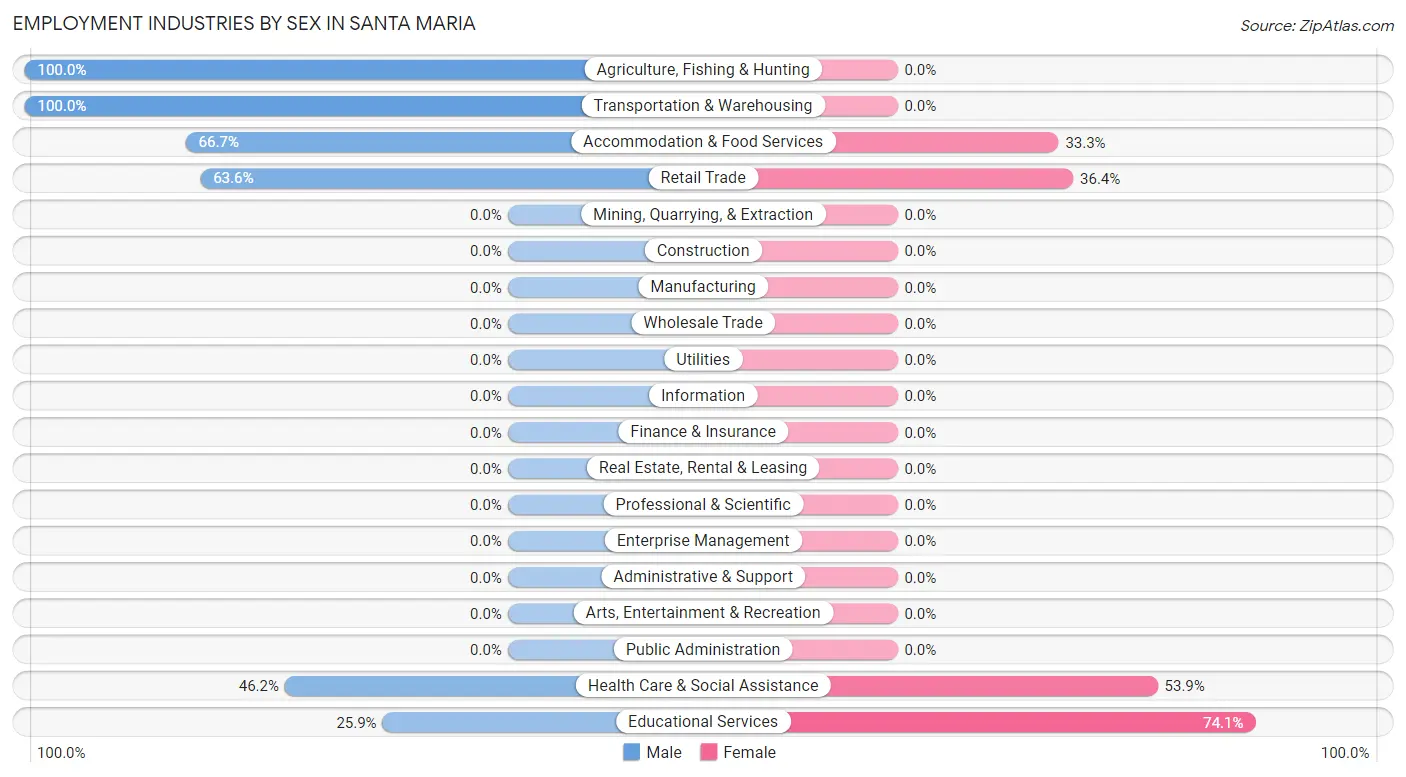
Employment Industries by Sex in Santa Maria
The Santa Maria industries that see more men than women are Agriculture, Fishing & Hunting (100.0%), Transportation & Warehousing (100.0%), and Accommodation & Food Services (66.7%), whereas the industries that tend to have a higher number of women are Educational Services (74.1%), Health Care & Social Assistance (53.8%), and Retail Trade (36.4%).
| Industry | Male | Female |
| Agriculture, Fishing & Hunting | 10 (100.0%) | 0 (0.0%) |
| Mining, Quarrying, & Extraction | 0 (0.0%) | 0 (0.0%) |
| Construction | 0 (0.0%) | 0 (0.0%) |
| Manufacturing | 0 (0.0%) | 0 (0.0%) |
| Wholesale Trade | 0 (0.0%) | 0 (0.0%) |
| Retail Trade | 42 (63.6%) | 24 (36.4%) |
| Transportation & Warehousing | 11 (100.0%) | 0 (0.0%) |
| Utilities | 0 (0.0%) | 0 (0.0%) |
| Information | 0 (0.0%) | 0 (0.0%) |
| Finance & Insurance | 0 (0.0%) | 0 (0.0%) |
| Real Estate, Rental & Leasing | 0 (0.0%) | 0 (0.0%) |
| Professional & Scientific | 0 (0.0%) | 0 (0.0%) |
| Enterprise Management | 0 (0.0%) | 0 (0.0%) |
| Administrative & Support | 0 (0.0%) | 0 (0.0%) |
| Educational Services | 7 (25.9%) | 20 (74.1%) |
| Health Care & Social Assistance | 24 (46.2%) | 28 (53.8%) |
| Arts, Entertainment & Recreation | 0 (0.0%) | 0 (0.0%) |
| Accommodation & Food Services | 20 (66.7%) | 10 (33.3%) |
| Public Administration | 0 (0.0%) | 0 (0.0%) |
| Total | 114 (58.2%) | 82 (41.8%) |
Education in Santa Maria
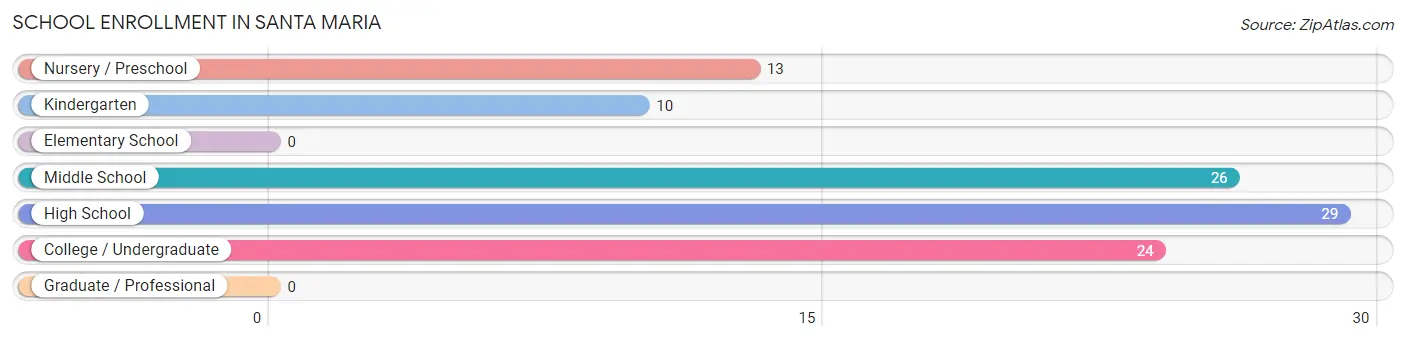
School Enrollment in Santa Maria
The most common levels of schooling among the 102 students in Santa Maria are high school (29 | 28.4%), middle school (26 | 25.5%), and college / undergraduate (24 | 23.5%).
| School Level | # Students | % Students |
| Nursery / Preschool | 13 | 12.8% |
| Kindergarten | 10 | 9.8% |
| Elementary School | 0 | 0.0% |
| Middle School | 26 | 25.5% |
| High School | 29 | 28.4% |
| College / Undergraduate | 24 | 23.5% |
| Graduate / Professional | 0 | 0.0% |
| Total | 102 | 100.0% |
School Enrollment by Age by Funding Source in Santa Maria
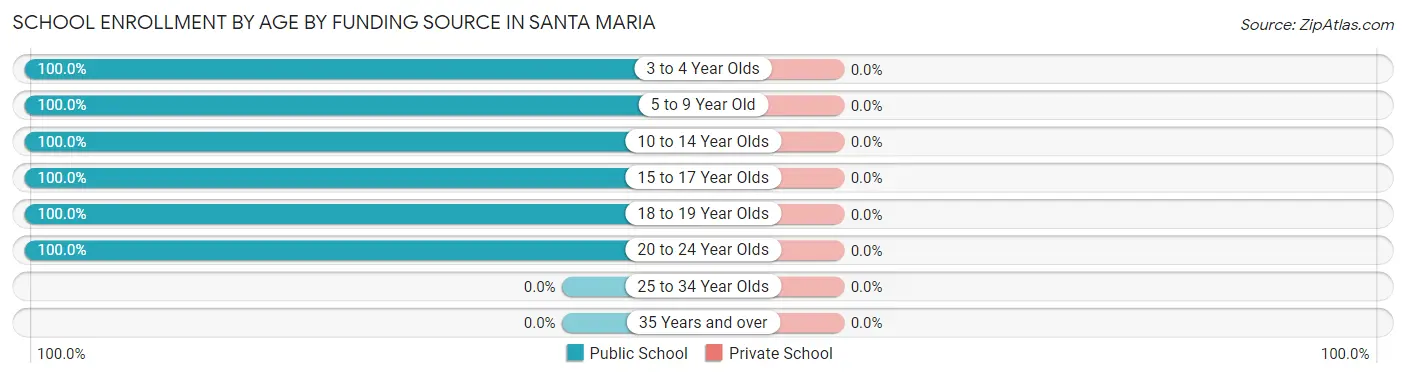
| Age Bracket | Public School | Private School |
| 3 to 4 Year Olds | 13 (100.0%) | 0 (0.0%) |
| 5 to 9 Year Old | 10 (100.0%) | 0 (0.0%) |
| 10 to 14 Year Olds | 26 (100.0%) | 0 (0.0%) |
| 15 to 17 Year Olds | 19 (100.0%) | 0 (0.0%) |
| 18 to 19 Year Olds | 26 (100.0%) | 0 (0.0%) |
| 20 to 24 Year Olds | 8 (100.0%) | 0 (0.0%) |
| 25 to 34 Year Olds | 0 (0.0%) | 0 (0.0%) |
| 35 Years and over | 0 (0.0%) | 0 (0.0%) |
| Total | 102 (100.0%) | 0 (0.0%) |
Educational Attainment by Field of Study in Santa Maria
, and education (7 | 100.0%) are the most common fields of study among 7 individuals in Santa Maria who have obtained a bachelor's degree or higher.
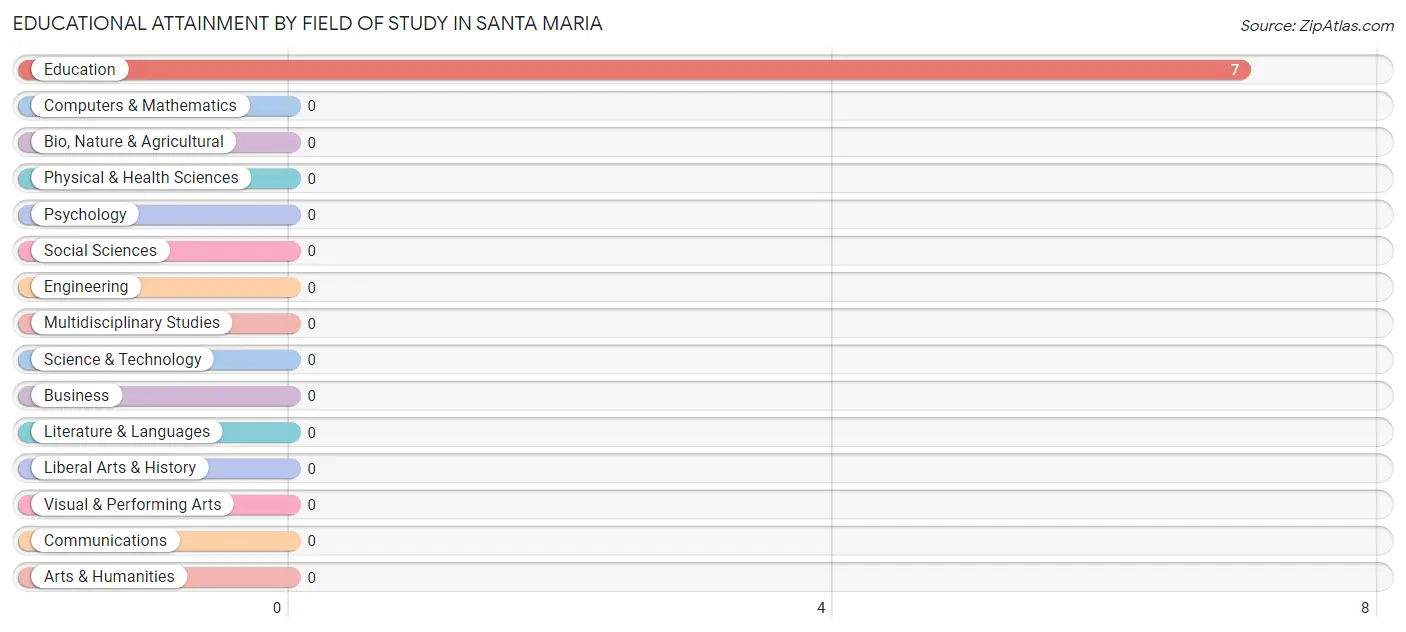
| Field of Study | # Graduates | % Graduates |
| Computers & Mathematics | 0 | 0.0% |
| Bio, Nature & Agricultural | 0 | 0.0% |
| Physical & Health Sciences | 0 | 0.0% |
| Psychology | 0 | 0.0% |
| Social Sciences | 0 | 0.0% |
| Engineering | 0 | 0.0% |
| Multidisciplinary Studies | 0 | 0.0% |
| Science & Technology | 0 | 0.0% |
| Business | 0 | 0.0% |
| Education | 7 | 100.0% |
| Literature & Languages | 0 | 0.0% |
| Liberal Arts & History | 0 | 0.0% |
| Visual & Performing Arts | 0 | 0.0% |
| Communications | 0 | 0.0% |
| Arts & Humanities | 0 | 0.0% |
| Total | 7 | 100.0% |
Transportation & Commute in Santa Maria
Vehicle Availability by Sex in Santa Maria
The most prevalent vehicle ownership categories in Santa Maria are males with 3 vehicles (33, accounting for 28.9%) and females with 3 vehicles (57, making up 40.2%).
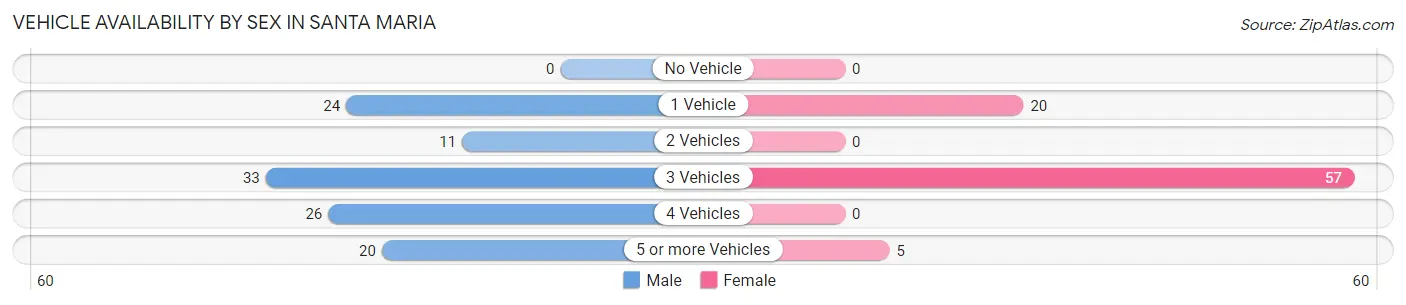
| Vehicles Available | Male | Female |
| No Vehicle | 0 (0.0%) | 0 (0.0%) |
| 1 Vehicle | 24 (21.0%) | 20 (24.4%) |
| 2 Vehicles | 11 (9.7%) | 0 (0.0%) |
| 3 Vehicles | 33 (28.9%) | 57 (69.5%) |
| 4 Vehicles | 26 (22.8%) | 0 (0.0%) |
| 5 or more Vehicles | 20 (17.5%) | 5 (6.1%) |
| Total | 114 (100.0%) | 82 (100.0%) |
Commute Time in Santa Maria
The most frequently occuring commute durations in Santa Maria are 25 to 29 minutes (84 commuters, 42.9%), 45 to 59 minutes (35 commuters, 17.9%), and 15 to 19 minutes (28 commuters, 14.3%).
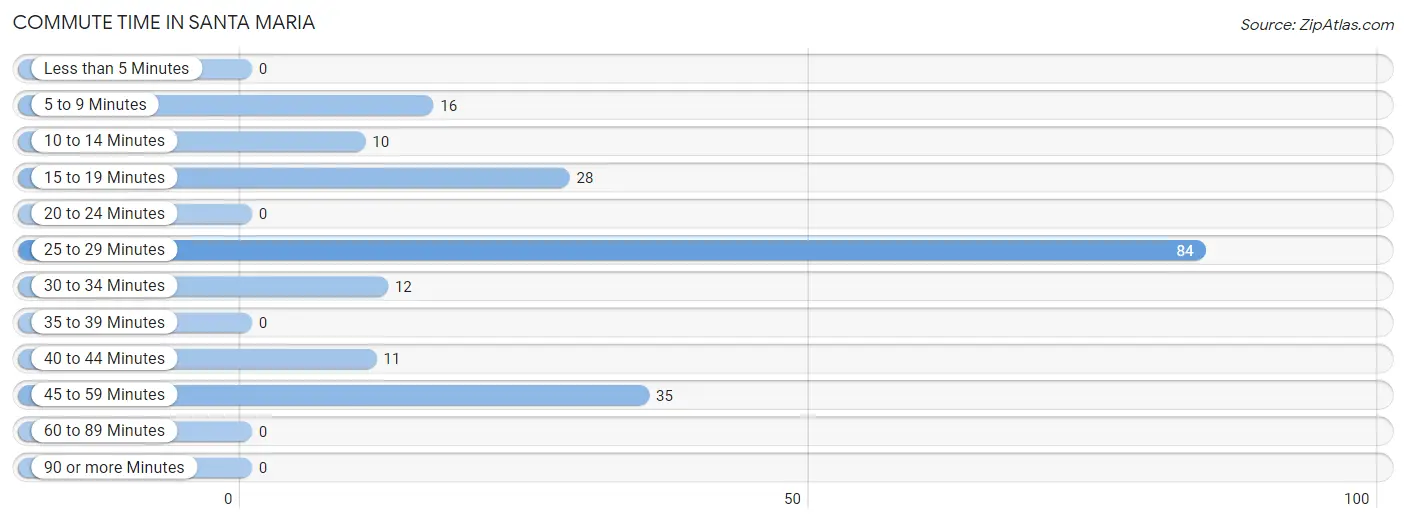
| Commute Time | # Commuters | % Commuters |
| Less than 5 Minutes | 0 | 0.0% |
| 5 to 9 Minutes | 16 | 8.2% |
| 10 to 14 Minutes | 10 | 5.1% |
| 15 to 19 Minutes | 28 | 14.3% |
| 20 to 24 Minutes | 0 | 0.0% |
| 25 to 29 Minutes | 84 | 42.9% |
| 30 to 34 Minutes | 12 | 6.1% |
| 35 to 39 Minutes | 0 | 0.0% |
| 40 to 44 Minutes | 11 | 5.6% |
| 45 to 59 Minutes | 35 | 17.9% |
| 60 to 89 Minutes | 0 | 0.0% |
| 90 or more Minutes | 0 | 0.0% |
Commute Time by Sex in Santa Maria
The most common commute times in Santa Maria are 25 to 29 minutes (36 commuters, 31.6%) for males and 25 to 29 minutes (48 commuters, 58.5%) for females.
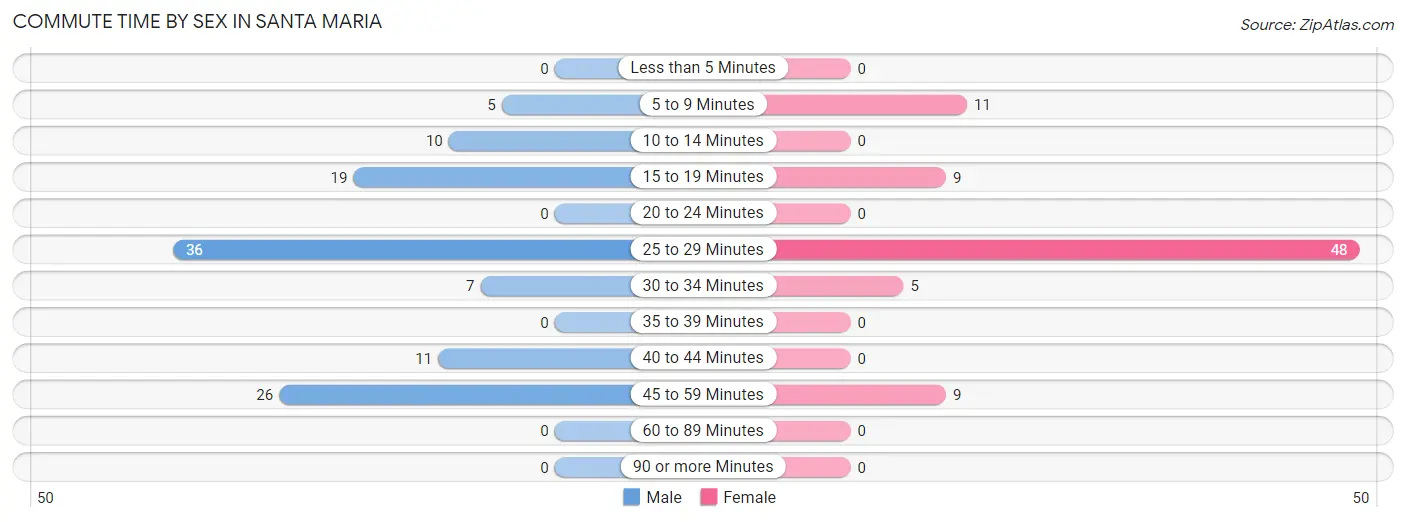
| Commute Time | Male | Female |
| Less than 5 Minutes | 0 (0.0%) | 0 (0.0%) |
| 5 to 9 Minutes | 5 (4.4%) | 11 (13.4%) |
| 10 to 14 Minutes | 10 (8.8%) | 0 (0.0%) |
| 15 to 19 Minutes | 19 (16.7%) | 9 (11.0%) |
| 20 to 24 Minutes | 0 (0.0%) | 0 (0.0%) |
| 25 to 29 Minutes | 36 (31.6%) | 48 (58.5%) |
| 30 to 34 Minutes | 7 (6.1%) | 5 (6.1%) |
| 35 to 39 Minutes | 0 (0.0%) | 0 (0.0%) |
| 40 to 44 Minutes | 11 (9.7%) | 0 (0.0%) |
| 45 to 59 Minutes | 26 (22.8%) | 9 (11.0%) |
| 60 to 89 Minutes | 0 (0.0%) | 0 (0.0%) |
| 90 or more Minutes | 0 (0.0%) | 0 (0.0%) |
Time of Departure to Work by Sex in Santa Maria
The most frequent times of departure to work in Santa Maria are 7:00 AM to 7:29 AM (34, 29.8%) for males and 7:30 AM to 7:59 AM (30, 36.6%) for females.
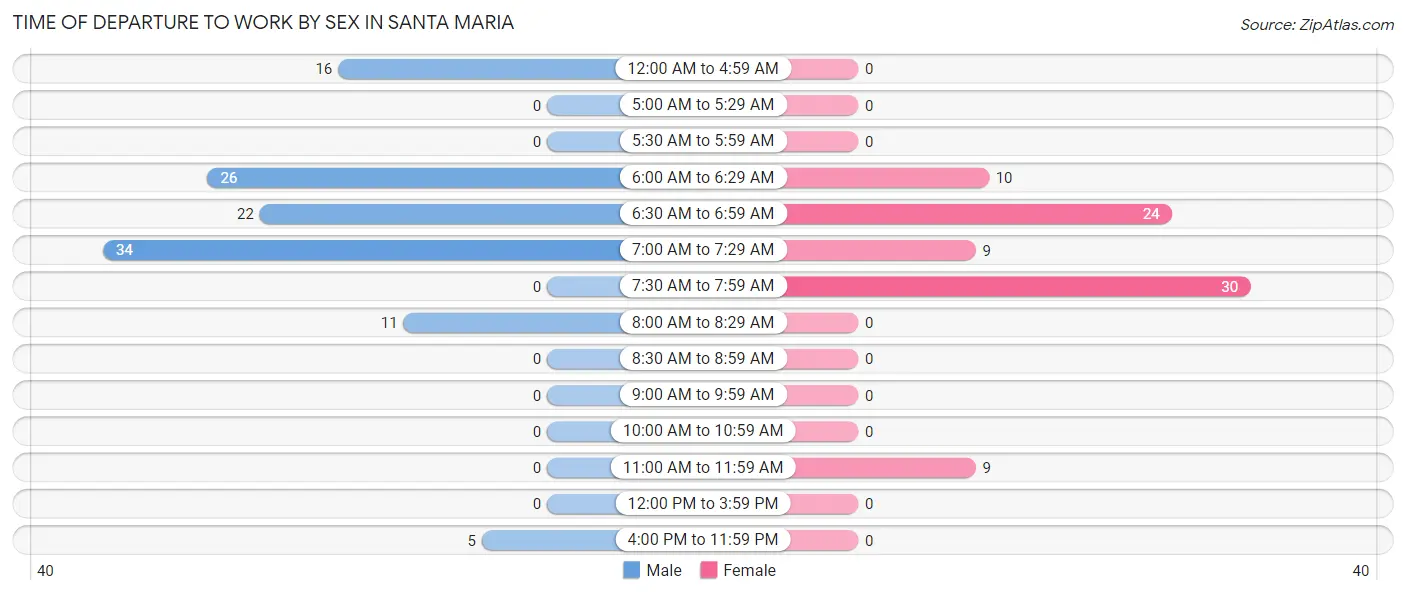
| Time of Departure | Male | Female |
| 12:00 AM to 4:59 AM | 16 (14.0%) | 0 (0.0%) |
| 5:00 AM to 5:29 AM | 0 (0.0%) | 0 (0.0%) |
| 5:30 AM to 5:59 AM | 0 (0.0%) | 0 (0.0%) |
| 6:00 AM to 6:29 AM | 26 (22.8%) | 10 (12.2%) |
| 6:30 AM to 6:59 AM | 22 (19.3%) | 24 (29.3%) |
| 7:00 AM to 7:29 AM | 34 (29.8%) | 9 (11.0%) |
| 7:30 AM to 7:59 AM | 0 (0.0%) | 30 (36.6%) |
| 8:00 AM to 8:29 AM | 11 (9.7%) | 0 (0.0%) |
| 8:30 AM to 8:59 AM | 0 (0.0%) | 0 (0.0%) |
| 9:00 AM to 9:59 AM | 0 (0.0%) | 0 (0.0%) |
| 10:00 AM to 10:59 AM | 0 (0.0%) | 0 (0.0%) |
| 11:00 AM to 11:59 AM | 0 (0.0%) | 9 (11.0%) |
| 12:00 PM to 3:59 PM | 0 (0.0%) | 0 (0.0%) |
| 4:00 PM to 11:59 PM | 5 (4.4%) | 0 (0.0%) |
| Total | 114 (100.0%) | 82 (100.0%) |
Housing Occupancy in Santa Maria
Occupancy by Ownership in Santa Maria
Of the total 166 dwellings in Santa Maria, owner-occupied units account for 147 (88.5%), while renter-occupied units make up 19 (11.5%).
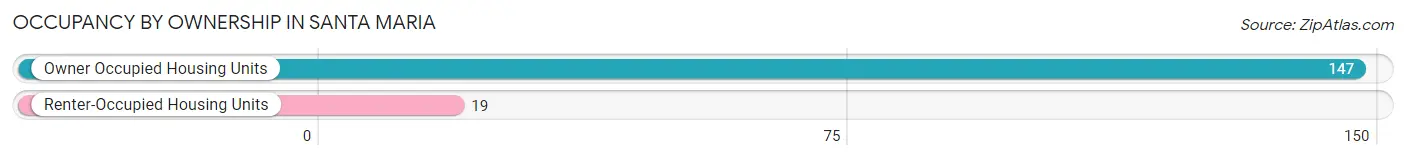
| Occupancy | # Housing Units | % Housing Units |
| Owner Occupied Housing Units | 147 | 88.5% |
| Renter-Occupied Housing Units | 19 | 11.5% |
| Total Occupied Housing Units | 166 | 100.0% |
Occupancy by Household Size in Santa Maria
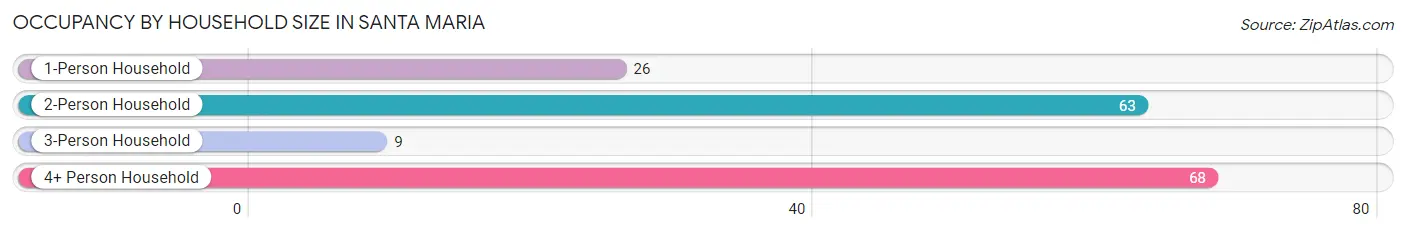
| Household Size | # Housing Units | % Housing Units |
| 1-Person Household | 26 | 15.7% |
| 2-Person Household | 63 | 38.0% |
| 3-Person Household | 9 | 5.4% |
| 4+ Person Household | 68 | 41.0% |
| Total Housing Units | 166 | 100.0% |
Occupancy by Ownership by Household Size in Santa Maria
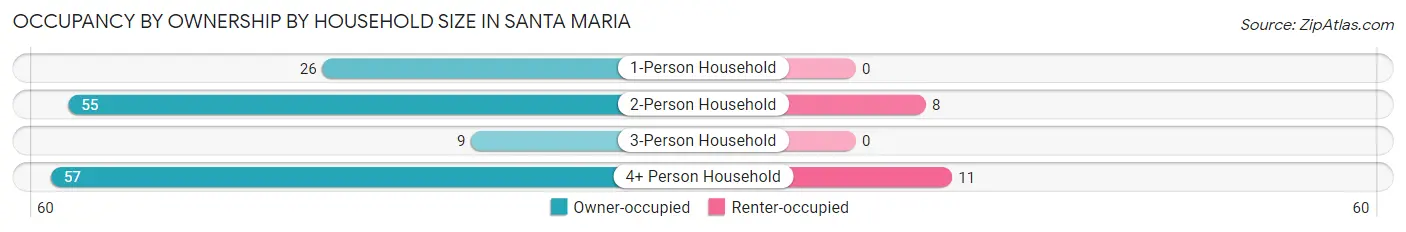
| Household Size | Owner-occupied | Renter-occupied |
| 1-Person Household | 26 (100.0%) | 0 (0.0%) |
| 2-Person Household | 55 (87.3%) | 8 (12.7%) |
| 3-Person Household | 9 (100.0%) | 0 (0.0%) |
| 4+ Person Household | 57 (83.8%) | 11 (16.2%) |
| Total Housing Units | 147 (88.5%) | 19 (11.5%) |
Occupancy by Educational Attainment in Santa Maria
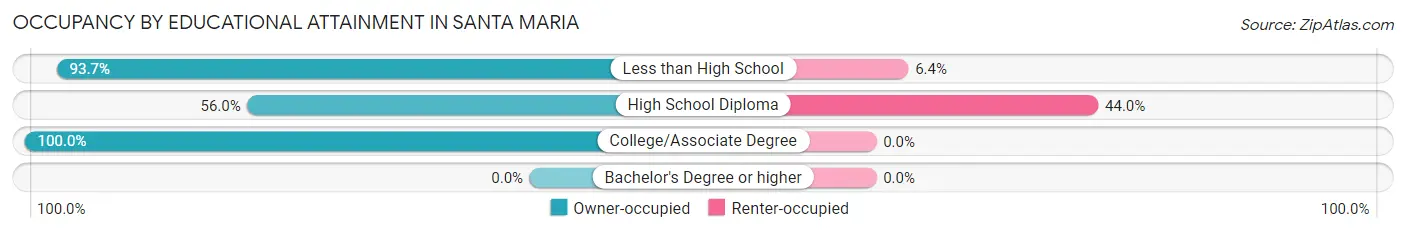
| Household Size | Owner-occupied | Renter-occupied |
| Less than High School | 118 (93.6%) | 8 (6.4%) |
| High School Diploma | 14 (56.0%) | 11 (44.0%) |
| College/Associate Degree | 15 (100.0%) | 0 (0.0%) |
| Bachelor's Degree or higher | 0 (0.0%) | 0 (0.0%) |
Occupancy by Age of Householder in Santa Maria
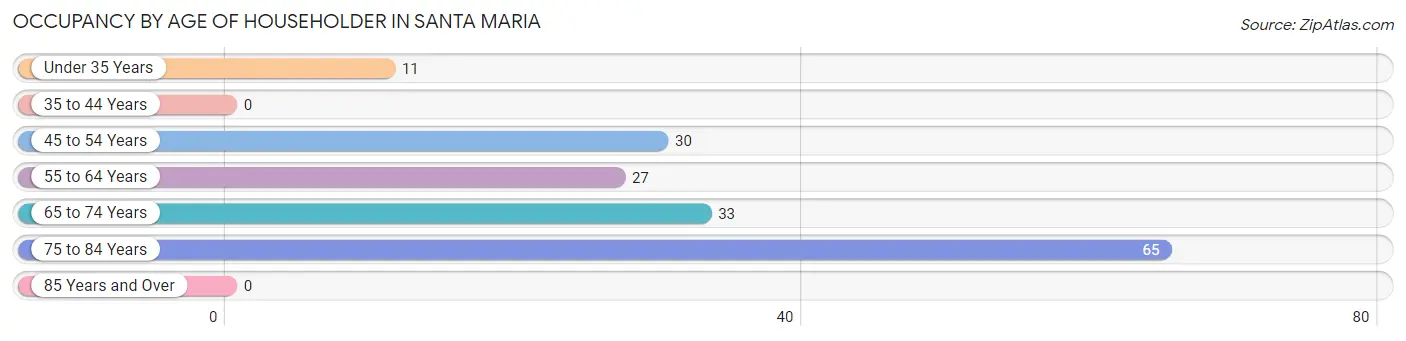
| Age Bracket | # Households | % Households |
| Under 35 Years | 11 | 6.6% |
| 35 to 44 Years | 0 | 0.0% |
| 45 to 54 Years | 30 | 18.1% |
| 55 to 64 Years | 27 | 16.3% |
| 65 to 74 Years | 33 | 19.9% |
| 75 to 84 Years | 65 | 39.2% |
| 85 Years and Over | 0 | 0.0% |
| Total | 166 | 100.0% |
Housing Finances in Santa Maria
Median Income by Occupancy in Santa Maria
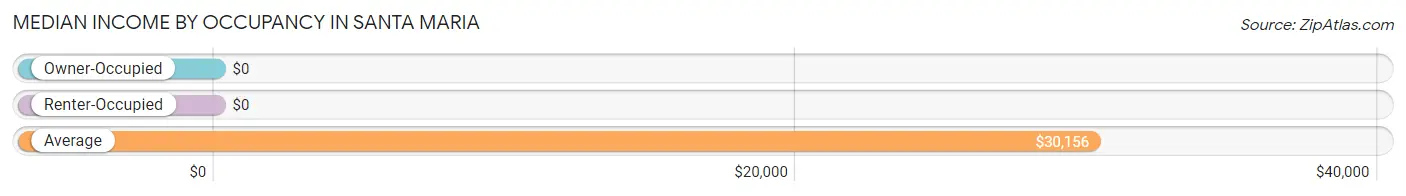
| Occupancy Type | # Households | Median Income |
| Owner-Occupied | 147 (88.5%) | $0 |
| Renter-Occupied | 19 (11.5%) | $0 |
| Average | 166 (100.0%) | $30,156 |
Occupancy by Householder Income Bracket in Santa Maria
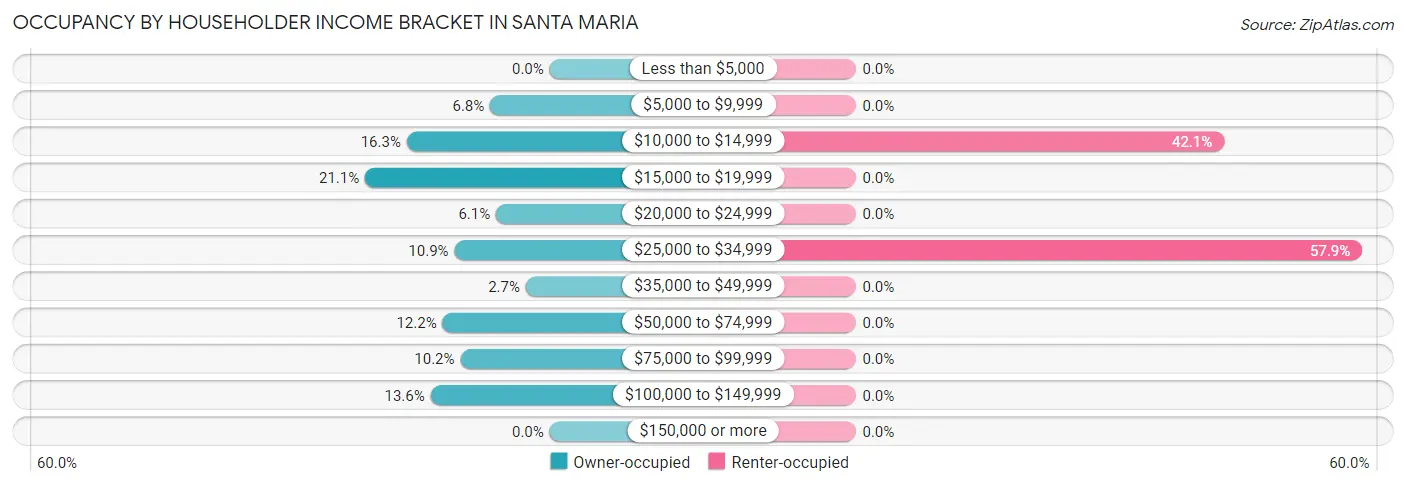
| Income Bracket | Owner-occupied | Renter-occupied |
| Less than $5,000 | 0 (0.0%) | 0 (0.0%) |
| $5,000 to $9,999 | 10 (6.8%) | 0 (0.0%) |
| $10,000 to $14,999 | 24 (16.3%) | 8 (42.1%) |
| $15,000 to $19,999 | 31 (21.1%) | 0 (0.0%) |
| $20,000 to $24,999 | 9 (6.1%) | 0 (0.0%) |
| $25,000 to $34,999 | 16 (10.9%) | 11 (57.9%) |
| $35,000 to $49,999 | 4 (2.7%) | 0 (0.0%) |
| $50,000 to $74,999 | 18 (12.2%) | 0 (0.0%) |
| $75,000 to $99,999 | 15 (10.2%) | 0 (0.0%) |
| $100,000 to $149,999 | 20 (13.6%) | 0 (0.0%) |
| $150,000 or more | 0 (0.0%) | 0 (0.0%) |
| Total | 147 (100.0%) | 19 (100.0%) |
Monthly Housing Cost Tiers in Santa Maria
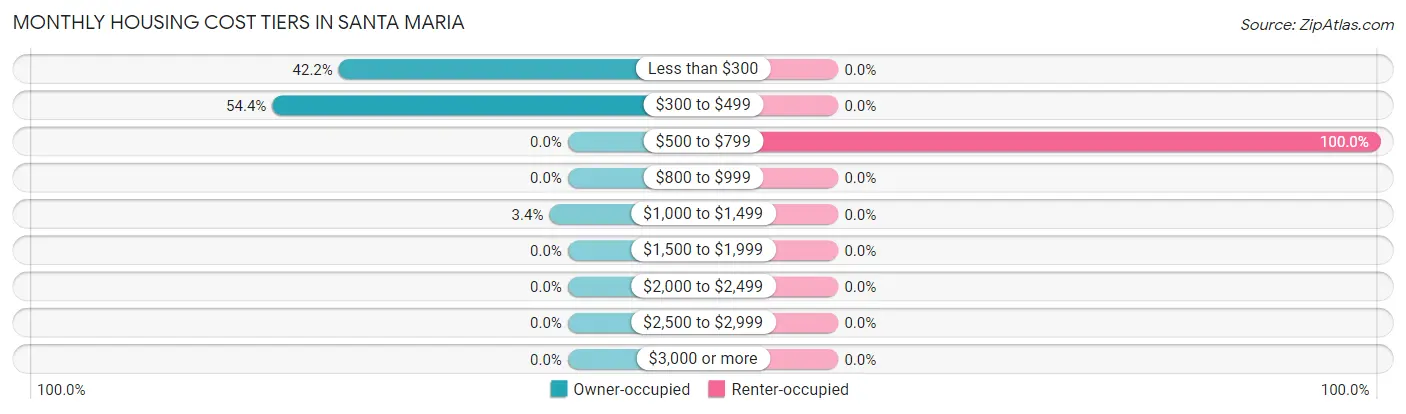
| Monthly Cost | Owner-occupied | Renter-occupied |
| Less than $300 | 62 (42.2%) | 0 (0.0%) |
| $300 to $499 | 80 (54.4%) | 0 (0.0%) |
| $500 to $799 | 0 (0.0%) | 19 (100.0%) |
| $800 to $999 | 0 (0.0%) | 0 (0.0%) |
| $1,000 to $1,499 | 5 (3.4%) | 0 (0.0%) |
| $1,500 to $1,999 | 0 (0.0%) | 0 (0.0%) |
| $2,000 to $2,499 | 0 (0.0%) | 0 (0.0%) |
| $2,500 to $2,999 | 0 (0.0%) | 0 (0.0%) |
| $3,000 or more | 0 (0.0%) | 0 (0.0%) |
| Total | 147 (100.0%) | 19 (100.0%) |
Physical Housing Characteristics in Santa Maria
Housing Structures in Santa Maria
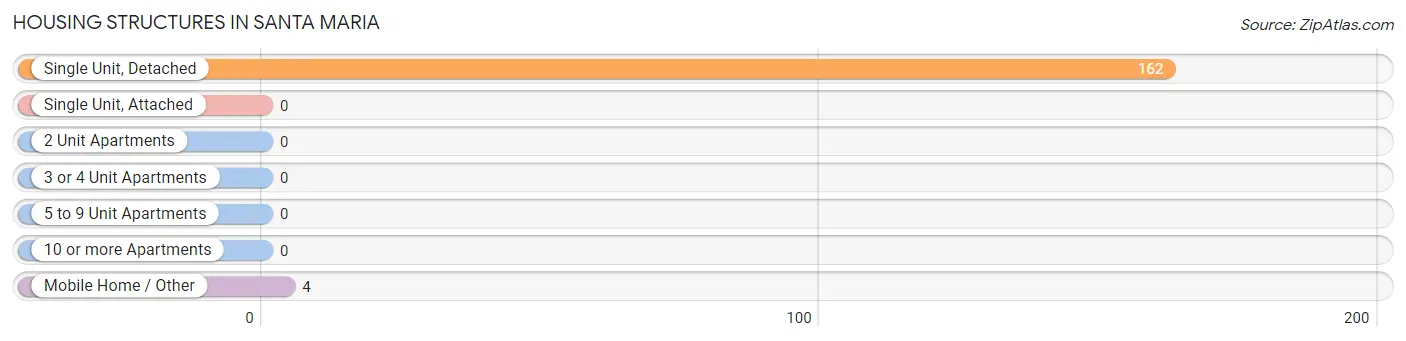
| Structure Type | # Housing Units | % Housing Units |
| Single Unit, Detached | 162 | 97.6% |
| Single Unit, Attached | 0 | 0.0% |
| 2 Unit Apartments | 0 | 0.0% |
| 3 or 4 Unit Apartments | 0 | 0.0% |
| 5 to 9 Unit Apartments | 0 | 0.0% |
| 10 or more Apartments | 0 | 0.0% |
| Mobile Home / Other | 4 | 2.4% |
| Total | 166 | 100.0% |
Housing Structures by Occupancy in Santa Maria

| Structure Type | Owner-occupied | Renter-occupied |
| Single Unit, Detached | 143 (88.3%) | 19 (11.7%) |
| Single Unit, Attached | 0 (0.0%) | 0 (0.0%) |
| 2 Unit Apartments | 0 (0.0%) | 0 (0.0%) |
| 3 or 4 Unit Apartments | 0 (0.0%) | 0 (0.0%) |
| 5 to 9 Unit Apartments | 0 (0.0%) | 0 (0.0%) |
| 10 or more Apartments | 0 (0.0%) | 0 (0.0%) |
| Mobile Home / Other | 4 (100.0%) | 0 (0.0%) |
| Total | 147 (88.5%) | 19 (11.5%) |
Housing Structures by Number of Rooms in Santa Maria
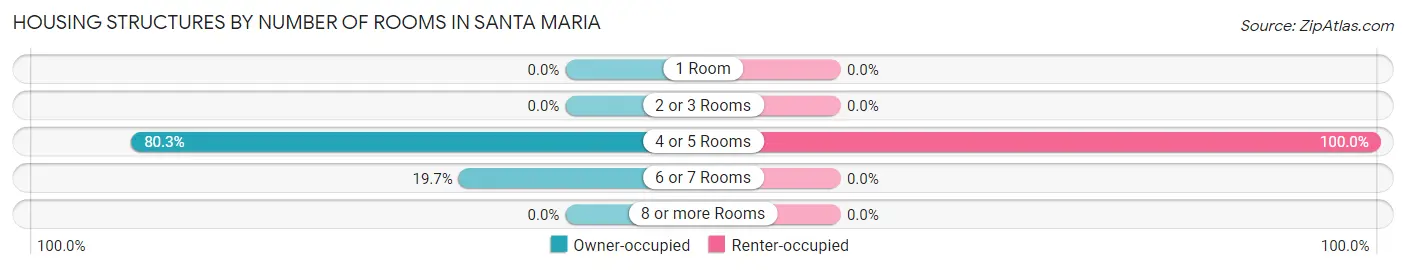
| Number of Rooms | Owner-occupied | Renter-occupied |
| 1 Room | 0 (0.0%) | 0 (0.0%) |
| 2 or 3 Rooms | 0 (0.0%) | 0 (0.0%) |
| 4 or 5 Rooms | 118 (80.3%) | 19 (100.0%) |
| 6 or 7 Rooms | 29 (19.7%) | 0 (0.0%) |
| 8 or more Rooms | 0 (0.0%) | 0 (0.0%) |
| Total | 147 (100.0%) | 19 (100.0%) |
Housing Structure by Heating Type in Santa Maria
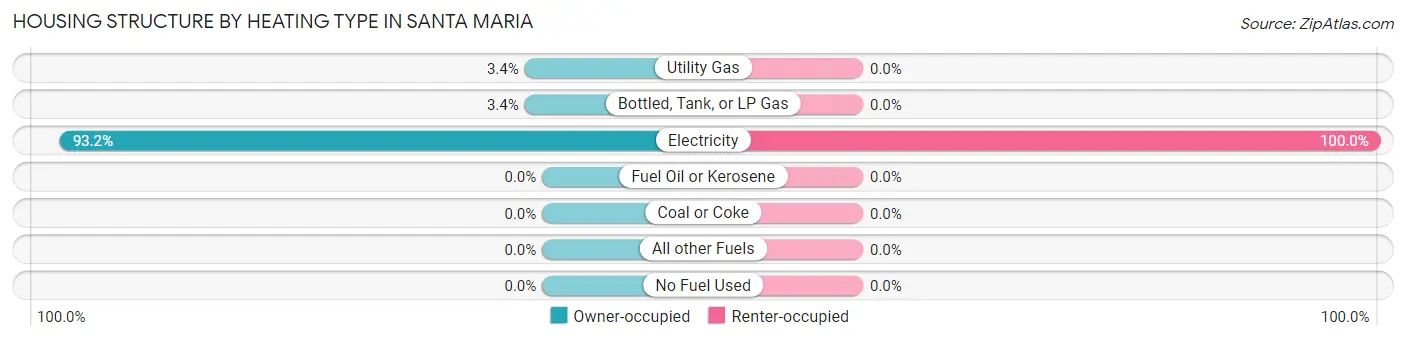
| Heating Type | Owner-occupied | Renter-occupied |
| Utility Gas | 5 (3.4%) | 0 (0.0%) |
| Bottled, Tank, or LP Gas | 5 (3.4%) | 0 (0.0%) |
| Electricity | 137 (93.2%) | 19 (100.0%) |
| Fuel Oil or Kerosene | 0 (0.0%) | 0 (0.0%) |
| Coal or Coke | 0 (0.0%) | 0 (0.0%) |
| All other Fuels | 0 (0.0%) | 0 (0.0%) |
| No Fuel Used | 0 (0.0%) | 0 (0.0%) |
| Total | 147 (100.0%) | 19 (100.0%) |
Household Vehicle Usage in Santa Maria
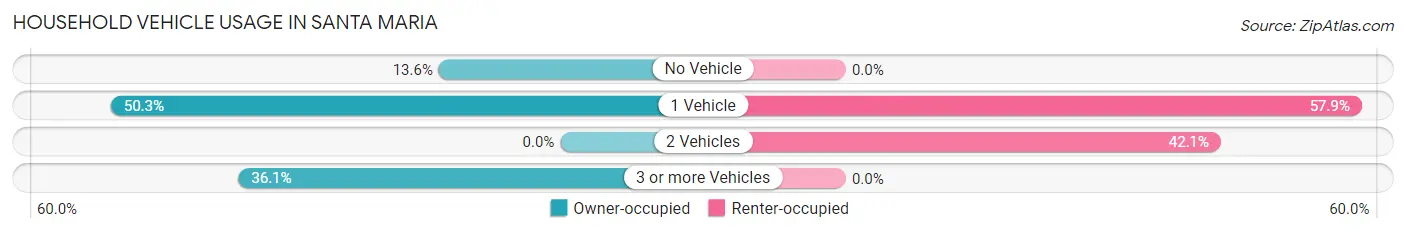
| Vehicles per Household | Owner-occupied | Renter-occupied |
| No Vehicle | 20 (13.6%) | 0 (0.0%) |
| 1 Vehicle | 74 (50.3%) | 11 (57.9%) |
| 2 Vehicles | 0 (0.0%) | 8 (42.1%) |
| 3 or more Vehicles | 53 (36.0%) | 0 (0.0%) |
| Total | 147 (100.0%) | 19 (100.0%) |
Real Estate & Mortgages in Santa Maria
Real Estate and Mortgage Overview in Santa Maria
| Characteristic | Without Mortgage | With Mortgage |
| Housing Units | 142 | 5 |
| Median Property Value | $34,600 | $0 |
| Median Household Income | $21,667 | $0 |
| Monthly Housing Costs | $314 | $0 |
| Real Estate Taxes | $423 | $0 |
Property Value by Mortgage Status in Santa Maria
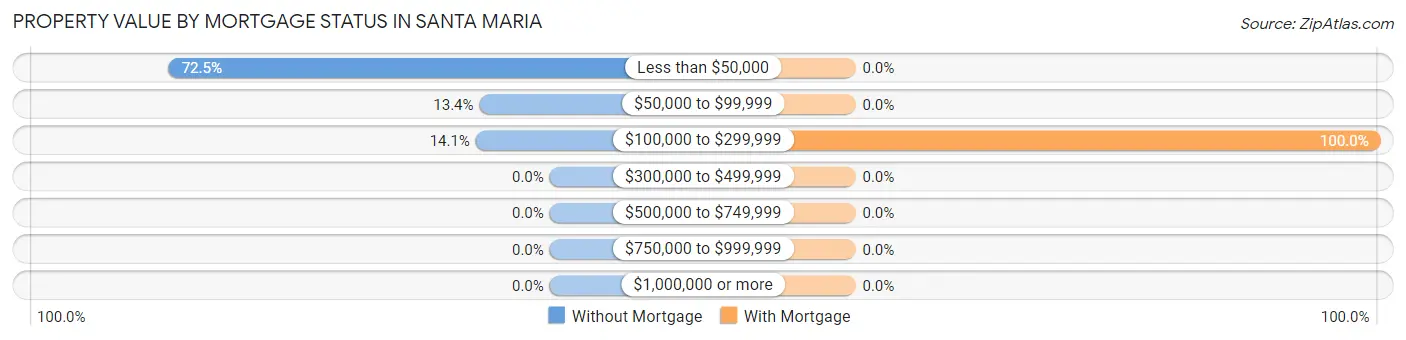
| Property Value | Without Mortgage | With Mortgage |
| Less than $50,000 | 103 (72.5%) | 0 (0.0%) |
| $50,000 to $99,999 | 19 (13.4%) | 0 (0.0%) |
| $100,000 to $299,999 | 20 (14.1%) | 5 (100.0%) |
| $300,000 to $499,999 | 0 (0.0%) | 0 (0.0%) |
| $500,000 to $749,999 | 0 (0.0%) | 0 (0.0%) |
| $750,000 to $999,999 | 0 (0.0%) | 0 (0.0%) |
| $1,000,000 or more | 0 (0.0%) | 0 (0.0%) |
| Total | 142 (100.0%) | 5 (100.0%) |
Household Income by Mortgage Status in Santa Maria
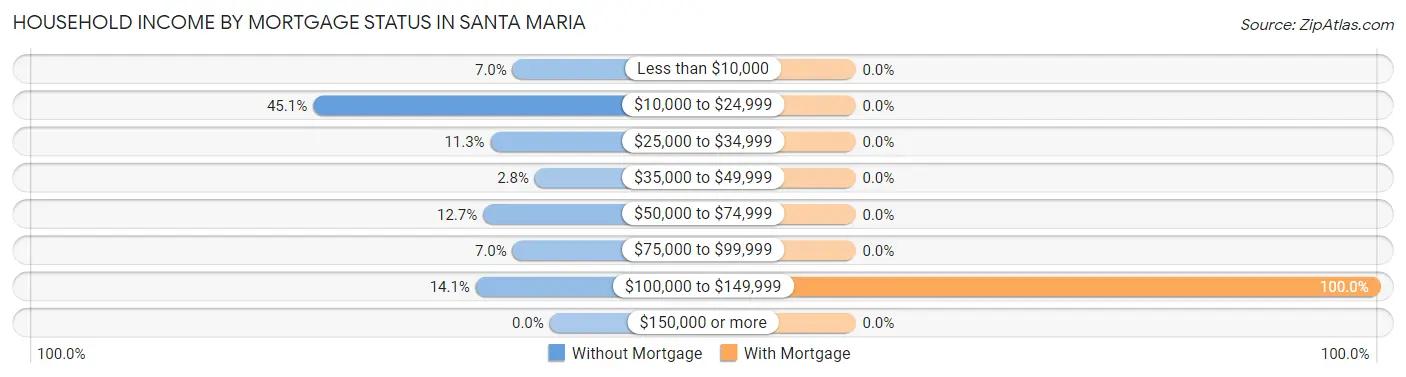
| Household Income | Without Mortgage | With Mortgage |
| Less than $10,000 | 10 (7.0%) | 0 (0.0%) |
| $10,000 to $24,999 | 64 (45.1%) | 0 (0.0%) |
| $25,000 to $34,999 | 16 (11.3%) | 0 (0.0%) |
| $35,000 to $49,999 | 4 (2.8%) | 0 (0.0%) |
| $50,000 to $74,999 | 18 (12.7%) | 0 (0.0%) |
| $75,000 to $99,999 | 10 (7.0%) | 0 (0.0%) |
| $100,000 to $149,999 | 20 (14.1%) | 5 (100.0%) |
| $150,000 or more | 0 (0.0%) | 0 (0.0%) |
| Total | 142 (100.0%) | 5 (100.0%) |
Property Value to Household Income Ratio in Santa Maria
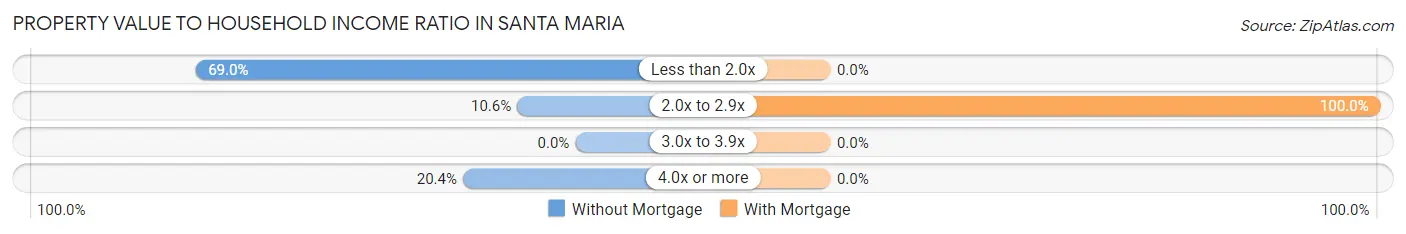
| Value-to-Income Ratio | Without Mortgage | With Mortgage |
| Less than 2.0x | 98 (69.0%) | 0 (0.0%) |
| 2.0x to 2.9x | 15 (10.6%) | 5 (100.0%) |
| 3.0x to 3.9x | 0 (0.0%) | 0 (0.0%) |
| 4.0x or more | 29 (20.4%) | 0 (0.0%) |
| Total | 142 (100.0%) | 5 (100.0%) |
Real Estate Taxes by Mortgage Status in Santa Maria
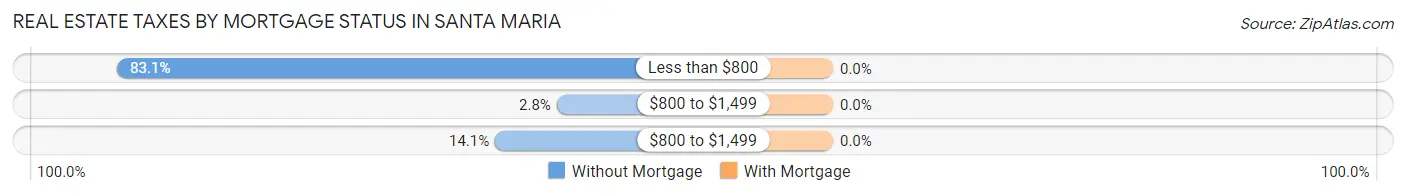
| Property Taxes | Without Mortgage | With Mortgage |
| Less than $800 | 118 (83.1%) | 0 (0.0%) |
| $800 to $1,499 | 4 (2.8%) | 0 (0.0%) |
| $800 to $1,499 | 20 (14.1%) | 0 (0.0%) |
| Total | 142 (100.0%) | 5 (100.0%) |
Health & Disability in Santa Maria
Health Insurance Coverage by Age in Santa Maria
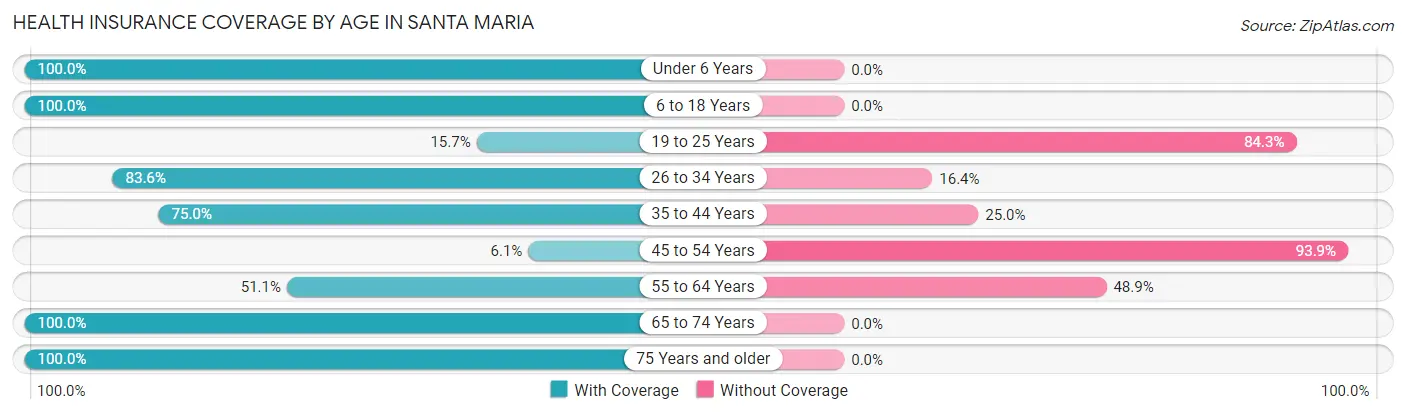
| Age Bracket | With Coverage | Without Coverage |
| Under 6 Years | 44 (100.0%) | 0 (0.0%) |
| 6 to 18 Years | 55 (100.0%) | 0 (0.0%) |
| 19 to 25 Years | 14 (15.7%) | 75 (84.3%) |
| 26 to 34 Years | 56 (83.6%) | 11 (16.4%) |
| 35 to 44 Years | 27 (75.0%) | 9 (25.0%) |
| 45 to 54 Years | 5 (6.1%) | 77 (93.9%) |
| 55 to 64 Years | 23 (51.1%) | 22 (48.9%) |
| 65 to 74 Years | 59 (100.0%) | 0 (0.0%) |
| 75 Years and older | 110 (100.0%) | 0 (0.0%) |
| Total | 393 (66.9%) | 194 (33.1%) |
Health Insurance Coverage by Citizenship Status in Santa Maria
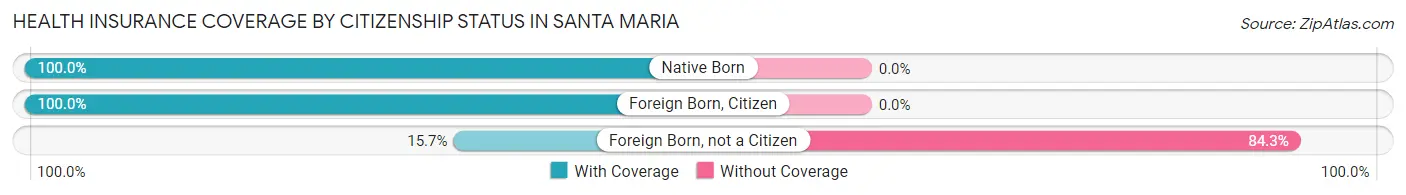
| Citizenship Status | With Coverage | Without Coverage |
| Native Born | 44 (100.0%) | 0 (0.0%) |
| Foreign Born, Citizen | 55 (100.0%) | 0 (0.0%) |
| Foreign Born, not a Citizen | 14 (15.7%) | 75 (84.3%) |
Health Insurance Coverage by Household Income in Santa Maria
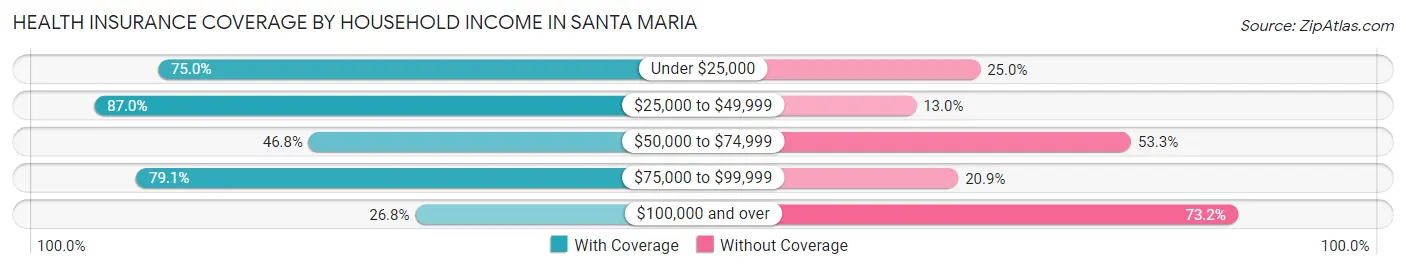
| Household Income | With Coverage | Without Coverage |
| Under $25,000 | 132 (75.0%) | 44 (25.0%) |
| $25,000 to $49,999 | 127 (87.0%) | 19 (13.0%) |
| $50,000 to $74,999 | 36 (46.8%) | 41 (53.2%) |
| $75,000 to $99,999 | 72 (79.1%) | 19 (20.9%) |
| $100,000 and over | 26 (26.8%) | 71 (73.2%) |
Public vs Private Health Insurance Coverage by Age in Santa Maria
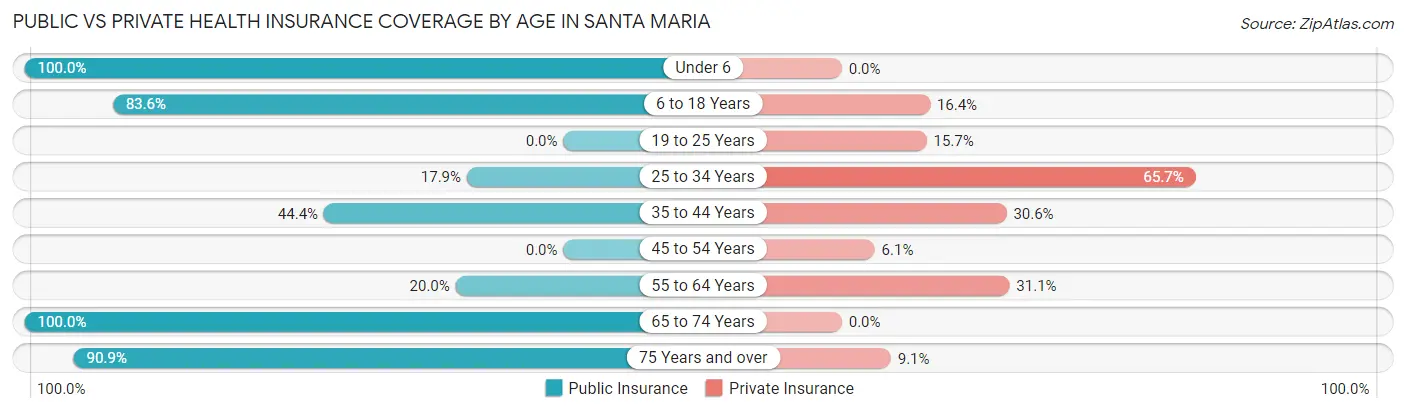
| Age Bracket | Public Insurance | Private Insurance |
| Under 6 | 44 (100.0%) | 0 (0.0%) |
| 6 to 18 Years | 46 (83.6%) | 9 (16.4%) |
| 19 to 25 Years | 0 (0.0%) | 14 (15.7%) |
| 25 to 34 Years | 12 (17.9%) | 44 (65.7%) |
| 35 to 44 Years | 16 (44.4%) | 11 (30.6%) |
| 45 to 54 Years | 0 (0.0%) | 5 (6.1%) |
| 55 to 64 Years | 9 (20.0%) | 14 (31.1%) |
| 65 to 74 Years | 59 (100.0%) | 0 (0.0%) |
| 75 Years and over | 100 (90.9%) | 10 (9.1%) |
| Total | 286 (48.7%) | 107 (18.2%) |
Disability Status by Sex by Age in Santa Maria
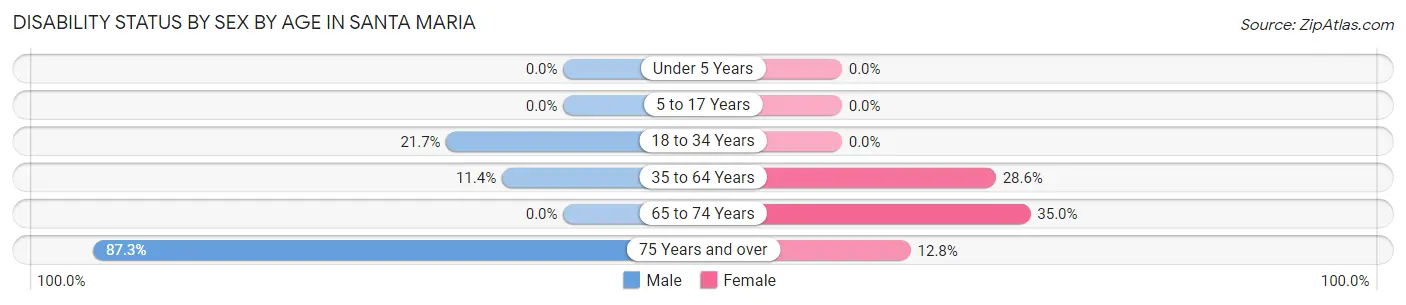
| Age Bracket | Male | Female |
| Under 5 Years | 0 (0.0%) | 0 (0.0%) |
| 5 to 17 Years | 0 (0.0%) | 0 (0.0%) |
| 18 to 34 Years | 23 (21.7%) | 0 (0.0%) |
| 35 to 64 Years | 9 (11.4%) | 24 (28.6%) |
| 65 to 74 Years | 0 (0.0%) | 14 (35.0%) |
| 75 Years and over | 55 (87.3%) | 6 (12.8%) |
Disability Class by Sex by Age in Santa Maria
Disability Class: Hearing Difficulty
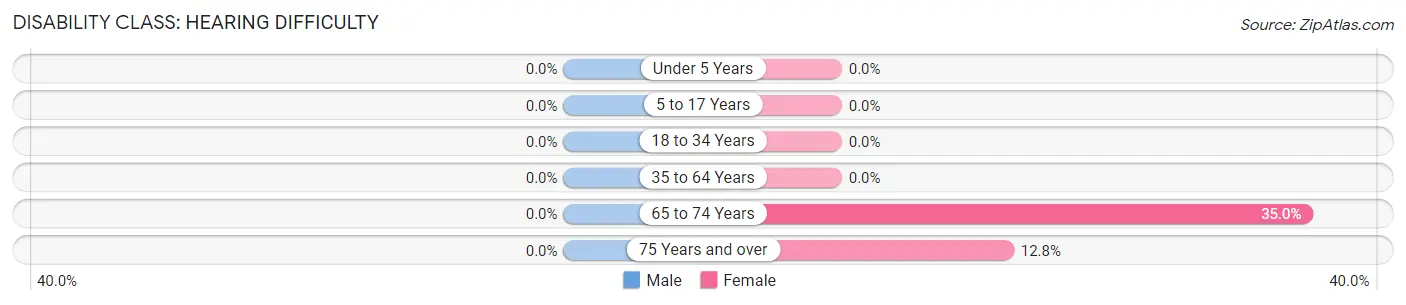
| Age Bracket | Male | Female |
| Under 5 Years | 0 (0.0%) | 0 (0.0%) |
| 5 to 17 Years | 0 (0.0%) | 0 (0.0%) |
| 18 to 34 Years | 0 (0.0%) | 0 (0.0%) |
| 35 to 64 Years | 0 (0.0%) | 0 (0.0%) |
| 65 to 74 Years | 0 (0.0%) | 14 (35.0%) |
| 75 Years and over | 0 (0.0%) | 6 (12.8%) |
Disability Class: Vision Difficulty
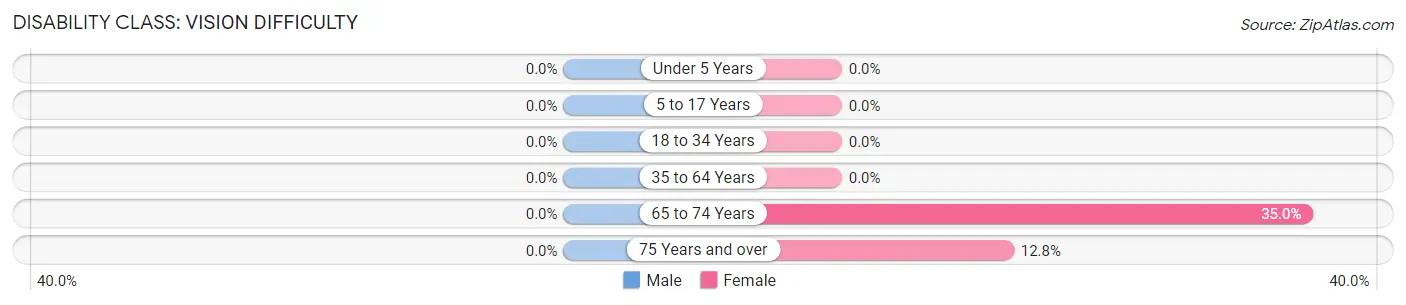
| Age Bracket | Male | Female |
| Under 5 Years | 0 (0.0%) | 0 (0.0%) |
| 5 to 17 Years | 0 (0.0%) | 0 (0.0%) |
| 18 to 34 Years | 0 (0.0%) | 0 (0.0%) |
| 35 to 64 Years | 0 (0.0%) | 0 (0.0%) |
| 65 to 74 Years | 0 (0.0%) | 14 (35.0%) |
| 75 Years and over | 0 (0.0%) | 6 (12.8%) |
Disability Class: Cognitive Difficulty
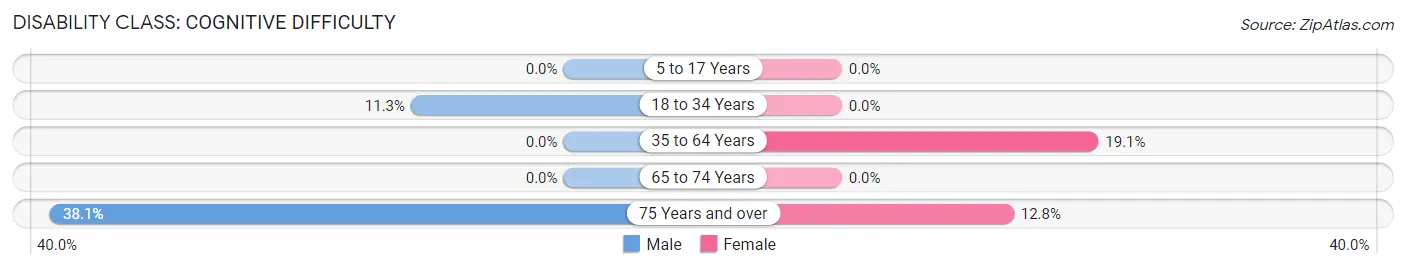
| Age Bracket | Male | Female |
| 5 to 17 Years | 0 (0.0%) | 0 (0.0%) |
| 18 to 34 Years | 12 (11.3%) | 0 (0.0%) |
| 35 to 64 Years | 0 (0.0%) | 16 (19.1%) |
| 65 to 74 Years | 0 (0.0%) | 0 (0.0%) |
| 75 Years and over | 24 (38.1%) | 6 (12.8%) |
Disability Class: Ambulatory Difficulty
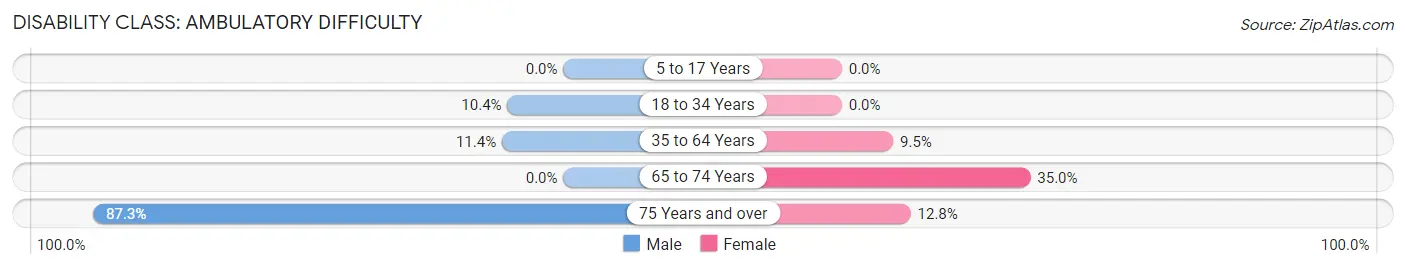
| Age Bracket | Male | Female |
| 5 to 17 Years | 0 (0.0%) | 0 (0.0%) |
| 18 to 34 Years | 11 (10.4%) | 0 (0.0%) |
| 35 to 64 Years | 9 (11.4%) | 8 (9.5%) |
| 65 to 74 Years | 0 (0.0%) | 14 (35.0%) |
| 75 Years and over | 55 (87.3%) | 6 (12.8%) |
Disability Class: Self-Care Difficulty
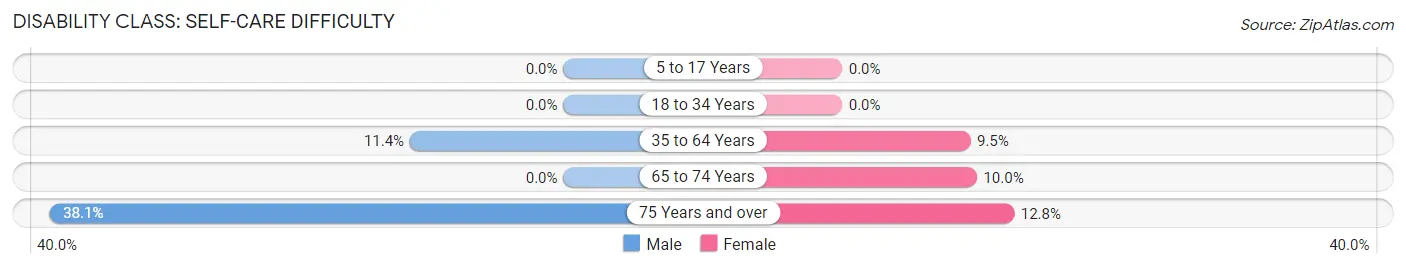
| Age Bracket | Male | Female |
| 5 to 17 Years | 0 (0.0%) | 0 (0.0%) |
| 18 to 34 Years | 0 (0.0%) | 0 (0.0%) |
| 35 to 64 Years | 9 (11.4%) | 8 (9.5%) |
| 65 to 74 Years | 0 (0.0%) | 4 (10.0%) |
| 75 Years and over | 24 (38.1%) | 6 (12.8%) |
Technology Access in Santa Maria
Computing Device Access in Santa Maria
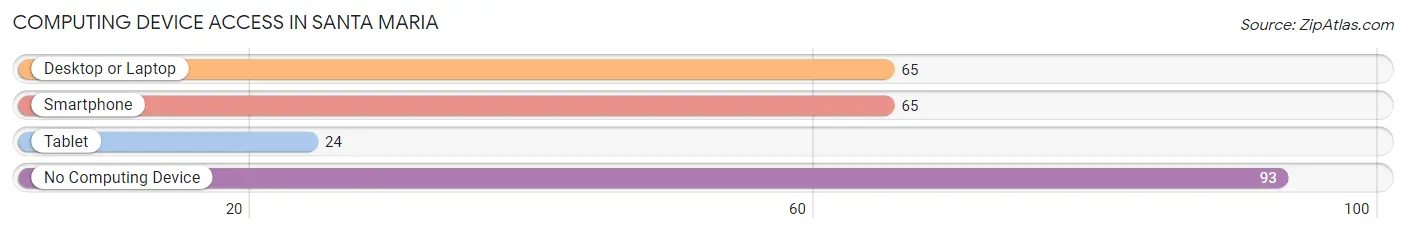
| Device Type | # Households | % Households |
| Desktop or Laptop | 65 | 39.2% |
| Smartphone | 65 | 39.2% |
| Tablet | 24 | 14.5% |
| No Computing Device | 93 | 56.0% |
| Total | 166 | 100.0% |
Internet Access in Santa Maria
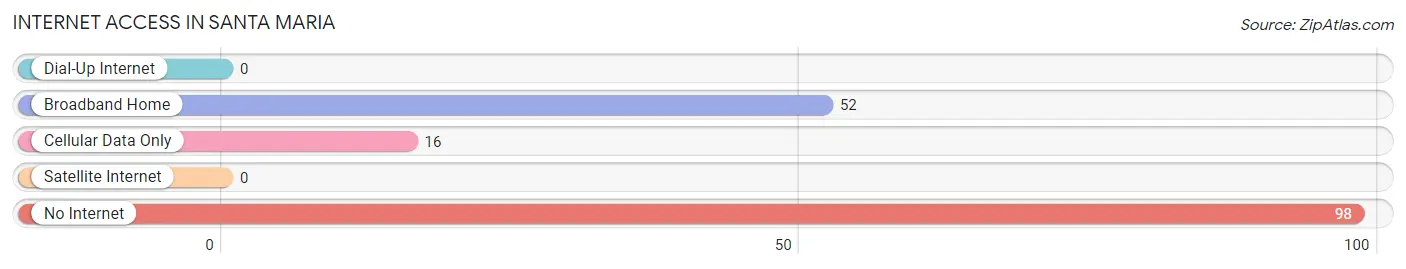
| Internet Type | # Households | % Households |
| Dial-Up Internet | 0 | 0.0% |
| Broadband Home | 52 | 31.3% |
| Cellular Data Only | 16 | 9.6% |
| Satellite Internet | 0 | 0.0% |
| No Internet | 98 | 59.0% |
| Total | 166 | 100.0% |
Santa Maria Summary
Santa Maria, Texas is a small town located in the Rio Grande Valley of South Texas. It is situated in Hidalgo County, approximately 20 miles south of McAllen and 30 miles north of Brownsville. The town was founded in 1848 by a group of Mexican settlers and was named after the nearby Santa Maria River. The population of Santa Maria was estimated to be 1,845 in 2019.
History
Santa Maria was founded in 1848 by a group of Mexican settlers who were looking for a place to settle and start a new life. The town was named after the nearby Santa Maria River. The settlers built a chapel and a school, and the town quickly grew. In 1852, the town was officially incorporated and the first mayor was elected.
In the late 1800s, Santa Maria was a thriving agricultural community. The town was known for its cotton, corn, and sugar cane production. The town also had a thriving cattle industry.
In the early 1900s, Santa Maria experienced a period of growth and development. The town was connected to the rest of the Rio Grande Valley by the St. Louis, Brownsville and Mexico Railway. This allowed for the transportation of goods and services to and from the town.
In the mid-1900s, Santa Maria experienced a period of decline. The town’s population decreased and the economy suffered. In the late 1900s, the town began to experience a period of revitalization. The town was connected to the rest of the Rio Grande Valley by the Santa Maria-McAllen Highway. This allowed for the transportation of goods and services to and from the town.
Geography
Santa Maria is located in the Rio Grande Valley of South Texas. It is situated in Hidalgo County, approximately 20 miles south of McAllen and 30 miles north of Brownsville. The town is located on the banks of the Santa Maria River. The town is surrounded by agricultural fields and is home to a variety of wildlife.
The climate in Santa Maria is subtropical and semi-arid. The average temperature in the summer is around 90 degrees Fahrenheit and the average temperature in the winter is around 70 degrees Fahrenheit. The town receives an average of 25 inches of rain per year.
Economy
Santa Maria’s economy is largely based on agriculture. The town is known for its cotton, corn, and sugar cane production. The town also has a thriving cattle industry.
In recent years, Santa Maria has experienced a period of economic growth. The town is home to a variety of businesses, including restaurants, retail stores, and medical facilities. The town is also home to a variety of manufacturing companies.
Demographics
The population of Santa Maria was estimated to be 1,845 in 2019. The town is predominantly Hispanic, with approximately 95% of the population identifying as Hispanic or Latino. The median household income in Santa Maria is $30,000. The town has a poverty rate of 28%.
Conclusion
Santa Maria, Texas is a small town located in the Rio Grande Valley of South Texas. It is situated in Hidalgo County, approximately 20 miles south of McAllen and 30 miles north of Brownsville. The town was founded in 1848 by a group of Mexican settlers and was named after the nearby Santa Maria River. The population of Santa Maria was estimated to be 1,845 in 2019. The town’s economy is largely based on agriculture and the town is home to a variety of businesses. The town is predominantly Hispanic, with approximately 95% of the population identifying as Hispanic or Latino.
Common Questions
What is Per Capita Income in Santa Maria?
Per Capita income in Santa Maria is $14,120.
What is the Median Household income in Santa Maria?
Median Household Income in Santa Maria is $30,156.
What is Income or Wage Gap in Santa Maria?
Income or Wage Gap in Santa Maria is 35.6%.
Women in Santa Maria earn 64.4 cents for every dollar earned by a man.
What is Inequality or Gini Index in Santa Maria?
Inequality or Gini Index in Santa Maria is 0.44.
What is the Total Population of Santa Maria?
Total Population of Santa Maria is 587.
What is the Total Male Population of Santa Maria?
Total Male Population of Santa Maria is 301.
What is the Total Female Population of Santa Maria?
Total Female Population of Santa Maria is 286.
What is the Ratio of Males per 100 Females in Santa Maria?
There are 105.24 Males per 100 Females in Santa Maria.
What is the Ratio of Females per 100 Males in Santa Maria?
There are 95.02 Females per 100 Males in Santa Maria.
What is the Median Population Age in Santa Maria?
Median Population Age in Santa Maria is 48.3 Years.
What is the Average Family Size in Santa Maria
Average Family Size in Santa Maria is 4.0 People.
What is the Average Household Size in Santa Maria
Average Household Size in Santa Maria is 3.5 People.
How Large is the Labor Force in Santa Maria?
There are 196 People in the Labor Forcein in Santa Maria.
What is the Percentage of People in the Labor Force in Santa Maria?
37.9% of People are in the Labor Force in Santa Maria.