Sanger, TX Map & Demographics
Sanger Map
Sanger Overview
$37,181
PER CAPITA INCOME
$106,875
AVG FAMILY INCOME
$86,083
AVG HOUSEHOLD INCOME
38.9%
WAGE / INCOME GAP [ % ]
61.1¢/ $1
WAGE / INCOME GAP [ $ ]
0.33
INEQUALITY / GINI INDEX
9,041
TOTAL POPULATION
4,700
MALE POPULATION
4,341
FEMALE POPULATION
108.27
MALES / 100 FEMALES
92.36
FEMALES / 100 MALES
31.8
MEDIAN AGE
3.3
AVG FAMILY SIZE
2.7
AVG HOUSEHOLD SIZE
4,968
LABOR FORCE [ PEOPLE ]
74.6%
PERCENT IN LABOR FORCE
1.8%
UNEMPLOYMENT RATE
Sanger Zip Codes
Sanger Area Codes
Income in Sanger
Income Overview in Sanger
Per Capita Income in Sanger is $37,181, while median incomes of families and households are $106,875 and $86,083 respectively.
| Characteristic | Number | Measure |
| Per Capita Income | 9,041 | $37,181 |
| Median Family Income | 2,226 | $106,875 |
| Mean Family Income | 2,226 | $114,306 |
| Median Household Income | 3,371 | $86,083 |
| Mean Household Income | 3,371 | $97,327 |
| Income Deficit | 2,226 | $0 |
| Wage / Income Gap (%) | 9,041 | 38.93% |
| Wage / Income Gap ($) | 9,041 | 61.07¢ per $1 |
| Gini / Inequality Index | 9,041 | 0.33 |
Earnings by Sex in Sanger
Average Earnings in Sanger are $45,467, $59,720 for men and $36,471 for women, a difference of 38.9%.
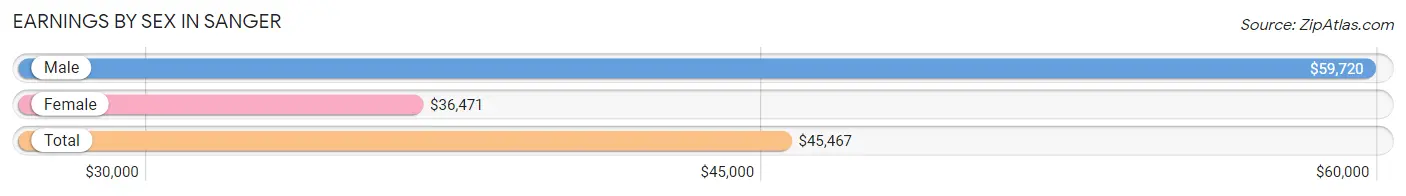
| Sex | Number | Average Earnings |
| Male | 2,698 (52.4%) | $59,720 |
| Female | 2,448 (47.6%) | $36,471 |
| Total | 5,146 (100.0%) | $45,467 |
Earnings by Sex by Income Bracket in Sanger
The most common earnings brackets in Sanger are $75,000 to $99,999 for men (425 | 15.8%) and $30,000 to $34,999 for women (245 | 10.0%).
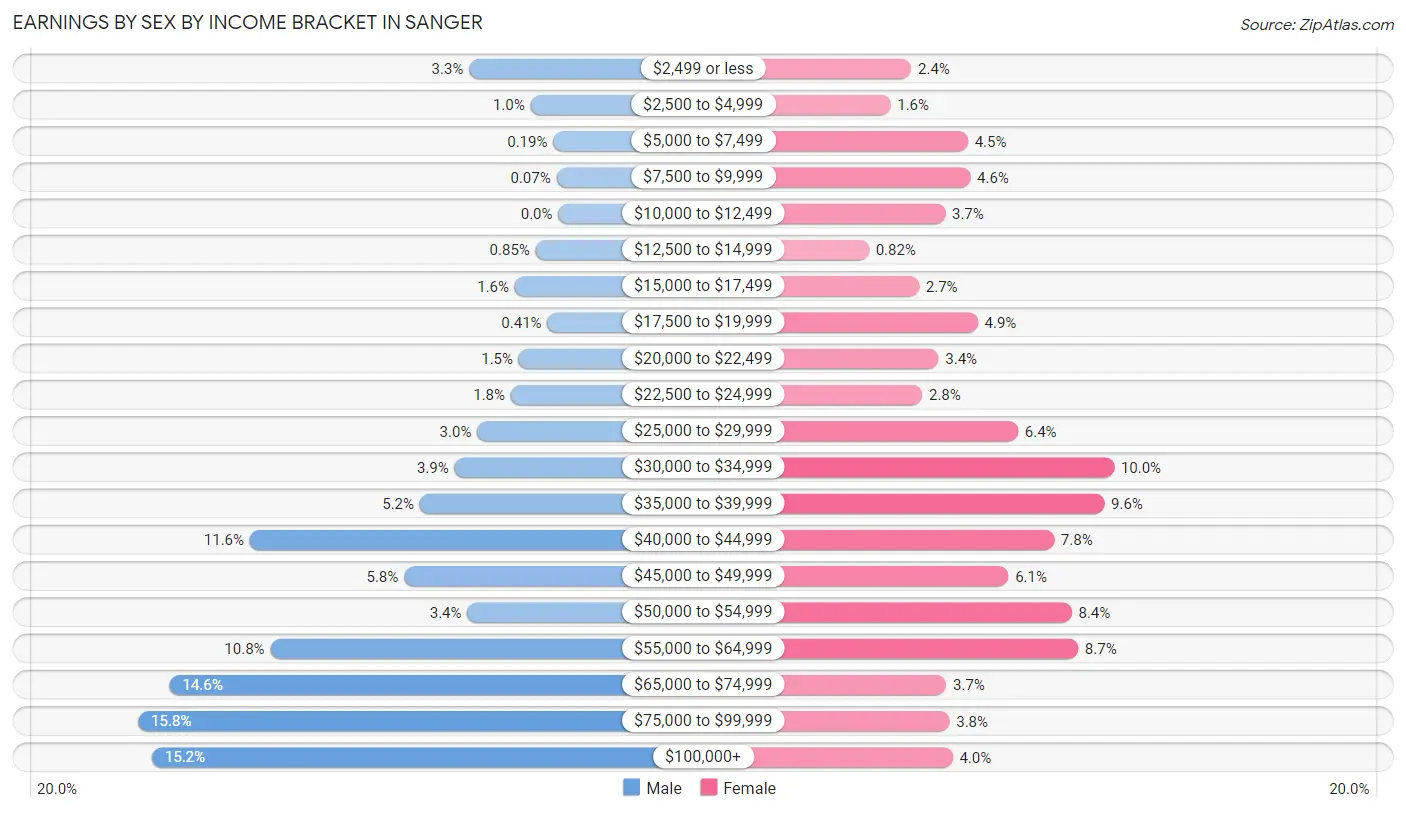
| Income | Male | Female |
| $2,499 or less | 90 (3.3%) | 59 (2.4%) |
| $2,500 to $4,999 | 28 (1.0%) | 40 (1.6%) |
| $5,000 to $7,499 | 5 (0.2%) | 111 (4.5%) |
| $7,500 to $9,999 | 2 (0.1%) | 113 (4.6%) |
| $10,000 to $12,499 | 0 (0.0%) | 90 (3.7%) |
| $12,500 to $14,999 | 23 (0.9%) | 20 (0.8%) |
| $15,000 to $17,499 | 44 (1.6%) | 66 (2.7%) |
| $17,500 to $19,999 | 11 (0.4%) | 120 (4.9%) |
| $20,000 to $22,499 | 40 (1.5%) | 84 (3.4%) |
| $22,500 to $24,999 | 48 (1.8%) | 69 (2.8%) |
| $25,000 to $29,999 | 82 (3.0%) | 157 (6.4%) |
| $30,000 to $34,999 | 105 (3.9%) | 245 (10.0%) |
| $35,000 to $39,999 | 140 (5.2%) | 236 (9.6%) |
| $40,000 to $44,999 | 312 (11.6%) | 190 (7.8%) |
| $45,000 to $49,999 | 156 (5.8%) | 148 (6.0%) |
| $50,000 to $54,999 | 92 (3.4%) | 206 (8.4%) |
| $55,000 to $64,999 | 291 (10.8%) | 212 (8.7%) |
| $65,000 to $74,999 | 393 (14.6%) | 91 (3.7%) |
| $75,000 to $99,999 | 425 (15.8%) | 94 (3.8%) |
| $100,000+ | 411 (15.2%) | 97 (4.0%) |
| Total | 2,698 (100.0%) | 2,448 (100.0%) |
Earnings by Sex by Educational Attainment in Sanger
Average earnings in Sanger are $67,351 for men and $40,585 for women, a difference of 39.7%. Men with an educational attainment of bachelor's degree enjoy the highest average annual earnings of $74,167, while those with less than high school education earn the least with $36,786. Women with an educational attainment of graduate degree earn the most with the average annual earnings of $54,000, while those with high school diploma education have the smallest earnings of $33,011.
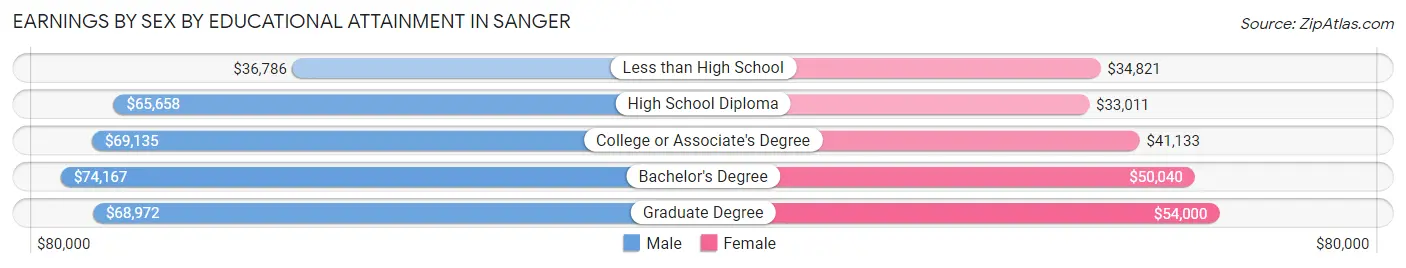
| Educational Attainment | Male Income | Female Income |
| Less than High School | $36,786 | $34,821 |
| High School Diploma | $65,658 | $33,011 |
| College or Associate's Degree | $69,135 | $41,133 |
| Bachelor's Degree | $74,167 | $50,040 |
| Graduate Degree | $68,972 | $54,000 |
| Total | $67,351 | $40,585 |
Family Income in Sanger
Family Income Brackets in Sanger
According to the Sanger family income data, there are 717 families falling into the $100,000 to $149,999 income range, which is the most common income bracket and makes up 32.2% of all families.
| Income Bracket | # Families | % Families |
| Less than $10,000 | 9 | 0.4% |
| $10,000 to $14,999 | 0 | 0.0% |
| $15,000 to $24,999 | 62 | 2.8% |
| $25,000 to $34,999 | 42 | 1.9% |
| $35,000 to $49,999 | 247 | 11.1% |
| $50,000 to $74,999 | 245 | 11.0% |
| $75,000 to $99,999 | 387 | 17.4% |
| $100,000 to $149,999 | 717 | 32.2% |
| $150,000 to $199,999 | 296 | 13.3% |
| $200,000+ | 218 | 9.8% |
Family Income by Famaliy Size in Sanger
6-person families (182 | 8.2%) account for the highest median family income in Sanger with $250,001 per family, while 2-person families (909 | 40.8%) have the highest median income of $50,382 per family member.
| Income Bracket | # Families | Median Income |
| 2-Person Families | 909 (40.8%) | $100,764 |
| 3-Person Families | 540 (24.3%) | $110,345 |
| 4-Person Families | 400 (18.0%) | $102,386 |
| 5-Person Families | 159 (7.1%) | $70,625 |
| 6-Person Families | 182 (8.2%) | $250,001 |
| 7+ Person Families | 36 (1.6%) | $0 |
| Total | 2,226 (100.0%) | $106,875 |
Family Income by Number of Earners in Sanger
The median family income in Sanger is $106,875, with families comprising 3+ earners (184) having the highest median family income of $128,942, while families with no earners (151) have the lowest median family income of $55,433, accounting for 8.3% and 6.8% of families, respectively.
| Number of Earners | # Families | Median Income |
| No Earners | 151 (6.8%) | $55,433 |
| 1 Earner | 722 (32.4%) | $80,116 |
| 2 Earners | 1,169 (52.5%) | $122,468 |
| 3+ Earners | 184 (8.3%) | $128,942 |
| Total | 2,226 (100.0%) | $106,875 |
Household Income in Sanger
Household Income Brackets in Sanger
With 890 households falling in the category, the $100,000 to $149,999 income range is the most frequent in Sanger, accounting for 26.4% of all households. In contrast, only 47 households (1.4%) fall into the less than $10,000 income bracket, making it the least populous group.
| Income Bracket | # Households | % Households |
| Less than $10,000 | 47 | 1.4% |
| $10,000 to $14,999 | 47 | 1.4% |
| $15,000 to $24,999 | 138 | 4.1% |
| $25,000 to $34,999 | 105 | 3.1% |
| $35,000 to $49,999 | 479 | 14.2% |
| $50,000 to $74,999 | 597 | 17.7% |
| $75,000 to $99,999 | 519 | 15.4% |
| $100,000 to $149,999 | 890 | 26.4% |
| $150,000 to $199,999 | 334 | 9.9% |
| $200,000+ | 219 | 6.5% |
Household Income by Householder Age in Sanger
The median household income in Sanger is $86,083, with the highest median household income of $101,141 found in the 45 to 64 years age bracket for the primary householder. A total of 1,150 households (34.1%) fall into this category. Meanwhile, the 65+ years age bracket for the primary householder has the lowest median household income of $55,238, with 530 households (15.7%) in this group.
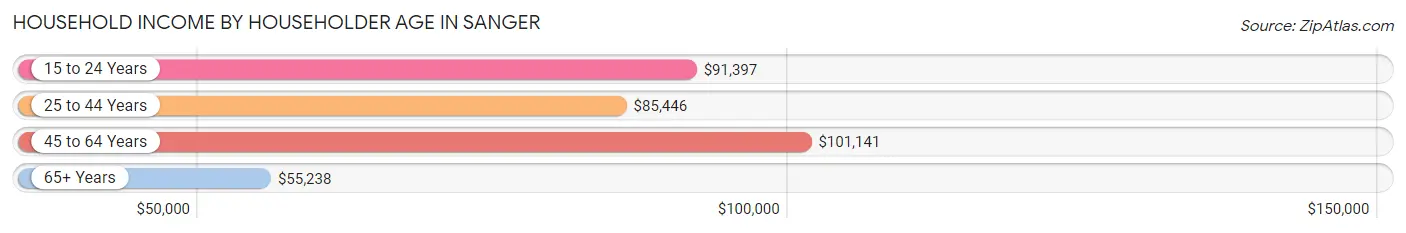
| Income Bracket | # Households | Median Income |
| 15 to 24 Years | 293 (8.7%) | $91,397 |
| 25 to 44 Years | 1,398 (41.5%) | $85,446 |
| 45 to 64 Years | 1,150 (34.1%) | $101,141 |
| 65+ Years | 530 (15.7%) | $55,238 |
| Total | 3,371 (100.0%) | $86,083 |
Poverty in Sanger
Income Below Poverty by Sex and Age in Sanger
With 3.2% poverty level for males and 7.1% for females among the residents of Sanger, 6 to 11 year old males and 45 to 54 year old females are the most vulnerable to poverty, with 35 males (10.8%) and 77 females (19.2%) in their respective age groups living below the poverty level.
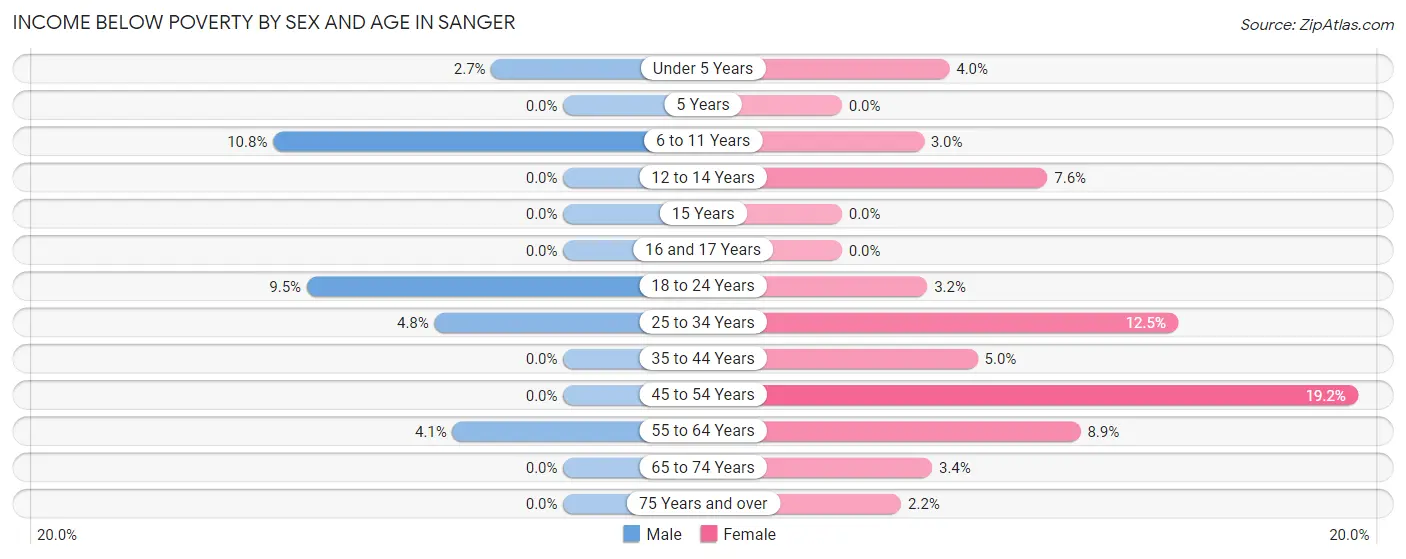
| Age Bracket | Male | Female |
| Under 5 Years | 15 (2.7%) | 14 (4.0%) |
| 5 Years | 0 (0.0%) | 0 (0.0%) |
| 6 to 11 Years | 35 (10.8%) | 9 (3.0%) |
| 12 to 14 Years | 0 (0.0%) | 9 (7.6%) |
| 15 Years | 0 (0.0%) | 0 (0.0%) |
| 16 and 17 Years | 0 (0.0%) | 0 (0.0%) |
| 18 to 24 Years | 36 (9.5%) | 16 (3.2%) |
| 25 to 34 Years | 42 (4.8%) | 94 (12.5%) |
| 35 to 44 Years | 0 (0.0%) | 34 (5.0%) |
| 45 to 54 Years | 0 (0.0%) | 77 (19.2%) |
| 55 to 64 Years | 21 (4.1%) | 38 (8.9%) |
| 65 to 74 Years | 0 (0.0%) | 13 (3.4%) |
| 75 Years and over | 0 (0.0%) | 5 (2.2%) |
| Total | 149 (3.2%) | 309 (7.1%) |
Income Above Poverty by Sex and Age in Sanger
According to the poverty statistics in Sanger, males aged 5 years and females aged 5 years are the age groups that are most secure financially, with 100.0% of males and 100.0% of females in these age groups living above the poverty line.
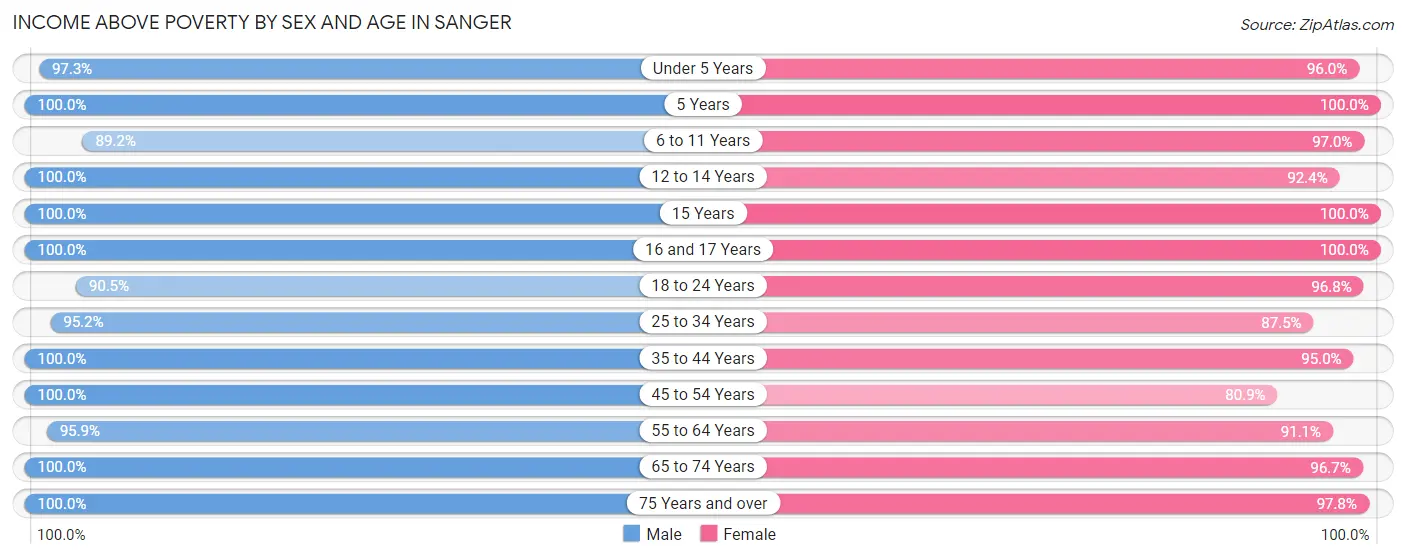
| Age Bracket | Male | Female |
| Under 5 Years | 547 (97.3%) | 337 (96.0%) |
| 5 Years | 238 (100.0%) | 102 (100.0%) |
| 6 to 11 Years | 290 (89.2%) | 287 (97.0%) |
| 12 to 14 Years | 279 (100.0%) | 109 (92.4%) |
| 15 Years | 21 (100.0%) | 68 (100.0%) |
| 16 and 17 Years | 17 (100.0%) | 27 (100.0%) |
| 18 to 24 Years | 342 (90.5%) | 488 (96.8%) |
| 25 to 34 Years | 836 (95.2%) | 660 (87.5%) |
| 35 to 44 Years | 750 (100.0%) | 641 (95.0%) |
| 45 to 54 Years | 353 (100.0%) | 325 (80.8%) |
| 55 to 64 Years | 490 (95.9%) | 391 (91.1%) |
| 65 to 74 Years | 206 (100.0%) | 375 (96.7%) |
| 75 Years and over | 161 (100.0%) | 222 (97.8%) |
| Total | 4,530 (96.8%) | 4,032 (92.9%) |
Income Below Poverty Among Married-Couple Families in Sanger
The poverty statistics for married-couple families in Sanger show that 0.8% or 15 of the total 1,802 families live below the poverty line. Families with 1 or 2 children have the highest poverty rate of 2.2%, comprising of 15 families. On the other hand, families with no children have the lowest poverty rate of 0.0%, which includes 0 families.
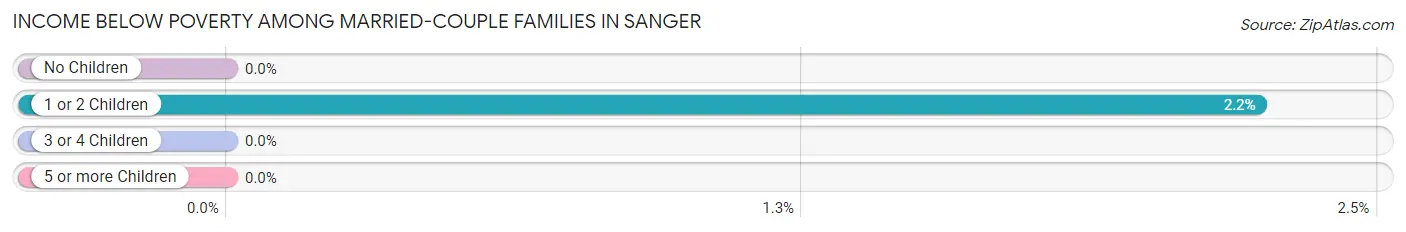
| Children | Above Poverty | Below Poverty |
| No Children | 856 (100.0%) | 0 (0.0%) |
| 1 or 2 Children | 655 (97.8%) | 15 (2.2%) |
| 3 or 4 Children | 266 (100.0%) | 0 (0.0%) |
| 5 or more Children | 10 (100.0%) | 0 (0.0%) |
| Total | 1,787 (99.2%) | 15 (0.8%) |
Income Below Poverty Among Single-Parent Households in Sanger
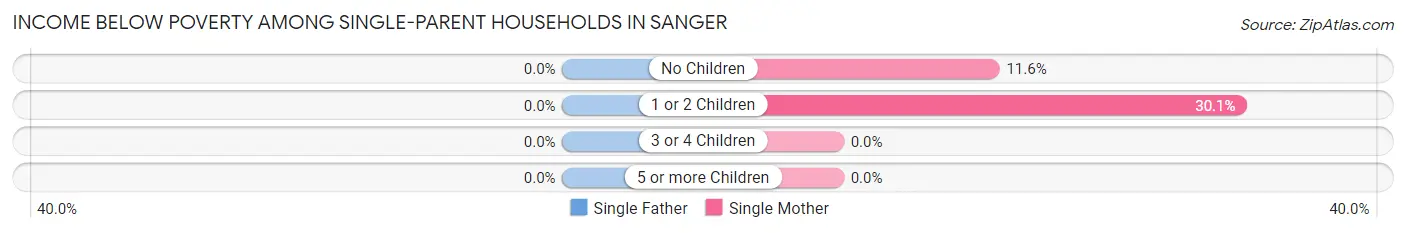
| Children | Single Father | Single Mother |
| No Children | 0 (0.0%) | 18 (11.6%) |
| 1 or 2 Children | 0 (0.0%) | 43 (30.1%) |
| 3 or 4 Children | 0 (0.0%) | 0 (0.0%) |
| 5 or more Children | 0 (0.0%) | 0 (0.0%) |
| Total | 0 (0.0%) | 61 (20.0%) |
Income Below Poverty Among Married-Couple vs Single-Parent Households in Sanger
The poverty data for Sanger shows that 15 of the married-couple family households (0.8%) and 61 of the single-parent households (14.4%) are living below the poverty level. Within the married-couple family households, those with 1 or 2 children have the highest poverty rate, with 15 households (2.2%) falling below the poverty line. Among the single-parent households, those with 1 or 2 children have the highest poverty rate, with 43 household (20.5%) living below poverty.
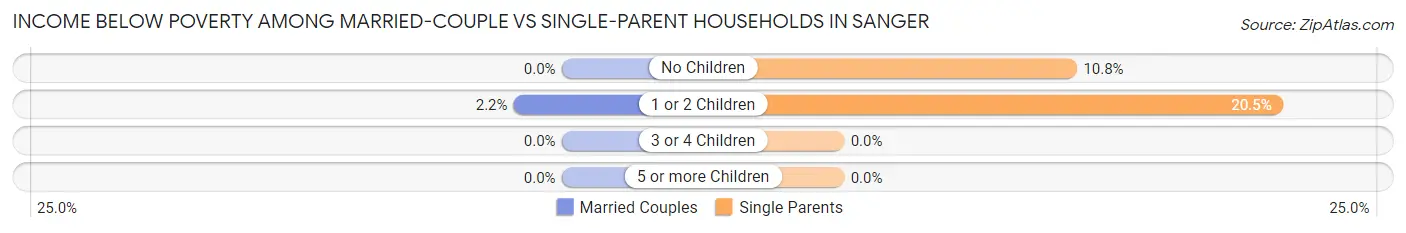
| Children | Married-Couple Families | Single-Parent Households |
| No Children | 0 (0.0%) | 18 (10.8%) |
| 1 or 2 Children | 15 (2.2%) | 43 (20.5%) |
| 3 or 4 Children | 0 (0.0%) | 0 (0.0%) |
| 5 or more Children | 0 (0.0%) | 0 (0.0%) |
| Total | 15 (0.8%) | 61 (14.4%) |
Race in Sanger
The most populous races in Sanger are White / Caucasian (7,330 | 81.1%), Hispanic or Latino (1,920 | 21.2%), and Two or more Races (1,027 | 11.4%).
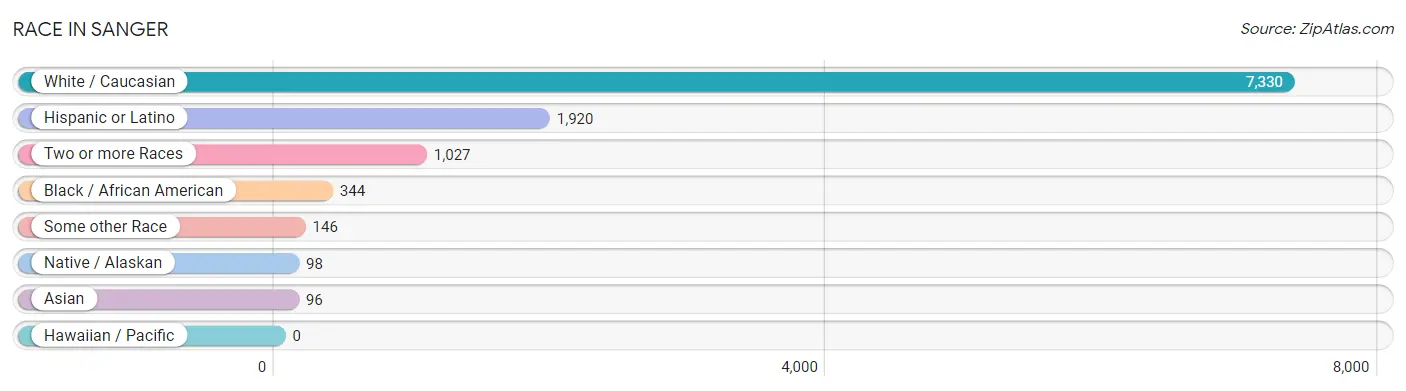
| Race | # Population | % Population |
| Asian | 96 | 1.1% |
| Black / African American | 344 | 3.8% |
| Hawaiian / Pacific | 0 | 0.0% |
| Hispanic or Latino | 1,920 | 21.2% |
| Native / Alaskan | 98 | 1.1% |
| White / Caucasian | 7,330 | 81.1% |
| Two or more Races | 1,027 | 11.4% |
| Some other Race | 146 | 1.6% |
| Total | 9,041 | 100.0% |
Ancestry in Sanger
The most populous ancestries reported in Sanger are Mexican (1,742 | 19.3%), German (1,573 | 17.4%), English (1,136 | 12.6%), American (1,022 | 11.3%), and Irish (840 | 9.3%), together accounting for 69.8% of all Sanger residents.
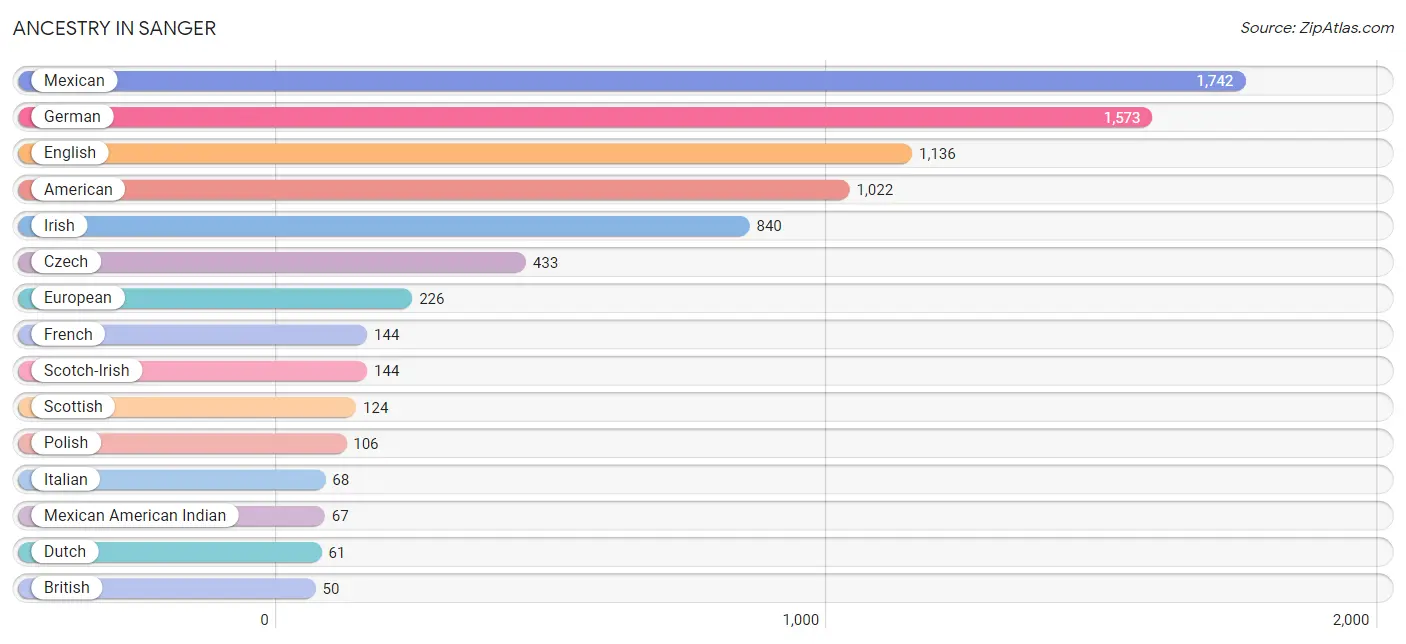
| Ancestry | # Population | % Population |
| African | 21 | 0.2% |
| American | 1,022 | 11.3% |
| Apache | 29 | 0.3% |
| Barbadian | 31 | 0.3% |
| Belgian | 24 | 0.3% |
| Bhutanese | 44 | 0.5% |
| Blackfeet | 12 | 0.1% |
| British | 50 | 0.5% |
| Canadian | 5 | 0.1% |
| Central American | 19 | 0.2% |
| Cherokee | 35 | 0.4% |
| Chickasaw | 7 | 0.1% |
| Choctaw | 4 | 0.0% |
| Colombian | 12 | 0.1% |
| Czech | 433 | 4.8% |
| Dutch | 61 | 0.7% |
| English | 1,136 | 12.6% |
| European | 226 | 2.5% |
| French | 144 | 1.6% |
| French Canadian | 12 | 0.1% |
| German | 1,573 | 17.4% |
| Guatemalan | 19 | 0.2% |
| Irish | 840 | 9.3% |
| Italian | 68 | 0.7% |
| Jamaican | 31 | 0.3% |
| Mexican | 1,742 | 19.3% |
| Mexican American Indian | 67 | 0.7% |
| Norwegian | 31 | 0.3% |
| Osage | 11 | 0.1% |
| Polish | 106 | 1.2% |
| Portuguese | 38 | 0.4% |
| Puerto Rican | 35 | 0.4% |
| Scandinavian | 26 | 0.3% |
| Scotch-Irish | 144 | 1.6% |
| Scottish | 124 | 1.4% |
| South American | 12 | 0.1% |
| Spaniard | 34 | 0.4% |
| Sri Lankan | 47 | 0.5% |
| Subsaharan African | 21 | 0.2% |
| Swiss | 18 | 0.2% |
| Welsh | 10 | 0.1% | View All 41 Rows |
Immigrants in Sanger
The most numerous immigrant groups reported in Sanger came from Central America (245 | 2.7%), Latin America (245 | 2.7%), Mexico (245 | 2.7%), Africa (60 | 0.7%), and Europe (35 | 0.4%), together accounting for 9.2% of all Sanger residents.
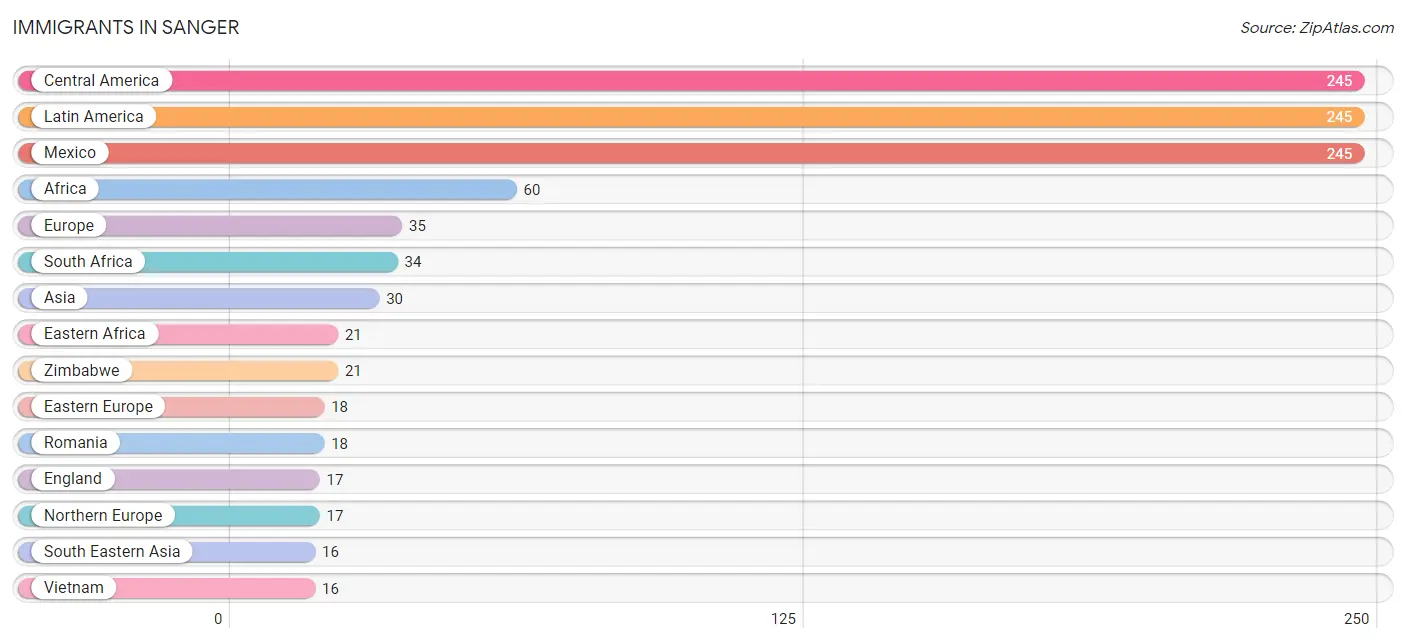
| Immigration Origin | # Population | % Population |
| Africa | 60 | 0.7% |
| Asia | 30 | 0.3% |
| Central America | 245 | 2.7% |
| Eastern Africa | 21 | 0.2% |
| Eastern Europe | 18 | 0.2% |
| England | 17 | 0.2% |
| Europe | 35 | 0.4% |
| Latin America | 245 | 2.7% |
| Mexico | 245 | 2.7% |
| Northern Europe | 17 | 0.2% |
| Pakistan | 14 | 0.2% |
| Romania | 18 | 0.2% |
| South Africa | 34 | 0.4% |
| South Central Asia | 14 | 0.2% |
| South Eastern Asia | 16 | 0.2% |
| Vietnam | 16 | 0.2% |
| Zimbabwe | 21 | 0.2% | View All 17 Rows |
Sex and Age in Sanger
Sex and Age in Sanger
The most populous age groups in Sanger are Under 5 Years (583 | 12.4%) for men and 30 to 34 Years (391 | 9.0%) for women.
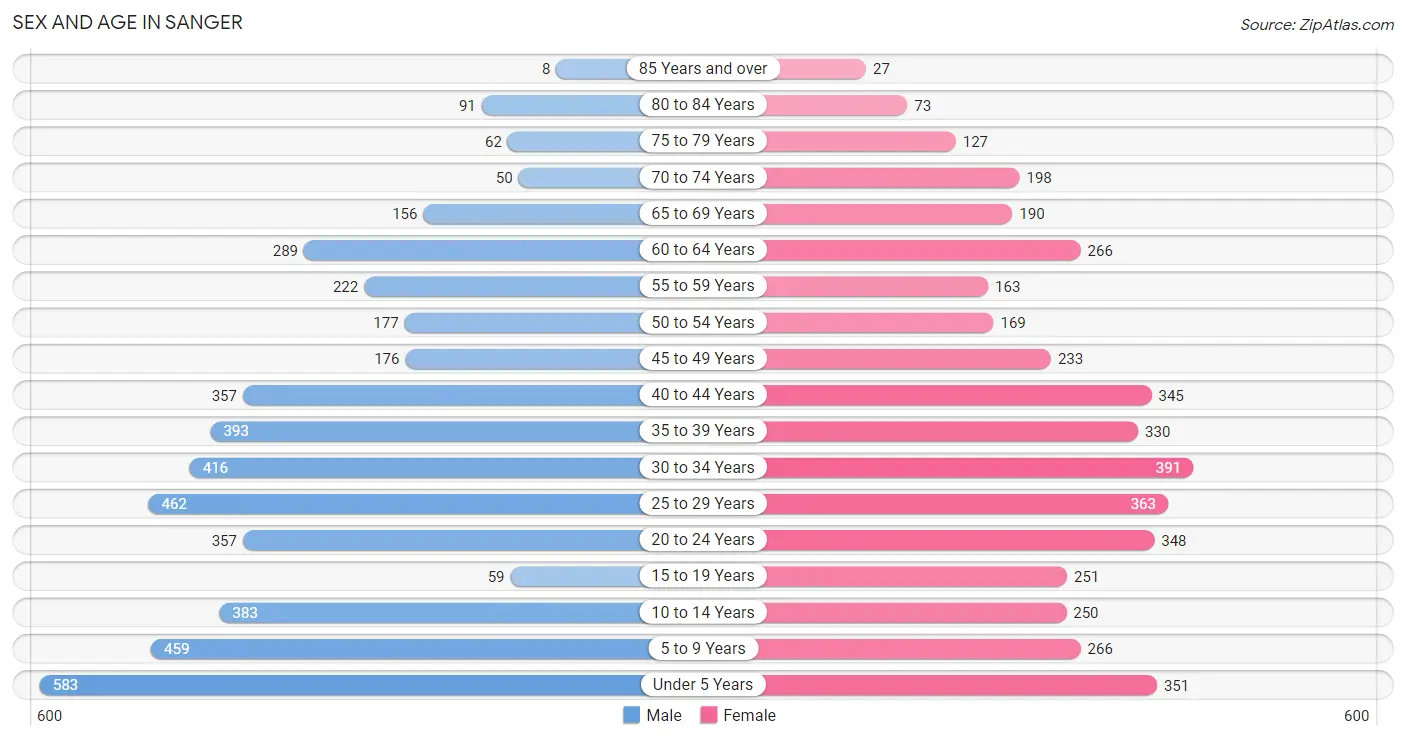
| Age Bracket | Male | Female |
| Under 5 Years | 583 (12.4%) | 351 (8.1%) |
| 5 to 9 Years | 459 (9.8%) | 266 (6.1%) |
| 10 to 14 Years | 383 (8.2%) | 250 (5.8%) |
| 15 to 19 Years | 59 (1.3%) | 251 (5.8%) |
| 20 to 24 Years | 357 (7.6%) | 348 (8.0%) |
| 25 to 29 Years | 462 (9.8%) | 363 (8.4%) |
| 30 to 34 Years | 416 (8.8%) | 391 (9.0%) |
| 35 to 39 Years | 393 (8.4%) | 330 (7.6%) |
| 40 to 44 Years | 357 (7.6%) | 345 (8.0%) |
| 45 to 49 Years | 176 (3.7%) | 233 (5.4%) |
| 50 to 54 Years | 177 (3.8%) | 169 (3.9%) |
| 55 to 59 Years | 222 (4.7%) | 163 (3.7%) |
| 60 to 64 Years | 289 (6.1%) | 266 (6.1%) |
| 65 to 69 Years | 156 (3.3%) | 190 (4.4%) |
| 70 to 74 Years | 50 (1.1%) | 198 (4.6%) |
| 75 to 79 Years | 62 (1.3%) | 127 (2.9%) |
| 80 to 84 Years | 91 (1.9%) | 73 (1.7%) |
| 85 Years and over | 8 (0.2%) | 27 (0.6%) |
| Total | 4,700 (100.0%) | 4,341 (100.0%) |
Families and Households in Sanger
Median Family Size in Sanger
The median family size in Sanger is 3.28 persons per family, with married-couple families (1,802 | 80.9%) accounting for the largest median family size of 3.39 persons per family. On the other hand, single female/mother families (305 | 13.7%) represent the smallest median family size with 2.65 persons per family.
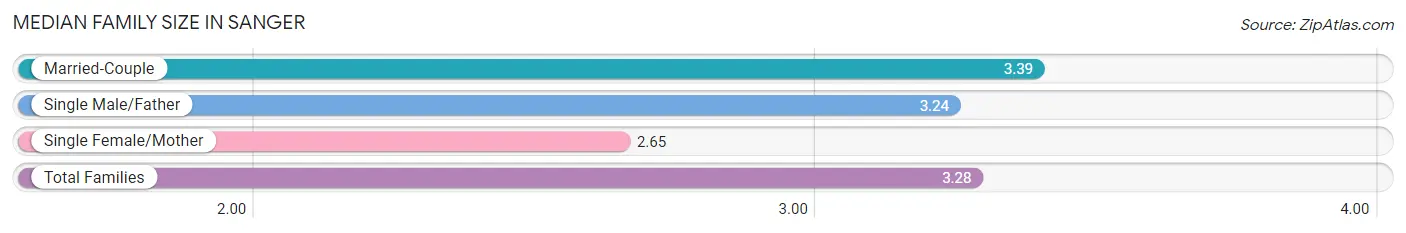
| Family Type | # Families | Family Size |
| Married-Couple | 1,802 (80.9%) | 3.39 |
| Single Male/Father | 119 (5.3%) | 3.24 |
| Single Female/Mother | 305 (13.7%) | 2.65 |
| Total Families | 2,226 (100.0%) | 3.28 |
Median Household Size in Sanger
The median household size in Sanger is 2.68 persons per household, with single male/father households (119 | 3.5%) accounting for the largest median household size of 3.59 persons per household. non-family households (1,145 | 34.0%) represent the smallest median household size with 1.31 persons per household.
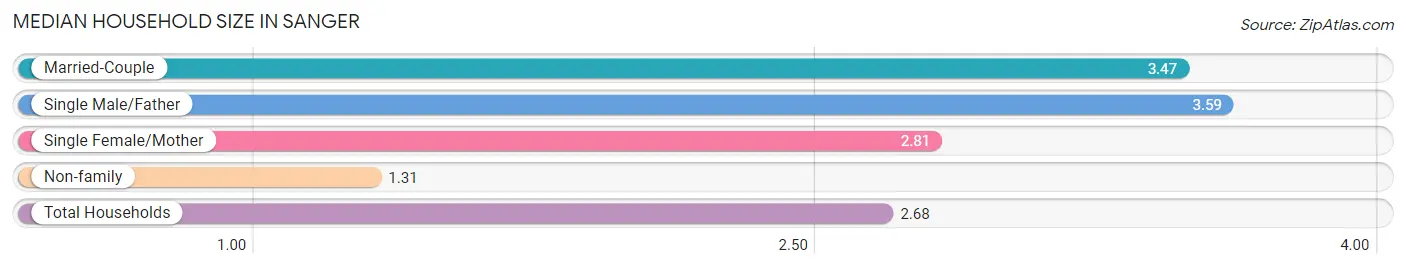
| Household Type | # Households | Household Size |
| Married-Couple | 1,802 (53.5%) | 3.47 |
| Single Male/Father | 119 (3.5%) | 3.59 |
| Single Female/Mother | 305 (9.0%) | 2.81 |
| Non-family | 1,145 (34.0%) | 1.31 |
| Total Households | 3,371 (100.0%) | 2.68 |
Household Size by Marriage Status in Sanger
Out of a total of 3,371 households in Sanger, 2,226 (66.0%) are family households, while 1,145 (34.0%) are nonfamily households. The most numerous type of family households are 2-person households, comprising 803, and the most common type of nonfamily households are 1-person households, comprising 882.
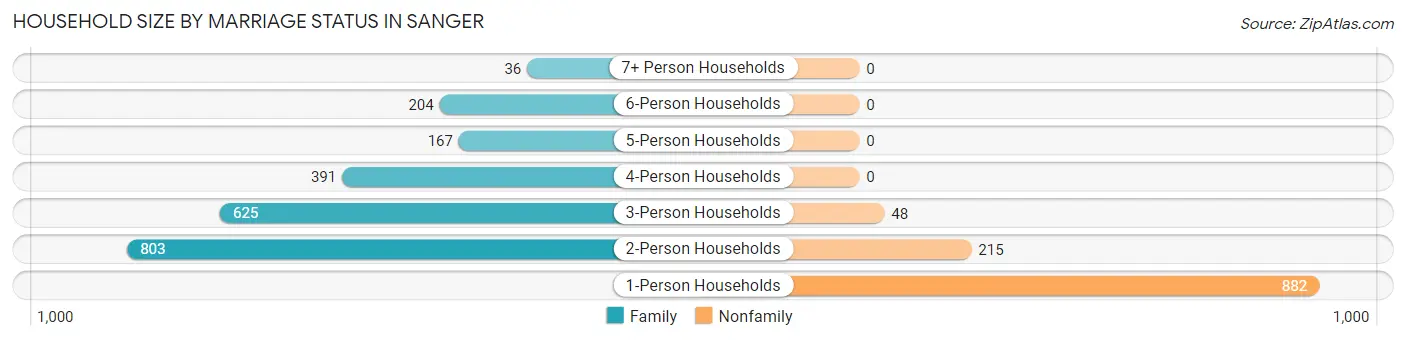
| Household Size | Family Households | Nonfamily Households |
| 1-Person Households | - | 882 (26.2%) |
| 2-Person Households | 803 (23.8%) | 215 (6.4%) |
| 3-Person Households | 625 (18.5%) | 48 (1.4%) |
| 4-Person Households | 391 (11.6%) | 0 (0.0%) |
| 5-Person Households | 167 (5.0%) | 0 (0.0%) |
| 6-Person Households | 204 (6.0%) | 0 (0.0%) |
| 7+ Person Households | 36 (1.1%) | 0 (0.0%) |
| Total | 2,226 (66.0%) | 1,145 (34.0%) |
Female Fertility in Sanger
Fertility by Age in Sanger
Average fertility rate in Sanger is 53.0 births per 1,000 women. Women in the age bracket of 35 to 50 years have the highest fertility rate with 105.0 births per 1,000 women. Women in the age bracket of 35 to 50 years acount for 81.1% of all women with births.
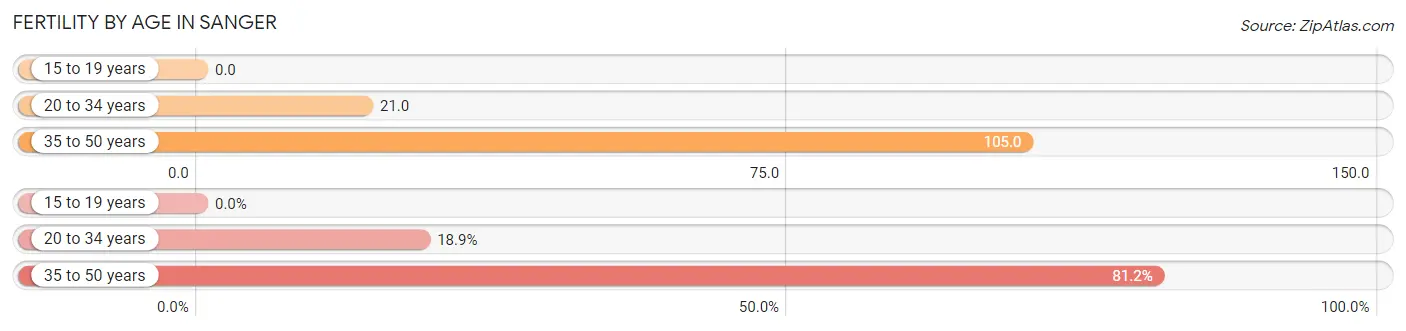
| Age Bracket | Women with Births | Births / 1,000 Women |
| 15 to 19 years | 0 (0.0%) | 0.0 |
| 20 to 34 years | 23 (18.9%) | 21.0 |
| 35 to 50 years | 99 (81.1%) | 105.0 |
| Total | 122 (100.0%) | 53.0 |
Fertility by Age by Marriage Status in Sanger
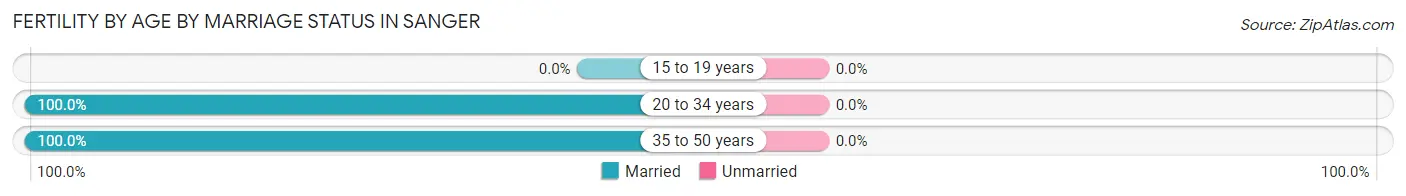
| Age Bracket | Married | Unmarried |
| 15 to 19 years | 0 (0.0%) | 0 (0.0%) |
| 20 to 34 years | 23 (100.0%) | 0 (0.0%) |
| 35 to 50 years | 99 (100.0%) | 0 (0.0%) |
| Total | 122 (100.0%) | 0 (0.0%) |
Fertility by Education in Sanger
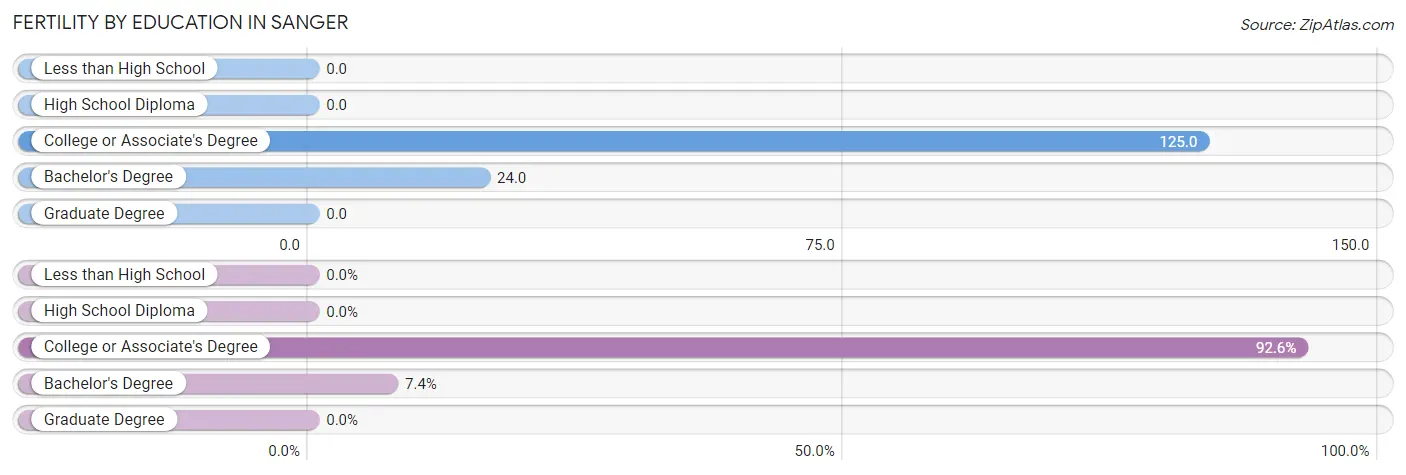
| Educational Attainment | Women with Births | Births / 1,000 Women |
| Less than High School | 0 (0.0%) | 0.0 |
| High School Diploma | 0 (0.0%) | 0.0 |
| College or Associate's Degree | 113 (92.6%) | 125.0 |
| Bachelor's Degree | 9 (7.4%) | 24.0 |
| Graduate Degree | 0 (0.0%) | 0.0 |
| Total | 122 (100.0%) | 53.0 |
Fertility by Education by Marriage Status in Sanger
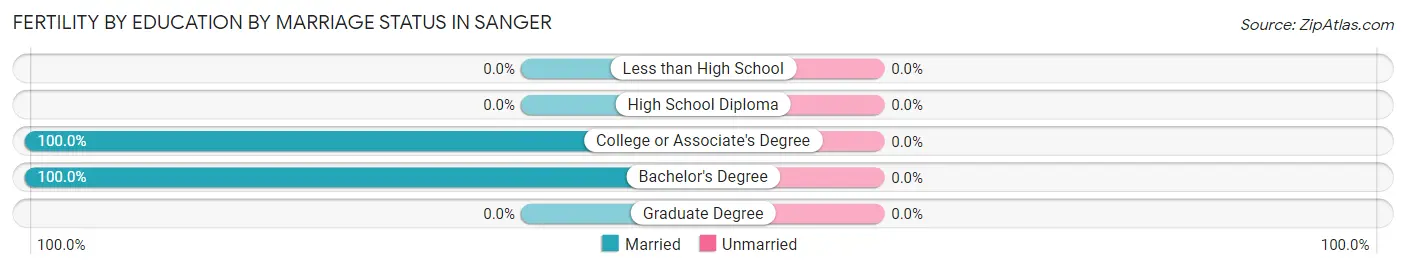
| Educational Attainment | Married | Unmarried |
| Less than High School | 0 (0.0%) | 0 (0.0%) |
| High School Diploma | 0 (0.0%) | 0 (0.0%) |
| College or Associate's Degree | 113 (100.0%) | 0 (0.0%) |
| Bachelor's Degree | 9 (100.0%) | 0 (0.0%) |
| Graduate Degree | 0 (0.0%) | 0 (0.0%) |
| Total | 122 (100.0%) | 0 (0.0%) |
Employment Characteristics in Sanger
Employment by Class of Employer in Sanger
Among the 4,847 employed individuals in Sanger, private company employees (3,520 | 72.6%), state government employees (423 | 8.7%), and local government employees (373 | 7.7%) make up the most common classes of employment.
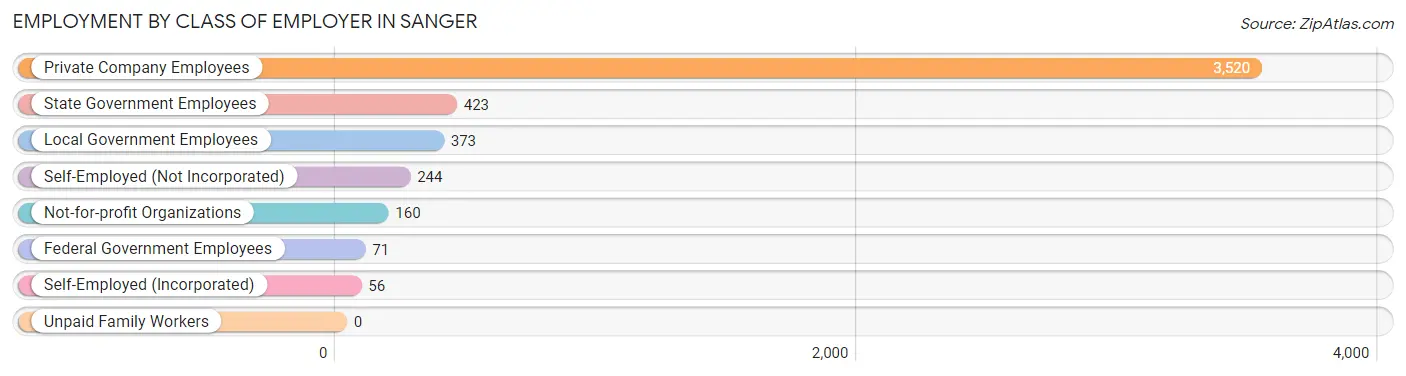
| Employer Class | # Employees | % Employees |
| Private Company Employees | 3,520 | 72.6% |
| Self-Employed (Incorporated) | 56 | 1.2% |
| Self-Employed (Not Incorporated) | 244 | 5.0% |
| Not-for-profit Organizations | 160 | 3.3% |
| Local Government Employees | 373 | 7.7% |
| State Government Employees | 423 | 8.7% |
| Federal Government Employees | 71 | 1.5% |
| Unpaid Family Workers | 0 | 0.0% |
| Total | 4,847 | 100.0% |
Employment Status by Age in Sanger
According to the labor force statistics for Sanger, out of the total population over 16 years of age (6,660), 74.6% or 4,968 individuals are in the labor force, with 1.8% or 89 of them unemployed. The age group with the highest labor force participation rate is 20 to 24 years, with 96.5% or 680 individuals in the labor force. Within the labor force, the 75 years and over age range has the highest percentage of unemployed individuals, with 31.0% or 9 of them being unemployed.
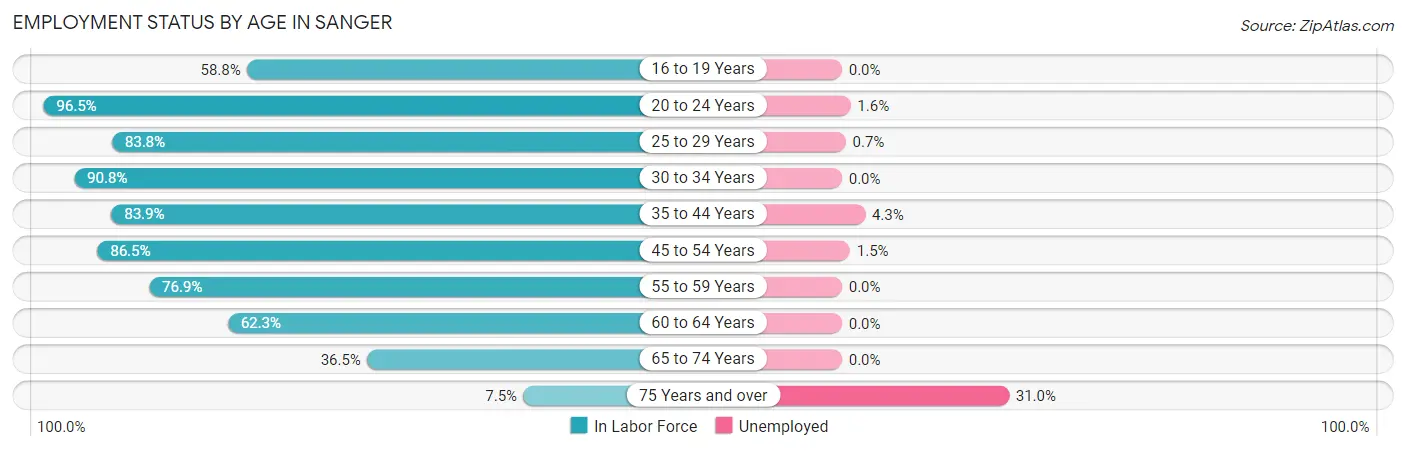
| Age Bracket | In Labor Force | Unemployed |
| 16 to 19 Years | 130 (58.8%) | 0 (0.0%) |
| 20 to 24 Years | 680 (96.5%) | 11 (1.6%) |
| 25 to 29 Years | 691 (83.8%) | 5 (0.7%) |
| 30 to 34 Years | 733 (90.8%) | 0 (0.0%) |
| 35 to 44 Years | 1,196 (83.9%) | 51 (4.3%) |
| 45 to 54 Years | 653 (86.5%) | 10 (1.5%) |
| 55 to 59 Years | 296 (76.9%) | 0 (0.0%) |
| 60 to 64 Years | 346 (62.3%) | 0 (0.0%) |
| 65 to 74 Years | 217 (36.5%) | 0 (0.0%) |
| 75 Years and over | 29 (7.5%) | 9 (31.0%) |
| Total | 4,968 (74.6%) | 89 (1.8%) |
Employment Status by Educational Attainment in Sanger
According to labor force statistics for Sanger, 82.4% of individuals (3,916) out of the total population between 25 and 64 years of age (4,752) are in the labor force, with 1.7% or 67 of them being unemployed. The group with the highest labor force participation rate are those with the educational attainment of high school diploma, with 86.2% or 1,248 individuals in the labor force. Within the labor force, individuals with less than high school education have the highest percentage of unemployment, with 6.2% or 21 of them being unemployed.
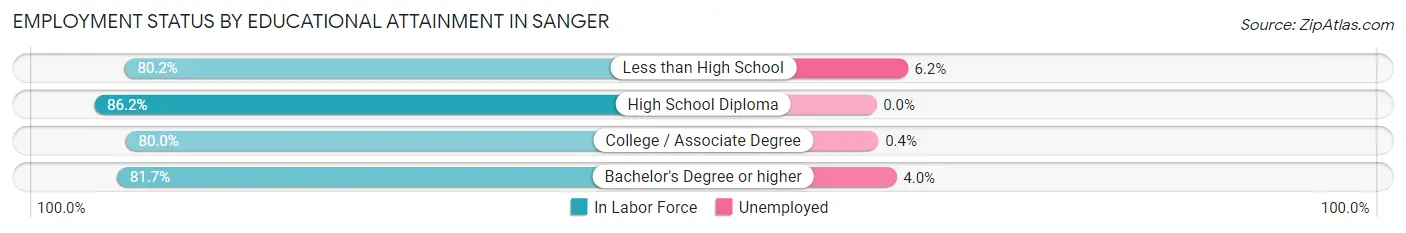
| Educational Attainment | In Labor Force | Unemployed |
| Less than High School | 337 (80.2%) | 26 (6.2%) |
| High School Diploma | 1,248 (86.2%) | 0 (0.0%) |
| College / Associate Degree | 1,299 (80.0%) | 6 (0.4%) |
| Bachelor's Degree or higher | 1,029 (81.7%) | 50 (4.0%) |
| Total | 3,916 (82.4%) | 81 (1.7%) |
Employment Occupations by Sex in Sanger
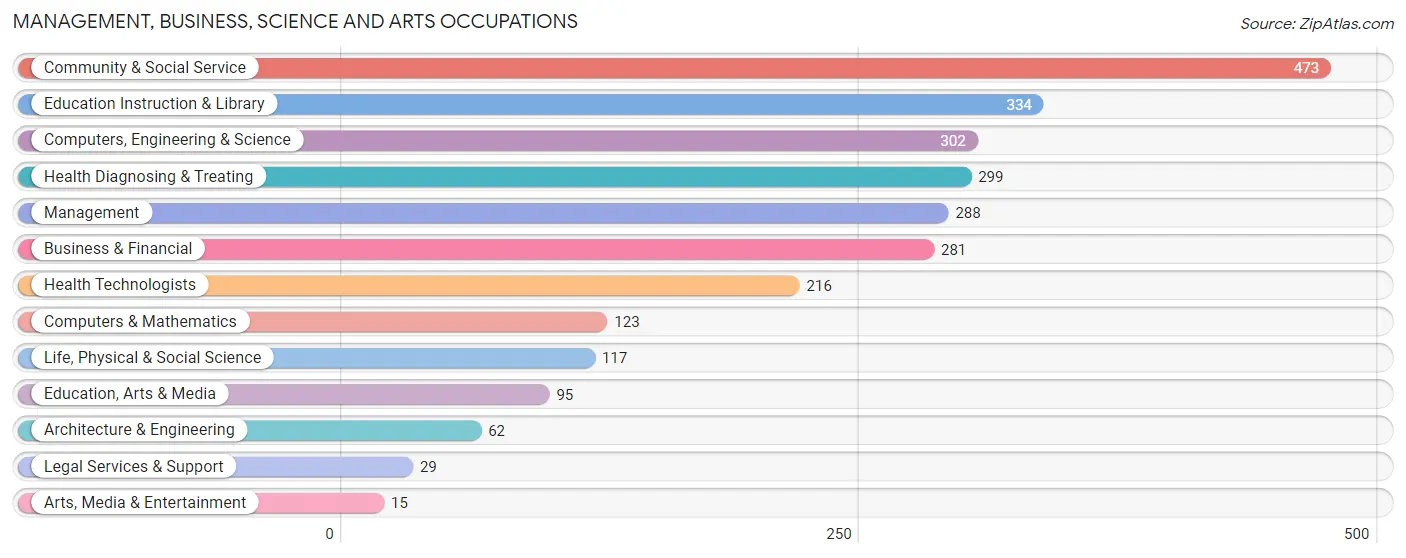
Management, Business, Science and Arts Occupations
The most common Management, Business, Science and Arts occupations in Sanger are Community & Social Service (473 | 9.7%), Education Instruction & Library (334 | 6.8%), Computers, Engineering & Science (302 | 6.2%), Health Diagnosing & Treating (299 | 6.1%), and Management (288 | 5.9%).
Management, Business, Science and Arts Occupations by Sex
Within the Management, Business, Science and Arts occupations in Sanger, the most male-oriented occupations are Life, Physical & Social Science (100.0%), Computers, Engineering & Science (89.1%), and Computers & Mathematics (83.7%), while the most female-oriented occupations are Arts, Media & Entertainment (100.0%), Health Diagnosing & Treating (100.0%), and Health Technologists (100.0%).
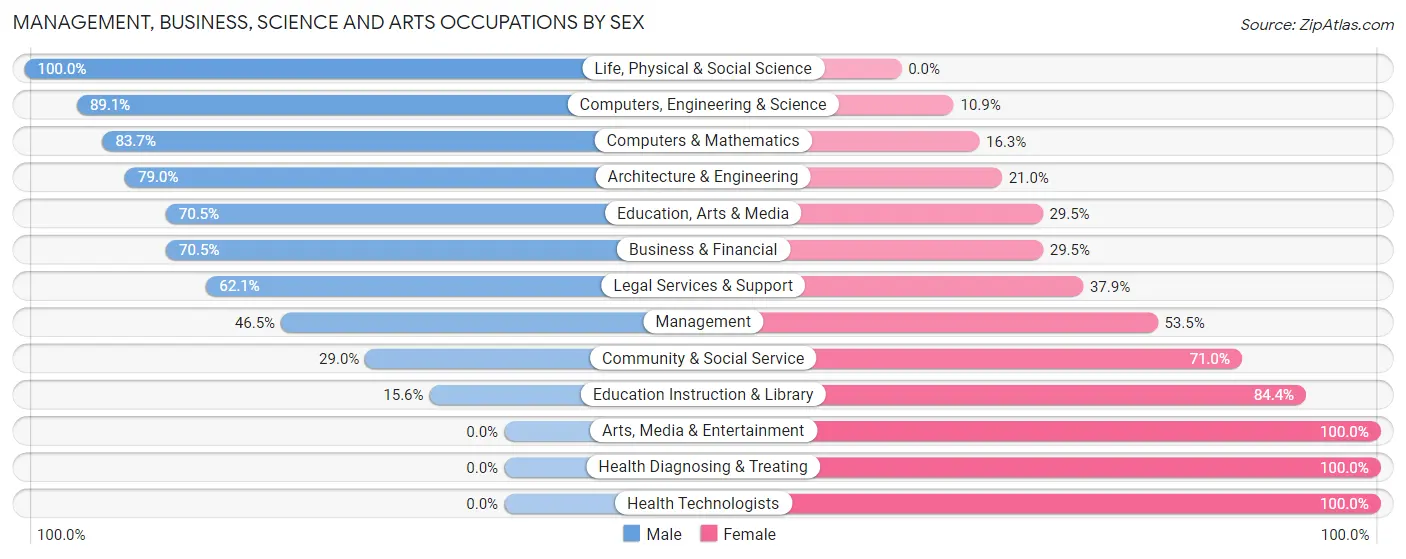
| Occupation | Male | Female |
| Management | 134 (46.5%) | 154 (53.5%) |
| Business & Financial | 198 (70.5%) | 83 (29.5%) |
| Computers, Engineering & Science | 269 (89.1%) | 33 (10.9%) |
| Computers & Mathematics | 103 (83.7%) | 20 (16.3%) |
| Architecture & Engineering | 49 (79.0%) | 13 (21.0%) |
| Life, Physical & Social Science | 117 (100.0%) | 0 (0.0%) |
| Community & Social Service | 137 (29.0%) | 336 (71.0%) |
| Education, Arts & Media | 67 (70.5%) | 28 (29.5%) |
| Legal Services & Support | 18 (62.1%) | 11 (37.9%) |
| Education Instruction & Library | 52 (15.6%) | 282 (84.4%) |
| Arts, Media & Entertainment | 0 (0.0%) | 15 (100.0%) |
| Health Diagnosing & Treating | 0 (0.0%) | 299 (100.0%) |
| Health Technologists | 0 (0.0%) | 216 (100.0%) |
| Total (Category) | 738 (44.9%) | 905 (55.1%) |
| Total (Overall) | 2,655 (54.4%) | 2,229 (45.6%) |
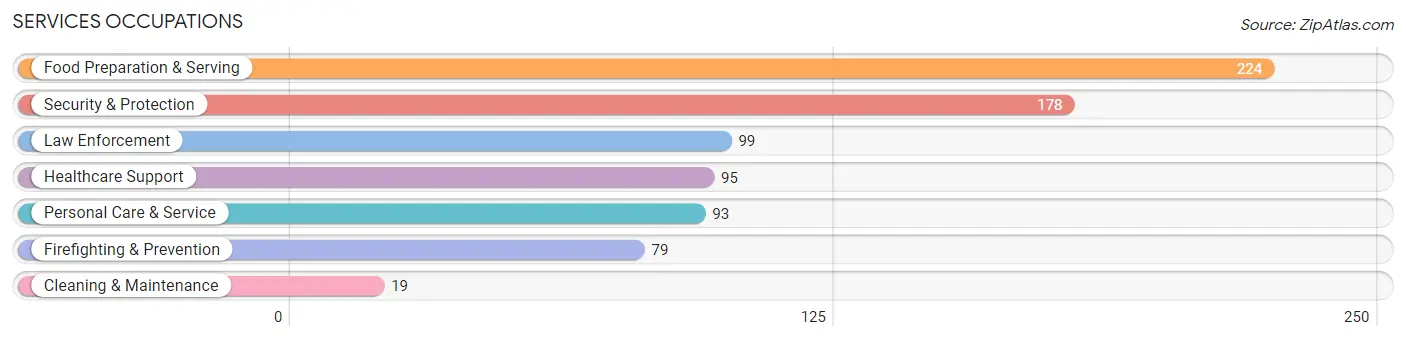
Services Occupations
The most common Services occupations in Sanger are Food Preparation & Serving (224 | 4.6%), Security & Protection (178 | 3.6%), Law Enforcement (99 | 2.0%), Healthcare Support (95 | 1.9%), and Personal Care & Service (93 | 1.9%).
Services Occupations by Sex
Within the Services occupations in Sanger, the most male-oriented occupations are Cleaning & Maintenance (100.0%), Law Enforcement (79.8%), and Security & Protection (73.0%), while the most female-oriented occupations are Healthcare Support (100.0%), Food Preparation & Serving (87.5%), and Personal Care & Service (65.6%).
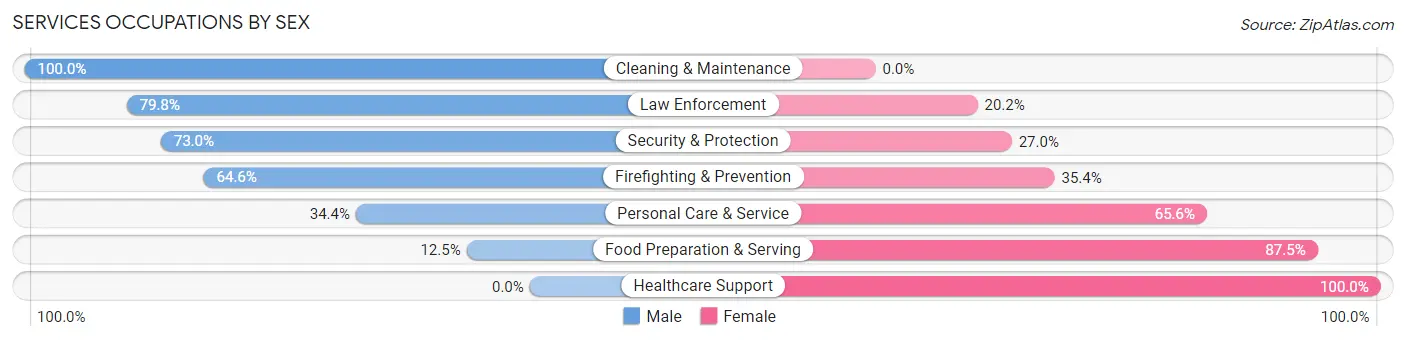
| Occupation | Male | Female |
| Healthcare Support | 0 (0.0%) | 95 (100.0%) |
| Security & Protection | 130 (73.0%) | 48 (27.0%) |
| Firefighting & Prevention | 51 (64.6%) | 28 (35.4%) |
| Law Enforcement | 79 (79.8%) | 20 (20.2%) |
| Food Preparation & Serving | 28 (12.5%) | 196 (87.5%) |
| Cleaning & Maintenance | 19 (100.0%) | 0 (0.0%) |
| Personal Care & Service | 32 (34.4%) | 61 (65.6%) |
| Total (Category) | 209 (34.3%) | 400 (65.7%) |
| Total (Overall) | 2,655 (54.4%) | 2,229 (45.6%) |
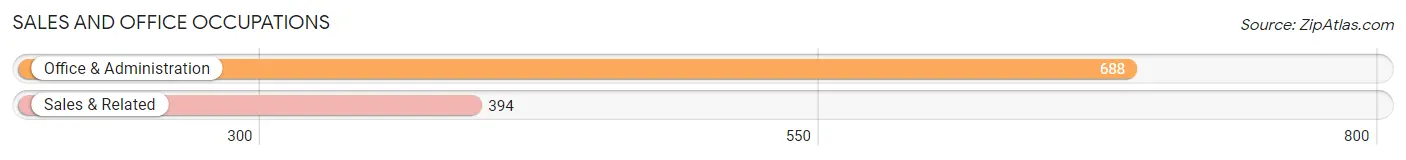
Sales and Office Occupations
The most common Sales and Office occupations in Sanger are Office & Administration (688 | 14.1%), and Sales & Related (394 | 8.1%).
Sales and Office Occupations by Sex
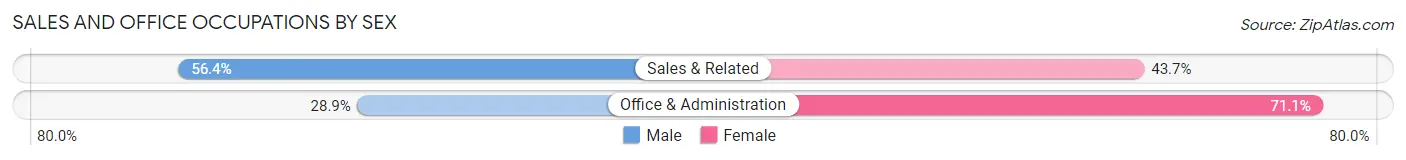
| Occupation | Male | Female |
| Sales & Related | 222 (56.4%) | 172 (43.6%) |
| Office & Administration | 199 (28.9%) | 489 (71.1%) |
| Total (Category) | 421 (38.9%) | 661 (61.1%) |
| Total (Overall) | 2,655 (54.4%) | 2,229 (45.6%) |
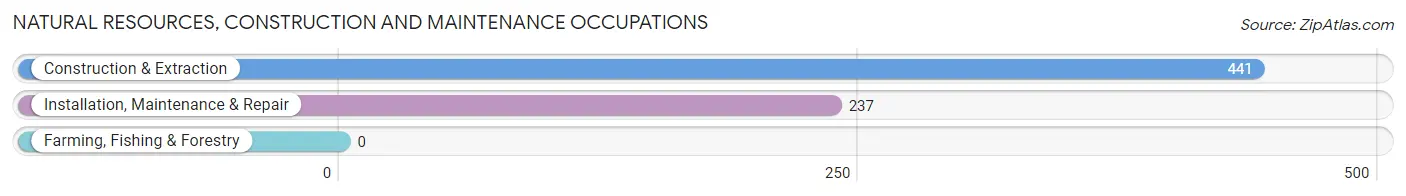
Natural Resources, Construction and Maintenance Occupations
The most common Natural Resources, Construction and Maintenance occupations in Sanger are Construction & Extraction (441 | 9.0%), and Installation, Maintenance & Repair (237 | 4.9%).
Natural Resources, Construction and Maintenance Occupations by Sex
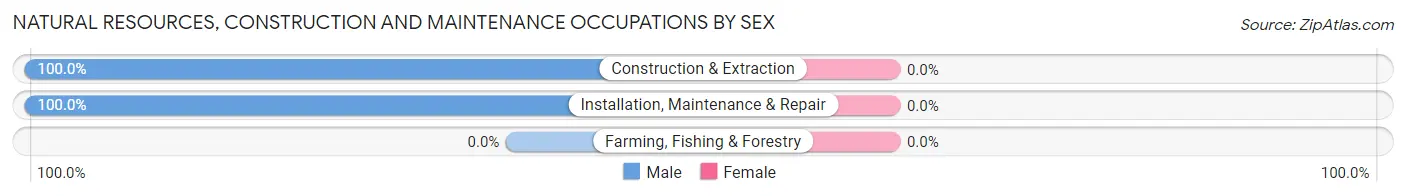
| Occupation | Male | Female |
| Farming, Fishing & Forestry | 0 (0.0%) | 0 (0.0%) |
| Construction & Extraction | 441 (100.0%) | 0 (0.0%) |
| Installation, Maintenance & Repair | 237 (100.0%) | 0 (0.0%) |
| Total (Category) | 678 (100.0%) | 0 (0.0%) |
| Total (Overall) | 2,655 (54.4%) | 2,229 (45.6%) |
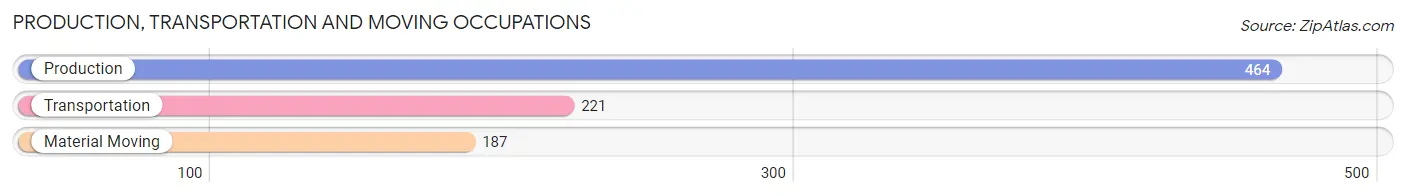
Production, Transportation and Moving Occupations
The most common Production, Transportation and Moving occupations in Sanger are Production (464 | 9.5%), Transportation (221 | 4.5%), and Material Moving (187 | 3.8%).
Production, Transportation and Moving Occupations by Sex
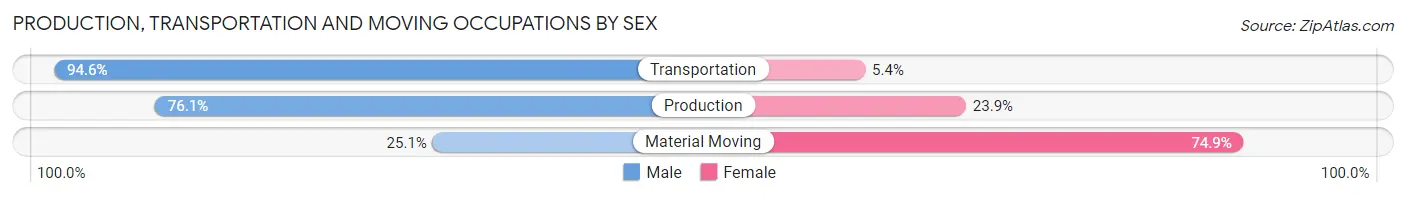
| Occupation | Male | Female |
| Production | 353 (76.1%) | 111 (23.9%) |
| Transportation | 209 (94.6%) | 12 (5.4%) |
| Material Moving | 47 (25.1%) | 140 (74.9%) |
| Total (Category) | 609 (69.8%) | 263 (30.2%) |
| Total (Overall) | 2,655 (54.4%) | 2,229 (45.6%) |
Employment Industries by Sex in Sanger
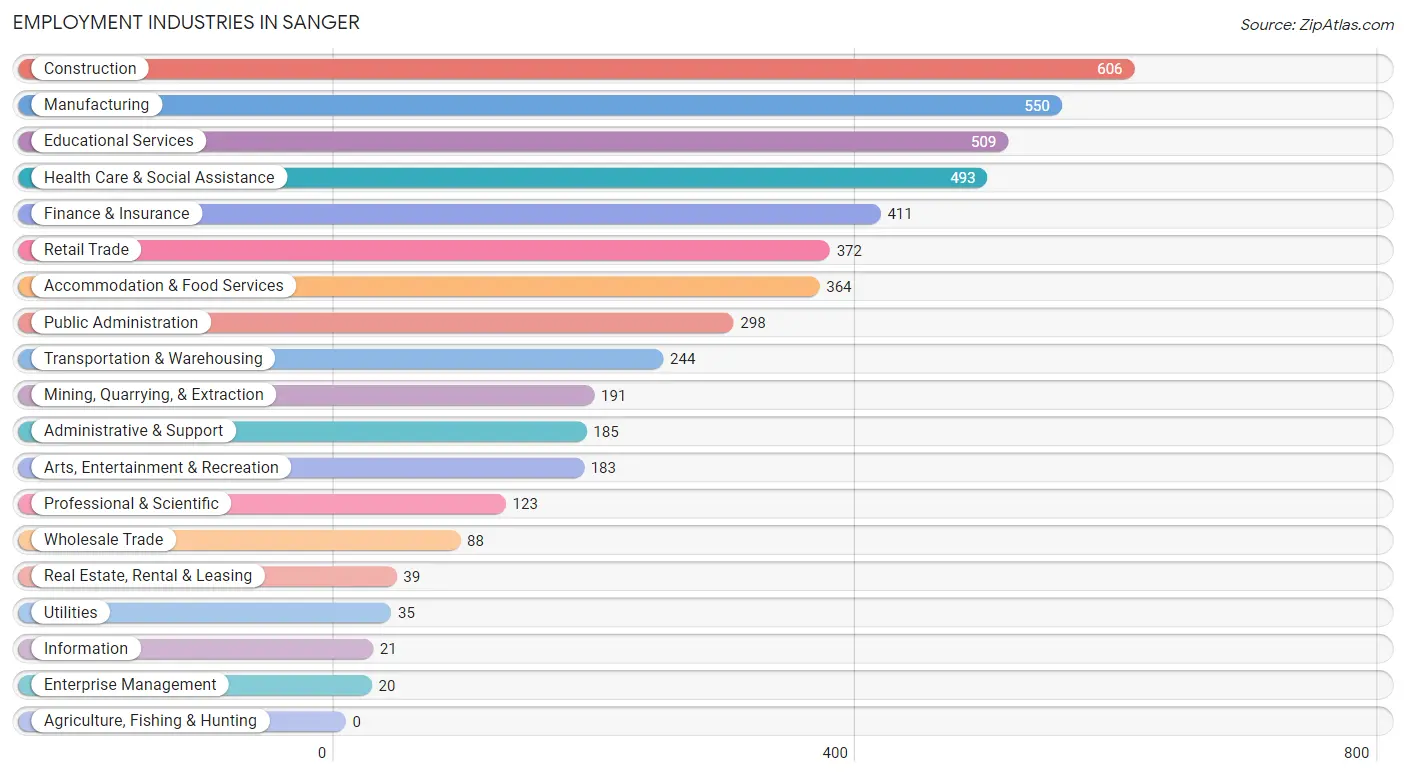
Employment Industries in Sanger
The major employment industries in Sanger include Construction (606 | 12.4%), Manufacturing (550 | 11.3%), Educational Services (509 | 10.4%), Health Care & Social Assistance (493 | 10.1%), and Finance & Insurance (411 | 8.4%).
Employment Industries by Sex in Sanger
The Sanger industries that see more men than women are Mining, Quarrying, & Extraction (100.0%), Wholesale Trade (100.0%), and Utilities (100.0%), whereas the industries that tend to have a higher number of women are Real Estate, Rental & Leasing (100.0%), Enterprise Management (100.0%), and Health Care & Social Assistance (87.6%).
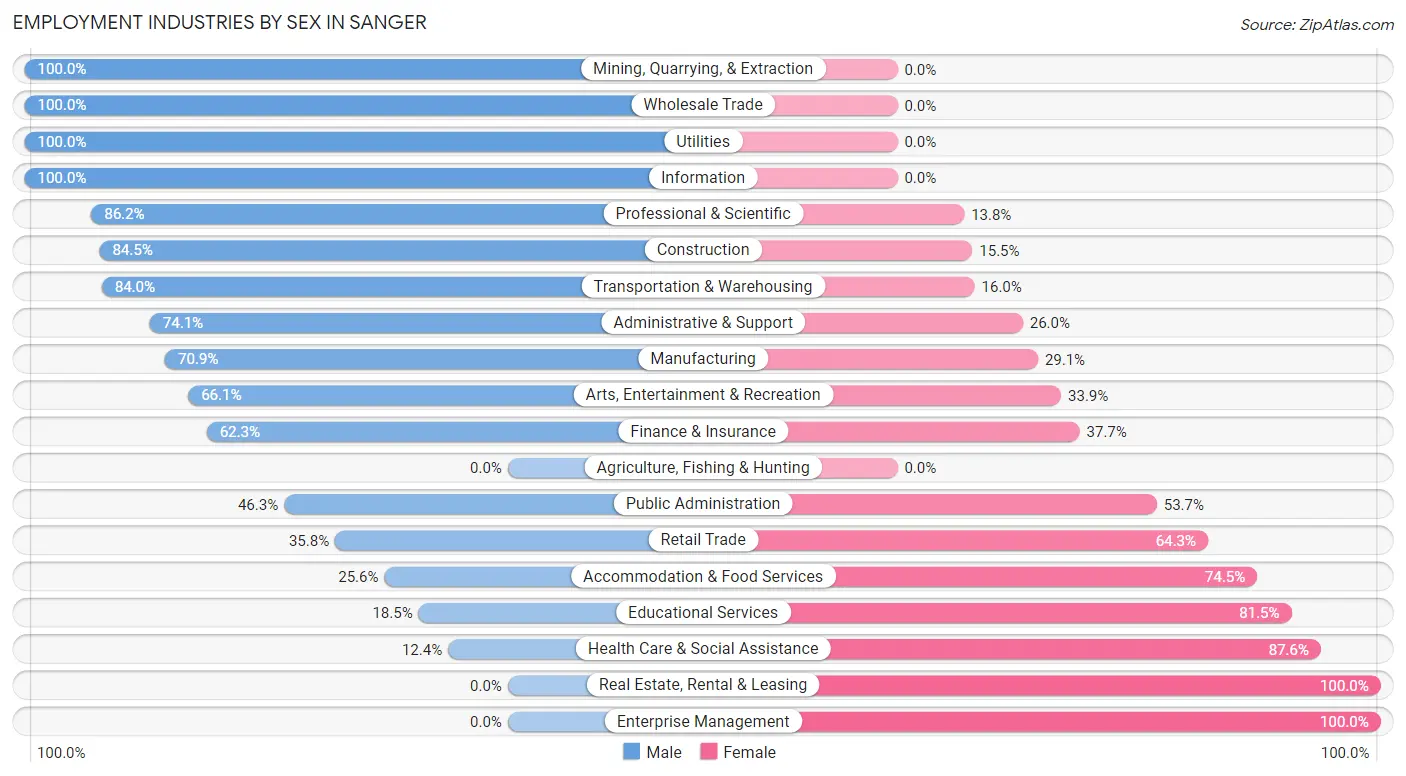
| Industry | Male | Female |
| Agriculture, Fishing & Hunting | 0 (0.0%) | 0 (0.0%) |
| Mining, Quarrying, & Extraction | 191 (100.0%) | 0 (0.0%) |
| Construction | 512 (84.5%) | 94 (15.5%) |
| Manufacturing | 390 (70.9%) | 160 (29.1%) |
| Wholesale Trade | 88 (100.0%) | 0 (0.0%) |
| Retail Trade | 133 (35.7%) | 239 (64.2%) |
| Transportation & Warehousing | 205 (84.0%) | 39 (16.0%) |
| Utilities | 35 (100.0%) | 0 (0.0%) |
| Information | 21 (100.0%) | 0 (0.0%) |
| Finance & Insurance | 256 (62.3%) | 155 (37.7%) |
| Real Estate, Rental & Leasing | 0 (0.0%) | 39 (100.0%) |
| Professional & Scientific | 106 (86.2%) | 17 (13.8%) |
| Enterprise Management | 0 (0.0%) | 20 (100.0%) |
| Administrative & Support | 137 (74.1%) | 48 (26.0%) |
| Educational Services | 94 (18.5%) | 415 (81.5%) |
| Health Care & Social Assistance | 61 (12.4%) | 432 (87.6%) |
| Arts, Entertainment & Recreation | 121 (66.1%) | 62 (33.9%) |
| Accommodation & Food Services | 93 (25.6%) | 271 (74.5%) |
| Public Administration | 138 (46.3%) | 160 (53.7%) |
| Total | 2,655 (54.4%) | 2,229 (45.6%) |
Education in Sanger
School Enrollment in Sanger
The most common levels of schooling among the 1,924 students in Sanger are middle school (474 | 24.6%), elementary school (426 | 22.1%), and college / undergraduate (328 | 17.1%).
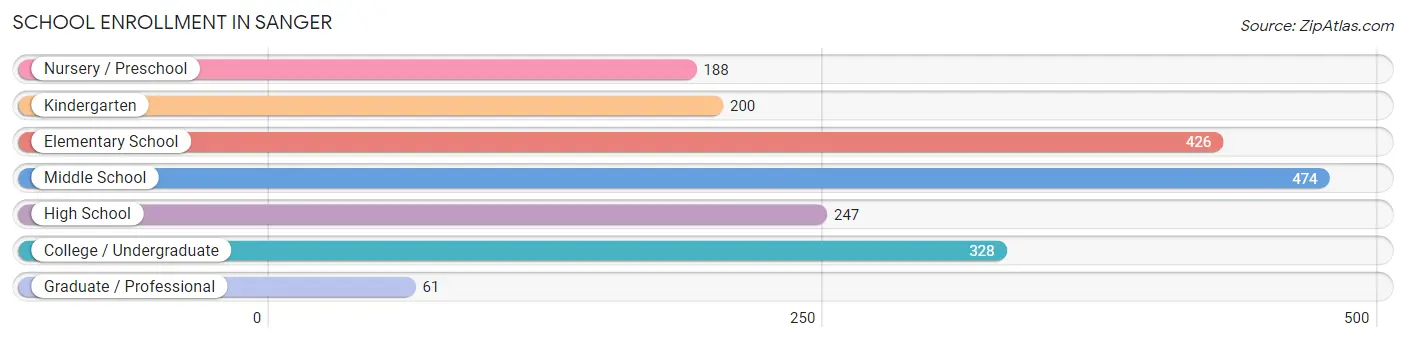
| School Level | # Students | % Students |
| Nursery / Preschool | 188 | 9.8% |
| Kindergarten | 200 | 10.4% |
| Elementary School | 426 | 22.1% |
| Middle School | 474 | 24.6% |
| High School | 247 | 12.8% |
| College / Undergraduate | 328 | 17.1% |
| Graduate / Professional | 61 | 3.2% |
| Total | 1,924 | 100.0% |
School Enrollment by Age by Funding Source in Sanger
Out of a total of 1,924 students who are enrolled in schools in Sanger, 275 (14.3%) attend a private institution, while the remaining 1,649 (85.7%) are enrolled in public schools. The age group of 3 to 4 year olds has the highest likelihood of being enrolled in private schools, with 55 (50.9% in the age bracket) enrolled. Conversely, the age group of 15 to 17 year olds has the lowest likelihood of being enrolled in a private school, with 133 (100.0% in the age bracket) attending a public institution.
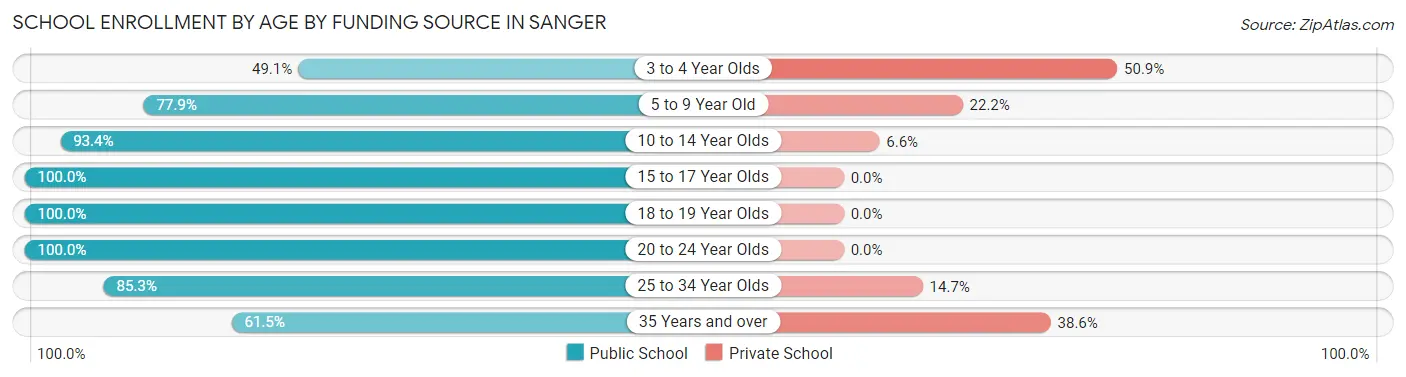
| Age Bracket | Public School | Private School |
| 3 to 4 Year Olds | 53 (49.1%) | 55 (50.9%) |
| 5 to 9 Year Old | 478 (77.8%) | 136 (22.2%) |
| 10 to 14 Year Olds | 591 (93.4%) | 42 (6.6%) |
| 15 to 17 Year Olds | 133 (100.0%) | 0 (0.0%) |
| 18 to 19 Year Olds | 74 (100.0%) | 0 (0.0%) |
| 20 to 24 Year Olds | 211 (100.0%) | 0 (0.0%) |
| 25 to 34 Year Olds | 58 (85.3%) | 10 (14.7%) |
| 35 Years and over | 51 (61.5%) | 32 (38.6%) |
| Total | 1,649 (85.7%) | 275 (14.3%) |
Educational Attainment by Field of Study in Sanger
Education (259 | 15.9%), business (238 | 14.6%), science & technology (213 | 13.1%), bio, nature & agricultural (165 | 10.1%), and arts & humanities (164 | 10.1%) are the most common fields of study among 1,628 individuals in Sanger who have obtained a bachelor's degree or higher.
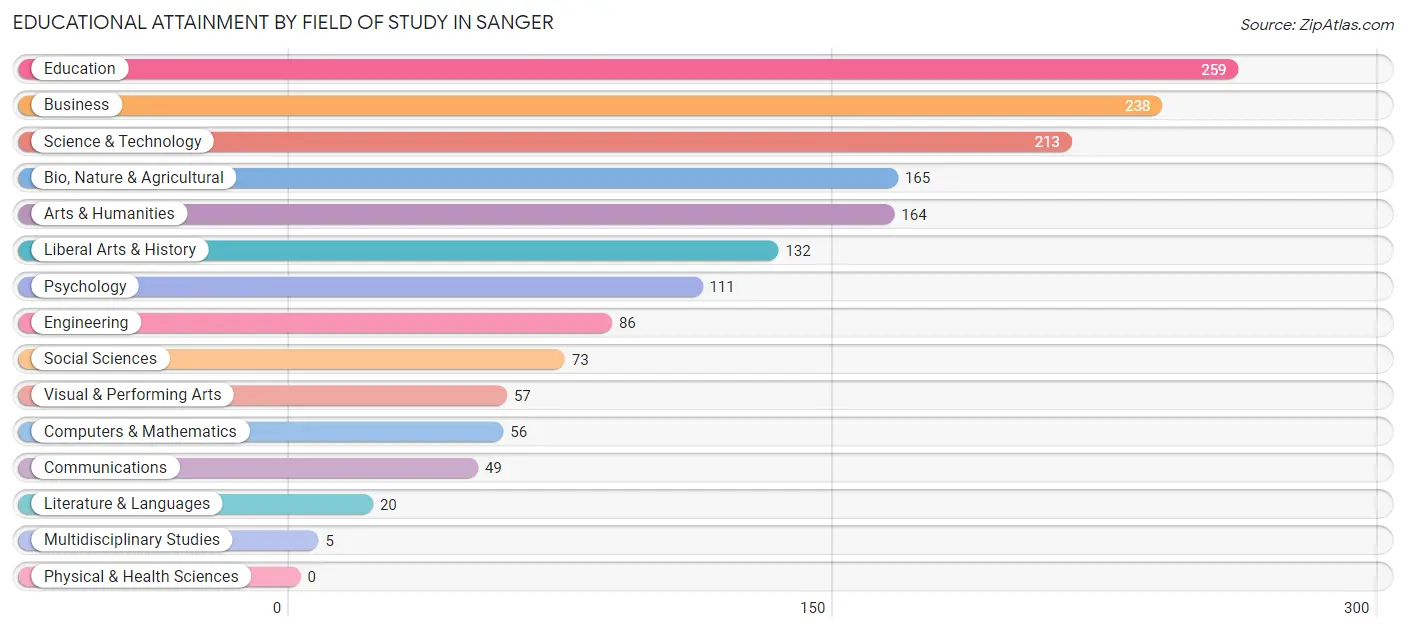
| Field of Study | # Graduates | % Graduates |
| Computers & Mathematics | 56 | 3.4% |
| Bio, Nature & Agricultural | 165 | 10.1% |
| Physical & Health Sciences | 0 | 0.0% |
| Psychology | 111 | 6.8% |
| Social Sciences | 73 | 4.5% |
| Engineering | 86 | 5.3% |
| Multidisciplinary Studies | 5 | 0.3% |
| Science & Technology | 213 | 13.1% |
| Business | 238 | 14.6% |
| Education | 259 | 15.9% |
| Literature & Languages | 20 | 1.2% |
| Liberal Arts & History | 132 | 8.1% |
| Visual & Performing Arts | 57 | 3.5% |
| Communications | 49 | 3.0% |
| Arts & Humanities | 164 | 10.1% |
| Total | 1,628 | 100.0% |
Transportation & Commute in Sanger
Vehicle Availability by Sex in Sanger
The most prevalent vehicle ownership categories in Sanger are males with 2 vehicles (1,261, accounting for 47.8%) and females with 2 vehicles (859, making up 57.1%).
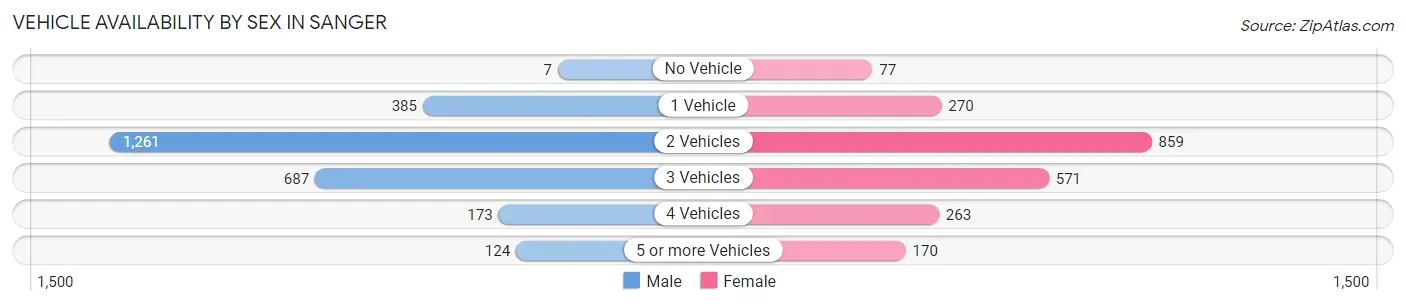
| Vehicles Available | Male | Female |
| No Vehicle | 7 (0.3%) | 77 (3.5%) |
| 1 Vehicle | 385 (14.6%) | 270 (12.2%) |
| 2 Vehicles | 1,261 (47.8%) | 859 (38.9%) |
| 3 Vehicles | 687 (26.1%) | 571 (25.8%) |
| 4 Vehicles | 173 (6.6%) | 263 (11.9%) |
| 5 or more Vehicles | 124 (4.7%) | 170 (7.7%) |
| Total | 2,637 (100.0%) | 2,210 (100.0%) |
Commute Time in Sanger
The most frequently occuring commute durations in Sanger are 30 to 34 minutes (870 commuters, 18.8%), 15 to 19 minutes (754 commuters, 16.3%), and 20 to 24 minutes (718 commuters, 15.5%).
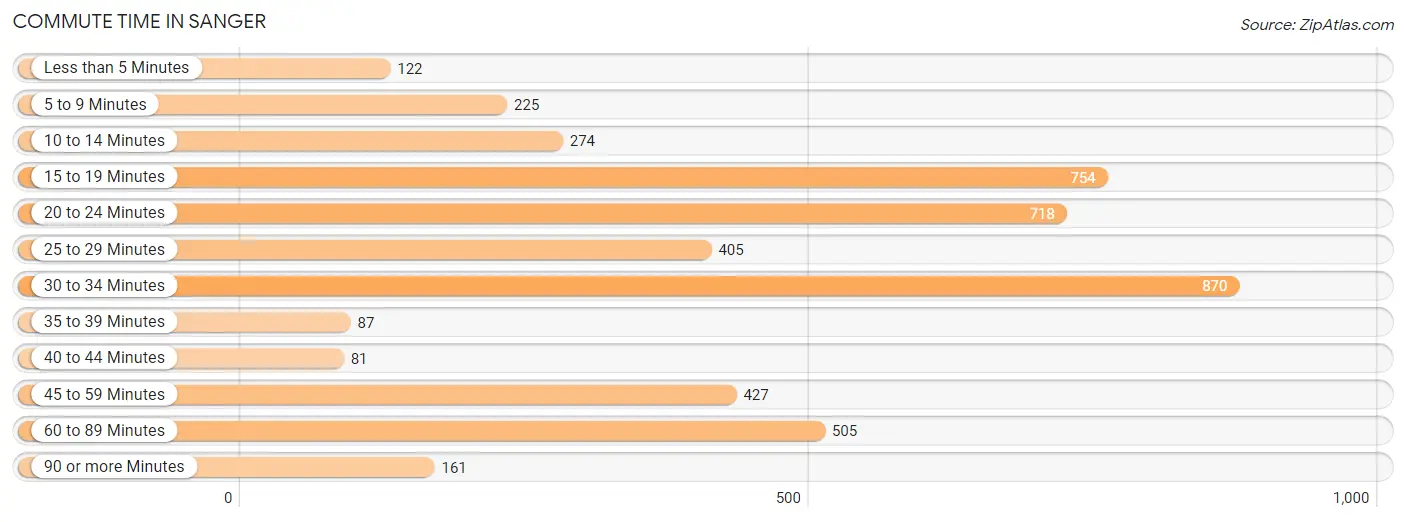
| Commute Time | # Commuters | % Commuters |
| Less than 5 Minutes | 122 | 2.6% |
| 5 to 9 Minutes | 225 | 4.9% |
| 10 to 14 Minutes | 274 | 5.9% |
| 15 to 19 Minutes | 754 | 16.3% |
| 20 to 24 Minutes | 718 | 15.5% |
| 25 to 29 Minutes | 405 | 8.7% |
| 30 to 34 Minutes | 870 | 18.8% |
| 35 to 39 Minutes | 87 | 1.9% |
| 40 to 44 Minutes | 81 | 1.8% |
| 45 to 59 Minutes | 427 | 9.2% |
| 60 to 89 Minutes | 505 | 10.9% |
| 90 or more Minutes | 161 | 3.5% |
Commute Time by Sex in Sanger
The most common commute times in Sanger are 20 to 24 minutes (477 commuters, 19.0%) for males and 30 to 34 minutes (445 commuters, 21.0%) for females.
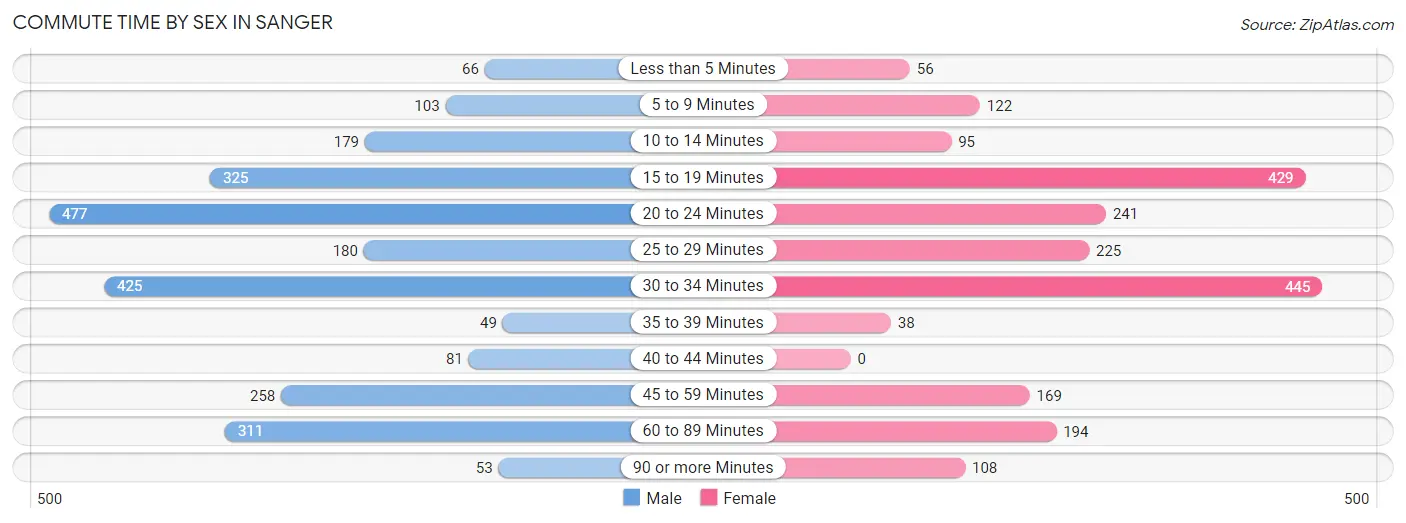
| Commute Time | Male | Female |
| Less than 5 Minutes | 66 (2.6%) | 56 (2.6%) |
| 5 to 9 Minutes | 103 (4.1%) | 122 (5.8%) |
| 10 to 14 Minutes | 179 (7.1%) | 95 (4.5%) |
| 15 to 19 Minutes | 325 (13.0%) | 429 (20.2%) |
| 20 to 24 Minutes | 477 (19.0%) | 241 (11.4%) |
| 25 to 29 Minutes | 180 (7.2%) | 225 (10.6%) |
| 30 to 34 Minutes | 425 (17.0%) | 445 (21.0%) |
| 35 to 39 Minutes | 49 (1.9%) | 38 (1.8%) |
| 40 to 44 Minutes | 81 (3.2%) | 0 (0.0%) |
| 45 to 59 Minutes | 258 (10.3%) | 169 (8.0%) |
| 60 to 89 Minutes | 311 (12.4%) | 194 (9.1%) |
| 90 or more Minutes | 53 (2.1%) | 108 (5.1%) |
Time of Departure to Work by Sex in Sanger
The most frequent times of departure to work in Sanger are 6:30 AM to 6:59 AM (382, 15.2%) for males and 7:00 AM to 7:29 AM (383, 18.0%) for females.
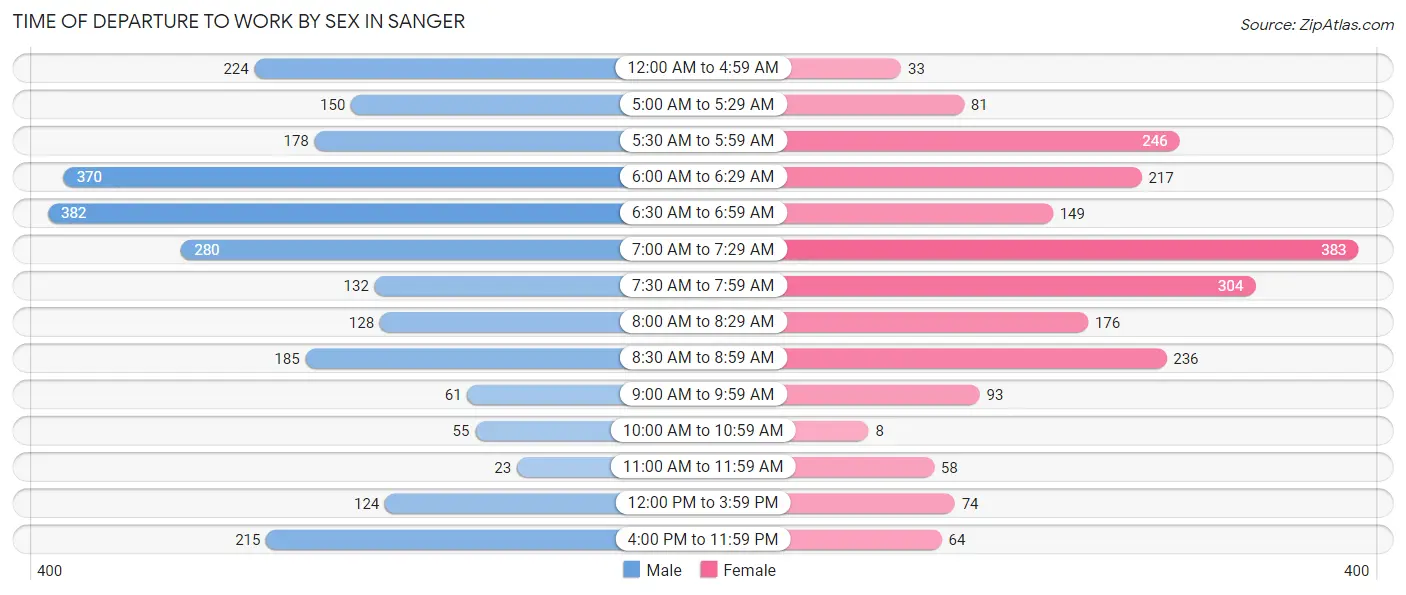
| Time of Departure | Male | Female |
| 12:00 AM to 4:59 AM | 224 (8.9%) | 33 (1.6%) |
| 5:00 AM to 5:29 AM | 150 (6.0%) | 81 (3.8%) |
| 5:30 AM to 5:59 AM | 178 (7.1%) | 246 (11.6%) |
| 6:00 AM to 6:29 AM | 370 (14.8%) | 217 (10.2%) |
| 6:30 AM to 6:59 AM | 382 (15.2%) | 149 (7.0%) |
| 7:00 AM to 7:29 AM | 280 (11.2%) | 383 (18.0%) |
| 7:30 AM to 7:59 AM | 132 (5.3%) | 304 (14.3%) |
| 8:00 AM to 8:29 AM | 128 (5.1%) | 176 (8.3%) |
| 8:30 AM to 8:59 AM | 185 (7.4%) | 236 (11.1%) |
| 9:00 AM to 9:59 AM | 61 (2.4%) | 93 (4.4%) |
| 10:00 AM to 10:59 AM | 55 (2.2%) | 8 (0.4%) |
| 11:00 AM to 11:59 AM | 23 (0.9%) | 58 (2.7%) |
| 12:00 PM to 3:59 PM | 124 (5.0%) | 74 (3.5%) |
| 4:00 PM to 11:59 PM | 215 (8.6%) | 64 (3.0%) |
| Total | 2,507 (100.0%) | 2,122 (100.0%) |
Housing Occupancy in Sanger
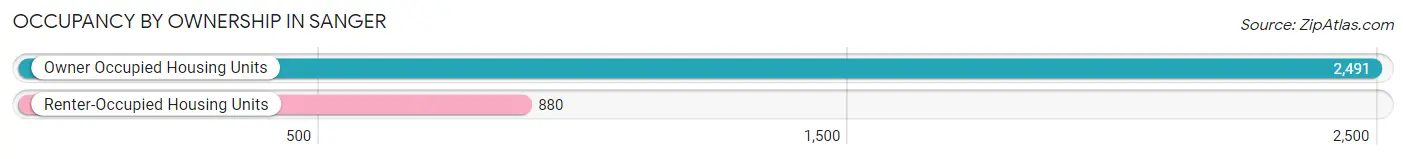
Occupancy by Ownership in Sanger
Of the total 3,371 dwellings in Sanger, owner-occupied units account for 2,491 (73.9%), while renter-occupied units make up 880 (26.1%).
| Occupancy | # Housing Units | % Housing Units |
| Owner Occupied Housing Units | 2,491 | 73.9% |
| Renter-Occupied Housing Units | 880 | 26.1% |
| Total Occupied Housing Units | 3,371 | 100.0% |
Occupancy by Household Size in Sanger
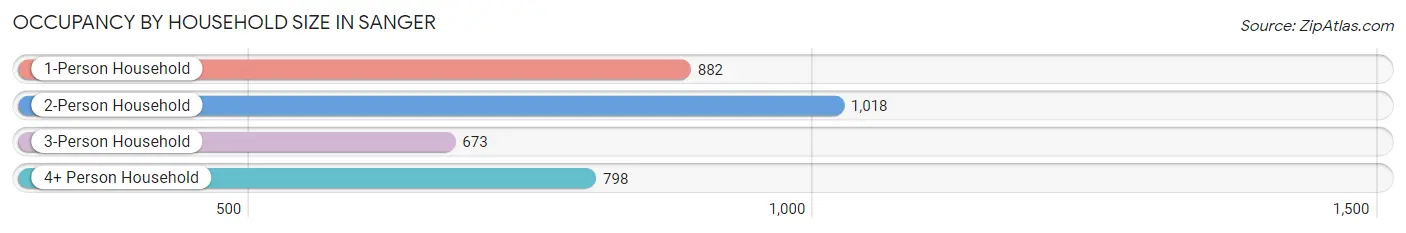
| Household Size | # Housing Units | % Housing Units |
| 1-Person Household | 882 | 26.2% |
| 2-Person Household | 1,018 | 30.2% |
| 3-Person Household | 673 | 20.0% |
| 4+ Person Household | 798 | 23.7% |
| Total Housing Units | 3,371 | 100.0% |
Occupancy by Ownership by Household Size in Sanger
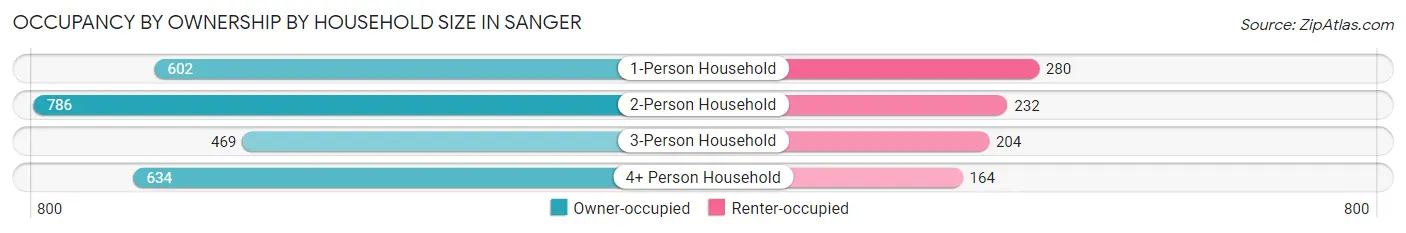
| Household Size | Owner-occupied | Renter-occupied |
| 1-Person Household | 602 (68.2%) | 280 (31.8%) |
| 2-Person Household | 786 (77.2%) | 232 (22.8%) |
| 3-Person Household | 469 (69.7%) | 204 (30.3%) |
| 4+ Person Household | 634 (79.4%) | 164 (20.5%) |
| Total Housing Units | 2,491 (73.9%) | 880 (26.1%) |
Occupancy by Educational Attainment in Sanger
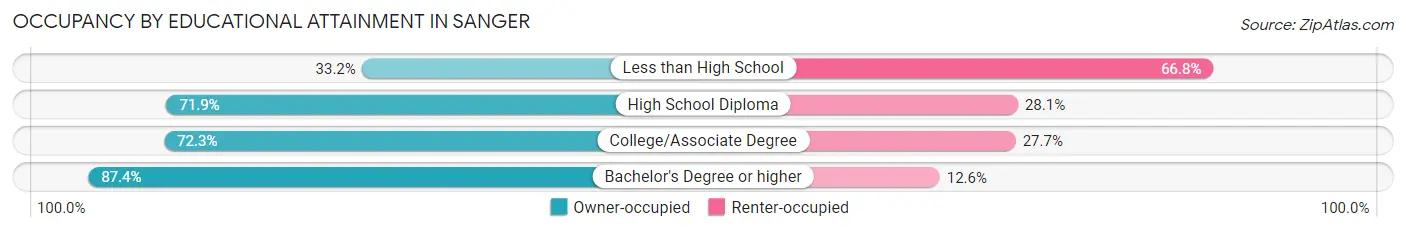
| Household Size | Owner-occupied | Renter-occupied |
| Less than High School | 70 (33.2%) | 141 (66.8%) |
| High School Diploma | 657 (71.9%) | 257 (28.1%) |
| College/Associate Degree | 954 (72.3%) | 365 (27.7%) |
| Bachelor's Degree or higher | 810 (87.4%) | 117 (12.6%) |
Occupancy by Age of Householder in Sanger
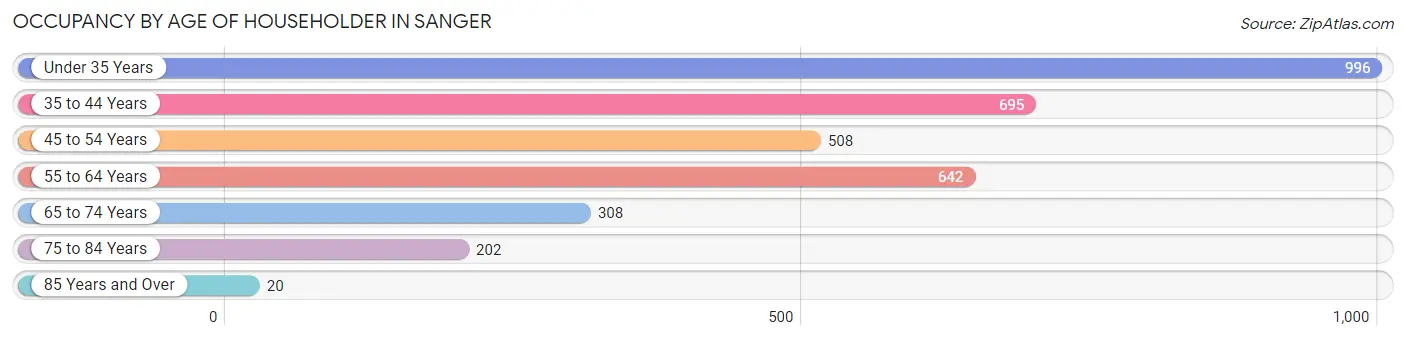
| Age Bracket | # Households | % Households |
| Under 35 Years | 996 | 29.5% |
| 35 to 44 Years | 695 | 20.6% |
| 45 to 54 Years | 508 | 15.1% |
| 55 to 64 Years | 642 | 19.0% |
| 65 to 74 Years | 308 | 9.1% |
| 75 to 84 Years | 202 | 6.0% |
| 85 Years and Over | 20 | 0.6% |
| Total | 3,371 | 100.0% |
Housing Finances in Sanger
Median Income by Occupancy in Sanger
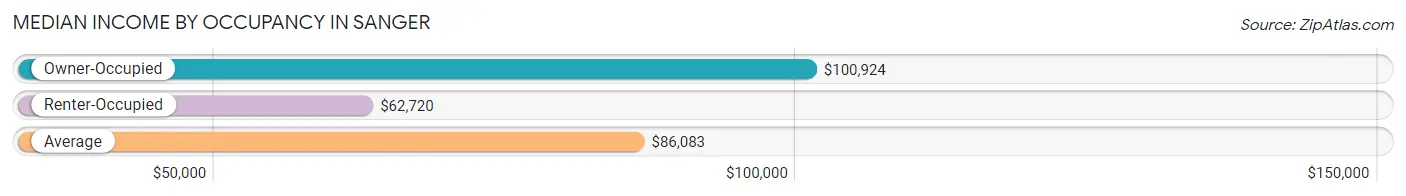
| Occupancy Type | # Households | Median Income |
| Owner-Occupied | 2,491 (73.9%) | $100,924 |
| Renter-Occupied | 880 (26.1%) | $62,720 |
| Average | 3,371 (100.0%) | $86,083 |
Occupancy by Householder Income Bracket in Sanger
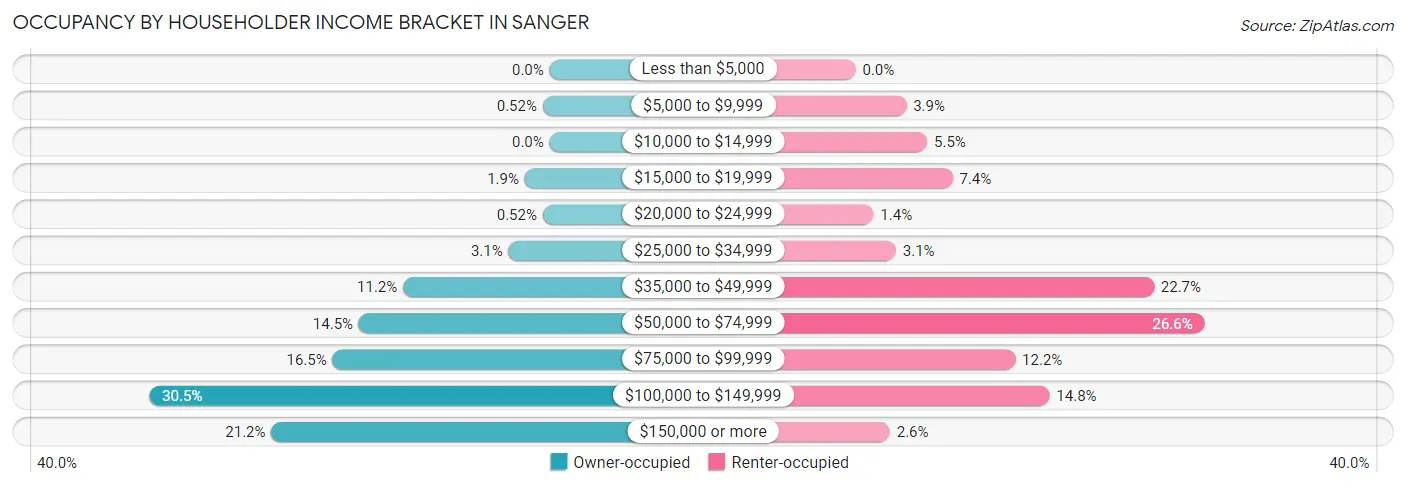
| Income Bracket | Owner-occupied | Renter-occupied |
| Less than $5,000 | 0 (0.0%) | 0 (0.0%) |
| $5,000 to $9,999 | 13 (0.5%) | 34 (3.9%) |
| $10,000 to $14,999 | 0 (0.0%) | 48 (5.4%) |
| $15,000 to $19,999 | 47 (1.9%) | 65 (7.4%) |
| $20,000 to $24,999 | 13 (0.5%) | 12 (1.4%) |
| $25,000 to $34,999 | 78 (3.1%) | 27 (3.1%) |
| $35,000 to $49,999 | 278 (11.2%) | 200 (22.7%) |
| $50,000 to $74,999 | 362 (14.5%) | 234 (26.6%) |
| $75,000 to $99,999 | 412 (16.5%) | 107 (12.2%) |
| $100,000 to $149,999 | 760 (30.5%) | 130 (14.8%) |
| $150,000 or more | 528 (21.2%) | 23 (2.6%) |
| Total | 2,491 (100.0%) | 880 (100.0%) |
Monthly Housing Cost Tiers in Sanger
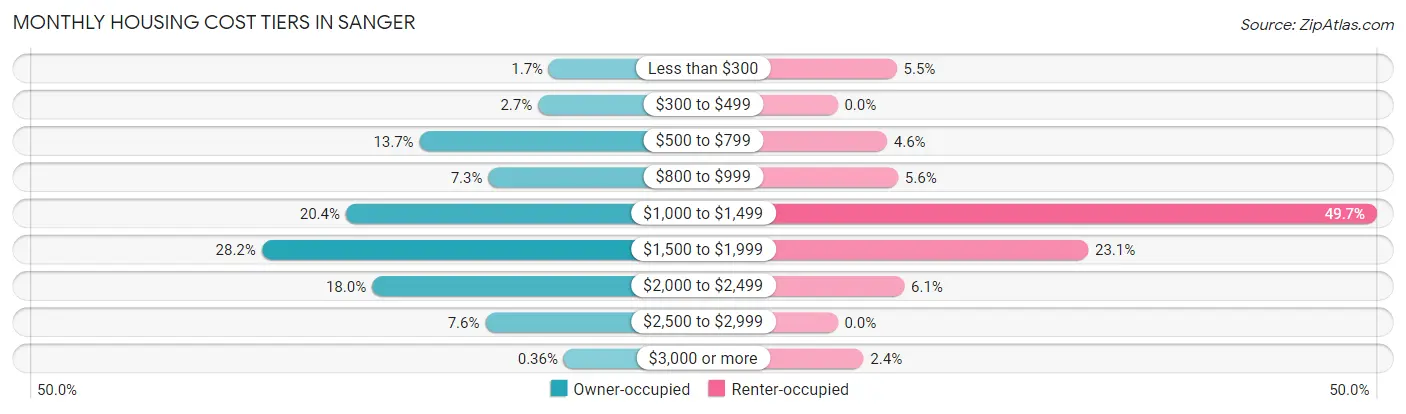
| Monthly Cost | Owner-occupied | Renter-occupied |
| Less than $300 | 43 (1.7%) | 48 (5.4%) |
| $300 to $499 | 68 (2.7%) | 0 (0.0%) |
| $500 to $799 | 340 (13.7%) | 40 (4.5%) |
| $800 to $999 | 182 (7.3%) | 49 (5.6%) |
| $1,000 to $1,499 | 509 (20.4%) | 437 (49.7%) |
| $1,500 to $1,999 | 702 (28.2%) | 203 (23.1%) |
| $2,000 to $2,499 | 449 (18.0%) | 54 (6.1%) |
| $2,500 to $2,999 | 189 (7.6%) | 0 (0.0%) |
| $3,000 or more | 9 (0.4%) | 21 (2.4%) |
| Total | 2,491 (100.0%) | 880 (100.0%) |
Physical Housing Characteristics in Sanger
Housing Structures in Sanger
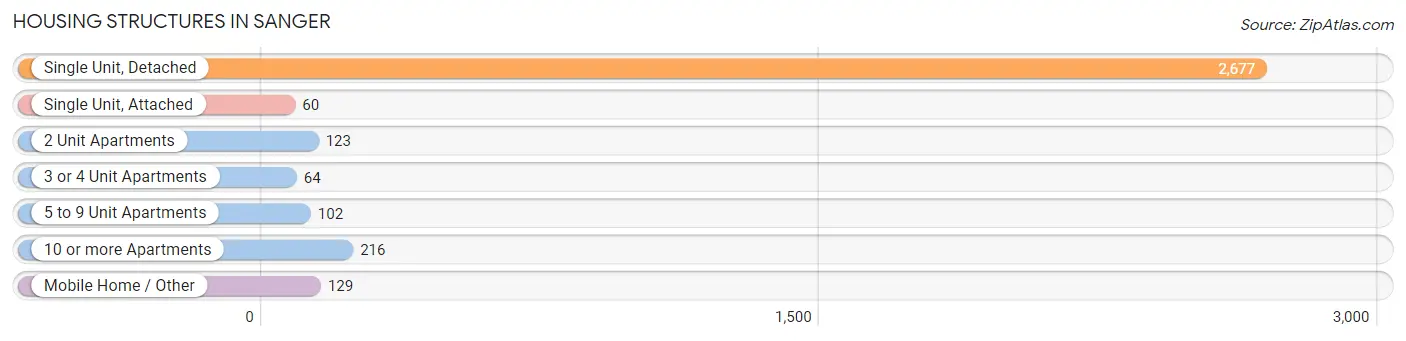
| Structure Type | # Housing Units | % Housing Units |
| Single Unit, Detached | 2,677 | 79.4% |
| Single Unit, Attached | 60 | 1.8% |
| 2 Unit Apartments | 123 | 3.6% |
| 3 or 4 Unit Apartments | 64 | 1.9% |
| 5 to 9 Unit Apartments | 102 | 3.0% |
| 10 or more Apartments | 216 | 6.4% |
| Mobile Home / Other | 129 | 3.8% |
| Total | 3,371 | 100.0% |
Housing Structures by Occupancy in Sanger
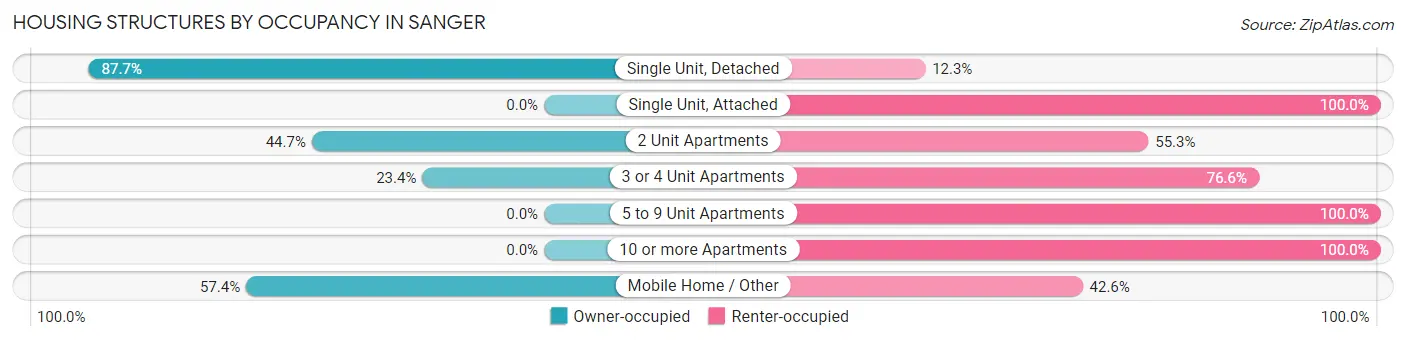
| Structure Type | Owner-occupied | Renter-occupied |
| Single Unit, Detached | 2,347 (87.7%) | 330 (12.3%) |
| Single Unit, Attached | 0 (0.0%) | 60 (100.0%) |
| 2 Unit Apartments | 55 (44.7%) | 68 (55.3%) |
| 3 or 4 Unit Apartments | 15 (23.4%) | 49 (76.6%) |
| 5 to 9 Unit Apartments | 0 (0.0%) | 102 (100.0%) |
| 10 or more Apartments | 0 (0.0%) | 216 (100.0%) |
| Mobile Home / Other | 74 (57.4%) | 55 (42.6%) |
| Total | 2,491 (73.9%) | 880 (26.1%) |
Housing Structures by Number of Rooms in Sanger
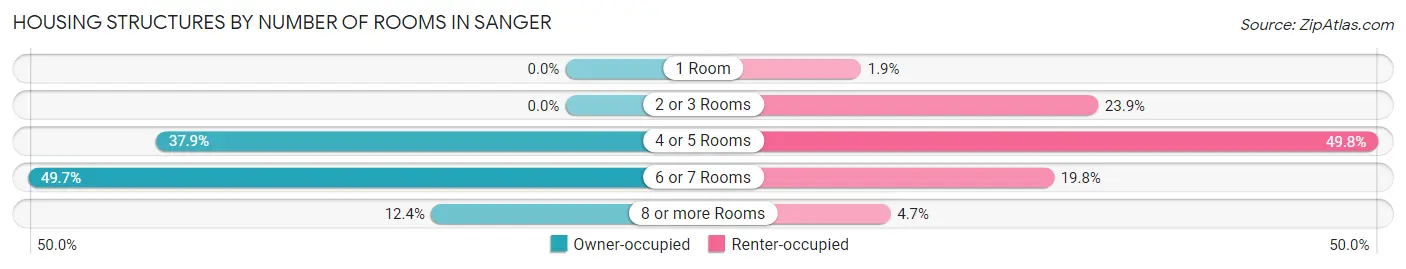
| Number of Rooms | Owner-occupied | Renter-occupied |
| 1 Room | 0 (0.0%) | 17 (1.9%) |
| 2 or 3 Rooms | 0 (0.0%) | 210 (23.9%) |
| 4 or 5 Rooms | 943 (37.9%) | 438 (49.8%) |
| 6 or 7 Rooms | 1,238 (49.7%) | 174 (19.8%) |
| 8 or more Rooms | 310 (12.4%) | 41 (4.7%) |
| Total | 2,491 (100.0%) | 880 (100.0%) |
Housing Structure by Heating Type in Sanger
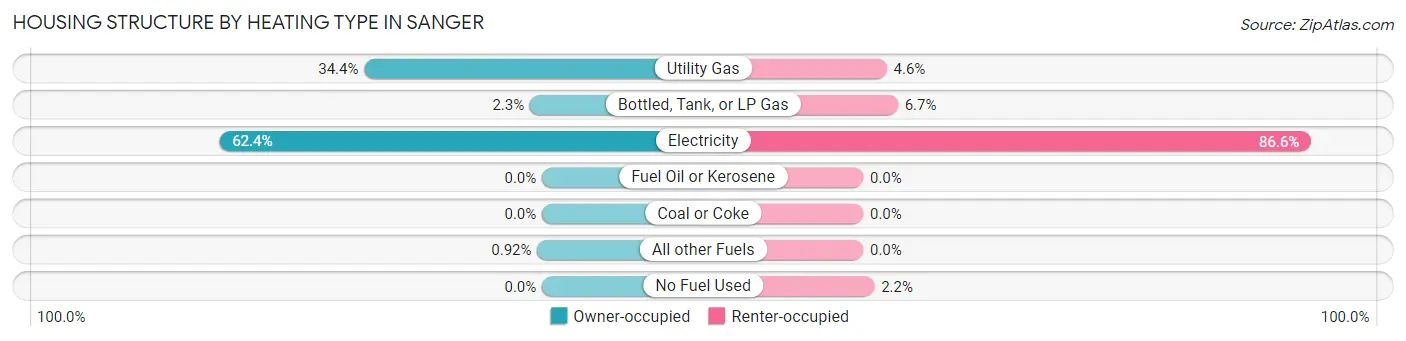
| Heating Type | Owner-occupied | Renter-occupied |
| Utility Gas | 856 (34.4%) | 40 (4.5%) |
| Bottled, Tank, or LP Gas | 58 (2.3%) | 59 (6.7%) |
| Electricity | 1,554 (62.4%) | 762 (86.6%) |
| Fuel Oil or Kerosene | 0 (0.0%) | 0 (0.0%) |
| Coal or Coke | 0 (0.0%) | 0 (0.0%) |
| All other Fuels | 23 (0.9%) | 0 (0.0%) |
| No Fuel Used | 0 (0.0%) | 19 (2.2%) |
| Total | 2,491 (100.0%) | 880 (100.0%) |
Household Vehicle Usage in Sanger
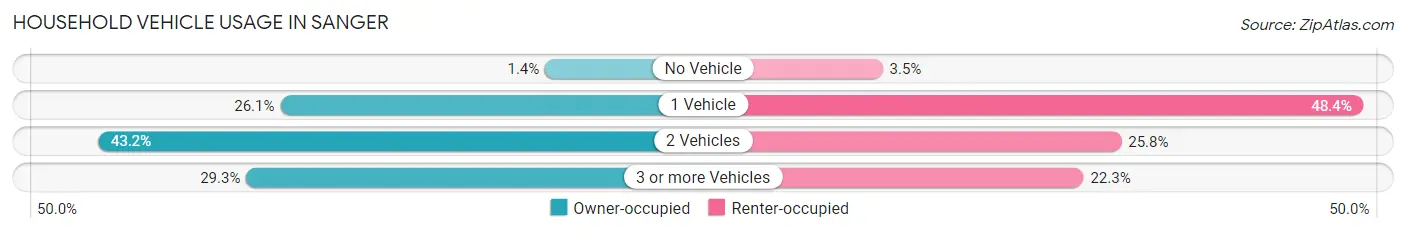
| Vehicles per Household | Owner-occupied | Renter-occupied |
| No Vehicle | 35 (1.4%) | 31 (3.5%) |
| 1 Vehicle | 651 (26.1%) | 426 (48.4%) |
| 2 Vehicles | 1,075 (43.2%) | 227 (25.8%) |
| 3 or more Vehicles | 730 (29.3%) | 196 (22.3%) |
| Total | 2,491 (100.0%) | 880 (100.0%) |
Real Estate & Mortgages in Sanger
Real Estate and Mortgage Overview in Sanger
| Characteristic | Without Mortgage | With Mortgage |
| Housing Units | 682 | 1,809 |
| Median Property Value | $251,800 | $258,100 |
| Median Household Income | $110,903 | $433 |
| Monthly Housing Costs | $720 | $9 |
| Real Estate Taxes | $3,534 | $24 |
Property Value by Mortgage Status in Sanger
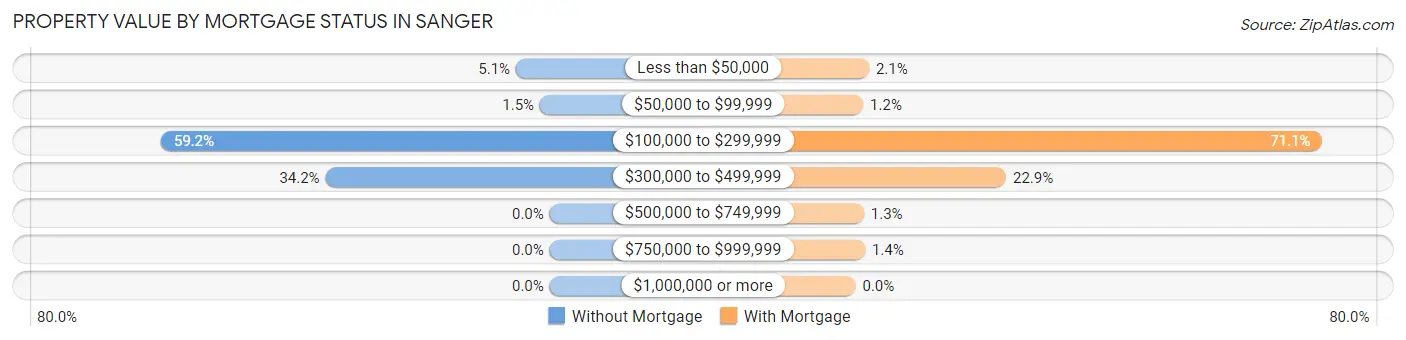
| Property Value | Without Mortgage | With Mortgage |
| Less than $50,000 | 35 (5.1%) | 37 (2.1%) |
| $50,000 to $99,999 | 10 (1.5%) | 21 (1.2%) |
| $100,000 to $299,999 | 404 (59.2%) | 1,287 (71.1%) |
| $300,000 to $499,999 | 233 (34.2%) | 415 (22.9%) |
| $500,000 to $749,999 | 0 (0.0%) | 23 (1.3%) |
| $750,000 to $999,999 | 0 (0.0%) | 26 (1.4%) |
| $1,000,000 or more | 0 (0.0%) | 0 (0.0%) |
| Total | 682 (100.0%) | 1,809 (100.0%) |
Household Income by Mortgage Status in Sanger
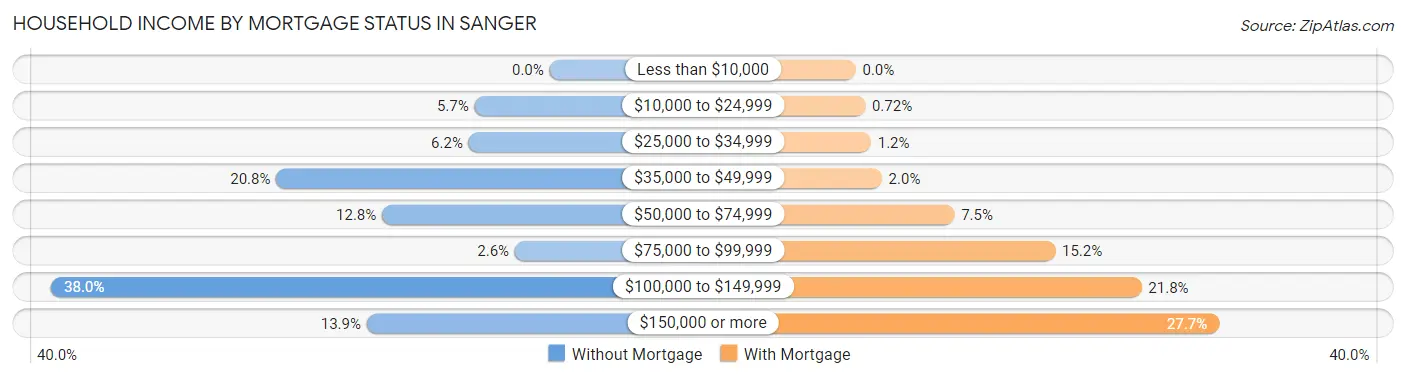
| Household Income | Without Mortgage | With Mortgage |
| Less than $10,000 | 0 (0.0%) | 0 (0.0%) |
| $10,000 to $24,999 | 39 (5.7%) | 13 (0.7%) |
| $25,000 to $34,999 | 42 (6.2%) | 21 (1.2%) |
| $35,000 to $49,999 | 142 (20.8%) | 36 (2.0%) |
| $50,000 to $74,999 | 87 (12.8%) | 136 (7.5%) |
| $75,000 to $99,999 | 18 (2.6%) | 275 (15.2%) |
| $100,000 to $149,999 | 259 (38.0%) | 394 (21.8%) |
| $150,000 or more | 95 (13.9%) | 501 (27.7%) |
| Total | 682 (100.0%) | 1,809 (100.0%) |
Property Value to Household Income Ratio in Sanger
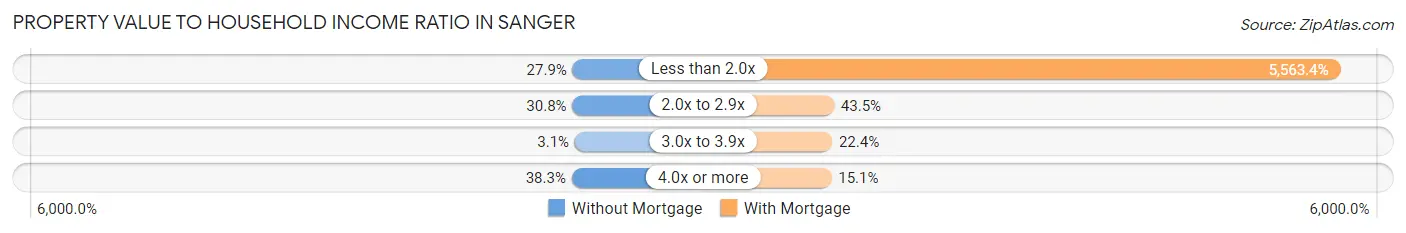
| Value-to-Income Ratio | Without Mortgage | With Mortgage |
| Less than 2.0x | 190 (27.9%) | 100,641 (5,563.3%) |
| 2.0x to 2.9x | 210 (30.8%) | 787 (43.5%) |
| 3.0x to 3.9x | 21 (3.1%) | 406 (22.4%) |
| 4.0x or more | 261 (38.3%) | 273 (15.1%) |
| Total | 682 (100.0%) | 1,809 (100.0%) |
Real Estate Taxes by Mortgage Status in Sanger
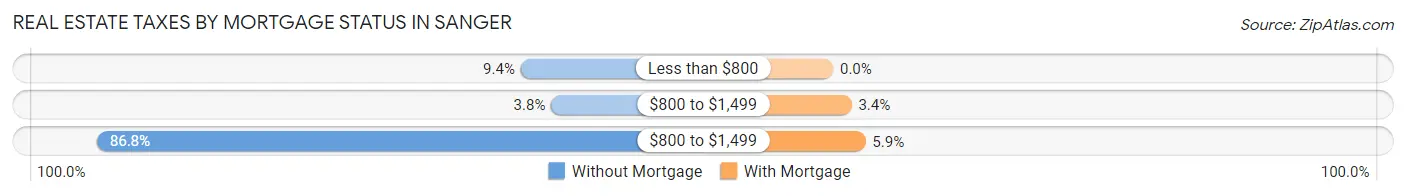
| Property Taxes | Without Mortgage | With Mortgage |
| Less than $800 | 64 (9.4%) | 0 (0.0%) |
| $800 to $1,499 | 26 (3.8%) | 61 (3.4%) |
| $800 to $1,499 | 592 (86.8%) | 107 (5.9%) |
| Total | 682 (100.0%) | 1,809 (100.0%) |
Health & Disability in Sanger
Health Insurance Coverage by Age in Sanger
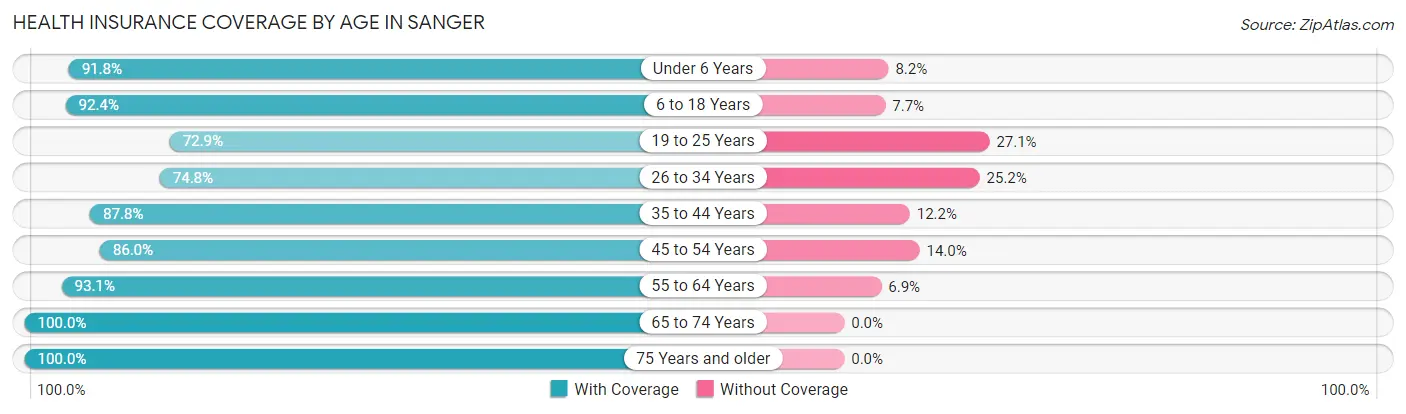
| Age Bracket | With Coverage | Without Coverage |
| Under 6 Years | 1,169 (91.8%) | 105 (8.2%) |
| 6 to 18 Years | 1,183 (92.3%) | 98 (7.6%) |
| 19 to 25 Years | 652 (72.9%) | 242 (27.1%) |
| 26 to 34 Years | 1,114 (74.8%) | 376 (25.2%) |
| 35 to 44 Years | 1,251 (87.8%) | 174 (12.2%) |
| 45 to 54 Years | 649 (86.0%) | 106 (14.0%) |
| 55 to 64 Years | 875 (93.1%) | 65 (6.9%) |
| 65 to 74 Years | 594 (100.0%) | 0 (0.0%) |
| 75 Years and older | 388 (100.0%) | 0 (0.0%) |
| Total | 7,875 (87.1%) | 1,166 (12.9%) |
Health Insurance Coverage by Citizenship Status in Sanger
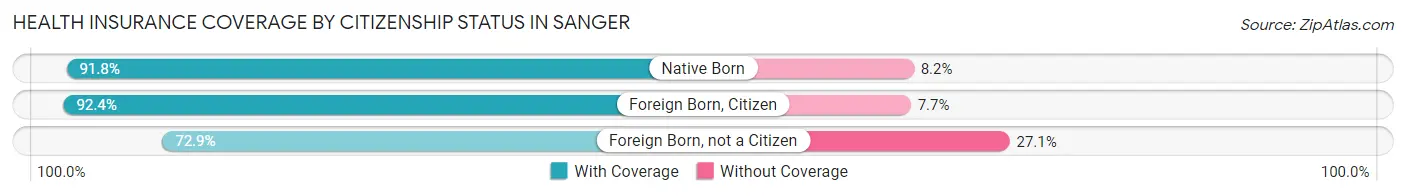
| Citizenship Status | With Coverage | Without Coverage |
| Native Born | 1,169 (91.8%) | 105 (8.2%) |
| Foreign Born, Citizen | 1,183 (92.3%) | 98 (7.6%) |
| Foreign Born, not a Citizen | 652 (72.9%) | 242 (27.1%) |
Health Insurance Coverage by Household Income in Sanger
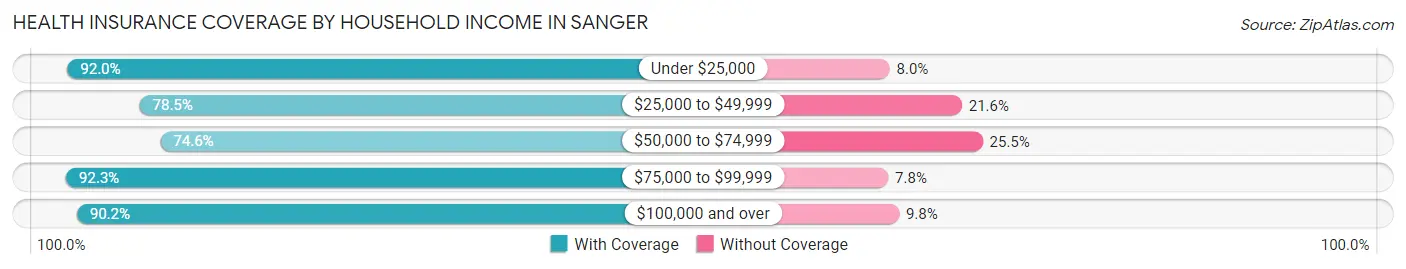
| Household Income | With Coverage | Without Coverage |
| Under $25,000 | 367 (92.0%) | 32 (8.0%) |
| $25,000 to $49,999 | 863 (78.4%) | 237 (21.5%) |
| $50,000 to $74,999 | 920 (74.6%) | 314 (25.5%) |
| $75,000 to $99,999 | 1,548 (92.2%) | 130 (7.7%) |
| $100,000 and over | 4,177 (90.2%) | 453 (9.8%) |
Public vs Private Health Insurance Coverage by Age in Sanger
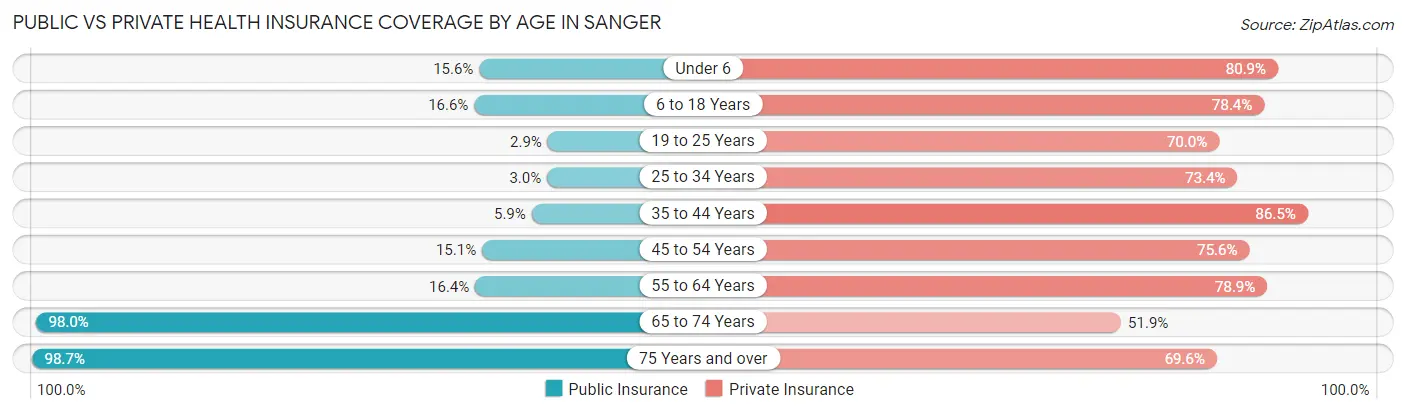
| Age Bracket | Public Insurance | Private Insurance |
| Under 6 | 199 (15.6%) | 1,031 (80.9%) |
| 6 to 18 Years | 212 (16.6%) | 1,004 (78.4%) |
| 19 to 25 Years | 26 (2.9%) | 626 (70.0%) |
| 25 to 34 Years | 45 (3.0%) | 1,094 (73.4%) |
| 35 to 44 Years | 84 (5.9%) | 1,232 (86.5%) |
| 45 to 54 Years | 114 (15.1%) | 571 (75.6%) |
| 55 to 64 Years | 154 (16.4%) | 742 (78.9%) |
| 65 to 74 Years | 582 (98.0%) | 308 (51.8%) |
| 75 Years and over | 383 (98.7%) | 270 (69.6%) |
| Total | 1,799 (19.9%) | 6,878 (76.1%) |
Disability Status by Sex by Age in Sanger
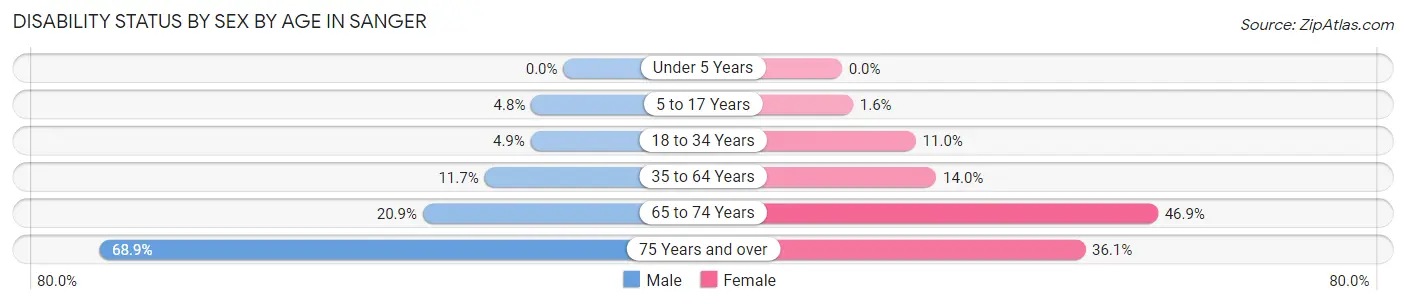
| Age Bracket | Male | Female |
| Under 5 Years | 0 (0.0%) | 0 (0.0%) |
| 5 to 17 Years | 42 (4.8%) | 10 (1.6%) |
| 18 to 34 Years | 61 (4.9%) | 138 (11.0%) |
| 35 to 64 Years | 189 (11.7%) | 211 (14.0%) |
| 65 to 74 Years | 43 (20.9%) | 182 (46.9%) |
| 75 Years and over | 111 (68.9%) | 82 (36.1%) |
Disability Class by Sex by Age in Sanger
Disability Class: Hearing Difficulty
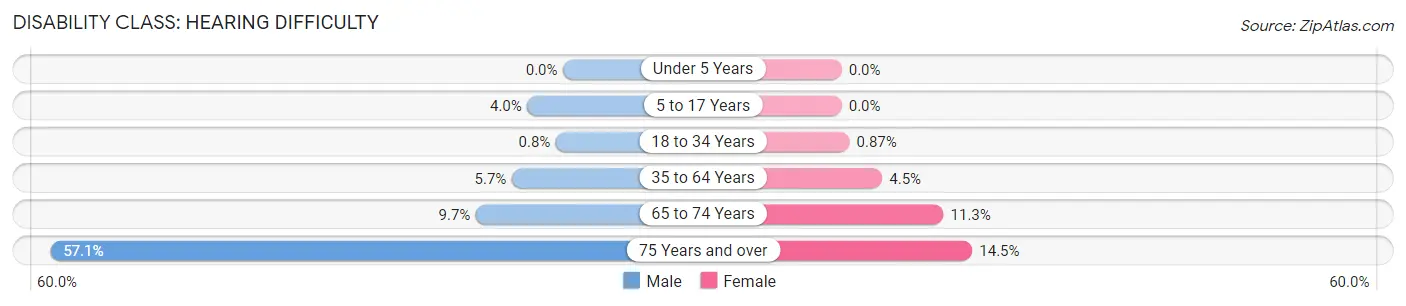
| Age Bracket | Male | Female |
| Under 5 Years | 0 (0.0%) | 0 (0.0%) |
| 5 to 17 Years | 35 (4.0%) | 0 (0.0%) |
| 18 to 34 Years | 10 (0.8%) | 11 (0.9%) |
| 35 to 64 Years | 92 (5.7%) | 68 (4.5%) |
| 65 to 74 Years | 20 (9.7%) | 44 (11.3%) |
| 75 Years and over | 92 (57.1%) | 33 (14.5%) |
Disability Class: Vision Difficulty
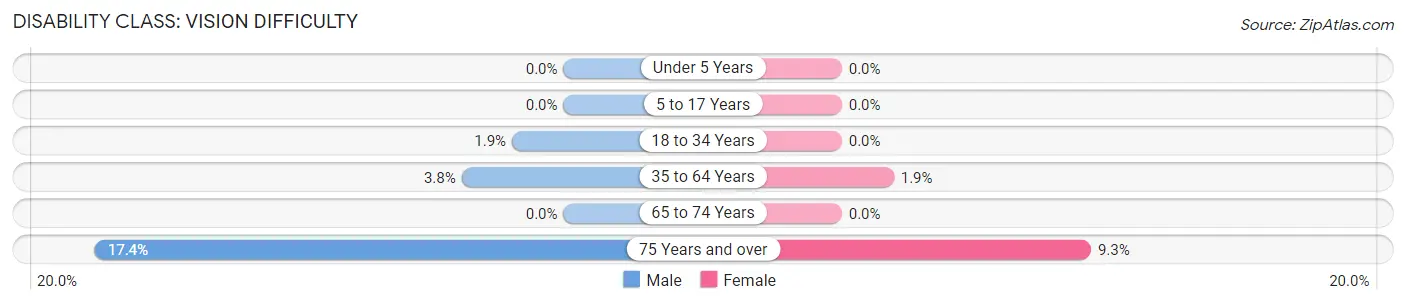
| Age Bracket | Male | Female |
| Under 5 Years | 0 (0.0%) | 0 (0.0%) |
| 5 to 17 Years | 0 (0.0%) | 0 (0.0%) |
| 18 to 34 Years | 24 (1.9%) | 0 (0.0%) |
| 35 to 64 Years | 61 (3.8%) | 29 (1.9%) |
| 65 to 74 Years | 0 (0.0%) | 0 (0.0%) |
| 75 Years and over | 28 (17.4%) | 21 (9.2%) |
Disability Class: Cognitive Difficulty
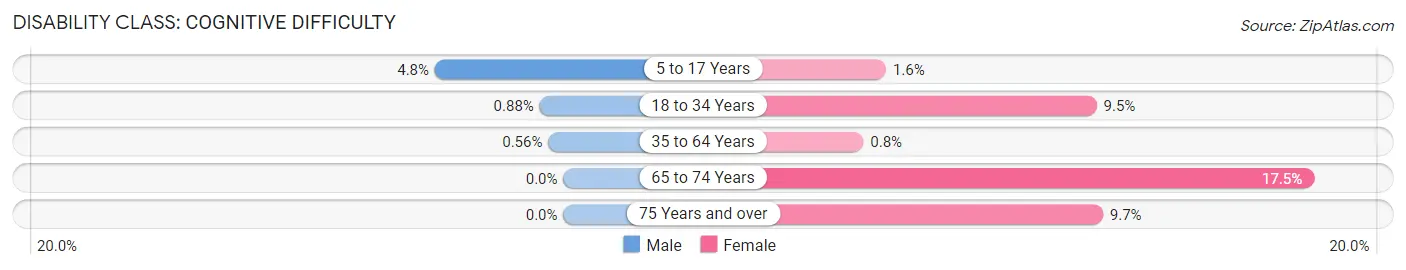
| Age Bracket | Male | Female |
| 5 to 17 Years | 42 (4.8%) | 10 (1.6%) |
| 18 to 34 Years | 11 (0.9%) | 119 (9.5%) |
| 35 to 64 Years | 9 (0.6%) | 12 (0.8%) |
| 65 to 74 Years | 0 (0.0%) | 68 (17.5%) |
| 75 Years and over | 0 (0.0%) | 22 (9.7%) |
Disability Class: Ambulatory Difficulty
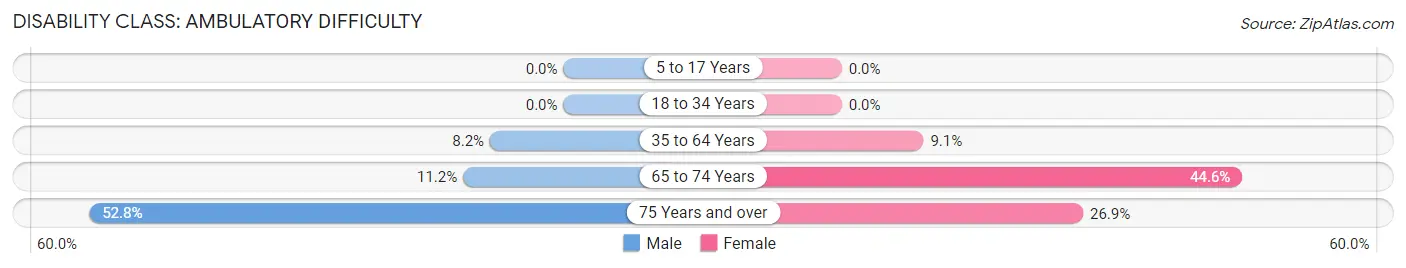
| Age Bracket | Male | Female |
| 5 to 17 Years | 0 (0.0%) | 0 (0.0%) |
| 18 to 34 Years | 0 (0.0%) | 0 (0.0%) |
| 35 to 64 Years | 132 (8.2%) | 137 (9.1%) |
| 65 to 74 Years | 23 (11.2%) | 173 (44.6%) |
| 75 Years and over | 85 (52.8%) | 61 (26.9%) |
Disability Class: Self-Care Difficulty
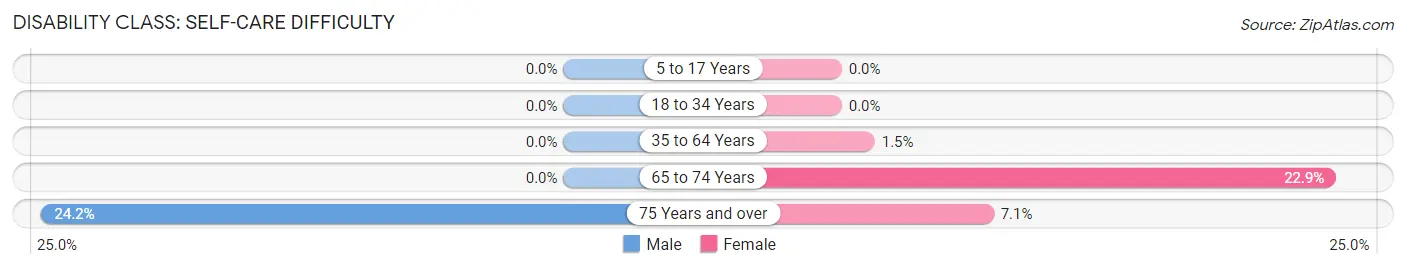
| Age Bracket | Male | Female |
| 5 to 17 Years | 0 (0.0%) | 0 (0.0%) |
| 18 to 34 Years | 0 (0.0%) | 0 (0.0%) |
| 35 to 64 Years | 0 (0.0%) | 23 (1.5%) |
| 65 to 74 Years | 0 (0.0%) | 89 (22.9%) |
| 75 Years and over | 39 (24.2%) | 16 (7.0%) |
Technology Access in Sanger
Computing Device Access in Sanger
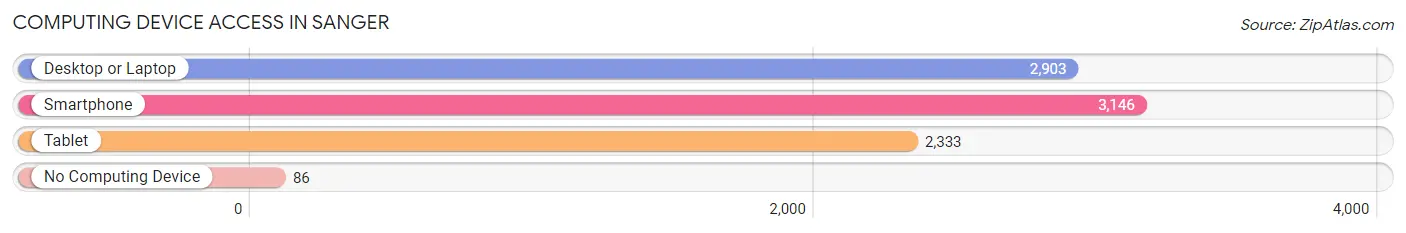
| Device Type | # Households | % Households |
| Desktop or Laptop | 2,903 | 86.1% |
| Smartphone | 3,146 | 93.3% |
| Tablet | 2,333 | 69.2% |
| No Computing Device | 86 | 2.5% |
| Total | 3,371 | 100.0% |
Internet Access in Sanger
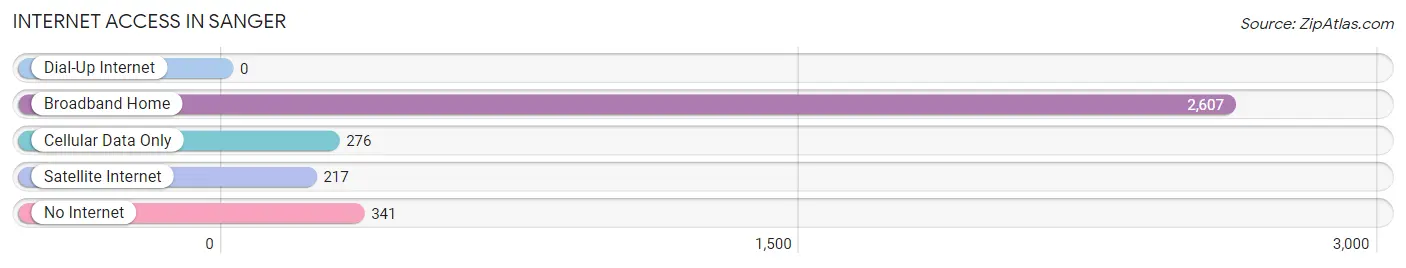
| Internet Type | # Households | % Households |
| Dial-Up Internet | 0 | 0.0% |
| Broadband Home | 2,607 | 77.3% |
| Cellular Data Only | 276 | 8.2% |
| Satellite Internet | 217 | 6.4% |
| No Internet | 341 | 10.1% |
| Total | 3,371 | 100.0% |
Sanger Summary
Sanger, Texas is a small city located in Denton County, Texas. It is situated about 30 miles north of Dallas and is part of the Dallas-Fort Worth-Arlington metropolitan area. The city was founded in 1873 and was named after a local rancher, John Sanger. The population of Sanger was estimated to be 6,845 in 2019.
History
Sanger was founded in 1873 by John Sanger, a local rancher. The city was originally known as Sanger Station, as it was a stop on the Texas and Pacific Railway. The city was incorporated in 1884 and was named after John Sanger.
In the early 1900s, Sanger was a thriving agricultural community. The city was known for its cotton production and was home to several cotton gins. The city also had a number of businesses, including a bank, a hotel, a drug store, and a blacksmith shop.
In the 1950s, Sanger began to experience a population boom as people moved to the city from other parts of Texas. This growth was due to the city's proximity to Dallas and the availability of jobs in the area.
Geography
Sanger is located in Denton County, Texas. It is situated about 30 miles north of Dallas and is part of the Dallas-Fort Worth-Arlington metropolitan area. The city is located on the banks of the Elm Fork of the Trinity River.
The city has a total area of 4.3 square miles, all of which is land. The terrain is mostly flat, with some rolling hills. The climate is humid subtropical, with hot summers and mild winters.
Economy
The economy of Sanger is largely based on agriculture and manufacturing. The city is home to several cotton gins and is known for its cotton production. The city also has a number of businesses, including a bank, a hotel, a drug store, and a blacksmith shop.
The city is also home to several manufacturing companies, including a plastics manufacturer, a metal fabricator, and a food processor. The city is also home to a number of retail stores, restaurants, and other businesses.
Demographics
The population of Sanger was estimated to be 6,845 in 2019. The population is predominantly white (83.3%), followed by Hispanic or Latino (11.2%), African American (3.2%), and Asian (1.7%).
The median household income in Sanger is $50,945, and the median home value is $164,400. The city has a poverty rate of 11.2%. The city has a high school graduation rate of 92.3%.
Conclusion
Sanger, Texas is a small city located in Denton County, Texas. It is situated about 30 miles north of Dallas and is part of the Dallas-Fort Worth-Arlington metropolitan area. The city was founded in 1873 and was named after a local rancher, John Sanger. The population of Sanger was estimated to be 6,845 in 2019. The economy of Sanger is largely based on agriculture and manufacturing, and the city is home to several businesses, including a bank, a hotel, a drug store, and a blacksmith shop. The population of Sanger is predominantly white (83.3%), followed by Hispanic or Latino (11.2%), African American (3.2%), and Asian (1.7%). The median household income in Sanger is $50,945, and the median home value is $164,400. The city has a high school graduation rate of 92.3%.
Common Questions
What is Per Capita Income in Sanger?
Per Capita income in Sanger is $37,181.
What is the Median Family Income in Sanger?
Median Family Income in Sanger is $106,875.
What is the Median Household income in Sanger?
Median Household Income in Sanger is $86,083.
What is Income or Wage Gap in Sanger?
Income or Wage Gap in Sanger is 38.9%.
Women in Sanger earn 61.1 cents for every dollar earned by a man.
What is Inequality or Gini Index in Sanger?
Inequality or Gini Index in Sanger is 0.33.
What is the Total Population of Sanger?
Total Population of Sanger is 9,041.
What is the Total Male Population of Sanger?
Total Male Population of Sanger is 4,700.
What is the Total Female Population of Sanger?
Total Female Population of Sanger is 4,341.
What is the Ratio of Males per 100 Females in Sanger?
There are 108.27 Males per 100 Females in Sanger.
What is the Ratio of Females per 100 Males in Sanger?
There are 92.36 Females per 100 Males in Sanger.
What is the Median Population Age in Sanger?
Median Population Age in Sanger is 31.8 Years.
What is the Average Family Size in Sanger
Average Family Size in Sanger is 3.3 People.
What is the Average Household Size in Sanger
Average Household Size in Sanger is 2.7 People.
How Large is the Labor Force in Sanger?
There are 4,968 People in the Labor Forcein in Sanger.
What is the Percentage of People in the Labor Force in Sanger?
74.6% of People are in the Labor Force in Sanger.
What is the Unemployment Rate in Sanger?
Unemployment Rate in Sanger is 1.8%.