San Isidro, TX Map & Demographics
San Isidro Map
San Isidro Overview
$17,555
PER CAPITA INCOME
$41,326
AVG FAMILY INCOME
$40,492
AVG HOUSEHOLD INCOME
0.38
INEQUALITY / GINI INDEX
255
TOTAL POPULATION
129
MALE POPULATION
126
FEMALE POPULATION
102.38
MALES / 100 FEMALES
97.67
FEMALES / 100 MALES
48.2
MEDIAN AGE
3.2
AVG FAMILY SIZE
2.7
AVG HOUSEHOLD SIZE
96
LABOR FORCE [ PEOPLE ]
41.6%
PERCENT IN LABOR FORCE
5.2%
UNEMPLOYMENT RATE
San Isidro Zip Codes
San Isidro Area Codes
Income in San Isidro
Income Overview in San Isidro
Per Capita Income in San Isidro is $17,555, while median incomes of families and households are $41,326 and $40,492 respectively.
| Characteristic | Number | Measure |
| Per Capita Income | 255 | $17,555 |
| Median Family Income | 73 | $41,326 |
| Mean Family Income | 73 | $51,697 |
| Median Household Income | 95 | $40,492 |
| Mean Household Income | 95 | $42,765 |
| Income Deficit | 73 | $0 |
| Wage / Income Gap (%) | 255 | 0.00% |
| Wage / Income Gap ($) | 255 | 100.00¢ per $1 |
| Gini / Inequality Index | 255 | 0.38 |
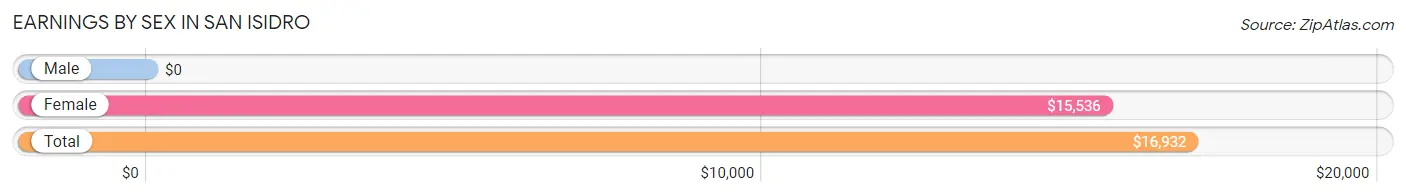
Earnings by Sex in San Isidro
| Sex | Number | Average Earnings |
| Male | 14 (15.4%) | $0 |
| Female | 77 (84.6%) | $15,536 |
| Total | 91 (100.0%) | $16,932 |
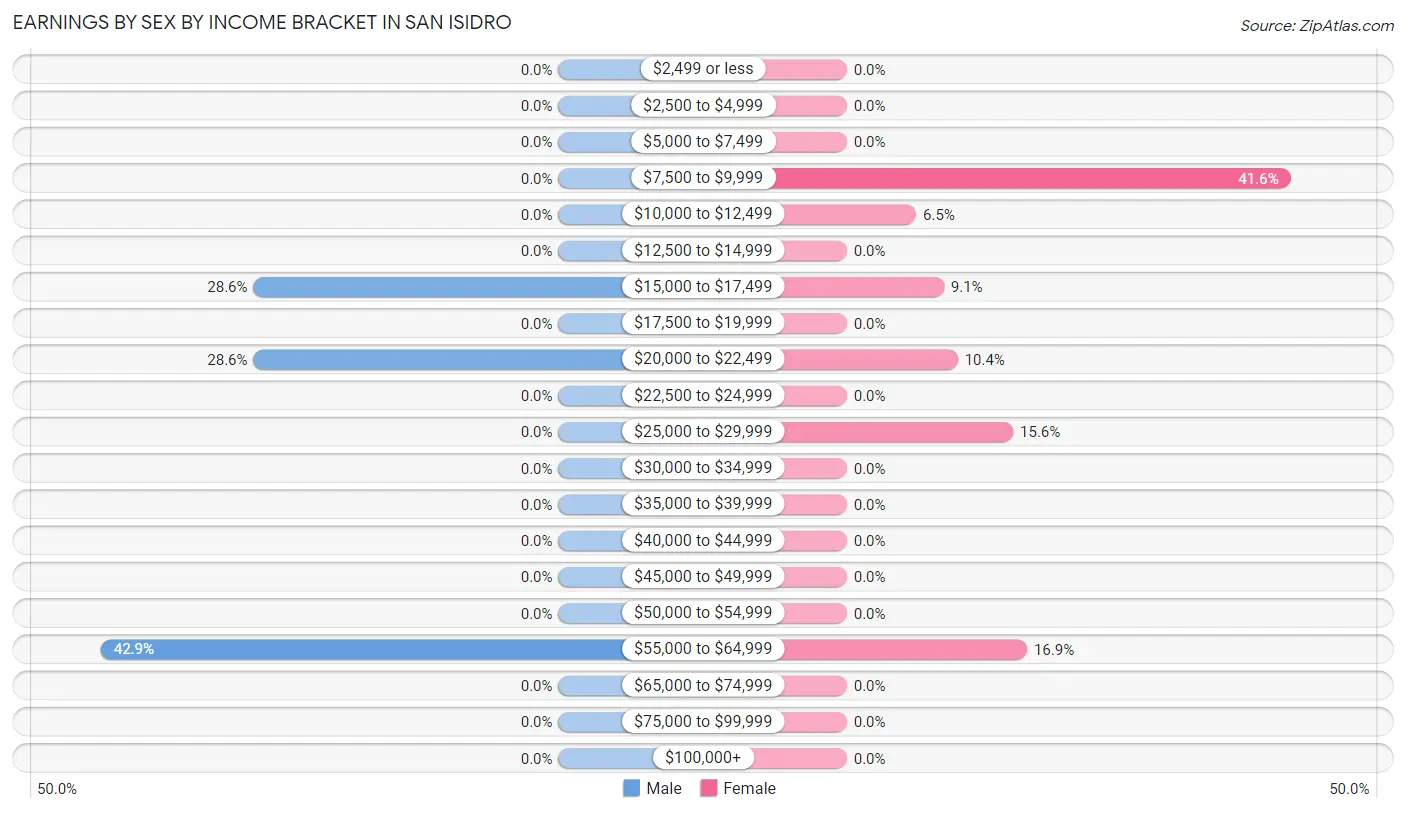
Earnings by Sex by Income Bracket in San Isidro
The most common earnings brackets in San Isidro are $55,000 to $64,999 for men (6 | 42.9%) and $7,500 to $9,999 for women (32 | 41.6%).
| Income | Male | Female |
| $2,499 or less | 0 (0.0%) | 0 (0.0%) |
| $2,500 to $4,999 | 0 (0.0%) | 0 (0.0%) |
| $5,000 to $7,499 | 0 (0.0%) | 0 (0.0%) |
| $7,500 to $9,999 | 0 (0.0%) | 32 (41.6%) |
| $10,000 to $12,499 | 0 (0.0%) | 5 (6.5%) |
| $12,500 to $14,999 | 0 (0.0%) | 0 (0.0%) |
| $15,000 to $17,499 | 4 (28.6%) | 7 (9.1%) |
| $17,500 to $19,999 | 0 (0.0%) | 0 (0.0%) |
| $20,000 to $22,499 | 4 (28.6%) | 8 (10.4%) |
| $22,500 to $24,999 | 0 (0.0%) | 0 (0.0%) |
| $25,000 to $29,999 | 0 (0.0%) | 12 (15.6%) |
| $30,000 to $34,999 | 0 (0.0%) | 0 (0.0%) |
| $35,000 to $39,999 | 0 (0.0%) | 0 (0.0%) |
| $40,000 to $44,999 | 0 (0.0%) | 0 (0.0%) |
| $45,000 to $49,999 | 0 (0.0%) | 0 (0.0%) |
| $50,000 to $54,999 | 0 (0.0%) | 0 (0.0%) |
| $55,000 to $64,999 | 6 (42.9%) | 13 (16.9%) |
| $65,000 to $74,999 | 0 (0.0%) | 0 (0.0%) |
| $75,000 to $99,999 | 0 (0.0%) | 0 (0.0%) |
| $100,000+ | 0 (0.0%) | 0 (0.0%) |
| Total | 14 (100.0%) | 77 (100.0%) |
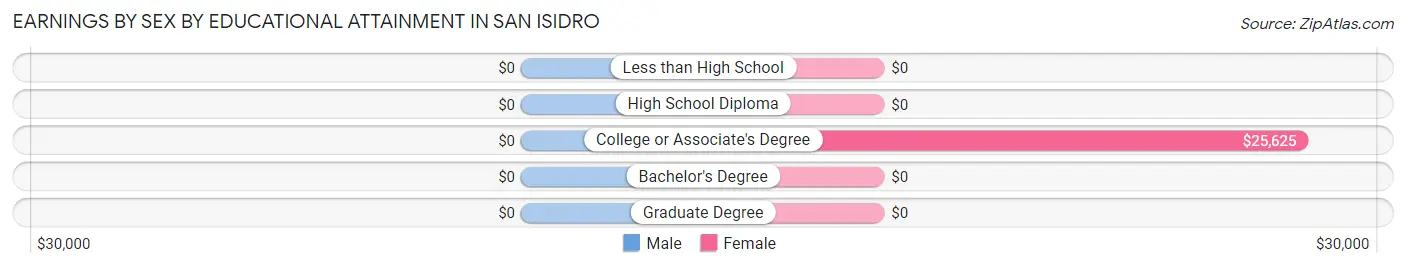
Earnings by Sex by Educational Attainment in San Isidro
| Educational Attainment | Male Income | Female Income |
| Less than High School | - | - |
| High School Diploma | - | - |
| College or Associate's Degree | - | - |
| Bachelor's Degree | - | - |
| Graduate Degree | - | - |
| Total | - | - |
Family Income in San Isidro
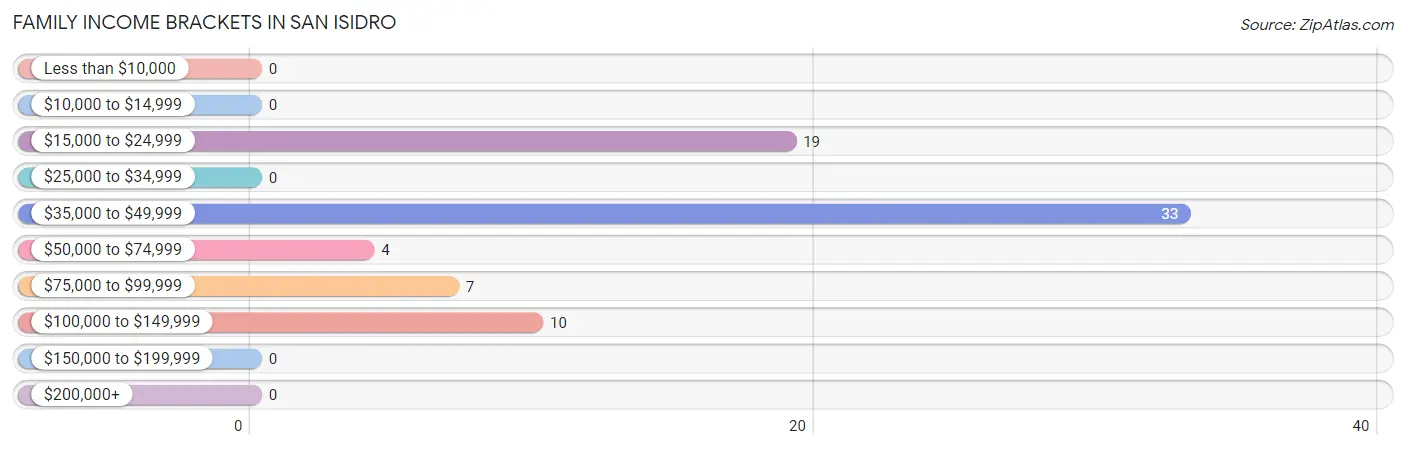
Family Income Brackets in San Isidro
According to the San Isidro family income data, there are 33 families falling into the $35,000 to $49,999 income range, which is the most common income bracket and makes up 45.2% of all families.
| Income Bracket | # Families | % Families |
| Less than $10,000 | 0 | 0.0% |
| $10,000 to $14,999 | 0 | 0.0% |
| $15,000 to $24,999 | 19 | 26.0% |
| $25,000 to $34,999 | 0 | 0.0% |
| $35,000 to $49,999 | 33 | 45.2% |
| $50,000 to $74,999 | 4 | 5.5% |
| $75,000 to $99,999 | 7 | 9.6% |
| $100,000 to $149,999 | 10 | 13.7% |
| $150,000 to $199,999 | 0 | 0.0% |
| $200,000+ | 0 | 0.0% |
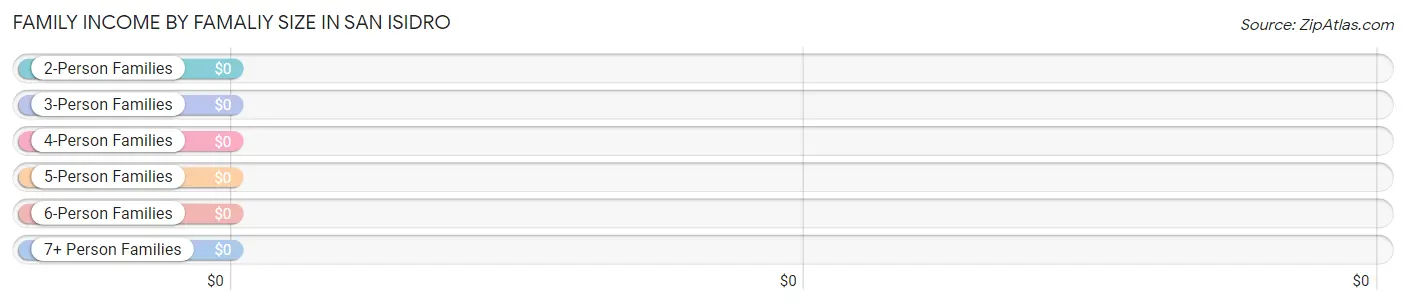
Family Income by Famaliy Size in San Isidro
| Income Bracket | # Families | Median Income |
| 2-Person Families | 29 (39.7%) | $0 |
| 3-Person Families | 37 (50.7%) | $0 |
| 4-Person Families | 3 (4.1%) | $0 |
| 5-Person Families | 4 (5.5%) | $0 |
| 6-Person Families | 0 (0.0%) | $0 |
| 7+ Person Families | 0 (0.0%) | $0 |
| Total | 73 (100.0%) | $41,326 |
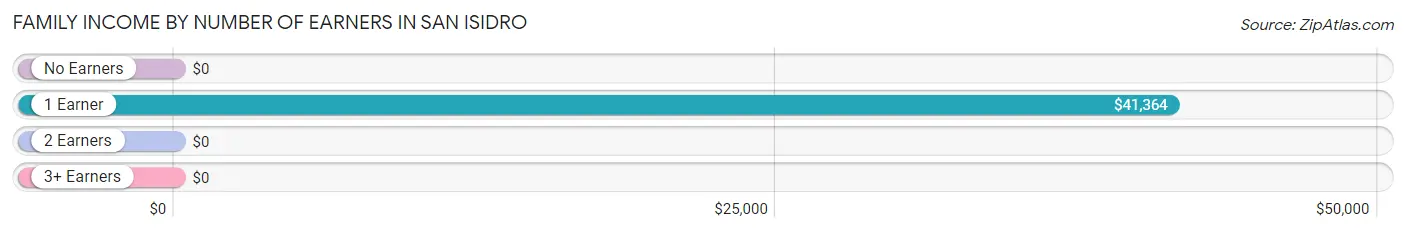
Family Income by Number of Earners in San Isidro
| Number of Earners | # Families | Median Income |
| No Earners | 12 (16.4%) | $0 |
| 1 Earner | 50 (68.5%) | $41,364 |
| 2 Earners | 7 (9.6%) | $0 |
| 3+ Earners | 4 (5.5%) | $0 |
| Total | 73 (100.0%) | $41,326 |
Household Income in San Isidro
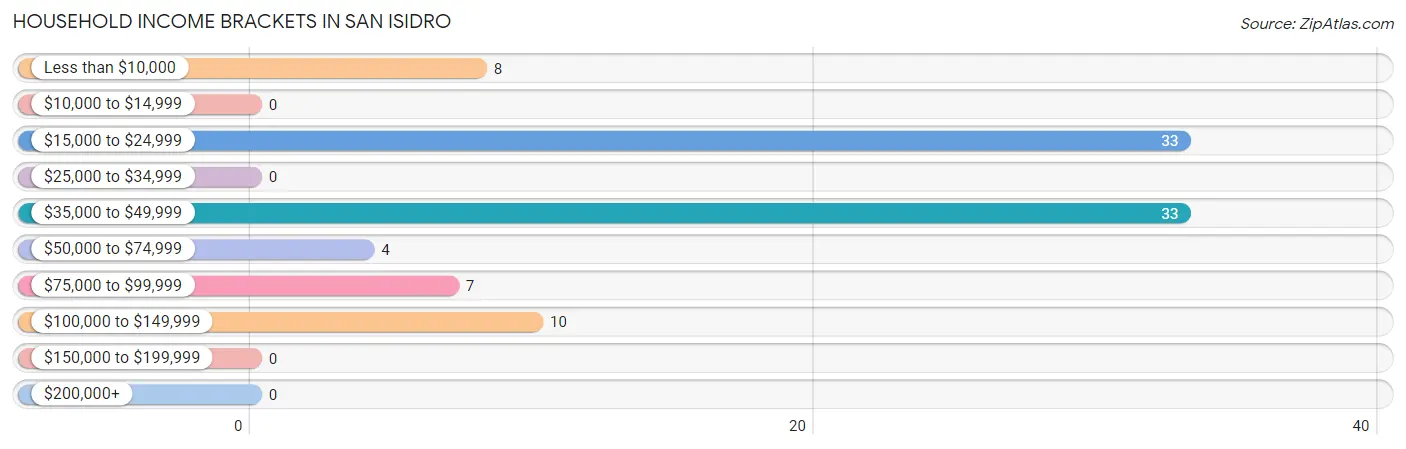
Household Income Brackets in San Isidro
With 33 households falling in the category, the $15,000 to $24,999 income range is the most frequent in San Isidro, accounting for 34.7% of all households.
| Income Bracket | # Households | % Households |
| Less than $10,000 | 8 | 8.4% |
| $10,000 to $14,999 | 0 | 0.0% |
| $15,000 to $24,999 | 33 | 34.7% |
| $25,000 to $34,999 | 0 | 0.0% |
| $35,000 to $49,999 | 33 | 34.7% |
| $50,000 to $74,999 | 4 | 4.2% |
| $75,000 to $99,999 | 7 | 7.4% |
| $100,000 to $149,999 | 10 | 10.5% |
| $150,000 to $199,999 | 0 | 0.0% |
| $200,000+ | 0 | 0.0% |
Household Income by Householder Age in San Isidro
The median household income in San Isidro is $40,492, with the highest median household income of $41,402 found in the 45 to 64 years age bracket for the primary householder. A total of 57 households (60.0%) fall into this category.
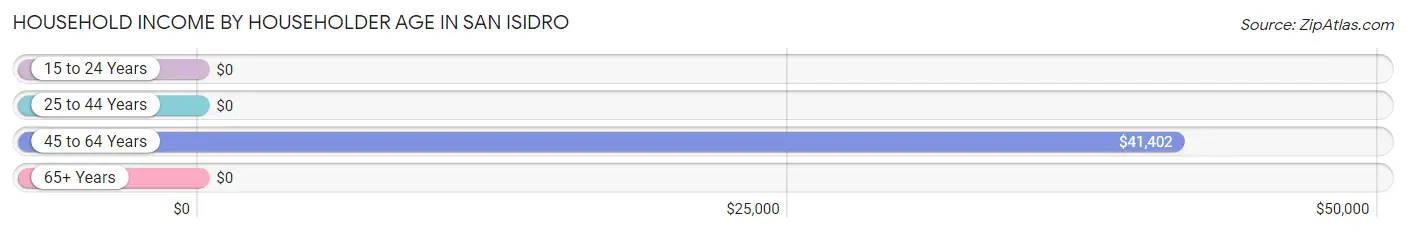
| Income Bracket | # Households | Median Income |
| 15 to 24 Years | 0 (0.0%) | $0 |
| 25 to 44 Years | 12 (12.6%) | $0 |
| 45 to 64 Years | 57 (60.0%) | $41,402 |
| 65+ Years | 26 (27.4%) | $0 |
| Total | 95 (100.0%) | $40,492 |
Poverty in San Isidro
Income Below Poverty by Sex and Age in San Isidro
With 10.8% poverty level for males and 11.9% for females among the residents of San Isidro, 18 to 24 year old males and 35 to 44 year old females are the most vulnerable to poverty, with 14 males (100.0%) and 5 females (41.7%) in their respective age groups living below the poverty level.
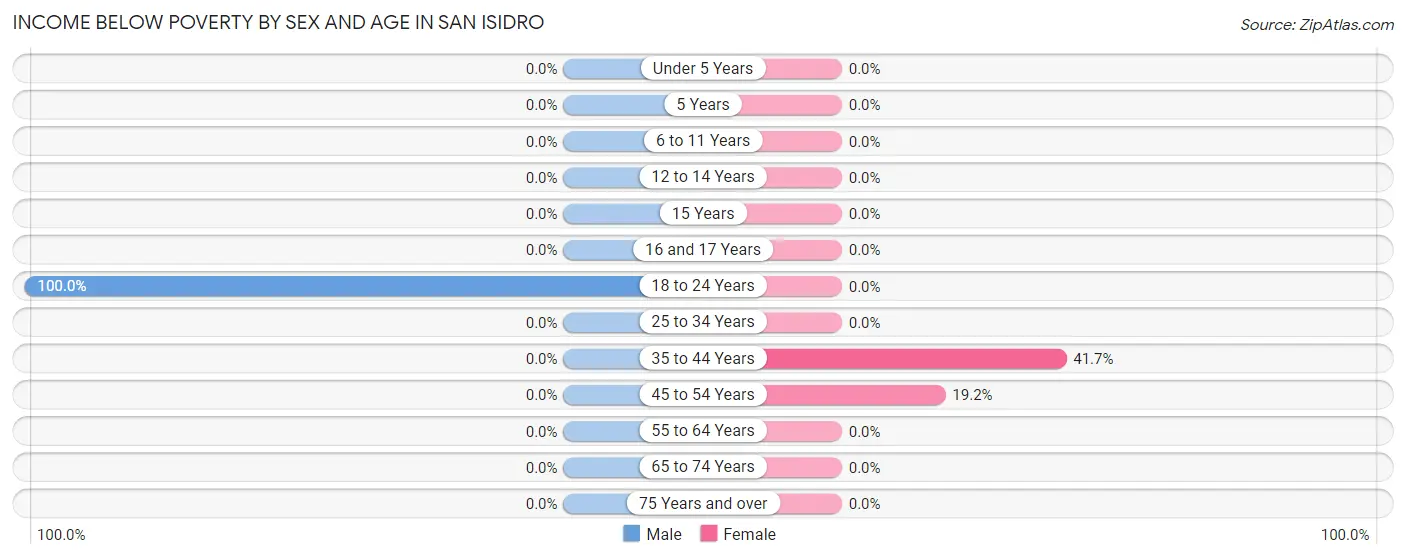
| Age Bracket | Male | Female |
| Under 5 Years | 0 (0.0%) | 0 (0.0%) |
| 5 Years | 0 (0.0%) | 0 (0.0%) |
| 6 to 11 Years | 0 (0.0%) | 0 (0.0%) |
| 12 to 14 Years | 0 (0.0%) | 0 (0.0%) |
| 15 Years | 0 (0.0%) | 0 (0.0%) |
| 16 and 17 Years | 0 (0.0%) | 0 (0.0%) |
| 18 to 24 Years | 14 (100.0%) | 0 (0.0%) |
| 25 to 34 Years | 0 (0.0%) | 0 (0.0%) |
| 35 to 44 Years | 0 (0.0%) | 5 (41.7%) |
| 45 to 54 Years | 0 (0.0%) | 10 (19.2%) |
| 55 to 64 Years | 0 (0.0%) | 0 (0.0%) |
| 65 to 74 Years | 0 (0.0%) | 0 (0.0%) |
| 75 Years and over | 0 (0.0%) | 0 (0.0%) |
| Total | 14 (10.8%) | 15 (11.9%) |
Income Above Poverty by Sex and Age in San Isidro
According to the poverty statistics in San Isidro, males aged 12 to 14 years and females aged 6 to 11 years are the age groups that are most secure financially, with 100.0% of males and 100.0% of females in these age groups living above the poverty line.
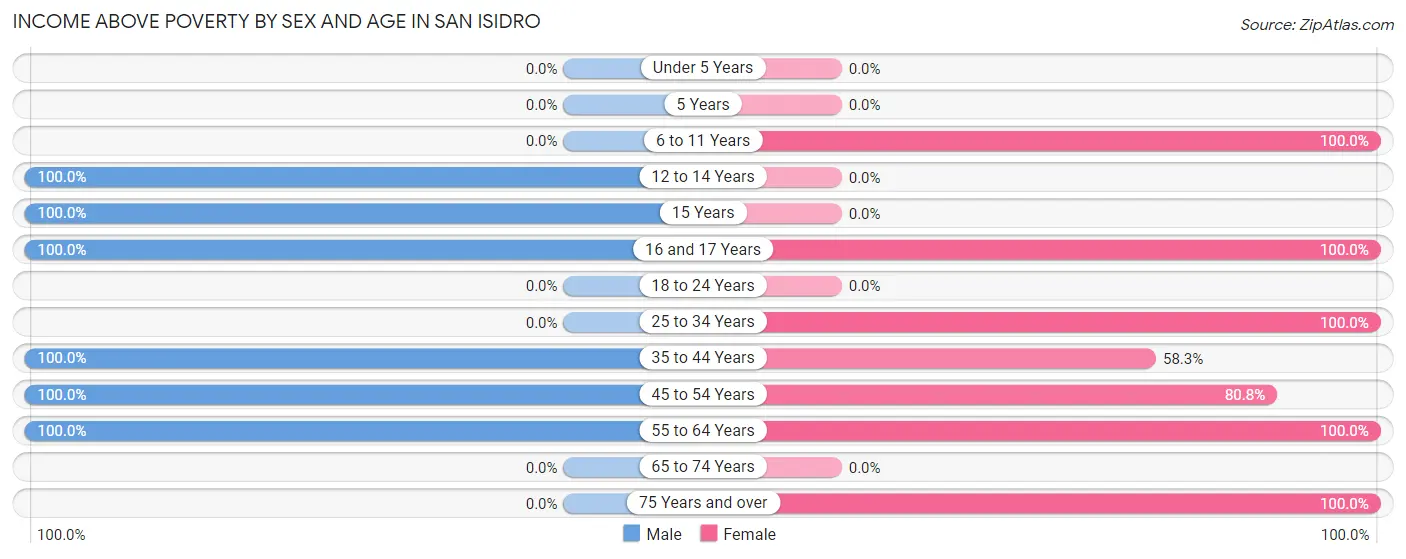
| Age Bracket | Male | Female |
| Under 5 Years | 0 (0.0%) | 0 (0.0%) |
| 5 Years | 0 (0.0%) | 0 (0.0%) |
| 6 to 11 Years | 0 (0.0%) | 10 (100.0%) |
| 12 to 14 Years | 4 (100.0%) | 0 (0.0%) |
| 15 Years | 10 (100.0%) | 0 (0.0%) |
| 16 and 17 Years | 36 (100.0%) | 5 (100.0%) |
| 18 to 24 Years | 0 (0.0%) | 0 (0.0%) |
| 25 to 34 Years | 0 (0.0%) | 16 (100.0%) |
| 35 to 44 Years | 6 (100.0%) | 7 (58.3%) |
| 45 to 54 Years | 22 (100.0%) | 42 (80.8%) |
| 55 to 64 Years | 37 (100.0%) | 5 (100.0%) |
| 65 to 74 Years | 0 (0.0%) | 0 (0.0%) |
| 75 Years and over | 0 (0.0%) | 26 (100.0%) |
| Total | 115 (89.1%) | 111 (88.1%) |
Income Below Poverty Among Married-Couple Families in San Isidro
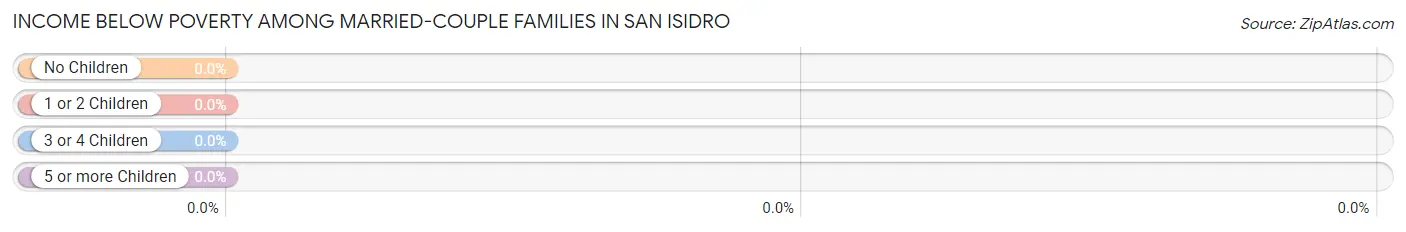
| Children | Above Poverty | Below Poverty |
| No Children | 0 (0.0%) | 0 (0.0%) |
| 1 or 2 Children | 44 (100.0%) | 0 (0.0%) |
| 3 or 4 Children | 0 (0.0%) | 0 (0.0%) |
| 5 or more Children | 0 (0.0%) | 0 (0.0%) |
| Total | 44 (100.0%) | 0 (0.0%) |
Income Below Poverty Among Single-Parent Households in San Isidro
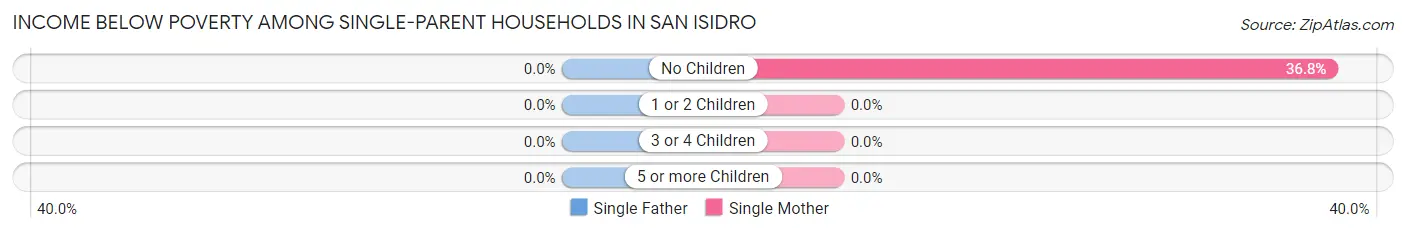
| Children | Single Father | Single Mother |
| No Children | 0 (0.0%) | 7 (36.8%) |
| 1 or 2 Children | 0 (0.0%) | 0 (0.0%) |
| 3 or 4 Children | 0 (0.0%) | 0 (0.0%) |
| 5 or more Children | 0 (0.0%) | 0 (0.0%) |
| Total | 0 (0.0%) | 7 (24.1%) |
Income Below Poverty Among Married-Couple vs Single-Parent Households in San Isidro
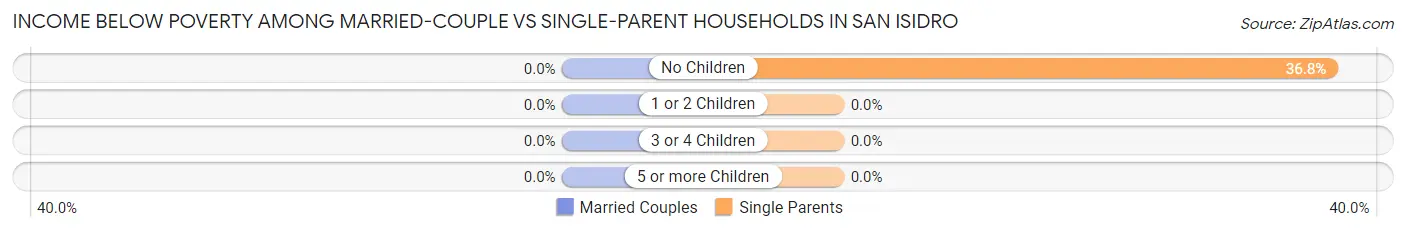
| Children | Married-Couple Families | Single-Parent Households |
| No Children | 0 (0.0%) | 7 (36.8%) |
| 1 or 2 Children | 0 (0.0%) | 0 (0.0%) |
| 3 or 4 Children | 0 (0.0%) | 0 (0.0%) |
| 5 or more Children | 0 (0.0%) | 0 (0.0%) |
| Total | 0 (0.0%) | 7 (24.1%) |
Race in San Isidro
The most populous races in San Isidro are Hispanic or Latino (255 | 100.0%), White / Caucasian (156 | 61.2%), and Two or more Races (99 | 38.8%).
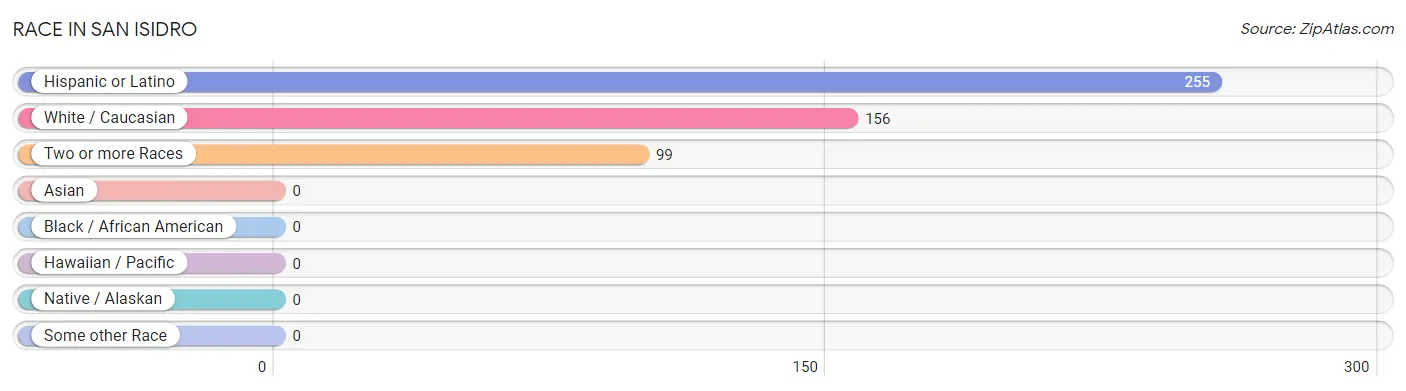
| Race | # Population | % Population |
| Asian | 0 | 0.0% |
| Black / African American | 0 | 0.0% |
| Hawaiian / Pacific | 0 | 0.0% |
| Hispanic or Latino | 255 | 100.0% |
| Native / Alaskan | 0 | 0.0% |
| White / Caucasian | 156 | 61.2% |
| Two or more Races | 99 | 38.8% |
| Some other Race | 0 | 0.0% |
| Total | 255 | 100.0% |
Ancestry in San Isidro
The most populous ancestries reported in San Isidro are Mexican (255 | 100.0%), and American (68 | 26.7%), together accounting for 126.7% of all San Isidro residents.
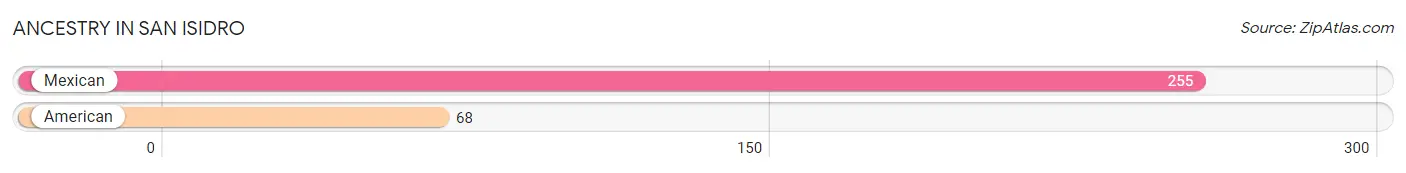
| Ancestry | # Population | % Population |
| American | 68 | 26.7% |
| Mexican | 255 | 100.0% | View All 2 Rows |
Immigrants in San Isidro
The most numerous immigrant groups reported in San Isidro came from Central America (30 | 11.8%), Latin America (30 | 11.8%), and Mexico (30 | 11.8%), together accounting for 35.3% of all San Isidro residents.
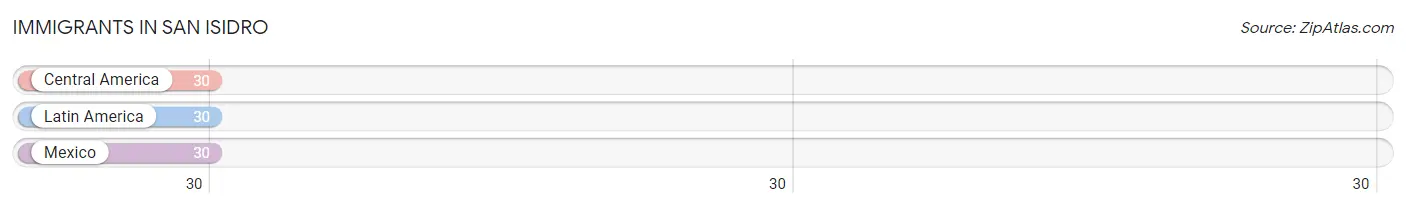
| Immigration Origin | # Population | % Population |
| Central America | 30 | 11.8% |
| Latin America | 30 | 11.8% |
| Mexico | 30 | 11.8% | View All 3 Rows |
Sex and Age in San Isidro
Sex and Age in San Isidro
The most populous age groups in San Isidro are 15 to 19 Years (46 | 35.7%) for men and 50 to 54 Years (39 | 30.9%) for women.
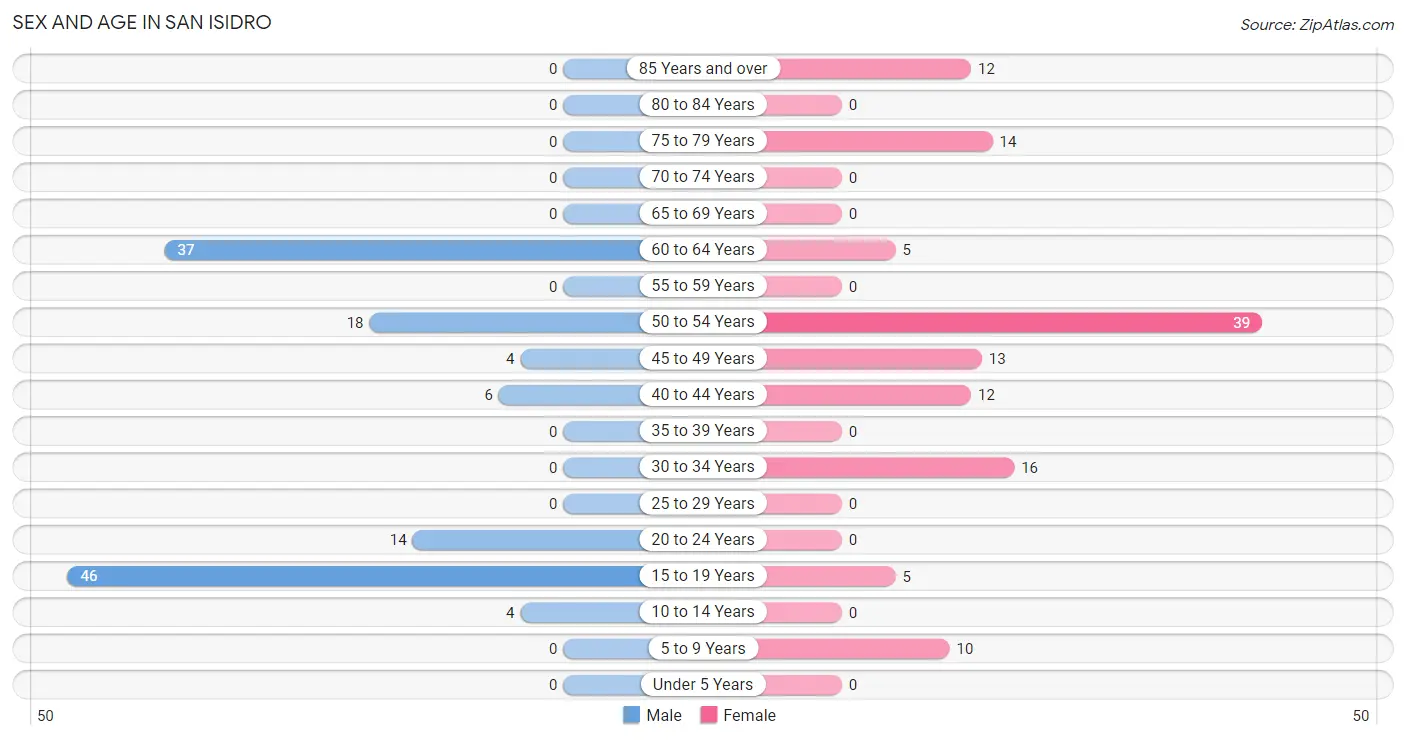
| Age Bracket | Male | Female |
| Under 5 Years | 0 (0.0%) | 0 (0.0%) |
| 5 to 9 Years | 0 (0.0%) | 10 (7.9%) |
| 10 to 14 Years | 4 (3.1%) | 0 (0.0%) |
| 15 to 19 Years | 46 (35.7%) | 5 (4.0%) |
| 20 to 24 Years | 14 (10.8%) | 0 (0.0%) |
| 25 to 29 Years | 0 (0.0%) | 0 (0.0%) |
| 30 to 34 Years | 0 (0.0%) | 16 (12.7%) |
| 35 to 39 Years | 0 (0.0%) | 0 (0.0%) |
| 40 to 44 Years | 6 (4.6%) | 12 (9.5%) |
| 45 to 49 Years | 4 (3.1%) | 13 (10.3%) |
| 50 to 54 Years | 18 (14.0%) | 39 (30.9%) |
| 55 to 59 Years | 0 (0.0%) | 0 (0.0%) |
| 60 to 64 Years | 37 (28.7%) | 5 (4.0%) |
| 65 to 69 Years | 0 (0.0%) | 0 (0.0%) |
| 70 to 74 Years | 0 (0.0%) | 0 (0.0%) |
| 75 to 79 Years | 0 (0.0%) | 14 (11.1%) |
| 80 to 84 Years | 0 (0.0%) | 0 (0.0%) |
| 85 Years and over | 0 (0.0%) | 12 (9.5%) |
| Total | 129 (100.0%) | 126 (100.0%) |
Families and Households in San Isidro
Median Family Size in San Isidro
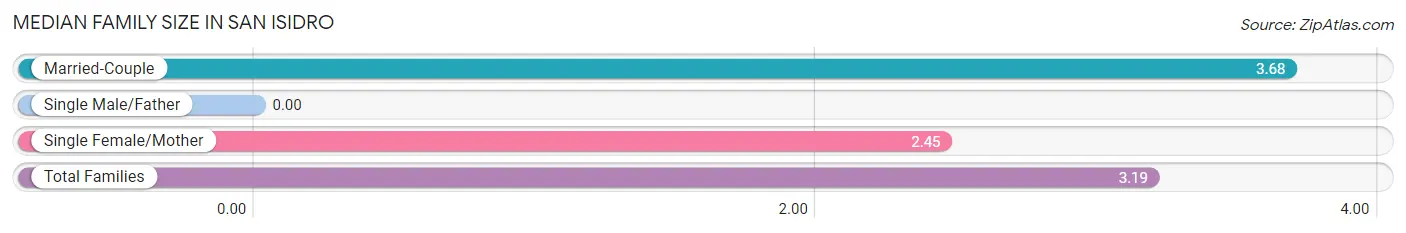
| Family Type | # Families | Family Size |
| Married-Couple | 44 (60.3%) | 3.68 |
| Single Male/Father | 0 (0.0%) | - |
| Single Female/Mother | 29 (39.7%) | 2.45 |
| Total Families | 73 (100.0%) | 3.19 |
Median Household Size in San Isidro
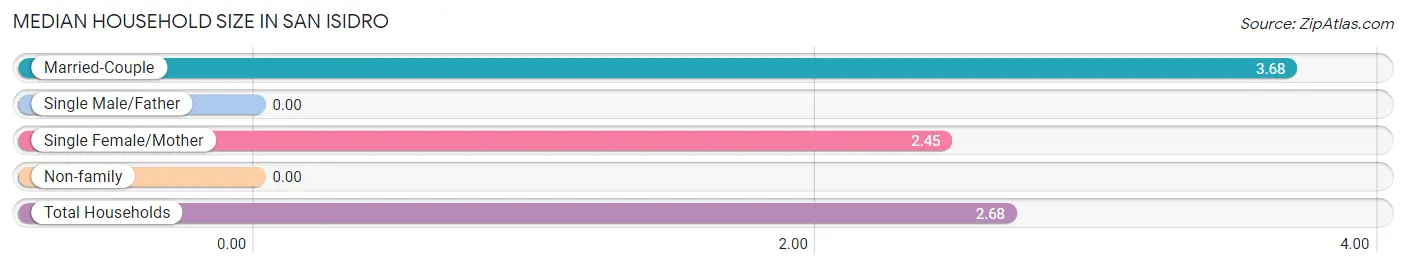
| Household Type | # Households | Household Size |
| Married-Couple | 44 (46.3%) | 3.68 |
| Single Male/Father | 0 (0.0%) | - |
| Single Female/Mother | 29 (30.5%) | 2.45 |
| Non-family | 22 (23.2%) | - |
| Total Households | 95 (100.0%) | 2.68 |
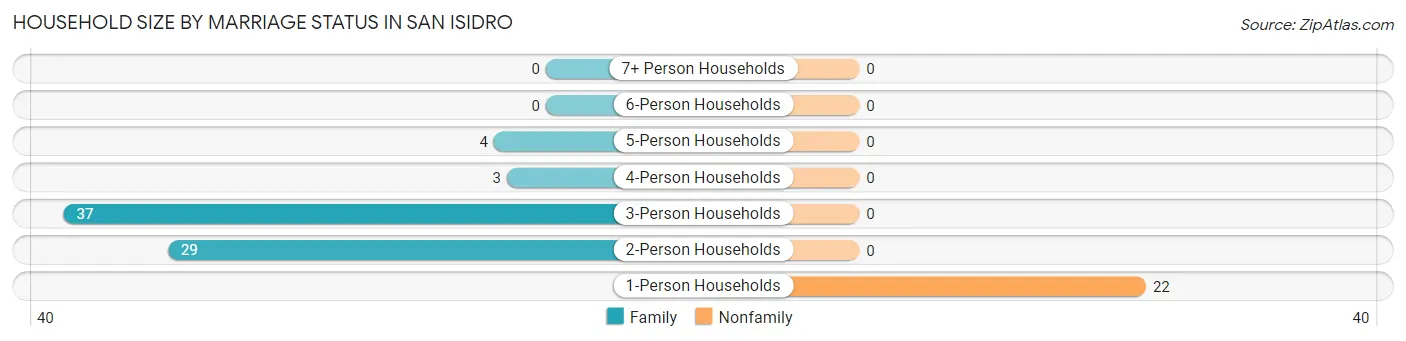
Household Size by Marriage Status in San Isidro
Out of a total of 95 households in San Isidro, 73 (76.8%) are family households, while 22 (23.2%) are nonfamily households. The most numerous type of family households are 3-person households, comprising 37, and the most common type of nonfamily households are 1-person households, comprising 22.
| Household Size | Family Households | Nonfamily Households |
| 1-Person Households | - | 22 (23.2%) |
| 2-Person Households | 29 (30.5%) | 0 (0.0%) |
| 3-Person Households | 37 (39.0%) | 0 (0.0%) |
| 4-Person Households | 3 (3.2%) | 0 (0.0%) |
| 5-Person Households | 4 (4.2%) | 0 (0.0%) |
| 6-Person Households | 0 (0.0%) | 0 (0.0%) |
| 7+ Person Households | 0 (0.0%) | 0 (0.0%) |
| Total | 73 (76.8%) | 22 (23.2%) |
Female Fertility in San Isidro
Fertility by Age in San Isidro
| Age Bracket | Women with Births | Births / 1,000 Women |
| 15 to 19 years | 0 (0.0%) | 0.0 |
| 20 to 34 years | 0 (0.0%) | 0.0 |
| 35 to 50 years | 0 (0.0%) | 0.0 |
| Total | 0 (0.0%) | 0.0 |
Fertility by Age by Marriage Status in San Isidro
| Age Bracket | Married | Unmarried |
| 15 to 19 years | 0 (0.0%) | 0 (0.0%) |
| 20 to 34 years | 0 (0.0%) | 0 (0.0%) |
| 35 to 50 years | 0 (0.0%) | 0 (0.0%) |
| Total | 0 (0.0%) | 0 (0.0%) |
Fertility by Education in San Isidro
| Educational Attainment | Women with Births | Births / 1,000 Women |
| Less than High School | 0 (0.0%) | 0.0 |
| High School Diploma | 0 (0.0%) | 0.0 |
| College or Associate's Degree | 0 (0.0%) | 0.0 |
| Bachelor's Degree | 0 (0.0%) | 0.0 |
| Graduate Degree | 0 (0.0%) | 0.0 |
| Total | 0 (0.0%) | 0.0 |
Fertility by Education by Marriage Status in San Isidro
| Educational Attainment | Married | Unmarried |
| Less than High School | 0 (0.0%) | 0 (0.0%) |
| High School Diploma | 0 (0.0%) | 0 (0.0%) |
| College or Associate's Degree | 0 (0.0%) | 0 (0.0%) |
| Bachelor's Degree | 0 (0.0%) | 0 (0.0%) |
| Graduate Degree | 0 (0.0%) | 0 (0.0%) |
| Total | 0 (0.0%) | 0 (0.0%) |
Employment Characteristics in San Isidro
Employment by Class of Employer in San Isidro
Among the 91 employed individuals in San Isidro, self-employed (not incorporated) (32 | 35.2%), private company employees (30 | 33.0%), and local government employees (12 | 13.2%) make up the most common classes of employment.
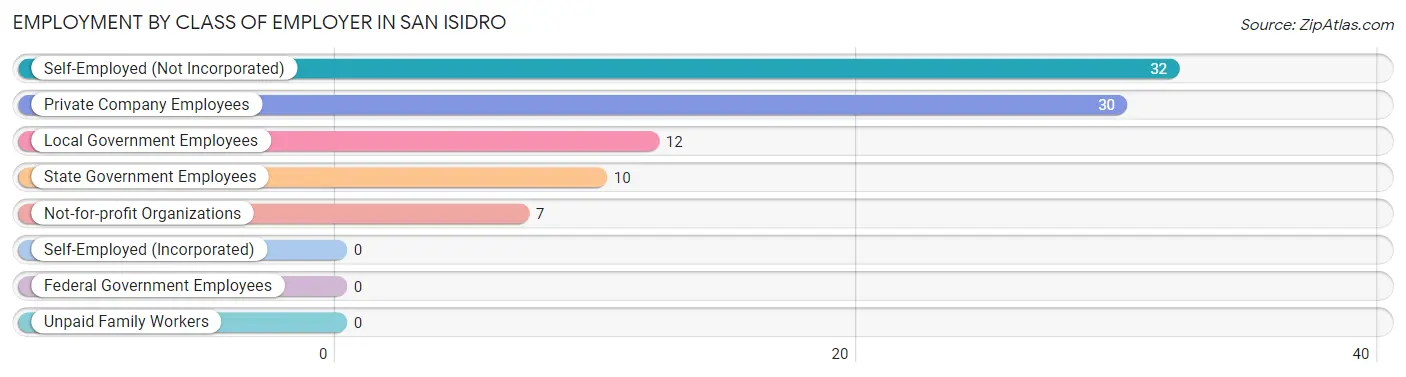
| Employer Class | # Employees | % Employees |
| Private Company Employees | 30 | 33.0% |
| Self-Employed (Incorporated) | 0 | 0.0% |
| Self-Employed (Not Incorporated) | 32 | 35.2% |
| Not-for-profit Organizations | 7 | 7.7% |
| Local Government Employees | 12 | 13.2% |
| State Government Employees | 10 | 11.0% |
| Federal Government Employees | 0 | 0.0% |
| Unpaid Family Workers | 0 | 0.0% |
| Total | 91 | 100.0% |
Employment Status by Age in San Isidro
According to the labor force statistics for San Isidro, out of the total population over 16 years of age (231), 41.6% or 96 individuals are in the labor force, with 5.2% or 5 of them unemployed. The age group with the highest labor force participation rate is 30 to 34 years, with 100.0% or 16 individuals in the labor force. Within the labor force, the 35 to 44 years age range has the highest percentage of unemployed individuals, with 27.8% or 5 of them being unemployed.
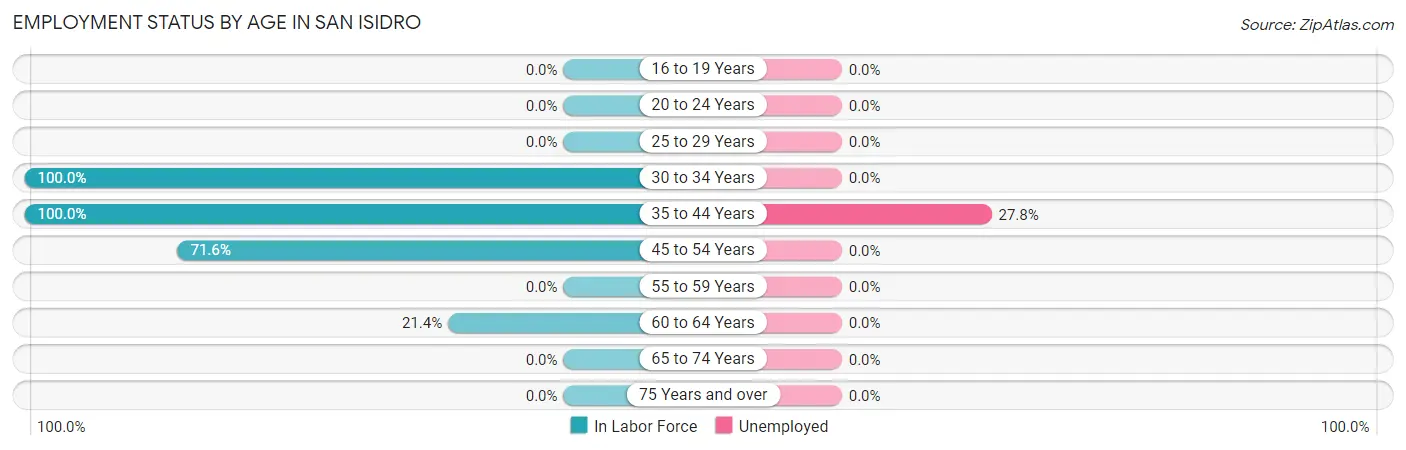
| Age Bracket | In Labor Force | Unemployed |
| 16 to 19 Years | 0 (0.0%) | 0 (0.0%) |
| 20 to 24 Years | 0 (0.0%) | 0 (0.0%) |
| 25 to 29 Years | 0 (0.0%) | 0 (0.0%) |
| 30 to 34 Years | 16 (100.0%) | 0 (0.0%) |
| 35 to 44 Years | 18 (100.0%) | 5 (27.8%) |
| 45 to 54 Years | 53 (71.6%) | 0 (0.0%) |
| 55 to 59 Years | 0 (0.0%) | 0 (0.0%) |
| 60 to 64 Years | 9 (21.4%) | 0 (0.0%) |
| 65 to 74 Years | 0 (0.0%) | 0 (0.0%) |
| 75 Years and over | 0 (0.0%) | 0 (0.0%) |
| Total | 96 (41.6%) | 5 (5.2%) |
Employment Status by Educational Attainment in San Isidro
According to labor force statistics for San Isidro, 64.0% of individuals (96) out of the total population between 25 and 64 years of age (150) are in the labor force, with 5.2% or 5 of them being unemployed. The group with the highest labor force participation rate are those with the educational attainment of high school diploma, with 100.0% or 47 individuals in the labor force. Within the labor force, individuals with less than high school education have the highest percentage of unemployment, with 41.7% or 5 of them being unemployed.
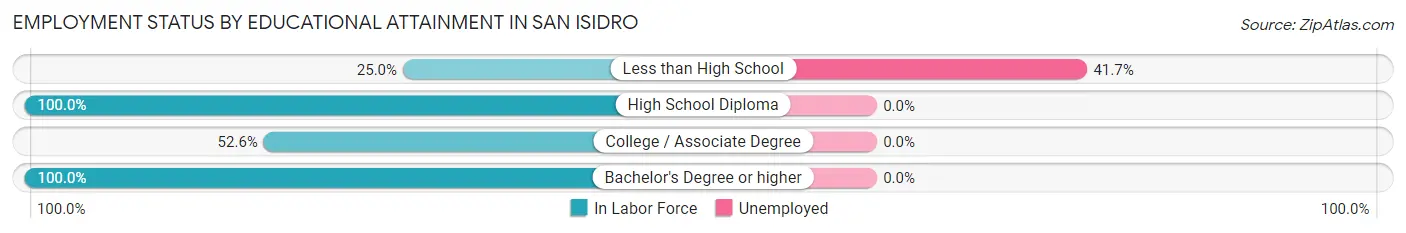
| Educational Attainment | In Labor Force | Unemployed |
| Less than High School | 12 (25.0%) | 20 (41.7%) |
| High School Diploma | 47 (100.0%) | 0 (0.0%) |
| College / Associate Degree | 20 (52.6%) | 0 (0.0%) |
| Bachelor's Degree or higher | 17 (100.0%) | 0 (0.0%) |
| Total | 96 (64.0%) | 8 (5.2%) |
Employment Occupations by Sex in San Isidro
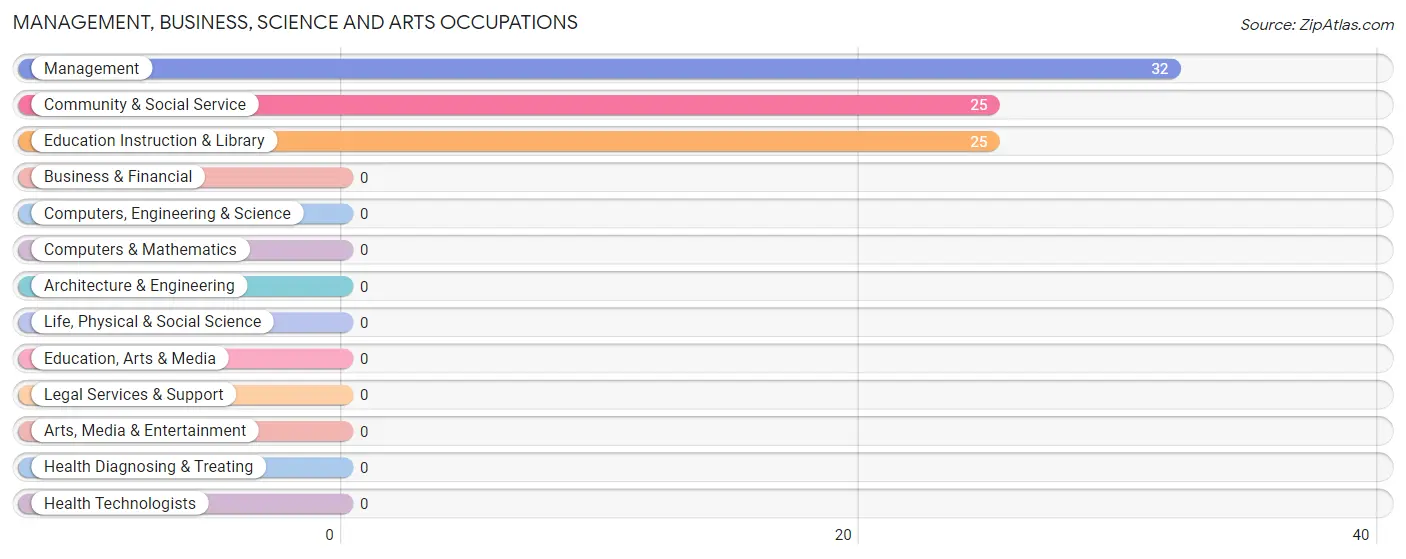
Management, Business, Science and Arts Occupations
The most common Management, Business, Science and Arts occupations in San Isidro are Management (32 | 35.2%), Community & Social Service (25 | 27.5%), and Education Instruction & Library (25 | 27.5%).
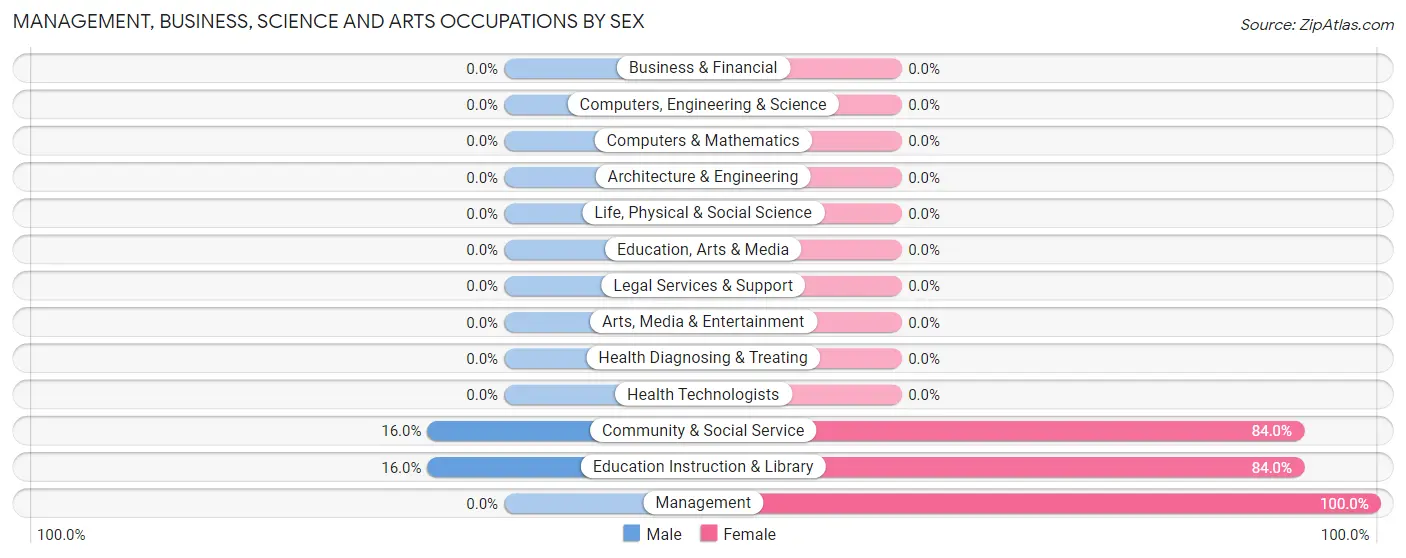
Management, Business, Science and Arts Occupations by Sex
Within the Management, Business, Science and Arts occupations in San Isidro, the most male-oriented occupations are Community & Social Service (16.0%), and Education Instruction & Library (16.0%), while the most female-oriented occupations are Management (100.0%), Community & Social Service (84.0%), and Education Instruction & Library (84.0%).
| Occupation | Male | Female |
| Management | 0 (0.0%) | 32 (100.0%) |
| Business & Financial | 0 (0.0%) | 0 (0.0%) |
| Computers, Engineering & Science | 0 (0.0%) | 0 (0.0%) |
| Computers & Mathematics | 0 (0.0%) | 0 (0.0%) |
| Architecture & Engineering | 0 (0.0%) | 0 (0.0%) |
| Life, Physical & Social Science | 0 (0.0%) | 0 (0.0%) |
| Community & Social Service | 4 (16.0%) | 21 (84.0%) |
| Education, Arts & Media | 0 (0.0%) | 0 (0.0%) |
| Legal Services & Support | 0 (0.0%) | 0 (0.0%) |
| Education Instruction & Library | 4 (16.0%) | 21 (84.0%) |
| Arts, Media & Entertainment | 0 (0.0%) | 0 (0.0%) |
| Health Diagnosing & Treating | 0 (0.0%) | 0 (0.0%) |
| Health Technologists | 0 (0.0%) | 0 (0.0%) |
| Total (Category) | 4 (7.0%) | 53 (93.0%) |
| Total (Overall) | 14 (15.4%) | 77 (84.6%) |
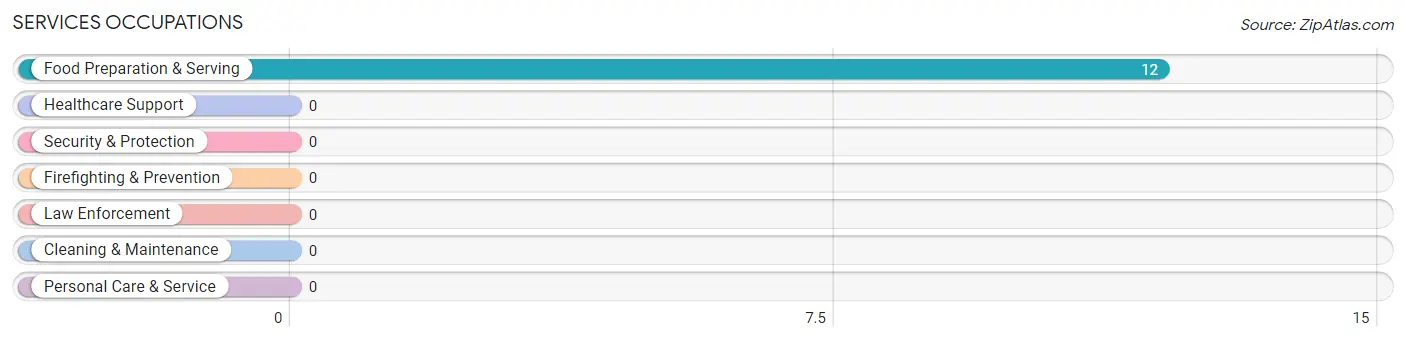
Services Occupations
The most common Services occupations in San Isidro are , and Food Preparation & Serving (12 | 13.2%).
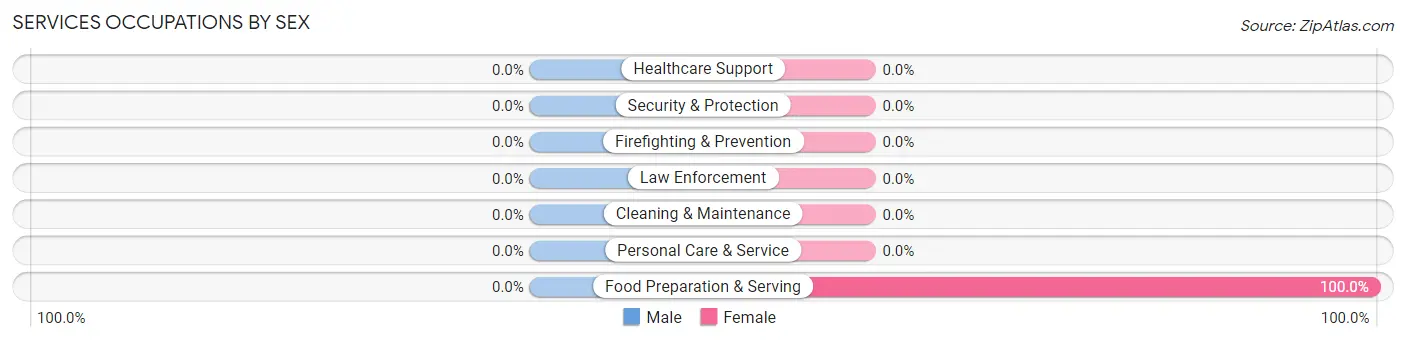
Services Occupations by Sex
| Occupation | Male | Female |
| Healthcare Support | 0 (0.0%) | 0 (0.0%) |
| Security & Protection | 0 (0.0%) | 0 (0.0%) |
| Firefighting & Prevention | 0 (0.0%) | 0 (0.0%) |
| Law Enforcement | 0 (0.0%) | 0 (0.0%) |
| Food Preparation & Serving | 0 (0.0%) | 12 (100.0%) |
| Cleaning & Maintenance | 0 (0.0%) | 0 (0.0%) |
| Personal Care & Service | 0 (0.0%) | 0 (0.0%) |
| Total (Category) | 0 (0.0%) | 12 (100.0%) |
| Total (Overall) | 14 (15.4%) | 77 (84.6%) |
Sales and Office Occupations
The most common Sales and Office occupations in San Isidro are , and Office & Administration (12 | 13.2%).
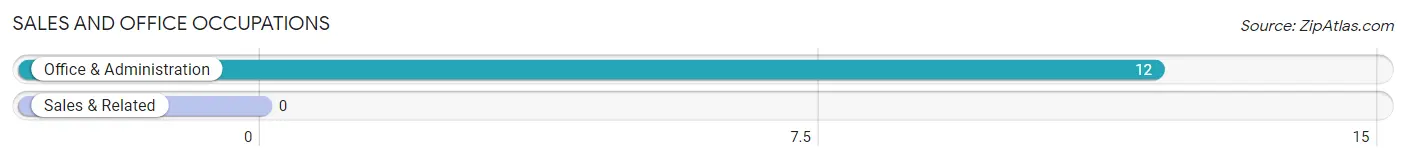
Sales and Office Occupations by Sex
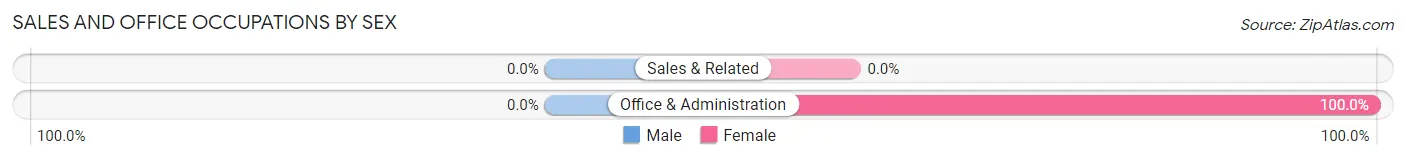
| Occupation | Male | Female |
| Sales & Related | 0 (0.0%) | 0 (0.0%) |
| Office & Administration | 0 (0.0%) | 12 (100.0%) |
| Total (Category) | 0 (0.0%) | 12 (100.0%) |
| Total (Overall) | 14 (15.4%) | 77 (84.6%) |
Natural Resources, Construction and Maintenance Occupations
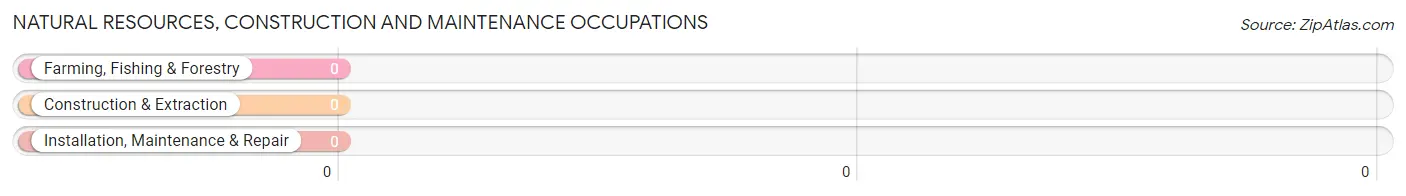
Natural Resources, Construction and Maintenance Occupations by Sex
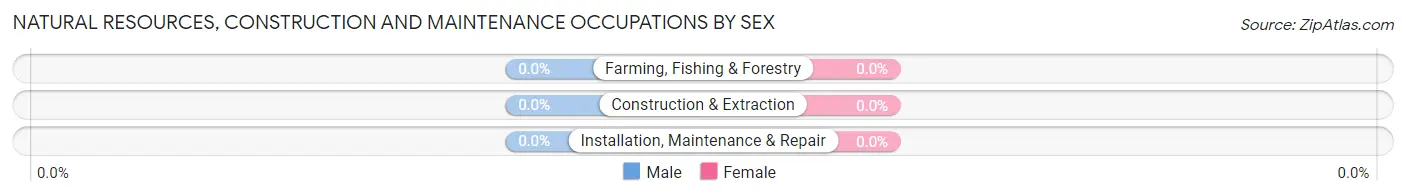
| Occupation | Male | Female |
| Farming, Fishing & Forestry | 0 (0.0%) | 0 (0.0%) |
| Construction & Extraction | 0 (0.0%) | 0 (0.0%) |
| Installation, Maintenance & Repair | 0 (0.0%) | 0 (0.0%) |
| Total (Category) | 0 (0.0%) | 0 (0.0%) |
| Total (Overall) | 14 (15.4%) | 77 (84.6%) |
Production, Transportation and Moving Occupations
The most common Production, Transportation and Moving occupations in San Isidro are , and Transportation (10 | 11.0%).
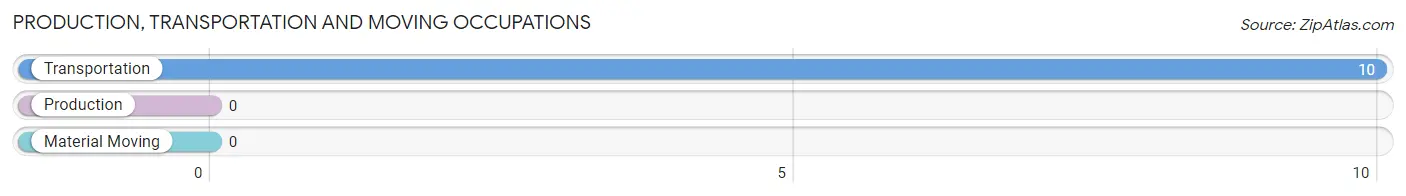
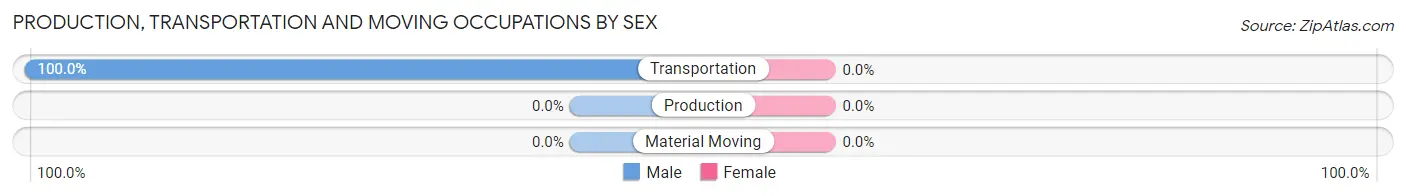
Production, Transportation and Moving Occupations by Sex
| Occupation | Male | Female |
| Production | 0 (0.0%) | 0 (0.0%) |
| Transportation | 10 (100.0%) | 0 (0.0%) |
| Material Moving | 0 (0.0%) | 0 (0.0%) |
| Total (Category) | 10 (100.0%) | 0 (0.0%) |
| Total (Overall) | 14 (15.4%) | 77 (84.6%) |
Employment Industries by Sex in San Isidro
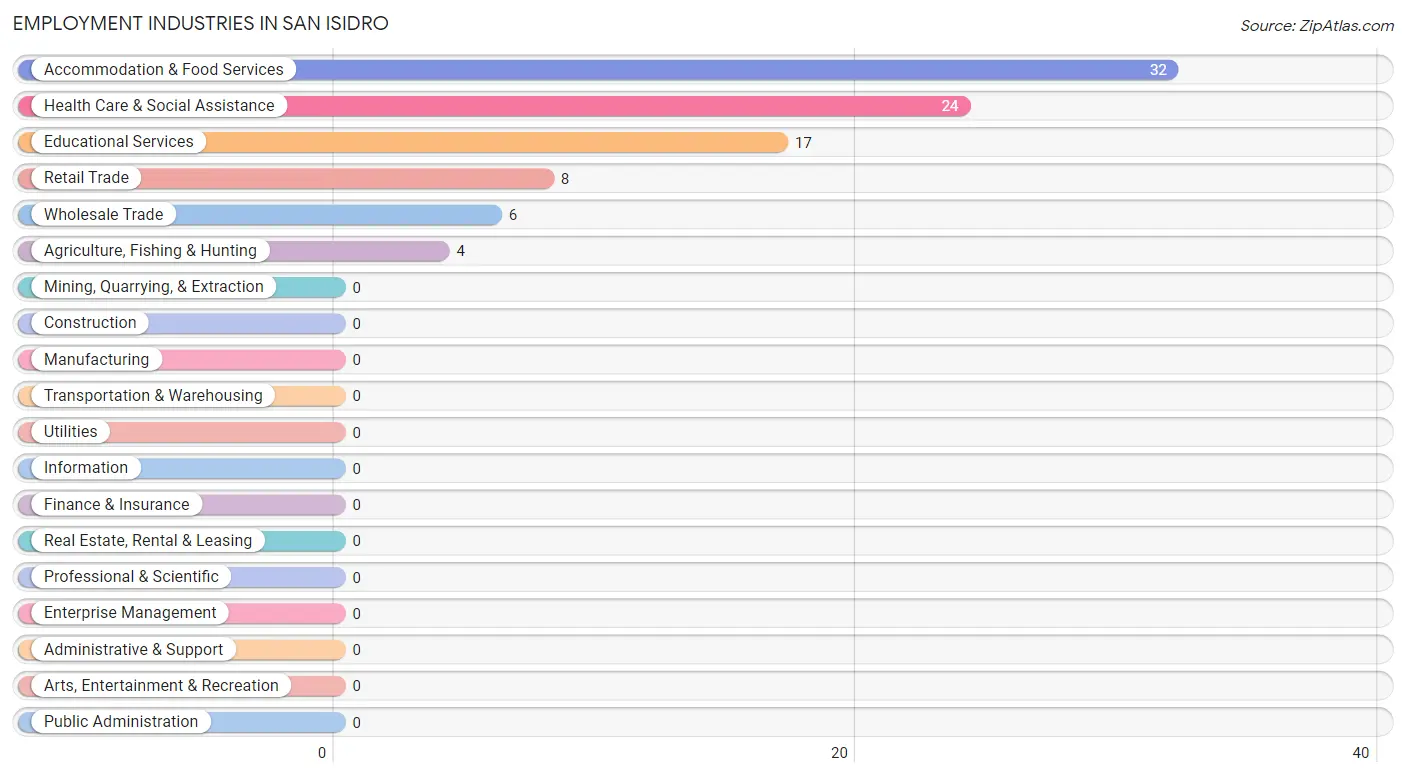
Employment Industries in San Isidro
The major employment industries in San Isidro include Accommodation & Food Services (32 | 35.2%), Health Care & Social Assistance (24 | 26.4%), Educational Services (17 | 18.7%), Retail Trade (8 | 8.8%), and Wholesale Trade (6 | 6.6%).
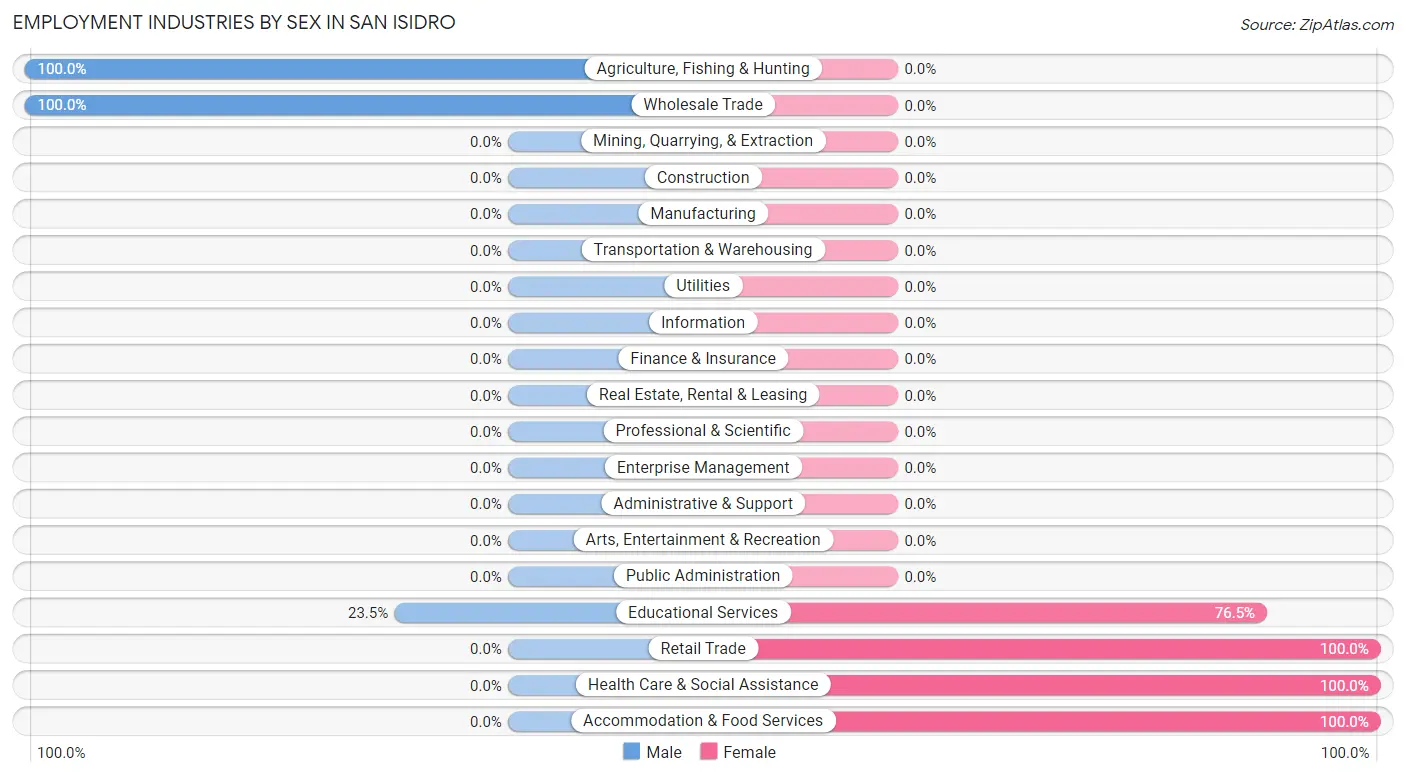
Employment Industries by Sex in San Isidro
The San Isidro industries that see more men than women are Agriculture, Fishing & Hunting (100.0%), Wholesale Trade (100.0%), and Educational Services (23.5%), whereas the industries that tend to have a higher number of women are Retail Trade (100.0%), Health Care & Social Assistance (100.0%), and Accommodation & Food Services (100.0%).
| Industry | Male | Female |
| Agriculture, Fishing & Hunting | 4 (100.0%) | 0 (0.0%) |
| Mining, Quarrying, & Extraction | 0 (0.0%) | 0 (0.0%) |
| Construction | 0 (0.0%) | 0 (0.0%) |
| Manufacturing | 0 (0.0%) | 0 (0.0%) |
| Wholesale Trade | 6 (100.0%) | 0 (0.0%) |
| Retail Trade | 0 (0.0%) | 8 (100.0%) |
| Transportation & Warehousing | 0 (0.0%) | 0 (0.0%) |
| Utilities | 0 (0.0%) | 0 (0.0%) |
| Information | 0 (0.0%) | 0 (0.0%) |
| Finance & Insurance | 0 (0.0%) | 0 (0.0%) |
| Real Estate, Rental & Leasing | 0 (0.0%) | 0 (0.0%) |
| Professional & Scientific | 0 (0.0%) | 0 (0.0%) |
| Enterprise Management | 0 (0.0%) | 0 (0.0%) |
| Administrative & Support | 0 (0.0%) | 0 (0.0%) |
| Educational Services | 4 (23.5%) | 13 (76.5%) |
| Health Care & Social Assistance | 0 (0.0%) | 24 (100.0%) |
| Arts, Entertainment & Recreation | 0 (0.0%) | 0 (0.0%) |
| Accommodation & Food Services | 0 (0.0%) | 32 (100.0%) |
| Public Administration | 0 (0.0%) | 0 (0.0%) |
| Total | 14 (15.4%) | 77 (84.6%) |
Education in San Isidro
School Enrollment in San Isidro
The most common levels of schooling among the 79 students in San Isidro are high school (51 | 64.6%), college / undergraduate (14 | 17.7%), and elementary school (10 | 12.7%).
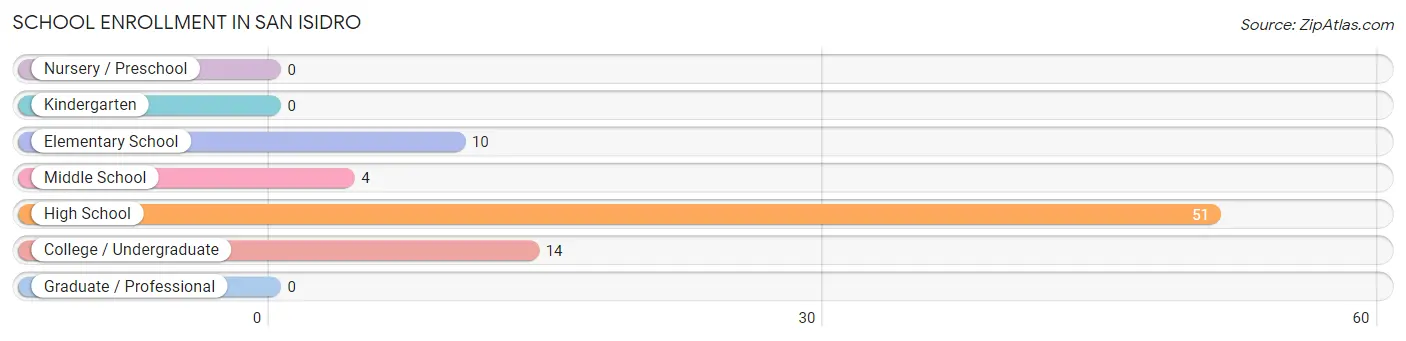
| School Level | # Students | % Students |
| Nursery / Preschool | 0 | 0.0% |
| Kindergarten | 0 | 0.0% |
| Elementary School | 10 | 12.7% |
| Middle School | 4 | 5.1% |
| High School | 51 | 64.6% |
| College / Undergraduate | 14 | 17.7% |
| Graduate / Professional | 0 | 0.0% |
| Total | 79 | 100.0% |
School Enrollment by Age by Funding Source in San Isidro
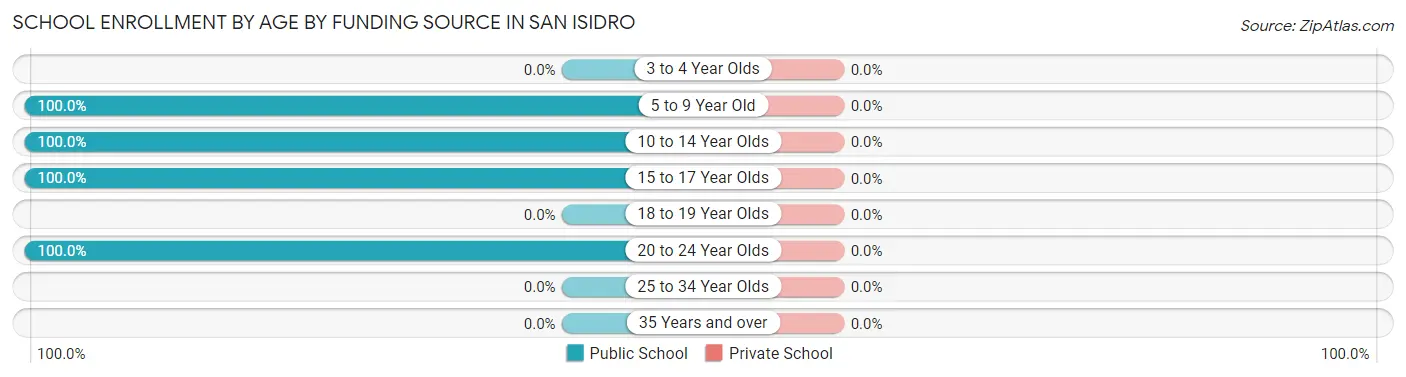
| Age Bracket | Public School | Private School |
| 3 to 4 Year Olds | 0 (0.0%) | 0 (0.0%) |
| 5 to 9 Year Old | 10 (100.0%) | 0 (0.0%) |
| 10 to 14 Year Olds | 4 (100.0%) | 0 (0.0%) |
| 15 to 17 Year Olds | 51 (100.0%) | 0 (0.0%) |
| 18 to 19 Year Olds | 0 (0.0%) | 0 (0.0%) |
| 20 to 24 Year Olds | 14 (100.0%) | 0 (0.0%) |
| 25 to 34 Year Olds | 0 (0.0%) | 0 (0.0%) |
| 35 Years and over | 0 (0.0%) | 0 (0.0%) |
| Total | 79 (100.0%) | 0 (0.0%) |
Educational Attainment by Field of Study in San Isidro
Social sciences (10 | 58.8%), education (4 | 23.5%), and multidisciplinary studies (3 | 17.6%) are the most common fields of study among 17 individuals in San Isidro who have obtained a bachelor's degree or higher.
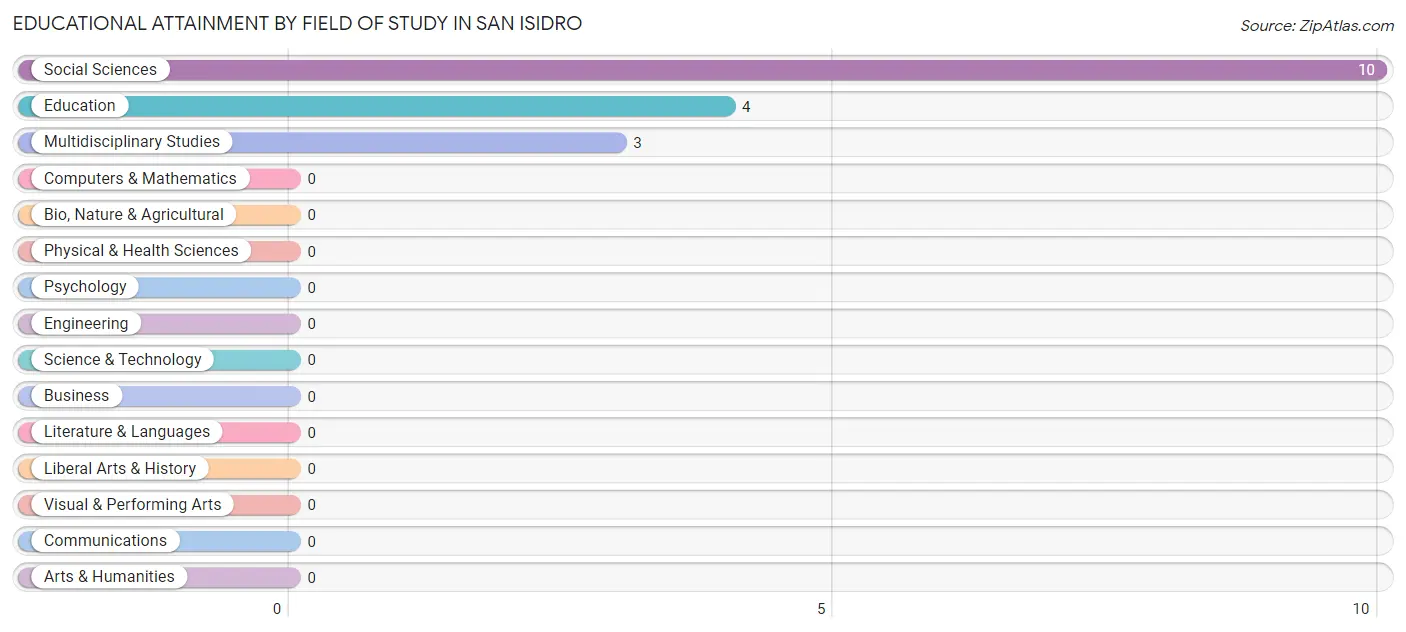
| Field of Study | # Graduates | % Graduates |
| Computers & Mathematics | 0 | 0.0% |
| Bio, Nature & Agricultural | 0 | 0.0% |
| Physical & Health Sciences | 0 | 0.0% |
| Psychology | 0 | 0.0% |
| Social Sciences | 10 | 58.8% |
| Engineering | 0 | 0.0% |
| Multidisciplinary Studies | 3 | 17.6% |
| Science & Technology | 0 | 0.0% |
| Business | 0 | 0.0% |
| Education | 4 | 23.5% |
| Literature & Languages | 0 | 0.0% |
| Liberal Arts & History | 0 | 0.0% |
| Visual & Performing Arts | 0 | 0.0% |
| Communications | 0 | 0.0% |
| Arts & Humanities | 0 | 0.0% |
| Total | 17 | 100.0% |
Transportation & Commute in San Isidro
Vehicle Availability by Sex in San Isidro
The most prevalent vehicle ownership categories in San Isidro are males with 2 vehicles (10, accounting for 71.4%) and females with 2 vehicles (46, making up 13.0%).
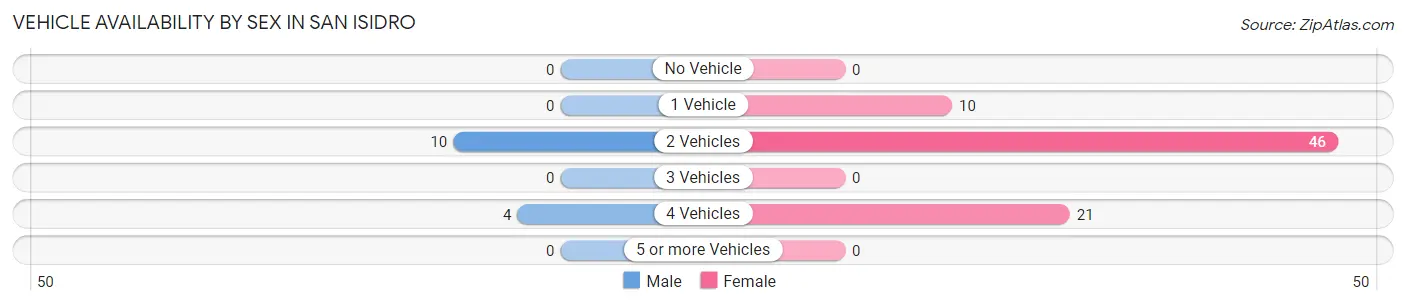
| Vehicles Available | Male | Female |
| No Vehicle | 0 (0.0%) | 0 (0.0%) |
| 1 Vehicle | 0 (0.0%) | 10 (13.0%) |
| 2 Vehicles | 10 (71.4%) | 46 (59.7%) |
| 3 Vehicles | 0 (0.0%) | 0 (0.0%) |
| 4 Vehicles | 4 (28.6%) | 21 (27.3%) |
| 5 or more Vehicles | 0 (0.0%) | 0 (0.0%) |
| Total | 14 (100.0%) | 77 (100.0%) |
Commute Time in San Isidro
The most frequently occuring commute durations in San Isidro are less than 5 minutes (49 commuters, 53.8%), 45 to 59 minutes (12 commuters, 13.2%), and 5 to 9 minutes (11 commuters, 12.1%).
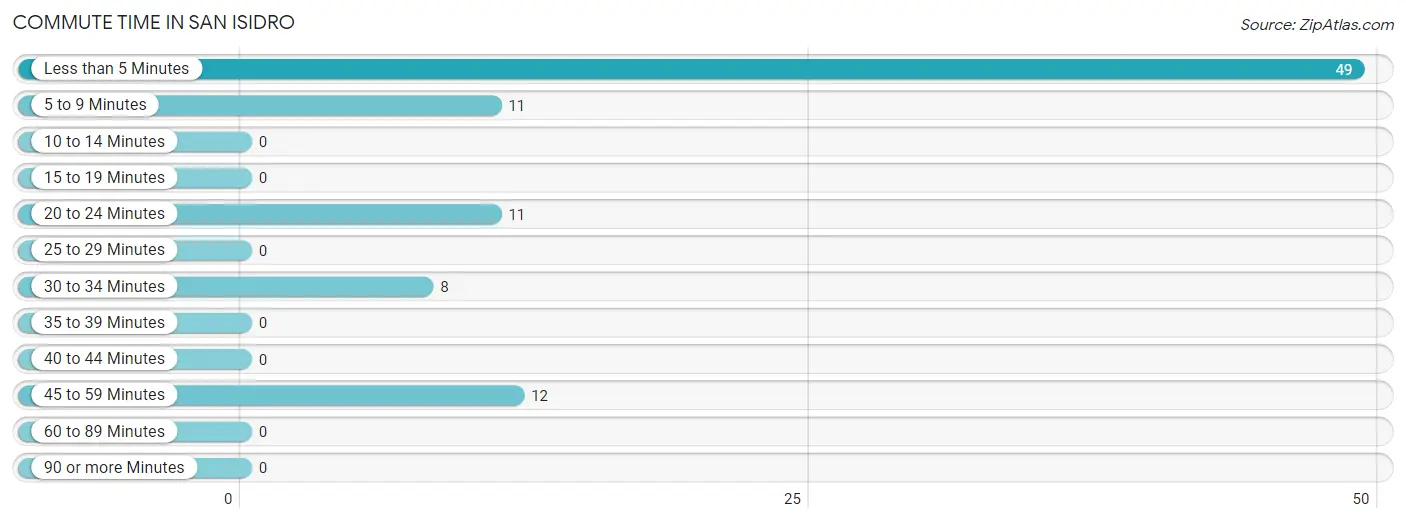
| Commute Time | # Commuters | % Commuters |
| Less than 5 Minutes | 49 | 53.8% |
| 5 to 9 Minutes | 11 | 12.1% |
| 10 to 14 Minutes | 0 | 0.0% |
| 15 to 19 Minutes | 0 | 0.0% |
| 20 to 24 Minutes | 11 | 12.1% |
| 25 to 29 Minutes | 0 | 0.0% |
| 30 to 34 Minutes | 8 | 8.8% |
| 35 to 39 Minutes | 0 | 0.0% |
| 40 to 44 Minutes | 0 | 0.0% |
| 45 to 59 Minutes | 12 | 13.2% |
| 60 to 89 Minutes | 0 | 0.0% |
| 90 or more Minutes | 0 | 0.0% |
Commute Time by Sex in San Isidro
The most common commute times in San Isidro are 5 to 9 minutes (6 commuters, 42.9%) for males and less than 5 minutes (45 commuters, 58.4%) for females.
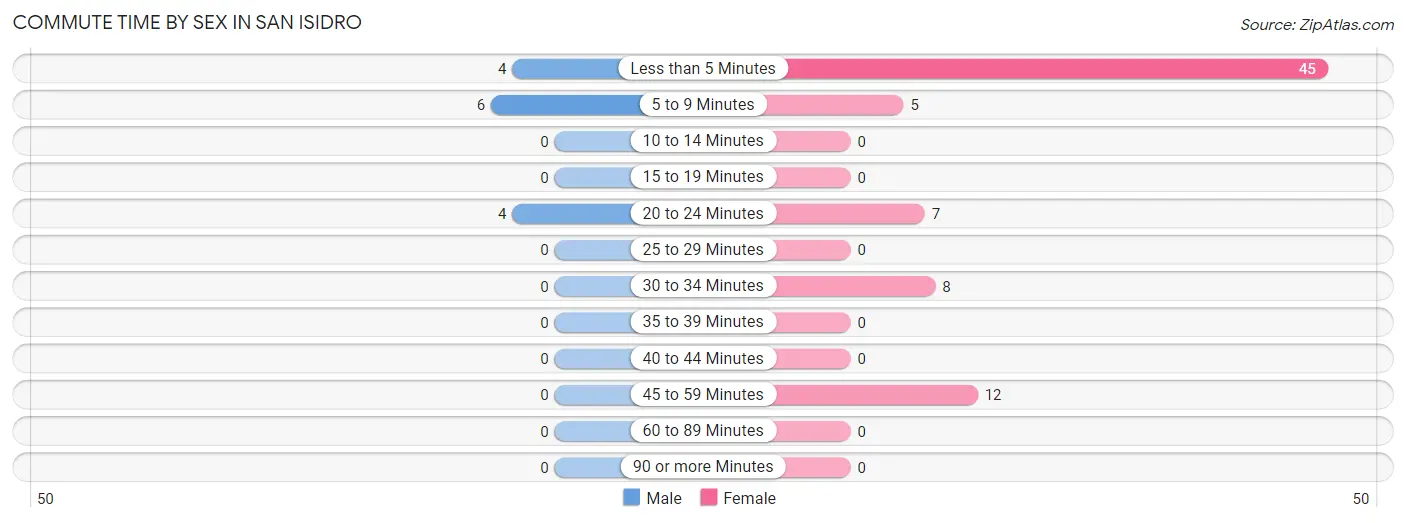
| Commute Time | Male | Female |
| Less than 5 Minutes | 4 (28.6%) | 45 (58.4%) |
| 5 to 9 Minutes | 6 (42.9%) | 5 (6.5%) |
| 10 to 14 Minutes | 0 (0.0%) | 0 (0.0%) |
| 15 to 19 Minutes | 0 (0.0%) | 0 (0.0%) |
| 20 to 24 Minutes | 4 (28.6%) | 7 (9.1%) |
| 25 to 29 Minutes | 0 (0.0%) | 0 (0.0%) |
| 30 to 34 Minutes | 0 (0.0%) | 8 (10.4%) |
| 35 to 39 Minutes | 0 (0.0%) | 0 (0.0%) |
| 40 to 44 Minutes | 0 (0.0%) | 0 (0.0%) |
| 45 to 59 Minutes | 0 (0.0%) | 12 (15.6%) |
| 60 to 89 Minutes | 0 (0.0%) | 0 (0.0%) |
| 90 or more Minutes | 0 (0.0%) | 0 (0.0%) |
Time of Departure to Work by Sex in San Isidro
The most frequent times of departure to work in San Isidro are 7:00 AM to 7:29 AM (8, 57.1%) for males and 5:30 AM to 5:59 AM (32, 41.6%) for females.
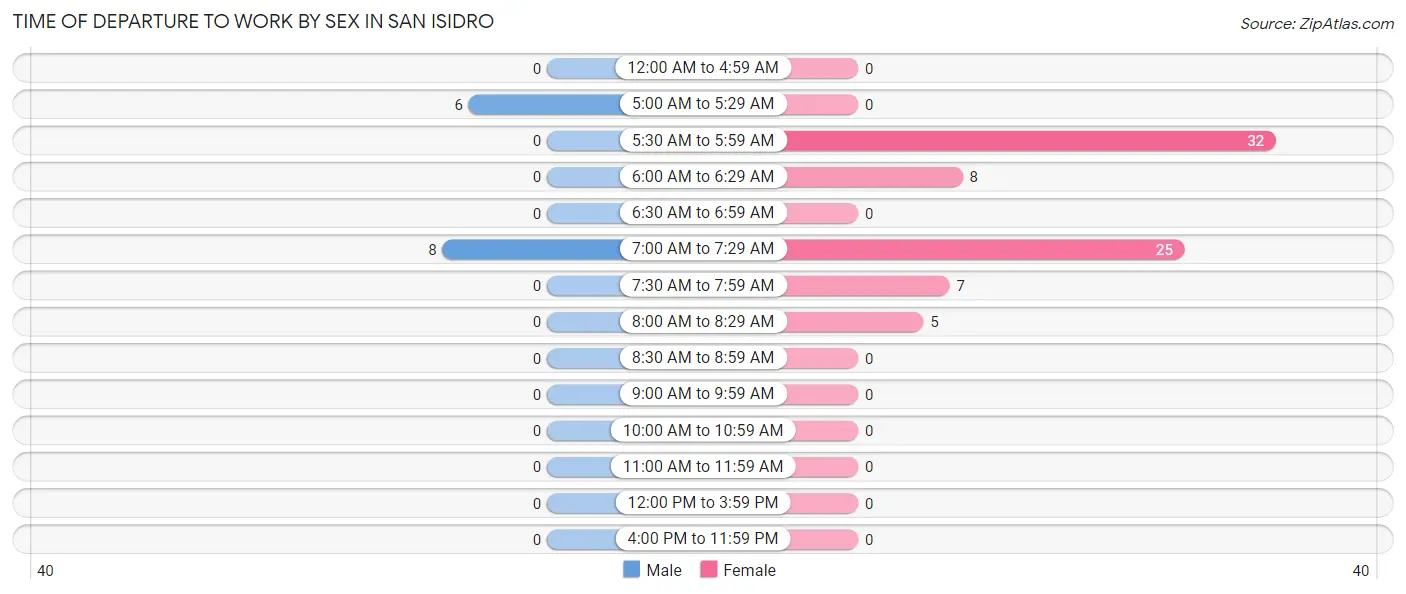
| Time of Departure | Male | Female |
| 12:00 AM to 4:59 AM | 0 (0.0%) | 0 (0.0%) |
| 5:00 AM to 5:29 AM | 6 (42.9%) | 0 (0.0%) |
| 5:30 AM to 5:59 AM | 0 (0.0%) | 32 (41.6%) |
| 6:00 AM to 6:29 AM | 0 (0.0%) | 8 (10.4%) |
| 6:30 AM to 6:59 AM | 0 (0.0%) | 0 (0.0%) |
| 7:00 AM to 7:29 AM | 8 (57.1%) | 25 (32.5%) |
| 7:30 AM to 7:59 AM | 0 (0.0%) | 7 (9.1%) |
| 8:00 AM to 8:29 AM | 0 (0.0%) | 5 (6.5%) |
| 8:30 AM to 8:59 AM | 0 (0.0%) | 0 (0.0%) |
| 9:00 AM to 9:59 AM | 0 (0.0%) | 0 (0.0%) |
| 10:00 AM to 10:59 AM | 0 (0.0%) | 0 (0.0%) |
| 11:00 AM to 11:59 AM | 0 (0.0%) | 0 (0.0%) |
| 12:00 PM to 3:59 PM | 0 (0.0%) | 0 (0.0%) |
| 4:00 PM to 11:59 PM | 0 (0.0%) | 0 (0.0%) |
| Total | 14 (100.0%) | 77 (100.0%) |
Housing Occupancy in San Isidro
Occupancy by Ownership in San Isidro
Of the total 95 dwellings in San Isidro, owner-occupied units account for 82 (86.3%), while renter-occupied units make up 13 (13.7%).
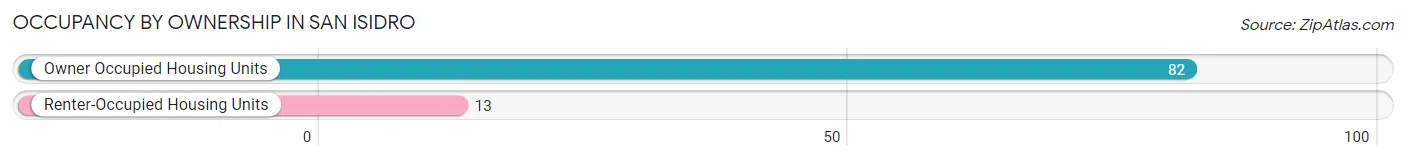
| Occupancy | # Housing Units | % Housing Units |
| Owner Occupied Housing Units | 82 | 86.3% |
| Renter-Occupied Housing Units | 13 | 13.7% |
| Total Occupied Housing Units | 95 | 100.0% |
Occupancy by Household Size in San Isidro
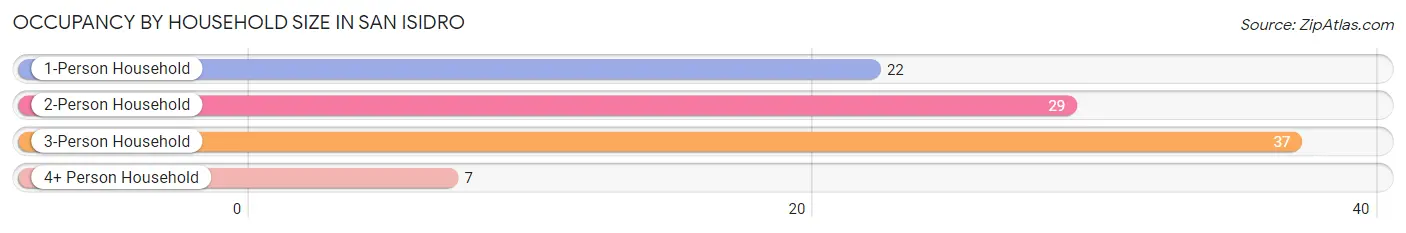
| Household Size | # Housing Units | % Housing Units |
| 1-Person Household | 22 | 23.2% |
| 2-Person Household | 29 | 30.5% |
| 3-Person Household | 37 | 39.0% |
| 4+ Person Household | 7 | 7.4% |
| Total Housing Units | 95 | 100.0% |
Occupancy by Ownership by Household Size in San Isidro
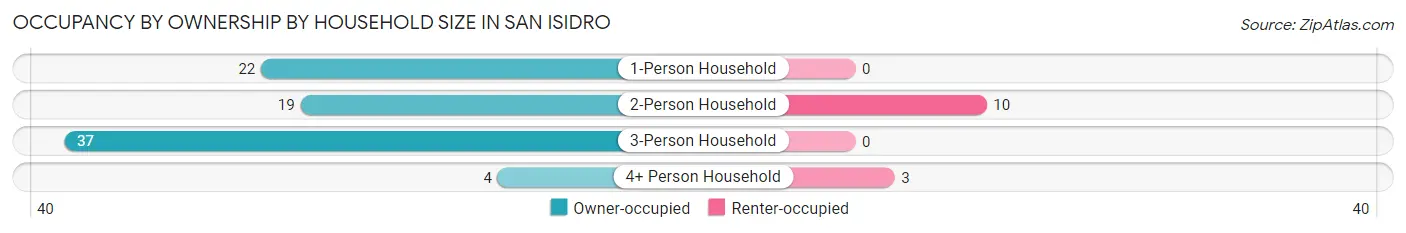
| Household Size | Owner-occupied | Renter-occupied |
| 1-Person Household | 22 (100.0%) | 0 (0.0%) |
| 2-Person Household | 19 (65.5%) | 10 (34.5%) |
| 3-Person Household | 37 (100.0%) | 0 (0.0%) |
| 4+ Person Household | 4 (57.1%) | 3 (42.9%) |
| Total Housing Units | 82 (86.3%) | 13 (13.7%) |
Occupancy by Educational Attainment in San Isidro
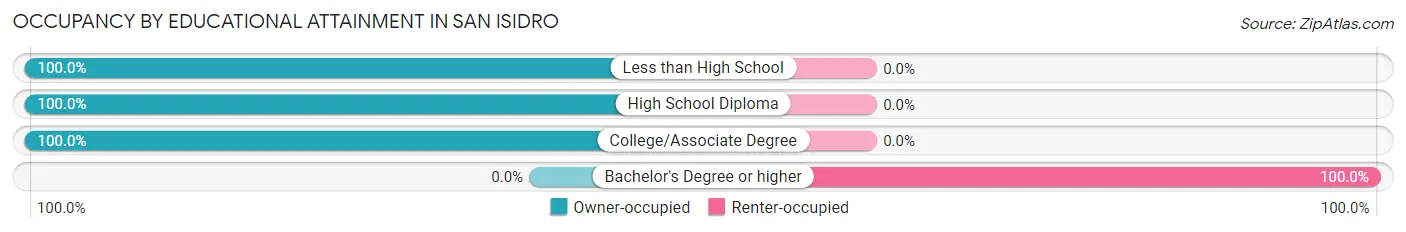
| Household Size | Owner-occupied | Renter-occupied |
| Less than High School | 60 (100.0%) | 0 (0.0%) |
| High School Diploma | 18 (100.0%) | 0 (0.0%) |
| College/Associate Degree | 4 (100.0%) | 0 (0.0%) |
| Bachelor's Degree or higher | 0 (0.0%) | 13 (100.0%) |
Occupancy by Age of Householder in San Isidro
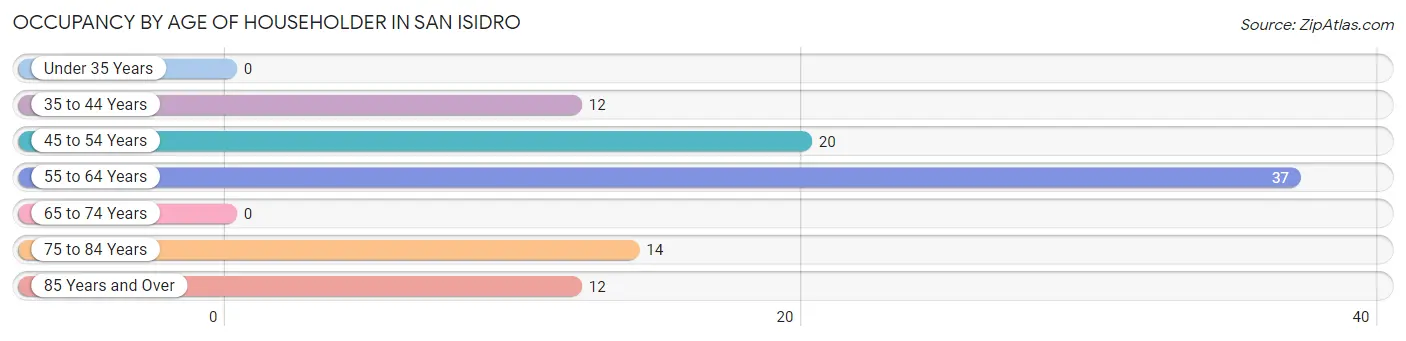
| Age Bracket | # Households | % Households |
| Under 35 Years | 0 | 0.0% |
| 35 to 44 Years | 12 | 12.6% |
| 45 to 54 Years | 20 | 21.0% |
| 55 to 64 Years | 37 | 39.0% |
| 65 to 74 Years | 0 | 0.0% |
| 75 to 84 Years | 14 | 14.7% |
| 85 Years and Over | 12 | 12.6% |
| Total | 95 | 100.0% |
Housing Finances in San Isidro
Median Income by Occupancy in San Isidro
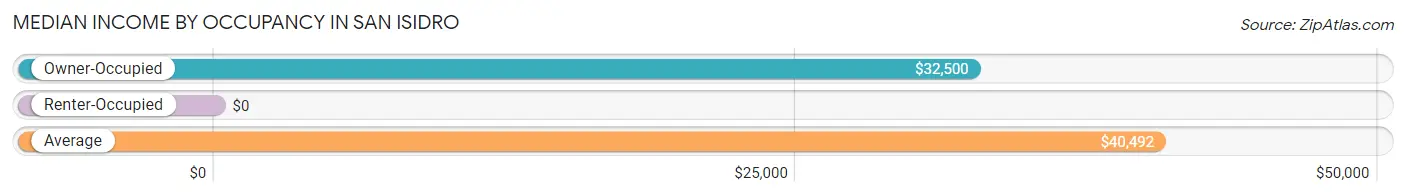
| Occupancy Type | # Households | Median Income |
| Owner-Occupied | 82 (86.3%) | $32,500 |
| Renter-Occupied | 13 (13.7%) | $0 |
| Average | 95 (100.0%) | $40,492 |
Occupancy by Householder Income Bracket in San Isidro
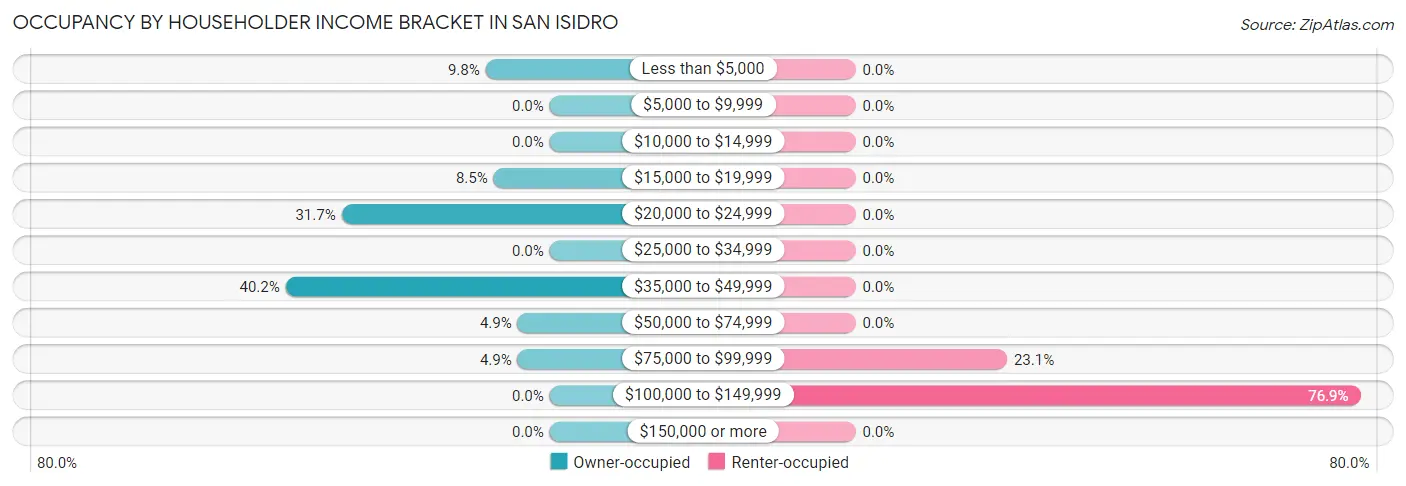
| Income Bracket | Owner-occupied | Renter-occupied |
| Less than $5,000 | 8 (9.8%) | 0 (0.0%) |
| $5,000 to $9,999 | 0 (0.0%) | 0 (0.0%) |
| $10,000 to $14,999 | 0 (0.0%) | 0 (0.0%) |
| $15,000 to $19,999 | 7 (8.5%) | 0 (0.0%) |
| $20,000 to $24,999 | 26 (31.7%) | 0 (0.0%) |
| $25,000 to $34,999 | 0 (0.0%) | 0 (0.0%) |
| $35,000 to $49,999 | 33 (40.2%) | 0 (0.0%) |
| $50,000 to $74,999 | 4 (4.9%) | 0 (0.0%) |
| $75,000 to $99,999 | 4 (4.9%) | 3 (23.1%) |
| $100,000 to $149,999 | 0 (0.0%) | 10 (76.9%) |
| $150,000 or more | 0 (0.0%) | 0 (0.0%) |
| Total | 82 (100.0%) | 13 (100.0%) |
Monthly Housing Cost Tiers in San Isidro
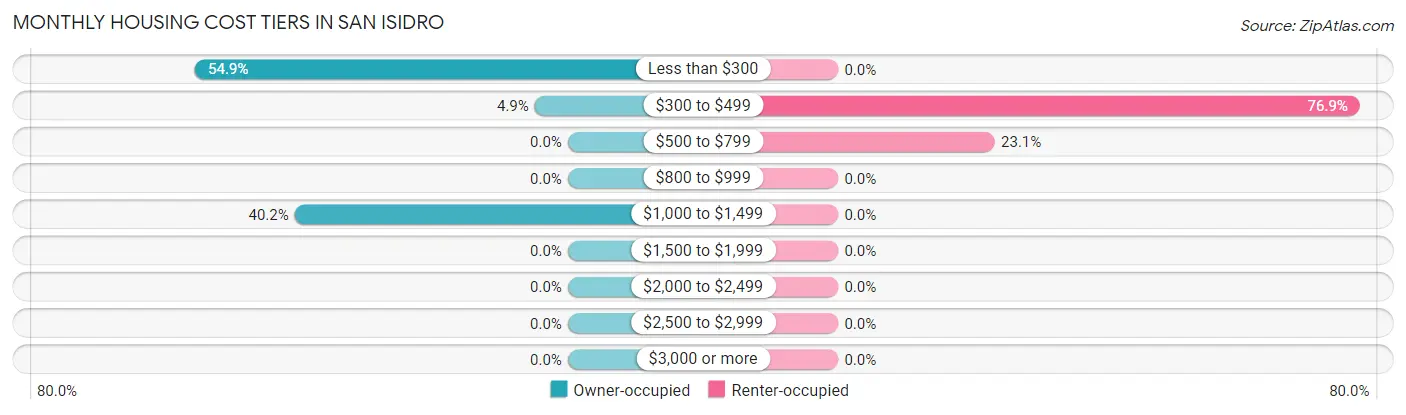
| Monthly Cost | Owner-occupied | Renter-occupied |
| Less than $300 | 45 (54.9%) | 0 (0.0%) |
| $300 to $499 | 4 (4.9%) | 10 (76.9%) |
| $500 to $799 | 0 (0.0%) | 3 (23.1%) |
| $800 to $999 | 0 (0.0%) | 0 (0.0%) |
| $1,000 to $1,499 | 33 (40.2%) | 0 (0.0%) |
| $1,500 to $1,999 | 0 (0.0%) | 0 (0.0%) |
| $2,000 to $2,499 | 0 (0.0%) | 0 (0.0%) |
| $2,500 to $2,999 | 0 (0.0%) | 0 (0.0%) |
| $3,000 or more | 0 (0.0%) | 0 (0.0%) |
| Total | 82 (100.0%) | 13 (100.0%) |
Physical Housing Characteristics in San Isidro
Housing Structures in San Isidro
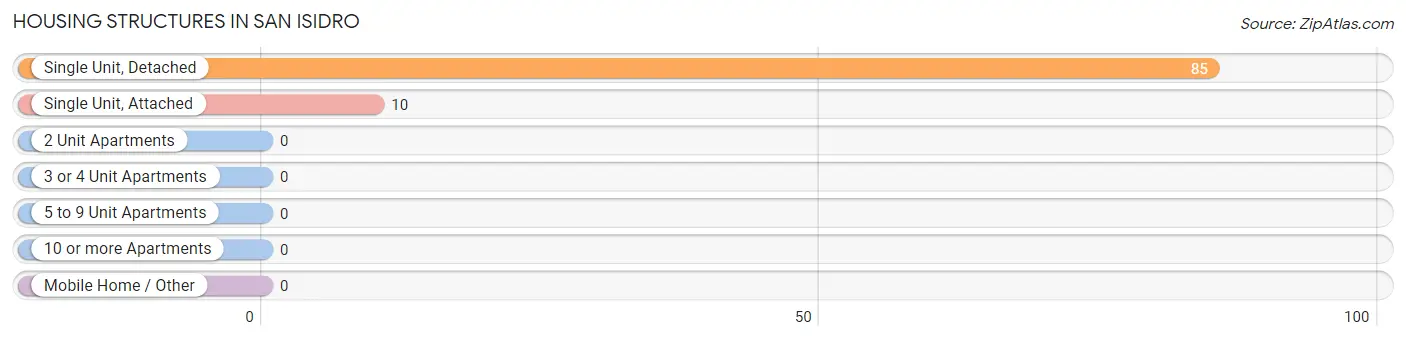
| Structure Type | # Housing Units | % Housing Units |
| Single Unit, Detached | 85 | 89.5% |
| Single Unit, Attached | 10 | 10.5% |
| 2 Unit Apartments | 0 | 0.0% |
| 3 or 4 Unit Apartments | 0 | 0.0% |
| 5 to 9 Unit Apartments | 0 | 0.0% |
| 10 or more Apartments | 0 | 0.0% |
| Mobile Home / Other | 0 | 0.0% |
| Total | 95 | 100.0% |
Housing Structures by Occupancy in San Isidro
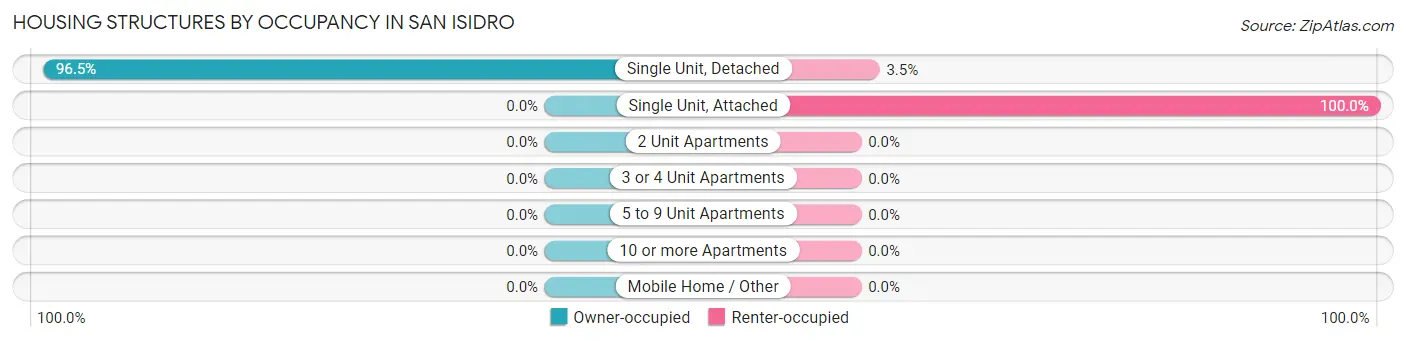
| Structure Type | Owner-occupied | Renter-occupied |
| Single Unit, Detached | 82 (96.5%) | 3 (3.5%) |
| Single Unit, Attached | 0 (0.0%) | 10 (100.0%) |
| 2 Unit Apartments | 0 (0.0%) | 0 (0.0%) |
| 3 or 4 Unit Apartments | 0 (0.0%) | 0 (0.0%) |
| 5 to 9 Unit Apartments | 0 (0.0%) | 0 (0.0%) |
| 10 or more Apartments | 0 (0.0%) | 0 (0.0%) |
| Mobile Home / Other | 0 (0.0%) | 0 (0.0%) |
| Total | 82 (86.3%) | 13 (13.7%) |
Housing Structures by Number of Rooms in San Isidro
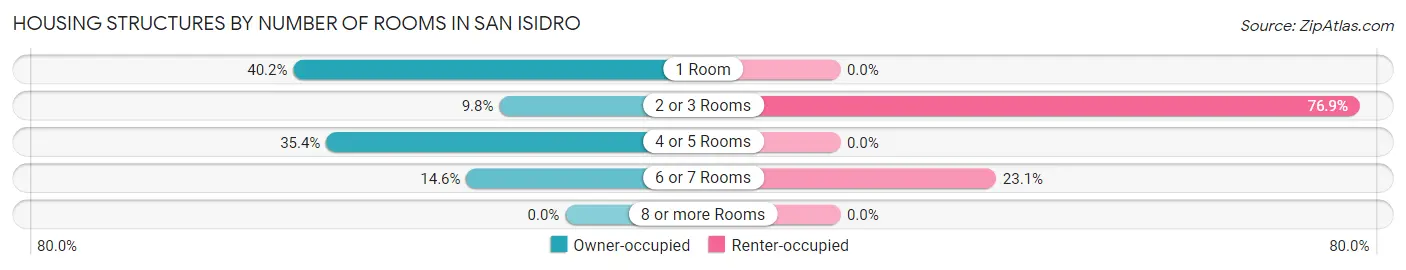
| Number of Rooms | Owner-occupied | Renter-occupied |
| 1 Room | 33 (40.2%) | 0 (0.0%) |
| 2 or 3 Rooms | 8 (9.8%) | 10 (76.9%) |
| 4 or 5 Rooms | 29 (35.4%) | 0 (0.0%) |
| 6 or 7 Rooms | 12 (14.6%) | 3 (23.1%) |
| 8 or more Rooms | 0 (0.0%) | 0 (0.0%) |
| Total | 82 (100.0%) | 13 (100.0%) |
Housing Structure by Heating Type in San Isidro
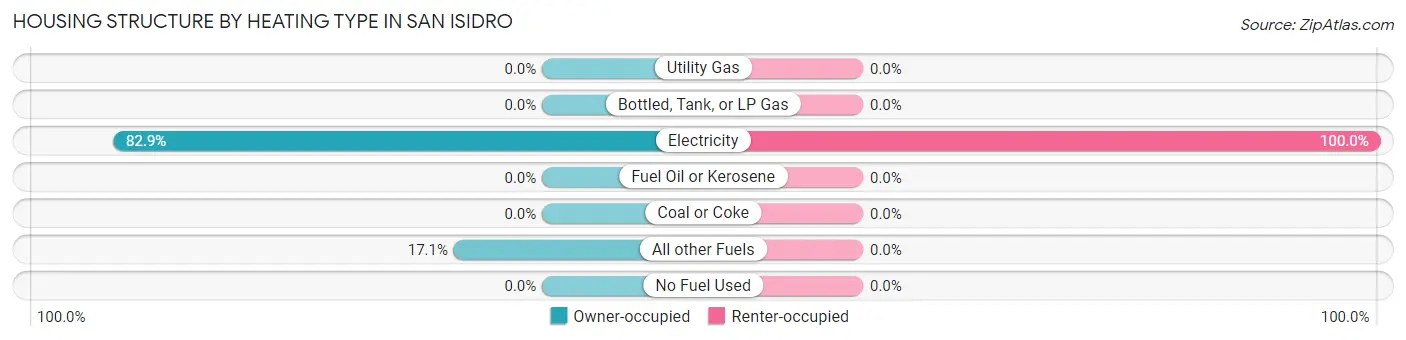
| Heating Type | Owner-occupied | Renter-occupied |
| Utility Gas | 0 (0.0%) | 0 (0.0%) |
| Bottled, Tank, or LP Gas | 0 (0.0%) | 0 (0.0%) |
| Electricity | 68 (82.9%) | 13 (100.0%) |
| Fuel Oil or Kerosene | 0 (0.0%) | 0 (0.0%) |
| Coal or Coke | 0 (0.0%) | 0 (0.0%) |
| All other Fuels | 14 (17.1%) | 0 (0.0%) |
| No Fuel Used | 0 (0.0%) | 0 (0.0%) |
| Total | 82 (100.0%) | 13 (100.0%) |
Household Vehicle Usage in San Isidro
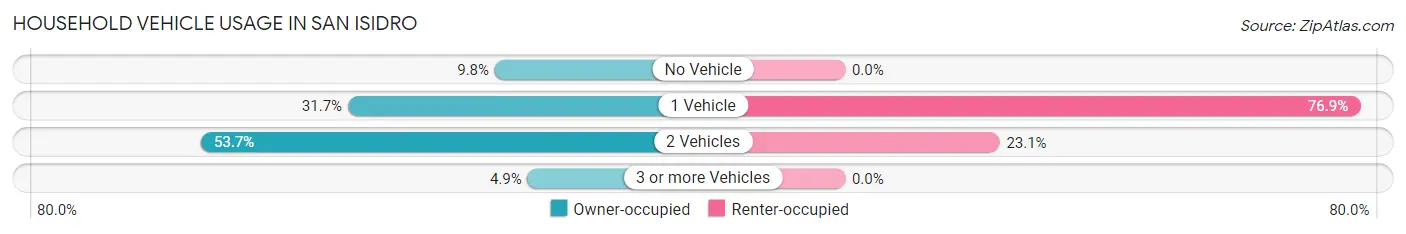
| Vehicles per Household | Owner-occupied | Renter-occupied |
| No Vehicle | 8 (9.8%) | 0 (0.0%) |
| 1 Vehicle | 26 (31.7%) | 10 (76.9%) |
| 2 Vehicles | 44 (53.7%) | 3 (23.1%) |
| 3 or more Vehicles | 4 (4.9%) | 0 (0.0%) |
| Total | 82 (100.0%) | 13 (100.0%) |
Real Estate & Mortgages in San Isidro
Real Estate and Mortgage Overview in San Isidro
| Characteristic | Without Mortgage | With Mortgage |
| Housing Units | 49 | 33 |
| Median Property Value | $43,600 | $0 |
| Median Household Income | $21,696 | $0 |
| Monthly Housing Costs | $158 | $0 |
| Real Estate Taxes | $476 | $0 |
Property Value by Mortgage Status in San Isidro
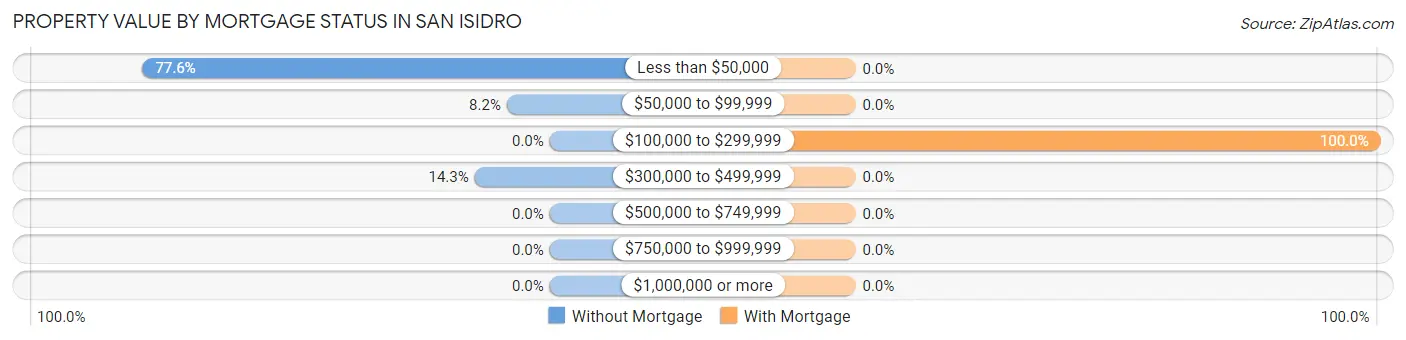
| Property Value | Without Mortgage | With Mortgage |
| Less than $50,000 | 38 (77.5%) | 0 (0.0%) |
| $50,000 to $99,999 | 4 (8.2%) | 0 (0.0%) |
| $100,000 to $299,999 | 0 (0.0%) | 33 (100.0%) |
| $300,000 to $499,999 | 7 (14.3%) | 0 (0.0%) |
| $500,000 to $749,999 | 0 (0.0%) | 0 (0.0%) |
| $750,000 to $999,999 | 0 (0.0%) | 0 (0.0%) |
| $1,000,000 or more | 0 (0.0%) | 0 (0.0%) |
| Total | 49 (100.0%) | 33 (100.0%) |
Household Income by Mortgage Status in San Isidro
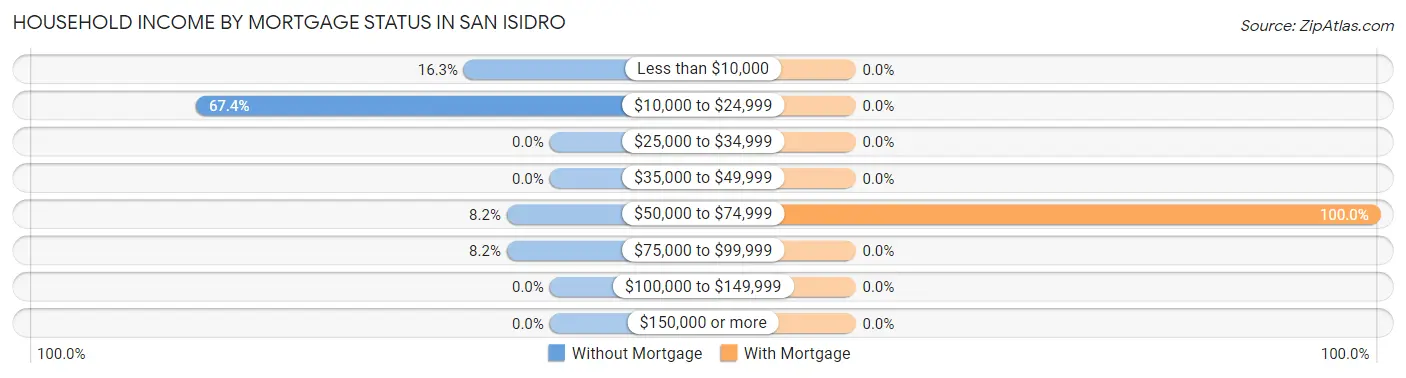
| Household Income | Without Mortgage | With Mortgage |
| Less than $10,000 | 8 (16.3%) | 0 (0.0%) |
| $10,000 to $24,999 | 33 (67.3%) | 0 (0.0%) |
| $25,000 to $34,999 | 0 (0.0%) | 0 (0.0%) |
| $35,000 to $49,999 | 0 (0.0%) | 0 (0.0%) |
| $50,000 to $74,999 | 4 (8.2%) | 33 (100.0%) |
| $75,000 to $99,999 | 4 (8.2%) | 0 (0.0%) |
| $100,000 to $149,999 | 0 (0.0%) | 0 (0.0%) |
| $150,000 or more | 0 (0.0%) | 0 (0.0%) |
| Total | 49 (100.0%) | 33 (100.0%) |
Property Value to Household Income Ratio in San Isidro
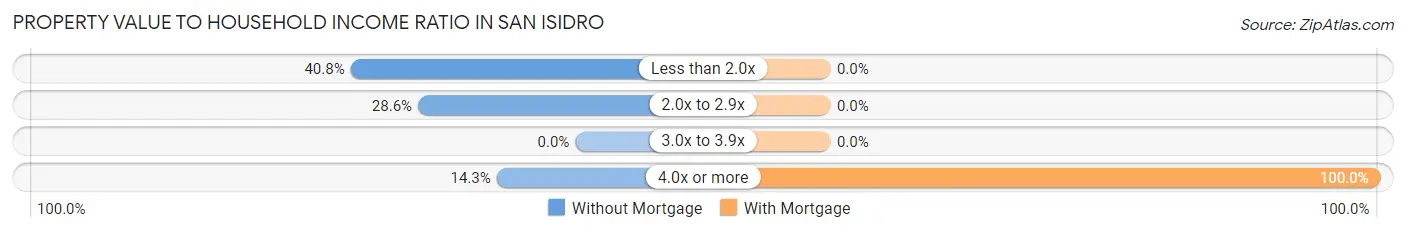
| Value-to-Income Ratio | Without Mortgage | With Mortgage |
| Less than 2.0x | 20 (40.8%) | 0 (0.0%) |
| 2.0x to 2.9x | 14 (28.6%) | 0 (0.0%) |
| 3.0x to 3.9x | 0 (0.0%) | 0 (0.0%) |
| 4.0x or more | 7 (14.3%) | 33 (100.0%) |
| Total | 49 (100.0%) | 33 (100.0%) |
Real Estate Taxes by Mortgage Status in San Isidro
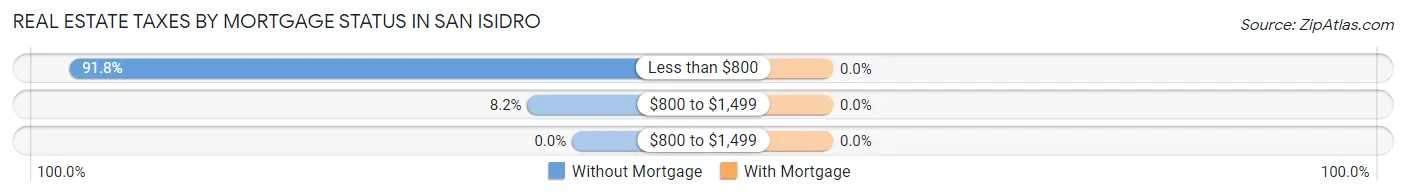
| Property Taxes | Without Mortgage | With Mortgage |
| Less than $800 | 45 (91.8%) | 0 (0.0%) |
| $800 to $1,499 | 4 (8.2%) | 0 (0.0%) |
| $800 to $1,499 | 0 (0.0%) | 0 (0.0%) |
| Total | 49 (100.0%) | 33 (100.0%) |
Health & Disability in San Isidro
Health Insurance Coverage by Age in San Isidro
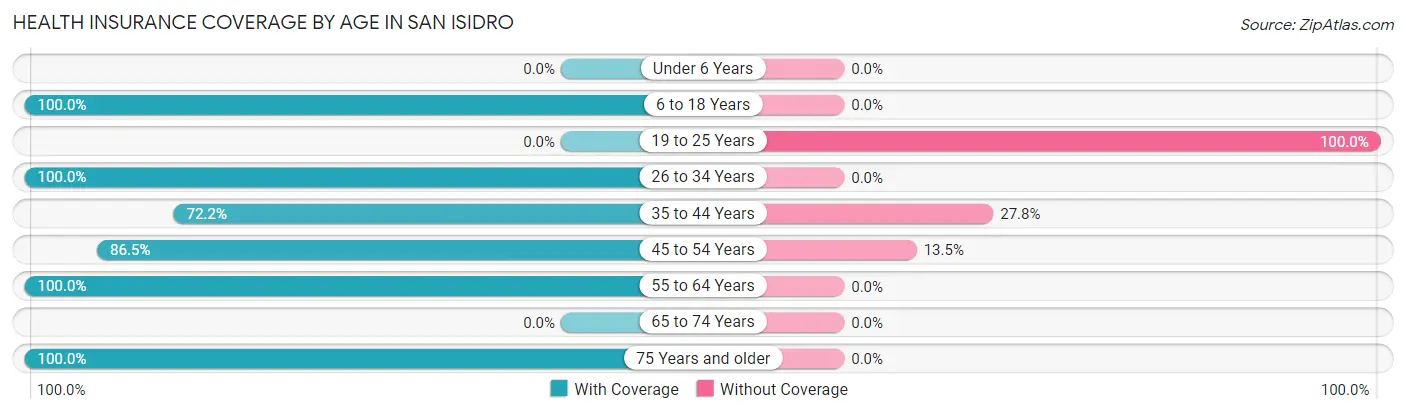
| Age Bracket | With Coverage | Without Coverage |
| Under 6 Years | 0 (0.0%) | 0 (0.0%) |
| 6 to 18 Years | 65 (100.0%) | 0 (0.0%) |
| 19 to 25 Years | 0 (0.0%) | 14 (100.0%) |
| 26 to 34 Years | 16 (100.0%) | 0 (0.0%) |
| 35 to 44 Years | 13 (72.2%) | 5 (27.8%) |
| 45 to 54 Years | 64 (86.5%) | 10 (13.5%) |
| 55 to 64 Years | 42 (100.0%) | 0 (0.0%) |
| 65 to 74 Years | 0 (0.0%) | 0 (0.0%) |
| 75 Years and older | 26 (100.0%) | 0 (0.0%) |
| Total | 226 (88.6%) | 29 (11.4%) |
Health Insurance Coverage by Citizenship Status in San Isidro
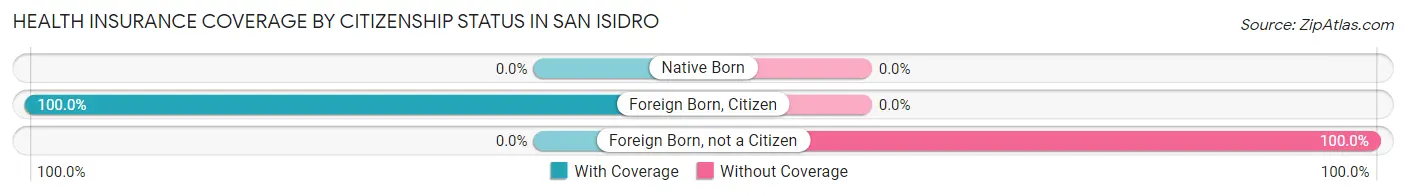
| Citizenship Status | With Coverage | Without Coverage |
| Native Born | 0 (0.0%) | 0 (0.0%) |
| Foreign Born, Citizen | 65 (100.0%) | 0 (0.0%) |
| Foreign Born, not a Citizen | 0 (0.0%) | 14 (100.0%) |
Health Insurance Coverage by Household Income in San Isidro
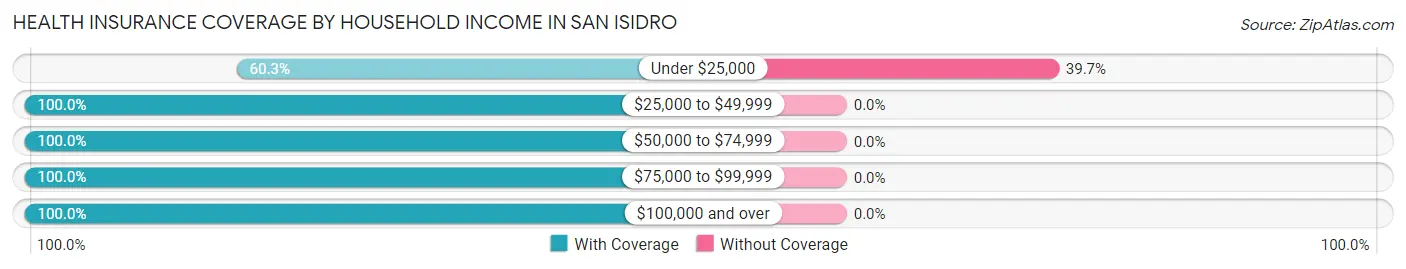
| Household Income | With Coverage | Without Coverage |
| Under $25,000 | 44 (60.3%) | 29 (39.7%) |
| $25,000 to $49,999 | 101 (100.0%) | 0 (0.0%) |
| $50,000 to $74,999 | 31 (100.0%) | 0 (0.0%) |
| $75,000 to $99,999 | 30 (100.0%) | 0 (0.0%) |
| $100,000 and over | 20 (100.0%) | 0 (0.0%) |
Public vs Private Health Insurance Coverage by Age in San Isidro
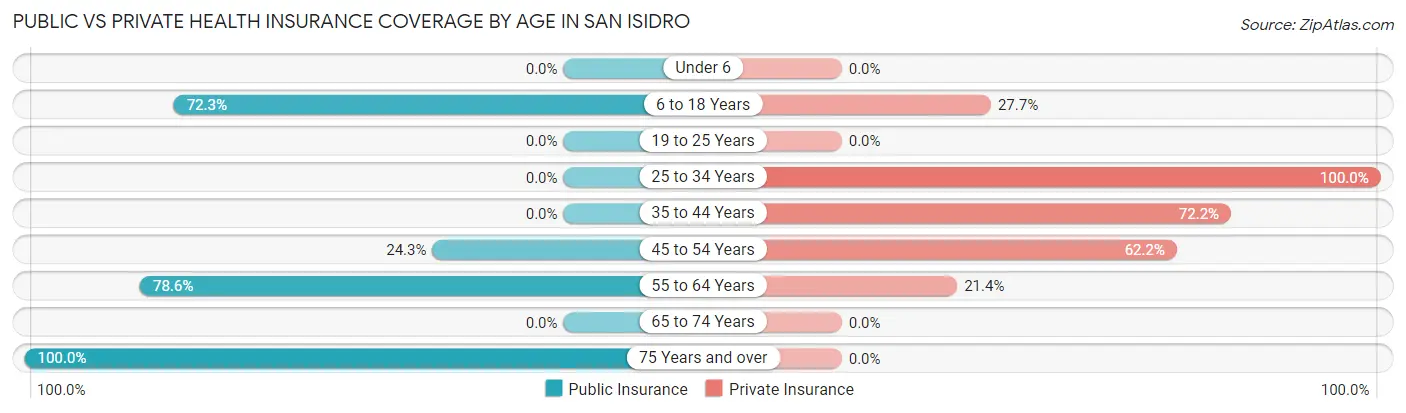
| Age Bracket | Public Insurance | Private Insurance |
| Under 6 | 0 (0.0%) | 0 (0.0%) |
| 6 to 18 Years | 47 (72.3%) | 18 (27.7%) |
| 19 to 25 Years | 0 (0.0%) | 0 (0.0%) |
| 25 to 34 Years | 0 (0.0%) | 16 (100.0%) |
| 35 to 44 Years | 0 (0.0%) | 13 (72.2%) |
| 45 to 54 Years | 18 (24.3%) | 46 (62.2%) |
| 55 to 64 Years | 33 (78.6%) | 9 (21.4%) |
| 65 to 74 Years | 0 (0.0%) | 0 (0.0%) |
| 75 Years and over | 26 (100.0%) | 0 (0.0%) |
| Total | 124 (48.6%) | 102 (40.0%) |
Disability Status by Sex by Age in San Isidro
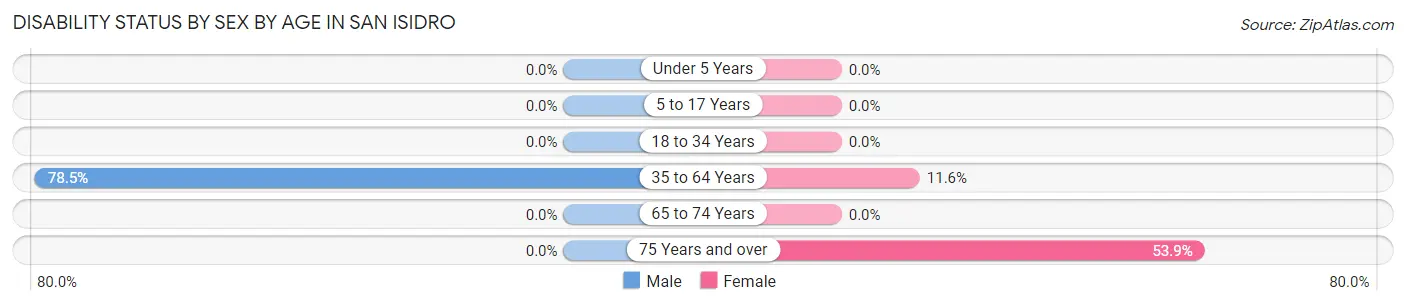
| Age Bracket | Male | Female |
| Under 5 Years | 0 (0.0%) | 0 (0.0%) |
| 5 to 17 Years | 0 (0.0%) | 0 (0.0%) |
| 18 to 34 Years | 0 (0.0%) | 0 (0.0%) |
| 35 to 64 Years | 51 (78.5%) | 8 (11.6%) |
| 65 to 74 Years | 0 (0.0%) | 0 (0.0%) |
| 75 Years and over | 0 (0.0%) | 14 (53.8%) |
Disability Class by Sex by Age in San Isidro
Disability Class: Hearing Difficulty
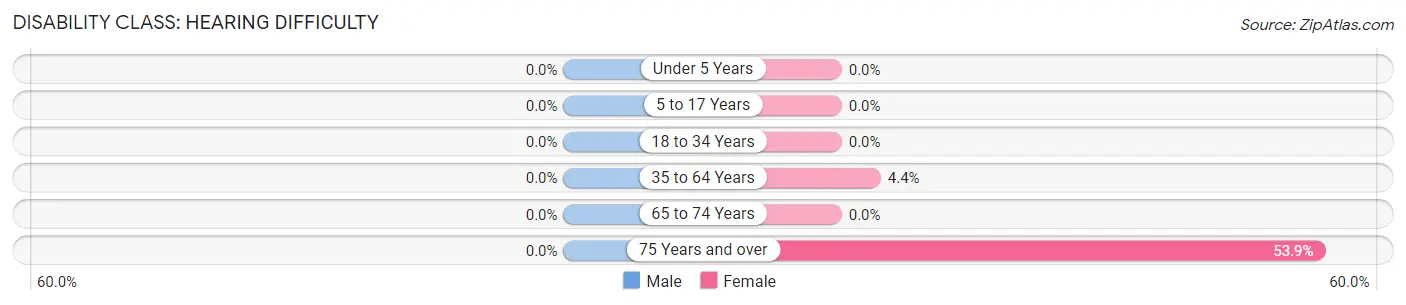
| Age Bracket | Male | Female |
| Under 5 Years | 0 (0.0%) | 0 (0.0%) |
| 5 to 17 Years | 0 (0.0%) | 0 (0.0%) |
| 18 to 34 Years | 0 (0.0%) | 0 (0.0%) |
| 35 to 64 Years | 0 (0.0%) | 3 (4.3%) |
| 65 to 74 Years | 0 (0.0%) | 0 (0.0%) |
| 75 Years and over | 0 (0.0%) | 14 (53.8%) |
Disability Class: Vision Difficulty
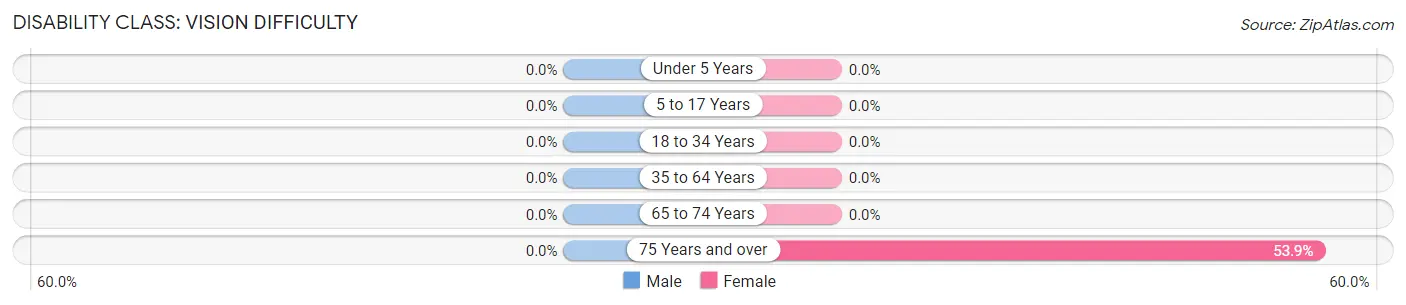
| Age Bracket | Male | Female |
| Under 5 Years | 0 (0.0%) | 0 (0.0%) |
| 5 to 17 Years | 0 (0.0%) | 0 (0.0%) |
| 18 to 34 Years | 0 (0.0%) | 0 (0.0%) |
| 35 to 64 Years | 0 (0.0%) | 0 (0.0%) |
| 65 to 74 Years | 0 (0.0%) | 0 (0.0%) |
| 75 Years and over | 0 (0.0%) | 14 (53.8%) |
Disability Class: Cognitive Difficulty
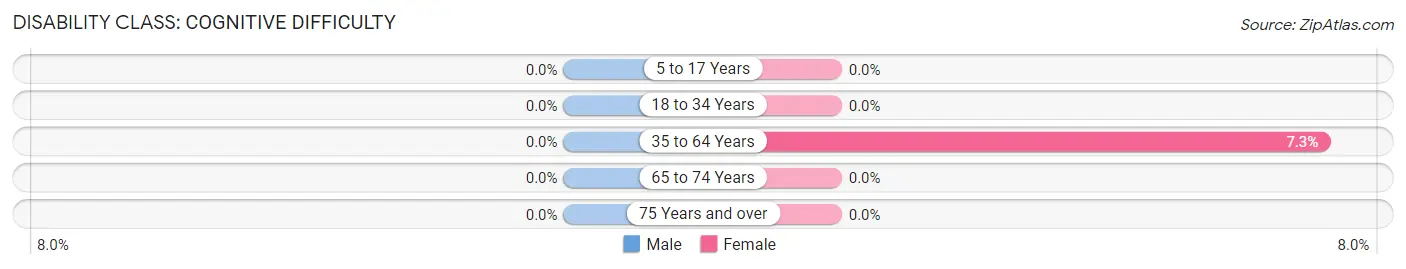
| Age Bracket | Male | Female |
| 5 to 17 Years | 0 (0.0%) | 0 (0.0%) |
| 18 to 34 Years | 0 (0.0%) | 0 (0.0%) |
| 35 to 64 Years | 0 (0.0%) | 5 (7.2%) |
| 65 to 74 Years | 0 (0.0%) | 0 (0.0%) |
| 75 Years and over | 0 (0.0%) | 0 (0.0%) |
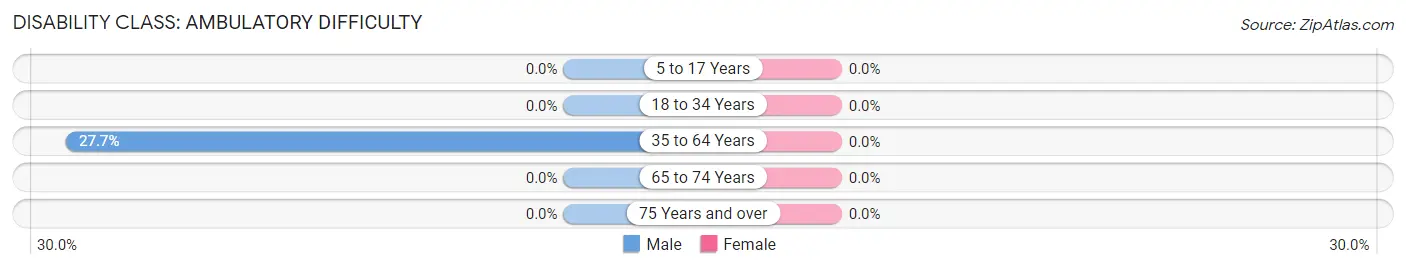
Disability Class: Ambulatory Difficulty
| Age Bracket | Male | Female |
| 5 to 17 Years | 0 (0.0%) | 0 (0.0%) |
| 18 to 34 Years | 0 (0.0%) | 0 (0.0%) |
| 35 to 64 Years | 18 (27.7%) | 0 (0.0%) |
| 65 to 74 Years | 0 (0.0%) | 0 (0.0%) |
| 75 Years and over | 0 (0.0%) | 0 (0.0%) |
Disability Class: Self-Care Difficulty
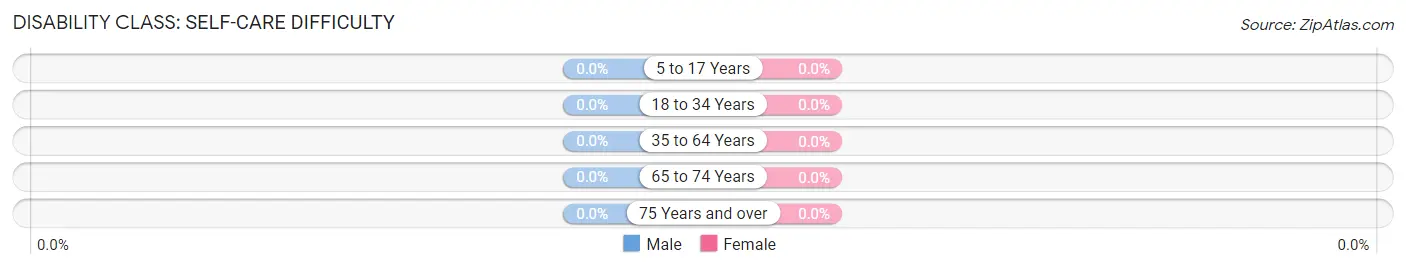
| Age Bracket | Male | Female |
| 5 to 17 Years | 0 (0.0%) | 0 (0.0%) |
| 18 to 34 Years | 0 (0.0%) | 0 (0.0%) |
| 35 to 64 Years | 0 (0.0%) | 0 (0.0%) |
| 65 to 74 Years | 0 (0.0%) | 0 (0.0%) |
| 75 Years and over | 0 (0.0%) | 0 (0.0%) |
Technology Access in San Isidro
Computing Device Access in San Isidro
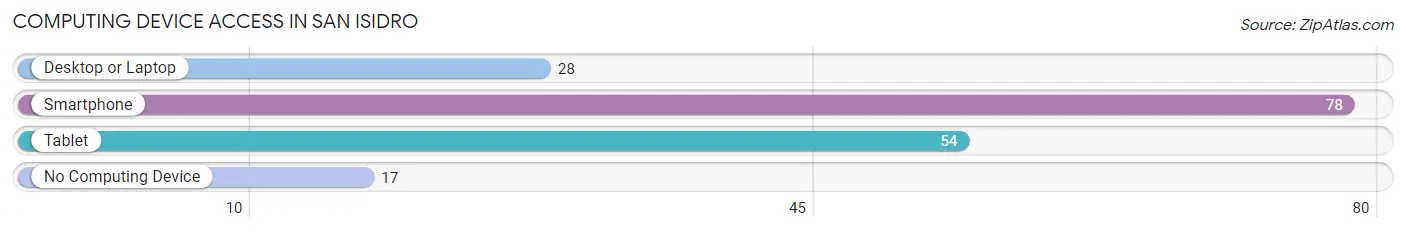
| Device Type | # Households | % Households |
| Desktop or Laptop | 28 | 29.5% |
| Smartphone | 78 | 82.1% |
| Tablet | 54 | 56.8% |
| No Computing Device | 17 | 17.9% |
| Total | 95 | 100.0% |
Internet Access in San Isidro
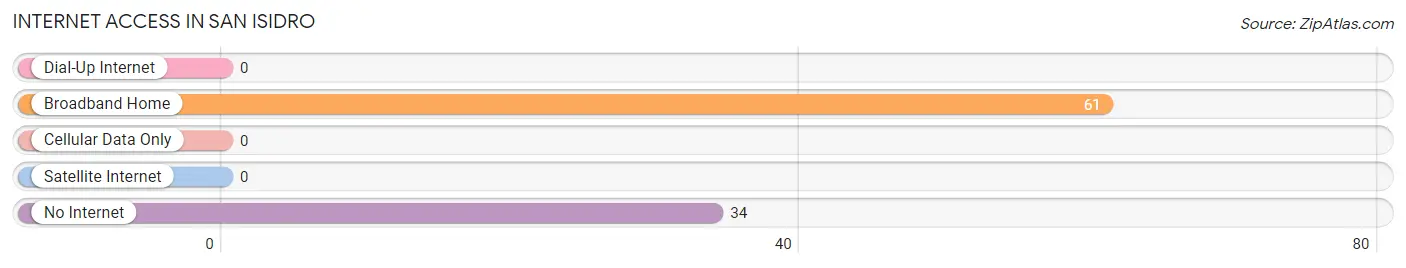
| Internet Type | # Households | % Households |
| Dial-Up Internet | 0 | 0.0% |
| Broadband Home | 61 | 64.2% |
| Cellular Data Only | 0 | 0.0% |
| Satellite Internet | 0 | 0.0% |
| No Internet | 34 | 35.8% |
| Total | 95 | 100.0% |
San Isidro Summary
San Isidro is a small town located in Starr County, Texas, United States. It is situated on the Rio Grande, approximately 20 miles south of Rio Grande City. The town was founded in 1848 and is named after Saint Isidore the Laborer, the patron saint of farmers. As of the 2010 census, the population of San Isidro was 1,093.
History
San Isidro was founded in 1848 by a group of Mexican settlers who were looking for a place to settle and farm. The town was named after Saint Isidore the Laborer, the patron saint of farmers. The settlers built a chapel dedicated to the saint, which still stands today.
In the late 19th century, San Isidro was a thriving agricultural community. The town was known for its production of cotton, corn, and other crops. The town also had a thriving livestock industry, with cattle, sheep, and goats being raised in the area.
In the early 20th century, San Isidro began to experience a decline in population as many of its residents moved away to larger cities in search of better economic opportunities. The town was also affected by the Great Depression, which caused many of its businesses to close.
Geography
San Isidro is located in Starr County, Texas, approximately 20 miles south of Rio Grande City. The town is situated on the Rio Grande, which forms the border between the United States and Mexico. The town is surrounded by farmland and is located in a semi-arid climate.
The terrain of San Isidro is mostly flat, with some rolling hills. The town is located at an elevation of approximately 500 feet above sea level.
Economy
San Isidro’s economy is largely based on agriculture. The town is known for its production of cotton, corn, and other crops. The town also has a thriving livestock industry, with cattle, sheep, and goats being raised in the area.
The town also has a few small businesses, including a grocery store, a hardware store, and a few restaurants.
Demographics
As of the 2010 census, the population of San Isidro was 1,093. The racial makeup of the town was 94.3% Hispanic or Latino, 4.2% White, 0.2% African American, 0.2% Native American, and 0.9% from other races.
The median household income in San Isidro was $19,917, and the median family income was $21,250. The per capita income was $7,945. About 28.3% of the population was below the poverty line.
Conclusion
San Isidro is a small town located in Starr County, Texas, United States. It was founded in 1848 and is named after Saint Isidore the Laborer, the patron saint of farmers. The town’s economy is largely based on agriculture, with cotton, corn, and other crops being produced in the area. The town also has a thriving livestock industry, with cattle, sheep, and goats being raised in the area. As of the 2010 census, the population of San Isidro was 1,093. The racial makeup of the town was 94.3% Hispanic or Latino, 4.2% White, 0.2% African American, 0.2% Native American, and 0.9% from other races. The median household income in San Isidro was $19,917, and the median family income was $21,250. The per capita income was $7,945. About 28.3% of the population was below the poverty line.
Common Questions
What is Per Capita Income in San Isidro?
Per Capita income in San Isidro is $17,555.
What is the Median Family Income in San Isidro?
Median Family Income in San Isidro is $41,326.
What is the Median Household income in San Isidro?
Median Household Income in San Isidro is $40,492.
What is Inequality or Gini Index in San Isidro?
Inequality or Gini Index in San Isidro is 0.38.
What is the Total Population of San Isidro?
Total Population of San Isidro is 255.
What is the Total Male Population of San Isidro?
Total Male Population of San Isidro is 129.
What is the Total Female Population of San Isidro?
Total Female Population of San Isidro is 126.
What is the Ratio of Males per 100 Females in San Isidro?
There are 102.38 Males per 100 Females in San Isidro.
What is the Ratio of Females per 100 Males in San Isidro?
There are 97.67 Females per 100 Males in San Isidro.
What is the Median Population Age in San Isidro?
Median Population Age in San Isidro is 48.2 Years.
What is the Average Family Size in San Isidro
Average Family Size in San Isidro is 3.2 People.
What is the Average Household Size in San Isidro
Average Household Size in San Isidro is 2.7 People.
How Large is the Labor Force in San Isidro?
There are 96 People in the Labor Forcein in San Isidro.
What is the Percentage of People in the Labor Force in San Isidro?
41.6% of People are in the Labor Force in San Isidro.
What is the Unemployment Rate in San Isidro?
Unemployment Rate in San Isidro is 5.2%.