Sabinal, TX Map & Demographics
Sabinal Map
Sabinal Overview
$18,835
PER CAPITA INCOME
$34,954
AVG FAMILY INCOME
$28,419
AVG HOUSEHOLD INCOME
25.6%
WAGE / INCOME GAP [ % ]
74.4¢/ $1
WAGE / INCOME GAP [ $ ]
0.32
INEQUALITY / GINI INDEX
635
TOTAL POPULATION
276
MALE POPULATION
359
FEMALE POPULATION
76.88
MALES / 100 FEMALES
130.07
FEMALES / 100 MALES
60.0
MEDIAN AGE
2.8
AVG FAMILY SIZE
1.9
AVG HOUSEHOLD SIZE
284
LABOR FORCE [ PEOPLE ]
52.7%
PERCENT IN LABOR FORCE
7.0%
UNEMPLOYMENT RATE
Sabinal Zip Codes
Sabinal Area Codes
Income in Sabinal
Income Overview in Sabinal
Per Capita Income in Sabinal is $18,835, while median incomes of families and households are $34,954 and $28,419 respectively.
| Characteristic | Number | Measure |
| Per Capita Income | 635 | $18,835 |
| Median Family Income | 153 | $34,954 |
| Mean Family Income | 153 | $39,899 |
| Median Household Income | 337 | $28,419 |
| Mean Household Income | 337 | $34,237 |
| Income Deficit | 153 | $0 |
| Wage / Income Gap (%) | 635 | 25.62% |
| Wage / Income Gap ($) | 635 | 74.38¢ per $1 |
| Gini / Inequality Index | 635 | 0.32 |
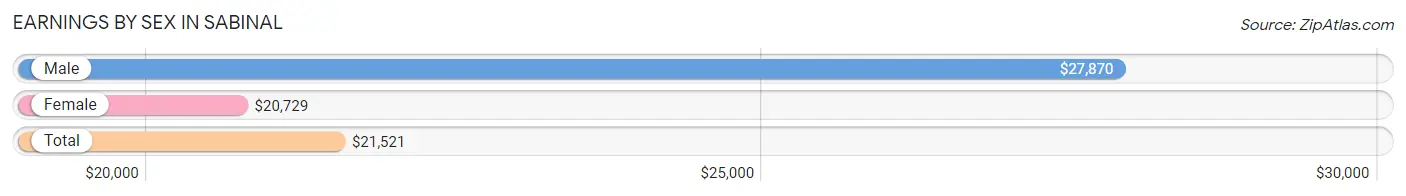
Earnings by Sex in Sabinal
Average Earnings in Sabinal are $21,521, $27,870 for men and $20,729 for women, a difference of 25.6%.
| Sex | Number | Average Earnings |
| Male | 120 (42.2%) | $27,870 |
| Female | 164 (57.8%) | $20,729 |
| Total | 284 (100.0%) | $21,521 |
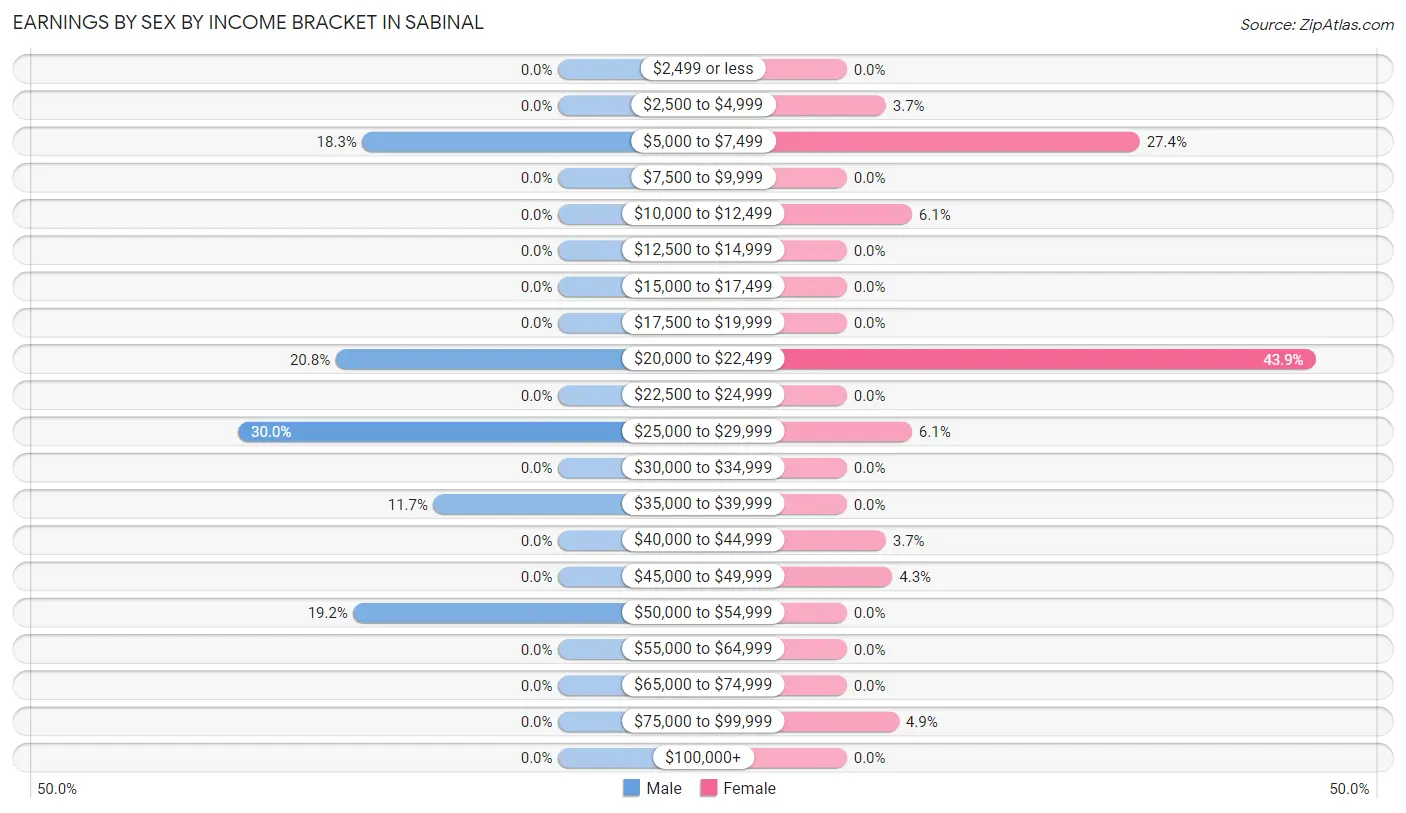
Earnings by Sex by Income Bracket in Sabinal
The most common earnings brackets in Sabinal are $25,000 to $29,999 for men (36 | 30.0%) and $20,000 to $22,499 for women (72 | 43.9%).
| Income | Male | Female |
| $2,499 or less | 0 (0.0%) | 0 (0.0%) |
| $2,500 to $4,999 | 0 (0.0%) | 6 (3.7%) |
| $5,000 to $7,499 | 22 (18.3%) | 45 (27.4%) |
| $7,500 to $9,999 | 0 (0.0%) | 0 (0.0%) |
| $10,000 to $12,499 | 0 (0.0%) | 10 (6.1%) |
| $12,500 to $14,999 | 0 (0.0%) | 0 (0.0%) |
| $15,000 to $17,499 | 0 (0.0%) | 0 (0.0%) |
| $17,500 to $19,999 | 0 (0.0%) | 0 (0.0%) |
| $20,000 to $22,499 | 25 (20.8%) | 72 (43.9%) |
| $22,500 to $24,999 | 0 (0.0%) | 0 (0.0%) |
| $25,000 to $29,999 | 36 (30.0%) | 10 (6.1%) |
| $30,000 to $34,999 | 0 (0.0%) | 0 (0.0%) |
| $35,000 to $39,999 | 14 (11.7%) | 0 (0.0%) |
| $40,000 to $44,999 | 0 (0.0%) | 6 (3.7%) |
| $45,000 to $49,999 | 0 (0.0%) | 7 (4.3%) |
| $50,000 to $54,999 | 23 (19.2%) | 0 (0.0%) |
| $55,000 to $64,999 | 0 (0.0%) | 0 (0.0%) |
| $65,000 to $74,999 | 0 (0.0%) | 0 (0.0%) |
| $75,000 to $99,999 | 0 (0.0%) | 8 (4.9%) |
| $100,000+ | 0 (0.0%) | 0 (0.0%) |
| Total | 120 (100.0%) | 164 (100.0%) |
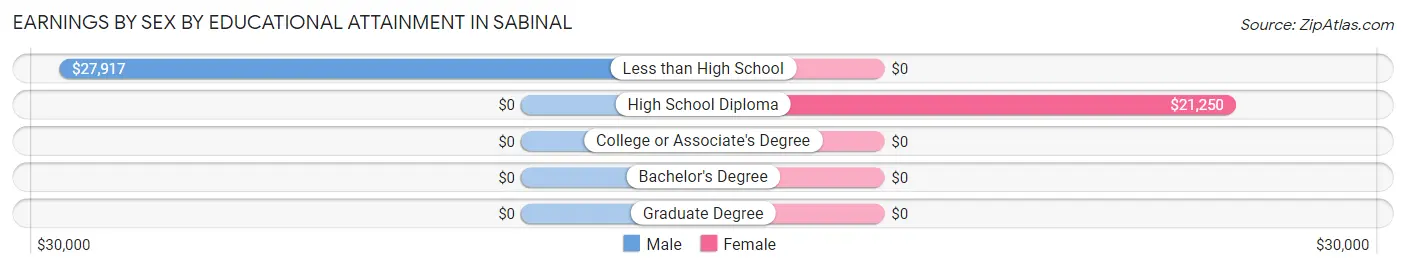
Earnings by Sex by Educational Attainment in Sabinal
Average earnings in Sabinal are $26,667 for men and $20,729 for women, a difference of 22.3%. Men with an educational attainment of less than high school enjoy the highest average annual earnings of $27,917, while those with less than high school education earn the least with $27,917. Women with an educational attainment of high school diploma earn the most with the average annual earnings of $21,250, while those with high school diploma education have the smallest earnings of $21,250.
| Educational Attainment | Male Income | Female Income |
| Less than High School | $27,917 | $0 |
| High School Diploma | - | - |
| College or Associate's Degree | - | - |
| Bachelor's Degree | - | - |
| Graduate Degree | - | - |
| Total | $26,667 | $20,729 |
Family Income in Sabinal
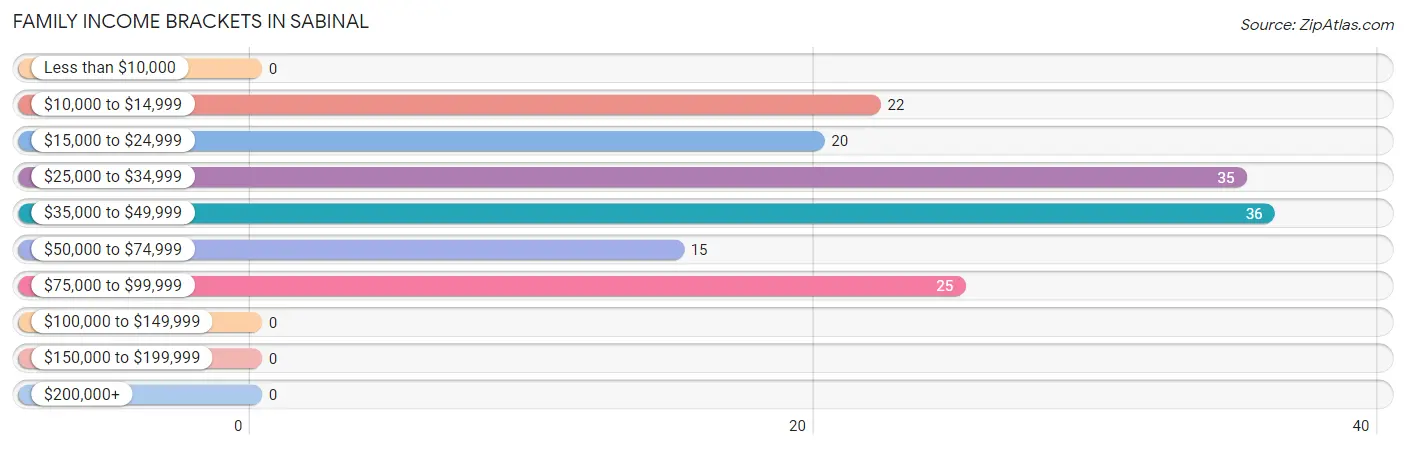
Family Income Brackets in Sabinal
According to the Sabinal family income data, there are 36 families falling into the $35,000 to $49,999 income range, which is the most common income bracket and makes up 23.5% of all families.
| Income Bracket | # Families | % Families |
| Less than $10,000 | 0 | 0.0% |
| $10,000 to $14,999 | 22 | 14.4% |
| $15,000 to $24,999 | 20 | 13.1% |
| $25,000 to $34,999 | 35 | 22.9% |
| $35,000 to $49,999 | 36 | 23.5% |
| $50,000 to $74,999 | 15 | 9.8% |
| $75,000 to $99,999 | 25 | 16.3% |
| $100,000 to $149,999 | 0 | 0.0% |
| $150,000 to $199,999 | 0 | 0.0% |
| $200,000+ | 0 | 0.0% |
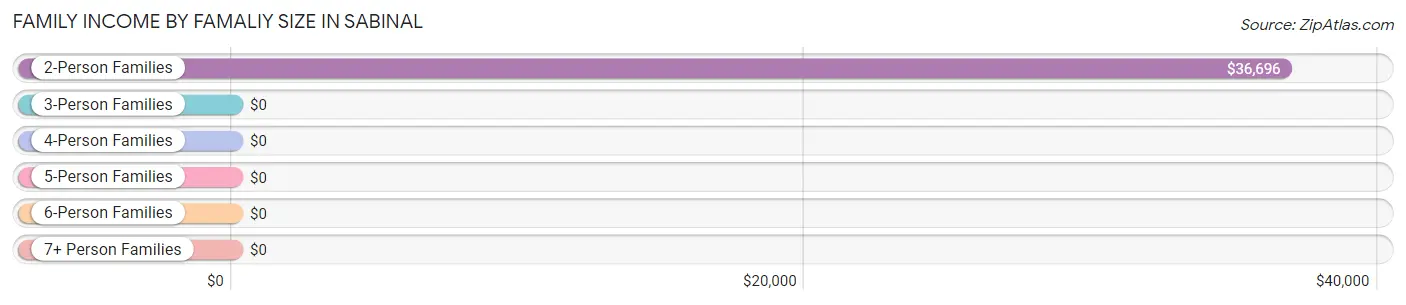
Family Income by Famaliy Size in Sabinal
2-person families (133 | 86.9%) account for the highest median family income in Sabinal with $36,696 per family, while 2-person families (133 | 86.9%) have the highest median income of $18,348 per family member.
| Income Bracket | # Families | Median Income |
| 2-Person Families | 133 (86.9%) | $36,696 |
| 3-Person Families | 0 (0.0%) | $0 |
| 4-Person Families | 12 (7.8%) | $0 |
| 5-Person Families | 8 (5.2%) | $0 |
| 6-Person Families | 0 (0.0%) | $0 |
| 7+ Person Families | 0 (0.0%) | $0 |
| Total | 153 (100.0%) | $34,954 |
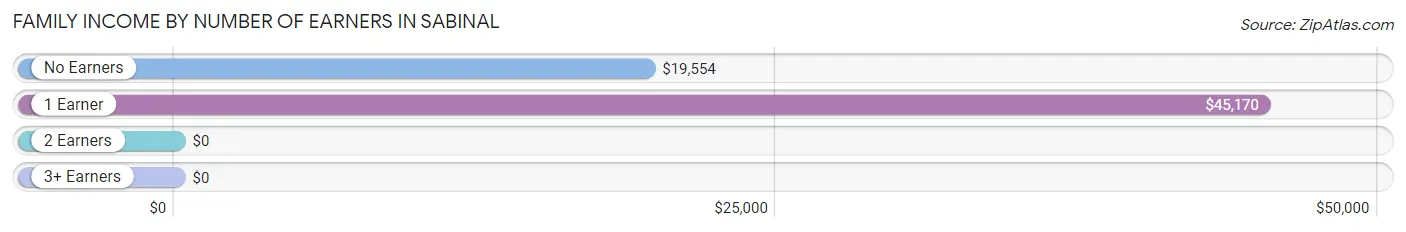
Family Income by Number of Earners in Sabinal
| Number of Earners | # Families | Median Income |
| No Earners | 67 (43.8%) | $19,554 |
| 1 Earner | 67 (43.8%) | $45,170 |
| 2 Earners | 19 (12.4%) | $0 |
| 3+ Earners | 0 (0.0%) | $0 |
| Total | 153 (100.0%) | $34,954 |
Household Income in Sabinal
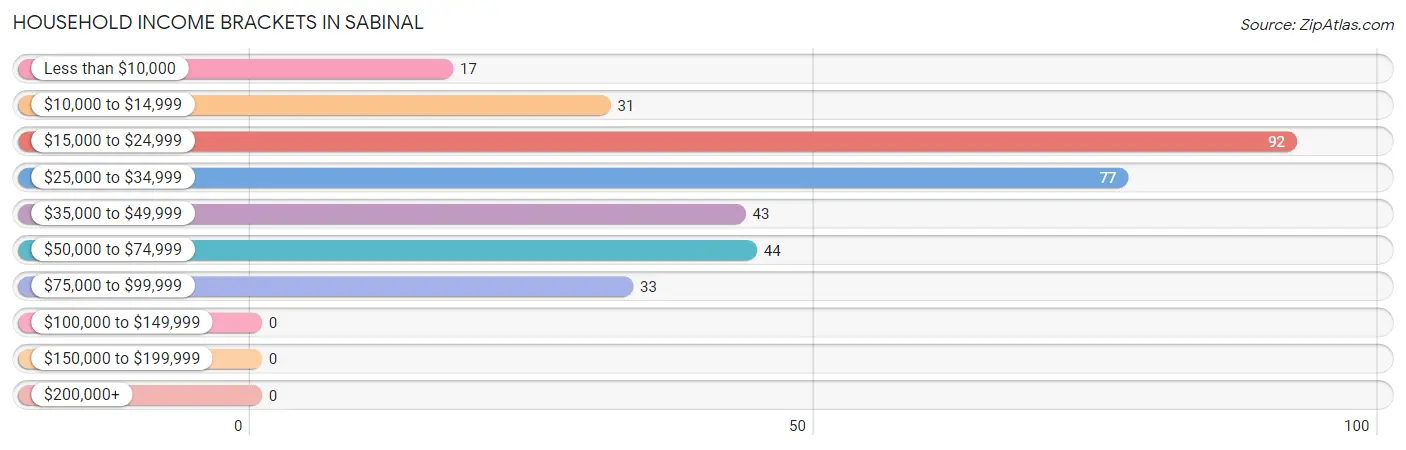
Household Income Brackets in Sabinal
With 92 households falling in the category, the $15,000 to $24,999 income range is the most frequent in Sabinal, accounting for 27.3% of all households.
| Income Bracket | # Households | % Households |
| Less than $10,000 | 17 | 5.0% |
| $10,000 to $14,999 | 31 | 9.2% |
| $15,000 to $24,999 | 92 | 27.3% |
| $25,000 to $34,999 | 77 | 22.8% |
| $35,000 to $49,999 | 43 | 12.8% |
| $50,000 to $74,999 | 44 | 13.1% |
| $75,000 to $99,999 | 33 | 9.8% |
| $100,000 to $149,999 | 0 | 0.0% |
| $150,000 to $199,999 | 0 | 0.0% |
| $200,000+ | 0 | 0.0% |
Household Income by Householder Age in Sabinal
The median household income in Sabinal is $28,419, with the highest median household income of $33,611 found in the 65+ years age bracket for the primary householder. A total of 122 households (36.2%) fall into this category. Meanwhile, the 15 to 24 years age bracket for the primary householder has the lowest median household income of $0, with 14 households (4.2%) in this group.
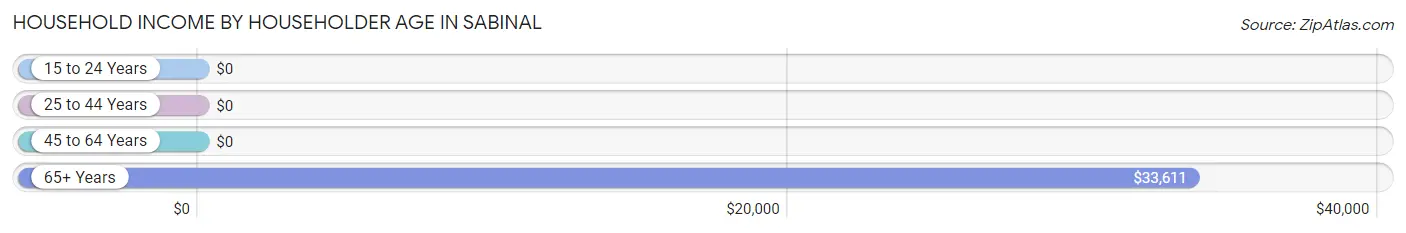
| Income Bracket | # Households | Median Income |
| 15 to 24 Years | 14 (4.2%) | $0 |
| 25 to 44 Years | 32 (9.5%) | $0 |
| 45 to 64 Years | 169 (50.1%) | $0 |
| 65+ Years | 122 (36.2%) | $33,611 |
| Total | 337 (100.0%) | $28,419 |
Poverty in Sabinal
Income Below Poverty by Sex and Age in Sabinal
With 14.5% poverty level for males and 39.3% for females among the residents of Sabinal, 12 to 14 year old males and 5 year old females are the most vulnerable to poverty, with 16 males (51.6%) and 9 females (100.0%) in their respective age groups living below the poverty level.
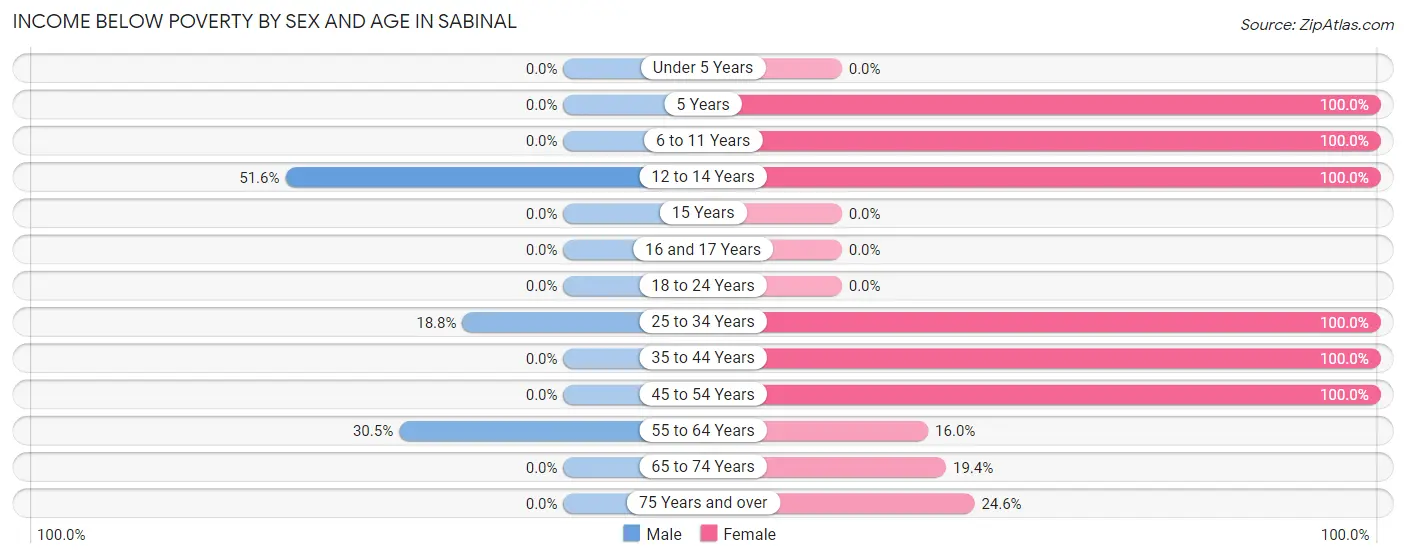
| Age Bracket | Male | Female |
| Under 5 Years | 0 (0.0%) | 0 (0.0%) |
| 5 Years | 0 (0.0%) | 9 (100.0%) |
| 6 to 11 Years | 0 (0.0%) | 23 (100.0%) |
| 12 to 14 Years | 16 (51.6%) | 9 (100.0%) |
| 15 Years | 0 (0.0%) | 0 (0.0%) |
| 16 and 17 Years | 0 (0.0%) | 0 (0.0%) |
| 18 to 24 Years | 0 (0.0%) | 0 (0.0%) |
| 25 to 34 Years | 6 (18.8%) | 16 (100.0%) |
| 35 to 44 Years | 0 (0.0%) | 20 (100.0%) |
| 45 to 54 Years | 0 (0.0%) | 15 (100.0%) |
| 55 to 64 Years | 18 (30.5%) | 21 (16.0%) |
| 65 to 74 Years | 0 (0.0%) | 12 (19.4%) |
| 75 Years and over | 0 (0.0%) | 16 (24.6%) |
| Total | 40 (14.5%) | 141 (39.3%) |
Income Above Poverty by Sex and Age in Sabinal
According to the poverty statistics in Sabinal, males aged under 5 years and females aged 16 and 17 years are the age groups that are most secure financially, with 100.0% of males and 100.0% of females in these age groups living above the poverty line.
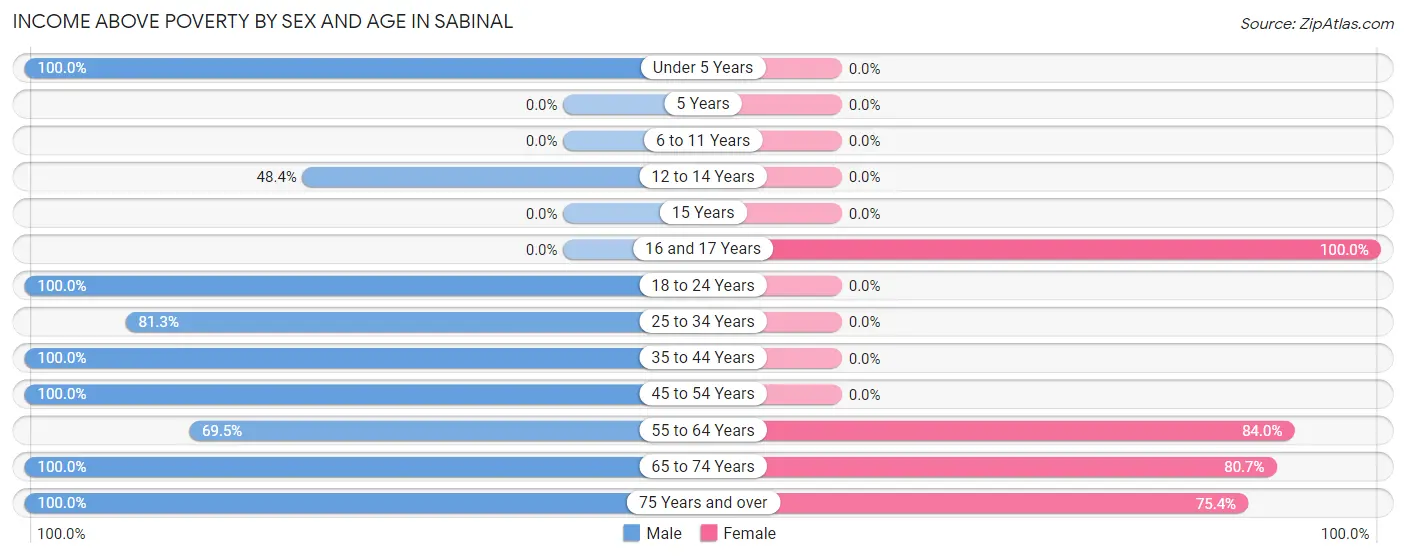
| Age Bracket | Male | Female |
| Under 5 Years | 24 (100.0%) | 0 (0.0%) |
| 5 Years | 0 (0.0%) | 0 (0.0%) |
| 6 to 11 Years | 0 (0.0%) | 0 (0.0%) |
| 12 to 14 Years | 15 (48.4%) | 0 (0.0%) |
| 15 Years | 0 (0.0%) | 0 (0.0%) |
| 16 and 17 Years | 0 (0.0%) | 9 (100.0%) |
| 18 to 24 Years | 14 (100.0%) | 0 (0.0%) |
| 25 to 34 Years | 26 (81.2%) | 0 (0.0%) |
| 35 to 44 Years | 19 (100.0%) | 0 (0.0%) |
| 45 to 54 Years | 38 (100.0%) | 0 (0.0%) |
| 55 to 64 Years | 41 (69.5%) | 110 (84.0%) |
| 65 to 74 Years | 8 (100.0%) | 50 (80.6%) |
| 75 Years and over | 51 (100.0%) | 49 (75.4%) |
| Total | 236 (85.5%) | 218 (60.7%) |
Income Below Poverty Among Married-Couple Families in Sabinal
The poverty statistics for married-couple families in Sabinal show that 19.0% or 18 of the total 95 families live below the poverty line. Families with 3 or 4 children have the highest poverty rate of 100.0%, comprising of 8 families. On the other hand, families with 1 or 2 children have the lowest poverty rate of 0.0%, which includes 0 families.
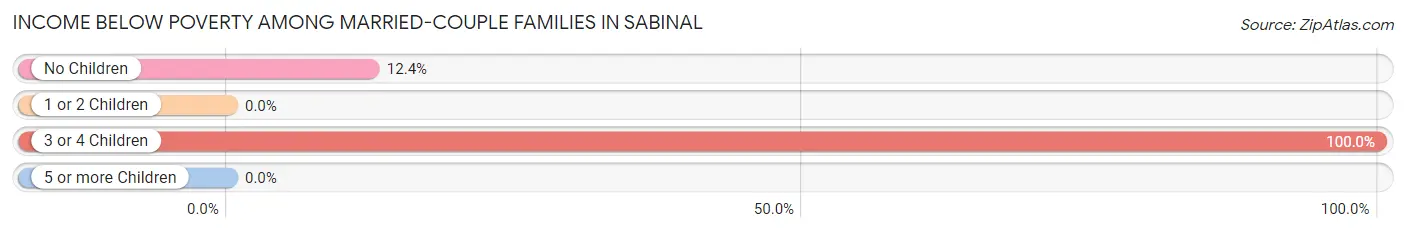
| Children | Above Poverty | Below Poverty |
| No Children | 71 (87.6%) | 10 (12.3%) |
| 1 or 2 Children | 6 (100.0%) | 0 (0.0%) |
| 3 or 4 Children | 0 (0.0%) | 8 (100.0%) |
| 5 or more Children | 0 (0.0%) | 0 (0.0%) |
| Total | 77 (81.0%) | 18 (19.0%) |
Income Below Poverty Among Single-Parent Households in Sabinal
According to the poverty data in Sabinal, 30.0% or 6 single-father households and 31.6% or 12 single-mother households are living below the poverty line. Among single-father households, those with 3 or 4 children have the highest poverty rate, with 6 households (100.0%) experiencing poverty. Likewise, among single-mother households, those with no children have the highest poverty rate, with 12 households (31.6%) falling below the poverty line.
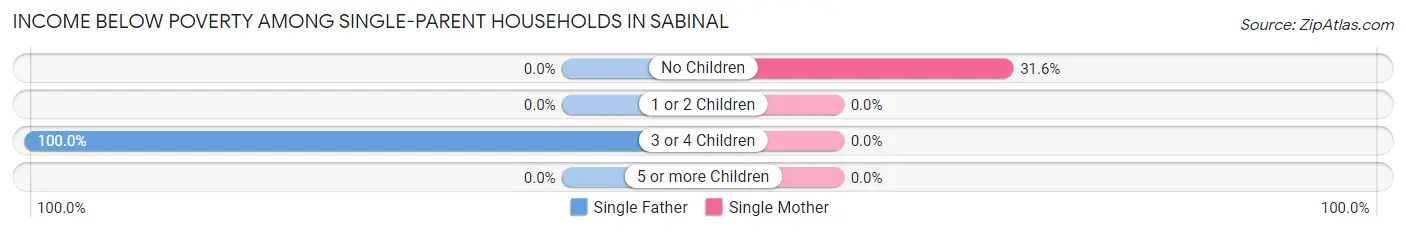
| Children | Single Father | Single Mother |
| No Children | 0 (0.0%) | 12 (31.6%) |
| 1 or 2 Children | 0 (0.0%) | 0 (0.0%) |
| 3 or 4 Children | 6 (100.0%) | 0 (0.0%) |
| 5 or more Children | 0 (0.0%) | 0 (0.0%) |
| Total | 6 (30.0%) | 12 (31.6%) |
Income Below Poverty Among Married-Couple vs Single-Parent Households in Sabinal
The poverty data for Sabinal shows that 18 of the married-couple family households (19.0%) and 18 of the single-parent households (31.0%) are living below the poverty level. Within the married-couple family households, those with 3 or 4 children have the highest poverty rate, with 8 households (100.0%) falling below the poverty line. Among the single-parent households, those with 3 or 4 children have the highest poverty rate, with 6 household (100.0%) living below poverty.
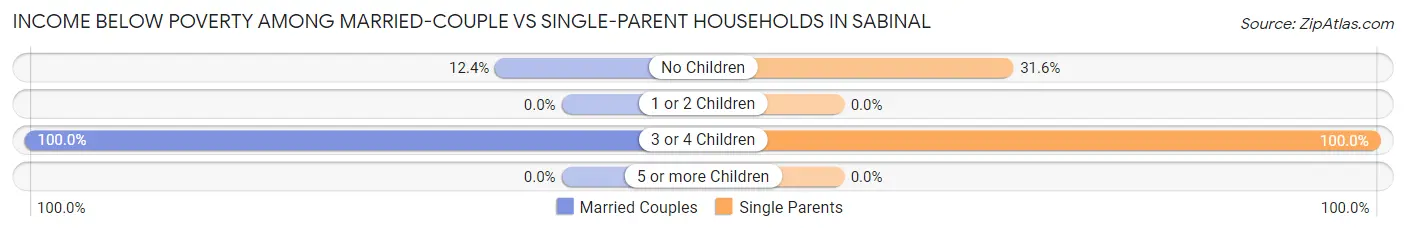
| Children | Married-Couple Families | Single-Parent Households |
| No Children | 10 (12.3%) | 12 (31.6%) |
| 1 or 2 Children | 0 (0.0%) | 0 (0.0%) |
| 3 or 4 Children | 8 (100.0%) | 6 (100.0%) |
| 5 or more Children | 0 (0.0%) | 0 (0.0%) |
| Total | 18 (19.0%) | 18 (31.0%) |
Race in Sabinal
The most populous races in Sabinal are White / Caucasian (453 | 71.3%), Hispanic or Latino (359 | 56.5%), and Two or more Races (182 | 28.7%).
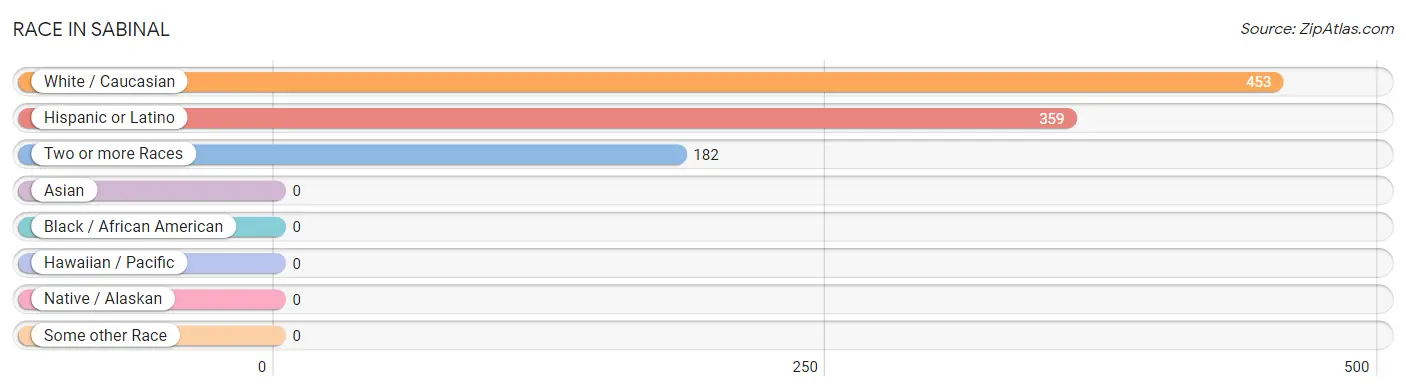
| Race | # Population | % Population |
| Asian | 0 | 0.0% |
| Black / African American | 0 | 0.0% |
| Hawaiian / Pacific | 0 | 0.0% |
| Hispanic or Latino | 359 | 56.5% |
| Native / Alaskan | 0 | 0.0% |
| White / Caucasian | 453 | 71.3% |
| Two or more Races | 182 | 28.7% |
| Some other Race | 0 | 0.0% |
| Total | 635 | 100.0% |
Ancestry in Sabinal
The most populous ancestries reported in Sabinal are Mexican (315 | 49.6%), Scotch-Irish (44 | 6.9%), Spaniard (44 | 6.9%), American (38 | 6.0%), and Irish (31 | 4.9%), together accounting for 74.3% of all Sabinal residents.
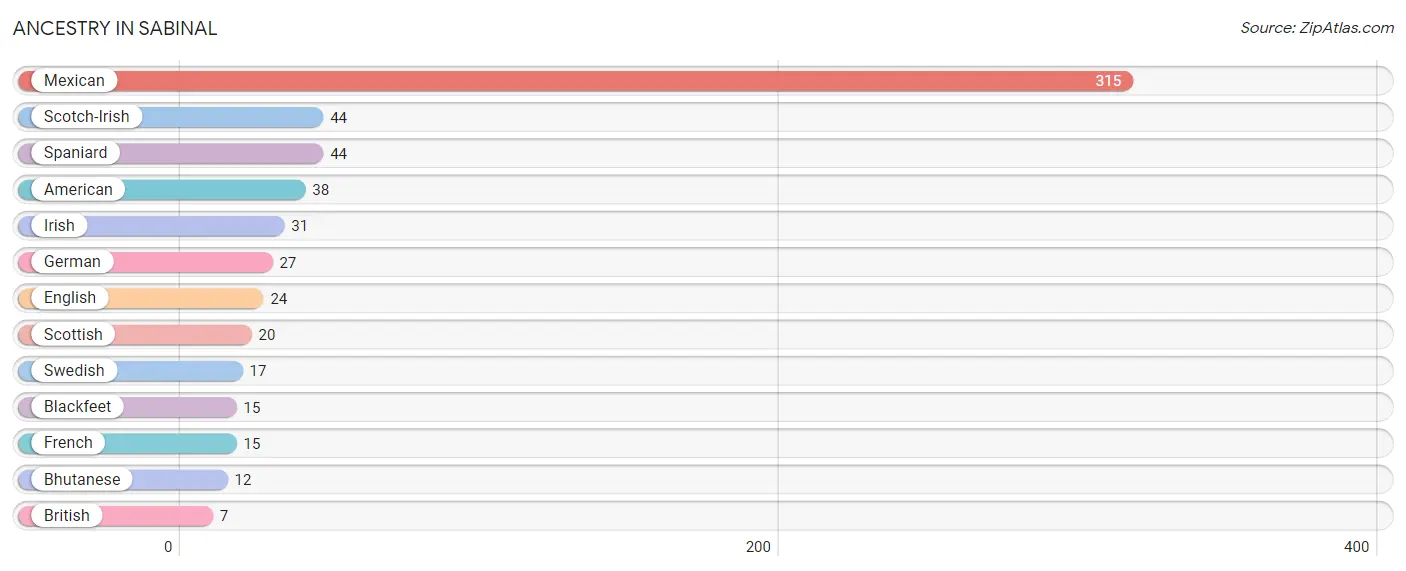
| Ancestry | # Population | % Population |
| American | 38 | 6.0% |
| Bhutanese | 12 | 1.9% |
| Blackfeet | 15 | 2.4% |
| British | 7 | 1.1% |
| English | 24 | 3.8% |
| French | 15 | 2.4% |
| German | 27 | 4.3% |
| Irish | 31 | 4.9% |
| Mexican | 315 | 49.6% |
| Scotch-Irish | 44 | 6.9% |
| Scottish | 20 | 3.2% |
| Spaniard | 44 | 6.9% |
| Swedish | 17 | 2.7% | View All 13 Rows |
Immigrants in Sabinal
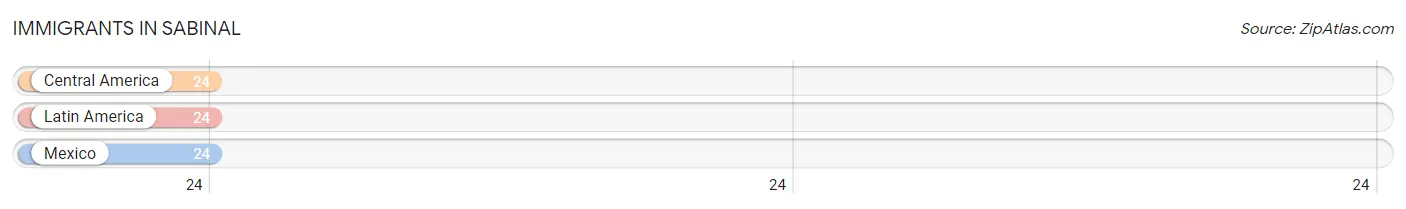
The most numerous immigrant groups reported in Sabinal came from Central America (24 | 3.8%), Latin America (24 | 3.8%), and Mexico (24 | 3.8%), together accounting for 11.3% of all Sabinal residents.
| Immigration Origin | # Population | % Population |
| Central America | 24 | 3.8% |
| Latin America | 24 | 3.8% |
| Mexico | 24 | 3.8% | View All 3 Rows |
Sex and Age in Sabinal
Sex and Age in Sabinal
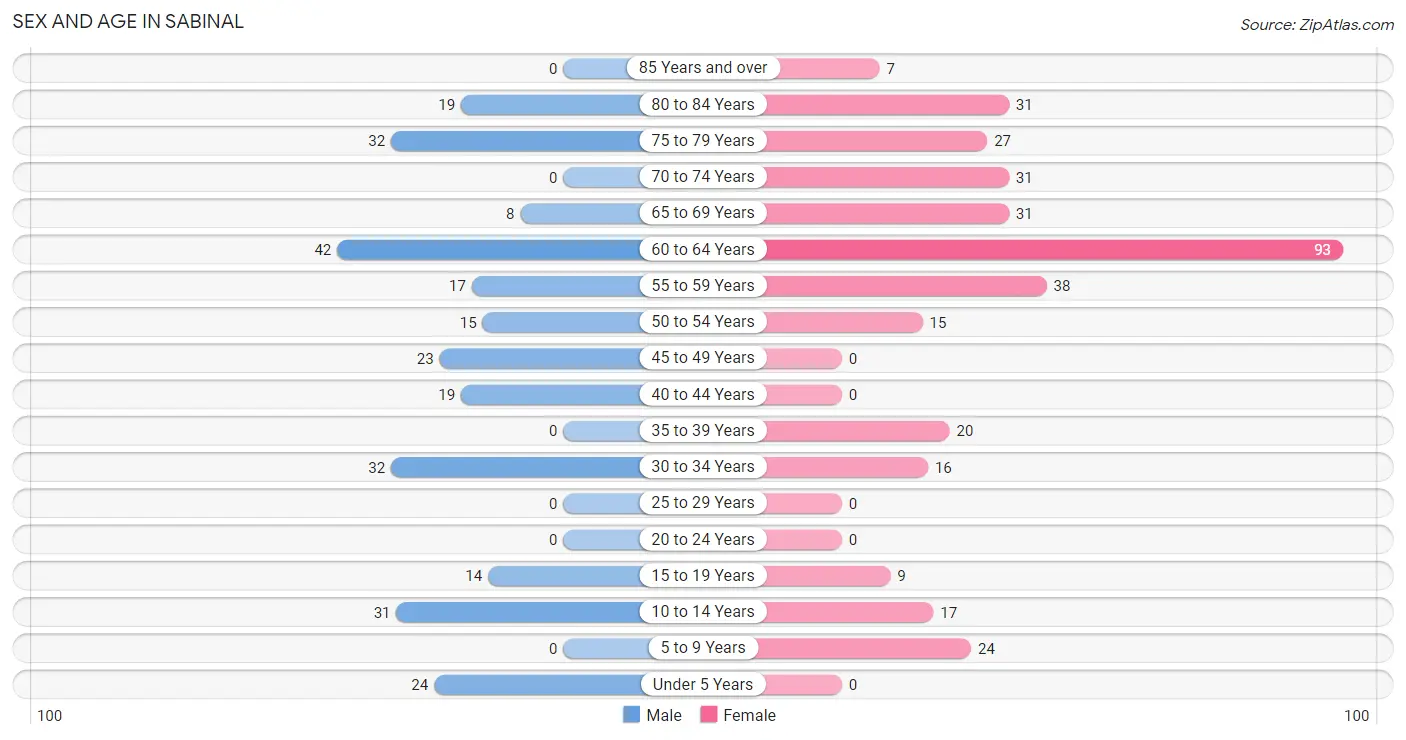
The most populous age groups in Sabinal are 60 to 64 Years (42 | 15.2%) for men and 60 to 64 Years (93 | 25.9%) for women.
| Age Bracket | Male | Female |
| Under 5 Years | 24 (8.7%) | 0 (0.0%) |
| 5 to 9 Years | 0 (0.0%) | 24 (6.7%) |
| 10 to 14 Years | 31 (11.2%) | 17 (4.7%) |
| 15 to 19 Years | 14 (5.1%) | 9 (2.5%) |
| 20 to 24 Years | 0 (0.0%) | 0 (0.0%) |
| 25 to 29 Years | 0 (0.0%) | 0 (0.0%) |
| 30 to 34 Years | 32 (11.6%) | 16 (4.5%) |
| 35 to 39 Years | 0 (0.0%) | 20 (5.6%) |
| 40 to 44 Years | 19 (6.9%) | 0 (0.0%) |
| 45 to 49 Years | 23 (8.3%) | 0 (0.0%) |
| 50 to 54 Years | 15 (5.4%) | 15 (4.2%) |
| 55 to 59 Years | 17 (6.2%) | 38 (10.6%) |
| 60 to 64 Years | 42 (15.2%) | 93 (25.9%) |
| 65 to 69 Years | 8 (2.9%) | 31 (8.6%) |
| 70 to 74 Years | 0 (0.0%) | 31 (8.6%) |
| 75 to 79 Years | 32 (11.6%) | 27 (7.5%) |
| 80 to 84 Years | 19 (6.9%) | 31 (8.6%) |
| 85 Years and over | 0 (0.0%) | 7 (1.9%) |
| Total | 276 (100.0%) | 359 (100.0%) |
Families and Households in Sabinal
Median Family Size in Sabinal
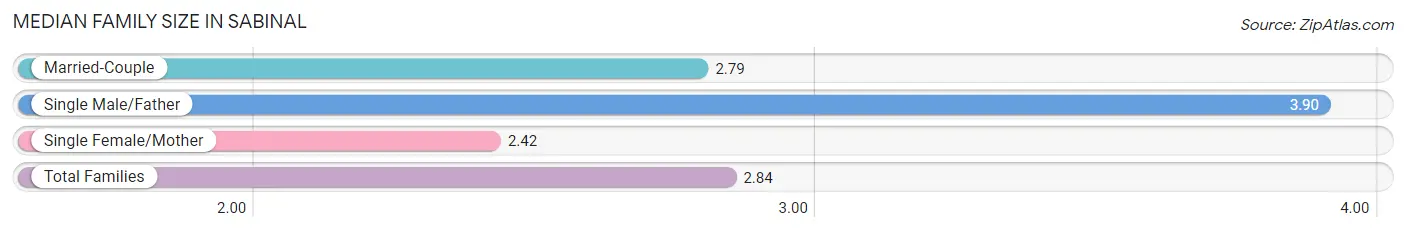
The median family size in Sabinal is 2.84 persons per family, with single male/father families (20 | 13.1%) accounting for the largest median family size of 3.9 persons per family. On the other hand, single female/mother families (38 | 24.8%) represent the smallest median family size with 2.42 persons per family.
| Family Type | # Families | Family Size |
| Married-Couple | 95 (62.1%) | 2.79 |
| Single Male/Father | 20 (13.1%) | 3.90 |
| Single Female/Mother | 38 (24.8%) | 2.42 |
| Total Families | 153 (100.0%) | 2.84 |
Median Household Size in Sabinal
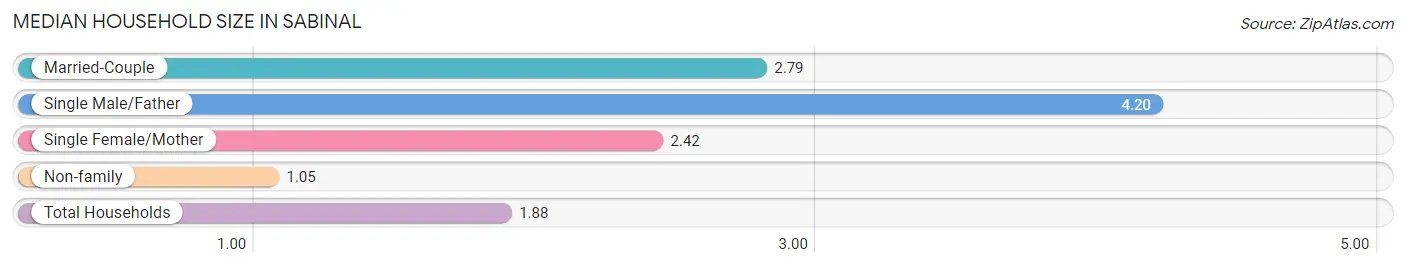
The median household size in Sabinal is 1.88 persons per household, with single male/father households (20 | 5.9%) accounting for the largest median household size of 4.2 persons per household. non-family households (184 | 54.6%) represent the smallest median household size with 1.05 persons per household.
| Household Type | # Households | Household Size |
| Married-Couple | 95 (28.2%) | 2.79 |
| Single Male/Father | 20 (5.9%) | 4.20 |
| Single Female/Mother | 38 (11.3%) | 2.42 |
| Non-family | 184 (54.6%) | 1.05 |
| Total Households | 337 (100.0%) | 1.88 |
Household Size by Marriage Status in Sabinal
Out of a total of 337 households in Sabinal, 153 (45.4%) are family households, while 184 (54.6%) are nonfamily households. The most numerous type of family households are 2-person households, comprising 133, and the most common type of nonfamily households are 1-person households, comprising 158.
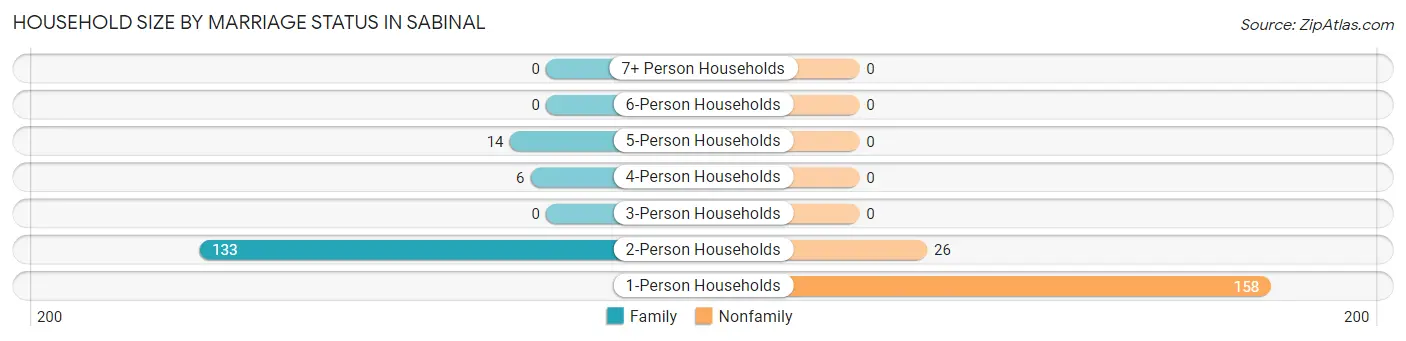
| Household Size | Family Households | Nonfamily Households |
| 1-Person Households | - | 158 (46.9%) |
| 2-Person Households | 133 (39.5%) | 26 (7.7%) |
| 3-Person Households | 0 (0.0%) | 0 (0.0%) |
| 4-Person Households | 6 (1.8%) | 0 (0.0%) |
| 5-Person Households | 14 (4.2%) | 0 (0.0%) |
| 6-Person Households | 0 (0.0%) | 0 (0.0%) |
| 7+ Person Households | 0 (0.0%) | 0 (0.0%) |
| Total | 153 (45.4%) | 184 (54.6%) |
Female Fertility in Sabinal
Fertility by Age in Sabinal
| Age Bracket | Women with Births | Births / 1,000 Women |
| 15 to 19 years | 0 (0.0%) | 0.0 |
| 20 to 34 years | 0 (0.0%) | 0.0 |
| 35 to 50 years | 0 (0.0%) | 0.0 |
| Total | 0 (0.0%) | 0.0 |
Fertility by Age by Marriage Status in Sabinal
| Age Bracket | Married | Unmarried |
| 15 to 19 years | 0 (0.0%) | 0 (0.0%) |
| 20 to 34 years | 0 (0.0%) | 0 (0.0%) |
| 35 to 50 years | 0 (0.0%) | 0 (0.0%) |
| Total | 0 (0.0%) | 0 (0.0%) |
Fertility by Education in Sabinal
| Educational Attainment | Women with Births | Births / 1,000 Women |
| Less than High School | 0 (0.0%) | 0.0 |
| High School Diploma | 0 (0.0%) | 0.0 |
| College or Associate's Degree | 0 (0.0%) | 0.0 |
| Bachelor's Degree | 0 (0.0%) | 0.0 |
| Graduate Degree | 0 (0.0%) | 0.0 |
| Total | 0 (0.0%) | 0.0 |
Fertility by Education by Marriage Status in Sabinal
| Educational Attainment | Married | Unmarried |
| Less than High School | 0 (0.0%) | 0 (0.0%) |
| High School Diploma | 0 (0.0%) | 0 (0.0%) |
| College or Associate's Degree | 0 (0.0%) | 0 (0.0%) |
| Bachelor's Degree | 0 (0.0%) | 0 (0.0%) |
| Graduate Degree | 0 (0.0%) | 0 (0.0%) |
| Total | 0 (0.0%) | 0 (0.0%) |
Employment Characteristics in Sabinal
Employment by Class of Employer in Sabinal
Among the 173 employed individuals in Sabinal, private company employees (97 | 56.1%), self-employed (not incorporated) (30 | 17.3%), and local government employees (23 | 13.3%) make up the most common classes of employment.
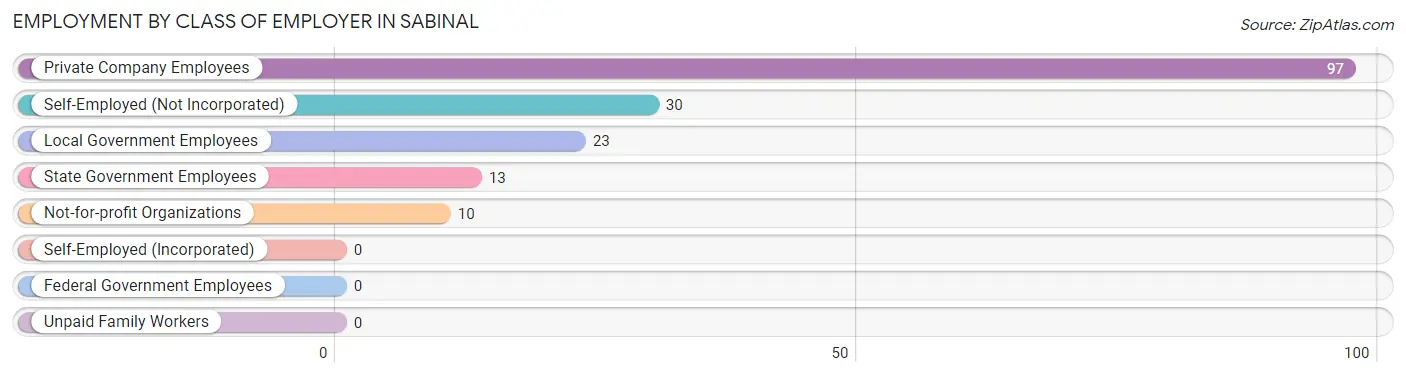
| Employer Class | # Employees | % Employees |
| Private Company Employees | 97 | 56.1% |
| Self-Employed (Incorporated) | 0 | 0.0% |
| Self-Employed (Not Incorporated) | 30 | 17.3% |
| Not-for-profit Organizations | 10 | 5.8% |
| Local Government Employees | 23 | 13.3% |
| State Government Employees | 13 | 7.5% |
| Federal Government Employees | 0 | 0.0% |
| Unpaid Family Workers | 0 | 0.0% |
| Total | 173 | 100.0% |
Employment Status by Age in Sabinal
According to the labor force statistics for Sabinal, out of the total population over 16 years of age (539), 52.7% or 284 individuals are in the labor force, with 7.0% or 20 of them unemployed. The age group with the highest labor force participation rate is 35 to 44 years, with 100.0% or 39 individuals in the labor force. Within the labor force, the 35 to 44 years age range has the highest percentage of unemployed individuals, with 51.3% or 20 of them being unemployed.
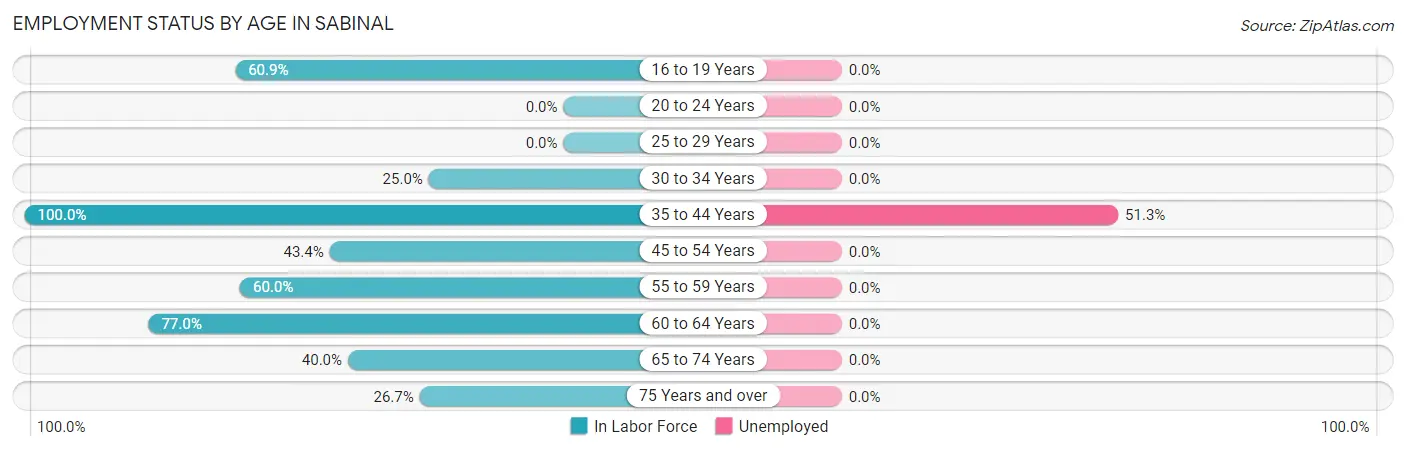
| Age Bracket | In Labor Force | Unemployed |
| 16 to 19 Years | 14 (60.9%) | 0 (0.0%) |
| 20 to 24 Years | 0 (0.0%) | 0 (0.0%) |
| 25 to 29 Years | 0 (0.0%) | 0 (0.0%) |
| 30 to 34 Years | 12 (25.0%) | 0 (0.0%) |
| 35 to 44 Years | 39 (100.0%) | 20 (51.3%) |
| 45 to 54 Years | 23 (43.4%) | 0 (0.0%) |
| 55 to 59 Years | 33 (60.0%) | 0 (0.0%) |
| 60 to 64 Years | 104 (77.0%) | 0 (0.0%) |
| 65 to 74 Years | 28 (40.0%) | 0 (0.0%) |
| 75 Years and over | 31 (26.7%) | 0 (0.0%) |
| Total | 284 (52.7%) | 20 (7.0%) |
Employment Status by Educational Attainment in Sabinal
According to labor force statistics for Sabinal, 63.9% of individuals (211) out of the total population between 25 and 64 years of age (330) are in the labor force, with 9.5% or 20 of them being unemployed. The group with the highest labor force participation rate are those with the educational attainment of less than high school, with 100.0% or 28 individuals in the labor force. Within the labor force, individuals with college / associate degree education have the highest percentage of unemployment, with 40.8% or 20 of them being unemployed.
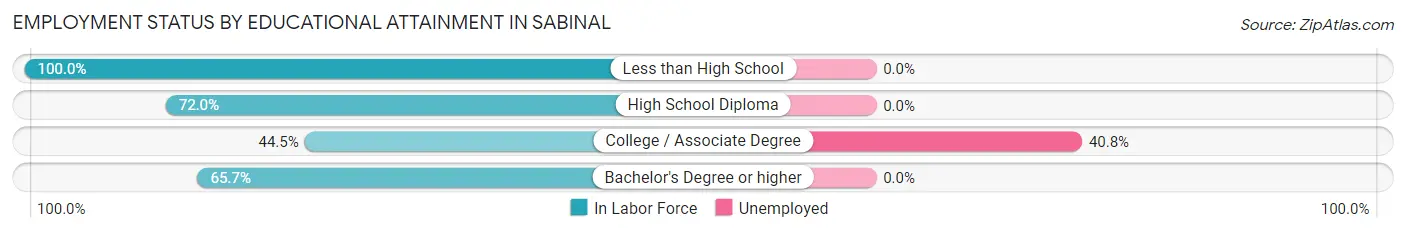
| Educational Attainment | In Labor Force | Unemployed |
| Less than High School | 28 (100.0%) | 0 (0.0%) |
| High School Diploma | 90 (72.0%) | 0 (0.0%) |
| College / Associate Degree | 49 (44.5%) | 45 (40.8%) |
| Bachelor's Degree or higher | 44 (65.7%) | 0 (0.0%) |
| Total | 211 (63.9%) | 31 (9.5%) |
Employment Occupations by Sex in Sabinal
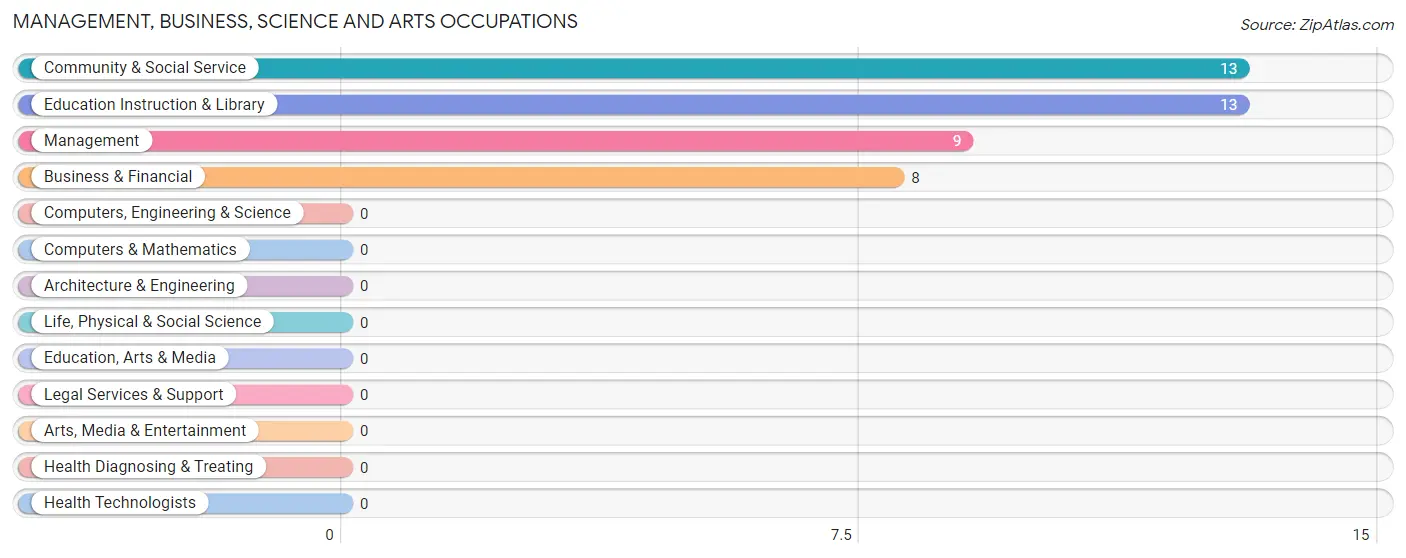
Management, Business, Science and Arts Occupations
The most common Management, Business, Science and Arts occupations in Sabinal are Community & Social Service (13 | 4.9%), Education Instruction & Library (13 | 4.9%), Management (9 | 3.4%), and Business & Financial (8 | 3.0%).
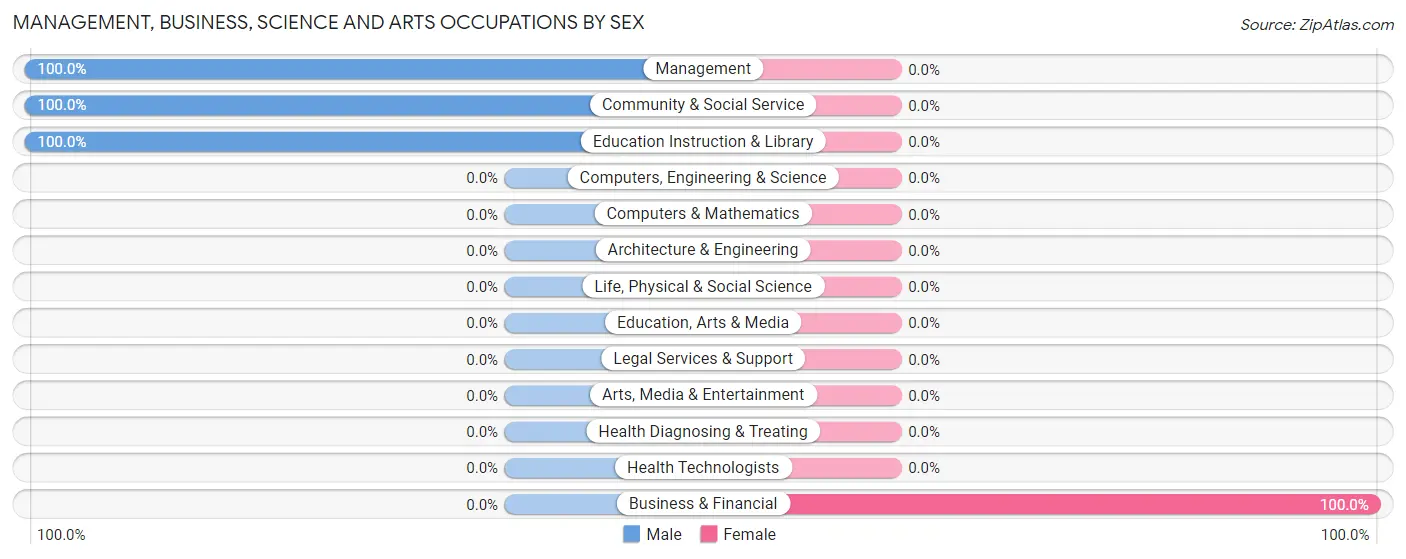
Management, Business, Science and Arts Occupations by Sex
| Occupation | Male | Female |
| Management | 9 (100.0%) | 0 (0.0%) |
| Business & Financial | 0 (0.0%) | 8 (100.0%) |
| Computers, Engineering & Science | 0 (0.0%) | 0 (0.0%) |
| Computers & Mathematics | 0 (0.0%) | 0 (0.0%) |
| Architecture & Engineering | 0 (0.0%) | 0 (0.0%) |
| Life, Physical & Social Science | 0 (0.0%) | 0 (0.0%) |
| Community & Social Service | 13 (100.0%) | 0 (0.0%) |
| Education, Arts & Media | 0 (0.0%) | 0 (0.0%) |
| Legal Services & Support | 0 (0.0%) | 0 (0.0%) |
| Education Instruction & Library | 13 (100.0%) | 0 (0.0%) |
| Arts, Media & Entertainment | 0 (0.0%) | 0 (0.0%) |
| Health Diagnosing & Treating | 0 (0.0%) | 0 (0.0%) |
| Health Technologists | 0 (0.0%) | 0 (0.0%) |
| Total (Category) | 22 (73.3%) | 8 (26.7%) |
| Total (Overall) | 120 (45.5%) | 144 (54.5%) |
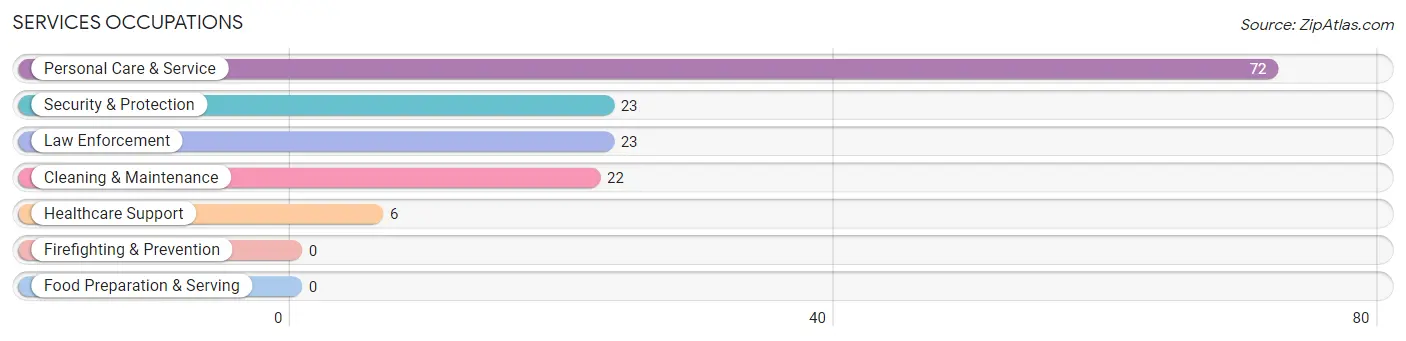
Services Occupations
The most common Services occupations in Sabinal are Personal Care & Service (72 | 27.3%), Security & Protection (23 | 8.7%), Law Enforcement (23 | 8.7%), Cleaning & Maintenance (22 | 8.3%), and Healthcare Support (6 | 2.3%).
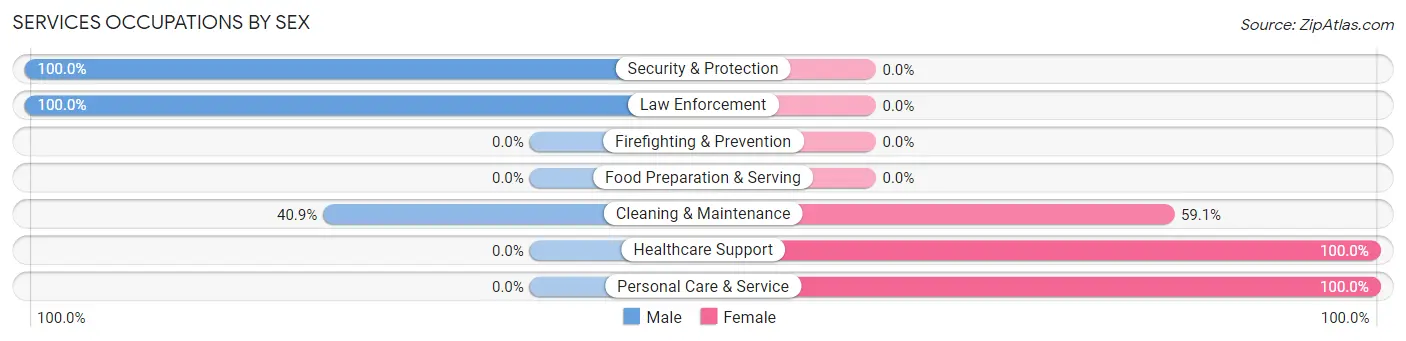
Services Occupations by Sex
Within the Services occupations in Sabinal, the most male-oriented occupations are Security & Protection (100.0%), Law Enforcement (100.0%), and Cleaning & Maintenance (40.9%), while the most female-oriented occupations are Healthcare Support (100.0%), Personal Care & Service (100.0%), and Cleaning & Maintenance (59.1%).
| Occupation | Male | Female |
| Healthcare Support | 0 (0.0%) | 6 (100.0%) |
| Security & Protection | 23 (100.0%) | 0 (0.0%) |
| Firefighting & Prevention | 0 (0.0%) | 0 (0.0%) |
| Law Enforcement | 23 (100.0%) | 0 (0.0%) |
| Food Preparation & Serving | 0 (0.0%) | 0 (0.0%) |
| Cleaning & Maintenance | 9 (40.9%) | 13 (59.1%) |
| Personal Care & Service | 0 (0.0%) | 72 (100.0%) |
| Total (Category) | 32 (26.0%) | 91 (74.0%) |
| Total (Overall) | 120 (45.5%) | 144 (54.5%) |
Sales and Office Occupations
The most common Sales and Office occupations in Sabinal are Sales & Related (28 | 10.6%), and Office & Administration (17 | 6.4%).
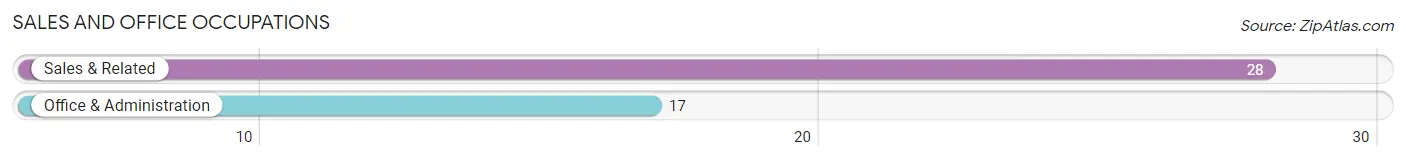
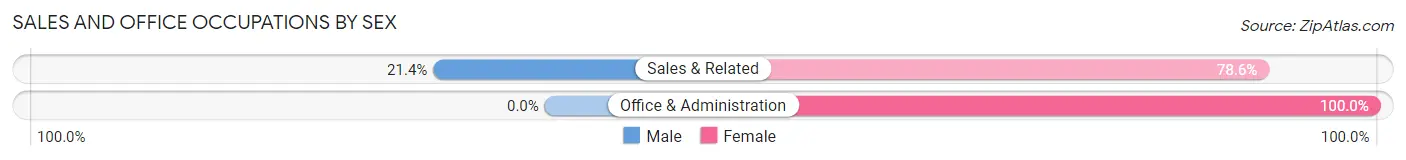
Sales and Office Occupations by Sex
| Occupation | Male | Female |
| Sales & Related | 6 (21.4%) | 22 (78.6%) |
| Office & Administration | 0 (0.0%) | 17 (100.0%) |
| Total (Category) | 6 (13.3%) | 39 (86.7%) |
| Total (Overall) | 120 (45.5%) | 144 (54.5%) |
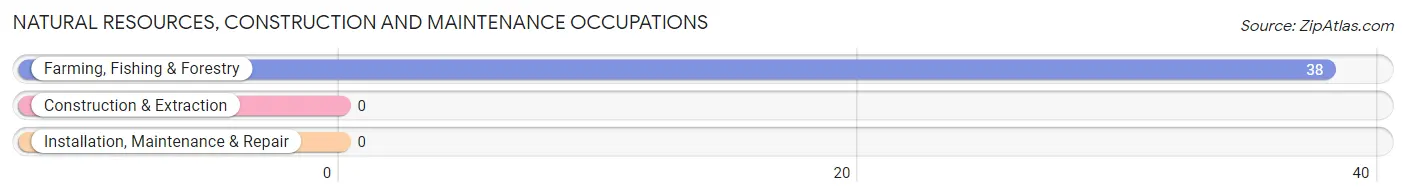
Natural Resources, Construction and Maintenance Occupations
The most common Natural Resources, Construction and Maintenance occupations in Sabinal are , and Farming, Fishing & Forestry (38 | 14.4%).
Natural Resources, Construction and Maintenance Occupations by Sex
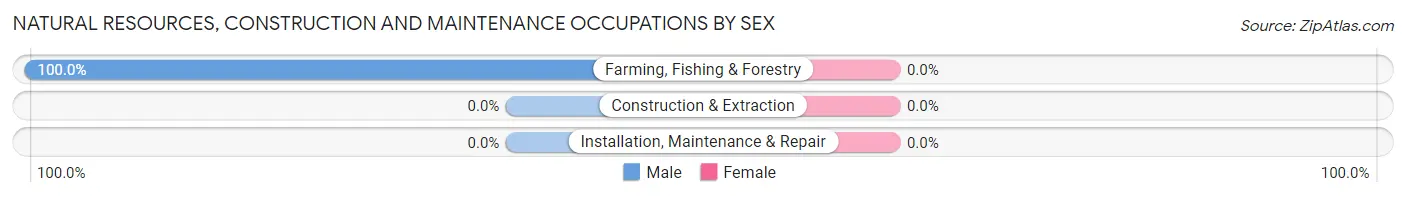
| Occupation | Male | Female |
| Farming, Fishing & Forestry | 38 (100.0%) | 0 (0.0%) |
| Construction & Extraction | 0 (0.0%) | 0 (0.0%) |
| Installation, Maintenance & Repair | 0 (0.0%) | 0 (0.0%) |
| Total (Category) | 38 (100.0%) | 0 (0.0%) |
| Total (Overall) | 120 (45.5%) | 144 (54.5%) |
Production, Transportation and Moving Occupations
The most common Production, Transportation and Moving occupations in Sabinal are Production (20 | 7.6%), and Transportation (8 | 3.0%).
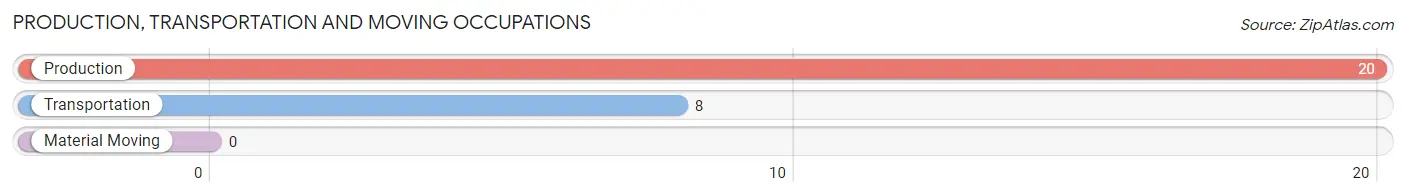
Production, Transportation and Moving Occupations by Sex
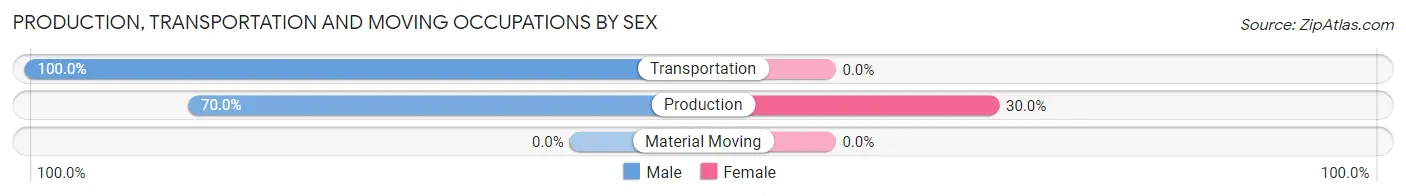
| Occupation | Male | Female |
| Production | 14 (70.0%) | 6 (30.0%) |
| Transportation | 8 (100.0%) | 0 (0.0%) |
| Material Moving | 0 (0.0%) | 0 (0.0%) |
| Total (Category) | 22 (78.6%) | 6 (21.4%) |
| Total (Overall) | 120 (45.5%) | 144 (54.5%) |
Employment Industries by Sex in Sabinal
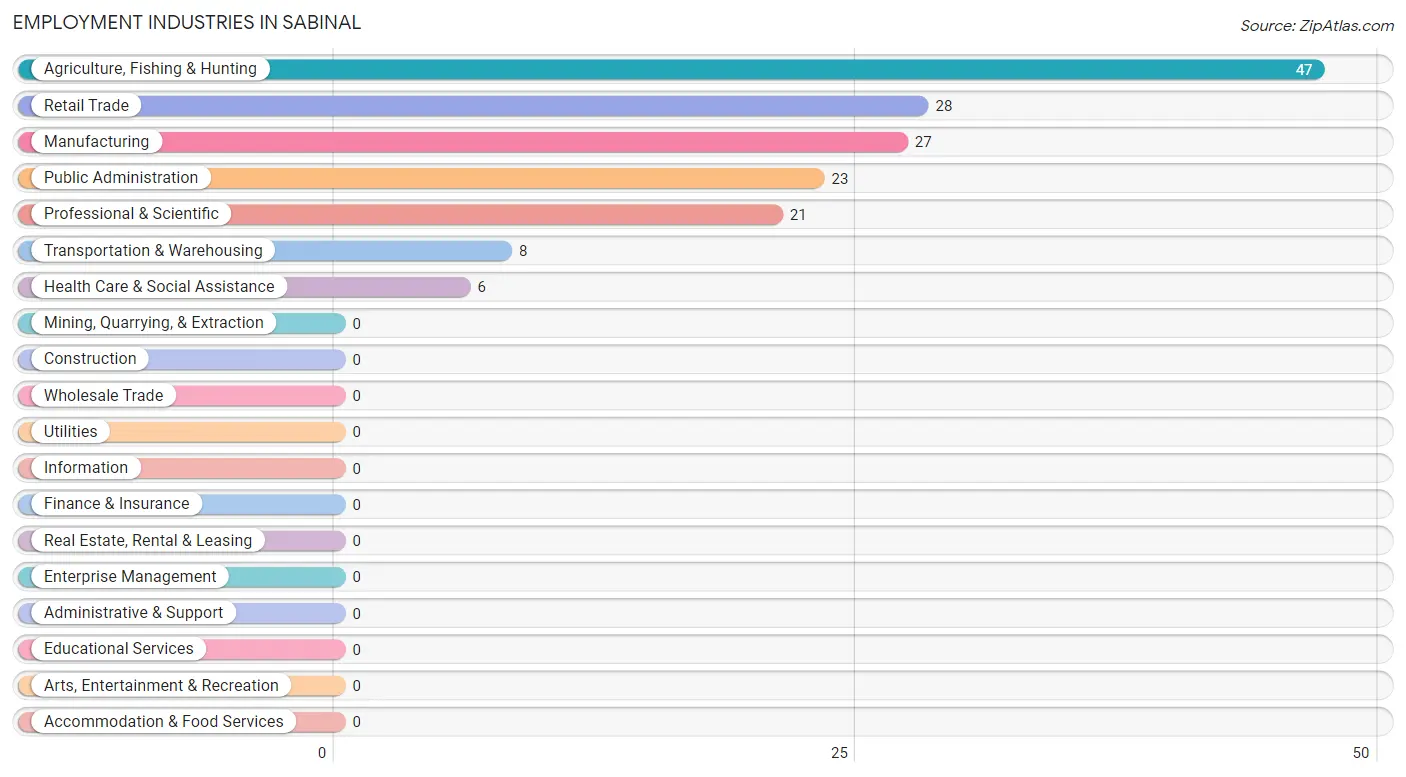
Employment Industries in Sabinal
The major employment industries in Sabinal include Agriculture, Fishing & Hunting (47 | 17.8%), Retail Trade (28 | 10.6%), Manufacturing (27 | 10.2%), Public Administration (23 | 8.7%), and Professional & Scientific (21 | 8.0%).
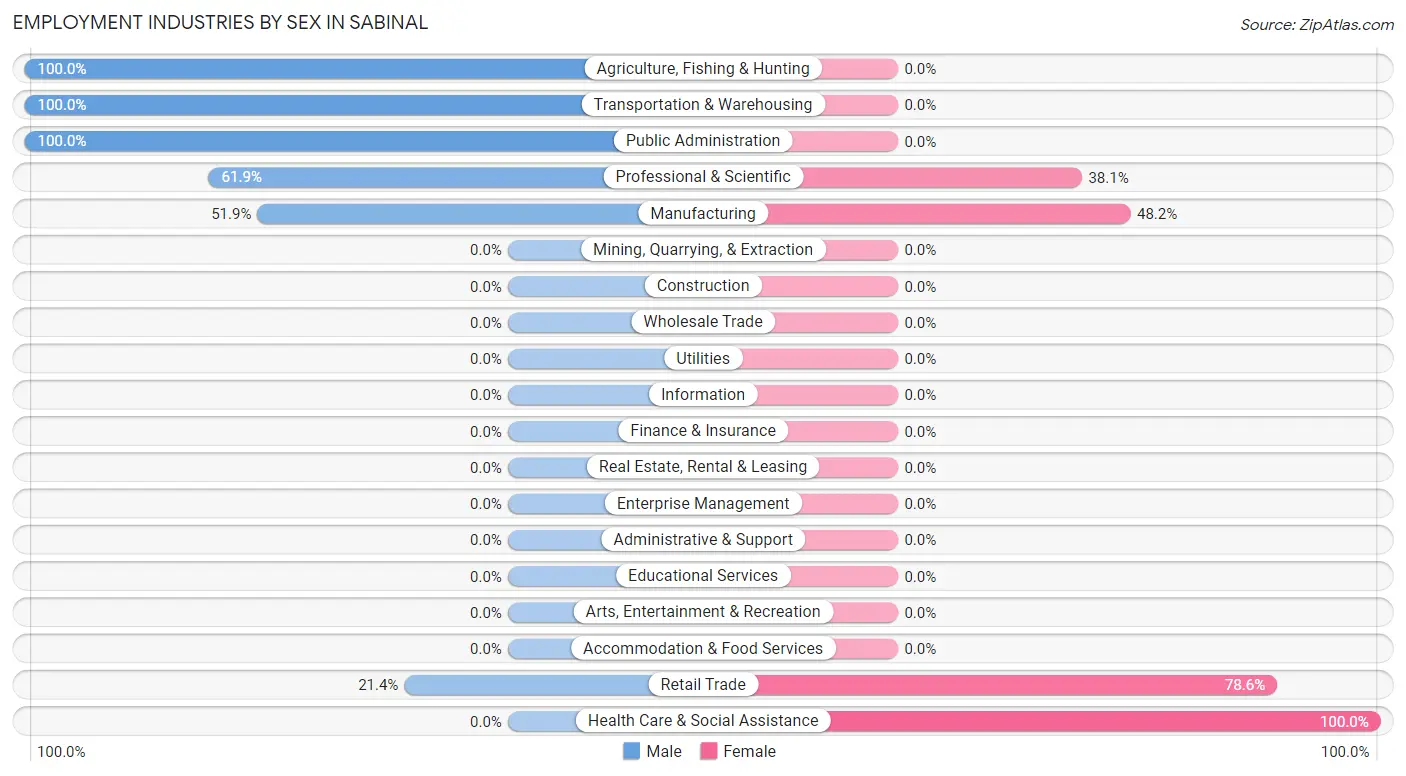
Employment Industries by Sex in Sabinal
The Sabinal industries that see more men than women are Agriculture, Fishing & Hunting (100.0%), Transportation & Warehousing (100.0%), and Public Administration (100.0%), whereas the industries that tend to have a higher number of women are Health Care & Social Assistance (100.0%), Retail Trade (78.6%), and Manufacturing (48.1%).
| Industry | Male | Female |
| Agriculture, Fishing & Hunting | 47 (100.0%) | 0 (0.0%) |
| Mining, Quarrying, & Extraction | 0 (0.0%) | 0 (0.0%) |
| Construction | 0 (0.0%) | 0 (0.0%) |
| Manufacturing | 14 (51.8%) | 13 (48.1%) |
| Wholesale Trade | 0 (0.0%) | 0 (0.0%) |
| Retail Trade | 6 (21.4%) | 22 (78.6%) |
| Transportation & Warehousing | 8 (100.0%) | 0 (0.0%) |
| Utilities | 0 (0.0%) | 0 (0.0%) |
| Information | 0 (0.0%) | 0 (0.0%) |
| Finance & Insurance | 0 (0.0%) | 0 (0.0%) |
| Real Estate, Rental & Leasing | 0 (0.0%) | 0 (0.0%) |
| Professional & Scientific | 13 (61.9%) | 8 (38.1%) |
| Enterprise Management | 0 (0.0%) | 0 (0.0%) |
| Administrative & Support | 0 (0.0%) | 0 (0.0%) |
| Educational Services | 0 (0.0%) | 0 (0.0%) |
| Health Care & Social Assistance | 0 (0.0%) | 6 (100.0%) |
| Arts, Entertainment & Recreation | 0 (0.0%) | 0 (0.0%) |
| Accommodation & Food Services | 0 (0.0%) | 0 (0.0%) |
| Public Administration | 23 (100.0%) | 0 (0.0%) |
| Total | 120 (45.5%) | 144 (54.5%) |
Education in Sabinal
School Enrollment in Sabinal
The most common levels of schooling among the 81 students in Sabinal are middle school (48 | 59.3%), elementary school (15 | 18.5%), and nursery / preschool (9 | 11.1%).
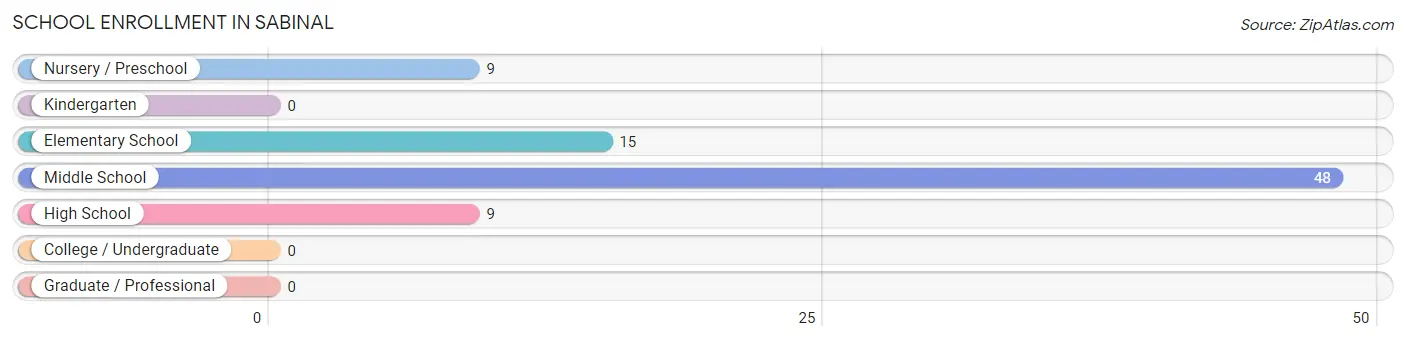
| School Level | # Students | % Students |
| Nursery / Preschool | 9 | 11.1% |
| Kindergarten | 0 | 0.0% |
| Elementary School | 15 | 18.5% |
| Middle School | 48 | 59.3% |
| High School | 9 | 11.1% |
| College / Undergraduate | 0 | 0.0% |
| Graduate / Professional | 0 | 0.0% |
| Total | 81 | 100.0% |
School Enrollment by Age by Funding Source in Sabinal
Out of a total of 81 students who are enrolled in schools in Sabinal, 38 (46.9%) attend a private institution, while the remaining 43 (53.1%) are enrolled in public schools. The age group of 5 to 9 year old has the highest likelihood of being enrolled in private schools, with 15 (62.5% in the age bracket) enrolled. Conversely, the age group of 15 to 17 year olds has the lowest likelihood of being enrolled in a private school, with 9 (100.0% in the age bracket) attending a public institution.
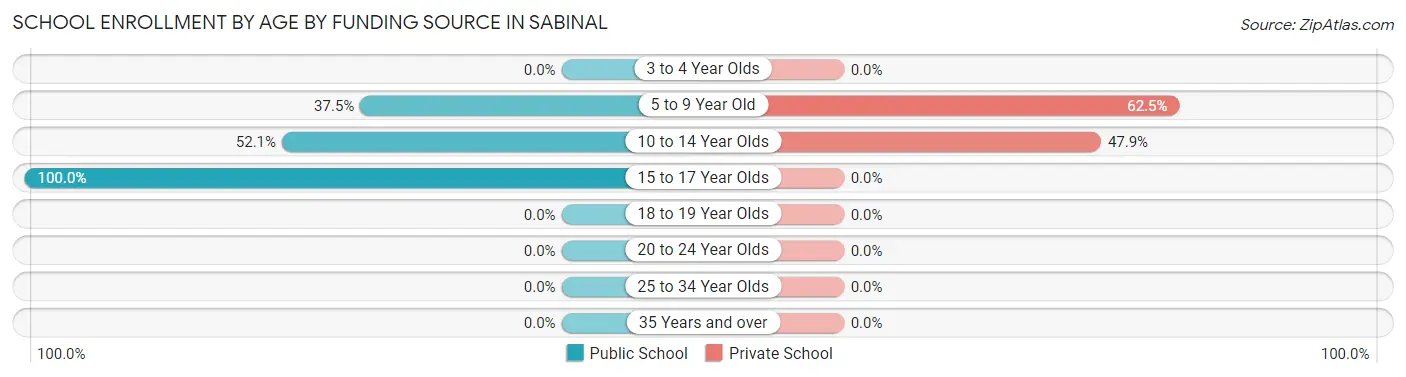
| Age Bracket | Public School | Private School |
| 3 to 4 Year Olds | 0 (0.0%) | 0 (0.0%) |
| 5 to 9 Year Old | 9 (37.5%) | 15 (62.5%) |
| 10 to 14 Year Olds | 25 (52.1%) | 23 (47.9%) |
| 15 to 17 Year Olds | 9 (100.0%) | 0 (0.0%) |
| 18 to 19 Year Olds | 0 (0.0%) | 0 (0.0%) |
| 20 to 24 Year Olds | 0 (0.0%) | 0 (0.0%) |
| 25 to 34 Year Olds | 0 (0.0%) | 0 (0.0%) |
| 35 Years and over | 0 (0.0%) | 0 (0.0%) |
| Total | 43 (53.1%) | 38 (46.9%) |
Educational Attainment by Field of Study in Sabinal
Arts & humanities (33 | 37.1%), physical & health sciences (23 | 25.8%), education (15 | 16.9%), engineering (10 | 11.2%), and business (8 | 9.0%) are the most common fields of study among 89 individuals in Sabinal who have obtained a bachelor's degree or higher.
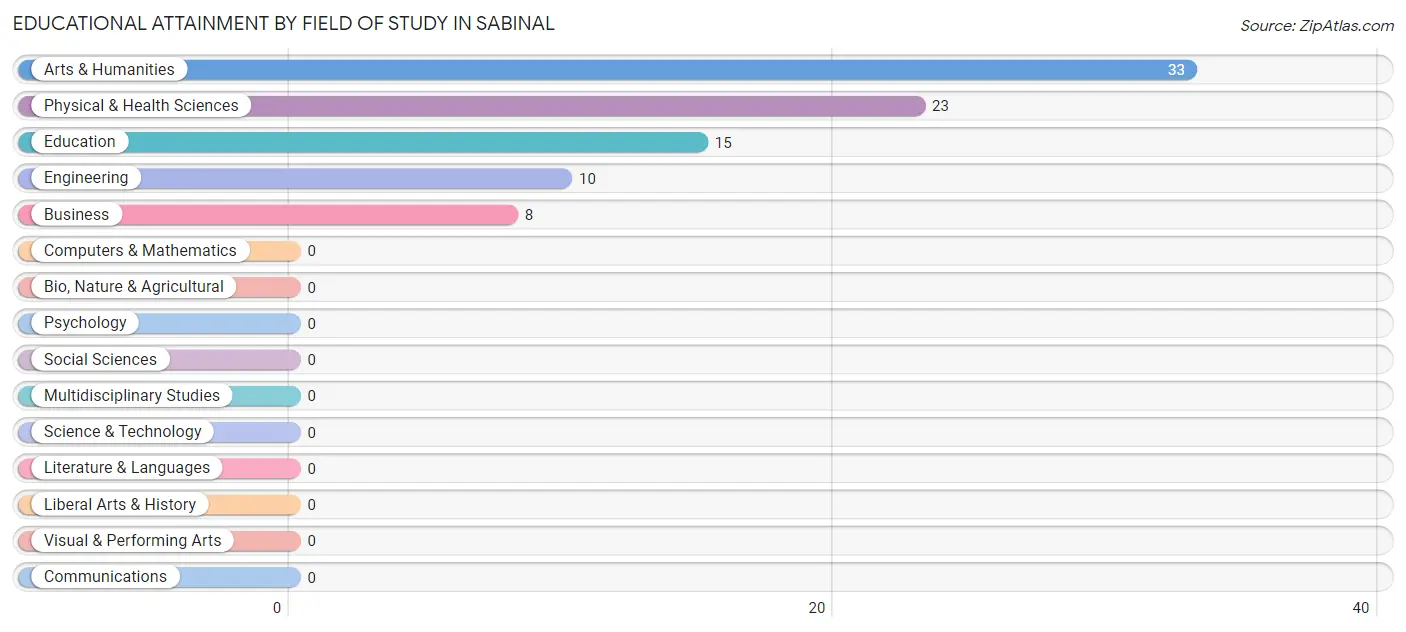
| Field of Study | # Graduates | % Graduates |
| Computers & Mathematics | 0 | 0.0% |
| Bio, Nature & Agricultural | 0 | 0.0% |
| Physical & Health Sciences | 23 | 25.8% |
| Psychology | 0 | 0.0% |
| Social Sciences | 0 | 0.0% |
| Engineering | 10 | 11.2% |
| Multidisciplinary Studies | 0 | 0.0% |
| Science & Technology | 0 | 0.0% |
| Business | 8 | 9.0% |
| Education | 15 | 16.9% |
| Literature & Languages | 0 | 0.0% |
| Liberal Arts & History | 0 | 0.0% |
| Visual & Performing Arts | 0 | 0.0% |
| Communications | 0 | 0.0% |
| Arts & Humanities | 33 | 37.1% |
| Total | 89 | 100.0% |
Transportation & Commute in Sabinal
Vehicle Availability by Sex in Sabinal
The most prevalent vehicle ownership categories in Sabinal are males with 1 vehicle (40, accounting for 39.6%) and females with 1 vehicle (38, making up 55.6%).
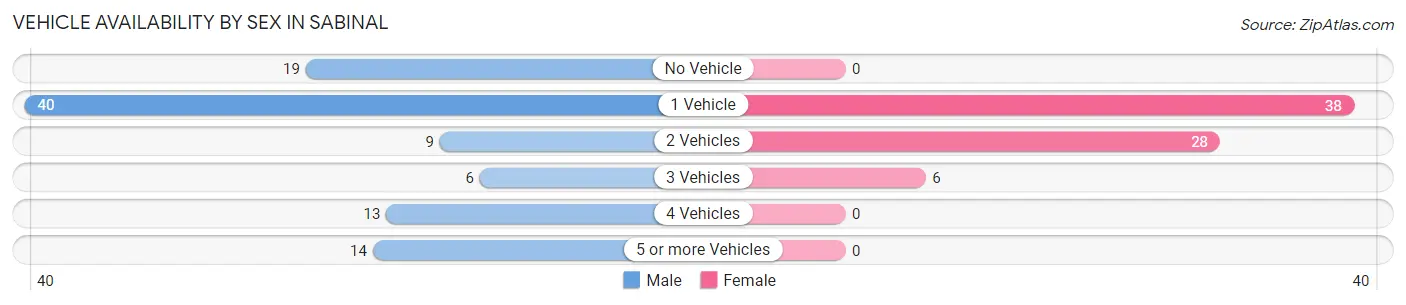
| Vehicles Available | Male | Female |
| No Vehicle | 19 (18.8%) | 0 (0.0%) |
| 1 Vehicle | 40 (39.6%) | 38 (52.8%) |
| 2 Vehicles | 9 (8.9%) | 28 (38.9%) |
| 3 Vehicles | 6 (5.9%) | 6 (8.3%) |
| 4 Vehicles | 13 (12.9%) | 0 (0.0%) |
| 5 or more Vehicles | 14 (13.9%) | 0 (0.0%) |
| Total | 101 (100.0%) | 72 (100.0%) |
Commute Time in Sabinal
The most frequently occuring commute durations in Sabinal are 30 to 34 minutes (61 commuters, 37.0%), 15 to 19 minutes (36 commuters, 21.8%), and 5 to 9 minutes (30 commuters, 18.2%).
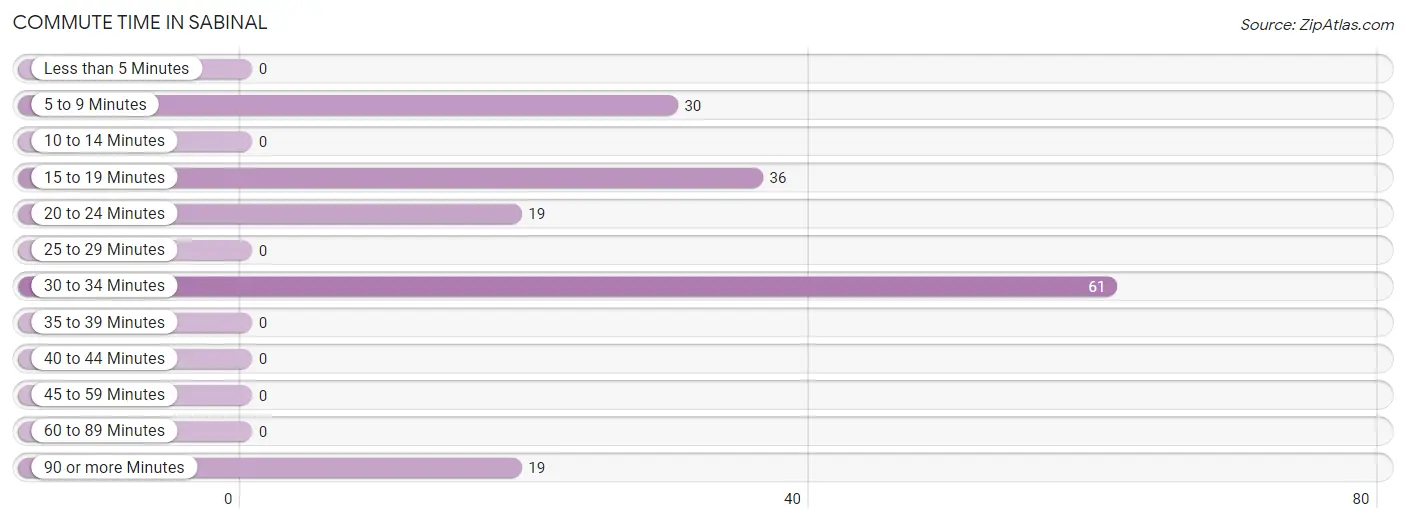
| Commute Time | # Commuters | % Commuters |
| Less than 5 Minutes | 0 | 0.0% |
| 5 to 9 Minutes | 30 | 18.2% |
| 10 to 14 Minutes | 0 | 0.0% |
| 15 to 19 Minutes | 36 | 21.8% |
| 20 to 24 Minutes | 19 | 11.5% |
| 25 to 29 Minutes | 0 | 0.0% |
| 30 to 34 Minutes | 61 | 37.0% |
| 35 to 39 Minutes | 0 | 0.0% |
| 40 to 44 Minutes | 0 | 0.0% |
| 45 to 59 Minutes | 0 | 0.0% |
| 60 to 89 Minutes | 0 | 0.0% |
| 90 or more Minutes | 19 | 11.5% |
Commute Time by Sex in Sabinal
The most common commute times in Sabinal are 30 to 34 minutes (51 commuters, 50.5%) for males and 5 to 9 minutes (22 commuters, 34.4%) for females.
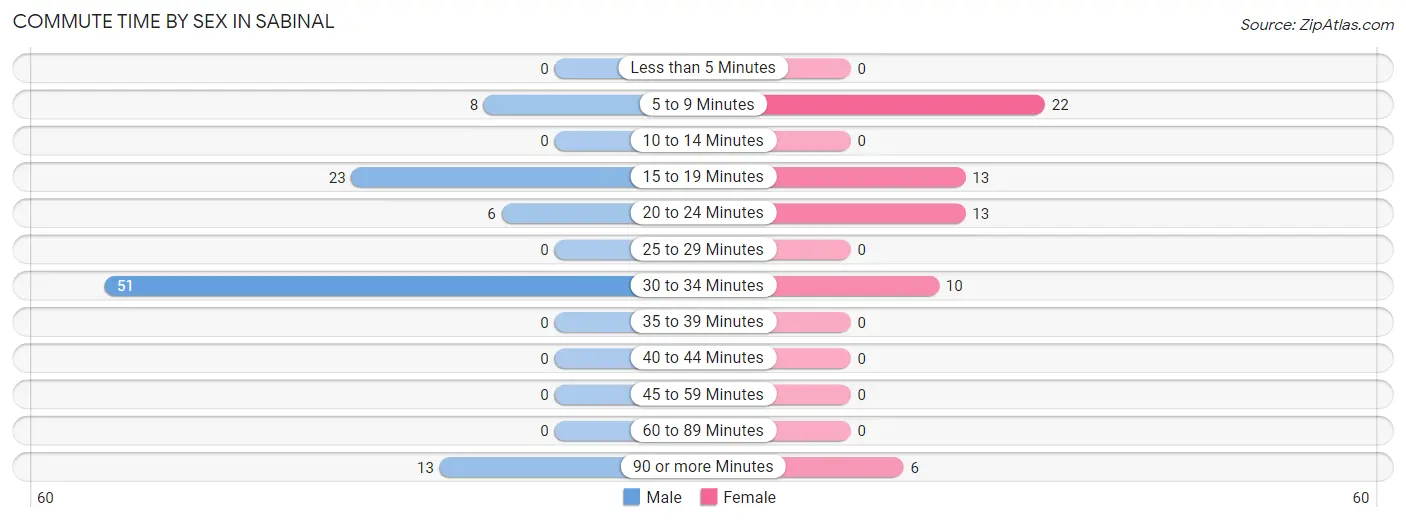
| Commute Time | Male | Female |
| Less than 5 Minutes | 0 (0.0%) | 0 (0.0%) |
| 5 to 9 Minutes | 8 (7.9%) | 22 (34.4%) |
| 10 to 14 Minutes | 0 (0.0%) | 0 (0.0%) |
| 15 to 19 Minutes | 23 (22.8%) | 13 (20.3%) |
| 20 to 24 Minutes | 6 (5.9%) | 13 (20.3%) |
| 25 to 29 Minutes | 0 (0.0%) | 0 (0.0%) |
| 30 to 34 Minutes | 51 (50.5%) | 10 (15.6%) |
| 35 to 39 Minutes | 0 (0.0%) | 0 (0.0%) |
| 40 to 44 Minutes | 0 (0.0%) | 0 (0.0%) |
| 45 to 59 Minutes | 0 (0.0%) | 0 (0.0%) |
| 60 to 89 Minutes | 0 (0.0%) | 0 (0.0%) |
| 90 or more Minutes | 13 (12.9%) | 6 (9.4%) |
Time of Departure to Work by Sex in Sabinal
The most frequent times of departure to work in Sabinal are 6:00 AM to 6:29 AM (45, 44.6%) for males and 12:00 AM to 4:59 AM (22, 34.4%) for females.
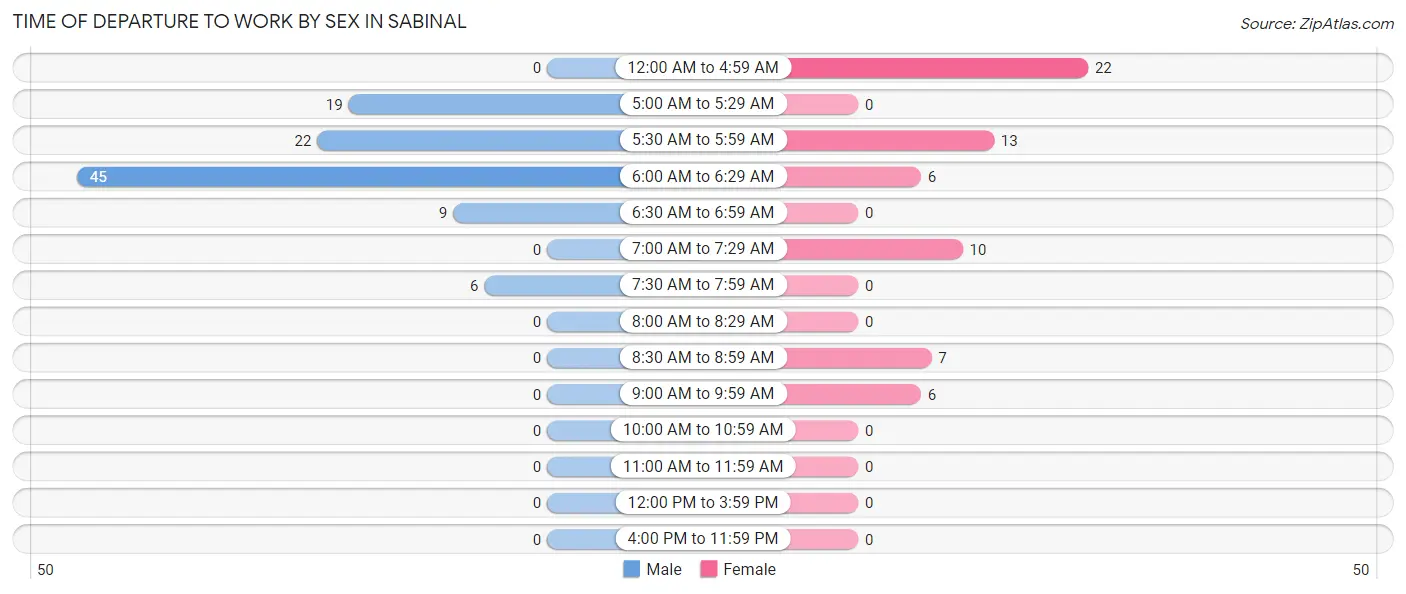
| Time of Departure | Male | Female |
| 12:00 AM to 4:59 AM | 0 (0.0%) | 22 (34.4%) |
| 5:00 AM to 5:29 AM | 19 (18.8%) | 0 (0.0%) |
| 5:30 AM to 5:59 AM | 22 (21.8%) | 13 (20.3%) |
| 6:00 AM to 6:29 AM | 45 (44.6%) | 6 (9.4%) |
| 6:30 AM to 6:59 AM | 9 (8.9%) | 0 (0.0%) |
| 7:00 AM to 7:29 AM | 0 (0.0%) | 10 (15.6%) |
| 7:30 AM to 7:59 AM | 6 (5.9%) | 0 (0.0%) |
| 8:00 AM to 8:29 AM | 0 (0.0%) | 0 (0.0%) |
| 8:30 AM to 8:59 AM | 0 (0.0%) | 7 (10.9%) |
| 9:00 AM to 9:59 AM | 0 (0.0%) | 6 (9.4%) |
| 10:00 AM to 10:59 AM | 0 (0.0%) | 0 (0.0%) |
| 11:00 AM to 11:59 AM | 0 (0.0%) | 0 (0.0%) |
| 12:00 PM to 3:59 PM | 0 (0.0%) | 0 (0.0%) |
| 4:00 PM to 11:59 PM | 0 (0.0%) | 0 (0.0%) |
| Total | 101 (100.0%) | 64 (100.0%) |
Housing Occupancy in Sabinal
Occupancy by Ownership in Sabinal
Of the total 337 dwellings in Sabinal, owner-occupied units account for 249 (73.9%), while renter-occupied units make up 88 (26.1%).
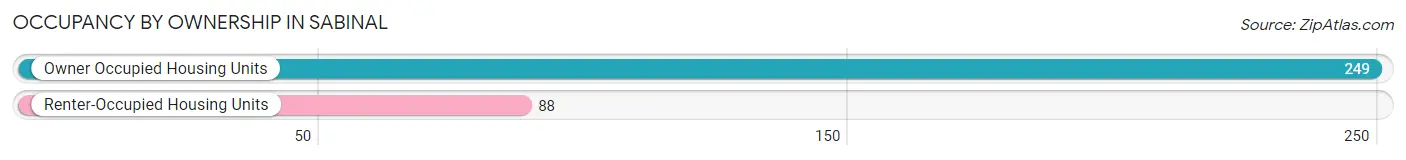
| Occupancy | # Housing Units | % Housing Units |
| Owner Occupied Housing Units | 249 | 73.9% |
| Renter-Occupied Housing Units | 88 | 26.1% |
| Total Occupied Housing Units | 337 | 100.0% |
Occupancy by Household Size in Sabinal
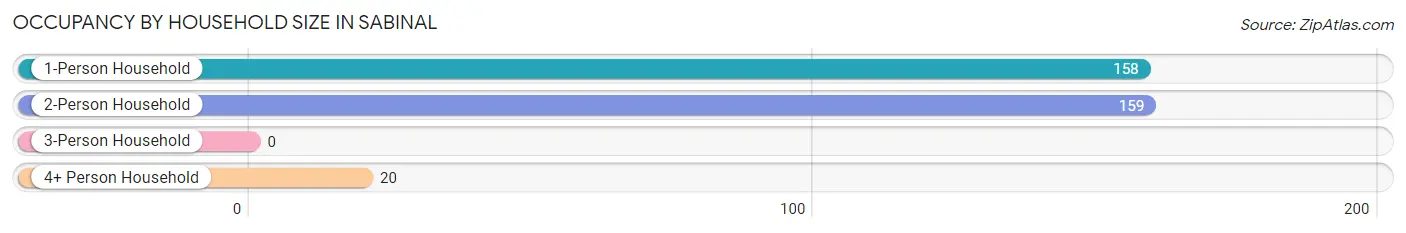
| Household Size | # Housing Units | % Housing Units |
| 1-Person Household | 158 | 46.9% |
| 2-Person Household | 159 | 47.2% |
| 3-Person Household | 0 | 0.0% |
| 4+ Person Household | 20 | 5.9% |
| Total Housing Units | 337 | 100.0% |
Occupancy by Ownership by Household Size in Sabinal
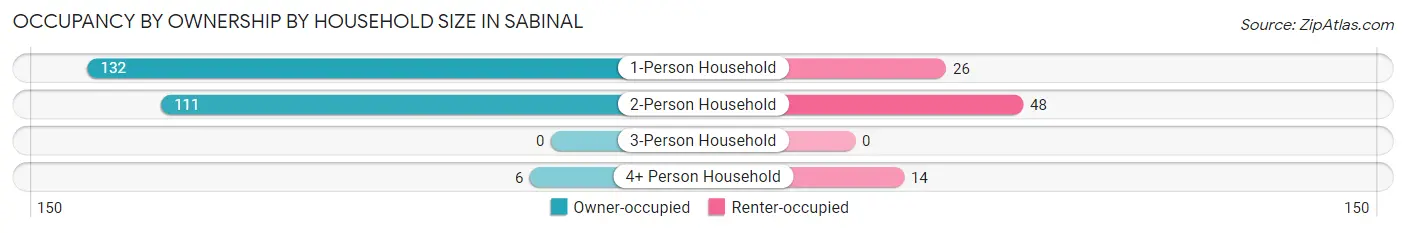
| Household Size | Owner-occupied | Renter-occupied |
| 1-Person Household | 132 (83.5%) | 26 (16.5%) |
| 2-Person Household | 111 (69.8%) | 48 (30.2%) |
| 3-Person Household | 0 (0.0%) | 0 (0.0%) |
| 4+ Person Household | 6 (30.0%) | 14 (70.0%) |
| Total Housing Units | 249 (73.9%) | 88 (26.1%) |
Occupancy by Educational Attainment in Sabinal
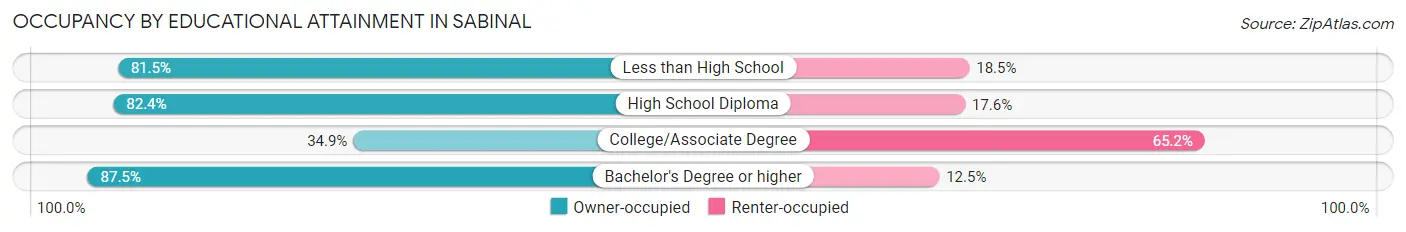
| Household Size | Owner-occupied | Renter-occupied |
| Less than High School | 53 (81.5%) | 12 (18.5%) |
| High School Diploma | 117 (82.4%) | 25 (17.6%) |
| College/Associate Degree | 23 (34.8%) | 43 (65.1%) |
| Bachelor's Degree or higher | 56 (87.5%) | 8 (12.5%) |
Occupancy by Age of Householder in Sabinal
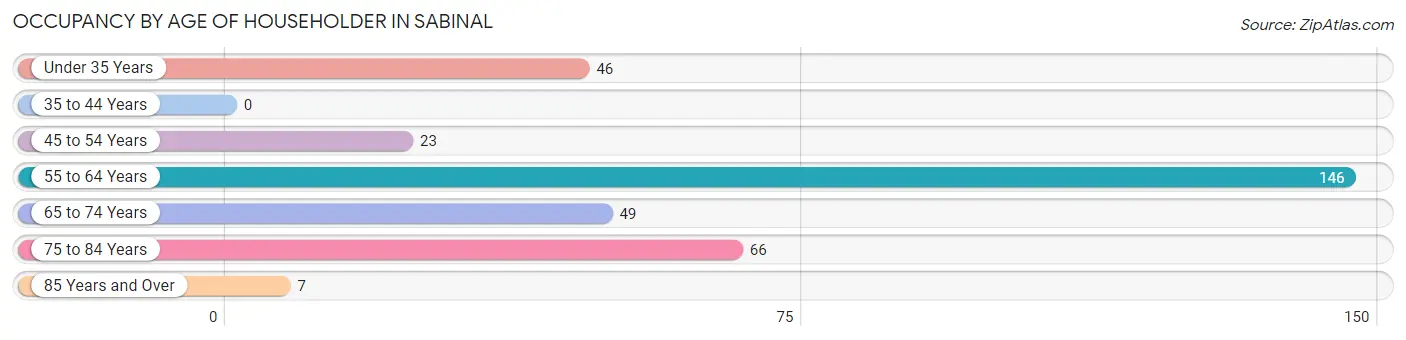
| Age Bracket | # Households | % Households |
| Under 35 Years | 46 | 13.7% |
| 35 to 44 Years | 0 | 0.0% |
| 45 to 54 Years | 23 | 6.8% |
| 55 to 64 Years | 146 | 43.3% |
| 65 to 74 Years | 49 | 14.5% |
| 75 to 84 Years | 66 | 19.6% |
| 85 Years and Over | 7 | 2.1% |
| Total | 337 | 100.0% |
Housing Finances in Sabinal
Median Income by Occupancy in Sabinal
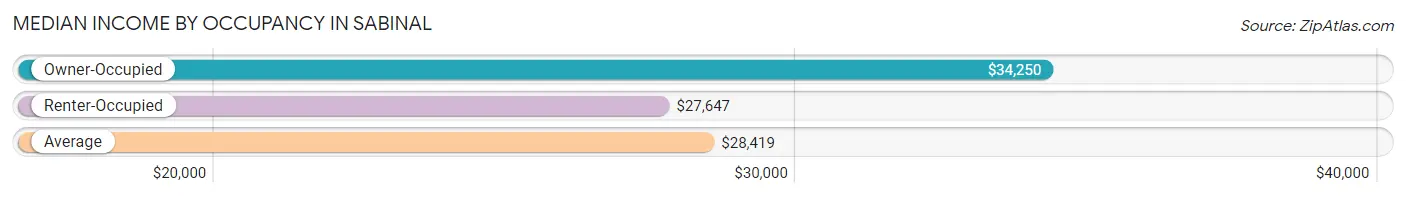
| Occupancy Type | # Households | Median Income |
| Owner-Occupied | 249 (73.9%) | $34,250 |
| Renter-Occupied | 88 (26.1%) | $27,647 |
| Average | 337 (100.0%) | $28,419 |
Occupancy by Householder Income Bracket in Sabinal
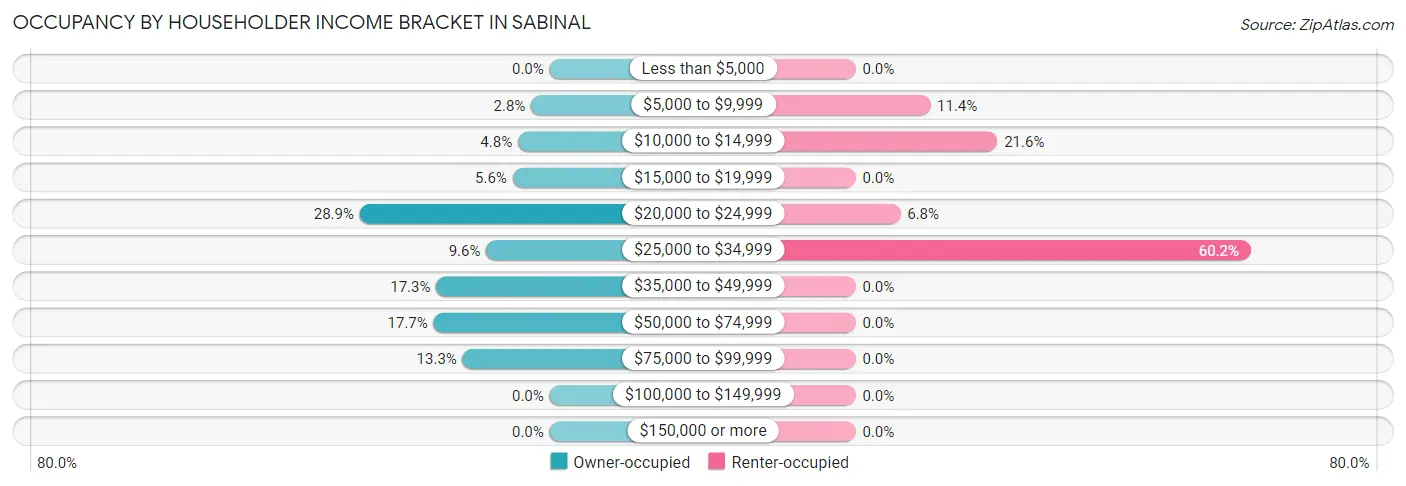
| Income Bracket | Owner-occupied | Renter-occupied |
| Less than $5,000 | 0 (0.0%) | 0 (0.0%) |
| $5,000 to $9,999 | 7 (2.8%) | 10 (11.4%) |
| $10,000 to $14,999 | 12 (4.8%) | 19 (21.6%) |
| $15,000 to $19,999 | 14 (5.6%) | 0 (0.0%) |
| $20,000 to $24,999 | 72 (28.9%) | 6 (6.8%) |
| $25,000 to $34,999 | 24 (9.6%) | 53 (60.2%) |
| $35,000 to $49,999 | 43 (17.3%) | 0 (0.0%) |
| $50,000 to $74,999 | 44 (17.7%) | 0 (0.0%) |
| $75,000 to $99,999 | 33 (13.3%) | 0 (0.0%) |
| $100,000 to $149,999 | 0 (0.0%) | 0 (0.0%) |
| $150,000 or more | 0 (0.0%) | 0 (0.0%) |
| Total | 249 (100.0%) | 88 (100.0%) |
Monthly Housing Cost Tiers in Sabinal
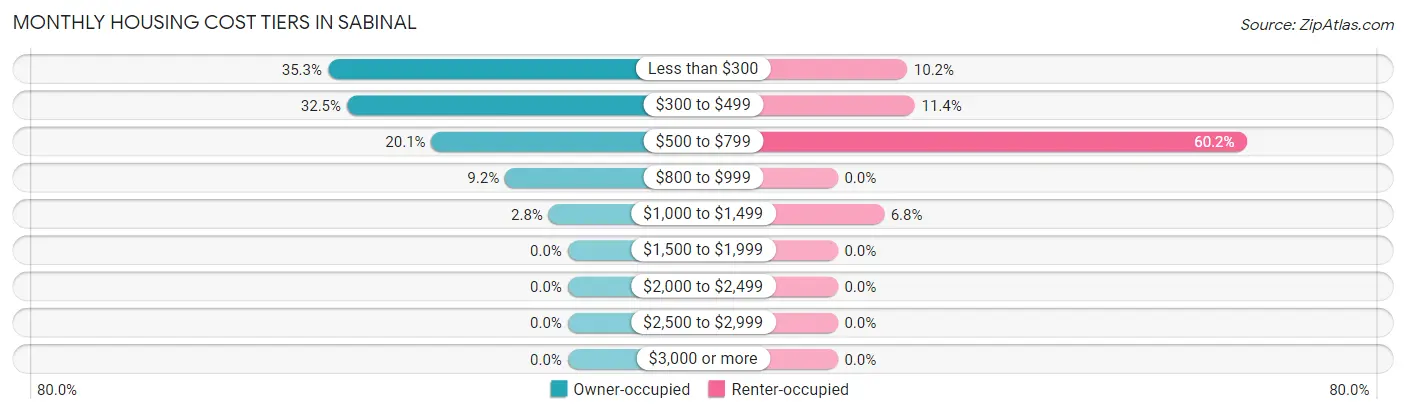
| Monthly Cost | Owner-occupied | Renter-occupied |
| Less than $300 | 88 (35.3%) | 9 (10.2%) |
| $300 to $499 | 81 (32.5%) | 10 (11.4%) |
| $500 to $799 | 50 (20.1%) | 53 (60.2%) |
| $800 to $999 | 23 (9.2%) | 0 (0.0%) |
| $1,000 to $1,499 | 7 (2.8%) | 6 (6.8%) |
| $1,500 to $1,999 | 0 (0.0%) | 0 (0.0%) |
| $2,000 to $2,499 | 0 (0.0%) | 0 (0.0%) |
| $2,500 to $2,999 | 0 (0.0%) | 0 (0.0%) |
| $3,000 or more | 0 (0.0%) | 0 (0.0%) |
| Total | 249 (100.0%) | 88 (100.0%) |
Physical Housing Characteristics in Sabinal
Housing Structures in Sabinal
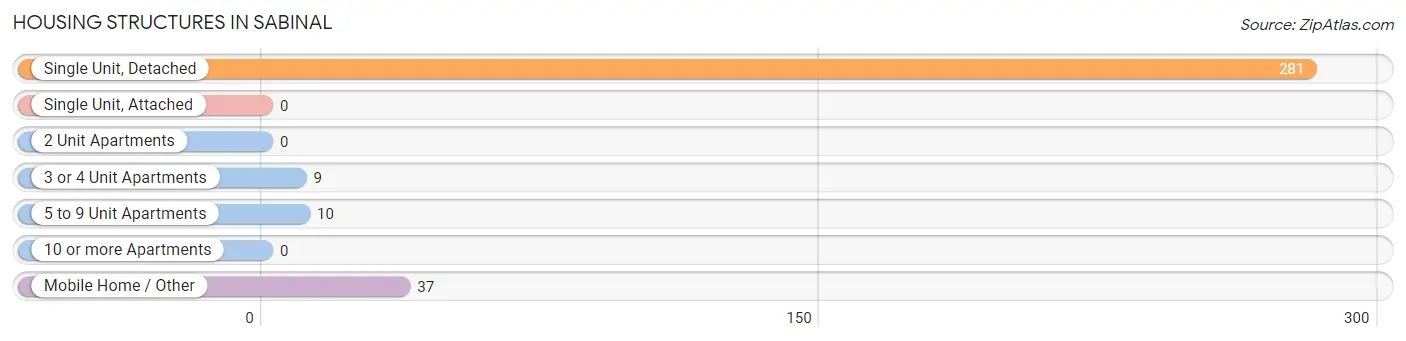
| Structure Type | # Housing Units | % Housing Units |
| Single Unit, Detached | 281 | 83.4% |
| Single Unit, Attached | 0 | 0.0% |
| 2 Unit Apartments | 0 | 0.0% |
| 3 or 4 Unit Apartments | 9 | 2.7% |
| 5 to 9 Unit Apartments | 10 | 3.0% |
| 10 or more Apartments | 0 | 0.0% |
| Mobile Home / Other | 37 | 11.0% |
| Total | 337 | 100.0% |
Housing Structures by Occupancy in Sabinal
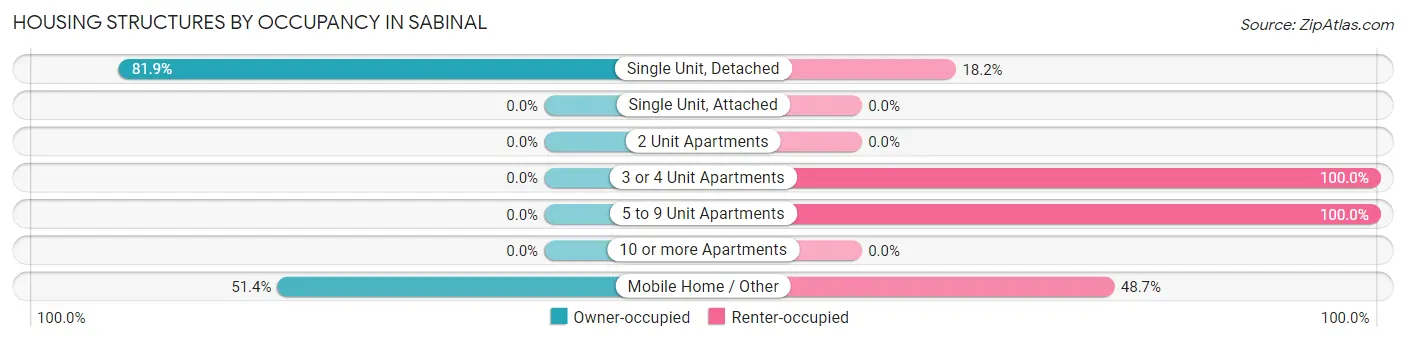
| Structure Type | Owner-occupied | Renter-occupied |
| Single Unit, Detached | 230 (81.9%) | 51 (18.1%) |
| Single Unit, Attached | 0 (0.0%) | 0 (0.0%) |
| 2 Unit Apartments | 0 (0.0%) | 0 (0.0%) |
| 3 or 4 Unit Apartments | 0 (0.0%) | 9 (100.0%) |
| 5 to 9 Unit Apartments | 0 (0.0%) | 10 (100.0%) |
| 10 or more Apartments | 0 (0.0%) | 0 (0.0%) |
| Mobile Home / Other | 19 (51.3%) | 18 (48.6%) |
| Total | 249 (73.9%) | 88 (26.1%) |
Housing Structures by Number of Rooms in Sabinal
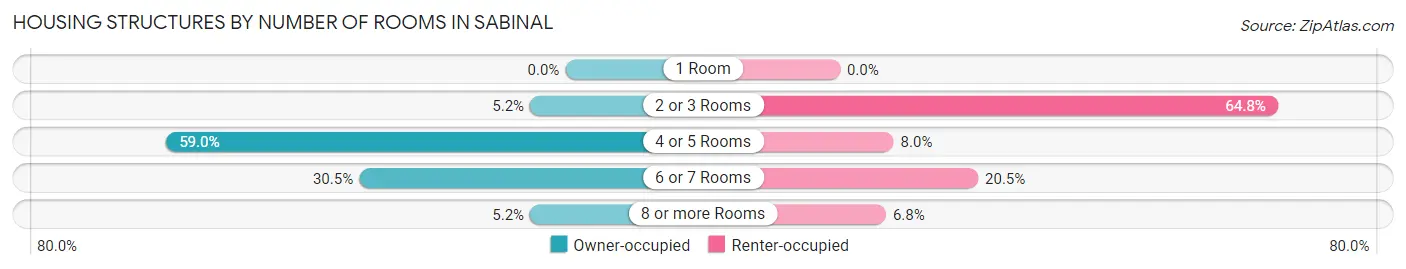
| Number of Rooms | Owner-occupied | Renter-occupied |
| 1 Room | 0 (0.0%) | 0 (0.0%) |
| 2 or 3 Rooms | 13 (5.2%) | 57 (64.8%) |
| 4 or 5 Rooms | 147 (59.0%) | 7 (8.0%) |
| 6 or 7 Rooms | 76 (30.5%) | 18 (20.4%) |
| 8 or more Rooms | 13 (5.2%) | 6 (6.8%) |
| Total | 249 (100.0%) | 88 (100.0%) |
Housing Structure by Heating Type in Sabinal
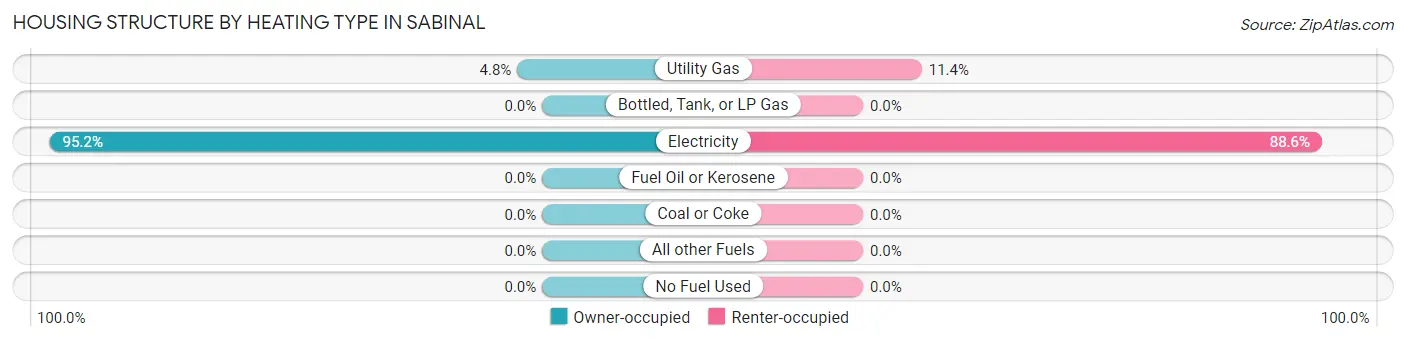
| Heating Type | Owner-occupied | Renter-occupied |
| Utility Gas | 12 (4.8%) | 10 (11.4%) |
| Bottled, Tank, or LP Gas | 0 (0.0%) | 0 (0.0%) |
| Electricity | 237 (95.2%) | 78 (88.6%) |
| Fuel Oil or Kerosene | 0 (0.0%) | 0 (0.0%) |
| Coal or Coke | 0 (0.0%) | 0 (0.0%) |
| All other Fuels | 0 (0.0%) | 0 (0.0%) |
| No Fuel Used | 0 (0.0%) | 0 (0.0%) |
| Total | 249 (100.0%) | 88 (100.0%) |
Household Vehicle Usage in Sabinal
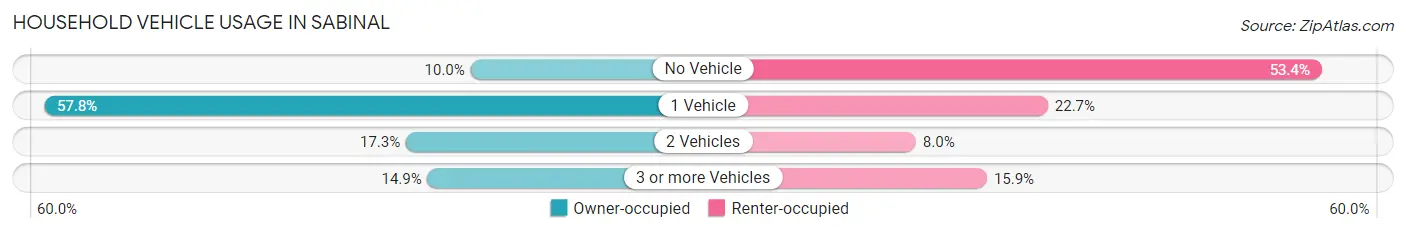
| Vehicles per Household | Owner-occupied | Renter-occupied |
| No Vehicle | 25 (10.0%) | 47 (53.4%) |
| 1 Vehicle | 144 (57.8%) | 20 (22.7%) |
| 2 Vehicles | 43 (17.3%) | 7 (8.0%) |
| 3 or more Vehicles | 37 (14.9%) | 14 (15.9%) |
| Total | 249 (100.0%) | 88 (100.0%) |
Real Estate & Mortgages in Sabinal
Real Estate and Mortgage Overview in Sabinal
| Characteristic | Without Mortgage | With Mortgage |
| Housing Units | 206 | 43 |
| Median Property Value | $78,300 | $21,800 |
| Median Household Income | - | - |
| Monthly Housing Costs | $325 | $0 |
| Real Estate Taxes | $537 | $0 |
Property Value by Mortgage Status in Sabinal
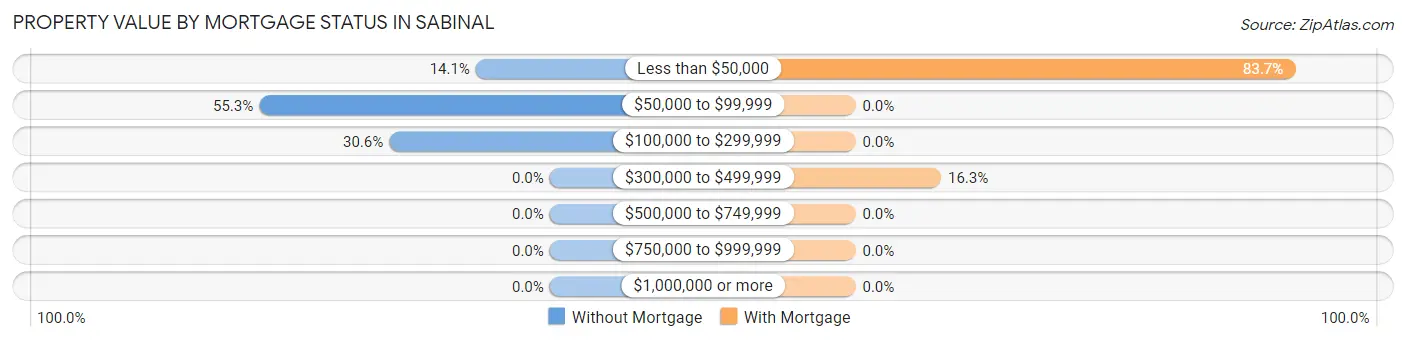
| Property Value | Without Mortgage | With Mortgage |
| Less than $50,000 | 29 (14.1%) | 36 (83.7%) |
| $50,000 to $99,999 | 114 (55.3%) | 0 (0.0%) |
| $100,000 to $299,999 | 63 (30.6%) | 0 (0.0%) |
| $300,000 to $499,999 | 0 (0.0%) | 7 (16.3%) |
| $500,000 to $749,999 | 0 (0.0%) | 0 (0.0%) |
| $750,000 to $999,999 | 0 (0.0%) | 0 (0.0%) |
| $1,000,000 or more | 0 (0.0%) | 0 (0.0%) |
| Total | 206 (100.0%) | 43 (100.0%) |
Household Income by Mortgage Status in Sabinal
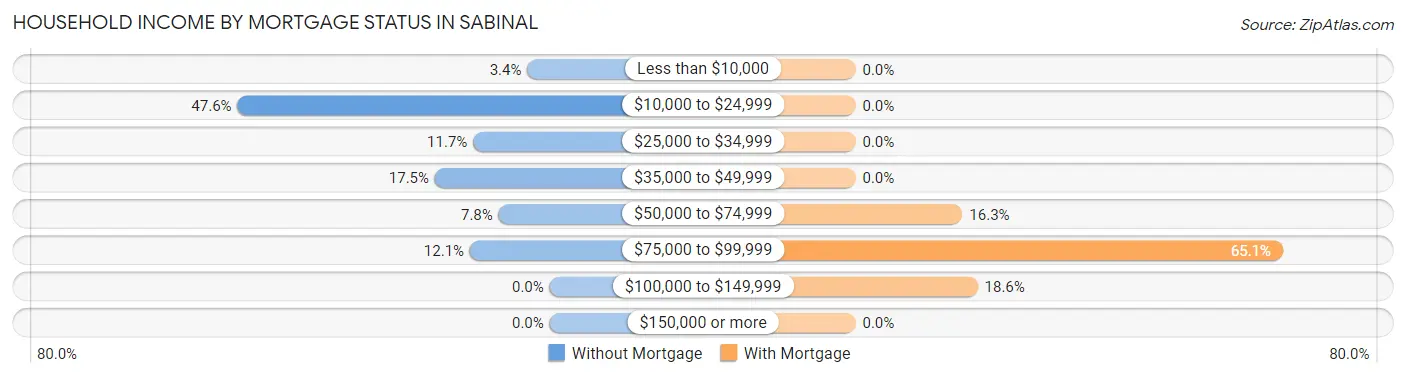
| Household Income | Without Mortgage | With Mortgage |
| Less than $10,000 | 7 (3.4%) | 0 (0.0%) |
| $10,000 to $24,999 | 98 (47.6%) | 0 (0.0%) |
| $25,000 to $34,999 | 24 (11.7%) | 0 (0.0%) |
| $35,000 to $49,999 | 36 (17.5%) | 0 (0.0%) |
| $50,000 to $74,999 | 16 (7.8%) | 7 (16.3%) |
| $75,000 to $99,999 | 25 (12.1%) | 28 (65.1%) |
| $100,000 to $149,999 | 0 (0.0%) | 8 (18.6%) |
| $150,000 or more | 0 (0.0%) | 0 (0.0%) |
| Total | 206 (100.0%) | 43 (100.0%) |
Property Value to Household Income Ratio in Sabinal
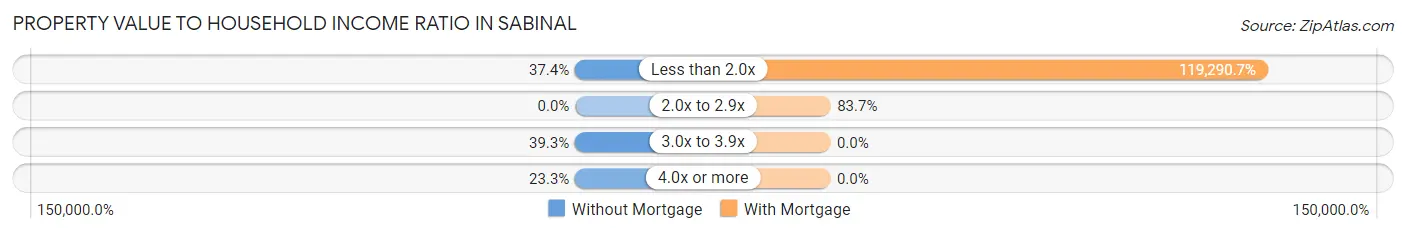
| Value-to-Income Ratio | Without Mortgage | With Mortgage |
| Less than 2.0x | 77 (37.4%) | 51,295 (119,290.7%) |
| 2.0x to 2.9x | 0 (0.0%) | 36 (83.7%) |
| 3.0x to 3.9x | 81 (39.3%) | 0 (0.0%) |
| 4.0x or more | 48 (23.3%) | 0 (0.0%) |
| Total | 206 (100.0%) | 43 (100.0%) |
Real Estate Taxes by Mortgage Status in Sabinal
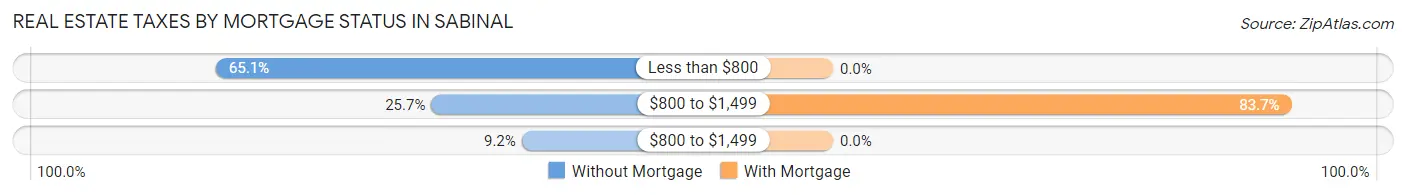
| Property Taxes | Without Mortgage | With Mortgage |
| Less than $800 | 134 (65.0%) | 0 (0.0%) |
| $800 to $1,499 | 53 (25.7%) | 36 (83.7%) |
| $800 to $1,499 | 19 (9.2%) | 0 (0.0%) |
| Total | 206 (100.0%) | 43 (100.0%) |
Health & Disability in Sabinal
Health Insurance Coverage by Age in Sabinal
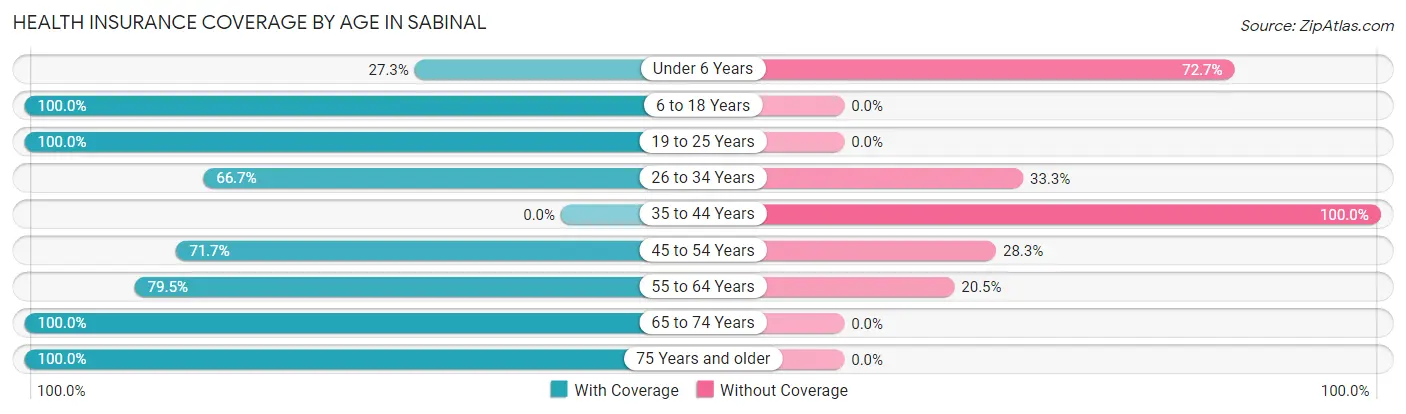
| Age Bracket | With Coverage | Without Coverage |
| Under 6 Years | 9 (27.3%) | 24 (72.7%) |
| 6 to 18 Years | 72 (100.0%) | 0 (0.0%) |
| 19 to 25 Years | 14 (100.0%) | 0 (0.0%) |
| 26 to 34 Years | 32 (66.7%) | 16 (33.3%) |
| 35 to 44 Years | 0 (0.0%) | 39 (100.0%) |
| 45 to 54 Years | 38 (71.7%) | 15 (28.3%) |
| 55 to 64 Years | 151 (79.5%) | 39 (20.5%) |
| 65 to 74 Years | 70 (100.0%) | 0 (0.0%) |
| 75 Years and older | 116 (100.0%) | 0 (0.0%) |
| Total | 502 (79.1%) | 133 (20.9%) |
Health Insurance Coverage by Citizenship Status in Sabinal
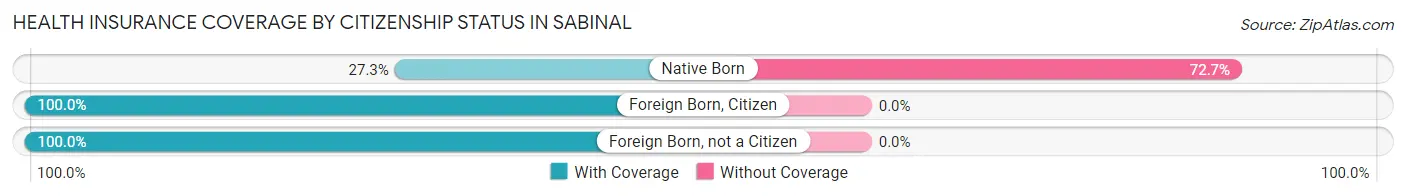
| Citizenship Status | With Coverage | Without Coverage |
| Native Born | 9 (27.3%) | 24 (72.7%) |
| Foreign Born, Citizen | 72 (100.0%) | 0 (0.0%) |
| Foreign Born, not a Citizen | 14 (100.0%) | 0 (0.0%) |
Health Insurance Coverage by Household Income in Sabinal
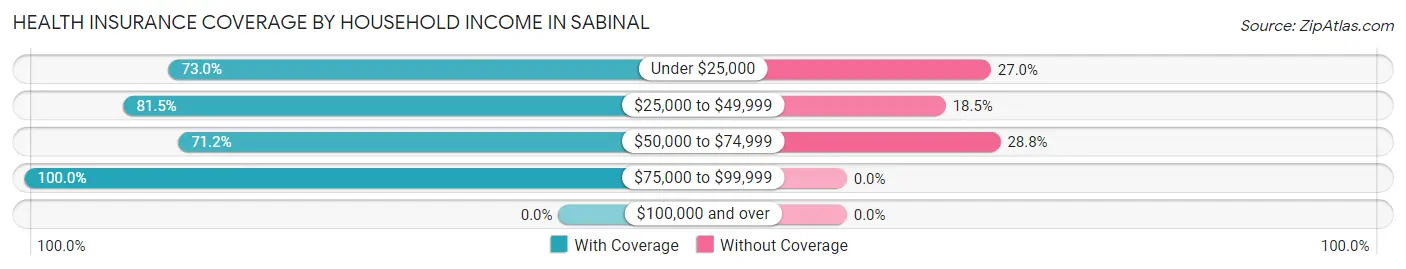
| Household Income | With Coverage | Without Coverage |
| Under $25,000 | 165 (73.0%) | 61 (27.0%) |
| $25,000 to $49,999 | 233 (81.5%) | 53 (18.5%) |
| $50,000 to $74,999 | 47 (71.2%) | 19 (28.8%) |
| $75,000 to $99,999 | 57 (100.0%) | 0 (0.0%) |
| $100,000 and over | 0 (0.0%) | 0 (0.0%) |
Public vs Private Health Insurance Coverage by Age in Sabinal
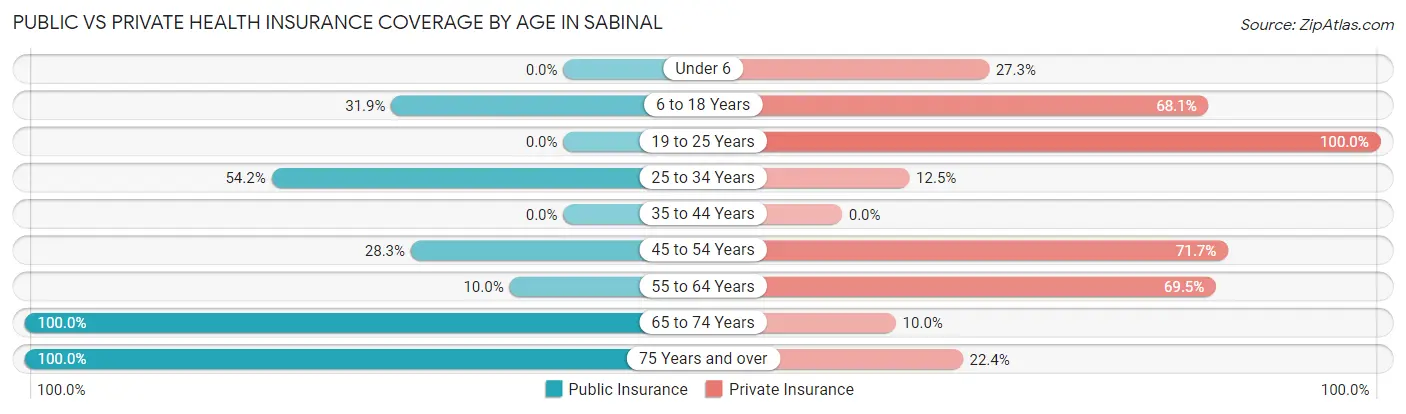
| Age Bracket | Public Insurance | Private Insurance |
| Under 6 | 0 (0.0%) | 9 (27.3%) |
| 6 to 18 Years | 23 (31.9%) | 49 (68.1%) |
| 19 to 25 Years | 0 (0.0%) | 14 (100.0%) |
| 25 to 34 Years | 26 (54.2%) | 6 (12.5%) |
| 35 to 44 Years | 0 (0.0%) | 0 (0.0%) |
| 45 to 54 Years | 15 (28.3%) | 38 (71.7%) |
| 55 to 64 Years | 19 (10.0%) | 132 (69.5%) |
| 65 to 74 Years | 70 (100.0%) | 7 (10.0%) |
| 75 Years and over | 116 (100.0%) | 26 (22.4%) |
| Total | 269 (42.4%) | 281 (44.3%) |
Disability Status by Sex by Age in Sabinal
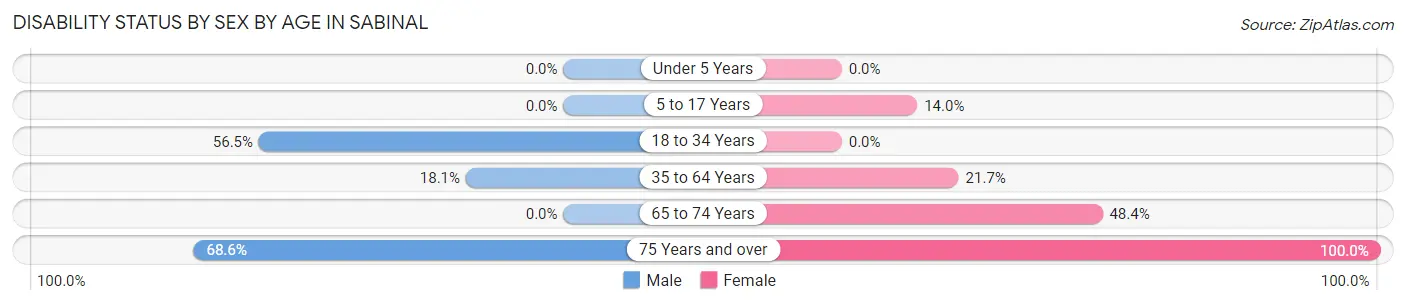
| Age Bracket | Male | Female |
| Under 5 Years | 0 (0.0%) | 0 (0.0%) |
| 5 to 17 Years | 0 (0.0%) | 7 (14.0%) |
| 18 to 34 Years | 26 (56.5%) | 0 (0.0%) |
| 35 to 64 Years | 21 (18.1%) | 36 (21.7%) |
| 65 to 74 Years | 0 (0.0%) | 30 (48.4%) |
| 75 Years and over | 35 (68.6%) | 65 (100.0%) |
Disability Class by Sex by Age in Sabinal
Disability Class: Hearing Difficulty
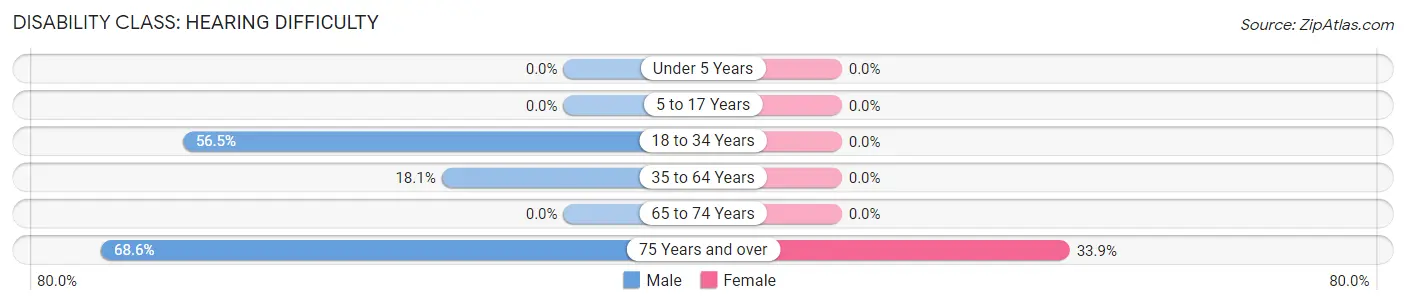
| Age Bracket | Male | Female |
| Under 5 Years | 0 (0.0%) | 0 (0.0%) |
| 5 to 17 Years | 0 (0.0%) | 0 (0.0%) |
| 18 to 34 Years | 26 (56.5%) | 0 (0.0%) |
| 35 to 64 Years | 21 (18.1%) | 0 (0.0%) |
| 65 to 74 Years | 0 (0.0%) | 0 (0.0%) |
| 75 Years and over | 35 (68.6%) | 22 (33.9%) |
Disability Class: Vision Difficulty
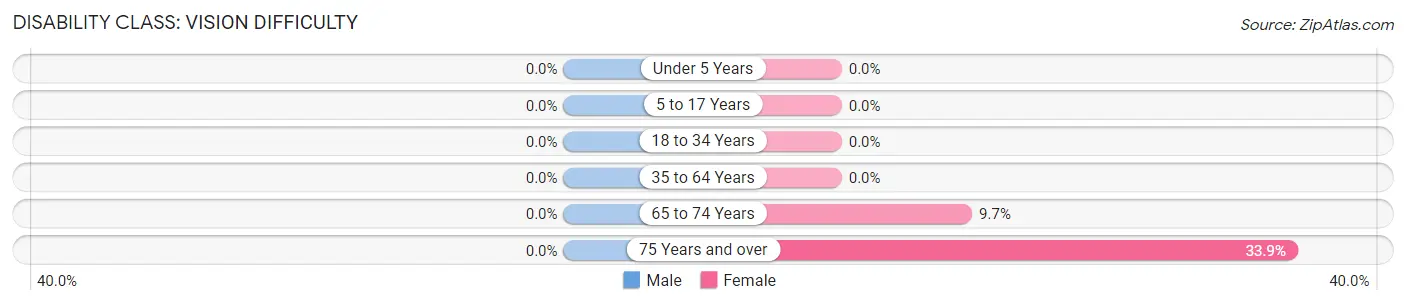
| Age Bracket | Male | Female |
| Under 5 Years | 0 (0.0%) | 0 (0.0%) |
| 5 to 17 Years | 0 (0.0%) | 0 (0.0%) |
| 18 to 34 Years | 0 (0.0%) | 0 (0.0%) |
| 35 to 64 Years | 0 (0.0%) | 0 (0.0%) |
| 65 to 74 Years | 0 (0.0%) | 6 (9.7%) |
| 75 Years and over | 0 (0.0%) | 22 (33.9%) |
Disability Class: Cognitive Difficulty
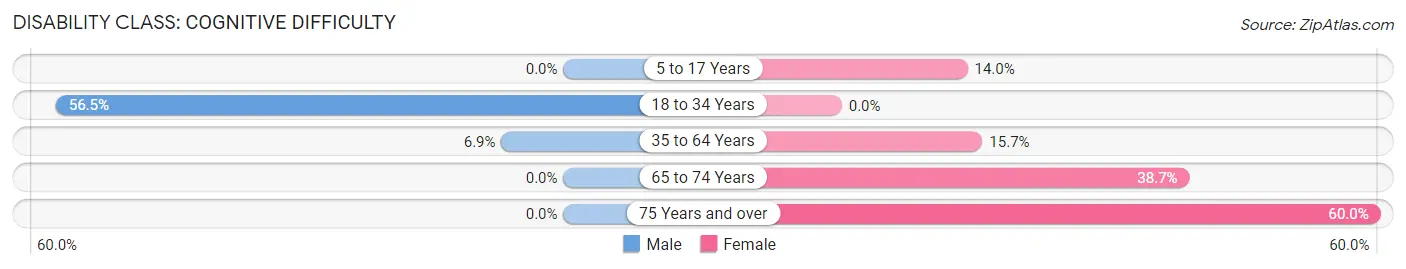
| Age Bracket | Male | Female |
| 5 to 17 Years | 0 (0.0%) | 7 (14.0%) |
| 18 to 34 Years | 26 (56.5%) | 0 (0.0%) |
| 35 to 64 Years | 8 (6.9%) | 26 (15.7%) |
| 65 to 74 Years | 0 (0.0%) | 24 (38.7%) |
| 75 Years and over | 0 (0.0%) | 39 (60.0%) |
Disability Class: Ambulatory Difficulty
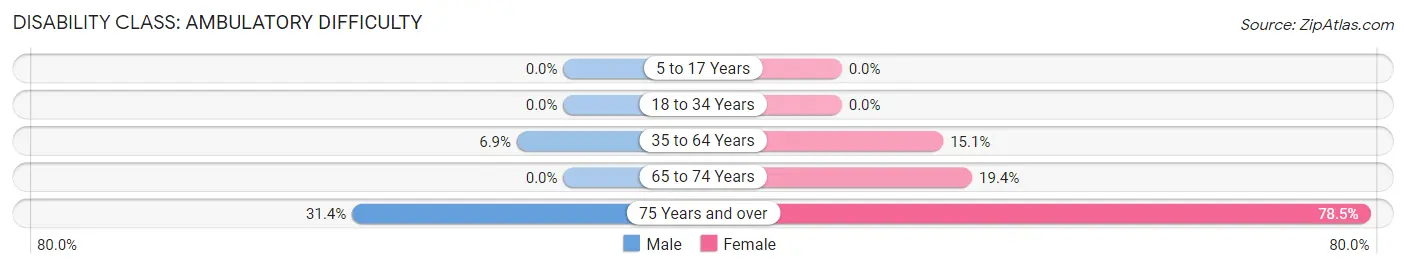
| Age Bracket | Male | Female |
| 5 to 17 Years | 0 (0.0%) | 0 (0.0%) |
| 18 to 34 Years | 0 (0.0%) | 0 (0.0%) |
| 35 to 64 Years | 8 (6.9%) | 25 (15.1%) |
| 65 to 74 Years | 0 (0.0%) | 12 (19.4%) |
| 75 Years and over | 16 (31.4%) | 51 (78.5%) |
Disability Class: Self-Care Difficulty
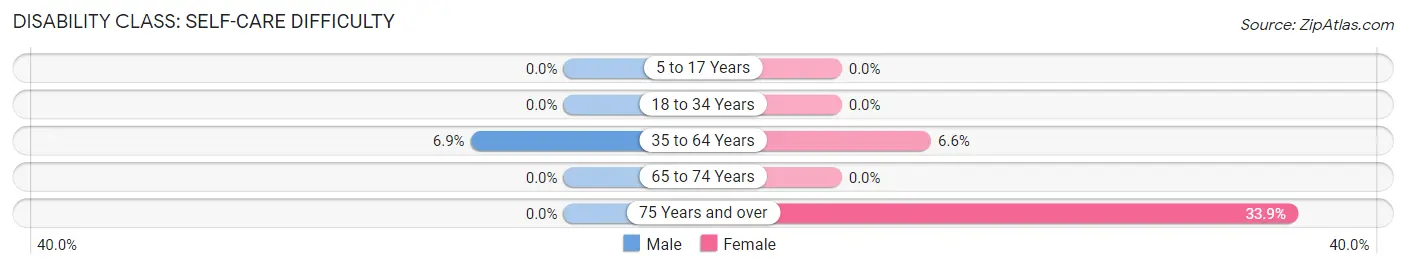
| Age Bracket | Male | Female |
| 5 to 17 Years | 0 (0.0%) | 0 (0.0%) |
| 18 to 34 Years | 0 (0.0%) | 0 (0.0%) |
| 35 to 64 Years | 8 (6.9%) | 11 (6.6%) |
| 65 to 74 Years | 0 (0.0%) | 0 (0.0%) |
| 75 Years and over | 0 (0.0%) | 22 (33.9%) |
Technology Access in Sabinal
Computing Device Access in Sabinal
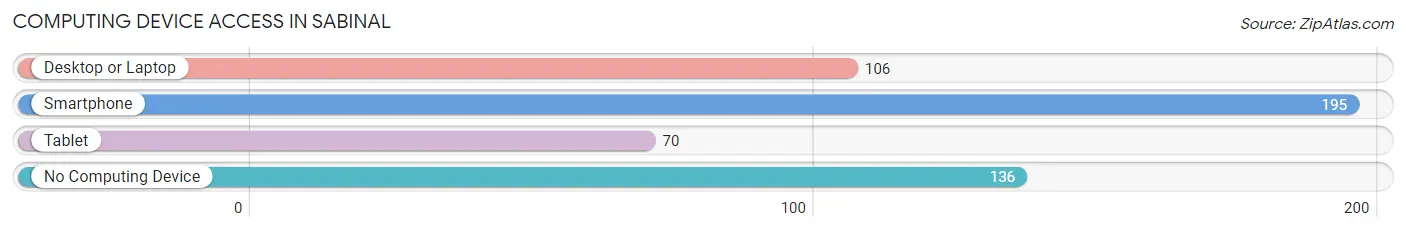
| Device Type | # Households | % Households |
| Desktop or Laptop | 106 | 31.5% |
| Smartphone | 195 | 57.9% |
| Tablet | 70 | 20.8% |
| No Computing Device | 136 | 40.4% |
| Total | 337 | 100.0% |
Internet Access in Sabinal
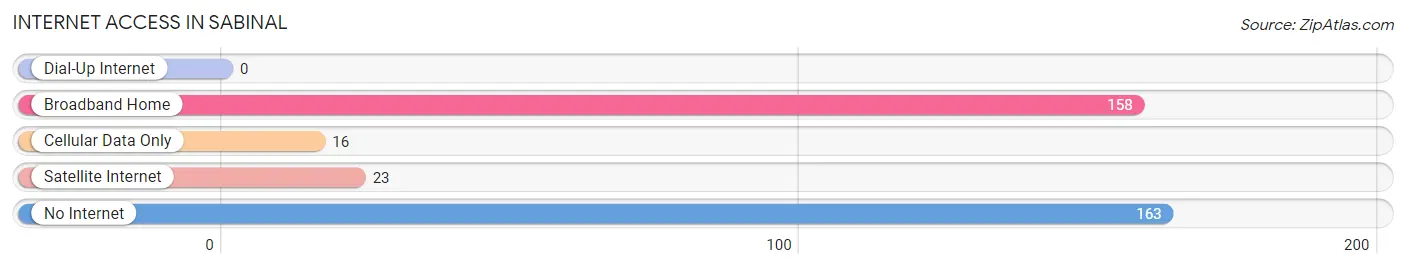
| Internet Type | # Households | % Households |
| Dial-Up Internet | 0 | 0.0% |
| Broadband Home | 158 | 46.9% |
| Cellular Data Only | 16 | 4.8% |
| Satellite Internet | 23 | 6.8% |
| No Internet | 163 | 48.4% |
| Total | 337 | 100.0% |
Sabinal Summary
Sabinal, Texas is a small town located in Uvalde County, Texas. It is situated in the Hill Country region of the state, about 70 miles west of San Antonio. The town was founded in 1856 and has a population of 1,741 as of the 2010 census.
History
The area around Sabinal was first settled by Native Americans, including the Tonkawa, Lipan Apache, and Comanche tribes. The first European settlers arrived in the area in the early 1800s, and the town of Sabinal was founded in 1856. The town was named after the nearby Sabinal River, which was named by Spanish explorers in the 1700s.
The town was originally a farming and ranching community, and the local economy was largely based on the production of cotton, corn, and other crops. In the late 1800s, the town began to grow as the railroad was built through the area, connecting Sabinal to other towns in the region.
In the early 1900s, Sabinal began to experience a period of growth and prosperity. The town was home to several businesses, including a bank, a hotel, a newspaper, and a movie theater. The town also had a school, a library, and a hospital.
Geography
Sabinal is located in Uvalde County, Texas, about 70 miles west of San Antonio. The town is situated in the Hill Country region of the state, and is surrounded by rolling hills and grasslands. The Sabinal River runs through the town, and the nearby Frio River is a popular destination for fishing and swimming.
The climate in Sabinal is generally mild, with hot summers and cool winters. The average temperature in the summer is around 90 degrees Fahrenheit, and the average temperature in the winter is around 50 degrees Fahrenheit.
Economy
The economy of Sabinal is largely based on agriculture and tourism. The town is home to several farms and ranches, and the local economy is supported by the production of cotton, corn, and other crops. The town is also a popular destination for tourists, who come to enjoy the area’s natural beauty and outdoor activities.
The town is home to several businesses, including restaurants, shops, and hotels. The local economy is also supported by the nearby military base, which provides jobs for many of the town’s residents.
Demographics
As of the 2010 census, the population of Sabinal was 1,741. The town is predominantly white, with about 85% of the population identifying as white. The remaining 15% of the population is made up of African Americans, Hispanics, and other ethnicities.
The median household income in Sabinal is $35,000, and the median home value is $90,000. The town has a low unemployment rate, and the poverty rate is below the national average.
Conclusion
Sabinal, Texas is a small town located in Uvalde County, Texas. It was founded in 1856 and has a population of 1,741 as of the 2010 census. The town is situated in the Hill Country region of the state, and the local economy is largely based on agriculture and tourism. The town is predominantly white, with about 85% of the population identifying as white. The median household income in Sabinal is $35,000, and the median home value is $90,000. The town has a low unemployment rate, and the poverty rate is below the national average.
Common Questions
What is Per Capita Income in Sabinal?
Per Capita income in Sabinal is $18,835.
What is the Median Family Income in Sabinal?
Median Family Income in Sabinal is $34,954.
What is the Median Household income in Sabinal?
Median Household Income in Sabinal is $28,419.
What is Income or Wage Gap in Sabinal?
Income or Wage Gap in Sabinal is 25.6%.
Women in Sabinal earn 74.4 cents for every dollar earned by a man.
What is Inequality or Gini Index in Sabinal?
Inequality or Gini Index in Sabinal is 0.32.
What is the Total Population of Sabinal?
Total Population of Sabinal is 635.
What is the Total Male Population of Sabinal?
Total Male Population of Sabinal is 276.
What is the Total Female Population of Sabinal?
Total Female Population of Sabinal is 359.
What is the Ratio of Males per 100 Females in Sabinal?
There are 76.88 Males per 100 Females in Sabinal.
What is the Ratio of Females per 100 Males in Sabinal?
There are 130.07 Females per 100 Males in Sabinal.
What is the Median Population Age in Sabinal?
Median Population Age in Sabinal is 60.0 Years.
What is the Average Family Size in Sabinal
Average Family Size in Sabinal is 2.8 People.
What is the Average Household Size in Sabinal
Average Household Size in Sabinal is 1.9 People.
How Large is the Labor Force in Sabinal?
There are 284 People in the Labor Forcein in Sabinal.
What is the Percentage of People in the Labor Force in Sabinal?
52.7% of People are in the Labor Force in Sabinal.
What is the Unemployment Rate in Sabinal?
Unemployment Rate in Sabinal is 7.0%.