Roma, TX Map & Demographics
Roma Map
Roma Overview
$14,065
PER CAPITA INCOME
$35,786
AVG FAMILY INCOME
$26,951
AVG HOUSEHOLD INCOME
4.7%
WAGE / INCOME GAP [ % ]
95.3¢/ $1
WAGE / INCOME GAP [ $ ]
0.49
INEQUALITY / GINI INDEX
11,531
TOTAL POPULATION
5,360
MALE POPULATION
6,171
FEMALE POPULATION
86.86
MALES / 100 FEMALES
115.13
FEMALES / 100 MALES
29.7
MEDIAN AGE
4.4
AVG FAMILY SIZE
3.5
AVG HOUSEHOLD SIZE
4,479
LABOR FORCE [ PEOPLE ]
55.0%
PERCENT IN LABOR FORCE
14.0%
UNEMPLOYMENT RATE
Roma Zip Codes
Roma Area Codes
Income in Roma
Income Overview in Roma
Per Capita Income in Roma is $14,065, while median incomes of families and households are $35,786 and $26,951 respectively.
| Characteristic | Number | Measure |
| Per Capita Income | 11,531 | $14,065 |
| Median Family Income | 2,393 | $35,786 |
| Mean Family Income | 2,393 | $47,057 |
| Median Household Income | 3,284 | $26,951 |
| Mean Household Income | 3,284 | $40,176 |
| Income Deficit | 2,393 | $0 |
| Wage / Income Gap (%) | 11,531 | 4.71% |
| Wage / Income Gap ($) | 11,531 | 95.29¢ per $1 |
| Gini / Inequality Index | 11,531 | 0.49 |
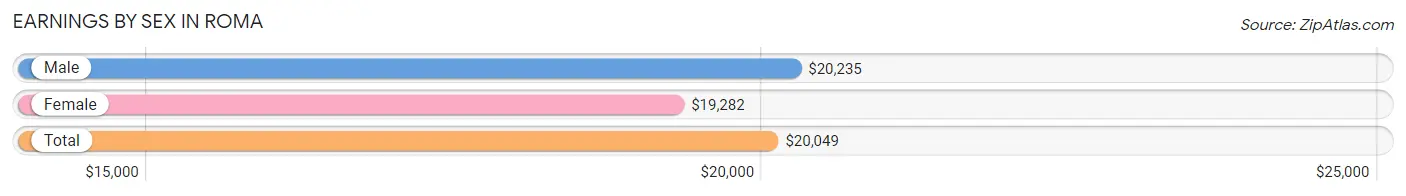
Earnings by Sex in Roma
Average Earnings in Roma are $20,049, $20,235 for men and $19,282 for women, a difference of 4.7%.
| Sex | Number | Average Earnings |
| Male | 2,607 (55.7%) | $20,235 |
| Female | 2,077 (44.3%) | $19,282 |
| Total | 4,684 (100.0%) | $20,049 |
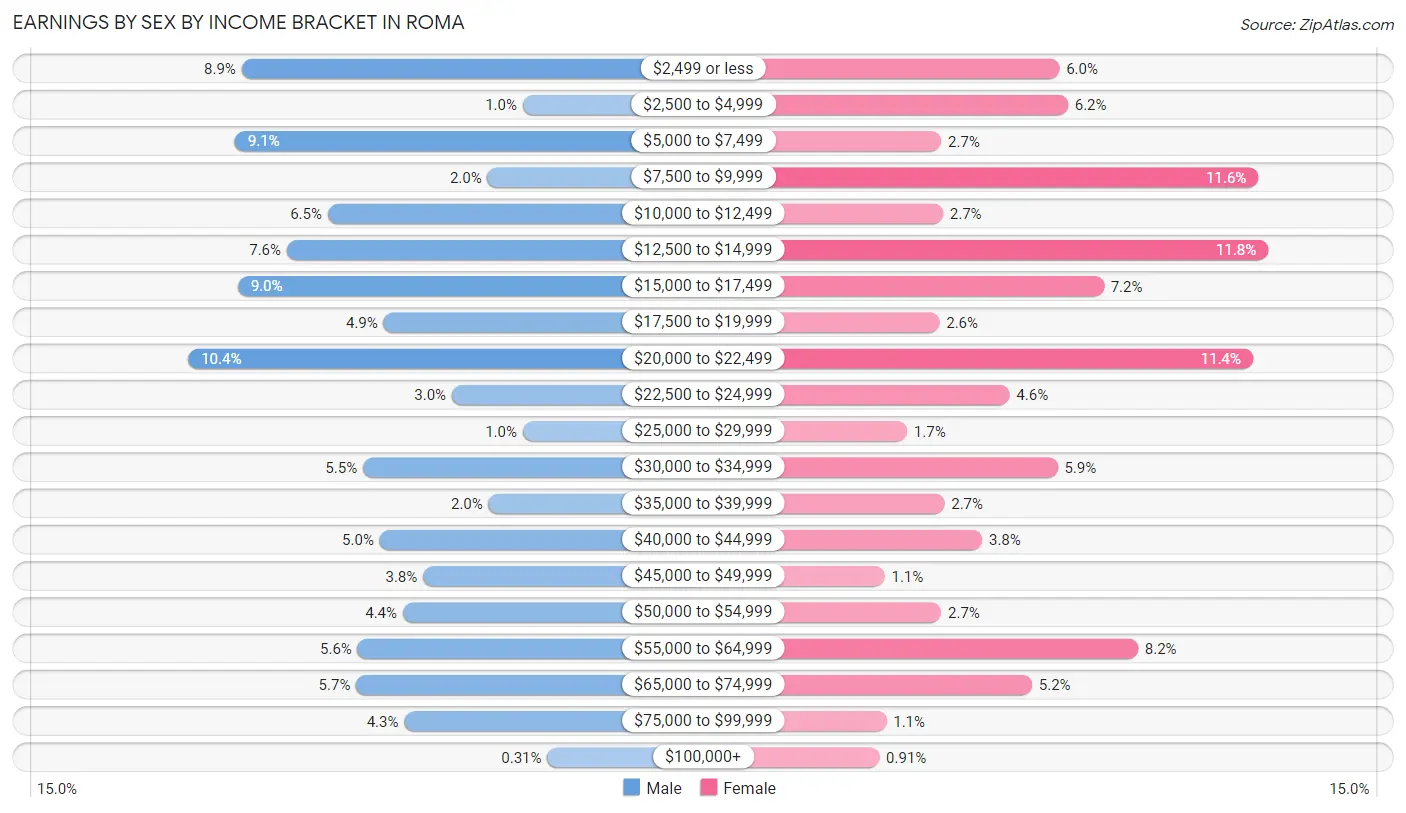
Earnings by Sex by Income Bracket in Roma
The most common earnings brackets in Roma are $20,000 to $22,499 for men (271 | 10.4%) and $12,500 to $14,999 for women (246 | 11.8%).
| Income | Male | Female |
| $2,499 or less | 232 (8.9%) | 124 (6.0%) |
| $2,500 to $4,999 | 26 (1.0%) | 129 (6.2%) |
| $5,000 to $7,499 | 237 (9.1%) | 55 (2.6%) |
| $7,500 to $9,999 | 52 (2.0%) | 240 (11.6%) |
| $10,000 to $12,499 | 169 (6.5%) | 56 (2.7%) |
| $12,500 to $14,999 | 199 (7.6%) | 246 (11.8%) |
| $15,000 to $17,499 | 235 (9.0%) | 150 (7.2%) |
| $17,500 to $19,999 | 128 (4.9%) | 54 (2.6%) |
| $20,000 to $22,499 | 271 (10.4%) | 237 (11.4%) |
| $22,500 to $24,999 | 78 (3.0%) | 95 (4.6%) |
| $25,000 to $29,999 | 26 (1.0%) | 35 (1.7%) |
| $30,000 to $34,999 | 143 (5.5%) | 123 (5.9%) |
| $35,000 to $39,999 | 51 (2.0%) | 57 (2.7%) |
| $40,000 to $44,999 | 131 (5.0%) | 79 (3.8%) |
| $45,000 to $49,999 | 99 (3.8%) | 22 (1.1%) |
| $50,000 to $54,999 | 114 (4.4%) | 55 (2.6%) |
| $55,000 to $64,999 | 147 (5.6%) | 170 (8.2%) |
| $65,000 to $74,999 | 148 (5.7%) | 108 (5.2%) |
| $75,000 to $99,999 | 113 (4.3%) | 23 (1.1%) |
| $100,000+ | 8 (0.3%) | 19 (0.9%) |
| Total | 2,607 (100.0%) | 2,077 (100.0%) |
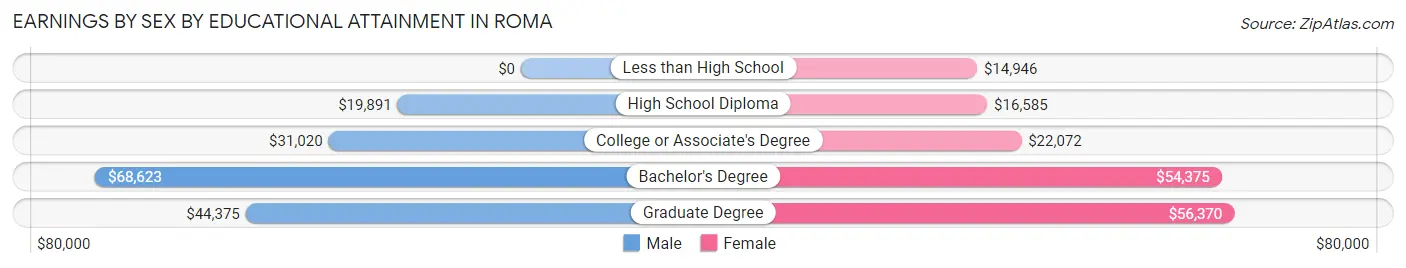
Earnings by Sex by Educational Attainment in Roma
Average earnings in Roma are $20,821 for men and $20,928 for women, a difference of 0.5%. Men with an educational attainment of bachelor's degree enjoy the highest average annual earnings of $68,623, while those with high school diploma education earn the least with $19,891. Women with an educational attainment of graduate degree earn the most with the average annual earnings of $56,370, while those with less than high school education have the smallest earnings of $14,946.
| Educational Attainment | Male Income | Female Income |
| Less than High School | - | - |
| High School Diploma | $19,891 | $16,585 |
| College or Associate's Degree | $31,020 | $22,072 |
| Bachelor's Degree | $68,623 | $54,375 |
| Graduate Degree | $44,375 | $56,370 |
| Total | $20,821 | $20,928 |
Family Income in Roma
Family Income Brackets in Roma
According to the Roma family income data, there are 498 families falling into the $35,000 to $49,999 income range, which is the most common income bracket and makes up 20.8% of all families. Conversely, the $150,000 to $199,999 income bracket is the least frequent group with only 50 families (2.1%) belonging to this category.
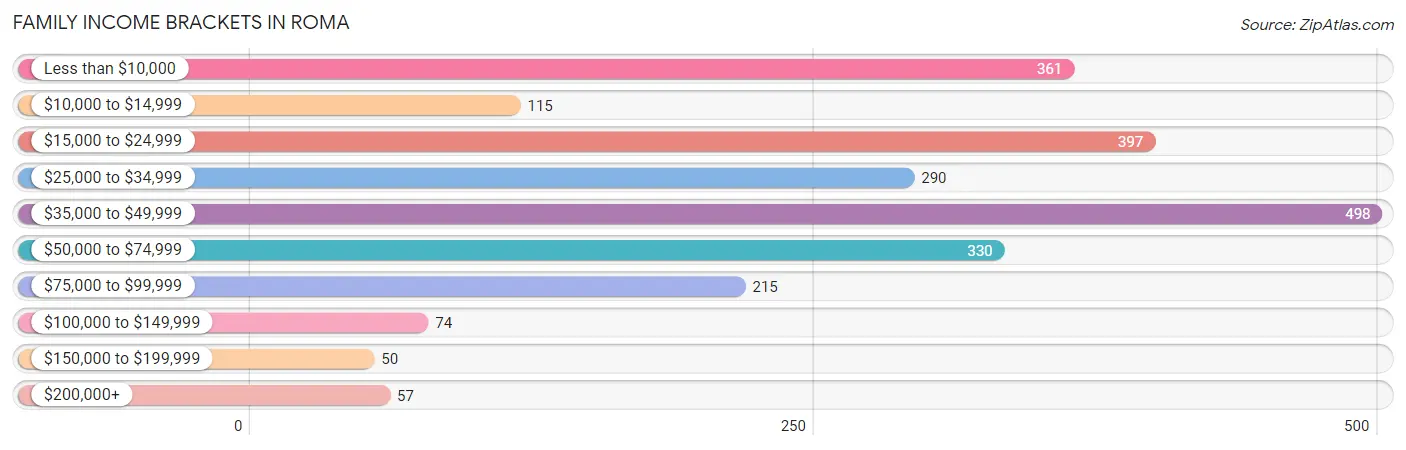
| Income Bracket | # Families | % Families |
| Less than $10,000 | 361 | 15.1% |
| $10,000 to $14,999 | 115 | 4.8% |
| $15,000 to $24,999 | 397 | 16.6% |
| $25,000 to $34,999 | 290 | 12.1% |
| $35,000 to $49,999 | 498 | 20.8% |
| $50,000 to $74,999 | 330 | 13.8% |
| $75,000 to $99,999 | 215 | 9.0% |
| $100,000 to $149,999 | 74 | 3.1% |
| $150,000 to $199,999 | 50 | 2.1% |
| $200,000+ | 57 | 2.4% |
Family Income by Famaliy Size in Roma
7+ person families (144 | 6.0%) account for the highest median family income in Roma with $71,298 per family, while 3-person families (688 | 28.7%) have the highest median income of $13,363 per family member.
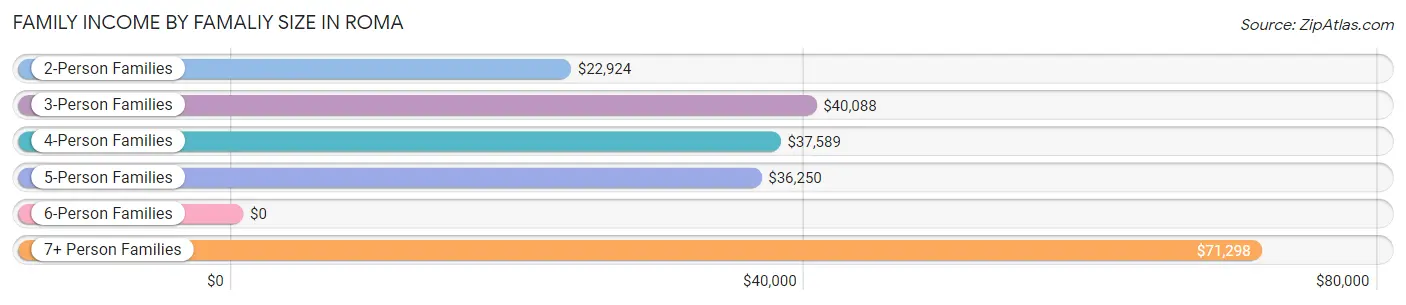
| Income Bracket | # Families | Median Income |
| 2-Person Families | 809 (33.8%) | $22,924 |
| 3-Person Families | 688 (28.7%) | $40,088 |
| 4-Person Families | 535 (22.4%) | $37,589 |
| 5-Person Families | 147 (6.1%) | $36,250 |
| 6-Person Families | 70 (2.9%) | $0 |
| 7+ Person Families | 144 (6.0%) | $71,298 |
| Total | 2,393 (100.0%) | $35,786 |
Family Income by Number of Earners in Roma
The median family income in Roma is $35,786, with families comprising 3+ earners (301) having the highest median family income of $67,250, while families with no earners (413) have the lowest median family income of $15,694, accounting for 12.6% and 17.3% of families, respectively.
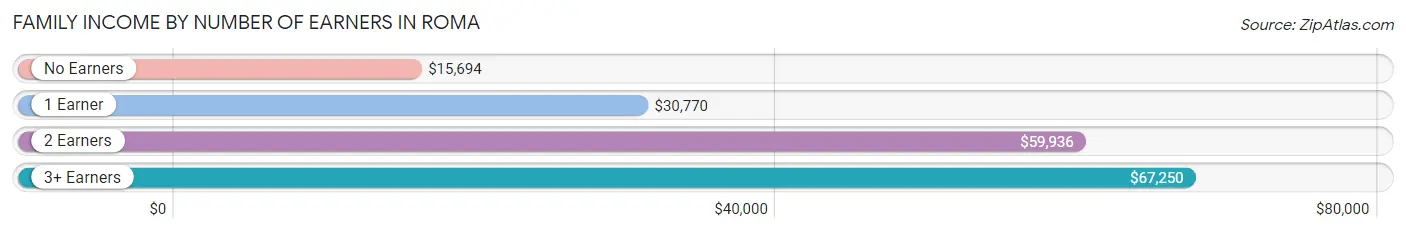
| Number of Earners | # Families | Median Income |
| No Earners | 413 (17.3%) | $15,694 |
| 1 Earner | 977 (40.8%) | $30,770 |
| 2 Earners | 702 (29.3%) | $59,936 |
| 3+ Earners | 301 (12.6%) | $67,250 |
| Total | 2,393 (100.0%) | $35,786 |
Household Income in Roma
Household Income Brackets in Roma
With 594 households falling in the category, the $35,000 to $49,999 income range is the most frequent in Roma, accounting for 18.1% of all households. In contrast, only 53 households (1.6%) fall into the $150,000 to $199,999 income bracket, making it the least populous group.
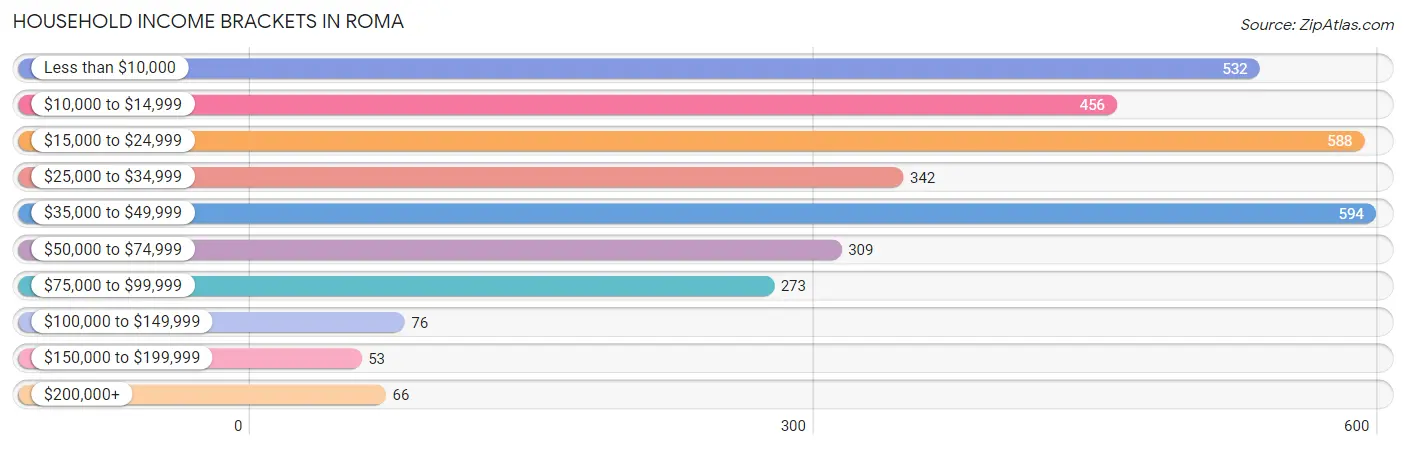
| Income Bracket | # Households | % Households |
| Less than $10,000 | 532 | 16.2% |
| $10,000 to $14,999 | 456 | 13.9% |
| $15,000 to $24,999 | 588 | 17.9% |
| $25,000 to $34,999 | 342 | 10.4% |
| $35,000 to $49,999 | 594 | 18.1% |
| $50,000 to $74,999 | 309 | 9.4% |
| $75,000 to $99,999 | 273 | 8.3% |
| $100,000 to $149,999 | 76 | 2.3% |
| $150,000 to $199,999 | 53 | 1.6% |
| $200,000+ | 66 | 2.0% |
Household Income by Householder Age in Roma
The median household income in Roma is $26,951, with the highest median household income of $39,048 found in the 45 to 64 years age bracket for the primary householder. A total of 1,071 households (32.6%) fall into this category. Meanwhile, the 15 to 24 years age bracket for the primary householder has the lowest median household income of $0, with 143 households (4.3%) in this group.
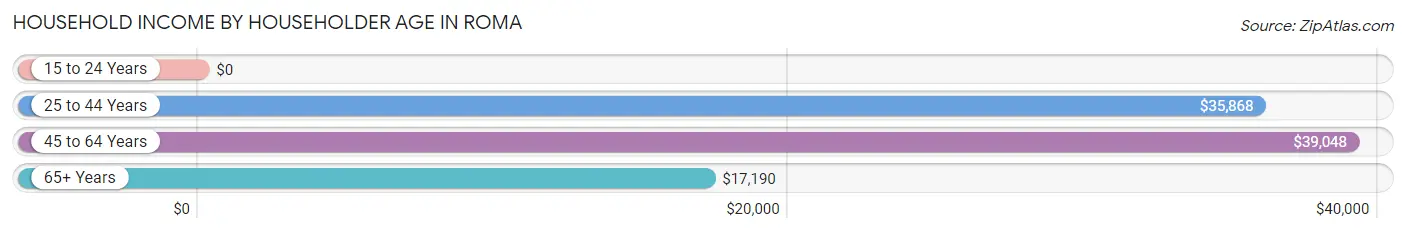
| Income Bracket | # Households | Median Income |
| 15 to 24 Years | 143 (4.3%) | $0 |
| 25 to 44 Years | 787 (24.0%) | $35,868 |
| 45 to 64 Years | 1,071 (32.6%) | $39,048 |
| 65+ Years | 1,283 (39.1%) | $17,190 |
| Total | 3,284 (100.0%) | $26,951 |
Poverty in Roma
Income Below Poverty by Sex and Age in Roma
With 31.1% poverty level for males and 35.9% for females among the residents of Roma, 6 to 11 year old males and 12 to 14 year old females are the most vulnerable to poverty, with 290 males (60.0%) and 206 females (66.0%) in their respective age groups living below the poverty level.
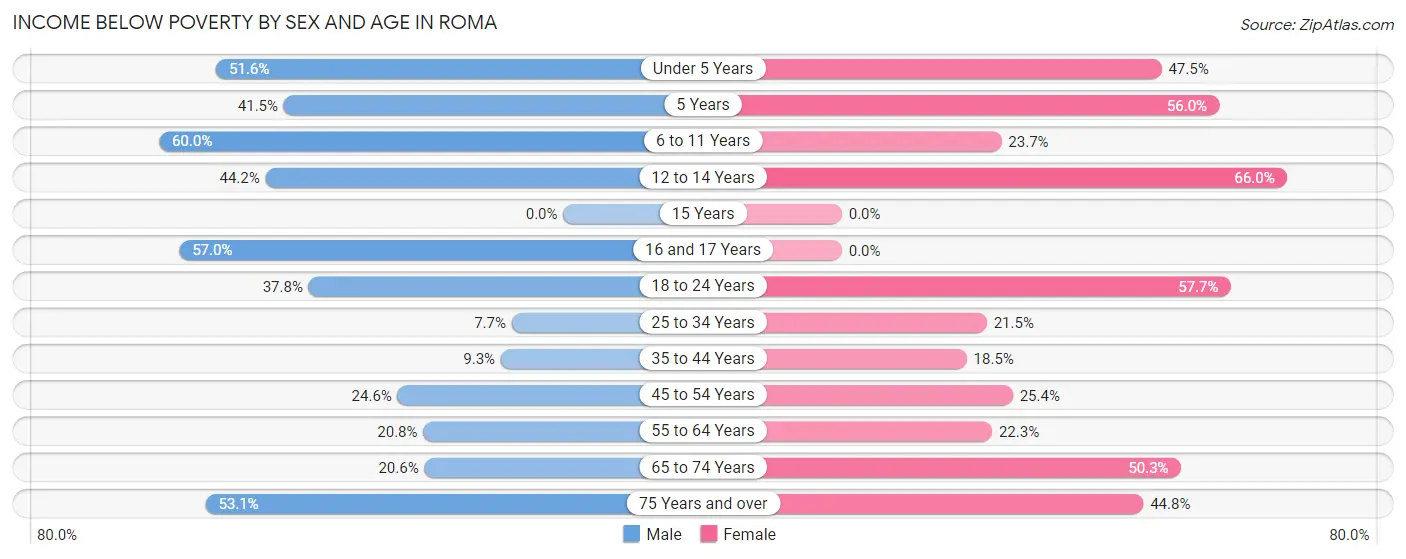
| Age Bracket | Male | Female |
| Under 5 Years | 262 (51.6%) | 451 (47.5%) |
| 5 Years | 61 (41.5%) | 42 (56.0%) |
| 6 to 11 Years | 290 (60.0%) | 137 (23.7%) |
| 12 to 14 Years | 134 (44.2%) | 206 (66.0%) |
| 15 Years | 0 (0.0%) | 0 (0.0%) |
| 16 and 17 Years | 162 (57.0%) | 0 (0.0%) |
| 18 to 24 Years | 228 (37.8%) | 240 (57.7%) |
| 25 to 34 Years | 79 (7.6%) | 176 (21.5%) |
| 35 to 44 Years | 43 (9.3%) | 84 (18.5%) |
| 45 to 54 Years | 123 (24.6%) | 133 (25.4%) |
| 55 to 64 Years | 74 (20.8%) | 155 (22.3%) |
| 65 to 74 Years | 86 (20.6%) | 355 (50.3%) |
| 75 Years and over | 127 (53.1%) | 235 (44.8%) |
| Total | 1,669 (31.1%) | 2,214 (35.9%) |
Income Above Poverty by Sex and Age in Roma
According to the poverty statistics in Roma, males aged 15 years and females aged 15 years are the age groups that are most secure financially, with 100.0% of males and 100.0% of females in these age groups living above the poverty line.
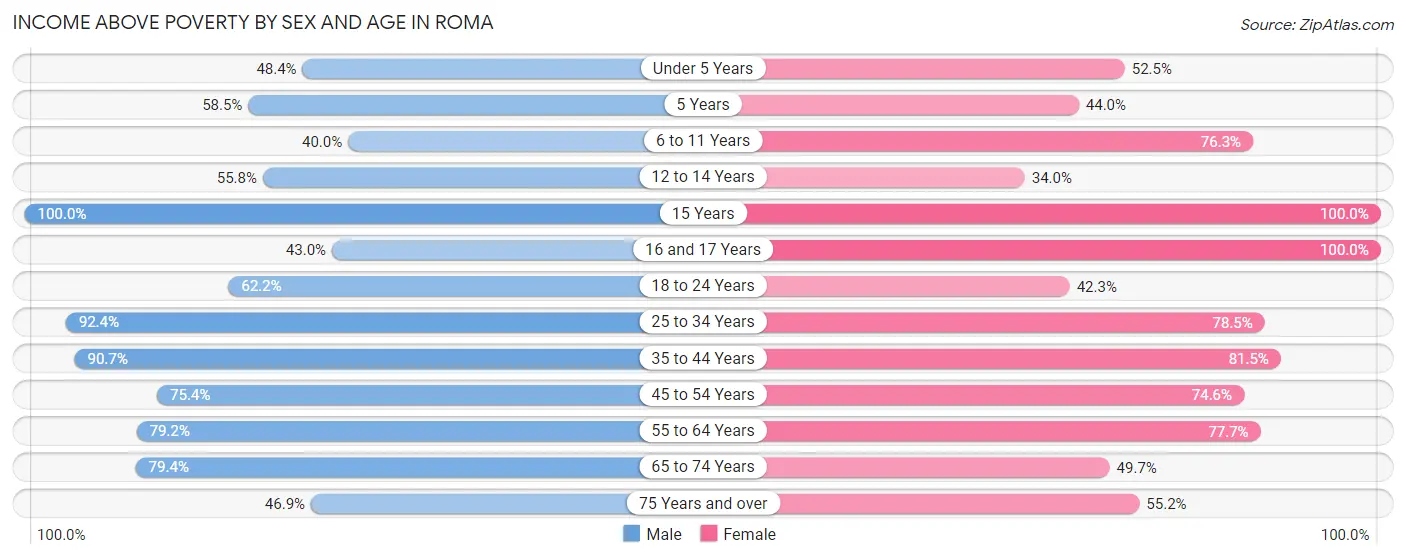
| Age Bracket | Male | Female |
| Under 5 Years | 246 (48.4%) | 499 (52.5%) |
| 5 Years | 86 (58.5%) | 33 (44.0%) |
| 6 to 11 Years | 193 (40.0%) | 441 (76.3%) |
| 12 to 14 Years | 169 (55.8%) | 106 (34.0%) |
| 15 Years | 23 (100.0%) | 9 (100.0%) |
| 16 and 17 Years | 122 (43.0%) | 110 (100.0%) |
| 18 to 24 Years | 375 (62.2%) | 176 (42.3%) |
| 25 to 34 Years | 954 (92.3%) | 642 (78.5%) |
| 35 to 44 Years | 421 (90.7%) | 369 (81.5%) |
| 45 to 54 Years | 377 (75.4%) | 391 (74.6%) |
| 55 to 64 Years | 282 (79.2%) | 540 (77.7%) |
| 65 to 74 Years | 331 (79.4%) | 351 (49.7%) |
| 75 Years and over | 112 (46.9%) | 290 (55.2%) |
| Total | 3,691 (68.9%) | 3,957 (64.1%) |
Income Below Poverty Among Married-Couple Families in Roma
The poverty statistics for married-couple families in Roma show that 28.0% or 374 of the total 1,334 families live below the poverty line. Families with 5 or more children have the highest poverty rate of 100.0%, comprising of 15 families. On the other hand, families with 3 or 4 children have the lowest poverty rate of 13.9%, which includes 15 families.
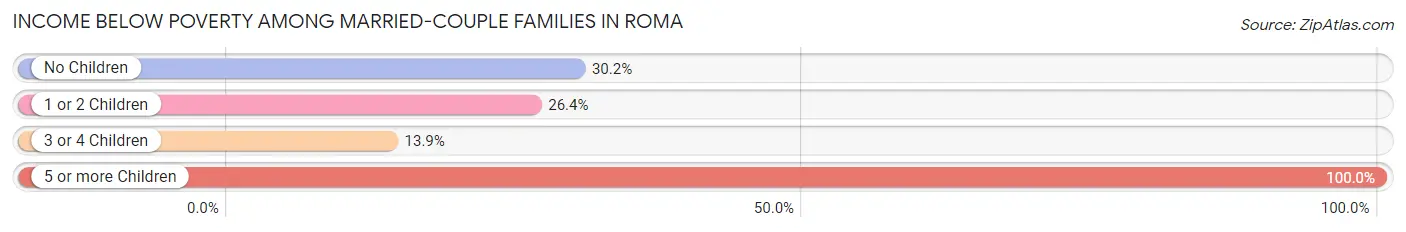
| Children | Above Poverty | Below Poverty |
| No Children | 446 (69.8%) | 193 (30.2%) |
| 1 or 2 Children | 421 (73.6%) | 151 (26.4%) |
| 3 or 4 Children | 93 (86.1%) | 15 (13.9%) |
| 5 or more Children | 0 (0.0%) | 15 (100.0%) |
| Total | 960 (72.0%) | 374 (28.0%) |
Income Below Poverty Among Single-Parent Households in Roma
According to the poverty data in Roma, 16.1% or 9 single-father households and 38.8% or 389 single-mother households are living below the poverty line. Among single-father households, those with 1 or 2 children have the highest poverty rate, with 9 households (100.0%) experiencing poverty. Likewise, among single-mother households, those with 3 or 4 children have the highest poverty rate, with 85 households (60.3%) falling below the poverty line.
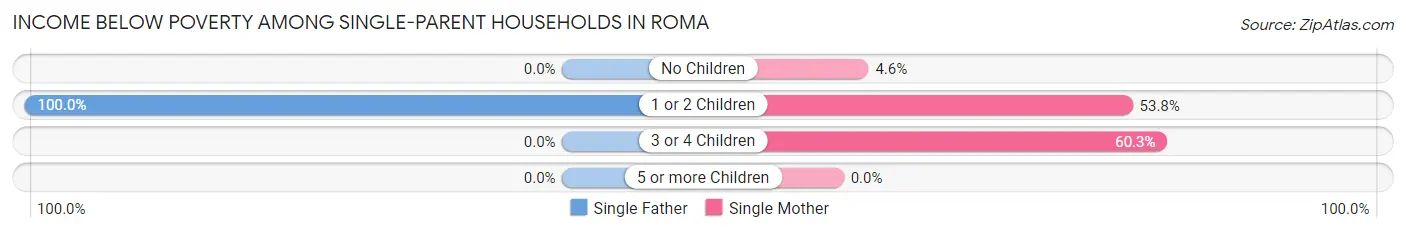
| Children | Single Father | Single Mother |
| No Children | 0 (0.0%) | 15 (4.6%) |
| 1 or 2 Children | 9 (100.0%) | 289 (53.8%) |
| 3 or 4 Children | 0 (0.0%) | 85 (60.3%) |
| 5 or more Children | 0 (0.0%) | 0 (0.0%) |
| Total | 9 (16.1%) | 389 (38.8%) |
Income Below Poverty Among Married-Couple vs Single-Parent Households in Roma
The poverty data for Roma shows that 374 of the married-couple family households (28.0%) and 398 of the single-parent households (37.6%) are living below the poverty level. Within the married-couple family households, those with 5 or more children have the highest poverty rate, with 15 households (100.0%) falling below the poverty line. Among the single-parent households, those with 3 or 4 children have the highest poverty rate, with 85 household (60.3%) living below poverty.
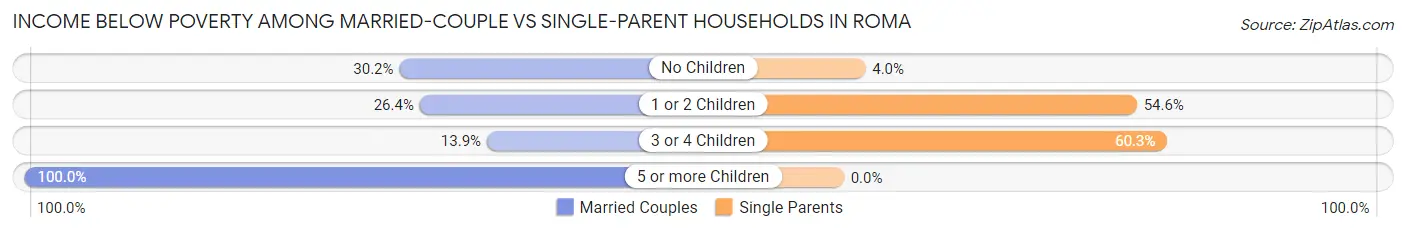
| Children | Married-Couple Families | Single-Parent Households |
| No Children | 193 (30.2%) | 15 (4.0%) |
| 1 or 2 Children | 151 (26.4%) | 298 (54.6%) |
| 3 or 4 Children | 15 (13.9%) | 85 (60.3%) |
| 5 or more Children | 15 (100.0%) | 0 (0.0%) |
| Total | 374 (28.0%) | 398 (37.6%) |
Race in Roma
The most populous races in Roma are Hispanic or Latino (11,331 | 98.3%), White / Caucasian (6,265 | 54.3%), and Two or more Races (4,461 | 38.7%).
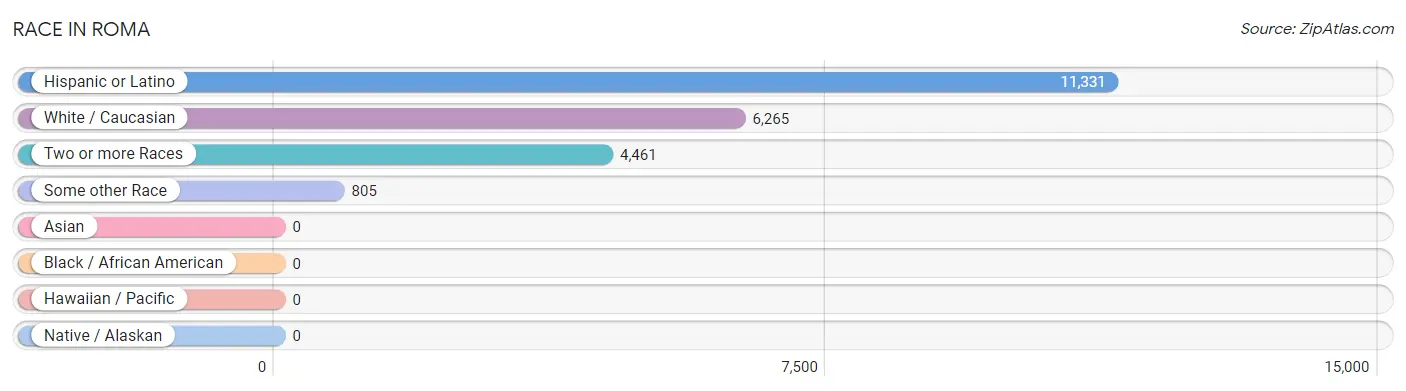
| Race | # Population | % Population |
| Asian | 0 | 0.0% |
| Black / African American | 0 | 0.0% |
| Hawaiian / Pacific | 0 | 0.0% |
| Hispanic or Latino | 11,331 | 98.3% |
| Native / Alaskan | 0 | 0.0% |
| White / Caucasian | 6,265 | 54.3% |
| Two or more Races | 4,461 | 38.7% |
| Some other Race | 805 | 7.0% |
| Total | 11,531 | 100.0% |
Ancestry in Roma
The most populous ancestries reported in Roma are Mexican (10,745 | 93.2%), French (14 | 0.1%), and American (13 | 0.1%), together accounting for 93.4% of all Roma residents.
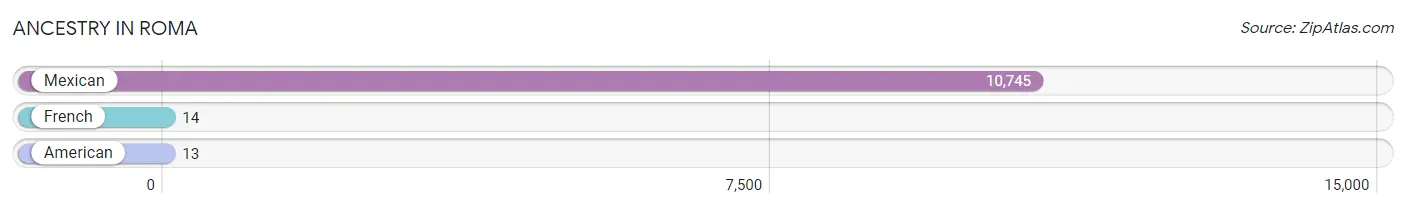
| Ancestry | # Population | % Population |
| American | 13 | 0.1% |
| French | 14 | 0.1% |
| Mexican | 10,745 | 93.2% | View All 3 Rows |
Immigrants in Roma
The most numerous immigrant groups reported in Roma came from Central America (3,939 | 34.2%), Latin America (3,939 | 34.2%), and Mexico (3,939 | 34.2%), together accounting for 102.5% of all Roma residents.
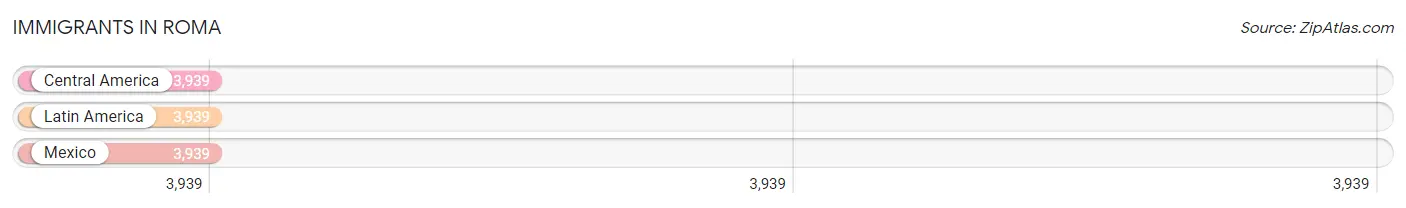
| Immigration Origin | # Population | % Population |
| Central America | 3,939 | 34.2% |
| Latin America | 3,939 | 34.2% |
| Mexico | 3,939 | 34.2% | View All 3 Rows |
Sex and Age in Roma
Sex and Age in Roma
The most populous age groups in Roma are 30 to 34 Years (586 | 10.9%) for men and Under 5 Years (950 | 15.4%) for women.
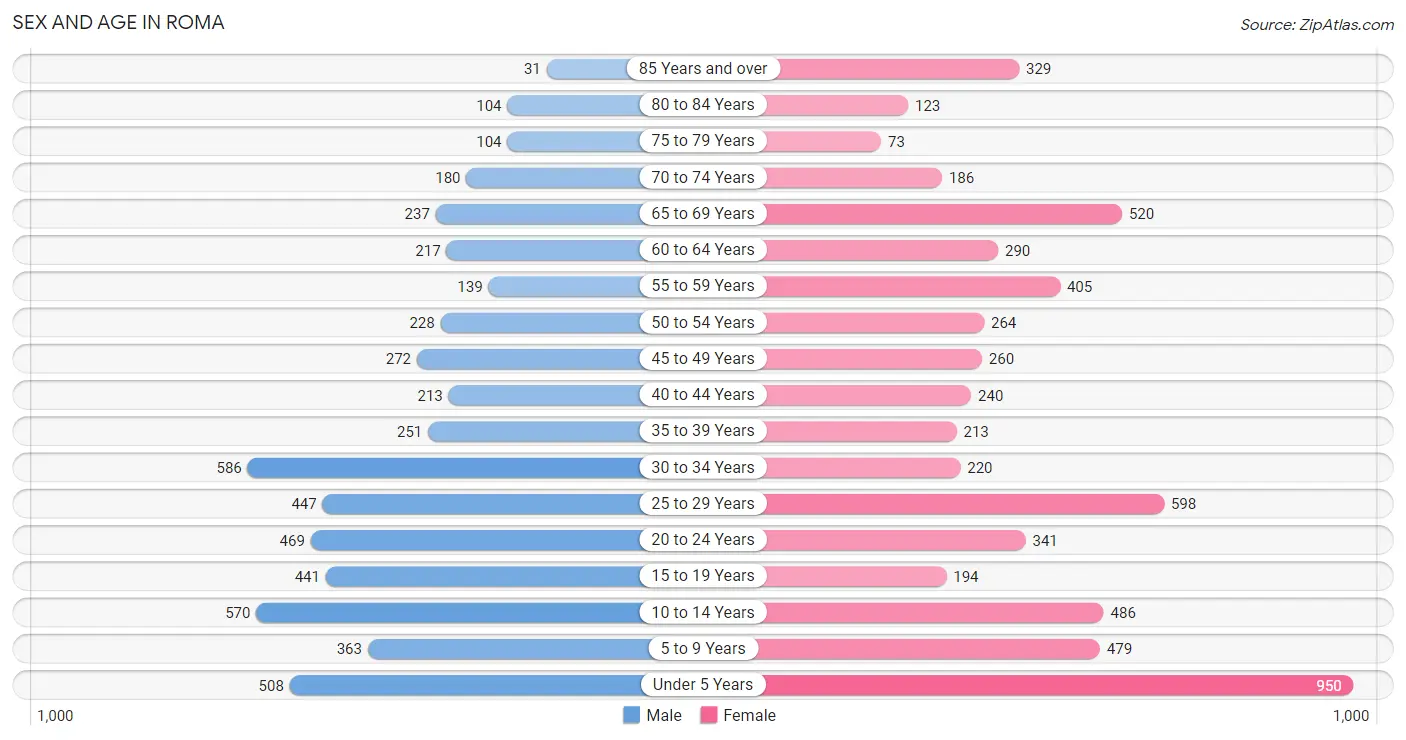
| Age Bracket | Male | Female |
| Under 5 Years | 508 (9.5%) | 950 (15.4%) |
| 5 to 9 Years | 363 (6.8%) | 479 (7.8%) |
| 10 to 14 Years | 570 (10.6%) | 486 (7.9%) |
| 15 to 19 Years | 441 (8.2%) | 194 (3.1%) |
| 20 to 24 Years | 469 (8.7%) | 341 (5.5%) |
| 25 to 29 Years | 447 (8.3%) | 598 (9.7%) |
| 30 to 34 Years | 586 (10.9%) | 220 (3.6%) |
| 35 to 39 Years | 251 (4.7%) | 213 (3.5%) |
| 40 to 44 Years | 213 (4.0%) | 240 (3.9%) |
| 45 to 49 Years | 272 (5.1%) | 260 (4.2%) |
| 50 to 54 Years | 228 (4.3%) | 264 (4.3%) |
| 55 to 59 Years | 139 (2.6%) | 405 (6.6%) |
| 60 to 64 Years | 217 (4.1%) | 290 (4.7%) |
| 65 to 69 Years | 237 (4.4%) | 520 (8.4%) |
| 70 to 74 Years | 180 (3.4%) | 186 (3.0%) |
| 75 to 79 Years | 104 (1.9%) | 73 (1.2%) |
| 80 to 84 Years | 104 (1.9%) | 123 (2.0%) |
| 85 Years and over | 31 (0.6%) | 329 (5.3%) |
| Total | 5,360 (100.0%) | 6,171 (100.0%) |
Families and Households in Roma
Median Family Size in Roma
The median family size in Roma is 4.40 persons per family, with married-couple families (1,334 | 55.7%) accounting for the largest median family size of 4.84 persons per family. On the other hand, single male/father families (56 | 2.3%) represent the smallest median family size with 3.07 persons per family.
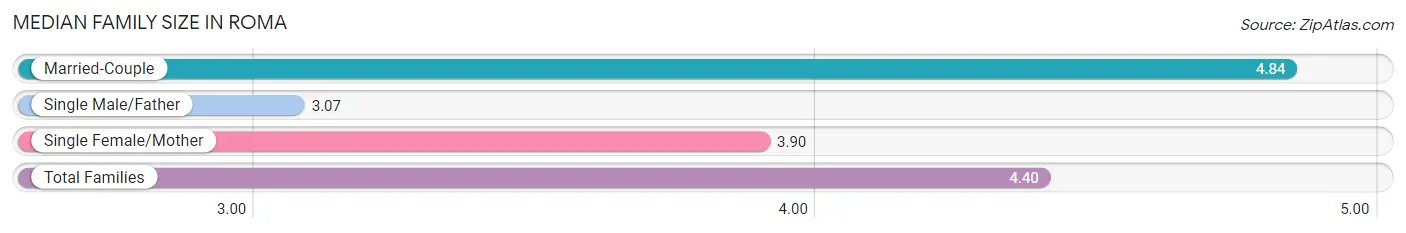
| Family Type | # Families | Family Size |
| Married-Couple | 1,334 (55.7%) | 4.84 |
| Single Male/Father | 56 (2.3%) | 3.07 |
| Single Female/Mother | 1,003 (41.9%) | 3.90 |
| Total Families | 2,393 (100.0%) | 4.40 |
Median Household Size in Roma
The median household size in Roma is 3.51 persons per household, with married-couple households (1,334 | 40.6%) accounting for the largest median household size of 4.84 persons per household. non-family households (891 | 27.1%) represent the smallest median household size with 1.04 persons per household.
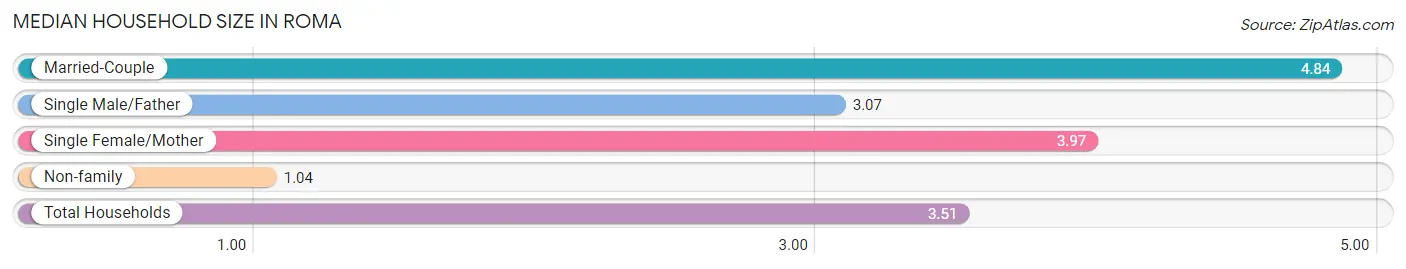
| Household Type | # Households | Household Size |
| Married-Couple | 1,334 (40.6%) | 4.84 |
| Single Male/Father | 56 (1.7%) | 3.07 |
| Single Female/Mother | 1,003 (30.5%) | 3.97 |
| Non-family | 891 (27.1%) | 1.04 |
| Total Households | 3,284 (100.0%) | 3.51 |
Household Size by Marriage Status in Roma
Out of a total of 3,284 households in Roma, 2,393 (72.9%) are family households, while 891 (27.1%) are nonfamily households. The most numerous type of family households are 2-person households, comprising 775, and the most common type of nonfamily households are 1-person households, comprising 850.
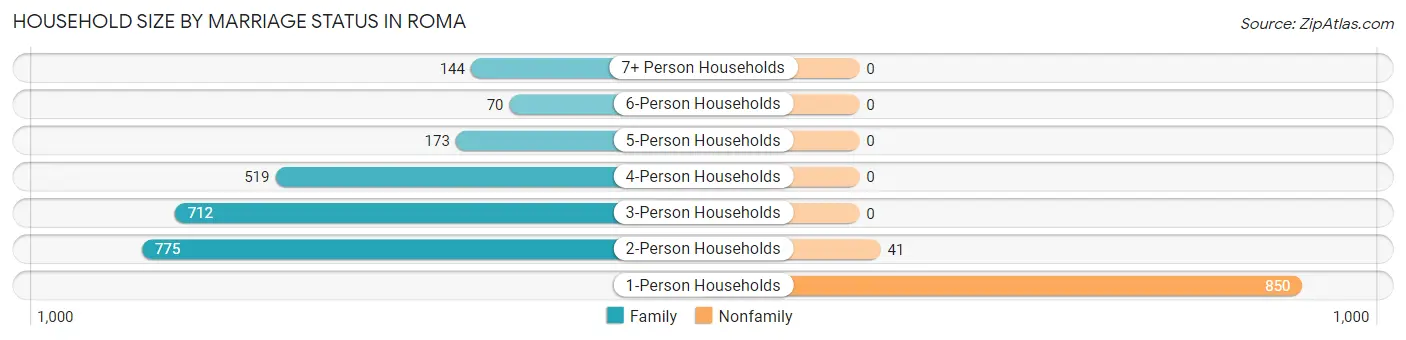
| Household Size | Family Households | Nonfamily Households |
| 1-Person Households | - | 850 (25.9%) |
| 2-Person Households | 775 (23.6%) | 41 (1.3%) |
| 3-Person Households | 712 (21.7%) | 0 (0.0%) |
| 4-Person Households | 519 (15.8%) | 0 (0.0%) |
| 5-Person Households | 173 (5.3%) | 0 (0.0%) |
| 6-Person Households | 70 (2.1%) | 0 (0.0%) |
| 7+ Person Households | 144 (4.4%) | 0 (0.0%) |
| Total | 2,393 (72.9%) | 891 (27.1%) |
Female Fertility in Roma
Fertility by Age in Roma
Average fertility rate in Roma is 127.0 births per 1,000 women. Women in the age bracket of 15 to 19 years have the highest fertility rate with 278.0 births per 1,000 women. Women in the age bracket of 20 to 34 years acount for 80.1% of all women with births.
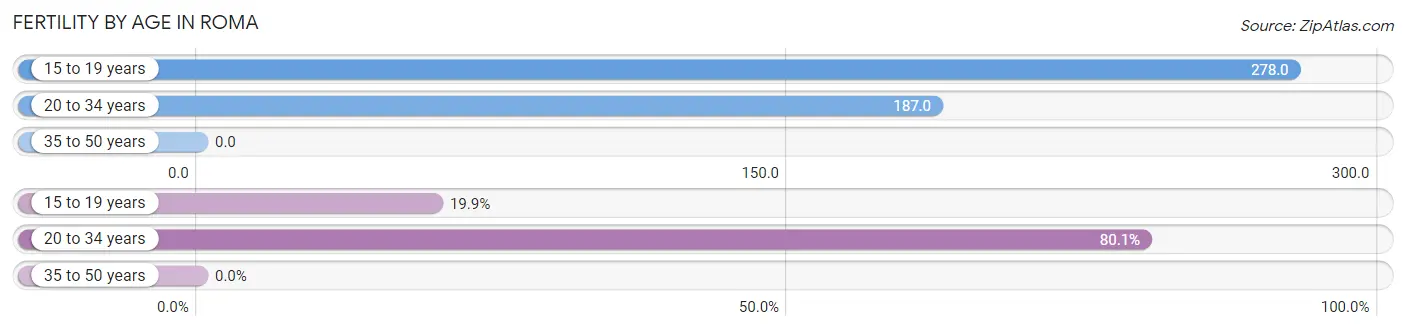
| Age Bracket | Women with Births | Births / 1,000 Women |
| 15 to 19 years | 54 (19.9%) | 278.0 |
| 20 to 34 years | 217 (80.1%) | 187.0 |
| 35 to 50 years | 0 (0.0%) | 0.0 |
| Total | 271 (100.0%) | 127.0 |
Fertility by Age by Marriage Status in Roma
55.4% of women with births (271) in Roma are married. The highest percentage of unmarried women with births falls into 20 to 34 years age bracket with 55.8% of them unmarried at the time of birth, while the lowest percentage of unmarried women with births belong to 15 to 19 years age bracket with 0.0% of them unmarried.
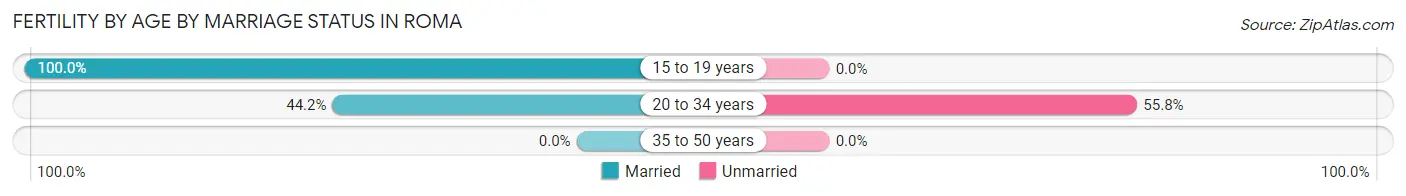
| Age Bracket | Married | Unmarried |
| 15 to 19 years | 54 (100.0%) | 0 (0.0%) |
| 20 to 34 years | 96 (44.2%) | 121 (55.8%) |
| 35 to 50 years | 0 (0.0%) | 0 (0.0%) |
| Total | 150 (55.3%) | 121 (44.7%) |
Fertility by Education in Roma
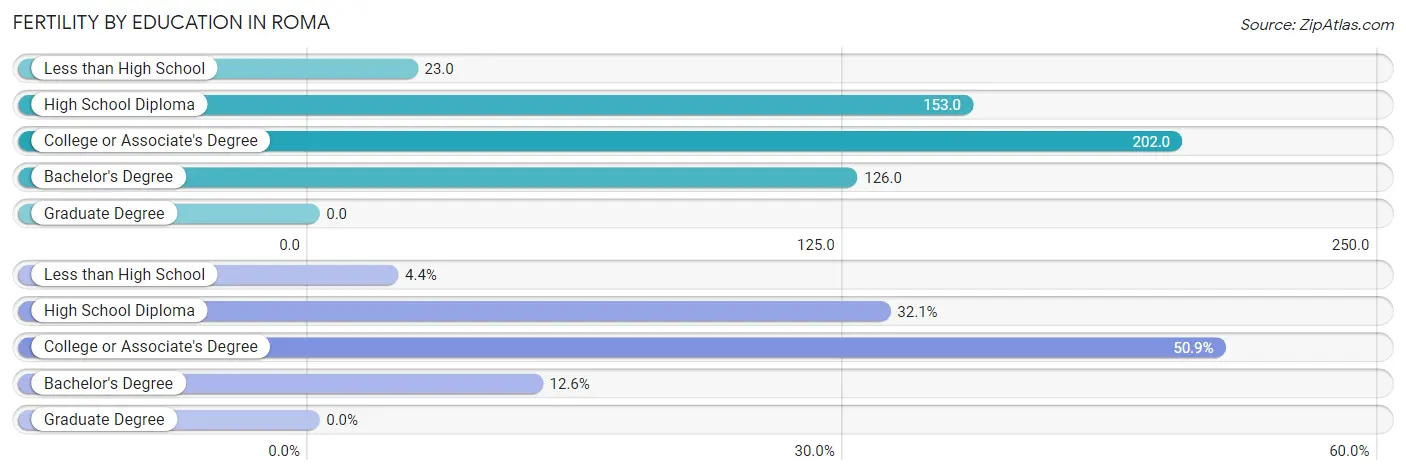
| Educational Attainment | Women with Births | Births / 1,000 Women |
| Less than High School | 12 (4.4%) | 23.0 |
| High School Diploma | 87 (32.1%) | 153.0 |
| College or Associate's Degree | 138 (50.9%) | 202.0 |
| Bachelor's Degree | 34 (12.6%) | 126.0 |
| Graduate Degree | 0 (0.0%) | 0.0 |
| Total | 271 (100.0%) | 127.0 |
Fertility by Education by Marriage Status in Roma
44.7% of women with births in Roma are unmarried. Women with the educational attainment of less than high school are most likely to be married with 100.0% of them married at childbirth, while women with the educational attainment of high school diploma are least likely to be married with 100.0% of them unmarried at childbirth.
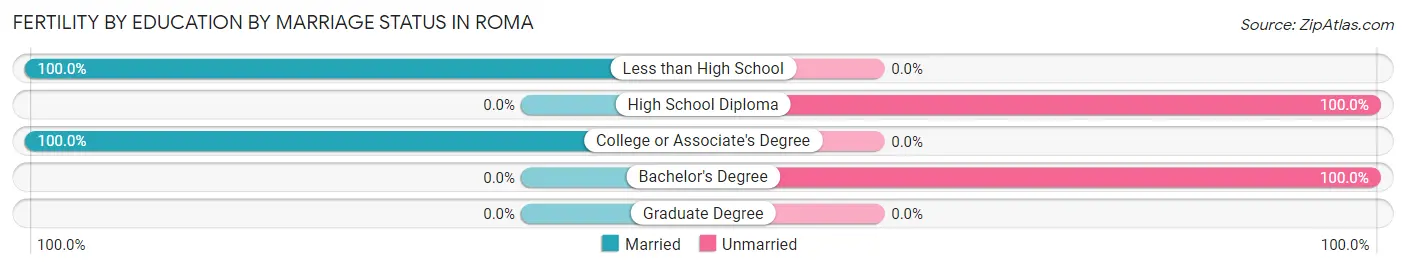
| Educational Attainment | Married | Unmarried |
| Less than High School | 12 (100.0%) | 0 (0.0%) |
| High School Diploma | 0 (0.0%) | 87 (100.0%) |
| College or Associate's Degree | 138 (100.0%) | 0 (0.0%) |
| Bachelor's Degree | 0 (0.0%) | 34 (100.0%) |
| Graduate Degree | 0 (0.0%) | 0 (0.0%) |
| Total | 150 (55.3%) | 121 (44.7%) |
Employment Characteristics in Roma
Employment by Class of Employer in Roma
Among the 3,855 employed individuals in Roma, private company employees (2,307 | 59.8%), local government employees (731 | 19.0%), and state government employees (384 | 10.0%) make up the most common classes of employment.
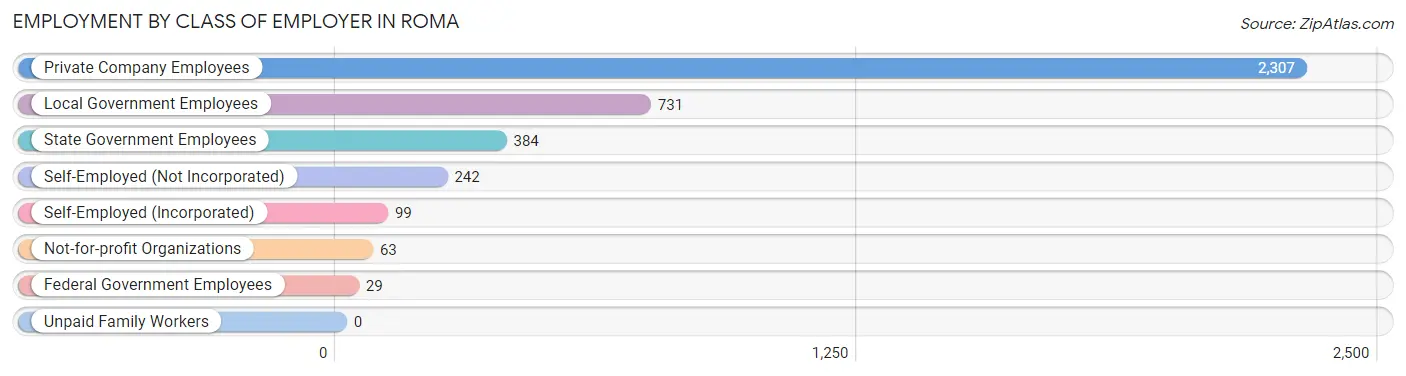
| Employer Class | # Employees | % Employees |
| Private Company Employees | 2,307 | 59.8% |
| Self-Employed (Incorporated) | 99 | 2.6% |
| Self-Employed (Not Incorporated) | 242 | 6.3% |
| Not-for-profit Organizations | 63 | 1.6% |
| Local Government Employees | 731 | 19.0% |
| State Government Employees | 384 | 10.0% |
| Federal Government Employees | 29 | 0.7% |
| Unpaid Family Workers | 0 | 0.0% |
| Total | 3,855 | 100.0% |
Employment Status by Age in Roma
According to the labor force statistics for Roma, out of the total population over 16 years of age (8,143), 55.0% or 4,479 individuals are in the labor force, with 14.0% or 627 of them unemployed. The age group with the highest labor force participation rate is 35 to 44 years, with 96.5% or 885 individuals in the labor force. Within the labor force, the 20 to 24 years age range has the highest percentage of unemployed individuals, with 30.5% or 205 of them being unemployed.
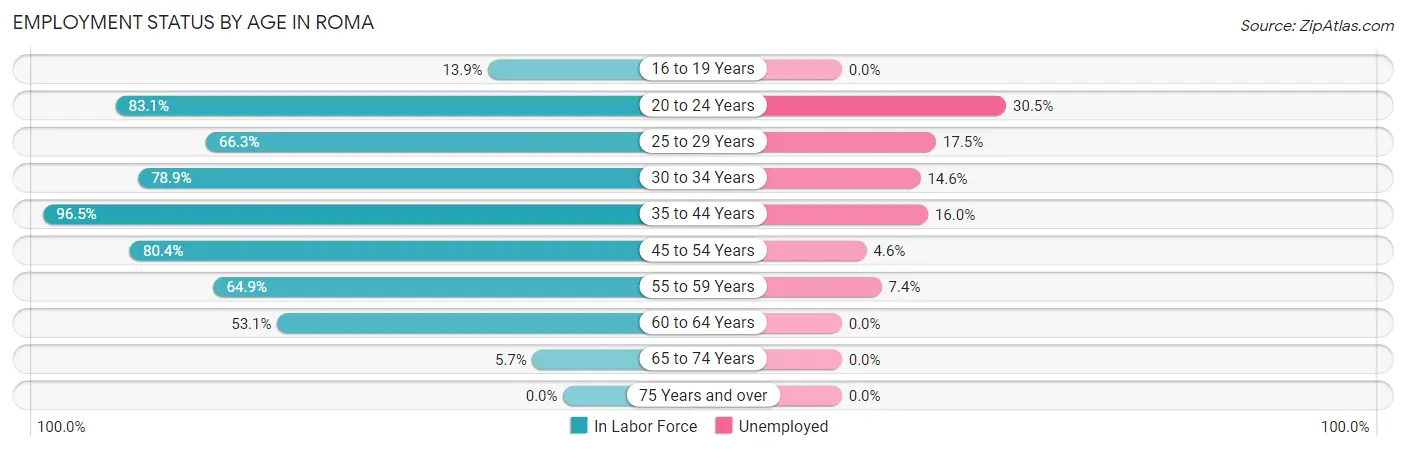
| Age Bracket | In Labor Force | Unemployed |
| 16 to 19 Years | 84 (13.9%) | 0 (0.0%) |
| 20 to 24 Years | 673 (83.1%) | 205 (30.5%) |
| 25 to 29 Years | 693 (66.3%) | 121 (17.5%) |
| 30 to 34 Years | 636 (78.9%) | 93 (14.6%) |
| 35 to 44 Years | 885 (96.5%) | 142 (16.0%) |
| 45 to 54 Years | 823 (80.4%) | 38 (4.6%) |
| 55 to 59 Years | 353 (64.9%) | 26 (7.4%) |
| 60 to 64 Years | 269 (53.1%) | 0 (0.0%) |
| 65 to 74 Years | 64 (5.7%) | 0 (0.0%) |
| 75 Years and over | 0 (0.0%) | 0 (0.0%) |
| Total | 4,479 (55.0%) | 627 (14.0%) |
Employment Status by Educational Attainment in Roma
According to labor force statistics for Roma, 75.6% of individuals (3,661) out of the total population between 25 and 64 years of age (4,843) are in the labor force, with 11.5% or 421 of them being unemployed. The group with the highest labor force participation rate are those with the educational attainment of bachelor's degree or higher, with 86.7% or 741 individuals in the labor force. Within the labor force, individuals with high school diploma education have the highest percentage of unemployment, with 23.5% or 274 of them being unemployed.
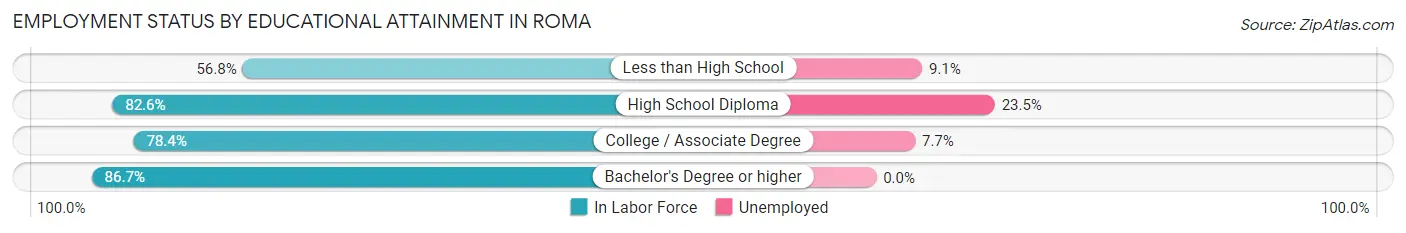
| Educational Attainment | In Labor Force | Unemployed |
| Less than High School | 703 (56.8%) | 113 (9.1%) |
| High School Diploma | 1,168 (82.6%) | 332 (23.5%) |
| College / Associate Degree | 1,047 (78.4%) | 103 (7.7%) |
| Bachelor's Degree or higher | 741 (86.7%) | 0 (0.0%) |
| Total | 3,661 (75.6%) | 557 (11.5%) |
Employment Occupations by Sex in Roma
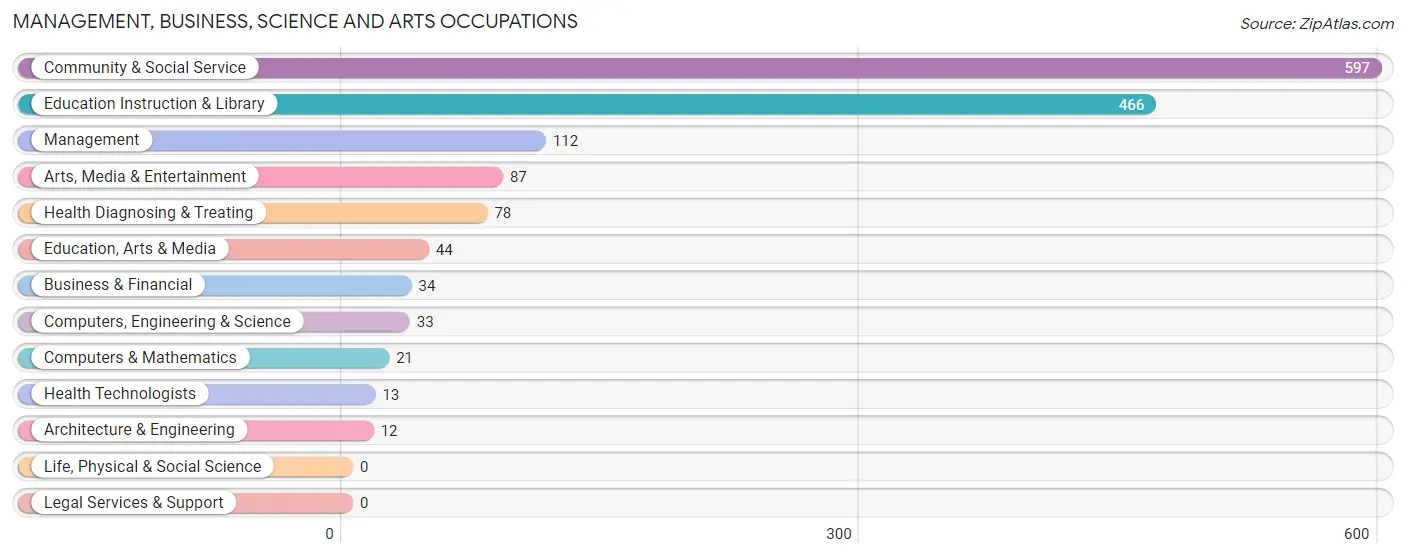
Management, Business, Science and Arts Occupations
The most common Management, Business, Science and Arts occupations in Roma are Community & Social Service (597 | 15.5%), Education Instruction & Library (466 | 12.1%), Management (112 | 2.9%), Arts, Media & Entertainment (87 | 2.3%), and Health Diagnosing & Treating (78 | 2.0%).
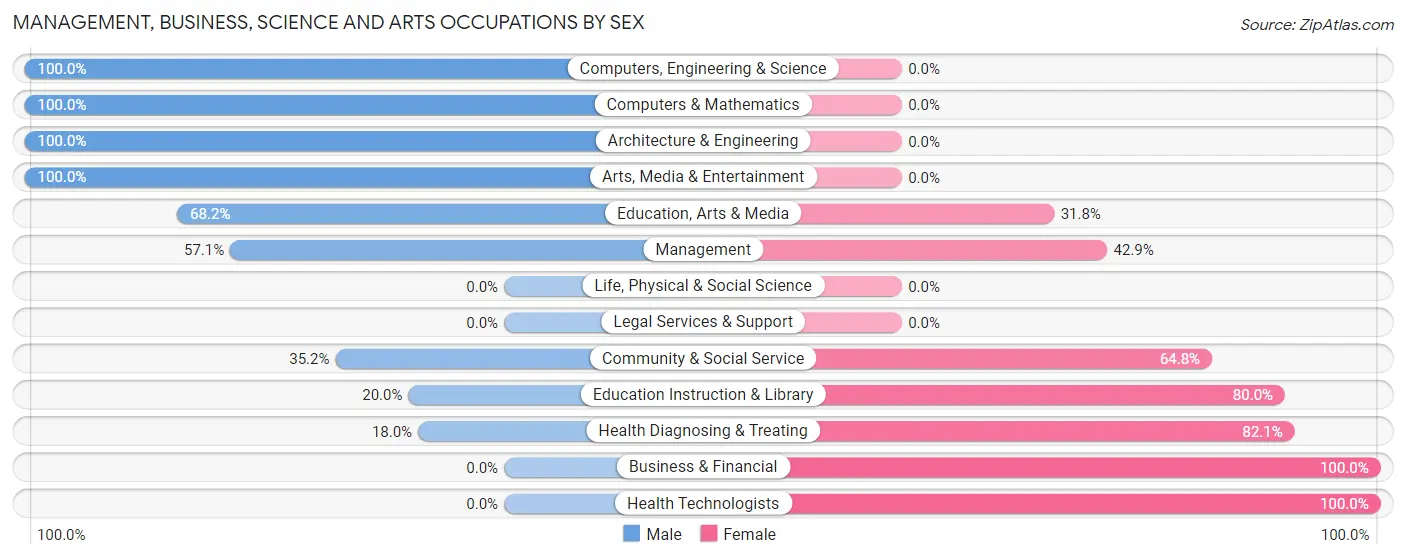
Management, Business, Science and Arts Occupations by Sex
Within the Management, Business, Science and Arts occupations in Roma, the most male-oriented occupations are Computers, Engineering & Science (100.0%), Computers & Mathematics (100.0%), and Architecture & Engineering (100.0%), while the most female-oriented occupations are Business & Financial (100.0%), Health Technologists (100.0%), and Health Diagnosing & Treating (82.1%).
| Occupation | Male | Female |
| Management | 64 (57.1%) | 48 (42.9%) |
| Business & Financial | 0 (0.0%) | 34 (100.0%) |
| Computers, Engineering & Science | 33 (100.0%) | 0 (0.0%) |
| Computers & Mathematics | 21 (100.0%) | 0 (0.0%) |
| Architecture & Engineering | 12 (100.0%) | 0 (0.0%) |
| Life, Physical & Social Science | 0 (0.0%) | 0 (0.0%) |
| Community & Social Service | 210 (35.2%) | 387 (64.8%) |
| Education, Arts & Media | 30 (68.2%) | 14 (31.8%) |
| Legal Services & Support | 0 (0.0%) | 0 (0.0%) |
| Education Instruction & Library | 93 (20.0%) | 373 (80.0%) |
| Arts, Media & Entertainment | 87 (100.0%) | 0 (0.0%) |
| Health Diagnosing & Treating | 14 (17.9%) | 64 (82.1%) |
| Health Technologists | 0 (0.0%) | 13 (100.0%) |
| Total (Category) | 321 (37.6%) | 533 (62.4%) |
| Total (Overall) | 2,076 (53.8%) | 1,779 (46.2%) |
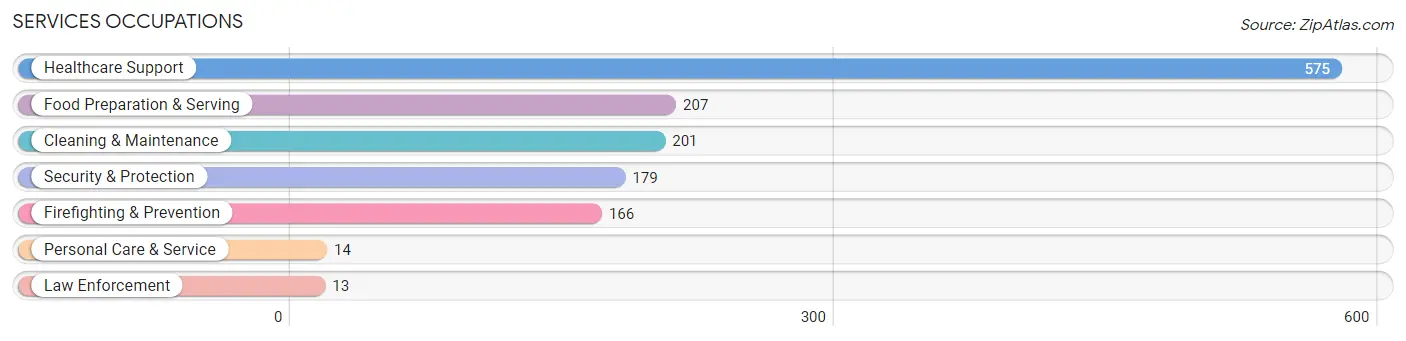
Services Occupations
The most common Services occupations in Roma are Healthcare Support (575 | 14.9%), Food Preparation & Serving (207 | 5.4%), Cleaning & Maintenance (201 | 5.2%), Security & Protection (179 | 4.6%), and Firefighting & Prevention (166 | 4.3%).
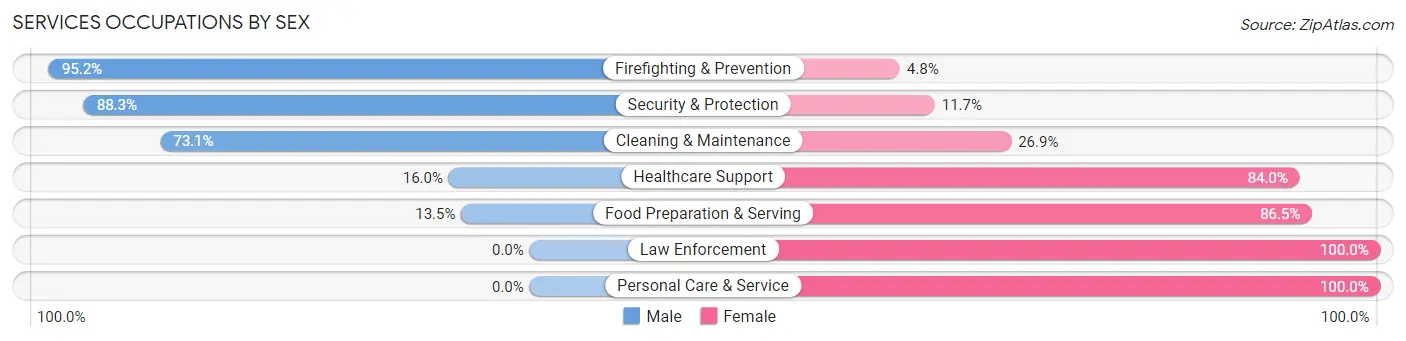
Services Occupations by Sex
Within the Services occupations in Roma, the most male-oriented occupations are Firefighting & Prevention (95.2%), Security & Protection (88.3%), and Cleaning & Maintenance (73.1%), while the most female-oriented occupations are Law Enforcement (100.0%), Personal Care & Service (100.0%), and Food Preparation & Serving (86.5%).
| Occupation | Male | Female |
| Healthcare Support | 92 (16.0%) | 483 (84.0%) |
| Security & Protection | 158 (88.3%) | 21 (11.7%) |
| Firefighting & Prevention | 158 (95.2%) | 8 (4.8%) |
| Law Enforcement | 0 (0.0%) | 13 (100.0%) |
| Food Preparation & Serving | 28 (13.5%) | 179 (86.5%) |
| Cleaning & Maintenance | 147 (73.1%) | 54 (26.9%) |
| Personal Care & Service | 0 (0.0%) | 14 (100.0%) |
| Total (Category) | 425 (36.1%) | 751 (63.9%) |
| Total (Overall) | 2,076 (53.8%) | 1,779 (46.2%) |
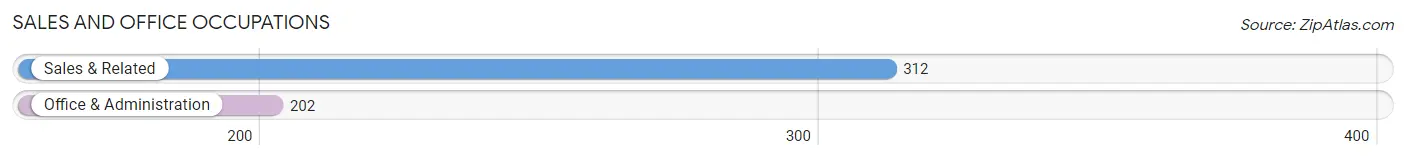
Sales and Office Occupations
The most common Sales and Office occupations in Roma are Sales & Related (312 | 8.1%), and Office & Administration (202 | 5.2%).
Sales and Office Occupations by Sex
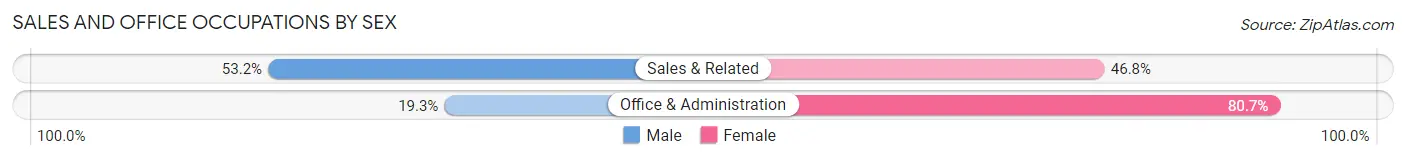
| Occupation | Male | Female |
| Sales & Related | 166 (53.2%) | 146 (46.8%) |
| Office & Administration | 39 (19.3%) | 163 (80.7%) |
| Total (Category) | 205 (39.9%) | 309 (60.1%) |
| Total (Overall) | 2,076 (53.8%) | 1,779 (46.2%) |
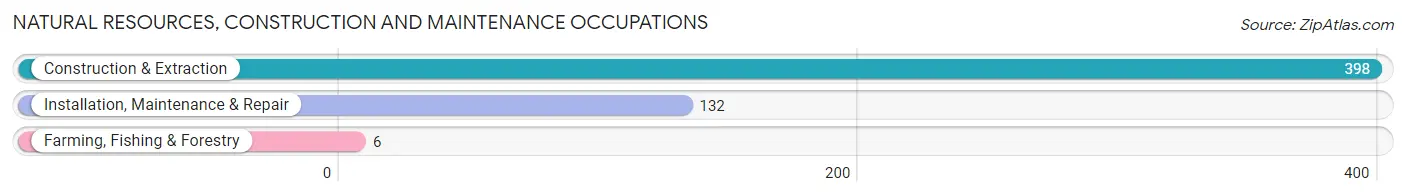
Natural Resources, Construction and Maintenance Occupations
The most common Natural Resources, Construction and Maintenance occupations in Roma are Construction & Extraction (398 | 10.3%), Installation, Maintenance & Repair (132 | 3.4%), and Farming, Fishing & Forestry (6 | 0.2%).
Natural Resources, Construction and Maintenance Occupations by Sex
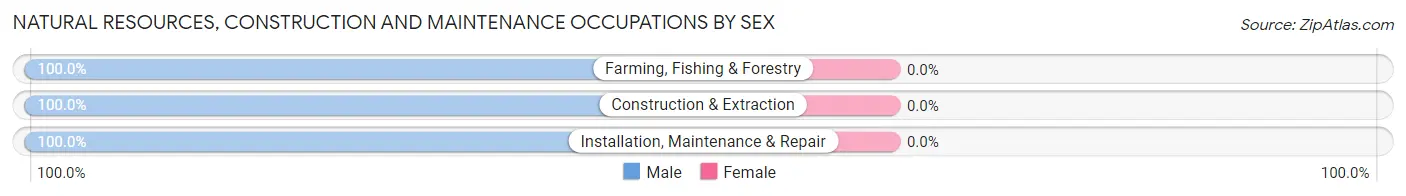
| Occupation | Male | Female |
| Farming, Fishing & Forestry | 6 (100.0%) | 0 (0.0%) |
| Construction & Extraction | 398 (100.0%) | 0 (0.0%) |
| Installation, Maintenance & Repair | 132 (100.0%) | 0 (0.0%) |
| Total (Category) | 536 (100.0%) | 0 (0.0%) |
| Total (Overall) | 2,076 (53.8%) | 1,779 (46.2%) |
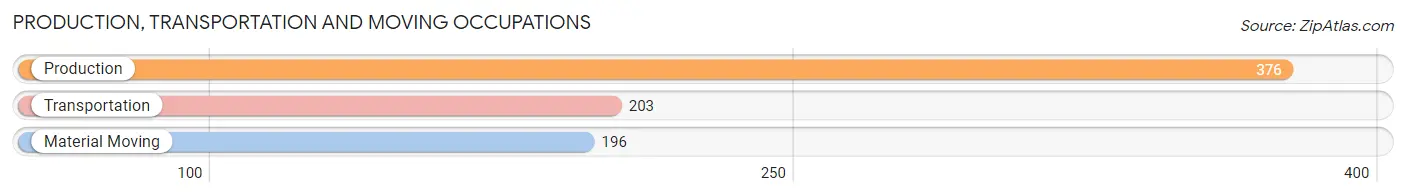
Production, Transportation and Moving Occupations
The most common Production, Transportation and Moving occupations in Roma are Production (376 | 9.8%), Transportation (203 | 5.3%), and Material Moving (196 | 5.1%).
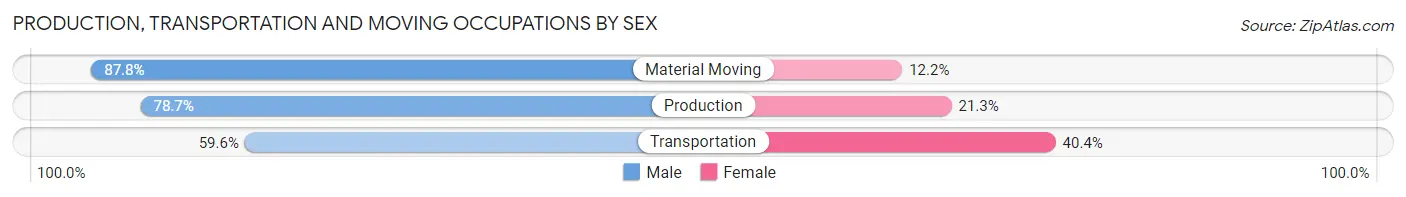
Production, Transportation and Moving Occupations by Sex
| Occupation | Male | Female |
| Production | 296 (78.7%) | 80 (21.3%) |
| Transportation | 121 (59.6%) | 82 (40.4%) |
| Material Moving | 172 (87.8%) | 24 (12.2%) |
| Total (Category) | 589 (76.0%) | 186 (24.0%) |
| Total (Overall) | 2,076 (53.8%) | 1,779 (46.2%) |
Employment Industries by Sex in Roma
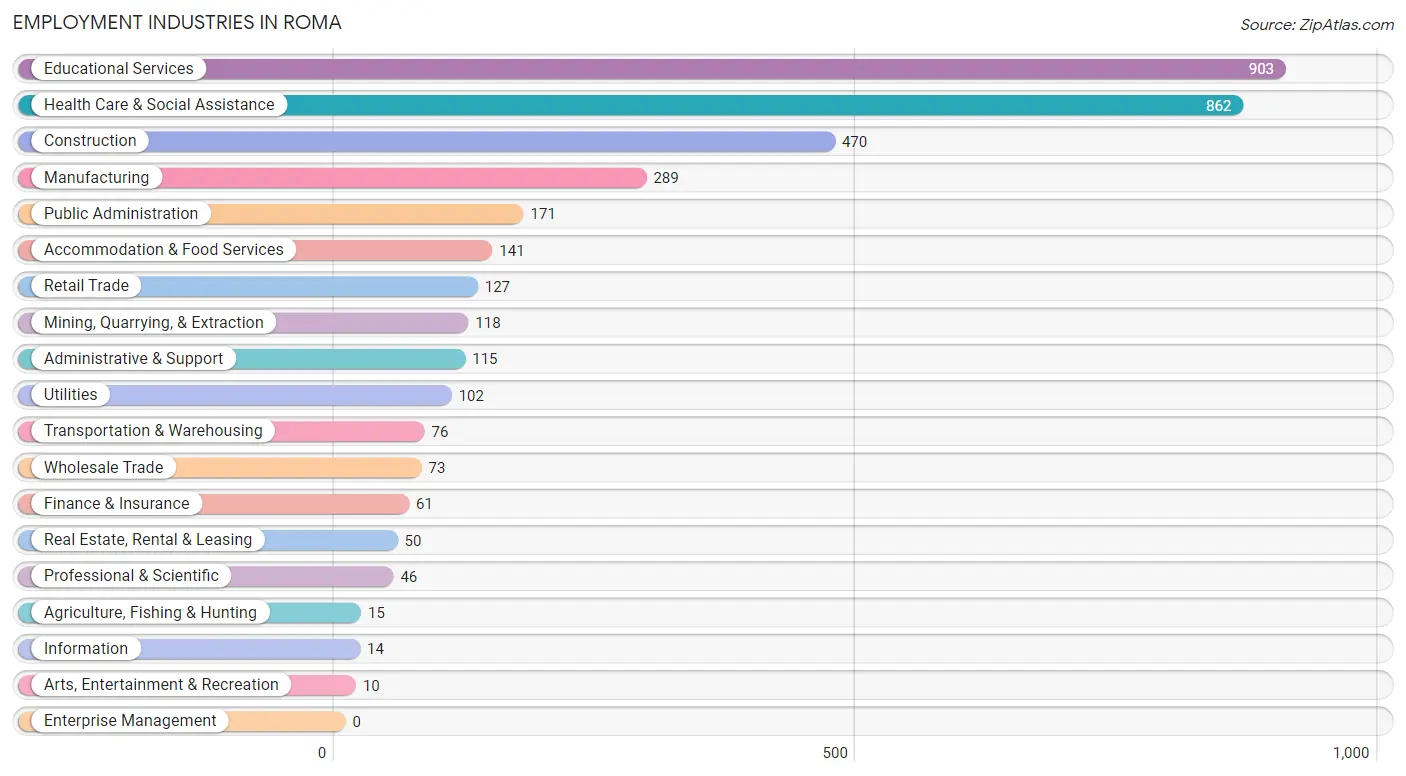
Employment Industries in Roma
The major employment industries in Roma include Educational Services (903 | 23.4%), Health Care & Social Assistance (862 | 22.4%), Construction (470 | 12.2%), Manufacturing (289 | 7.5%), and Public Administration (171 | 4.4%).
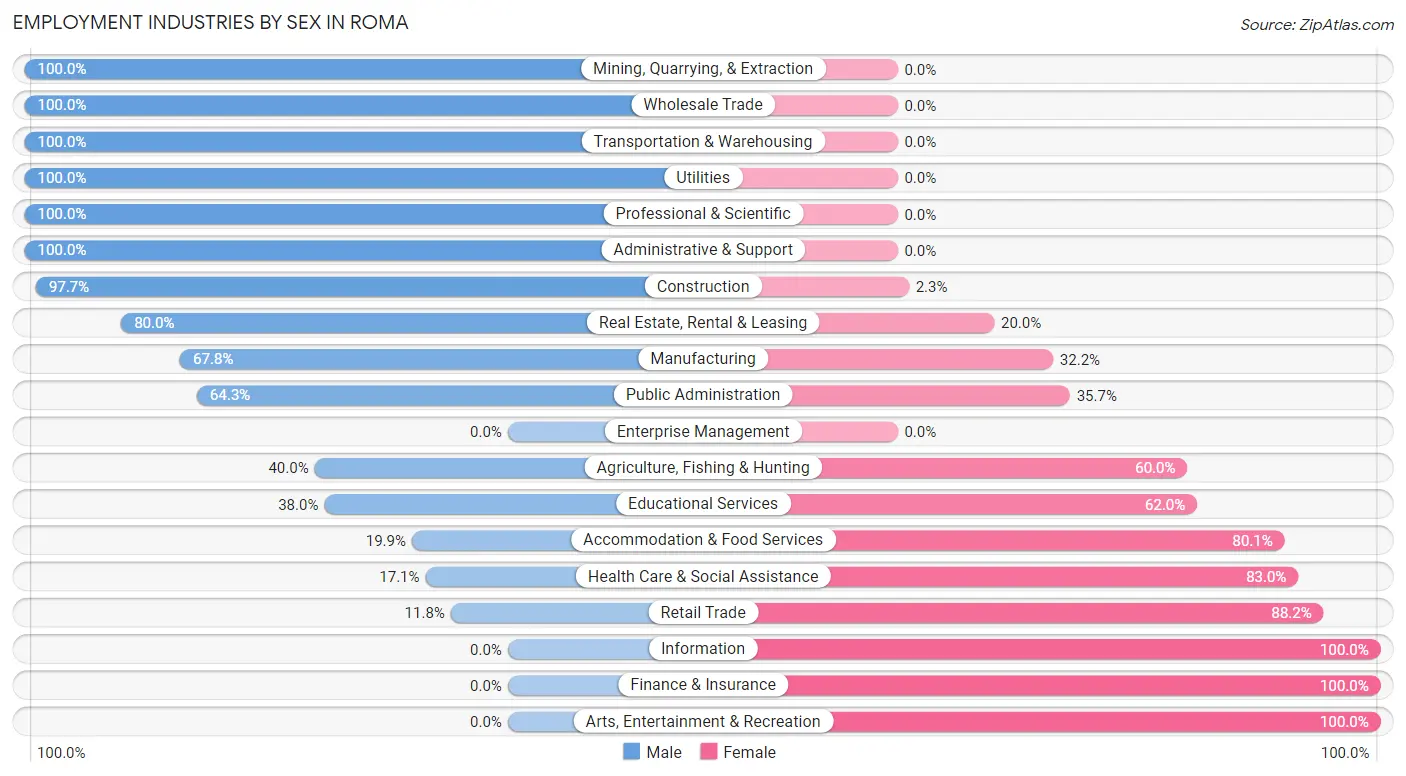
Employment Industries by Sex in Roma
The Roma industries that see more men than women are Mining, Quarrying, & Extraction (100.0%), Wholesale Trade (100.0%), and Transportation & Warehousing (100.0%), whereas the industries that tend to have a higher number of women are Information (100.0%), Finance & Insurance (100.0%), and Arts, Entertainment & Recreation (100.0%).
| Industry | Male | Female |
| Agriculture, Fishing & Hunting | 6 (40.0%) | 9 (60.0%) |
| Mining, Quarrying, & Extraction | 118 (100.0%) | 0 (0.0%) |
| Construction | 459 (97.7%) | 11 (2.3%) |
| Manufacturing | 196 (67.8%) | 93 (32.2%) |
| Wholesale Trade | 73 (100.0%) | 0 (0.0%) |
| Retail Trade | 15 (11.8%) | 112 (88.2%) |
| Transportation & Warehousing | 76 (100.0%) | 0 (0.0%) |
| Utilities | 102 (100.0%) | 0 (0.0%) |
| Information | 0 (0.0%) | 14 (100.0%) |
| Finance & Insurance | 0 (0.0%) | 61 (100.0%) |
| Real Estate, Rental & Leasing | 40 (80.0%) | 10 (20.0%) |
| Professional & Scientific | 46 (100.0%) | 0 (0.0%) |
| Enterprise Management | 0 (0.0%) | 0 (0.0%) |
| Administrative & Support | 115 (100.0%) | 0 (0.0%) |
| Educational Services | 343 (38.0%) | 560 (62.0%) |
| Health Care & Social Assistance | 147 (17.1%) | 715 (83.0%) |
| Arts, Entertainment & Recreation | 0 (0.0%) | 10 (100.0%) |
| Accommodation & Food Services | 28 (19.9%) | 113 (80.1%) |
| Public Administration | 110 (64.3%) | 61 (35.7%) |
| Total | 2,076 (53.8%) | 1,779 (46.2%) |
Education in Roma
School Enrollment in Roma
The most common levels of schooling among the 3,341 students in Roma are middle school (707 | 21.2%), high school (688 | 20.6%), and elementary school (677 | 20.3%).
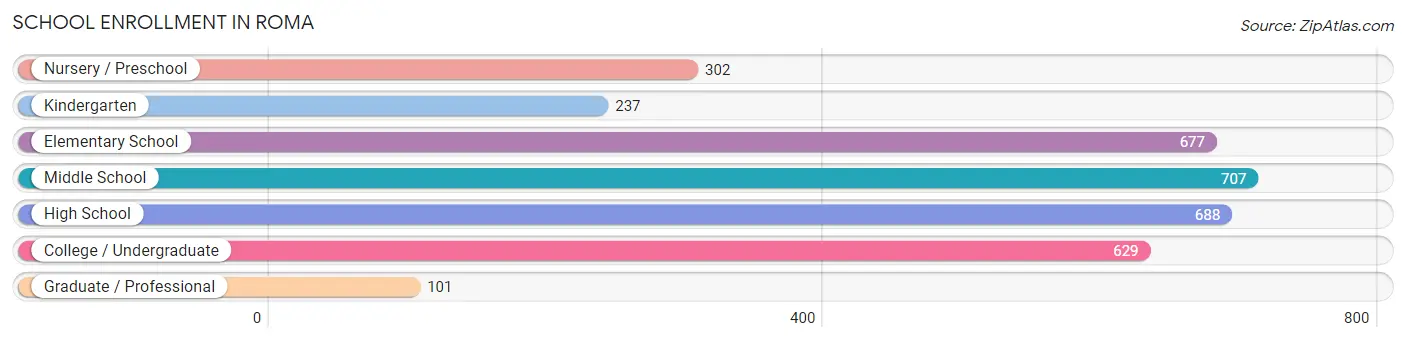
| School Level | # Students | % Students |
| Nursery / Preschool | 302 | 9.0% |
| Kindergarten | 237 | 7.1% |
| Elementary School | 677 | 20.3% |
| Middle School | 707 | 21.2% |
| High School | 688 | 20.6% |
| College / Undergraduate | 629 | 18.8% |
| Graduate / Professional | 101 | 3.0% |
| Total | 3,341 | 100.0% |
School Enrollment by Age by Funding Source in Roma
Out of a total of 3,341 students who are enrolled in schools in Roma, 90 (2.7%) attend a private institution, while the remaining 3,251 (97.3%) are enrolled in public schools. The age group of 3 to 4 year olds has the highest likelihood of being enrolled in private schools, with 90 (31.8% in the age bracket) enrolled. Conversely, the age group of 5 to 9 year old has the lowest likelihood of being enrolled in a private school, with 745 (100.0% in the age bracket) attending a public institution.
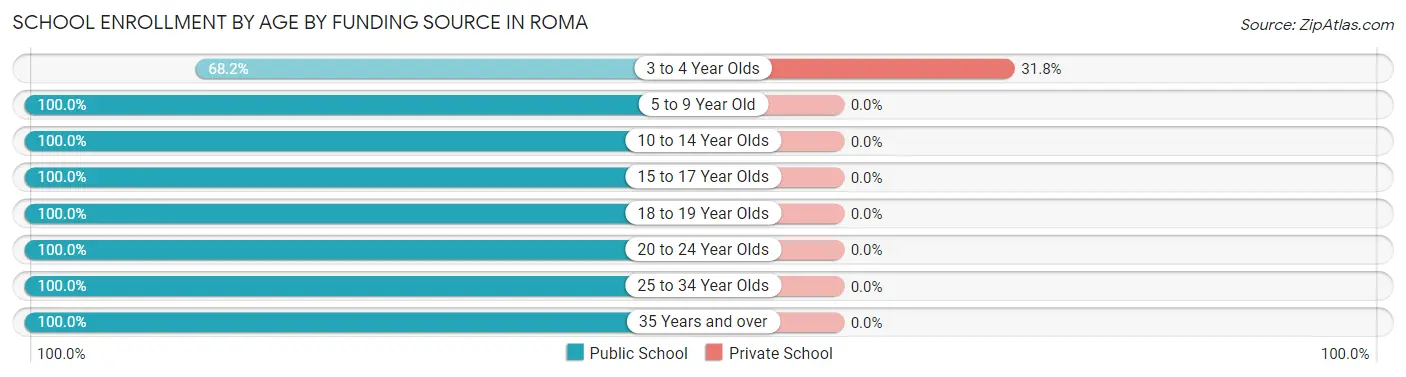
| Age Bracket | Public School | Private School |
| 3 to 4 Year Olds | 193 (68.2%) | 90 (31.8%) |
| 5 to 9 Year Old | 745 (100.0%) | 0 (0.0%) |
| 10 to 14 Year Olds | 1,056 (100.0%) | 0 (0.0%) |
| 15 to 17 Year Olds | 416 (100.0%) | 0 (0.0%) |
| 18 to 19 Year Olds | 185 (100.0%) | 0 (0.0%) |
| 20 to 24 Year Olds | 290 (100.0%) | 0 (0.0%) |
| 25 to 34 Year Olds | 318 (100.0%) | 0 (0.0%) |
| 35 Years and over | 48 (100.0%) | 0 (0.0%) |
| Total | 3,251 (97.3%) | 90 (2.7%) |
Educational Attainment by Field of Study in Roma
Education (324 | 30.9%), business (183 | 17.5%), psychology (166 | 15.8%), science & technology (94 | 9.0%), and physical & health sciences (61 | 5.8%) are the most common fields of study among 1,048 individuals in Roma who have obtained a bachelor's degree or higher.
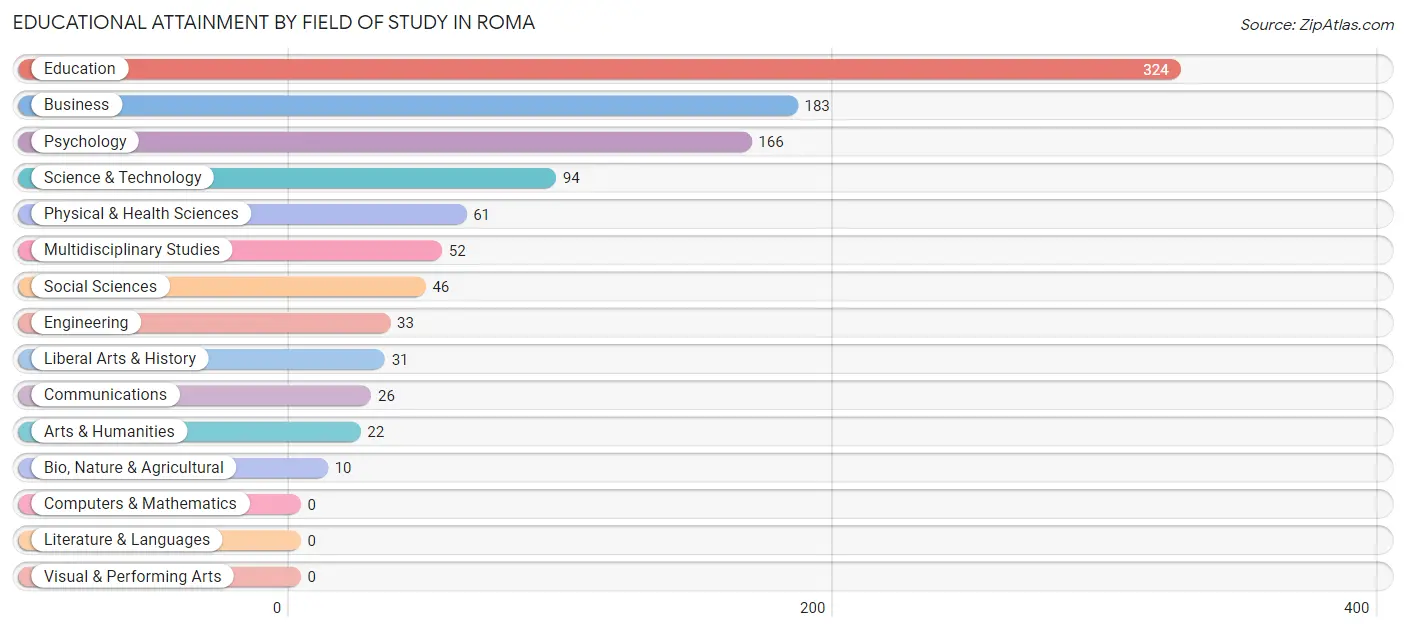
| Field of Study | # Graduates | % Graduates |
| Computers & Mathematics | 0 | 0.0% |
| Bio, Nature & Agricultural | 10 | 0.9% |
| Physical & Health Sciences | 61 | 5.8% |
| Psychology | 166 | 15.8% |
| Social Sciences | 46 | 4.4% |
| Engineering | 33 | 3.2% |
| Multidisciplinary Studies | 52 | 5.0% |
| Science & Technology | 94 | 9.0% |
| Business | 183 | 17.5% |
| Education | 324 | 30.9% |
| Literature & Languages | 0 | 0.0% |
| Liberal Arts & History | 31 | 3.0% |
| Visual & Performing Arts | 0 | 0.0% |
| Communications | 26 | 2.5% |
| Arts & Humanities | 22 | 2.1% |
| Total | 1,048 | 100.0% |
Transportation & Commute in Roma
Vehicle Availability by Sex in Roma
The most prevalent vehicle ownership categories in Roma are males with 2 vehicles (685, accounting for 33.0%) and females with 2 vehicles (506, making up 38.5%).
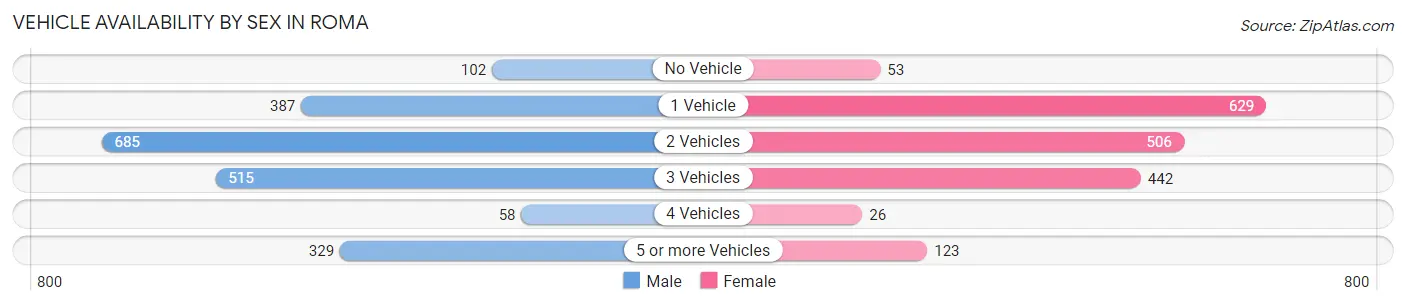
| Vehicles Available | Male | Female |
| No Vehicle | 102 (4.9%) | 53 (3.0%) |
| 1 Vehicle | 387 (18.6%) | 629 (35.4%) |
| 2 Vehicles | 685 (33.0%) | 506 (28.4%) |
| 3 Vehicles | 515 (24.8%) | 442 (24.8%) |
| 4 Vehicles | 58 (2.8%) | 26 (1.5%) |
| 5 or more Vehicles | 329 (15.9%) | 123 (6.9%) |
| Total | 2,076 (100.0%) | 1,779 (100.0%) |
Commute Time in Roma
The most frequently occuring commute durations in Roma are 5 to 9 minutes (837 commuters, 25.7%), 10 to 14 minutes (672 commuters, 20.6%), and 20 to 24 minutes (392 commuters, 12.0%).
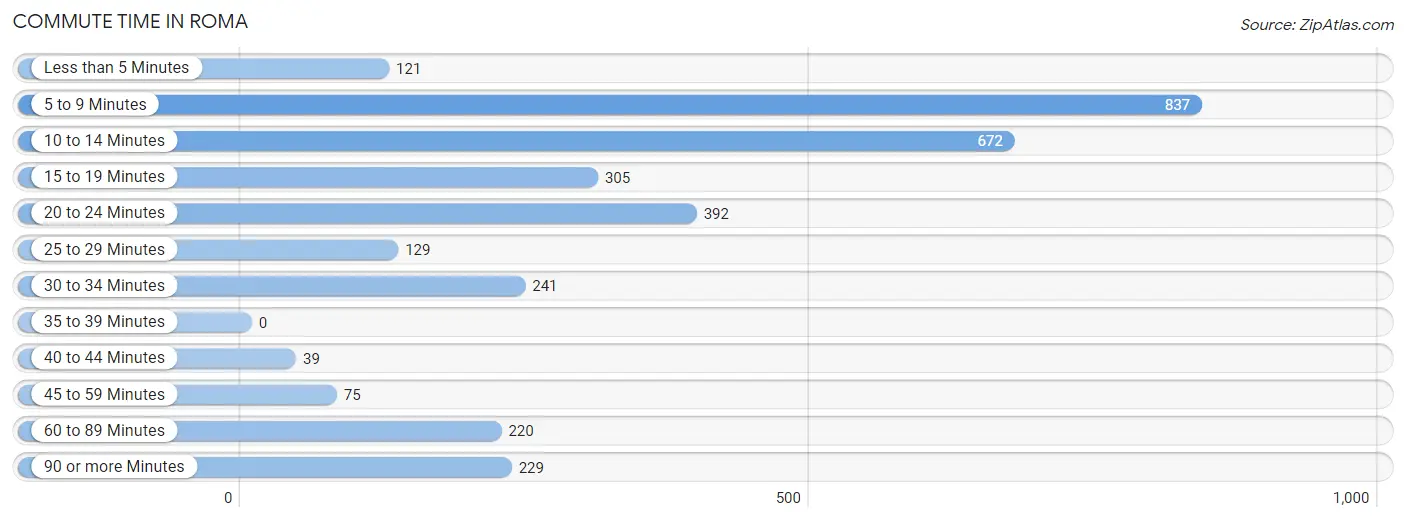
| Commute Time | # Commuters | % Commuters |
| Less than 5 Minutes | 121 | 3.7% |
| 5 to 9 Minutes | 837 | 25.7% |
| 10 to 14 Minutes | 672 | 20.6% |
| 15 to 19 Minutes | 305 | 9.4% |
| 20 to 24 Minutes | 392 | 12.0% |
| 25 to 29 Minutes | 129 | 4.0% |
| 30 to 34 Minutes | 241 | 7.4% |
| 35 to 39 Minutes | 0 | 0.0% |
| 40 to 44 Minutes | 39 | 1.2% |
| 45 to 59 Minutes | 75 | 2.3% |
| 60 to 89 Minutes | 220 | 6.8% |
| 90 or more Minutes | 229 | 7.0% |
Commute Time by Sex in Roma
The most common commute times in Roma are 5 to 9 minutes (448 commuters, 26.5%) for males and 10 to 14 minutes (442 commuters, 28.1%) for females.
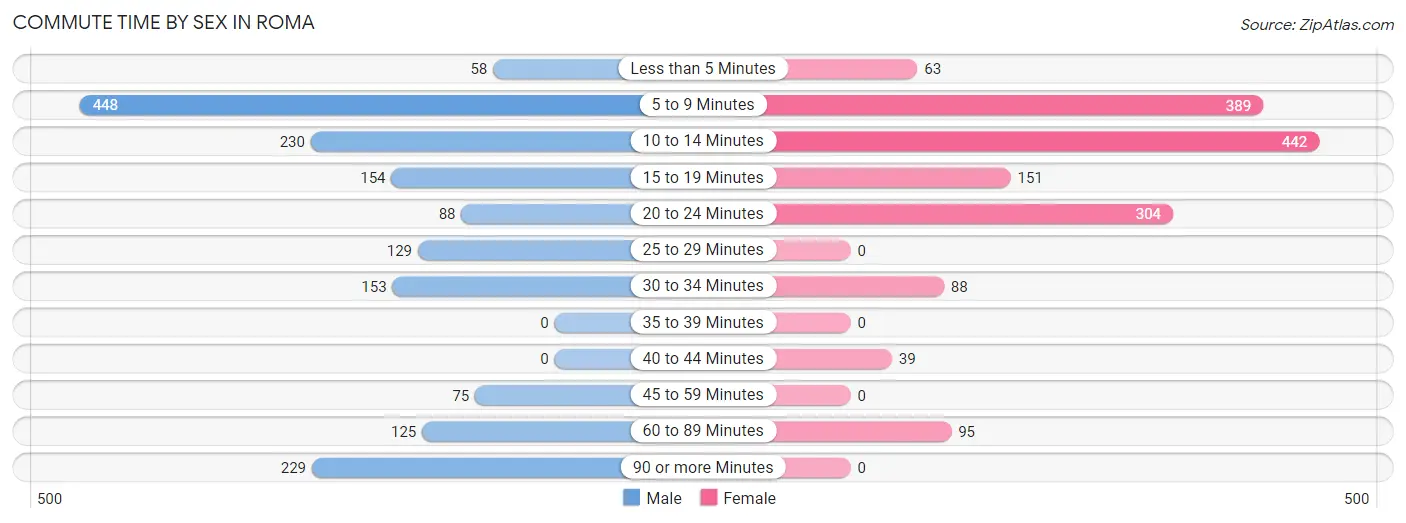
| Commute Time | Male | Female |
| Less than 5 Minutes | 58 (3.4%) | 63 (4.0%) |
| 5 to 9 Minutes | 448 (26.5%) | 389 (24.8%) |
| 10 to 14 Minutes | 230 (13.6%) | 442 (28.1%) |
| 15 to 19 Minutes | 154 (9.1%) | 151 (9.6%) |
| 20 to 24 Minutes | 88 (5.2%) | 304 (19.4%) |
| 25 to 29 Minutes | 129 (7.6%) | 0 (0.0%) |
| 30 to 34 Minutes | 153 (9.1%) | 88 (5.6%) |
| 35 to 39 Minutes | 0 (0.0%) | 0 (0.0%) |
| 40 to 44 Minutes | 0 (0.0%) | 39 (2.5%) |
| 45 to 59 Minutes | 75 (4.4%) | 0 (0.0%) |
| 60 to 89 Minutes | 125 (7.4%) | 95 (6.0%) |
| 90 or more Minutes | 229 (13.6%) | 0 (0.0%) |
Time of Departure to Work by Sex in Roma
The most frequent times of departure to work in Roma are 6:30 AM to 6:59 AM (404, 23.9%) for males and 7:00 AM to 7:29 AM (404, 25.7%) for females.
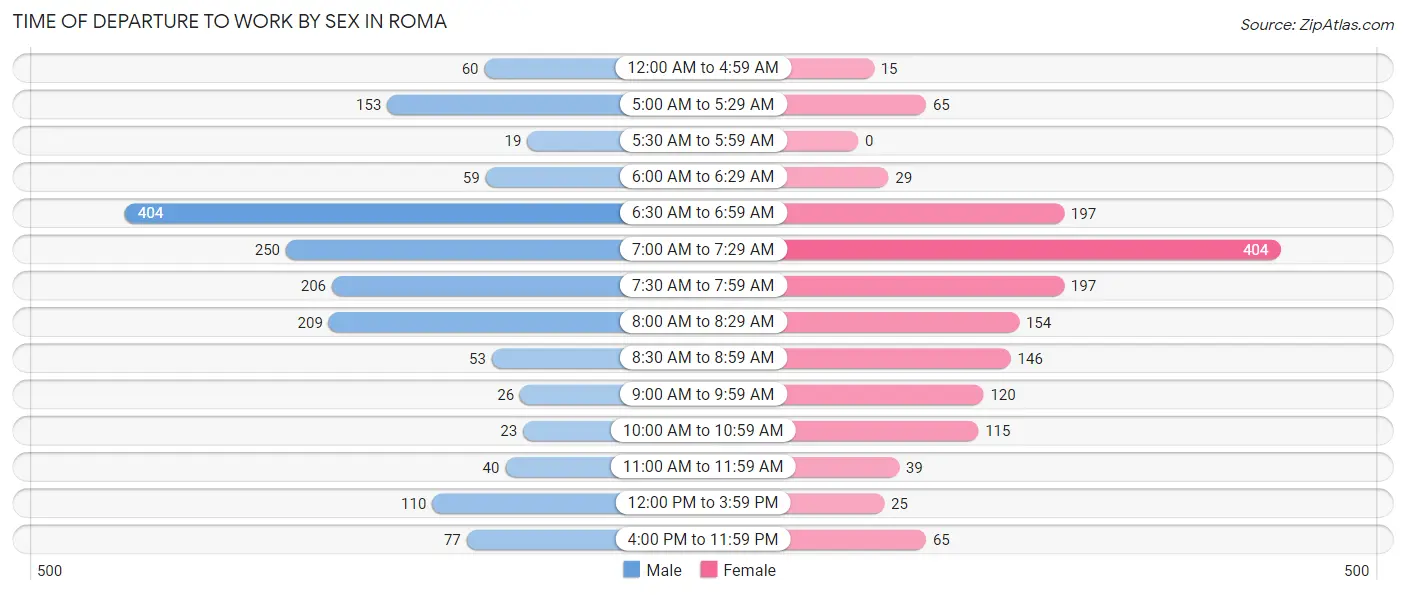
| Time of Departure | Male | Female |
| 12:00 AM to 4:59 AM | 60 (3.5%) | 15 (0.9%) |
| 5:00 AM to 5:29 AM | 153 (9.1%) | 65 (4.1%) |
| 5:30 AM to 5:59 AM | 19 (1.1%) | 0 (0.0%) |
| 6:00 AM to 6:29 AM | 59 (3.5%) | 29 (1.8%) |
| 6:30 AM to 6:59 AM | 404 (23.9%) | 197 (12.5%) |
| 7:00 AM to 7:29 AM | 250 (14.8%) | 404 (25.7%) |
| 7:30 AM to 7:59 AM | 206 (12.2%) | 197 (12.5%) |
| 8:00 AM to 8:29 AM | 209 (12.4%) | 154 (9.8%) |
| 8:30 AM to 8:59 AM | 53 (3.1%) | 146 (9.3%) |
| 9:00 AM to 9:59 AM | 26 (1.5%) | 120 (7.6%) |
| 10:00 AM to 10:59 AM | 23 (1.4%) | 115 (7.3%) |
| 11:00 AM to 11:59 AM | 40 (2.4%) | 39 (2.5%) |
| 12:00 PM to 3:59 PM | 110 (6.5%) | 25 (1.6%) |
| 4:00 PM to 11:59 PM | 77 (4.6%) | 65 (4.1%) |
| Total | 1,689 (100.0%) | 1,571 (100.0%) |
Housing Occupancy in Roma
Occupancy by Ownership in Roma
Of the total 3,284 dwellings in Roma, owner-occupied units account for 1,981 (60.3%), while renter-occupied units make up 1,303 (39.7%).
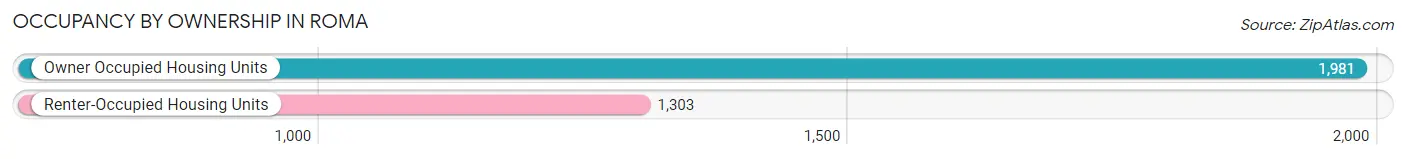
| Occupancy | # Housing Units | % Housing Units |
| Owner Occupied Housing Units | 1,981 | 60.3% |
| Renter-Occupied Housing Units | 1,303 | 39.7% |
| Total Occupied Housing Units | 3,284 | 100.0% |
Occupancy by Household Size in Roma
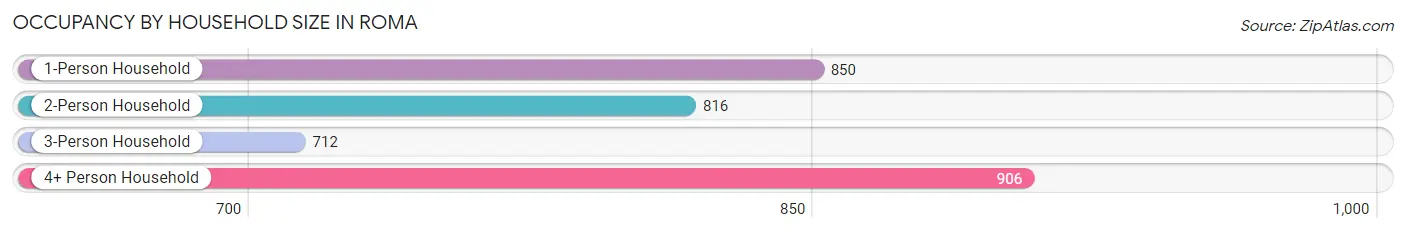
| Household Size | # Housing Units | % Housing Units |
| 1-Person Household | 850 | 25.9% |
| 2-Person Household | 816 | 24.8% |
| 3-Person Household | 712 | 21.7% |
| 4+ Person Household | 906 | 27.6% |
| Total Housing Units | 3,284 | 100.0% |
Occupancy by Ownership by Household Size in Roma
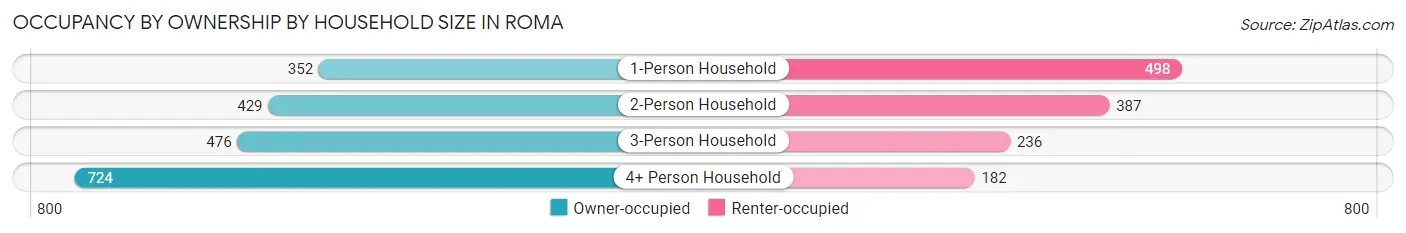
| Household Size | Owner-occupied | Renter-occupied |
| 1-Person Household | 352 (41.4%) | 498 (58.6%) |
| 2-Person Household | 429 (52.6%) | 387 (47.4%) |
| 3-Person Household | 476 (66.8%) | 236 (33.2%) |
| 4+ Person Household | 724 (79.9%) | 182 (20.1%) |
| Total Housing Units | 1,981 (60.3%) | 1,303 (39.7%) |
Occupancy by Educational Attainment in Roma
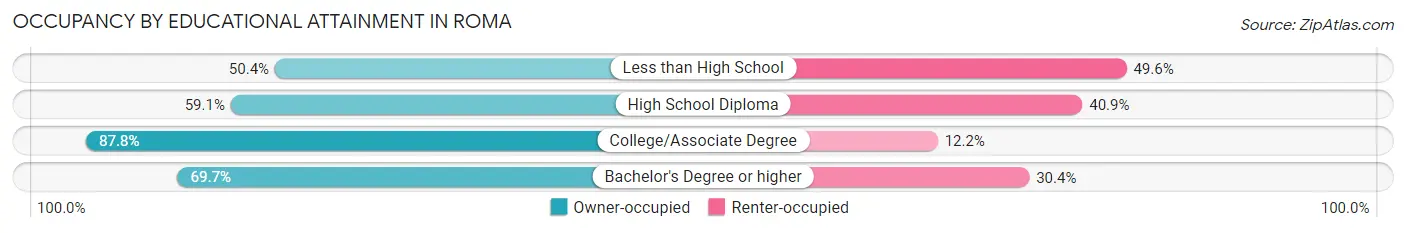
| Household Size | Owner-occupied | Renter-occupied |
| Less than High School | 822 (50.4%) | 810 (49.6%) |
| High School Diploma | 421 (59.1%) | 291 (40.9%) |
| College/Associate Degree | 403 (87.8%) | 56 (12.2%) |
| Bachelor's Degree or higher | 335 (69.7%) | 146 (30.3%) |
Occupancy by Age of Householder in Roma
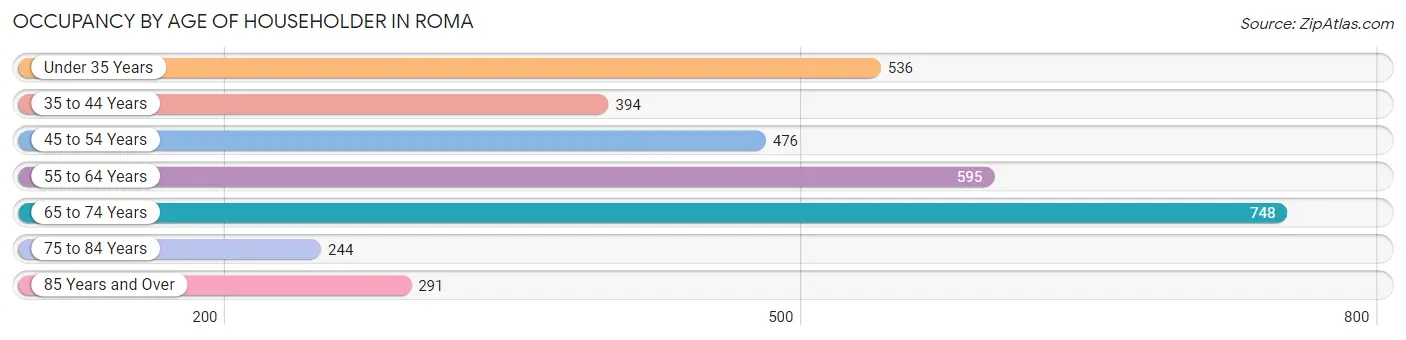
| Age Bracket | # Households | % Households |
| Under 35 Years | 536 | 16.3% |
| 35 to 44 Years | 394 | 12.0% |
| 45 to 54 Years | 476 | 14.5% |
| 55 to 64 Years | 595 | 18.1% |
| 65 to 74 Years | 748 | 22.8% |
| 75 to 84 Years | 244 | 7.4% |
| 85 Years and Over | 291 | 8.9% |
| Total | 3,284 | 100.0% |
Housing Finances in Roma
Median Income by Occupancy in Roma
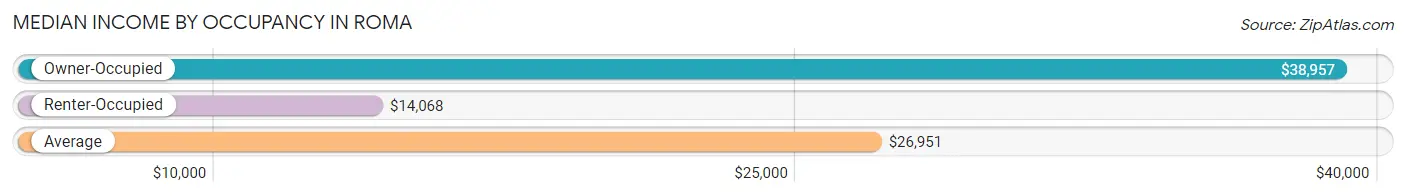
| Occupancy Type | # Households | Median Income |
| Owner-Occupied | 1,981 (60.3%) | $38,957 |
| Renter-Occupied | 1,303 (39.7%) | $14,068 |
| Average | 3,284 (100.0%) | $26,951 |
Occupancy by Householder Income Bracket in Roma
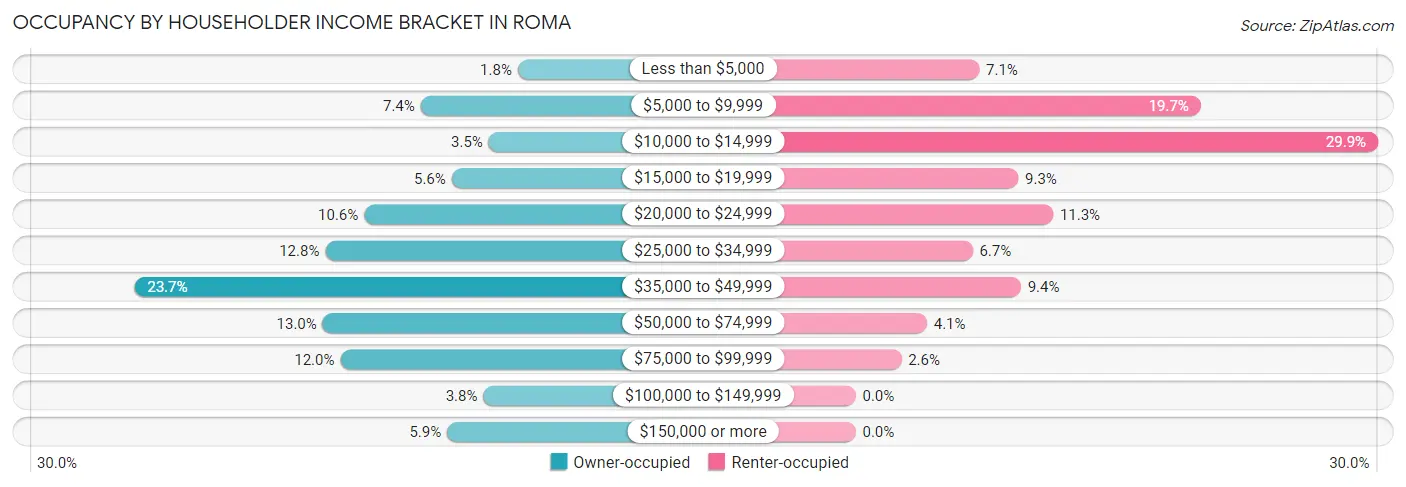
| Income Bracket | Owner-occupied | Renter-occupied |
| Less than $5,000 | 36 (1.8%) | 92 (7.1%) |
| $5,000 to $9,999 | 146 (7.4%) | 257 (19.7%) |
| $10,000 to $14,999 | 69 (3.5%) | 389 (29.8%) |
| $15,000 to $19,999 | 111 (5.6%) | 121 (9.3%) |
| $20,000 to $24,999 | 210 (10.6%) | 147 (11.3%) |
| $25,000 to $34,999 | 254 (12.8%) | 87 (6.7%) |
| $35,000 to $49,999 | 470 (23.7%) | 123 (9.4%) |
| $50,000 to $74,999 | 257 (13.0%) | 53 (4.1%) |
| $75,000 to $99,999 | 237 (12.0%) | 34 (2.6%) |
| $100,000 to $149,999 | 75 (3.8%) | 0 (0.0%) |
| $150,000 or more | 116 (5.9%) | 0 (0.0%) |
| Total | 1,981 (100.0%) | 1,303 (100.0%) |
Monthly Housing Cost Tiers in Roma
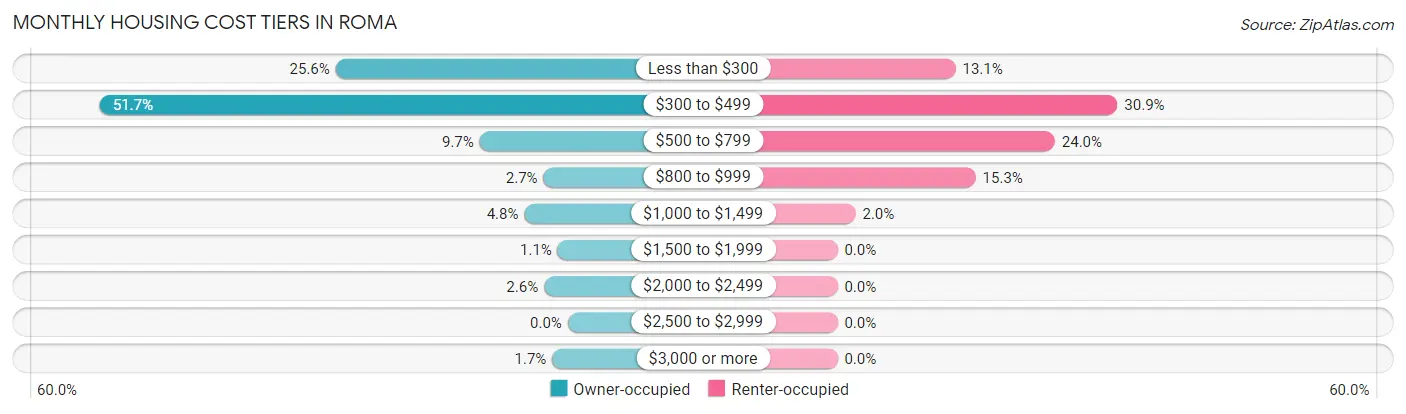
| Monthly Cost | Owner-occupied | Renter-occupied |
| Less than $300 | 508 (25.6%) | 170 (13.1%) |
| $300 to $499 | 1,024 (51.7%) | 403 (30.9%) |
| $500 to $799 | 193 (9.7%) | 313 (24.0%) |
| $800 to $999 | 53 (2.7%) | 199 (15.3%) |
| $1,000 to $1,499 | 95 (4.8%) | 26 (2.0%) |
| $1,500 to $1,999 | 22 (1.1%) | 0 (0.0%) |
| $2,000 to $2,499 | 52 (2.6%) | 0 (0.0%) |
| $2,500 to $2,999 | 0 (0.0%) | 0 (0.0%) |
| $3,000 or more | 34 (1.7%) | 0 (0.0%) |
| Total | 1,981 (100.0%) | 1,303 (100.0%) |
Physical Housing Characteristics in Roma
Housing Structures in Roma
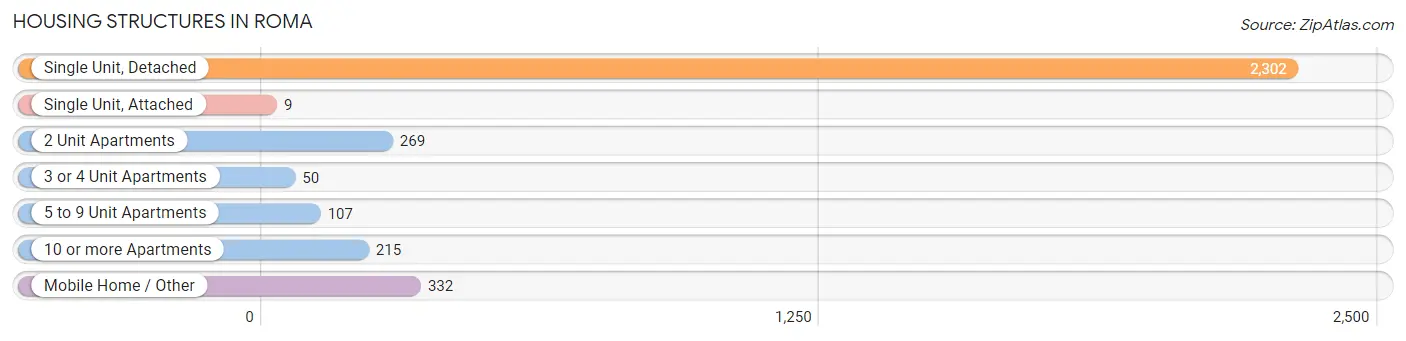
| Structure Type | # Housing Units | % Housing Units |
| Single Unit, Detached | 2,302 | 70.1% |
| Single Unit, Attached | 9 | 0.3% |
| 2 Unit Apartments | 269 | 8.2% |
| 3 or 4 Unit Apartments | 50 | 1.5% |
| 5 to 9 Unit Apartments | 107 | 3.3% |
| 10 or more Apartments | 215 | 6.6% |
| Mobile Home / Other | 332 | 10.1% |
| Total | 3,284 | 100.0% |
Housing Structures by Occupancy in Roma
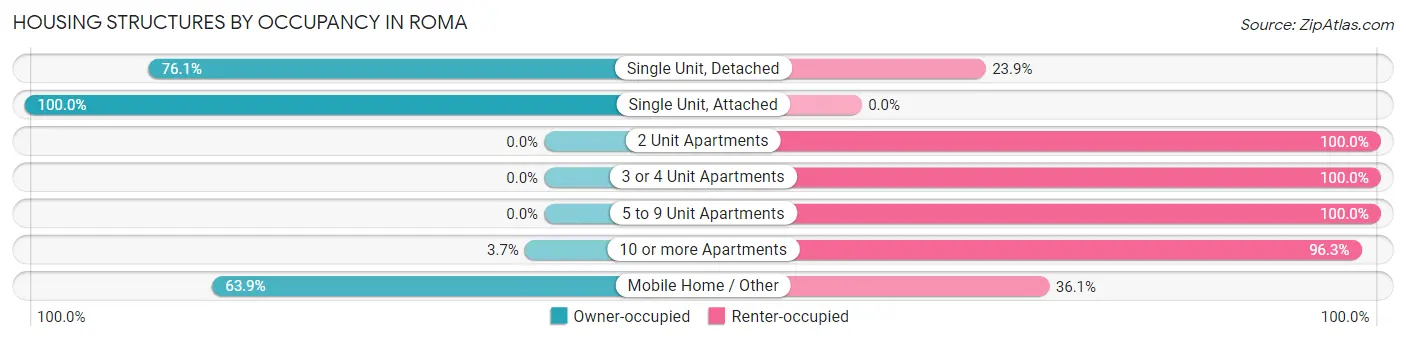
| Structure Type | Owner-occupied | Renter-occupied |
| Single Unit, Detached | 1,752 (76.1%) | 550 (23.9%) |
| Single Unit, Attached | 9 (100.0%) | 0 (0.0%) |
| 2 Unit Apartments | 0 (0.0%) | 269 (100.0%) |
| 3 or 4 Unit Apartments | 0 (0.0%) | 50 (100.0%) |
| 5 to 9 Unit Apartments | 0 (0.0%) | 107 (100.0%) |
| 10 or more Apartments | 8 (3.7%) | 207 (96.3%) |
| Mobile Home / Other | 212 (63.9%) | 120 (36.1%) |
| Total | 1,981 (60.3%) | 1,303 (39.7%) |
Housing Structures by Number of Rooms in Roma
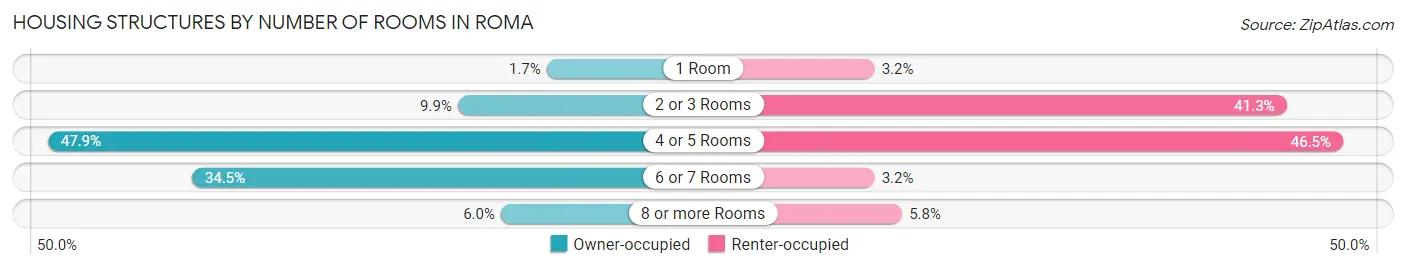
| Number of Rooms | Owner-occupied | Renter-occupied |
| 1 Room | 34 (1.7%) | 42 (3.2%) |
| 2 or 3 Rooms | 197 (9.9%) | 538 (41.3%) |
| 4 or 5 Rooms | 948 (47.8%) | 606 (46.5%) |
| 6 or 7 Rooms | 684 (34.5%) | 42 (3.2%) |
| 8 or more Rooms | 118 (6.0%) | 75 (5.8%) |
| Total | 1,981 (100.0%) | 1,303 (100.0%) |
Housing Structure by Heating Type in Roma
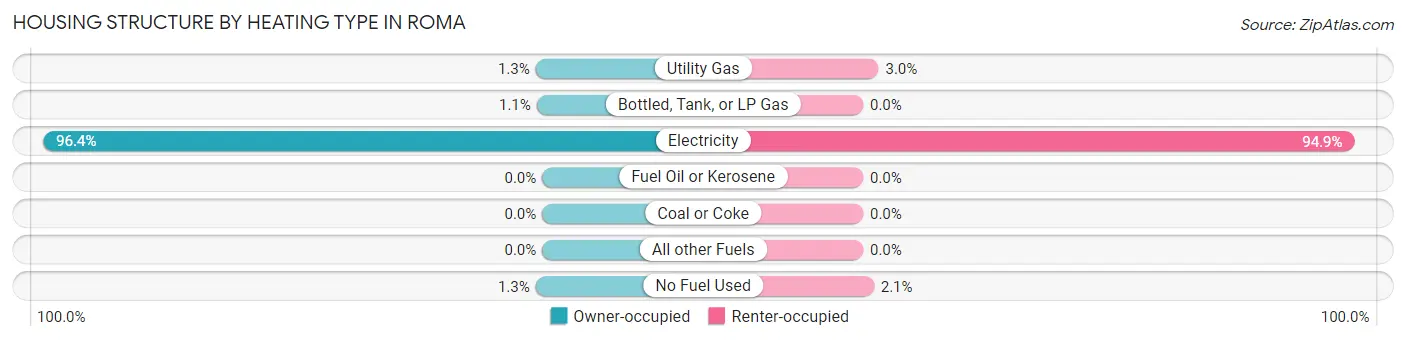
| Heating Type | Owner-occupied | Renter-occupied |
| Utility Gas | 25 (1.3%) | 39 (3.0%) |
| Bottled, Tank, or LP Gas | 21 (1.1%) | 0 (0.0%) |
| Electricity | 1,910 (96.4%) | 1,237 (94.9%) |
| Fuel Oil or Kerosene | 0 (0.0%) | 0 (0.0%) |
| Coal or Coke | 0 (0.0%) | 0 (0.0%) |
| All other Fuels | 0 (0.0%) | 0 (0.0%) |
| No Fuel Used | 25 (1.3%) | 27 (2.1%) |
| Total | 1,981 (100.0%) | 1,303 (100.0%) |
Household Vehicle Usage in Roma
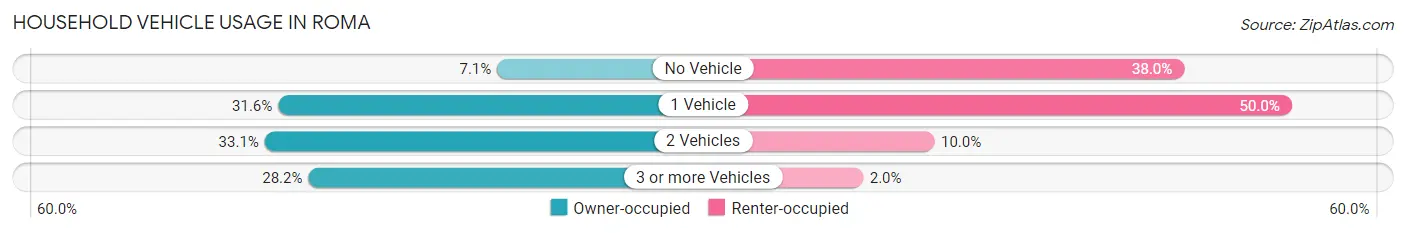
| Vehicles per Household | Owner-occupied | Renter-occupied |
| No Vehicle | 140 (7.1%) | 495 (38.0%) |
| 1 Vehicle | 626 (31.6%) | 652 (50.0%) |
| 2 Vehicles | 656 (33.1%) | 130 (10.0%) |
| 3 or more Vehicles | 559 (28.2%) | 26 (2.0%) |
| Total | 1,981 (100.0%) | 1,303 (100.0%) |
Real Estate & Mortgages in Roma
Real Estate and Mortgage Overview in Roma
| Characteristic | Without Mortgage | With Mortgage |
| Housing Units | 1,720 | 261 |
| Median Property Value | $73,500 | $106,300 |
| Median Household Income | $38,125 | $43 |
| Monthly Housing Costs | $347 | $34 |
| Real Estate Taxes | $729 | $0 |
Property Value by Mortgage Status in Roma
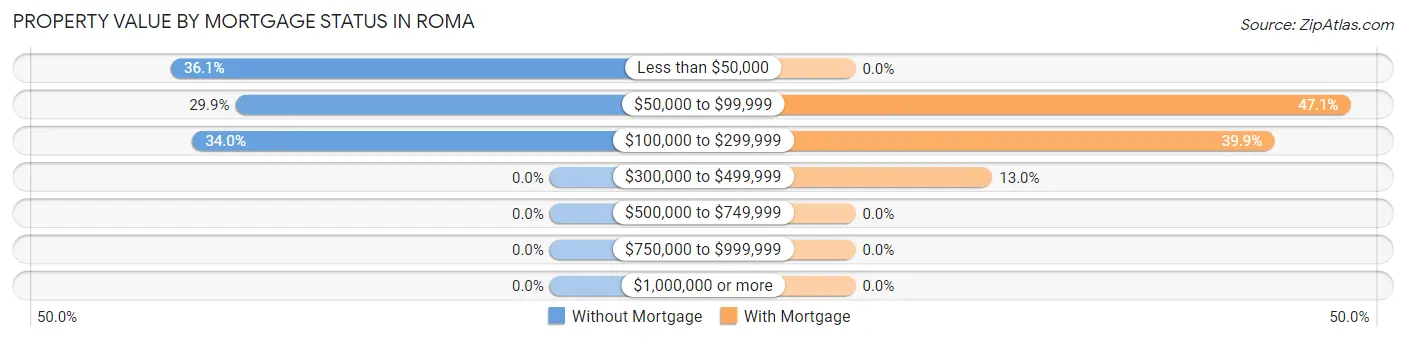
| Property Value | Without Mortgage | With Mortgage |
| Less than $50,000 | 620 (36.0%) | 0 (0.0%) |
| $50,000 to $99,999 | 515 (29.9%) | 123 (47.1%) |
| $100,000 to $299,999 | 585 (34.0%) | 104 (39.9%) |
| $300,000 to $499,999 | 0 (0.0%) | 34 (13.0%) |
| $500,000 to $749,999 | 0 (0.0%) | 0 (0.0%) |
| $750,000 to $999,999 | 0 (0.0%) | 0 (0.0%) |
| $1,000,000 or more | 0 (0.0%) | 0 (0.0%) |
| Total | 1,720 (100.0%) | 261 (100.0%) |
Household Income by Mortgage Status in Roma
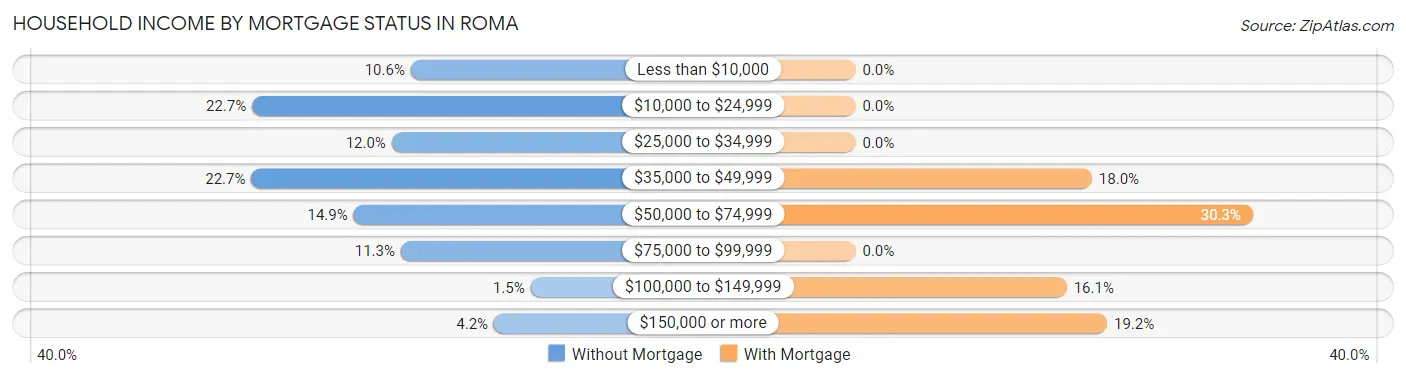
| Household Income | Without Mortgage | With Mortgage |
| Less than $10,000 | 182 (10.6%) | 0 (0.0%) |
| $10,000 to $24,999 | 390 (22.7%) | 0 (0.0%) |
| $25,000 to $34,999 | 207 (12.0%) | 0 (0.0%) |
| $35,000 to $49,999 | 391 (22.7%) | 47 (18.0%) |
| $50,000 to $74,999 | 257 (14.9%) | 79 (30.3%) |
| $75,000 to $99,999 | 195 (11.3%) | 0 (0.0%) |
| $100,000 to $149,999 | 25 (1.5%) | 42 (16.1%) |
| $150,000 or more | 73 (4.2%) | 50 (19.2%) |
| Total | 1,720 (100.0%) | 261 (100.0%) |
Property Value to Household Income Ratio in Roma
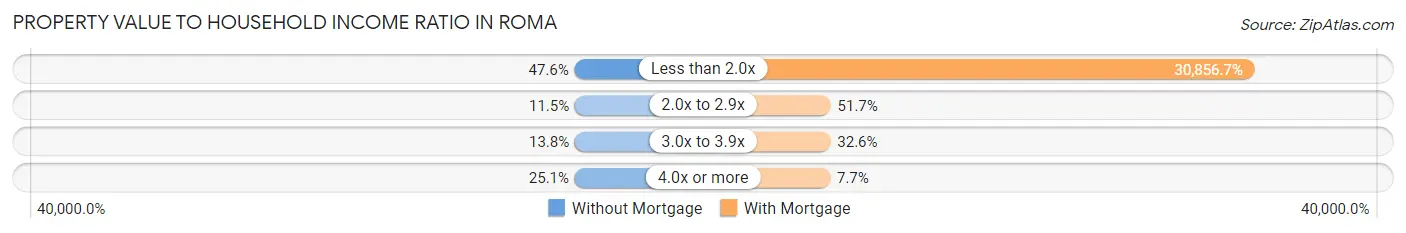
| Value-to-Income Ratio | Without Mortgage | With Mortgage |
| Less than 2.0x | 818 (47.6%) | 80,536 (30,856.7%) |
| 2.0x to 2.9x | 197 (11.5%) | 135 (51.7%) |
| 3.0x to 3.9x | 238 (13.8%) | 85 (32.6%) |
| 4.0x or more | 431 (25.1%) | 20 (7.7%) |
| Total | 1,720 (100.0%) | 261 (100.0%) |
Real Estate Taxes by Mortgage Status in Roma
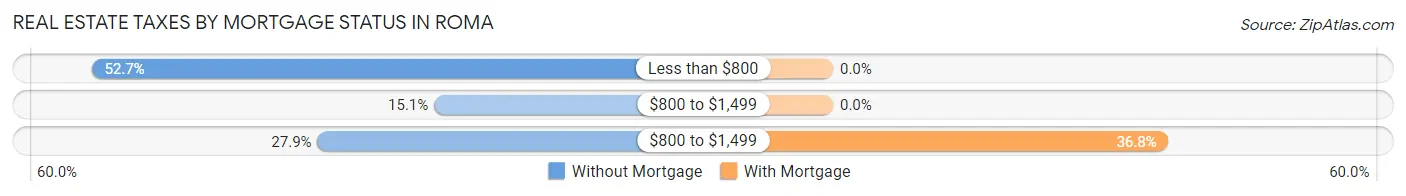
| Property Taxes | Without Mortgage | With Mortgage |
| Less than $800 | 906 (52.7%) | 0 (0.0%) |
| $800 to $1,499 | 260 (15.1%) | 0 (0.0%) |
| $800 to $1,499 | 480 (27.9%) | 96 (36.8%) |
| Total | 1,720 (100.0%) | 261 (100.0%) |
Health & Disability in Roma
Health Insurance Coverage by Age in Roma
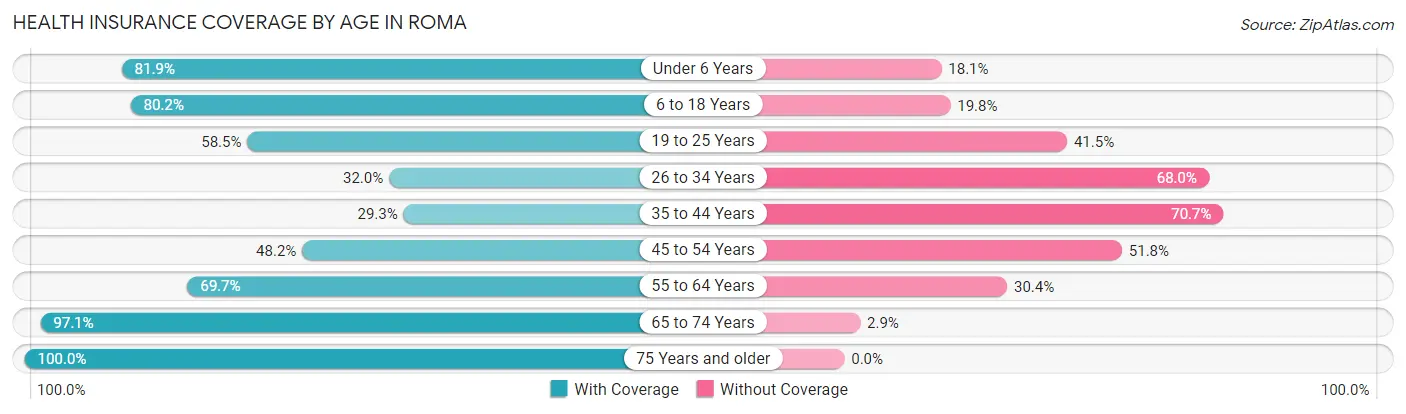
| Age Bracket | With Coverage | Without Coverage |
| Under 6 Years | 1,376 (81.9%) | 304 (18.1%) |
| 6 to 18 Years | 1,734 (80.2%) | 427 (19.8%) |
| 19 to 25 Years | 618 (58.5%) | 439 (41.5%) |
| 26 to 34 Years | 562 (32.0%) | 1,192 (68.0%) |
| 35 to 44 Years | 269 (29.3%) | 648 (70.7%) |
| 45 to 54 Years | 494 (48.2%) | 530 (51.8%) |
| 55 to 64 Years | 732 (69.7%) | 319 (30.3%) |
| 65 to 74 Years | 1,090 (97.1%) | 33 (2.9%) |
| 75 Years and older | 764 (100.0%) | 0 (0.0%) |
| Total | 7,639 (66.2%) | 3,892 (33.8%) |
Health Insurance Coverage by Citizenship Status in Roma
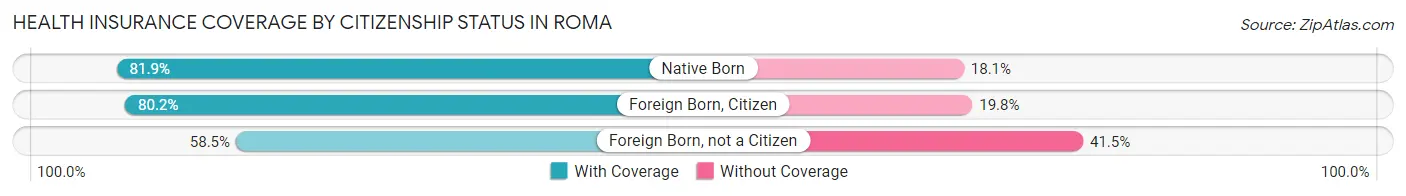
| Citizenship Status | With Coverage | Without Coverage |
| Native Born | 1,376 (81.9%) | 304 (18.1%) |
| Foreign Born, Citizen | 1,734 (80.2%) | 427 (19.8%) |
| Foreign Born, not a Citizen | 618 (58.5%) | 439 (41.5%) |
Health Insurance Coverage by Household Income in Roma
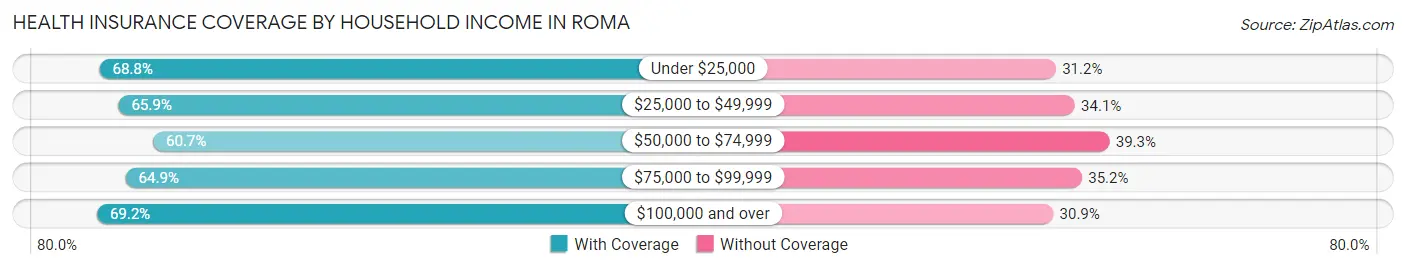
| Household Income | With Coverage | Without Coverage |
| Under $25,000 | 2,403 (68.8%) | 1,092 (31.2%) |
| $25,000 to $49,999 | 2,619 (65.9%) | 1,354 (34.1%) |
| $50,000 to $74,999 | 1,019 (60.7%) | 659 (39.3%) |
| $75,000 to $99,999 | 773 (64.8%) | 419 (35.1%) |
| $100,000 and over | 825 (69.2%) | 368 (30.8%) |
Public vs Private Health Insurance Coverage by Age in Roma
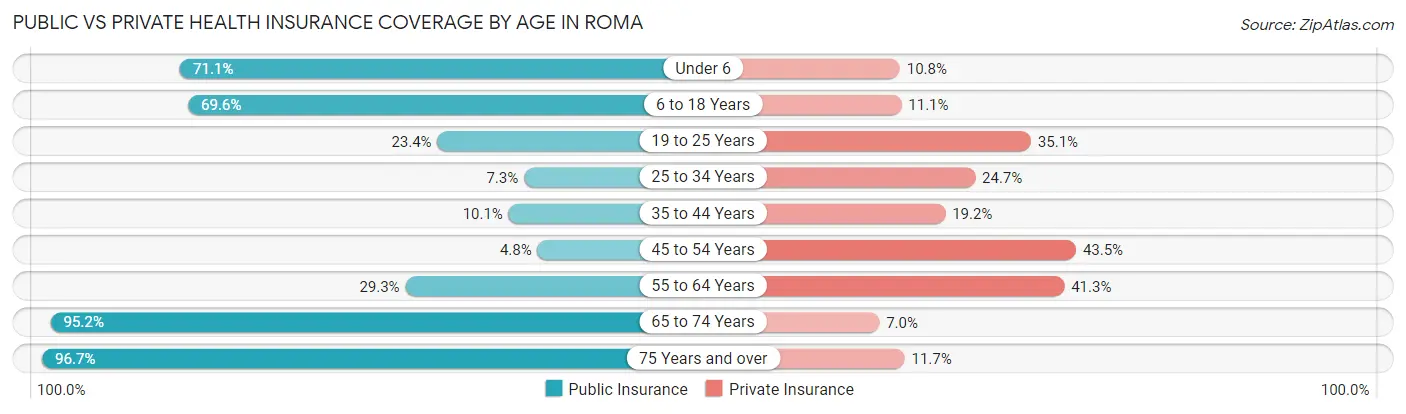
| Age Bracket | Public Insurance | Private Insurance |
| Under 6 | 1,195 (71.1%) | 181 (10.8%) |
| 6 to 18 Years | 1,505 (69.6%) | 239 (11.1%) |
| 19 to 25 Years | 247 (23.4%) | 371 (35.1%) |
| 25 to 34 Years | 128 (7.3%) | 434 (24.7%) |
| 35 to 44 Years | 93 (10.1%) | 176 (19.2%) |
| 45 to 54 Years | 49 (4.8%) | 445 (43.5%) |
| 55 to 64 Years | 308 (29.3%) | 434 (41.3%) |
| 65 to 74 Years | 1,069 (95.2%) | 78 (7.0%) |
| 75 Years and over | 739 (96.7%) | 89 (11.7%) |
| Total | 5,333 (46.3%) | 2,447 (21.2%) |
Disability Status by Sex by Age in Roma
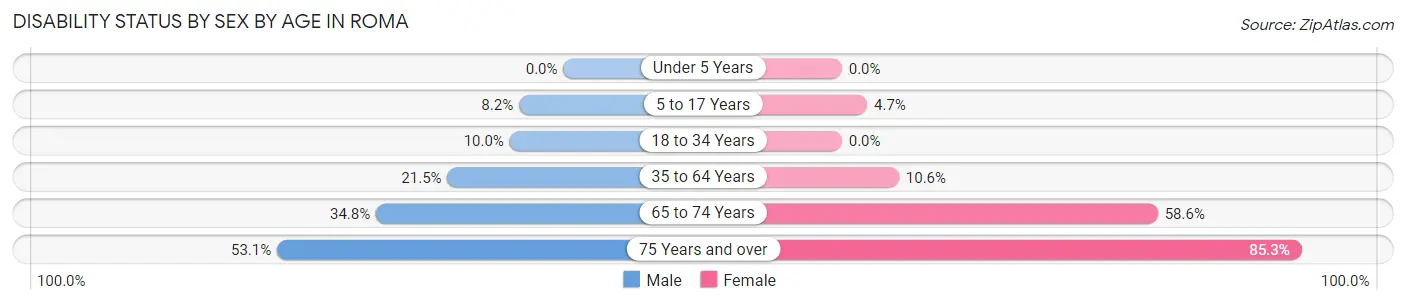
| Age Bracket | Male | Female |
| Under 5 Years | 0 (0.0%) | 0 (0.0%) |
| 5 to 17 Years | 102 (8.2%) | 51 (4.7%) |
| 18 to 34 Years | 163 (10.0%) | 0 (0.0%) |
| 35 to 64 Years | 284 (21.5%) | 177 (10.6%) |
| 65 to 74 Years | 145 (34.8%) | 414 (58.6%) |
| 75 Years and over | 127 (53.1%) | 448 (85.3%) |
Disability Class by Sex by Age in Roma
Disability Class: Hearing Difficulty
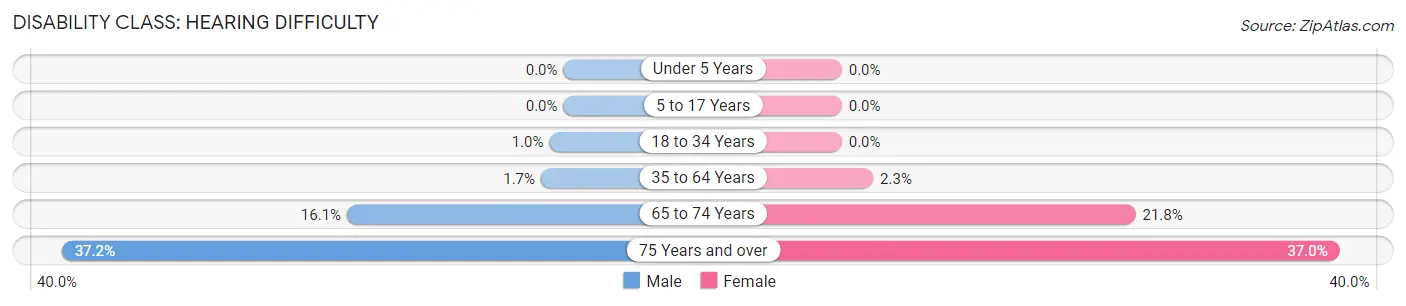
| Age Bracket | Male | Female |
| Under 5 Years | 0 (0.0%) | 0 (0.0%) |
| 5 to 17 Years | 0 (0.0%) | 0 (0.0%) |
| 18 to 34 Years | 17 (1.0%) | 0 (0.0%) |
| 35 to 64 Years | 22 (1.7%) | 39 (2.3%) |
| 65 to 74 Years | 67 (16.1%) | 154 (21.8%) |
| 75 Years and over | 89 (37.2%) | 194 (36.9%) |
Disability Class: Vision Difficulty
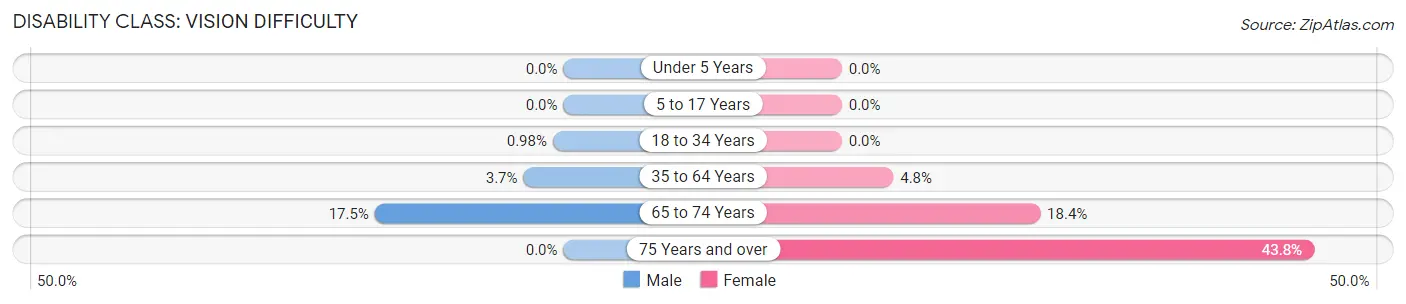
| Age Bracket | Male | Female |
| Under 5 Years | 0 (0.0%) | 0 (0.0%) |
| 5 to 17 Years | 0 (0.0%) | 0 (0.0%) |
| 18 to 34 Years | 16 (1.0%) | 0 (0.0%) |
| 35 to 64 Years | 49 (3.7%) | 80 (4.8%) |
| 65 to 74 Years | 73 (17.5%) | 130 (18.4%) |
| 75 Years and over | 0 (0.0%) | 230 (43.8%) |
Disability Class: Cognitive Difficulty
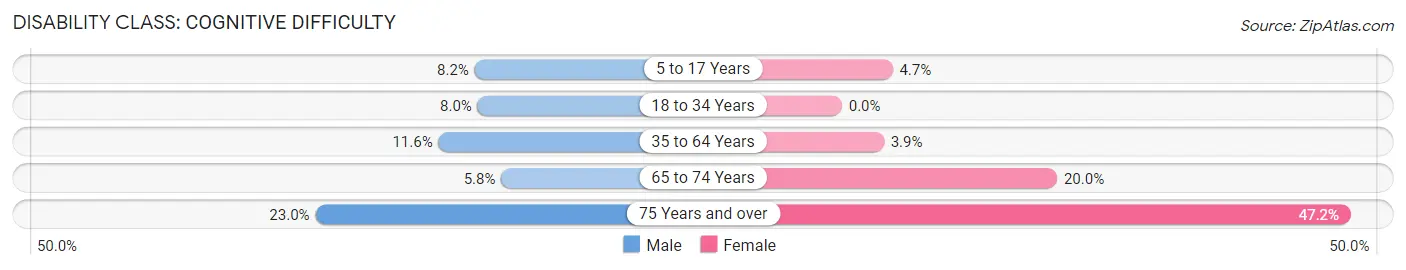
| Age Bracket | Male | Female |
| 5 to 17 Years | 102 (8.2%) | 51 (4.7%) |
| 18 to 34 Years | 130 (8.0%) | 0 (0.0%) |
| 35 to 64 Years | 153 (11.6%) | 65 (3.9%) |
| 65 to 74 Years | 24 (5.8%) | 141 (20.0%) |
| 75 Years and over | 55 (23.0%) | 248 (47.2%) |
Disability Class: Ambulatory Difficulty
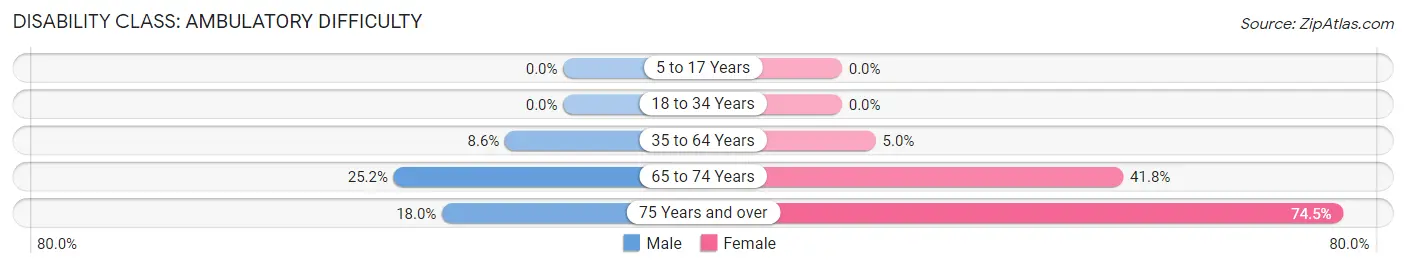
| Age Bracket | Male | Female |
| 5 to 17 Years | 0 (0.0%) | 0 (0.0%) |
| 18 to 34 Years | 0 (0.0%) | 0 (0.0%) |
| 35 to 64 Years | 114 (8.6%) | 84 (5.0%) |
| 65 to 74 Years | 105 (25.2%) | 295 (41.8%) |
| 75 Years and over | 43 (18.0%) | 391 (74.5%) |
Disability Class: Self-Care Difficulty
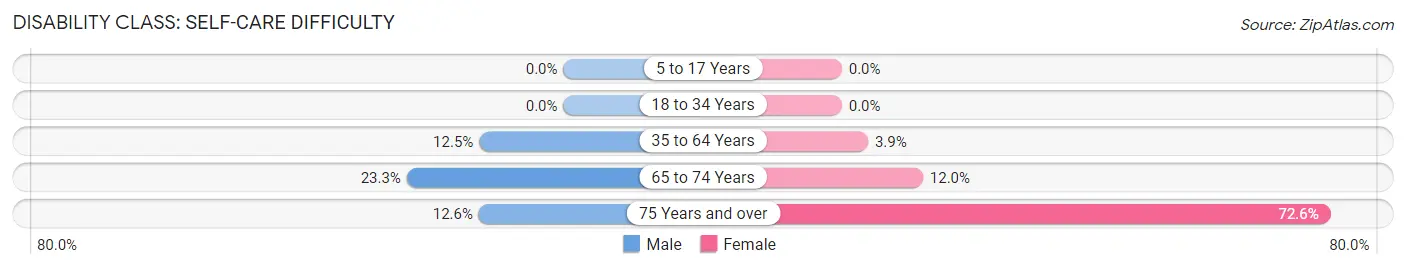
| Age Bracket | Male | Female |
| 5 to 17 Years | 0 (0.0%) | 0 (0.0%) |
| 18 to 34 Years | 0 (0.0%) | 0 (0.0%) |
| 35 to 64 Years | 165 (12.5%) | 65 (3.9%) |
| 65 to 74 Years | 97 (23.3%) | 85 (12.0%) |
| 75 Years and over | 30 (12.6%) | 381 (72.6%) |
Technology Access in Roma
Computing Device Access in Roma
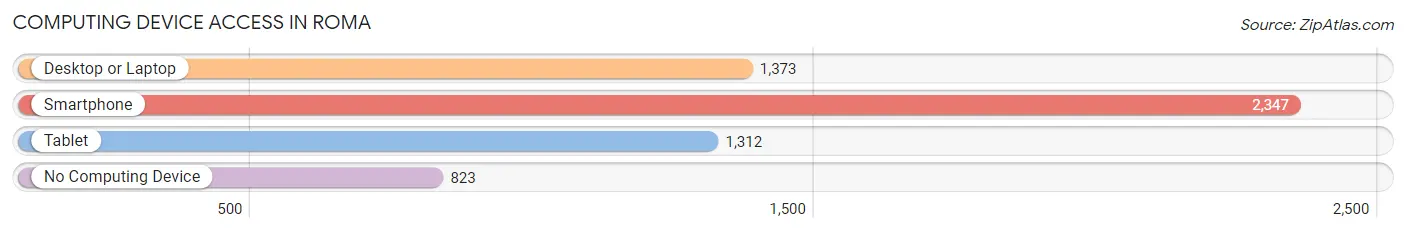
| Device Type | # Households | % Households |
| Desktop or Laptop | 1,373 | 41.8% |
| Smartphone | 2,347 | 71.5% |
| Tablet | 1,312 | 40.0% |
| No Computing Device | 823 | 25.1% |
| Total | 3,284 | 100.0% |
Internet Access in Roma
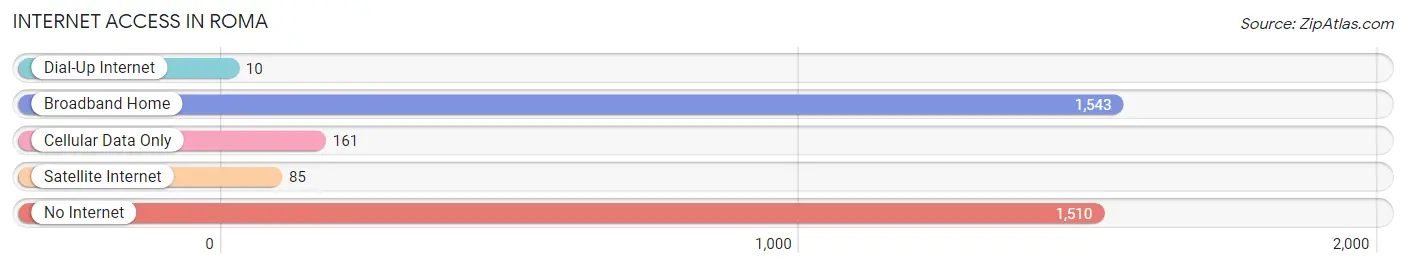
| Internet Type | # Households | % Households |
| Dial-Up Internet | 10 | 0.3% |
| Broadband Home | 1,543 | 47.0% |
| Cellular Data Only | 161 | 4.9% |
| Satellite Internet | 85 | 2.6% |
| No Internet | 1,510 | 46.0% |
| Total | 3,284 | 100.0% |
Roma Summary
Roma, Texas is a city located in Starr County, Texas, United States. It is located on the Rio Grande, across from Ciudad Miguel Alemán, Tamaulipas, Mexico. The population was 11,946 at the 2010 census.
History
Roma was founded in 1765 by Spanish settlers, making it one of the oldest cities in Texas. It was originally known as La Villa de Santa Rosa de Roma. The city was named after the Italian city of Rome. In 1848, the Treaty of Guadalupe Hidalgo was signed, which ceded the area to the United States. In 1852, the city was officially incorporated.
In the late 19th century, Roma was a major port of entry for immigrants from Mexico. The city was also a major center for the production of cotton and other agricultural products.
Geography
Roma is located at 26°20'45" North, 99°7'45" West (26.3458, -99.1293). It is situated on the Rio Grande, across from Ciudad Miguel Alemán, Tamaulipas, Mexico.
According to the United States Census Bureau, the city has a total area of 4.2 square miles (10.8 km2), all of it land.
Economy
Roma's economy is largely based on agriculture and tourism. The city is home to several large farms and ranches, as well as a number of tourist attractions, such as the Roma Bluffs Nature Park and the Roma-Ciudad Miguel Alemán International Bridge.
The city is also home to several manufacturing companies, including a large steel mill and a number of food processing plants.
Demographics
As of the 2010 census, there were 11,946 people, 3,717 households, and 2,817 families residing in the city. The population density was 2,845.3 people per square mile (1,098.7/km2). There were 4,093 housing units at an average density of 976.2 per square mile (376.3/km2). The racial makeup of the city was 79.2% White, 0.7% African American, 0.4% Native American, 0.2% Asian, 0.1% Pacific Islander, 17.7% from other races, and 1.7% from two or more races. Hispanic or Latino of any race were 97.2% of the population.
There were 3,717 households, out of which 43.2% had children under the age of 18 living with them, 51.2% were married couples living together, 17.7% had a female householder with no husband present, and 24.2% were non-families. 20.3% of all households were made up of individuals, and 8.3% had someone living alone who was 65 years of age or older. The average household size was 3.17 and the average family size was 3.67.
In the city, the population was spread out, with 33.2% under the age of 18, 10.7% from 18 to 24, 27.2% from 25 to 44, 19.2% from 45 to 64, and 9.7% who were 65 years of age or older. The median age was 29 years. For every 100 females, there were 93.2 males. For every 100 females age 18 and over, there were 88.7 males.
The median income for a household in the city was $17,917, and the median income for a family was $19,917. Males had a median income of $17,917 versus $14,917 for females. The per capita income for the city was $7,917. About 33.2% of families and 37.2% of the population were below the poverty line, including 45.2% of those under age 18 and 33.2% of those age 65 or over.
Common Questions
What is Per Capita Income in Roma?
Per Capita income in Roma is $14,065.
What is the Median Family Income in Roma?
Median Family Income in Roma is $35,786.
What is the Median Household income in Roma?
Median Household Income in Roma is $26,951.
What is Income or Wage Gap in Roma?
Income or Wage Gap in Roma is 4.7%.
Women in Roma earn 95.3 cents for every dollar earned by a man.
What is Inequality or Gini Index in Roma?
Inequality or Gini Index in Roma is 0.49.
What is the Total Population of Roma?
Total Population of Roma is 11,531.
What is the Total Male Population of Roma?
Total Male Population of Roma is 5,360.
What is the Total Female Population of Roma?
Total Female Population of Roma is 6,171.
What is the Ratio of Males per 100 Females in Roma?
There are 86.86 Males per 100 Females in Roma.
What is the Ratio of Females per 100 Males in Roma?
There are 115.13 Females per 100 Males in Roma.
What is the Median Population Age in Roma?
Median Population Age in Roma is 29.7 Years.
What is the Average Family Size in Roma
Average Family Size in Roma is 4.4 People.
What is the Average Household Size in Roma
Average Household Size in Roma is 3.5 People.
How Large is the Labor Force in Roma?
There are 4,479 People in the Labor Forcein in Roma.
What is the Percentage of People in the Labor Force in Roma?
55.0% of People are in the Labor Force in Roma.
What is the Unemployment Rate in Roma?
Unemployment Rate in Roma is 14.0%.