Rocksprings, TX Map & Demographics
Rocksprings Map

Rocksprings Overview
$22,332
PER CAPITA INCOME
$41,176
AVG HOUSEHOLD INCOME
13.6%
WAGE / INCOME GAP [ % ]
86.4¢/ $1
WAGE / INCOME GAP [ $ ]
0.47
INEQUALITY / GINI INDEX
1,002
TOTAL POPULATION
518
MALE POPULATION
484
FEMALE POPULATION
107.02
MALES / 100 FEMALES
93.44
FEMALES / 100 MALES
40.2
MEDIAN AGE
4.5
AVG FAMILY SIZE
2.6
AVG HOUSEHOLD SIZE
560
LABOR FORCE [ PEOPLE ]
72.9%
PERCENT IN LABOR FORCE
Rocksprings Zip Codes
Rocksprings Area Codes
Income in Rocksprings
Income Overview in Rocksprings
| Characteristic | Number | Measure |
| Per Capita Income | 1,002 | $22,332 |
| Median Family Income | 161 | $0 |
| Mean Family Income | 161 | $91,076 |
| Median Household Income | 376 | $41,176 |
| Mean Household Income | 376 | $57,825 |
| Income Deficit | 161 | $0 |
| Wage / Income Gap (%) | 1,002 | 13.63% |
| Wage / Income Gap ($) | 1,002 | 86.37¢ per $1 |
| Gini / Inequality Index | 1,002 | 0.47 |
Earnings by Sex in Rocksprings
Average Earnings in Rocksprings are $20,417, $22,768 for men and $19,665 for women, a difference of 13.6%.
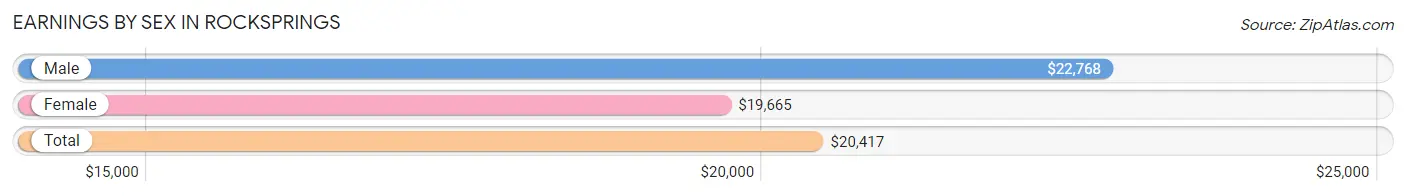
| Sex | Number | Average Earnings |
| Male | 349 (58.0%) | $22,768 |
| Female | 253 (42.0%) | $19,665 |
| Total | 602 (100.0%) | $20,417 |
Earnings by Sex by Income Bracket in Rocksprings
The most common earnings brackets in Rocksprings are $22,500 to $24,999 for men (98 | 28.1%) and $17,500 to $19,999 for women (41 | 16.2%).
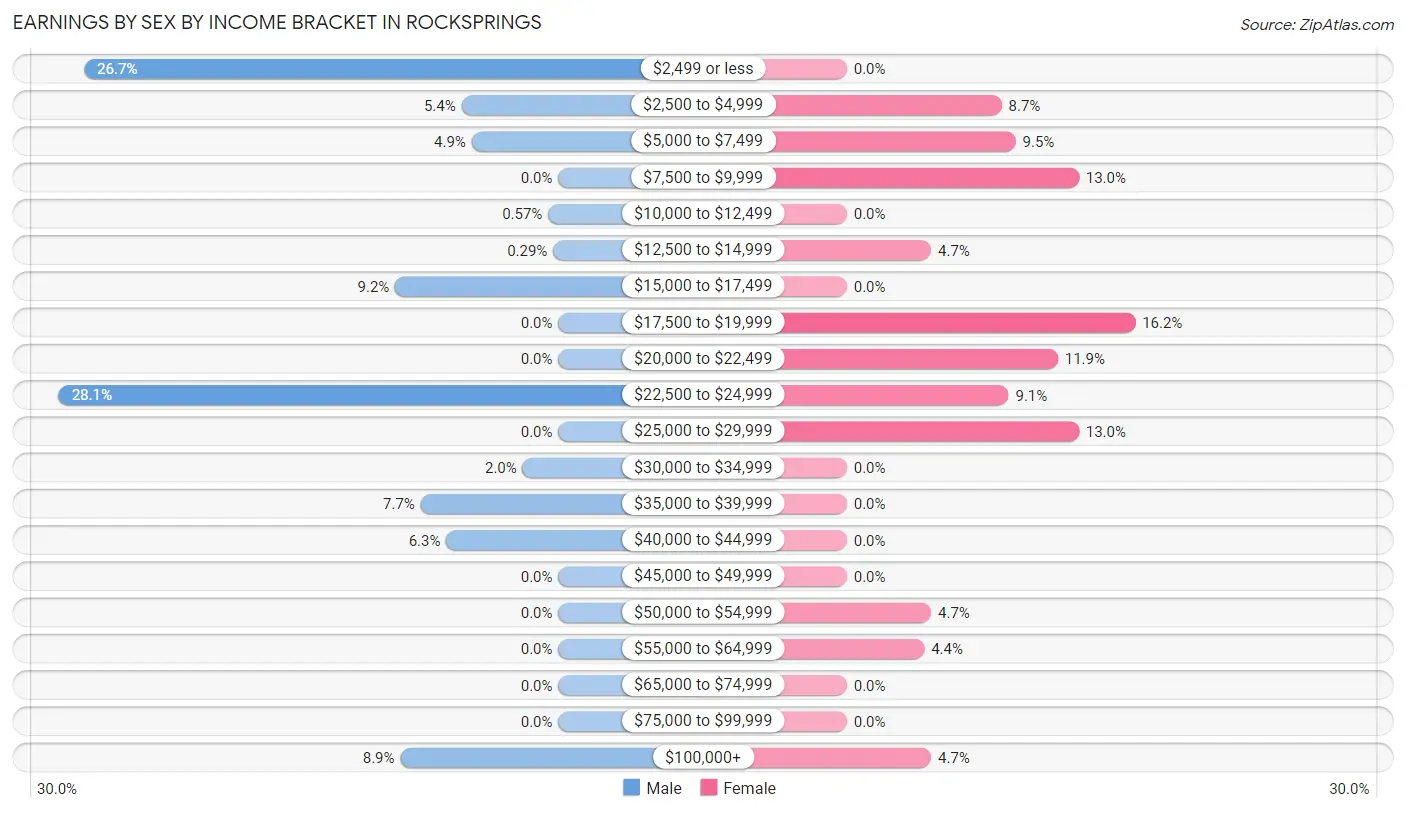
| Income | Male | Female |
| $2,499 or less | 93 (26.7%) | 0 (0.0%) |
| $2,500 to $4,999 | 19 (5.4%) | 22 (8.7%) |
| $5,000 to $7,499 | 17 (4.9%) | 24 (9.5%) |
| $7,500 to $9,999 | 0 (0.0%) | 33 (13.0%) |
| $10,000 to $12,499 | 2 (0.6%) | 0 (0.0%) |
| $12,500 to $14,999 | 1 (0.3%) | 12 (4.7%) |
| $15,000 to $17,499 | 32 (9.2%) | 0 (0.0%) |
| $17,500 to $19,999 | 0 (0.0%) | 41 (16.2%) |
| $20,000 to $22,499 | 0 (0.0%) | 30 (11.9%) |
| $22,500 to $24,999 | 98 (28.1%) | 23 (9.1%) |
| $25,000 to $29,999 | 0 (0.0%) | 33 (13.0%) |
| $30,000 to $34,999 | 7 (2.0%) | 0 (0.0%) |
| $35,000 to $39,999 | 27 (7.7%) | 0 (0.0%) |
| $40,000 to $44,999 | 22 (6.3%) | 0 (0.0%) |
| $45,000 to $49,999 | 0 (0.0%) | 0 (0.0%) |
| $50,000 to $54,999 | 0 (0.0%) | 12 (4.7%) |
| $55,000 to $64,999 | 0 (0.0%) | 11 (4.3%) |
| $65,000 to $74,999 | 0 (0.0%) | 0 (0.0%) |
| $75,000 to $99,999 | 0 (0.0%) | 0 (0.0%) |
| $100,000+ | 31 (8.9%) | 12 (4.7%) |
| Total | 349 (100.0%) | 253 (100.0%) |
Earnings by Sex by Educational Attainment in Rocksprings
Average earnings in Rocksprings are $32,083 for men and $19,665 for women, a difference of 38.7%. Men with an educational attainment of less than high school enjoy the highest average annual earnings of $2,499, while those with less than high school education earn the least with $2,499. Women with an educational attainment of high school diploma earn the most with the average annual earnings of $18,713, while those with less than high school education have the smallest earnings of $8,750.
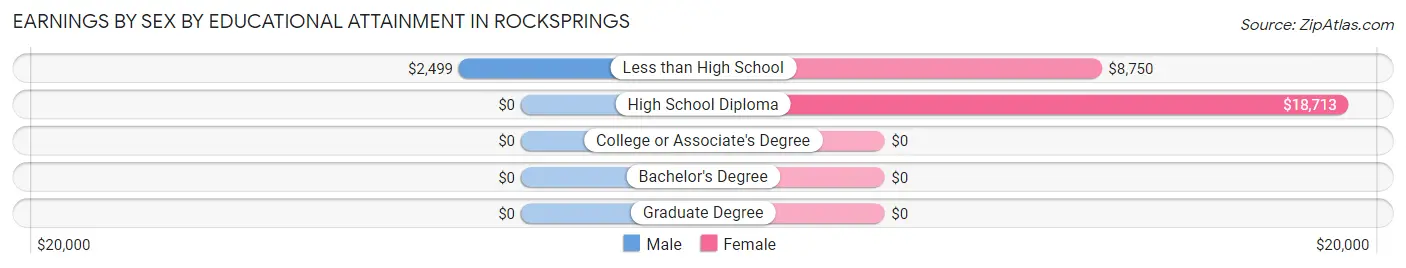
| Educational Attainment | Male Income | Female Income |
| Less than High School | $2,499 | $8,750 |
| High School Diploma | - | - |
| College or Associate's Degree | - | - |
| Bachelor's Degree | - | - |
| Graduate Degree | - | - |
| Total | $32,083 | $19,665 |
Family Income in Rocksprings
Family Income Brackets in Rocksprings
According to the Rocksprings family income data, there are 86 families falling into the $35,000 to $49,999 income range, which is the most common income bracket and makes up 53.4% of all families.
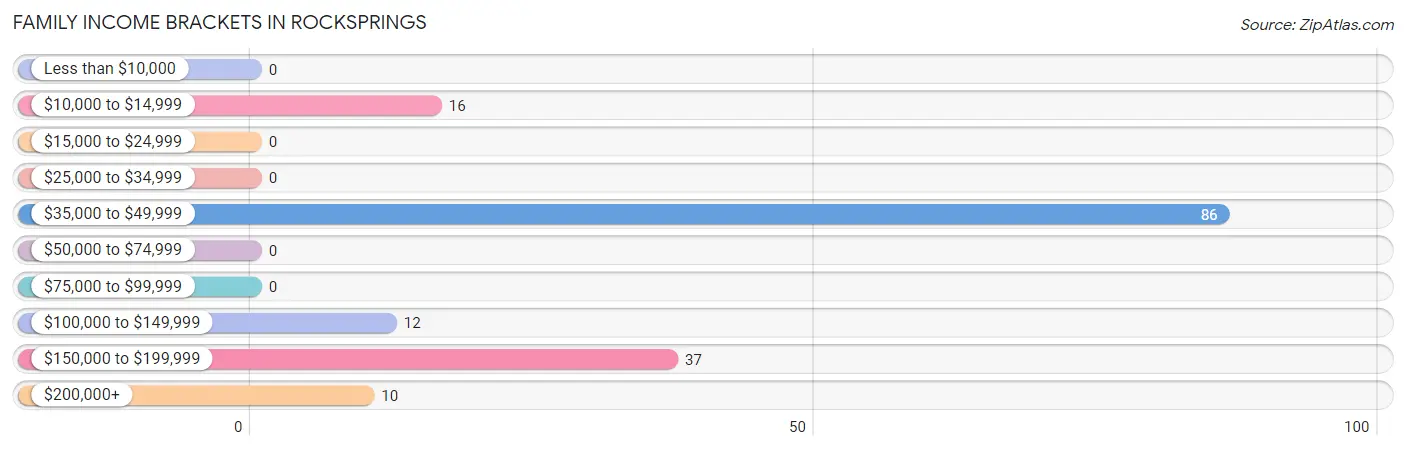
| Income Bracket | # Families | % Families |
| Less than $10,000 | 0 | 0.0% |
| $10,000 to $14,999 | 16 | 9.9% |
| $15,000 to $24,999 | 0 | 0.0% |
| $25,000 to $34,999 | 0 | 0.0% |
| $35,000 to $49,999 | 86 | 53.4% |
| $50,000 to $74,999 | 0 | 0.0% |
| $75,000 to $99,999 | 0 | 0.0% |
| $100,000 to $149,999 | 12 | 7.5% |
| $150,000 to $199,999 | 37 | 23.0% |
| $200,000+ | 10 | 6.2% |
Family Income by Famaliy Size in Rocksprings
2-person families (59 | 36.6%) account for the highest median family income in Rocksprings with $190,875 per family, while 2-person families (59 | 36.6%) have the highest median income of $95,438 per family member.
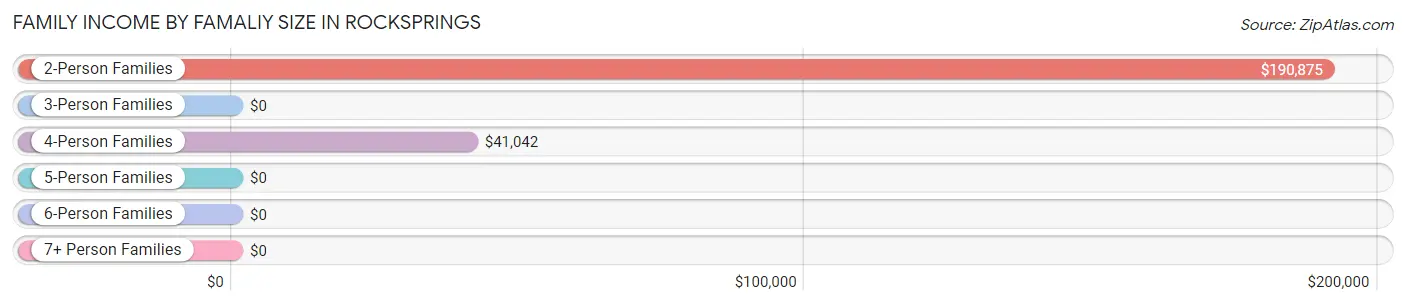
| Income Bracket | # Families | Median Income |
| 2-Person Families | 59 (36.6%) | $190,875 |
| 3-Person Families | 34 (21.1%) | $0 |
| 4-Person Families | 40 (24.8%) | $41,042 |
| 5-Person Families | 28 (17.4%) | $0 |
| 6-Person Families | 0 (0.0%) | $0 |
| 7+ Person Families | 0 (0.0%) | $0 |
| Total | 161 (100.0%) | $0 |
Family Income by Number of Earners in Rocksprings
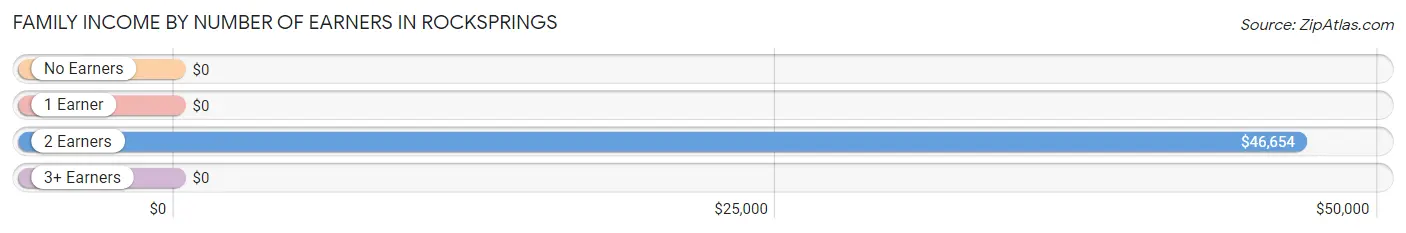
| Number of Earners | # Families | Median Income |
| No Earners | 30 (18.6%) | $0 |
| 1 Earner | 0 (0.0%) | $0 |
| 2 Earners | 107 (66.5%) | $46,654 |
| 3+ Earners | 24 (14.9%) | $0 |
| Total | 161 (100.0%) | $0 |
Household Income in Rocksprings
Household Income Brackets in Rocksprings
With 107 households falling in the category, the $35,000 to $49,999 income range is the most frequent in Rocksprings, accounting for 28.5% of all households.
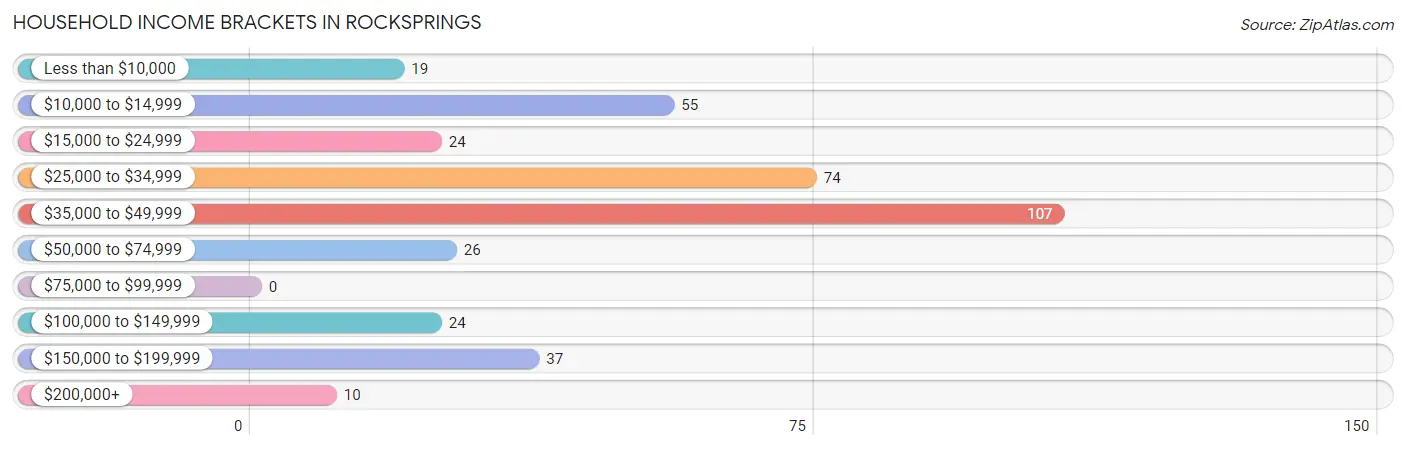
| Income Bracket | # Households | % Households |
| Less than $10,000 | 19 | 5.1% |
| $10,000 to $14,999 | 55 | 14.6% |
| $15,000 to $24,999 | 24 | 6.4% |
| $25,000 to $34,999 | 74 | 19.7% |
| $35,000 to $49,999 | 107 | 28.5% |
| $50,000 to $74,999 | 26 | 6.9% |
| $75,000 to $99,999 | 0 | 0.0% |
| $100,000 to $149,999 | 24 | 6.4% |
| $150,000 to $199,999 | 37 | 9.8% |
| $200,000+ | 10 | 2.7% |
Household Income by Householder Age in Rocksprings
The median household income in Rocksprings is $41,176, with the highest median household income of $58,068 found in the 45 to 64 years age bracket for the primary householder. A total of 151 households (40.2%) fall into this category.
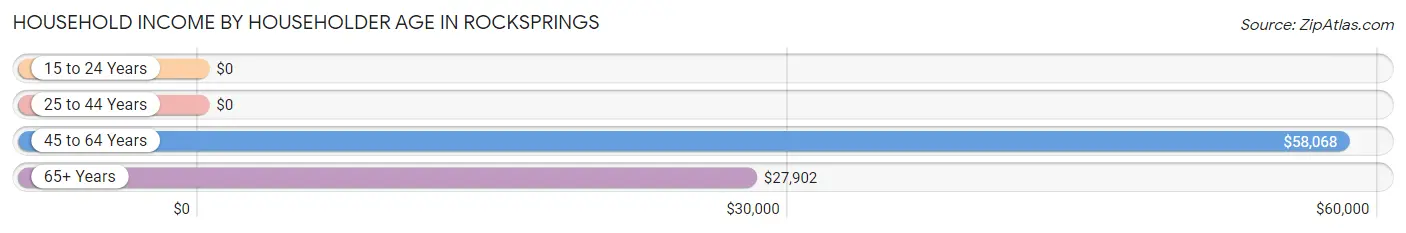
| Income Bracket | # Households | Median Income |
| 15 to 24 Years | 0 (0.0%) | $0 |
| 25 to 44 Years | 46 (12.2%) | $0 |
| 45 to 64 Years | 151 (40.2%) | $58,068 |
| 65+ Years | 179 (47.6%) | $27,902 |
| Total | 376 (100.0%) | $41,176 |
Poverty in Rocksprings
Income Below Poverty by Sex and Age in Rocksprings
With 13.1% poverty level for males and 18.5% for females among the residents of Rocksprings, 6 to 11 year old males and 6 to 11 year old females are the most vulnerable to poverty, with 23 males (52.3%) and 25 females (55.6%) in their respective age groups living below the poverty level.
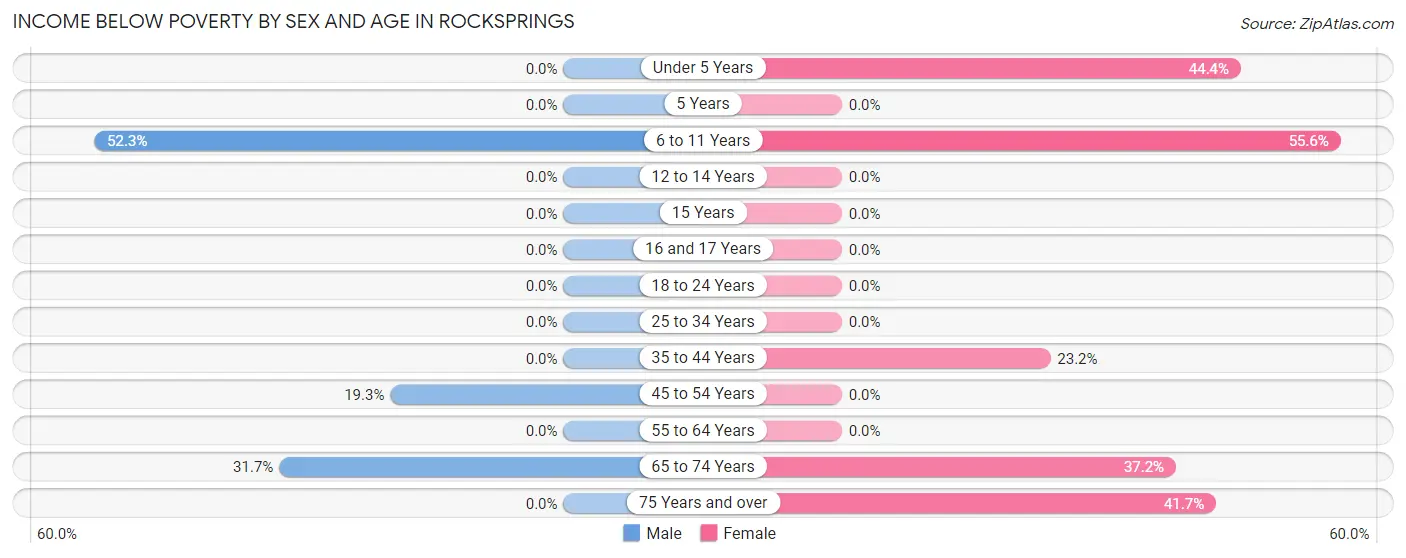
| Age Bracket | Male | Female |
| Under 5 Years | 0 (0.0%) | 20 (44.4%) |
| 5 Years | 0 (0.0%) | 0 (0.0%) |
| 6 to 11 Years | 23 (52.3%) | 25 (55.6%) |
| 12 to 14 Years | 0 (0.0%) | 0 (0.0%) |
| 15 Years | 0 (0.0%) | 0 (0.0%) |
| 16 and 17 Years | 0 (0.0%) | 0 (0.0%) |
| 18 to 24 Years | 0 (0.0%) | 0 (0.0%) |
| 25 to 34 Years | 0 (0.0%) | 0 (0.0%) |
| 35 to 44 Years | 0 (0.0%) | 23 (23.2%) |
| 45 to 54 Years | 16 (19.3%) | 0 (0.0%) |
| 55 to 64 Years | 0 (0.0%) | 0 (0.0%) |
| 65 to 74 Years | 25 (31.7%) | 16 (37.2%) |
| 75 Years and over | 0 (0.0%) | 5 (41.7%) |
| Total | 64 (13.1%) | 89 (18.5%) |
Income Above Poverty by Sex and Age in Rocksprings
According to the poverty statistics in Rocksprings, males aged 15 years and females aged 5 years are the age groups that are most secure financially, with 100.0% of males and 100.0% of females in these age groups living above the poverty line.
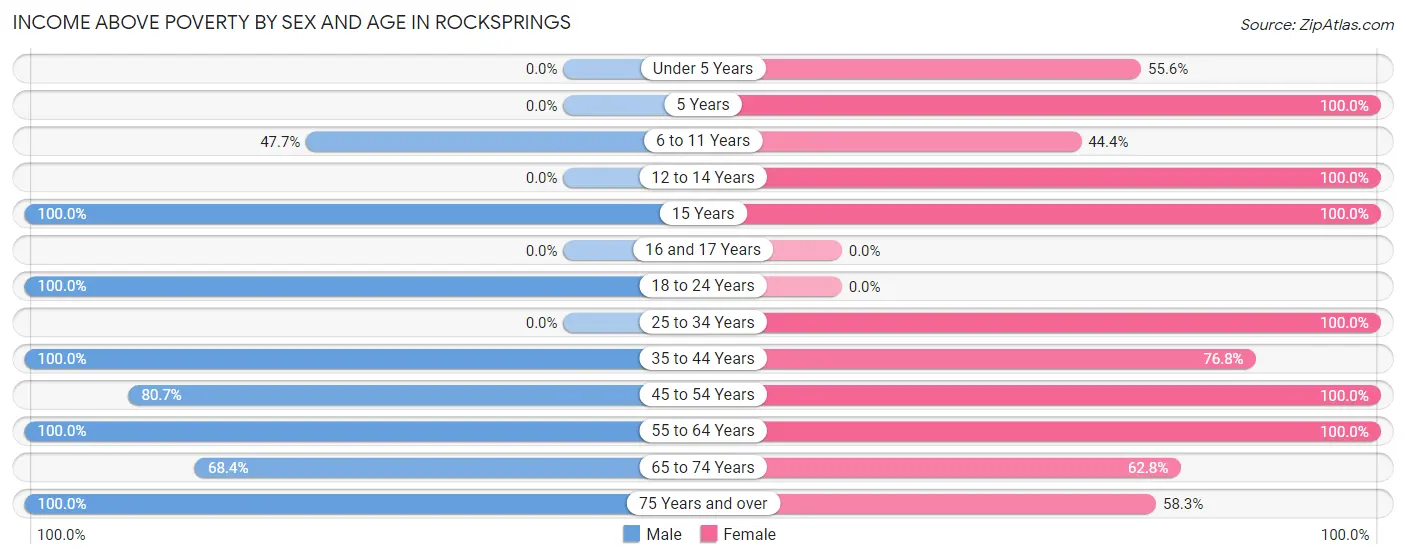
| Age Bracket | Male | Female |
| Under 5 Years | 0 (0.0%) | 25 (55.6%) |
| 5 Years | 0 (0.0%) | 26 (100.0%) |
| 6 to 11 Years | 21 (47.7%) | 20 (44.4%) |
| 12 to 14 Years | 0 (0.0%) | 28 (100.0%) |
| 15 Years | 12 (100.0%) | 34 (100.0%) |
| 16 and 17 Years | 0 (0.0%) | 0 (0.0%) |
| 18 to 24 Years | 185 (100.0%) | 0 (0.0%) |
| 25 to 34 Years | 0 (0.0%) | 19 (100.0%) |
| 35 to 44 Years | 11 (100.0%) | 76 (76.8%) |
| 45 to 54 Years | 67 (80.7%) | 94 (100.0%) |
| 55 to 64 Years | 18 (100.0%) | 36 (100.0%) |
| 65 to 74 Years | 54 (68.3%) | 27 (62.8%) |
| 75 Years and over | 55 (100.0%) | 7 (58.3%) |
| Total | 423 (86.9%) | 392 (81.5%) |
Income Below Poverty Among Married-Couple Families in Rocksprings
The poverty statistics for married-couple families in Rocksprings show that 16.2% or 16 of the total 99 families live below the poverty line. Families with 3 or 4 children have the highest poverty rate of 100.0%, comprising of 16 families. On the other hand, families with no children have the lowest poverty rate of 0.0%, which includes 0 families.
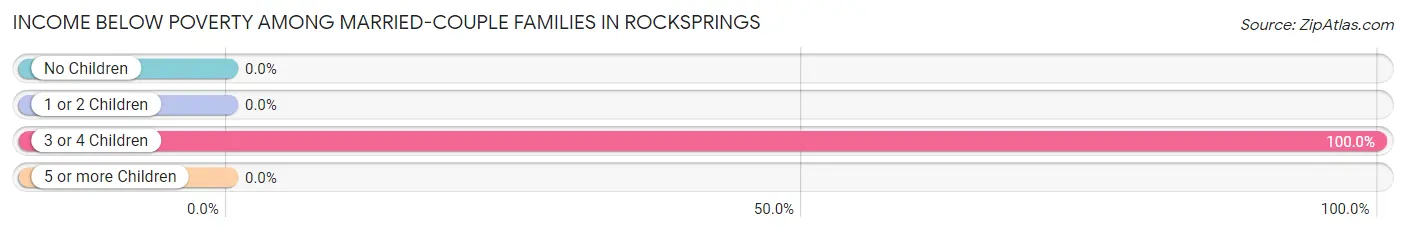
| Children | Above Poverty | Below Poverty |
| No Children | 59 (100.0%) | 0 (0.0%) |
| 1 or 2 Children | 24 (100.0%) | 0 (0.0%) |
| 3 or 4 Children | 0 (0.0%) | 16 (100.0%) |
| 5 or more Children | 0 (0.0%) | 0 (0.0%) |
| Total | 83 (83.8%) | 16 (16.2%) |
Income Below Poverty Among Single-Parent Households in Rocksprings
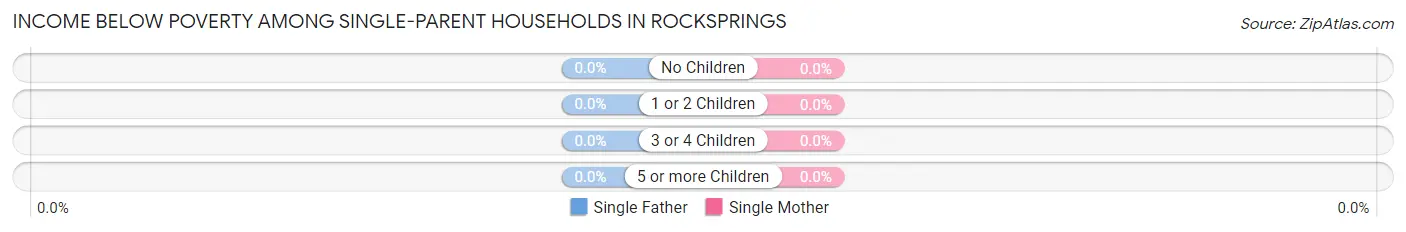
| Children | Single Father | Single Mother |
| No Children | 0 (0.0%) | 0 (0.0%) |
| 1 or 2 Children | 0 (0.0%) | 0 (0.0%) |
| 3 or 4 Children | 0 (0.0%) | 0 (0.0%) |
| 5 or more Children | 0 (0.0%) | 0 (0.0%) |
| Total | 0 (0.0%) | 0 (0.0%) |
Income Below Poverty Among Married-Couple vs Single-Parent Households in Rocksprings
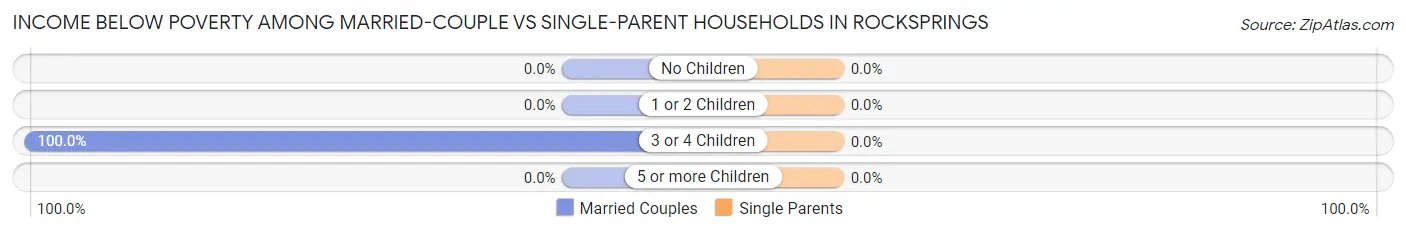
| Children | Married-Couple Families | Single-Parent Households |
| No Children | 0 (0.0%) | 0 (0.0%) |
| 1 or 2 Children | 0 (0.0%) | 0 (0.0%) |
| 3 or 4 Children | 16 (100.0%) | 0 (0.0%) |
| 5 or more Children | 0 (0.0%) | 0 (0.0%) |
| Total | 16 (16.2%) | 0 (0.0%) |
Race in Rocksprings
The most populous races in Rocksprings are White / Caucasian (865 | 86.3%), Hispanic or Latino (662 | 66.1%), and Some other Race (120 | 12.0%).
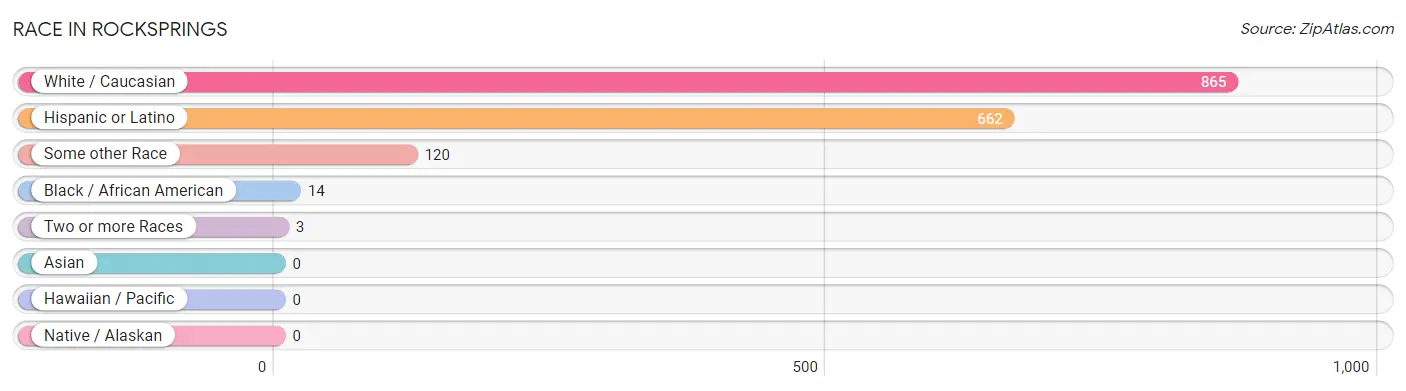
| Race | # Population | % Population |
| Asian | 0 | 0.0% |
| Black / African American | 14 | 1.4% |
| Hawaiian / Pacific | 0 | 0.0% |
| Hispanic or Latino | 662 | 66.1% |
| Native / Alaskan | 0 | 0.0% |
| White / Caucasian | 865 | 86.3% |
| Two or more Races | 3 | 0.3% |
| Some other Race | 120 | 12.0% |
| Total | 1,002 | 100.0% |
Ancestry in Rocksprings
The most populous ancestries reported in Rocksprings are Mexican (660 | 65.9%), English (45 | 4.5%), Irish (44 | 4.4%), German (25 | 2.5%), and Scottish (15 | 1.5%), together accounting for 78.8% of all Rocksprings residents.
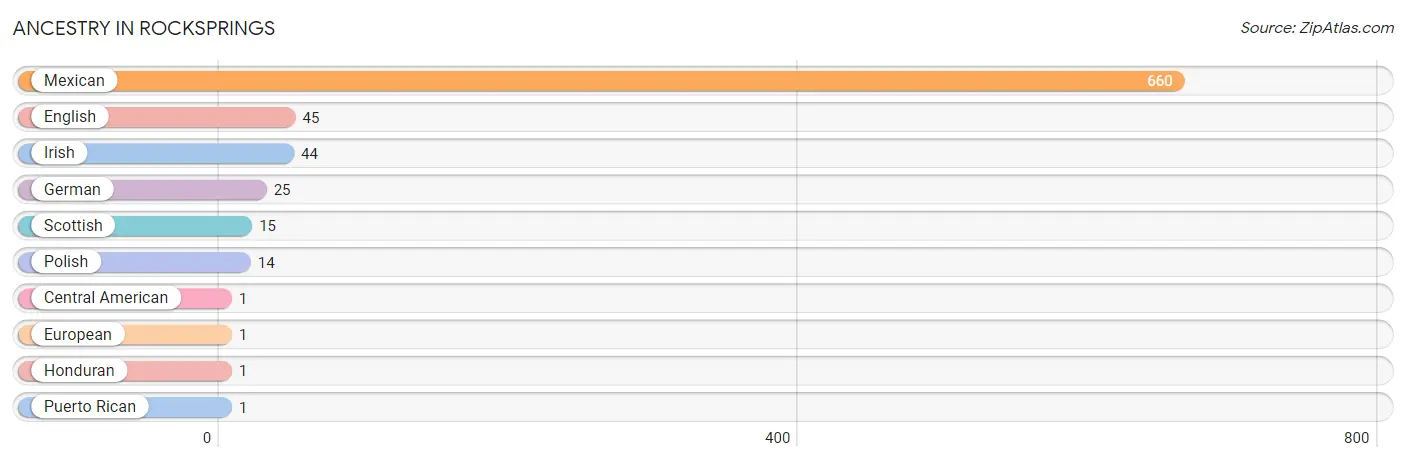
| Ancestry | # Population | % Population |
| Central American | 1 | 0.1% |
| English | 45 | 4.5% |
| European | 1 | 0.1% |
| German | 25 | 2.5% |
| Honduran | 1 | 0.1% |
| Irish | 44 | 4.4% |
| Mexican | 660 | 65.9% |
| Polish | 14 | 1.4% |
| Puerto Rican | 1 | 0.1% |
| Scottish | 15 | 1.5% | View All 10 Rows |
Immigrants in Rocksprings
The most numerous immigrant groups reported in Rocksprings came from Central America (128 | 12.8%), Latin America (128 | 12.8%), Mexico (126 | 12.6%), Guatemala (1 | 0.1%), and Honduras (1 | 0.1%), together accounting for 38.3% of all Rocksprings residents.
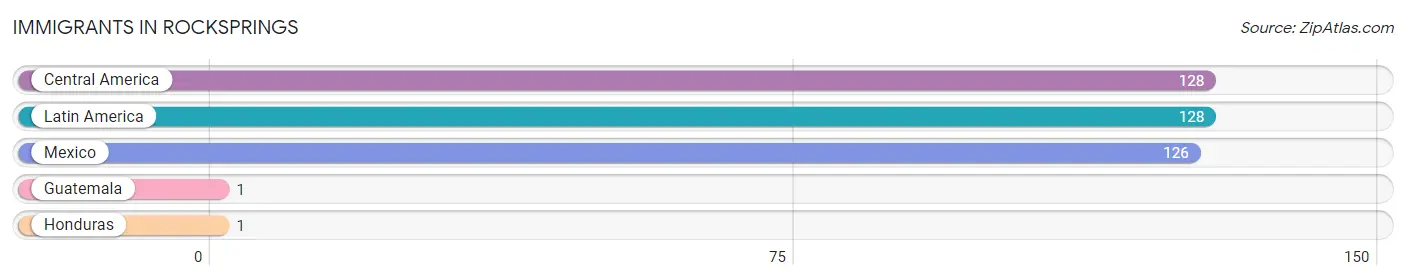
| Immigration Origin | # Population | % Population |
| Central America | 128 | 12.8% |
| Guatemala | 1 | 0.1% |
| Honduras | 1 | 0.1% |
| Latin America | 128 | 12.8% |
| Mexico | 126 | 12.6% | View All 5 Rows |
Sex and Age in Rocksprings
Sex and Age in Rocksprings
The most populous age groups in Rocksprings are 15 to 19 Years (108 | 20.8%) for men and 50 to 54 Years (83 | 17.2%) for women.
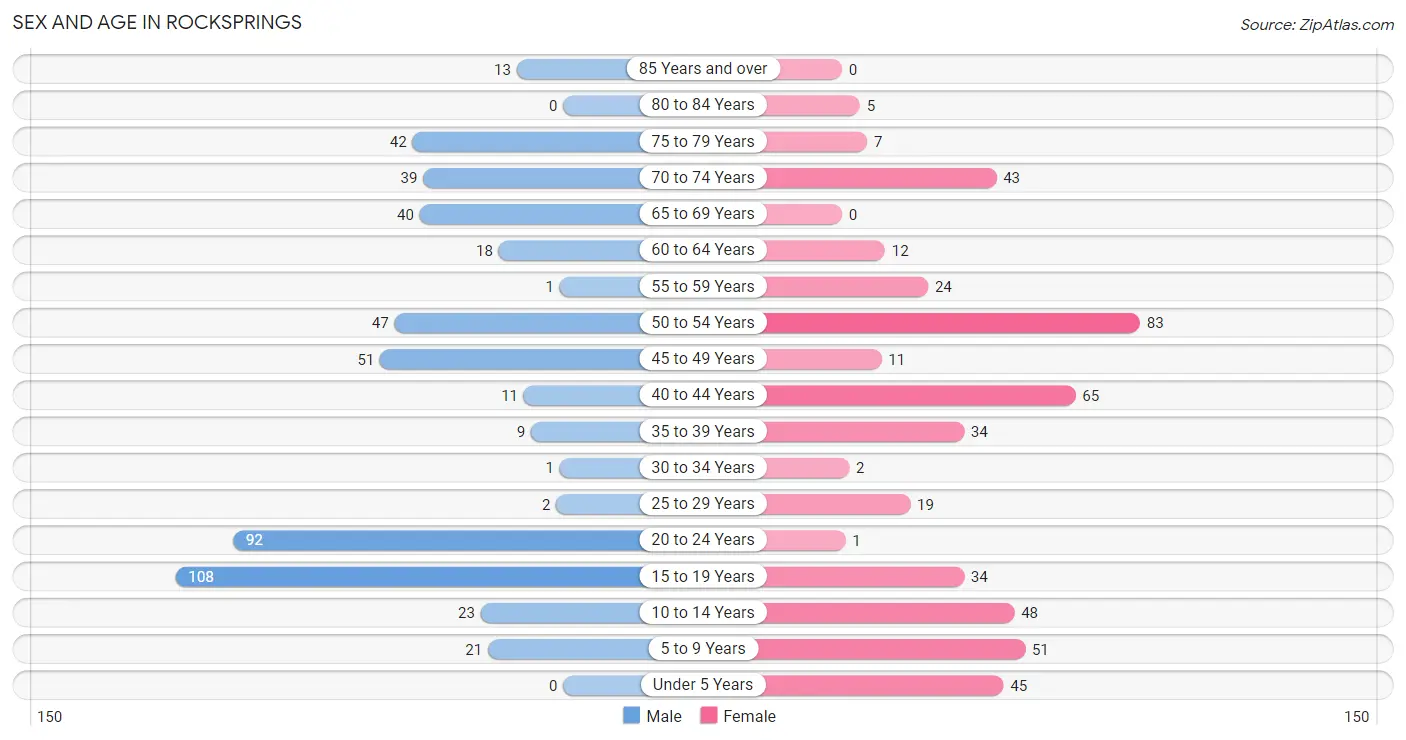
| Age Bracket | Male | Female |
| Under 5 Years | 0 (0.0%) | 45 (9.3%) |
| 5 to 9 Years | 21 (4.1%) | 51 (10.5%) |
| 10 to 14 Years | 23 (4.4%) | 48 (9.9%) |
| 15 to 19 Years | 108 (20.8%) | 34 (7.0%) |
| 20 to 24 Years | 92 (17.8%) | 1 (0.2%) |
| 25 to 29 Years | 2 (0.4%) | 19 (3.9%) |
| 30 to 34 Years | 1 (0.2%) | 2 (0.4%) |
| 35 to 39 Years | 9 (1.7%) | 34 (7.0%) |
| 40 to 44 Years | 11 (2.1%) | 65 (13.4%) |
| 45 to 49 Years | 51 (9.9%) | 11 (2.3%) |
| 50 to 54 Years | 47 (9.1%) | 83 (17.2%) |
| 55 to 59 Years | 1 (0.2%) | 24 (5.0%) |
| 60 to 64 Years | 18 (3.5%) | 12 (2.5%) |
| 65 to 69 Years | 40 (7.7%) | 0 (0.0%) |
| 70 to 74 Years | 39 (7.5%) | 43 (8.9%) |
| 75 to 79 Years | 42 (8.1%) | 7 (1.5%) |
| 80 to 84 Years | 0 (0.0%) | 5 (1.0%) |
| 85 Years and over | 13 (2.5%) | 0 (0.0%) |
| Total | 518 (100.0%) | 484 (100.0%) |
Families and Households in Rocksprings
Median Family Size in Rocksprings
The median family size in Rocksprings is 4.49 persons per family, with single male/father families (28 | 17.4%) accounting for the largest median family size of 6.11 persons per family. On the other hand, married-couple families (99 | 61.5%) represent the smallest median family size with 3.98 persons per family.
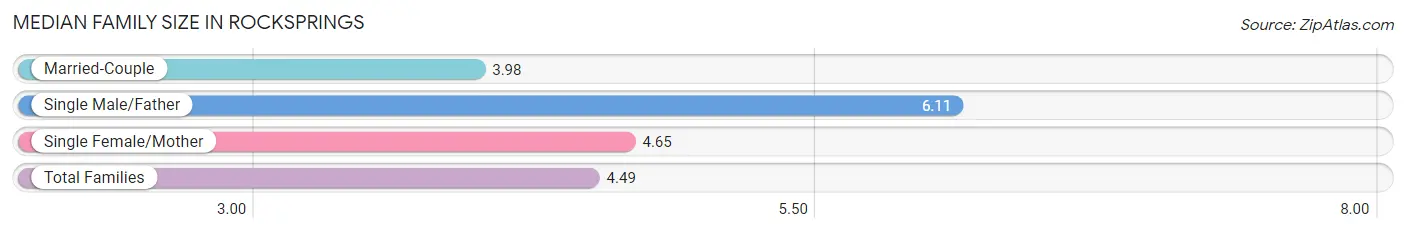
| Family Type | # Families | Family Size |
| Married-Couple | 99 (61.5%) | 3.98 |
| Single Male/Father | 28 (17.4%) | 6.11 |
| Single Female/Mother | 34 (21.1%) | 4.65 |
| Total Families | 161 (100.0%) | 4.49 |
Median Household Size in Rocksprings
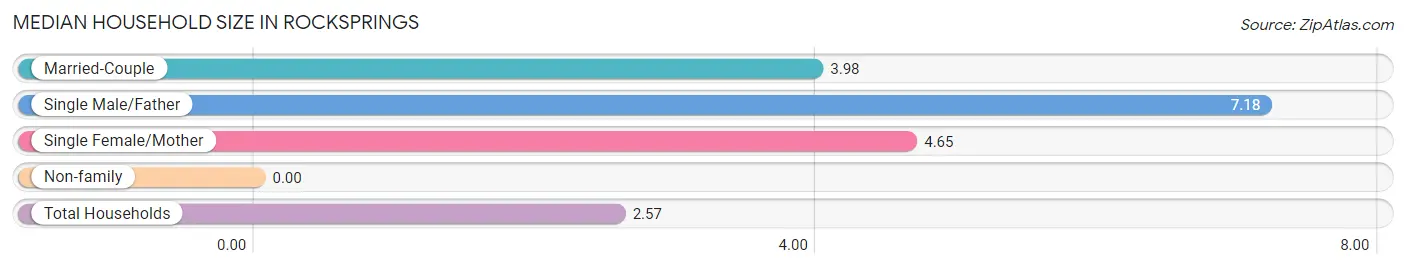
| Household Type | # Households | Household Size |
| Married-Couple | 99 (26.3%) | 3.98 |
| Single Male/Father | 28 (7.4%) | 7.18 |
| Single Female/Mother | 34 (9.0%) | 4.65 |
| Non-family | 215 (57.2%) | - |
| Total Households | 376 (100.0%) | 2.57 |
Household Size by Marriage Status in Rocksprings
Out of a total of 376 households in Rocksprings, 161 (42.8%) are family households, while 215 (57.2%) are nonfamily households. The most numerous type of family households are 2-person households, comprising 59, and the most common type of nonfamily households are 1-person households, comprising 215.
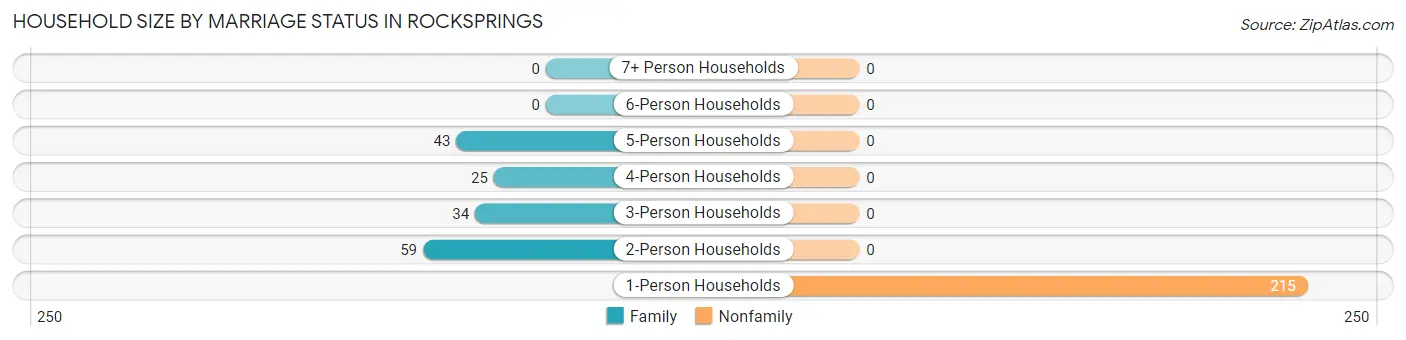
| Household Size | Family Households | Nonfamily Households |
| 1-Person Households | - | 215 (57.2%) |
| 2-Person Households | 59 (15.7%) | 0 (0.0%) |
| 3-Person Households | 34 (9.0%) | 0 (0.0%) |
| 4-Person Households | 25 (6.7%) | 0 (0.0%) |
| 5-Person Households | 43 (11.4%) | 0 (0.0%) |
| 6-Person Households | 0 (0.0%) | 0 (0.0%) |
| 7+ Person Households | 0 (0.0%) | 0 (0.0%) |
| Total | 161 (42.8%) | 215 (57.2%) |
Female Fertility in Rocksprings
Fertility by Age in Rocksprings
Average fertility rate in Rocksprings is 136.0 births per 1,000 women. Women in the age bracket of 35 to 50 years have the highest fertility rate with 190.0 births per 1,000 women. Women in the age bracket of 35 to 50 years acount for 95.8% of all women with births.
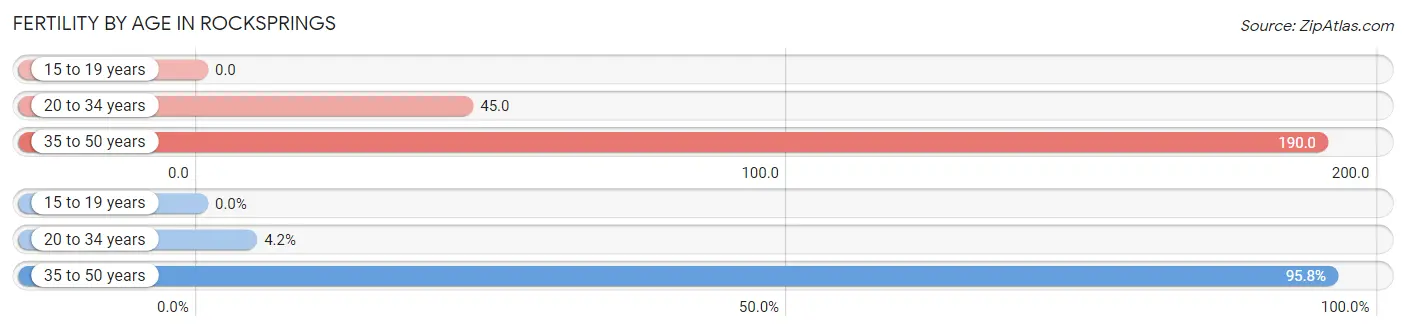
| Age Bracket | Women with Births | Births / 1,000 Women |
| 15 to 19 years | 0 (0.0%) | 0.0 |
| 20 to 34 years | 1 (4.2%) | 45.0 |
| 35 to 50 years | 23 (95.8%) | 190.0 |
| Total | 24 (100.0%) | 136.0 |
Fertility by Age by Marriage Status in Rocksprings
95.8% of women with births (24) in Rocksprings are married. The highest percentage of unmarried women with births falls into 20 to 34 years age bracket with 100.0% of them unmarried at the time of birth, while the lowest percentage of unmarried women with births belong to 35 to 50 years age bracket with 0.0% of them unmarried.
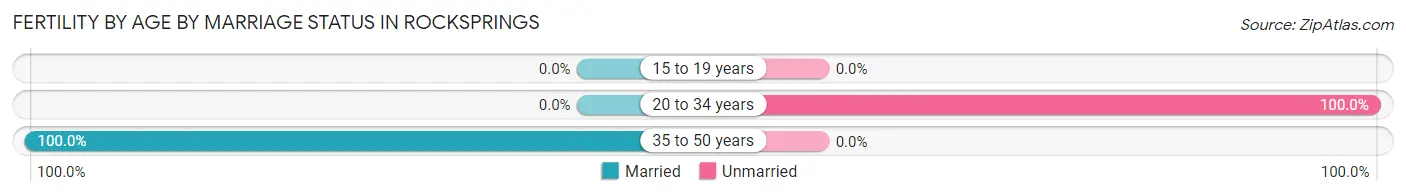
| Age Bracket | Married | Unmarried |
| 15 to 19 years | 0 (0.0%) | 0 (0.0%) |
| 20 to 34 years | 0 (0.0%) | 1 (100.0%) |
| 35 to 50 years | 23 (100.0%) | 0 (0.0%) |
| Total | 23 (95.8%) | 1 (4.2%) |
Fertility by Education in Rocksprings
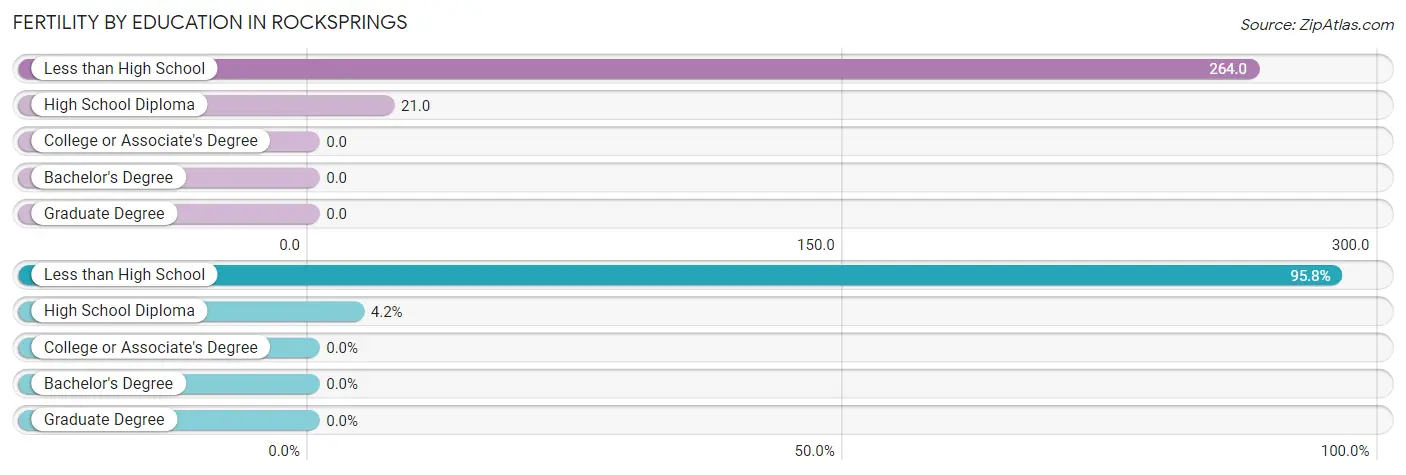
| Educational Attainment | Women with Births | Births / 1,000 Women |
| Less than High School | 23 (95.8%) | 264.0 |
| High School Diploma | 1 (4.2%) | 21.0 |
| College or Associate's Degree | 0 (0.0%) | 0.0 |
| Bachelor's Degree | 0 (0.0%) | 0.0 |
| Graduate Degree | 0 (0.0%) | 0.0 |
| Total | 24 (100.0%) | 136.0 |
Fertility by Education by Marriage Status in Rocksprings
4.2% of women with births in Rocksprings are unmarried. Women with the educational attainment of less than high school are most likely to be married with 100.0% of them married at childbirth, while women with the educational attainment of high school diploma are least likely to be married with 100.0% of them unmarried at childbirth.
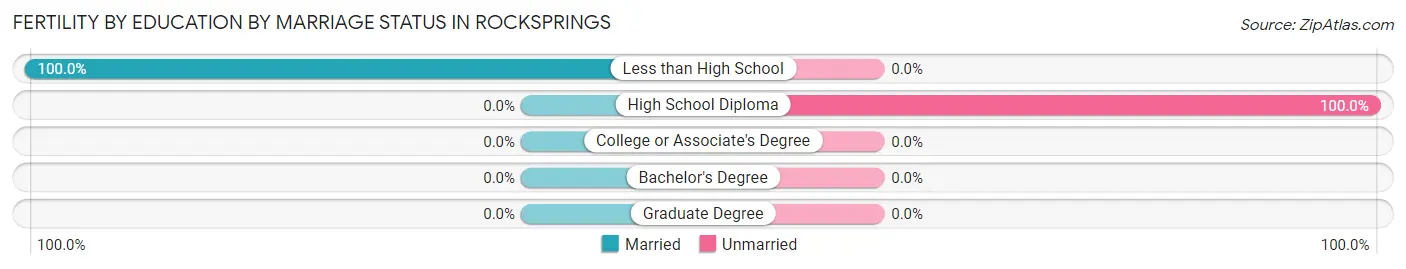
| Educational Attainment | Married | Unmarried |
| Less than High School | 23 (100.0%) | 0 (0.0%) |
| High School Diploma | 0 (0.0%) | 1 (100.0%) |
| College or Associate's Degree | 0 (0.0%) | 0 (0.0%) |
| Bachelor's Degree | 0 (0.0%) | 0 (0.0%) |
| Graduate Degree | 0 (0.0%) | 0 (0.0%) |
| Total | 23 (95.8%) | 1 (4.2%) |
Employment Characteristics in Rocksprings
Employment by Class of Employer in Rocksprings
Among the 548 employed individuals in Rocksprings, private company employees (385 | 70.3%), self-employed (not incorporated) (63 | 11.5%), and local government employees (44 | 8.0%) make up the most common classes of employment.
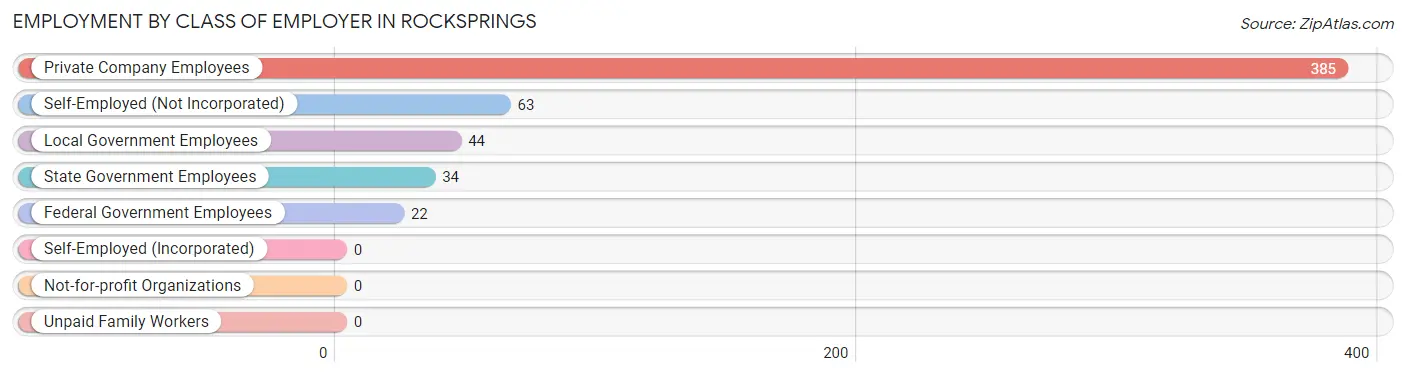
| Employer Class | # Employees | % Employees |
| Private Company Employees | 385 | 70.3% |
| Self-Employed (Incorporated) | 0 | 0.0% |
| Self-Employed (Not Incorporated) | 63 | 11.5% |
| Not-for-profit Organizations | 0 | 0.0% |
| Local Government Employees | 44 | 8.0% |
| State Government Employees | 34 | 6.2% |
| Federal Government Employees | 22 | 4.0% |
| Unpaid Family Workers | 0 | 0.0% |
| Total | 548 | 100.0% |
Employment Status by Age in Rocksprings
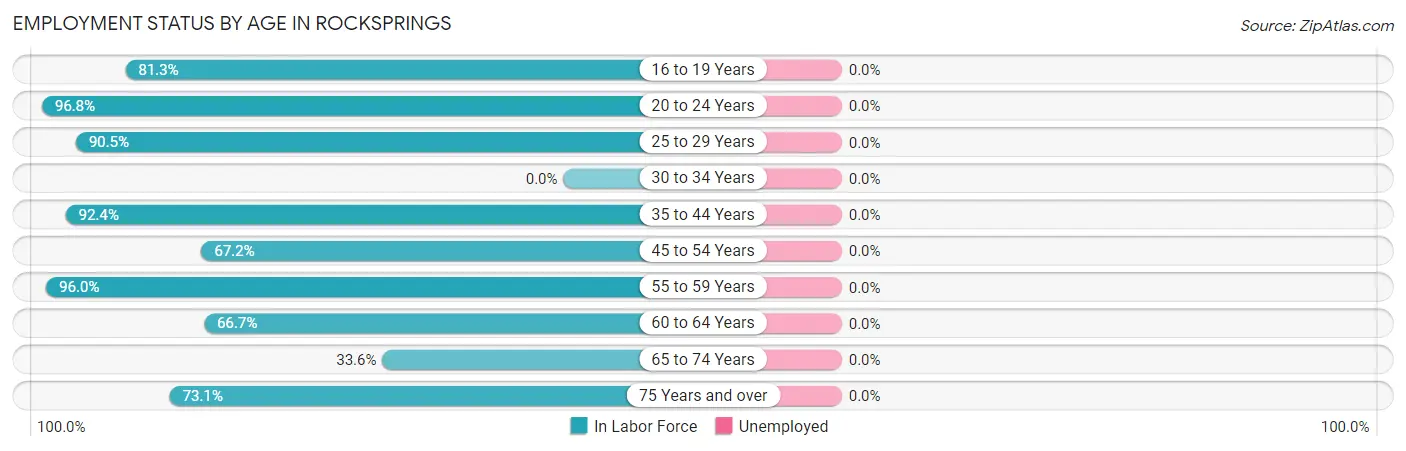
| Age Bracket | In Labor Force | Unemployed |
| 16 to 19 Years | 78 (81.3%) | 0 (0.0%) |
| 20 to 24 Years | 90 (96.8%) | 0 (0.0%) |
| 25 to 29 Years | 19 (90.5%) | 0 (0.0%) |
| 30 to 34 Years | 0 (0.0%) | 0 (0.0%) |
| 35 to 44 Years | 110 (92.4%) | 0 (0.0%) |
| 45 to 54 Years | 129 (67.2%) | 0 (0.0%) |
| 55 to 59 Years | 24 (96.0%) | 0 (0.0%) |
| 60 to 64 Years | 20 (66.7%) | 0 (0.0%) |
| 65 to 74 Years | 41 (33.6%) | 0 (0.0%) |
| 75 Years and over | 49 (73.1%) | 0 (0.0%) |
| Total | 560 (72.9%) | 0 (0.0%) |
Employment Status by Educational Attainment in Rocksprings
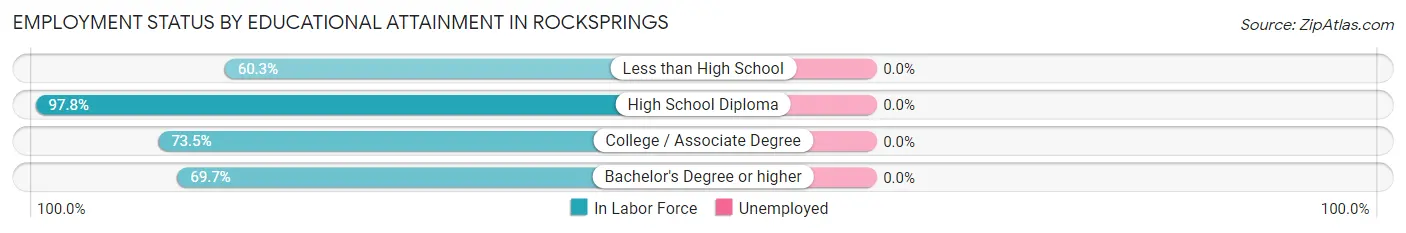
| Educational Attainment | In Labor Force | Unemployed |
| Less than High School | 73 (60.3%) | 0 (0.0%) |
| High School Diploma | 131 (97.8%) | 0 (0.0%) |
| College / Associate Degree | 75 (73.5%) | 0 (0.0%) |
| Bachelor's Degree or higher | 23 (69.7%) | 0 (0.0%) |
| Total | 302 (77.4%) | 0 (0.0%) |
Employment Occupations by Sex in Rocksprings
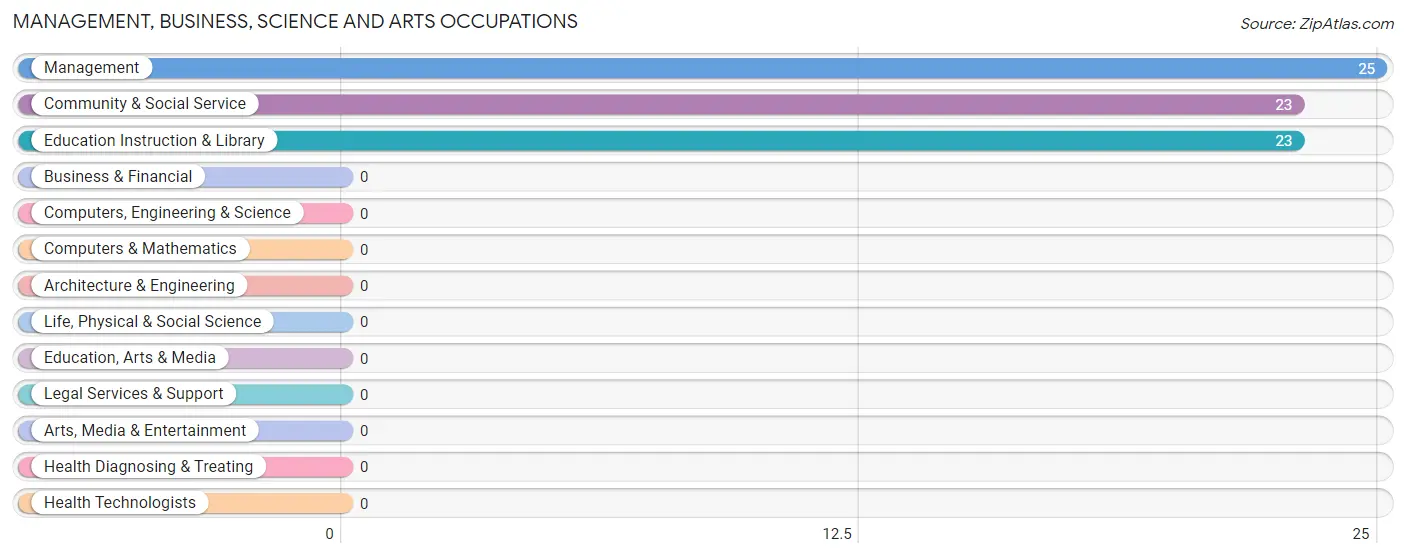
Management, Business, Science and Arts Occupations
The most common Management, Business, Science and Arts occupations in Rocksprings are Management (25 | 4.5%), Community & Social Service (23 | 4.1%), and Education Instruction & Library (23 | 4.1%).
Management, Business, Science and Arts Occupations by Sex
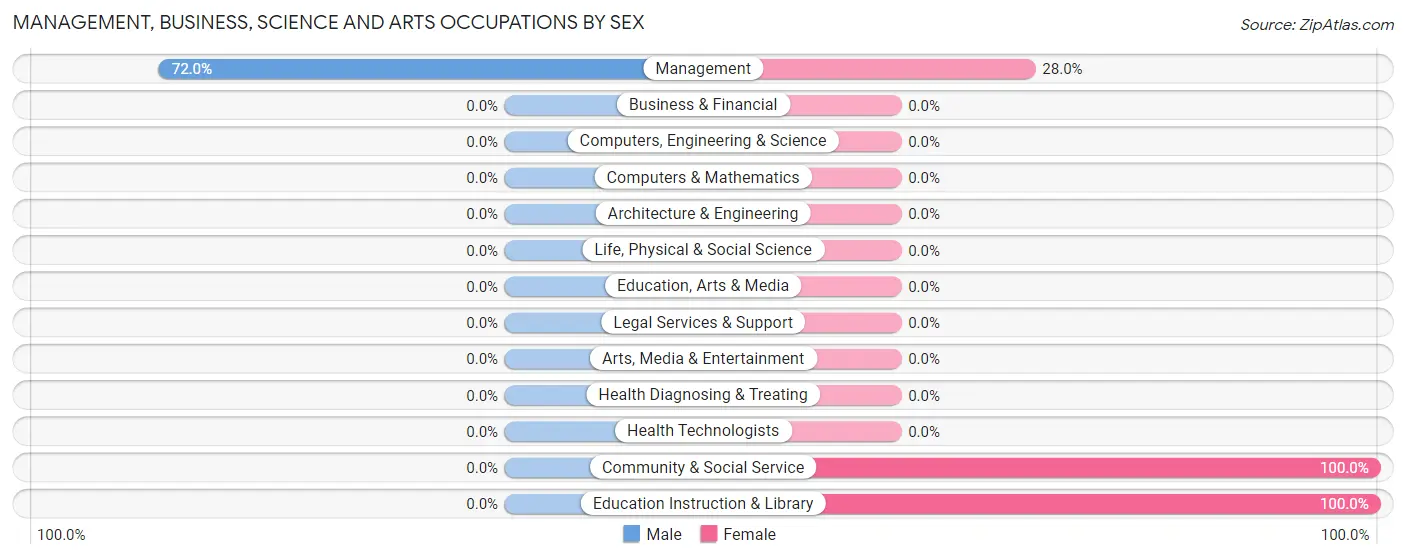
| Occupation | Male | Female |
| Management | 18 (72.0%) | 7 (28.0%) |
| Business & Financial | 0 (0.0%) | 0 (0.0%) |
| Computers, Engineering & Science | 0 (0.0%) | 0 (0.0%) |
| Computers & Mathematics | 0 (0.0%) | 0 (0.0%) |
| Architecture & Engineering | 0 (0.0%) | 0 (0.0%) |
| Life, Physical & Social Science | 0 (0.0%) | 0 (0.0%) |
| Community & Social Service | 0 (0.0%) | 23 (100.0%) |
| Education, Arts & Media | 0 (0.0%) | 0 (0.0%) |
| Legal Services & Support | 0 (0.0%) | 0 (0.0%) |
| Education Instruction & Library | 0 (0.0%) | 23 (100.0%) |
| Arts, Media & Entertainment | 0 (0.0%) | 0 (0.0%) |
| Health Diagnosing & Treating | 0 (0.0%) | 0 (0.0%) |
| Health Technologists | 0 (0.0%) | 0 (0.0%) |
| Total (Category) | 18 (37.5%) | 30 (62.5%) |
| Total (Overall) | 308 (55.0%) | 252 (45.0%) |
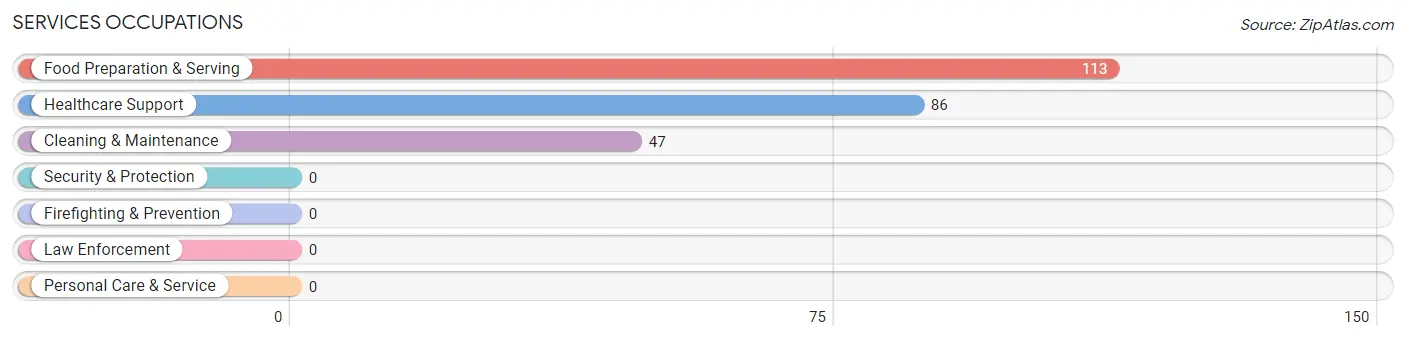
Services Occupations
The most common Services occupations in Rocksprings are Food Preparation & Serving (113 | 20.2%), Healthcare Support (86 | 15.4%), and Cleaning & Maintenance (47 | 8.4%).
Services Occupations by Sex
Within the Services occupations in Rocksprings, the most male-oriented occupations are Food Preparation & Serving (69.0%), and Cleaning & Maintenance (29.8%), while the most female-oriented occupations are Healthcare Support (100.0%), Cleaning & Maintenance (70.2%), and Food Preparation & Serving (31.0%).
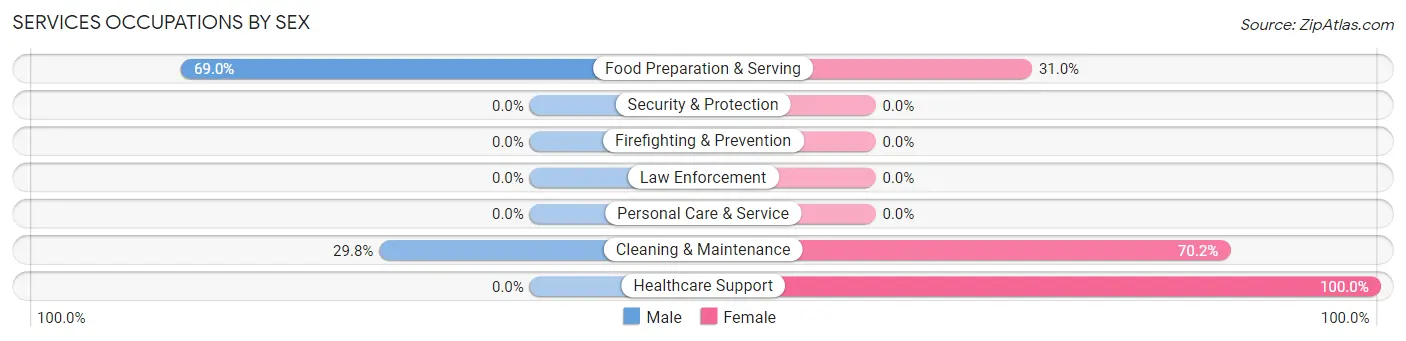
| Occupation | Male | Female |
| Healthcare Support | 0 (0.0%) | 86 (100.0%) |
| Security & Protection | 0 (0.0%) | 0 (0.0%) |
| Firefighting & Prevention | 0 (0.0%) | 0 (0.0%) |
| Law Enforcement | 0 (0.0%) | 0 (0.0%) |
| Food Preparation & Serving | 78 (69.0%) | 35 (31.0%) |
| Cleaning & Maintenance | 14 (29.8%) | 33 (70.2%) |
| Personal Care & Service | 0 (0.0%) | 0 (0.0%) |
| Total (Category) | 92 (37.4%) | 154 (62.6%) |
| Total (Overall) | 308 (55.0%) | 252 (45.0%) |
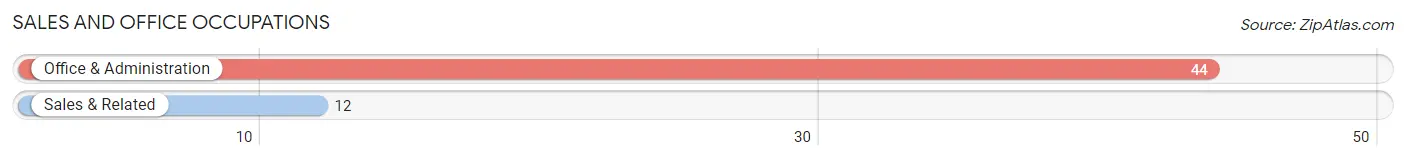
Sales and Office Occupations
The most common Sales and Office occupations in Rocksprings are Office & Administration (44 | 7.9%), and Sales & Related (12 | 2.1%).
Sales and Office Occupations by Sex
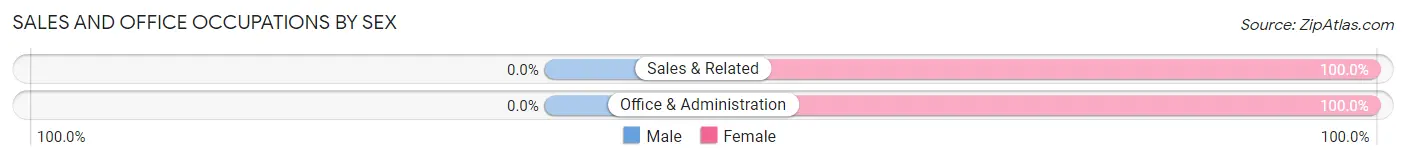
| Occupation | Male | Female |
| Sales & Related | 0 (0.0%) | 12 (100.0%) |
| Office & Administration | 0 (0.0%) | 44 (100.0%) |
| Total (Category) | 0 (0.0%) | 56 (100.0%) |
| Total (Overall) | 308 (55.0%) | 252 (45.0%) |
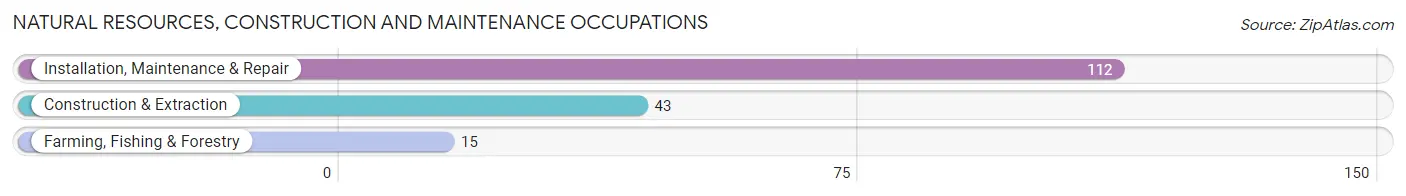
Natural Resources, Construction and Maintenance Occupations
The most common Natural Resources, Construction and Maintenance occupations in Rocksprings are Installation, Maintenance & Repair (112 | 20.0%), Construction & Extraction (43 | 7.7%), and Farming, Fishing & Forestry (15 | 2.7%).
Natural Resources, Construction and Maintenance Occupations by Sex
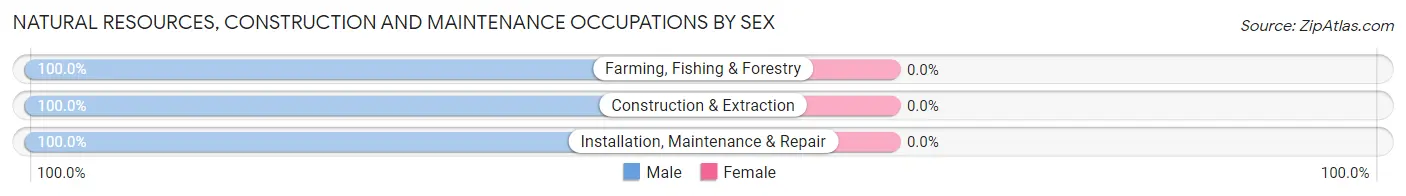
| Occupation | Male | Female |
| Farming, Fishing & Forestry | 15 (100.0%) | 0 (0.0%) |
| Construction & Extraction | 43 (100.0%) | 0 (0.0%) |
| Installation, Maintenance & Repair | 112 (100.0%) | 0 (0.0%) |
| Total (Category) | 170 (100.0%) | 0 (0.0%) |
| Total (Overall) | 308 (55.0%) | 252 (45.0%) |
Production, Transportation and Moving Occupations
The most common Production, Transportation and Moving occupations in Rocksprings are Transportation (24 | 4.3%), and Material Moving (16 | 2.9%).
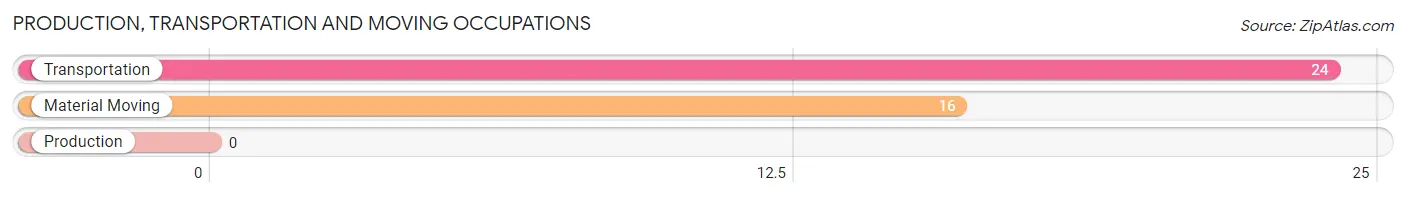
Production, Transportation and Moving Occupations by Sex
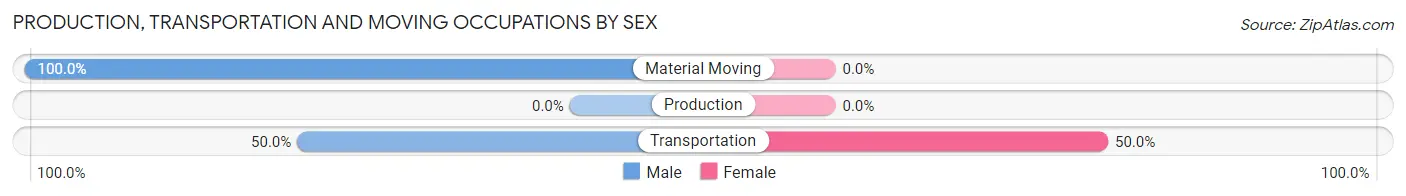
| Occupation | Male | Female |
| Production | 0 (0.0%) | 0 (0.0%) |
| Transportation | 12 (50.0%) | 12 (50.0%) |
| Material Moving | 16 (100.0%) | 0 (0.0%) |
| Total (Category) | 28 (70.0%) | 12 (30.0%) |
| Total (Overall) | 308 (55.0%) | 252 (45.0%) |
Employment Industries by Sex in Rocksprings
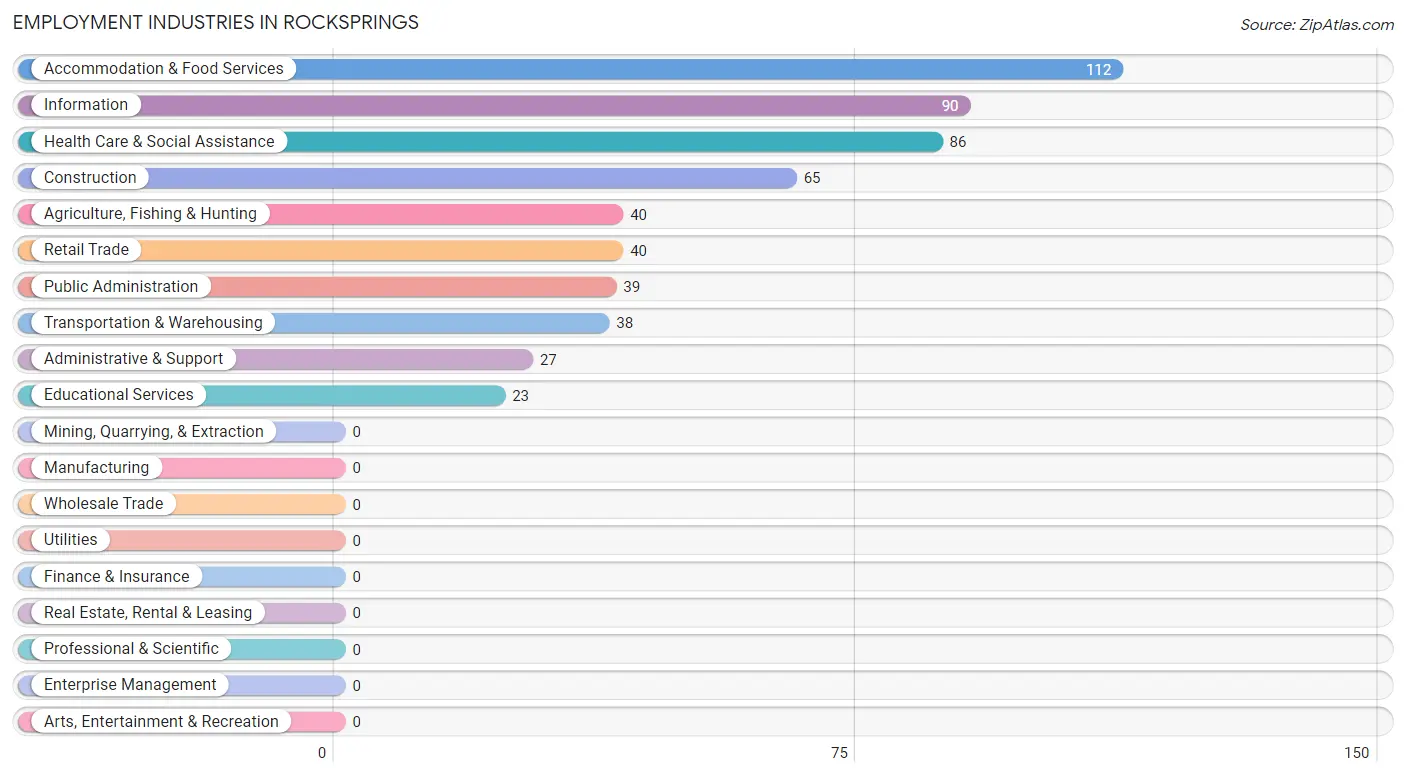
Employment Industries in Rocksprings
The major employment industries in Rocksprings include Accommodation & Food Services (112 | 20.0%), Information (90 | 16.1%), Health Care & Social Assistance (86 | 15.4%), Construction (65 | 11.6%), and Agriculture, Fishing & Hunting (40 | 7.1%).
Employment Industries by Sex in Rocksprings
The Rocksprings industries that see more men than women are Construction (100.0%), Information (100.0%), and Agriculture, Fishing & Hunting (82.5%), whereas the industries that tend to have a higher number of women are Educational Services (100.0%), Health Care & Social Assistance (100.0%), and Public Administration (100.0%).
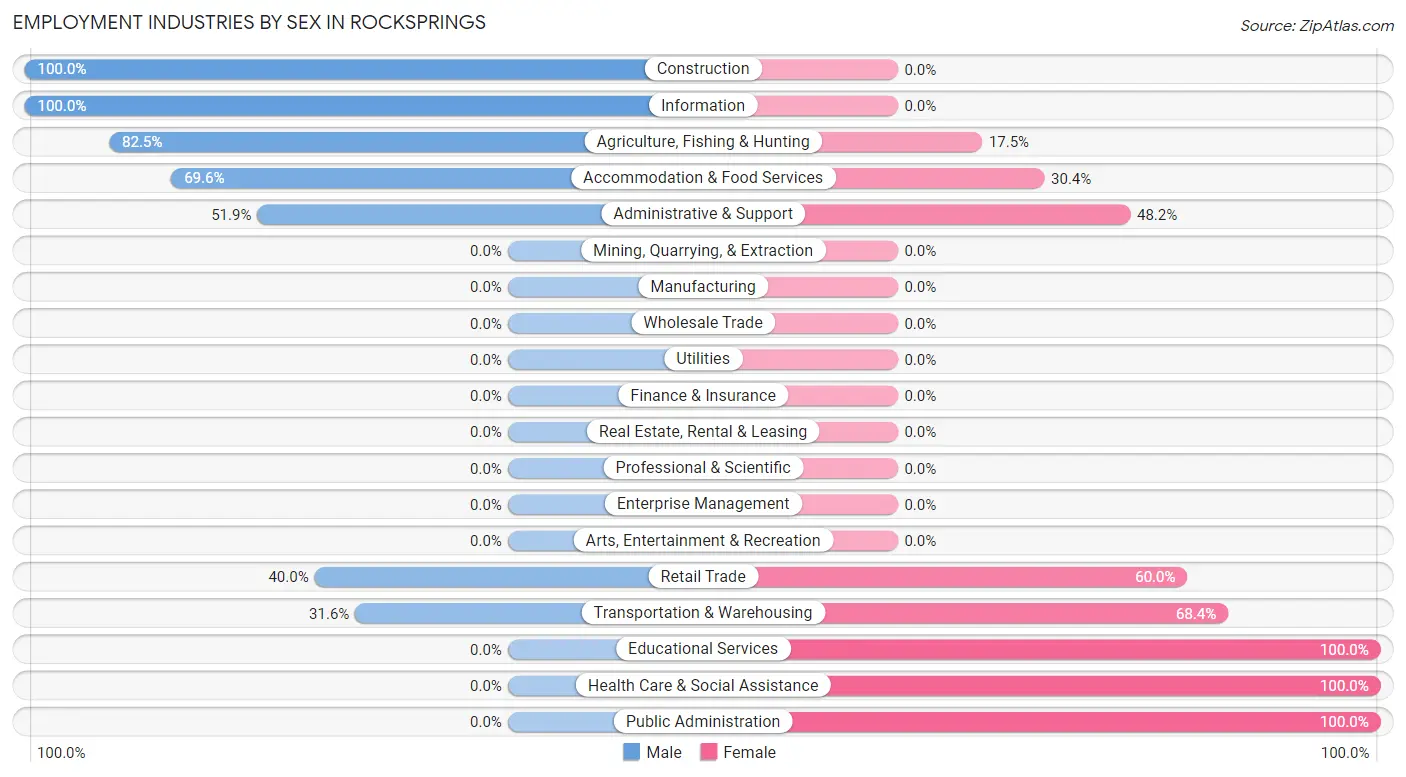
| Industry | Male | Female |
| Agriculture, Fishing & Hunting | 33 (82.5%) | 7 (17.5%) |
| Mining, Quarrying, & Extraction | 0 (0.0%) | 0 (0.0%) |
| Construction | 65 (100.0%) | 0 (0.0%) |
| Manufacturing | 0 (0.0%) | 0 (0.0%) |
| Wholesale Trade | 0 (0.0%) | 0 (0.0%) |
| Retail Trade | 16 (40.0%) | 24 (60.0%) |
| Transportation & Warehousing | 12 (31.6%) | 26 (68.4%) |
| Utilities | 0 (0.0%) | 0 (0.0%) |
| Information | 90 (100.0%) | 0 (0.0%) |
| Finance & Insurance | 0 (0.0%) | 0 (0.0%) |
| Real Estate, Rental & Leasing | 0 (0.0%) | 0 (0.0%) |
| Professional & Scientific | 0 (0.0%) | 0 (0.0%) |
| Enterprise Management | 0 (0.0%) | 0 (0.0%) |
| Administrative & Support | 14 (51.8%) | 13 (48.1%) |
| Educational Services | 0 (0.0%) | 23 (100.0%) |
| Health Care & Social Assistance | 0 (0.0%) | 86 (100.0%) |
| Arts, Entertainment & Recreation | 0 (0.0%) | 0 (0.0%) |
| Accommodation & Food Services | 78 (69.6%) | 34 (30.4%) |
| Public Administration | 0 (0.0%) | 39 (100.0%) |
| Total | 308 (55.0%) | 252 (45.0%) |
Education in Rocksprings
School Enrollment in Rocksprings
The most common levels of schooling among the 294 students in Rocksprings are high school (125 | 42.5%), elementary school (69 | 23.5%), and nursery / preschool (51 | 17.3%).
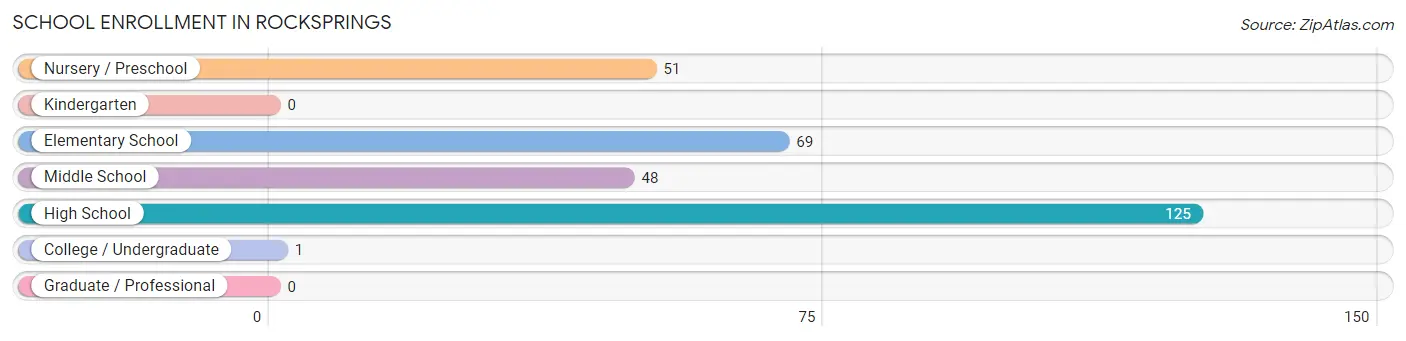
| School Level | # Students | % Students |
| Nursery / Preschool | 51 | 17.3% |
| Kindergarten | 0 | 0.0% |
| Elementary School | 69 | 23.5% |
| Middle School | 48 | 16.3% |
| High School | 125 | 42.5% |
| College / Undergraduate | 1 | 0.3% |
| Graduate / Professional | 0 | 0.0% |
| Total | 294 | 100.0% |
School Enrollment by Age by Funding Source in Rocksprings
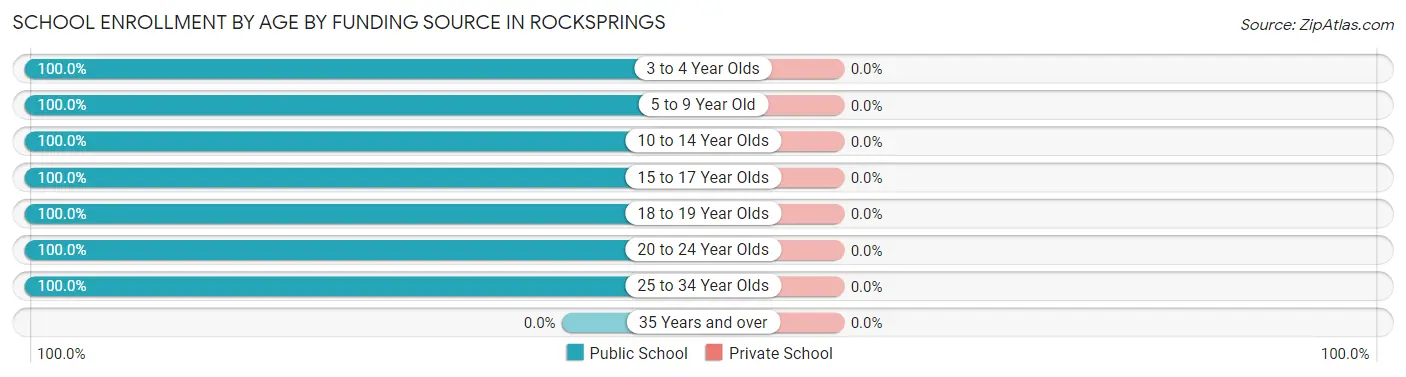
| Age Bracket | Public School | Private School |
| 3 to 4 Year Olds | 25 (100.0%) | 0 (0.0%) |
| 5 to 9 Year Old | 72 (100.0%) | 0 (0.0%) |
| 10 to 14 Year Olds | 71 (100.0%) | 0 (0.0%) |
| 15 to 17 Year Olds | 46 (100.0%) | 0 (0.0%) |
| 18 to 19 Year Olds | 78 (100.0%) | 0 (0.0%) |
| 20 to 24 Year Olds | 1 (100.0%) | 0 (0.0%) |
| 25 to 34 Year Olds | 1 (100.0%) | 0 (0.0%) |
| 35 Years and over | 0 (0.0%) | 0 (0.0%) |
| Total | 294 (100.0%) | 0 (0.0%) |
Educational Attainment by Field of Study in Rocksprings
Bio, nature & agricultural (21 | 42.0%), education (12 | 24.0%), engineering (10 | 20.0%), and physical & health sciences (7 | 14.0%) are the most common fields of study among 50 individuals in Rocksprings who have obtained a bachelor's degree or higher.
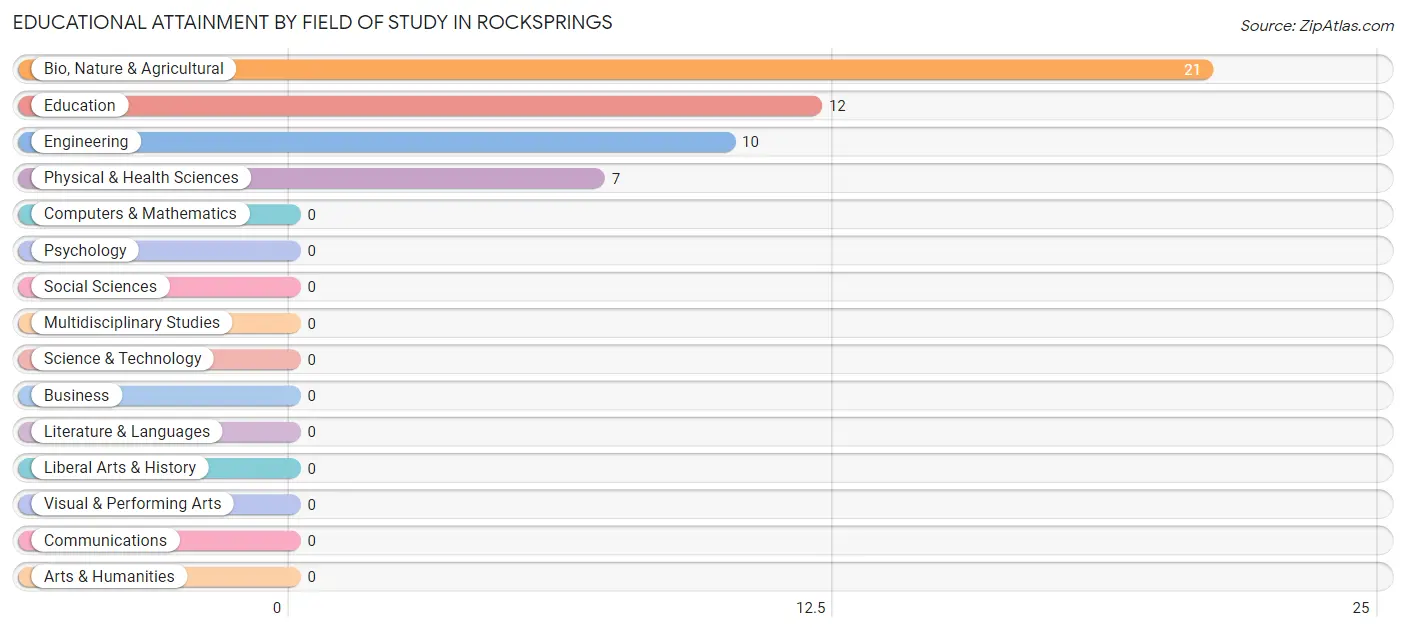
| Field of Study | # Graduates | % Graduates |
| Computers & Mathematics | 0 | 0.0% |
| Bio, Nature & Agricultural | 21 | 42.0% |
| Physical & Health Sciences | 7 | 14.0% |
| Psychology | 0 | 0.0% |
| Social Sciences | 0 | 0.0% |
| Engineering | 10 | 20.0% |
| Multidisciplinary Studies | 0 | 0.0% |
| Science & Technology | 0 | 0.0% |
| Business | 0 | 0.0% |
| Education | 12 | 24.0% |
| Literature & Languages | 0 | 0.0% |
| Liberal Arts & History | 0 | 0.0% |
| Visual & Performing Arts | 0 | 0.0% |
| Communications | 0 | 0.0% |
| Arts & Humanities | 0 | 0.0% |
| Total | 50 | 100.0% |
Transportation & Commute in Rocksprings
Vehicle Availability by Sex in Rocksprings
The most prevalent vehicle ownership categories in Rocksprings are males with 1 vehicle (127, accounting for 41.2%) and females with 1 vehicle (177, making up 52.9%).
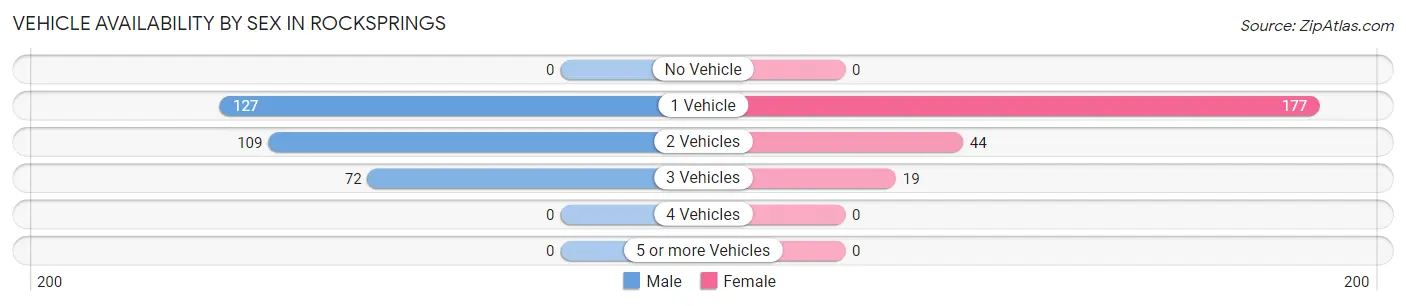
| Vehicles Available | Male | Female |
| No Vehicle | 0 (0.0%) | 0 (0.0%) |
| 1 Vehicle | 127 (41.2%) | 177 (73.8%) |
| 2 Vehicles | 109 (35.4%) | 44 (18.3%) |
| 3 Vehicles | 72 (23.4%) | 19 (7.9%) |
| 4 Vehicles | 0 (0.0%) | 0 (0.0%) |
| 5 or more Vehicles | 0 (0.0%) | 0 (0.0%) |
| Total | 308 (100.0%) | 240 (100.0%) |
Commute Time in Rocksprings
The most frequently occuring commute durations in Rocksprings are 5 to 9 minutes (163 commuters, 30.8%), less than 5 minutes (105 commuters, 19.9%), and 45 to 59 minutes (90 commuters, 17.0%).
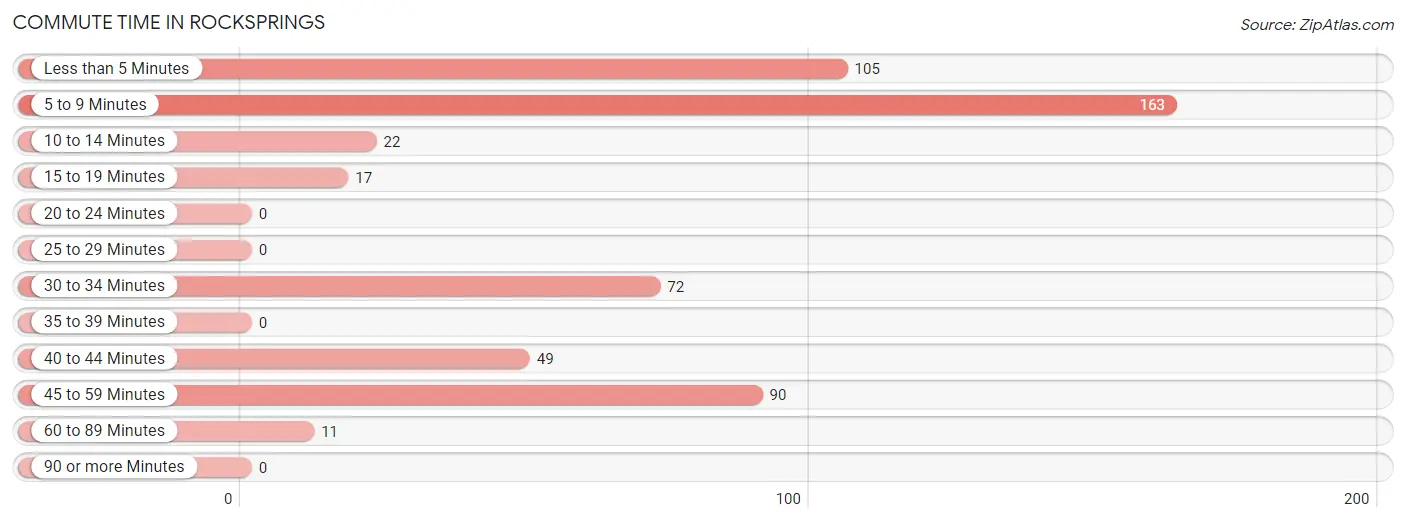
| Commute Time | # Commuters | % Commuters |
| Less than 5 Minutes | 105 | 19.9% |
| 5 to 9 Minutes | 163 | 30.8% |
| 10 to 14 Minutes | 22 | 4.2% |
| 15 to 19 Minutes | 17 | 3.2% |
| 20 to 24 Minutes | 0 | 0.0% |
| 25 to 29 Minutes | 0 | 0.0% |
| 30 to 34 Minutes | 72 | 13.6% |
| 35 to 39 Minutes | 0 | 0.0% |
| 40 to 44 Minutes | 49 | 9.3% |
| 45 to 59 Minutes | 90 | 17.0% |
| 60 to 89 Minutes | 11 | 2.1% |
| 90 or more Minutes | 0 | 0.0% |
Commute Time by Sex in Rocksprings
The most common commute times in Rocksprings are 45 to 59 minutes (90 commuters, 29.2%) for males and 5 to 9 minutes (104 commuters, 47.1%) for females.
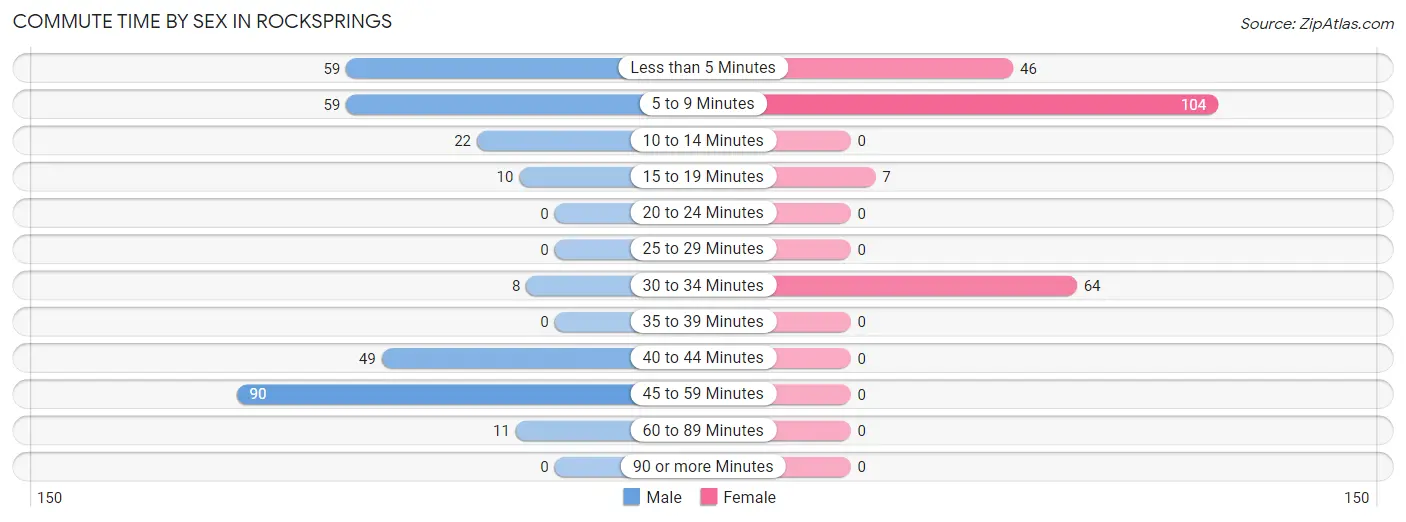
| Commute Time | Male | Female |
| Less than 5 Minutes | 59 (19.2%) | 46 (20.8%) |
| 5 to 9 Minutes | 59 (19.2%) | 104 (47.1%) |
| 10 to 14 Minutes | 22 (7.1%) | 0 (0.0%) |
| 15 to 19 Minutes | 10 (3.3%) | 7 (3.2%) |
| 20 to 24 Minutes | 0 (0.0%) | 0 (0.0%) |
| 25 to 29 Minutes | 0 (0.0%) | 0 (0.0%) |
| 30 to 34 Minutes | 8 (2.6%) | 64 (29.0%) |
| 35 to 39 Minutes | 0 (0.0%) | 0 (0.0%) |
| 40 to 44 Minutes | 49 (15.9%) | 0 (0.0%) |
| 45 to 59 Minutes | 90 (29.2%) | 0 (0.0%) |
| 60 to 89 Minutes | 11 (3.6%) | 0 (0.0%) |
| 90 or more Minutes | 0 (0.0%) | 0 (0.0%) |
Time of Departure to Work by Sex in Rocksprings
The most frequent times of departure to work in Rocksprings are 7:00 AM to 7:29 AM (130, 42.2%) for males and 12:00 AM to 4:59 AM (56, 25.3%) for females.
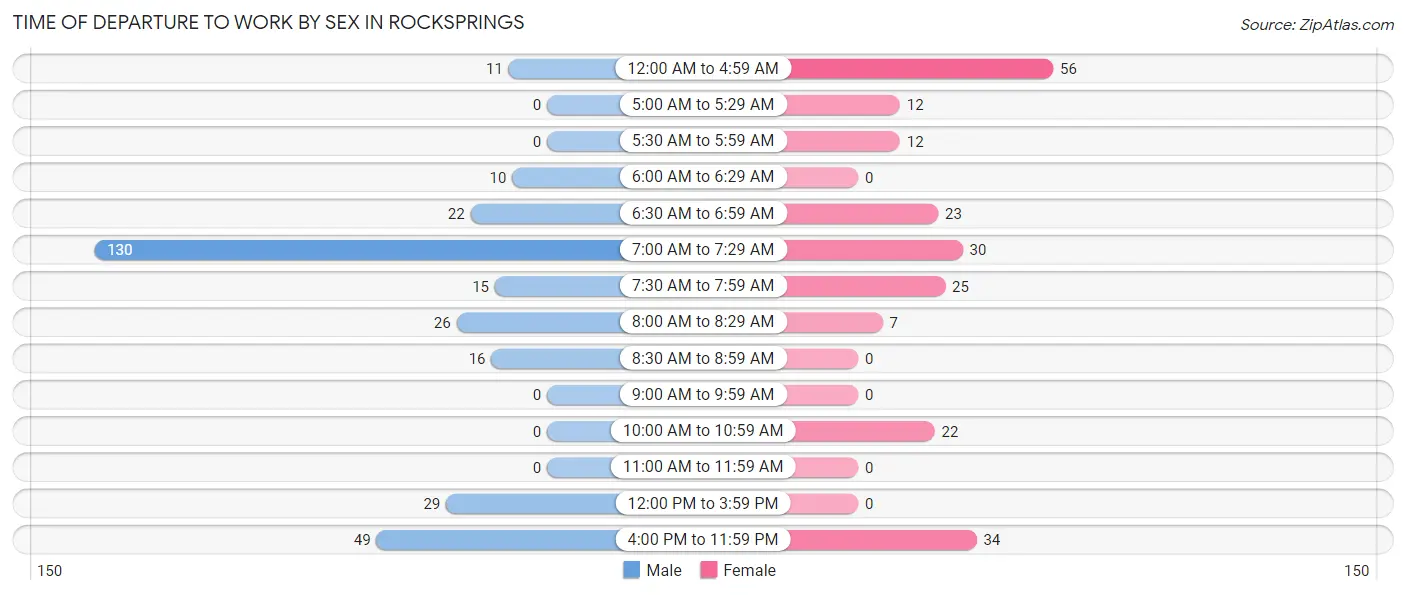
| Time of Departure | Male | Female |
| 12:00 AM to 4:59 AM | 11 (3.6%) | 56 (25.3%) |
| 5:00 AM to 5:29 AM | 0 (0.0%) | 12 (5.4%) |
| 5:30 AM to 5:59 AM | 0 (0.0%) | 12 (5.4%) |
| 6:00 AM to 6:29 AM | 10 (3.3%) | 0 (0.0%) |
| 6:30 AM to 6:59 AM | 22 (7.1%) | 23 (10.4%) |
| 7:00 AM to 7:29 AM | 130 (42.2%) | 30 (13.6%) |
| 7:30 AM to 7:59 AM | 15 (4.9%) | 25 (11.3%) |
| 8:00 AM to 8:29 AM | 26 (8.4%) | 7 (3.2%) |
| 8:30 AM to 8:59 AM | 16 (5.2%) | 0 (0.0%) |
| 9:00 AM to 9:59 AM | 0 (0.0%) | 0 (0.0%) |
| 10:00 AM to 10:59 AM | 0 (0.0%) | 22 (10.0%) |
| 11:00 AM to 11:59 AM | 0 (0.0%) | 0 (0.0%) |
| 12:00 PM to 3:59 PM | 29 (9.4%) | 0 (0.0%) |
| 4:00 PM to 11:59 PM | 49 (15.9%) | 34 (15.4%) |
| Total | 308 (100.0%) | 221 (100.0%) |
Housing Occupancy in Rocksprings
Occupancy by Ownership in Rocksprings
Of the total 376 dwellings in Rocksprings, owner-occupied units account for 283 (75.3%), while renter-occupied units make up 93 (24.7%).
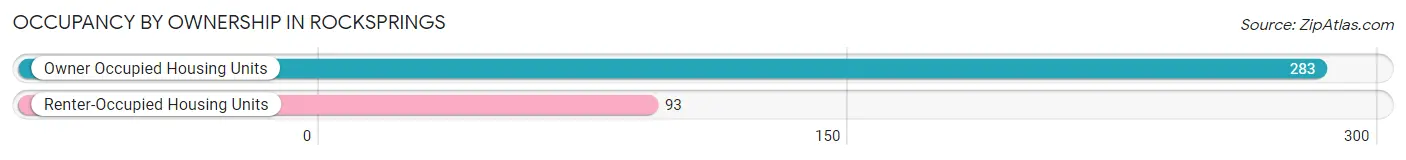
| Occupancy | # Housing Units | % Housing Units |
| Owner Occupied Housing Units | 283 | 75.3% |
| Renter-Occupied Housing Units | 93 | 24.7% |
| Total Occupied Housing Units | 376 | 100.0% |
Occupancy by Household Size in Rocksprings
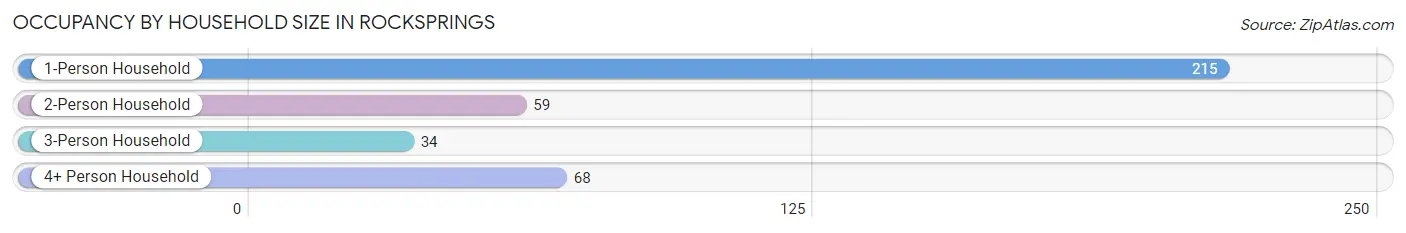
| Household Size | # Housing Units | % Housing Units |
| 1-Person Household | 215 | 57.2% |
| 2-Person Household | 59 | 15.7% |
| 3-Person Household | 34 | 9.0% |
| 4+ Person Household | 68 | 18.1% |
| Total Housing Units | 376 | 100.0% |
Occupancy by Ownership by Household Size in Rocksprings
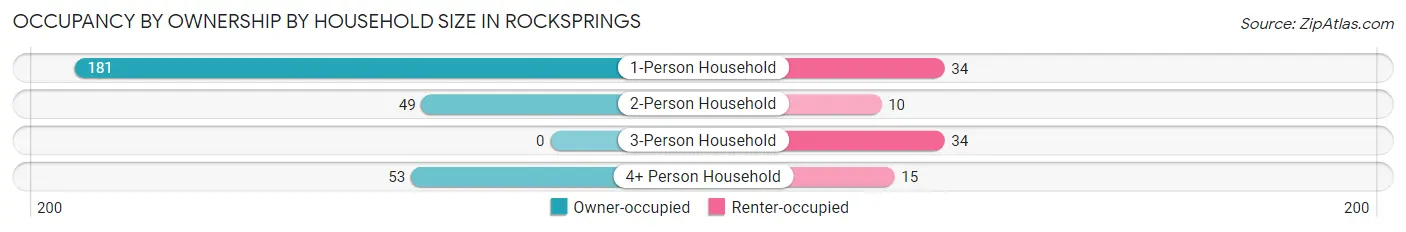
| Household Size | Owner-occupied | Renter-occupied |
| 1-Person Household | 181 (84.2%) | 34 (15.8%) |
| 2-Person Household | 49 (83.1%) | 10 (17.0%) |
| 3-Person Household | 0 (0.0%) | 34 (100.0%) |
| 4+ Person Household | 53 (77.9%) | 15 (22.1%) |
| Total Housing Units | 283 (75.3%) | 93 (24.7%) |
Occupancy by Educational Attainment in Rocksprings
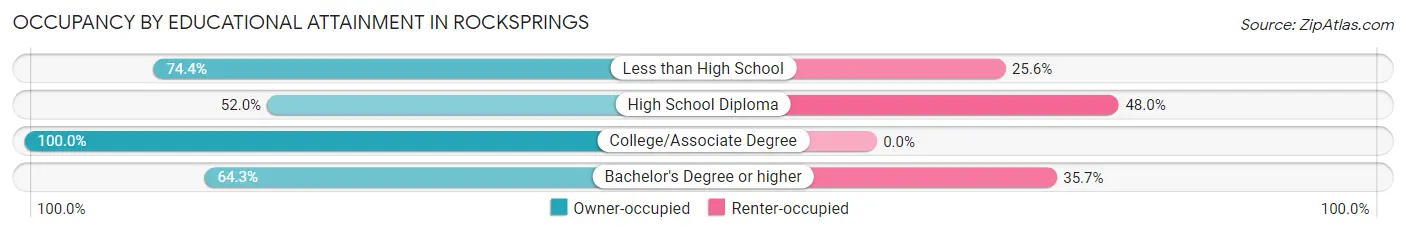
| Household Size | Owner-occupied | Renter-occupied |
| Less than High School | 99 (74.4%) | 34 (25.6%) |
| High School Diploma | 53 (52.0%) | 49 (48.0%) |
| College/Associate Degree | 113 (100.0%) | 0 (0.0%) |
| Bachelor's Degree or higher | 18 (64.3%) | 10 (35.7%) |
Occupancy by Age of Householder in Rocksprings
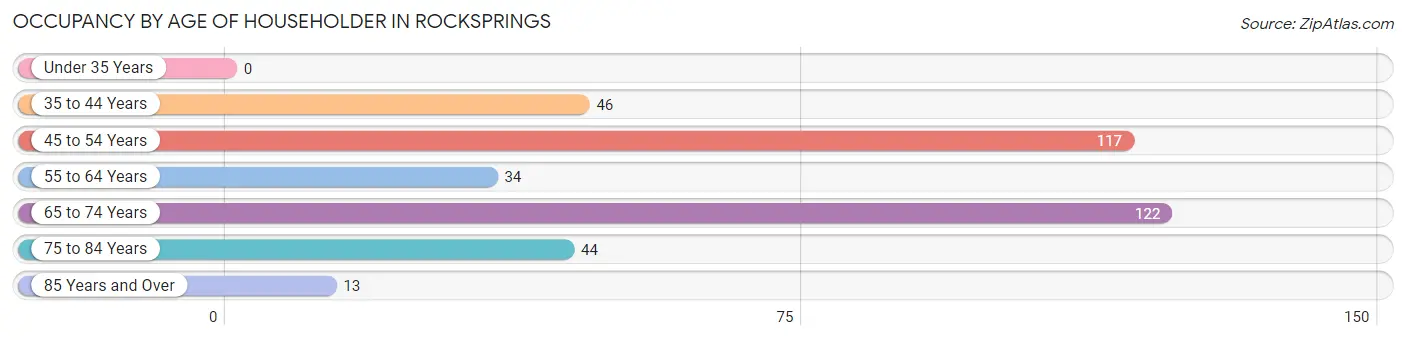
| Age Bracket | # Households | % Households |
| Under 35 Years | 0 | 0.0% |
| 35 to 44 Years | 46 | 12.2% |
| 45 to 54 Years | 117 | 31.1% |
| 55 to 64 Years | 34 | 9.0% |
| 65 to 74 Years | 122 | 32.5% |
| 75 to 84 Years | 44 | 11.7% |
| 85 Years and Over | 13 | 3.5% |
| Total | 376 | 100.0% |
Housing Finances in Rocksprings
Median Income by Occupancy in Rocksprings
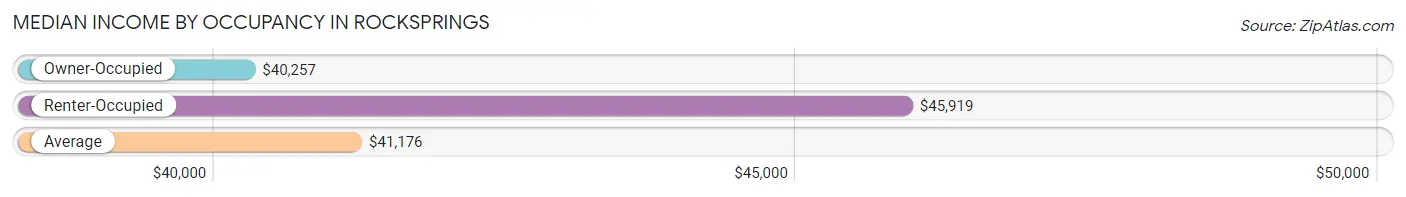
| Occupancy Type | # Households | Median Income |
| Owner-Occupied | 283 (75.3%) | $40,257 |
| Renter-Occupied | 93 (24.7%) | $45,919 |
| Average | 376 (100.0%) | $41,176 |
Occupancy by Householder Income Bracket in Rocksprings
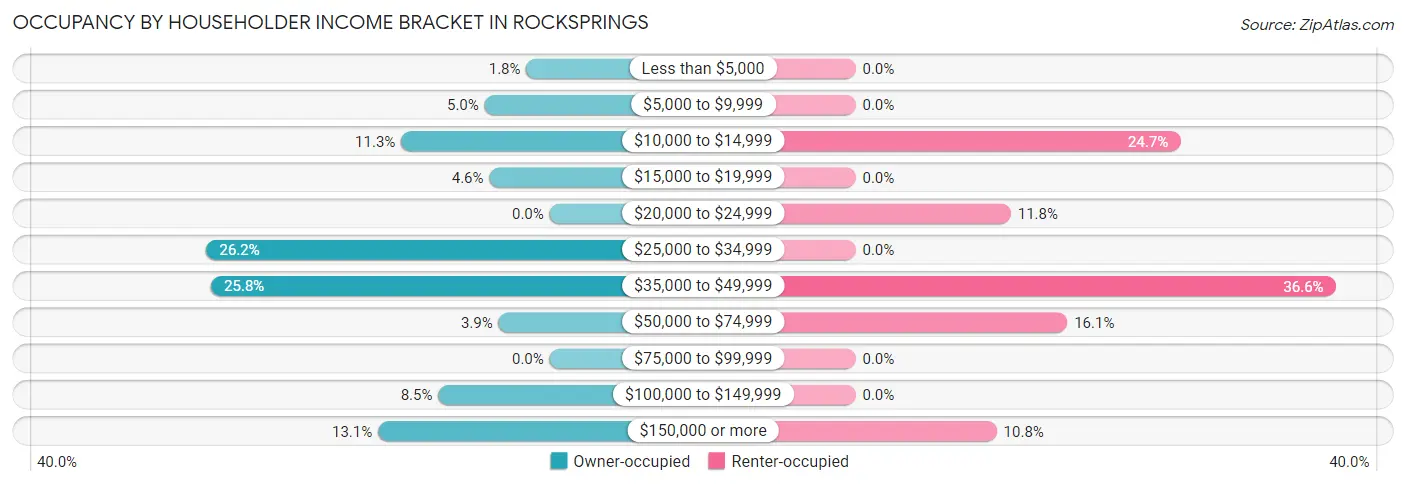
| Income Bracket | Owner-occupied | Renter-occupied |
| Less than $5,000 | 5 (1.8%) | 0 (0.0%) |
| $5,000 to $9,999 | 14 (5.0%) | 0 (0.0%) |
| $10,000 to $14,999 | 32 (11.3%) | 23 (24.7%) |
| $15,000 to $19,999 | 13 (4.6%) | 0 (0.0%) |
| $20,000 to $24,999 | 0 (0.0%) | 11 (11.8%) |
| $25,000 to $34,999 | 74 (26.2%) | 0 (0.0%) |
| $35,000 to $49,999 | 73 (25.8%) | 34 (36.6%) |
| $50,000 to $74,999 | 11 (3.9%) | 15 (16.1%) |
| $75,000 to $99,999 | 0 (0.0%) | 0 (0.0%) |
| $100,000 to $149,999 | 24 (8.5%) | 0 (0.0%) |
| $150,000 or more | 37 (13.1%) | 10 (10.7%) |
| Total | 283 (100.0%) | 93 (100.0%) |
Monthly Housing Cost Tiers in Rocksprings
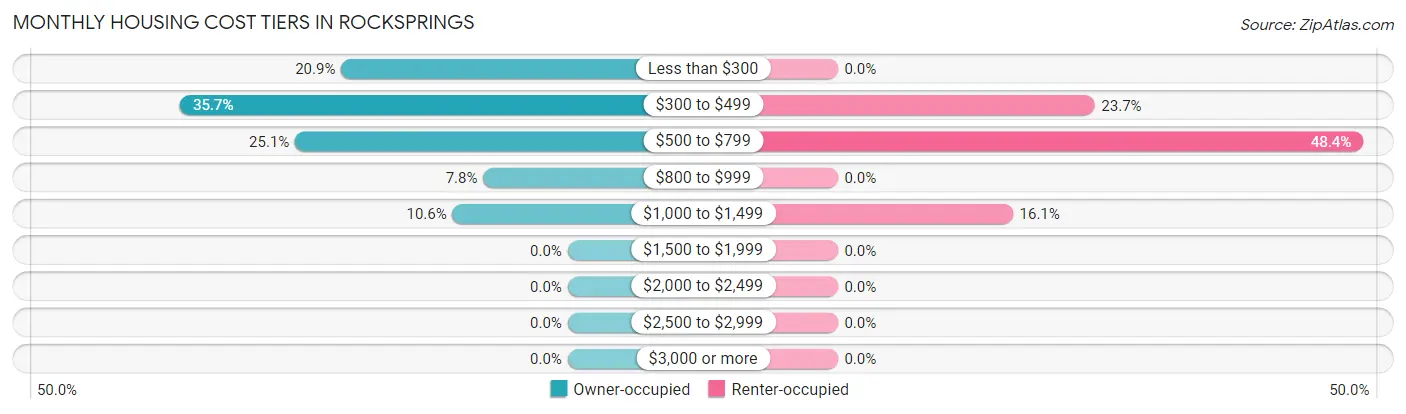
| Monthly Cost | Owner-occupied | Renter-occupied |
| Less than $300 | 59 (20.8%) | 0 (0.0%) |
| $300 to $499 | 101 (35.7%) | 22 (23.7%) |
| $500 to $799 | 71 (25.1%) | 45 (48.4%) |
| $800 to $999 | 22 (7.8%) | 0 (0.0%) |
| $1,000 to $1,499 | 30 (10.6%) | 15 (16.1%) |
| $1,500 to $1,999 | 0 (0.0%) | 0 (0.0%) |
| $2,000 to $2,499 | 0 (0.0%) | 0 (0.0%) |
| $2,500 to $2,999 | 0 (0.0%) | 0 (0.0%) |
| $3,000 or more | 0 (0.0%) | 0 (0.0%) |
| Total | 283 (100.0%) | 93 (100.0%) |
Physical Housing Characteristics in Rocksprings
Housing Structures in Rocksprings
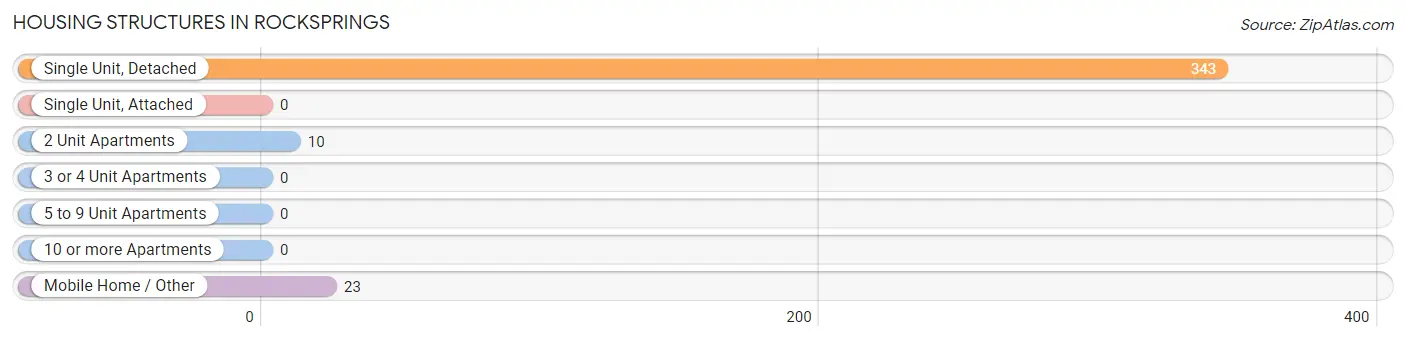
| Structure Type | # Housing Units | % Housing Units |
| Single Unit, Detached | 343 | 91.2% |
| Single Unit, Attached | 0 | 0.0% |
| 2 Unit Apartments | 10 | 2.7% |
| 3 or 4 Unit Apartments | 0 | 0.0% |
| 5 to 9 Unit Apartments | 0 | 0.0% |
| 10 or more Apartments | 0 | 0.0% |
| Mobile Home / Other | 23 | 6.1% |
| Total | 376 | 100.0% |
Housing Structures by Occupancy in Rocksprings
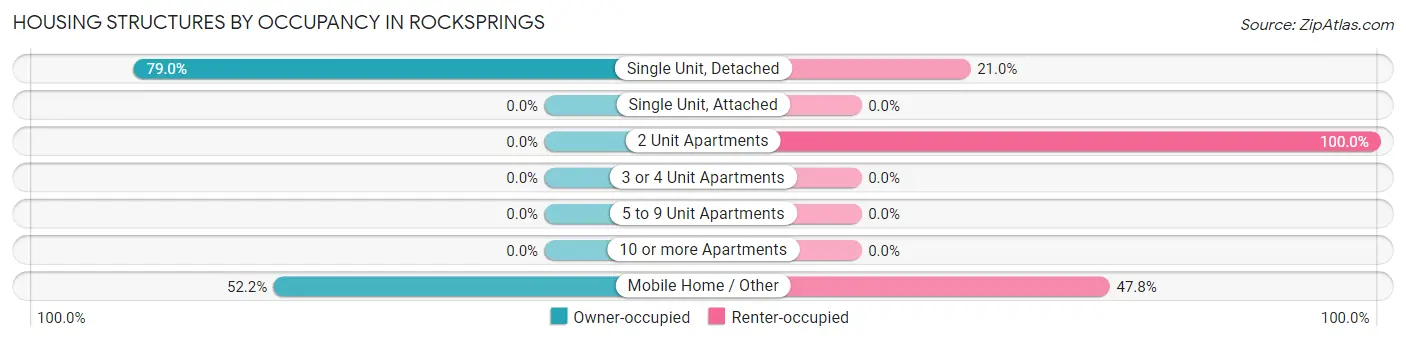
| Structure Type | Owner-occupied | Renter-occupied |
| Single Unit, Detached | 271 (79.0%) | 72 (21.0%) |
| Single Unit, Attached | 0 (0.0%) | 0 (0.0%) |
| 2 Unit Apartments | 0 (0.0%) | 10 (100.0%) |
| 3 or 4 Unit Apartments | 0 (0.0%) | 0 (0.0%) |
| 5 to 9 Unit Apartments | 0 (0.0%) | 0 (0.0%) |
| 10 or more Apartments | 0 (0.0%) | 0 (0.0%) |
| Mobile Home / Other | 12 (52.2%) | 11 (47.8%) |
| Total | 283 (75.3%) | 93 (24.7%) |
Housing Structures by Number of Rooms in Rocksprings
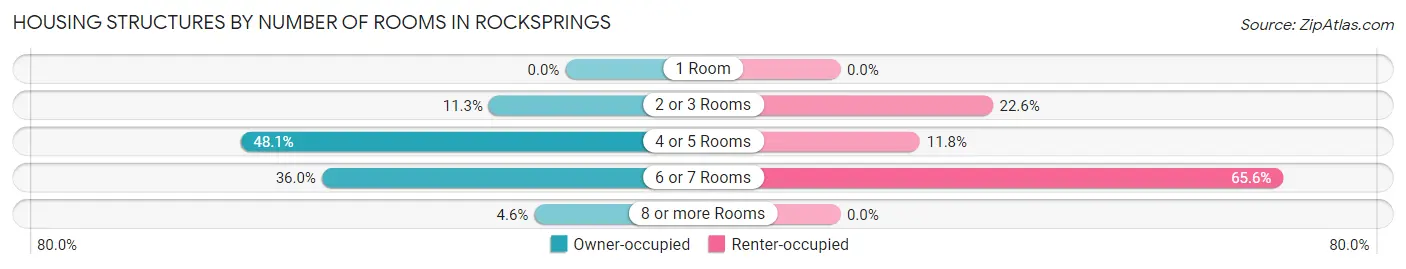
| Number of Rooms | Owner-occupied | Renter-occupied |
| 1 Room | 0 (0.0%) | 0 (0.0%) |
| 2 or 3 Rooms | 32 (11.3%) | 21 (22.6%) |
| 4 or 5 Rooms | 136 (48.1%) | 11 (11.8%) |
| 6 or 7 Rooms | 102 (36.0%) | 61 (65.6%) |
| 8 or more Rooms | 13 (4.6%) | 0 (0.0%) |
| Total | 283 (100.0%) | 93 (100.0%) |
Housing Structure by Heating Type in Rocksprings
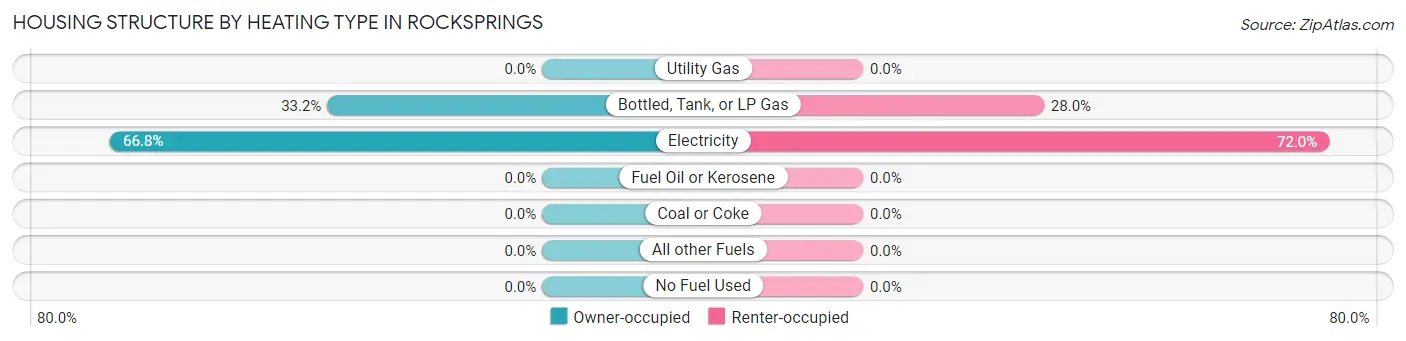
| Heating Type | Owner-occupied | Renter-occupied |
| Utility Gas | 0 (0.0%) | 0 (0.0%) |
| Bottled, Tank, or LP Gas | 94 (33.2%) | 26 (28.0%) |
| Electricity | 189 (66.8%) | 67 (72.0%) |
| Fuel Oil or Kerosene | 0 (0.0%) | 0 (0.0%) |
| Coal or Coke | 0 (0.0%) | 0 (0.0%) |
| All other Fuels | 0 (0.0%) | 0 (0.0%) |
| No Fuel Used | 0 (0.0%) | 0 (0.0%) |
| Total | 283 (100.0%) | 93 (100.0%) |
Household Vehicle Usage in Rocksprings
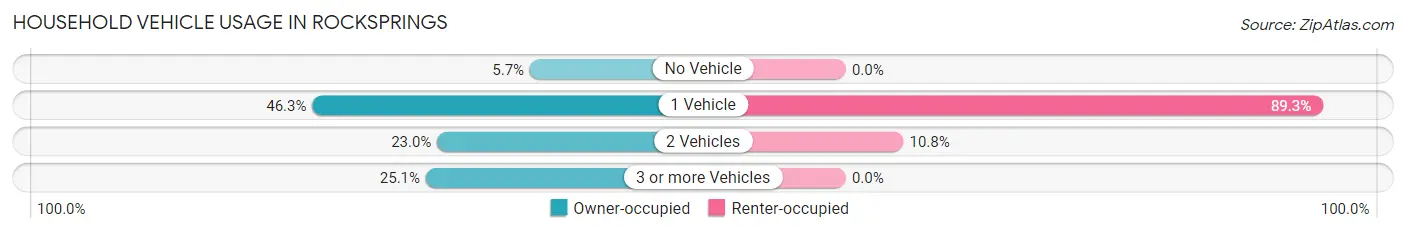
| Vehicles per Household | Owner-occupied | Renter-occupied |
| No Vehicle | 16 (5.7%) | 0 (0.0%) |
| 1 Vehicle | 131 (46.3%) | 83 (89.2%) |
| 2 Vehicles | 65 (23.0%) | 10 (10.7%) |
| 3 or more Vehicles | 71 (25.1%) | 0 (0.0%) |
| Total | 283 (100.0%) | 93 (100.0%) |
Real Estate & Mortgages in Rocksprings
Real Estate and Mortgage Overview in Rocksprings
| Characteristic | Without Mortgage | With Mortgage |
| Housing Units | 215 | 68 |
| Median Property Value | $43,800 | $88,200 |
| Median Household Income | $31,367 | $30 |
| Monthly Housing Costs | $383 | $0 |
| Real Estate Taxes | $534 | $0 |
Property Value by Mortgage Status in Rocksprings
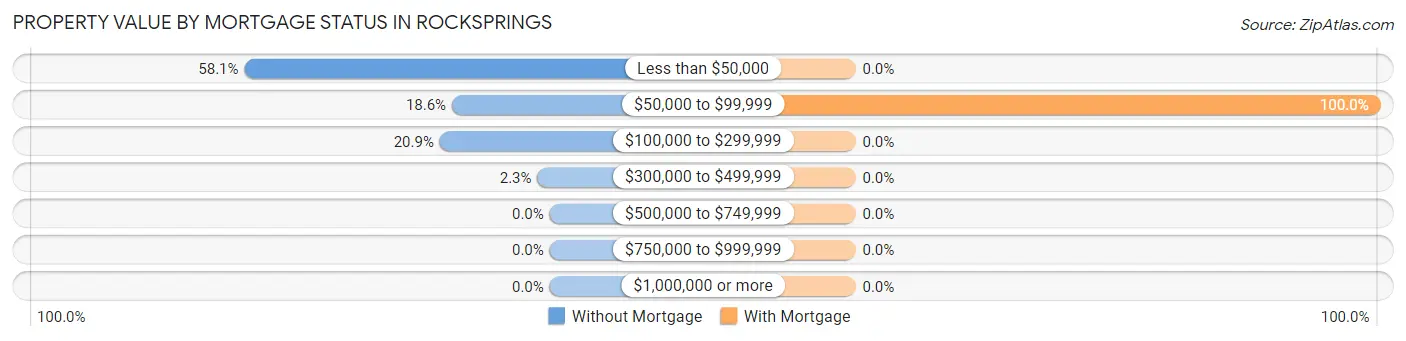
| Property Value | Without Mortgage | With Mortgage |
| Less than $50,000 | 125 (58.1%) | 0 (0.0%) |
| $50,000 to $99,999 | 40 (18.6%) | 68 (100.0%) |
| $100,000 to $299,999 | 45 (20.9%) | 0 (0.0%) |
| $300,000 to $499,999 | 5 (2.3%) | 0 (0.0%) |
| $500,000 to $749,999 | 0 (0.0%) | 0 (0.0%) |
| $750,000 to $999,999 | 0 (0.0%) | 0 (0.0%) |
| $1,000,000 or more | 0 (0.0%) | 0 (0.0%) |
| Total | 215 (100.0%) | 68 (100.0%) |
Household Income by Mortgage Status in Rocksprings
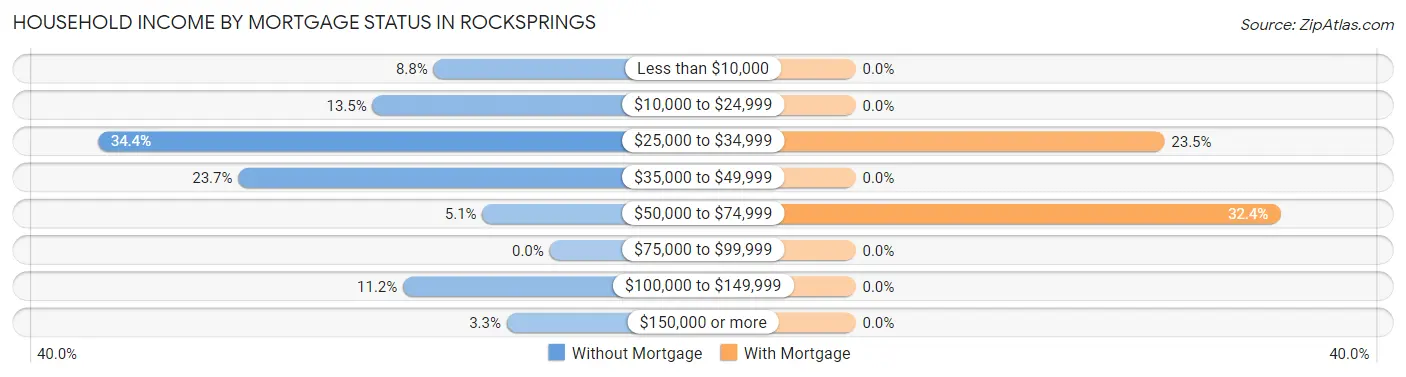
| Household Income | Without Mortgage | With Mortgage |
| Less than $10,000 | 19 (8.8%) | 0 (0.0%) |
| $10,000 to $24,999 | 29 (13.5%) | 0 (0.0%) |
| $25,000 to $34,999 | 74 (34.4%) | 16 (23.5%) |
| $35,000 to $49,999 | 51 (23.7%) | 0 (0.0%) |
| $50,000 to $74,999 | 11 (5.1%) | 22 (32.4%) |
| $75,000 to $99,999 | 0 (0.0%) | 0 (0.0%) |
| $100,000 to $149,999 | 24 (11.2%) | 0 (0.0%) |
| $150,000 or more | 7 (3.3%) | 0 (0.0%) |
| Total | 215 (100.0%) | 68 (100.0%) |
Property Value to Household Income Ratio in Rocksprings
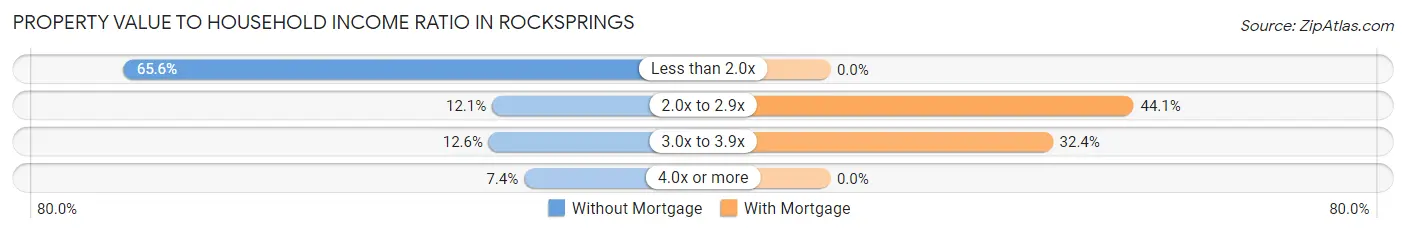
| Value-to-Income Ratio | Without Mortgage | With Mortgage |
| Less than 2.0x | 141 (65.6%) | 0 (0.0%) |
| 2.0x to 2.9x | 26 (12.1%) | 30 (44.1%) |
| 3.0x to 3.9x | 27 (12.6%) | 22 (32.4%) |
| 4.0x or more | 16 (7.4%) | 0 (0.0%) |
| Total | 215 (100.0%) | 68 (100.0%) |
Real Estate Taxes by Mortgage Status in Rocksprings
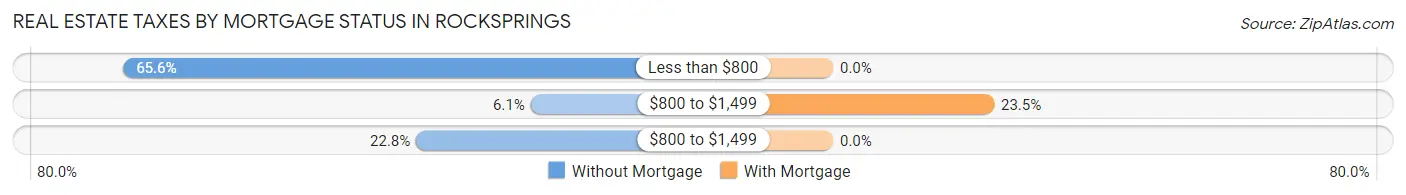
| Property Taxes | Without Mortgage | With Mortgage |
| Less than $800 | 141 (65.6%) | 0 (0.0%) |
| $800 to $1,499 | 13 (6.0%) | 16 (23.5%) |
| $800 to $1,499 | 49 (22.8%) | 0 (0.0%) |
| Total | 215 (100.0%) | 68 (100.0%) |
Health & Disability in Rocksprings
Health Insurance Coverage by Age in Rocksprings
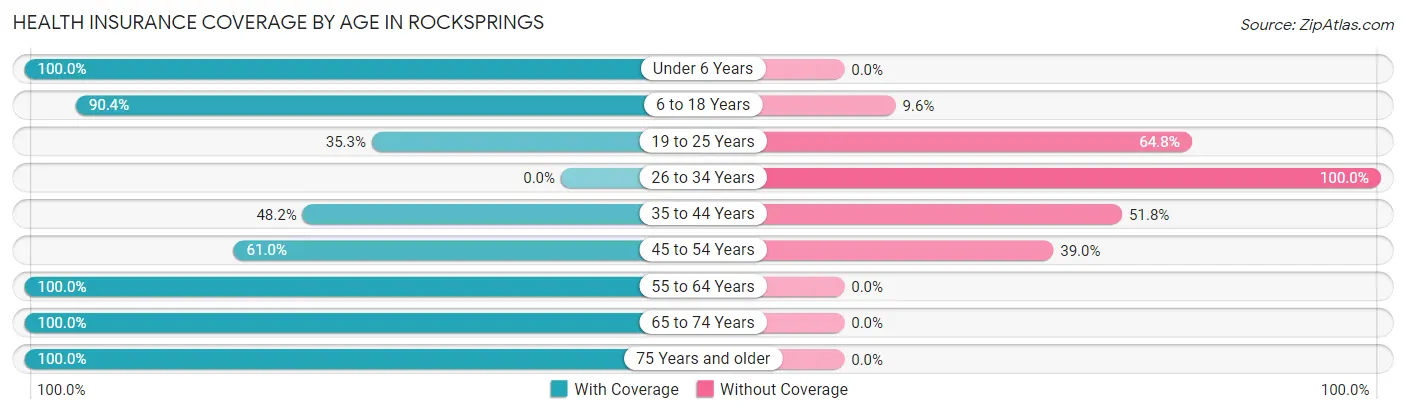
| Age Bracket | With Coverage | Without Coverage |
| Under 6 Years | 71 (100.0%) | 0 (0.0%) |
| 6 to 18 Years | 189 (90.4%) | 20 (9.6%) |
| 19 to 25 Years | 49 (35.2%) | 90 (64.7%) |
| 26 to 34 Years | 0 (0.0%) | 19 (100.0%) |
| 35 to 44 Years | 53 (48.2%) | 57 (51.8%) |
| 45 to 54 Years | 108 (61.0%) | 69 (39.0%) |
| 55 to 64 Years | 54 (100.0%) | 0 (0.0%) |
| 65 to 74 Years | 122 (100.0%) | 0 (0.0%) |
| 75 Years and older | 67 (100.0%) | 0 (0.0%) |
| Total | 713 (73.7%) | 255 (26.3%) |
Health Insurance Coverage by Citizenship Status in Rocksprings
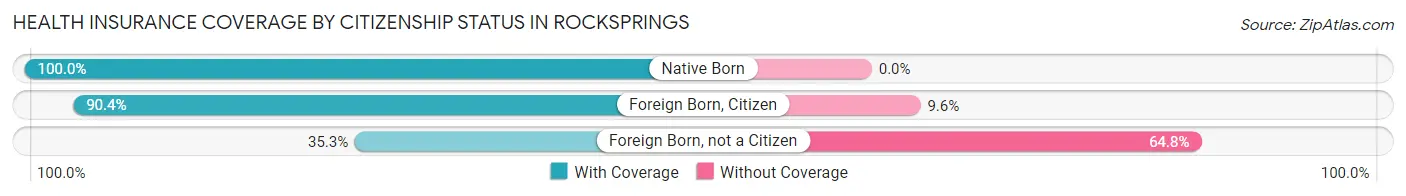
| Citizenship Status | With Coverage | Without Coverage |
| Native Born | 71 (100.0%) | 0 (0.0%) |
| Foreign Born, Citizen | 189 (90.4%) | 20 (9.6%) |
| Foreign Born, not a Citizen | 49 (35.2%) | 90 (64.7%) |
Health Insurance Coverage by Household Income in Rocksprings
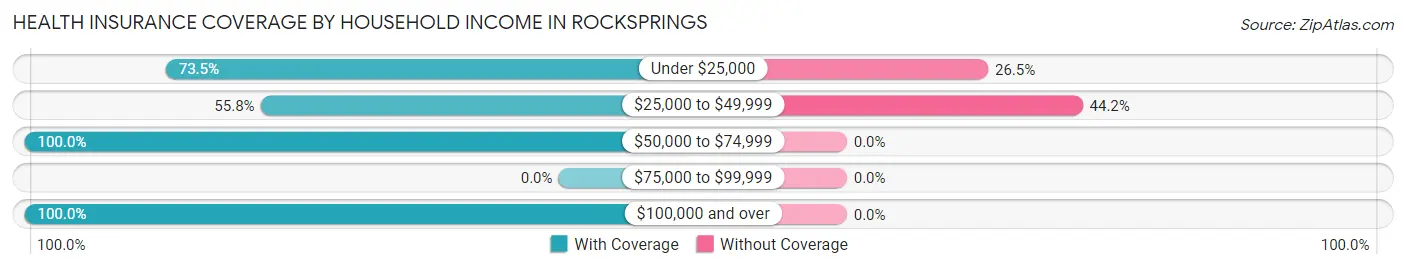
| Household Income | With Coverage | Without Coverage |
| Under $25,000 | 139 (73.5%) | 50 (26.5%) |
| $25,000 to $49,999 | 259 (55.8%) | 205 (44.2%) |
| $50,000 to $74,999 | 126 (100.0%) | 0 (0.0%) |
| $75,000 to $99,999 | 0 (0.0%) | 0 (0.0%) |
| $100,000 and over | 189 (100.0%) | 0 (0.0%) |
Public vs Private Health Insurance Coverage by Age in Rocksprings
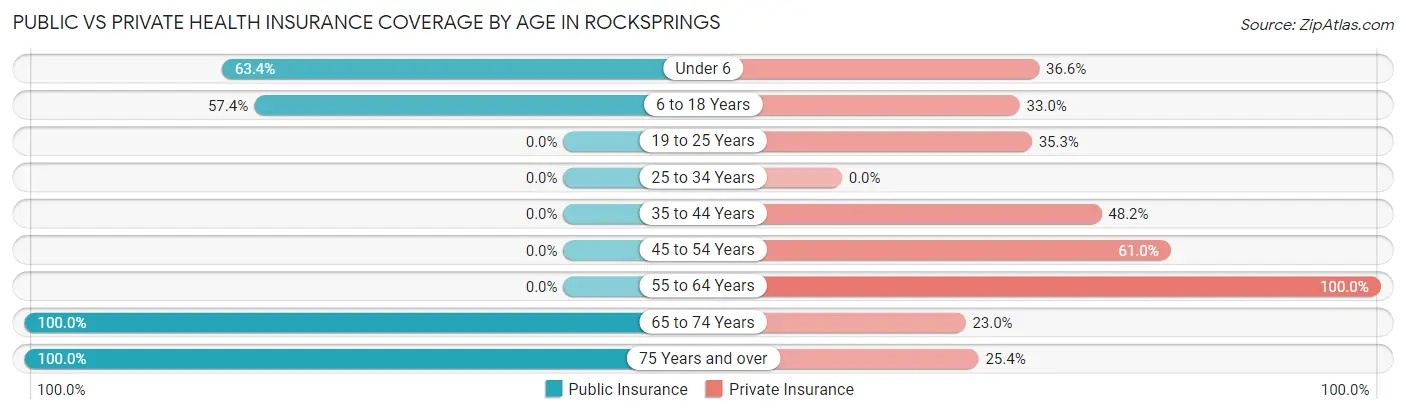
| Age Bracket | Public Insurance | Private Insurance |
| Under 6 | 45 (63.4%) | 26 (36.6%) |
| 6 to 18 Years | 120 (57.4%) | 69 (33.0%) |
| 19 to 25 Years | 0 (0.0%) | 49 (35.2%) |
| 25 to 34 Years | 0 (0.0%) | 0 (0.0%) |
| 35 to 44 Years | 0 (0.0%) | 53 (48.2%) |
| 45 to 54 Years | 0 (0.0%) | 108 (61.0%) |
| 55 to 64 Years | 0 (0.0%) | 54 (100.0%) |
| 65 to 74 Years | 122 (100.0%) | 28 (23.0%) |
| 75 Years and over | 67 (100.0%) | 17 (25.4%) |
| Total | 354 (36.6%) | 404 (41.7%) |
Disability Status by Sex by Age in Rocksprings
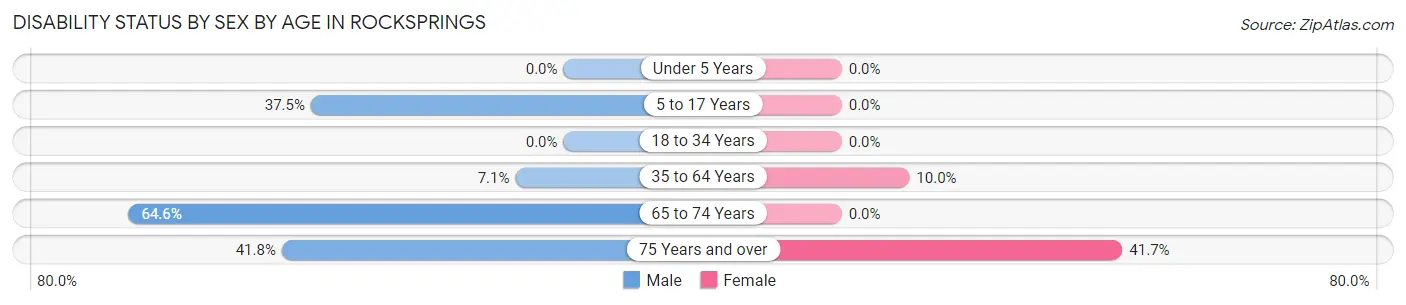
| Age Bracket | Male | Female |
| Under 5 Years | 0 (0.0%) | 0 (0.0%) |
| 5 to 17 Years | 21 (37.5%) | 0 (0.0%) |
| 18 to 34 Years | 0 (0.0%) | 0 (0.0%) |
| 35 to 64 Years | 8 (7.1%) | 23 (10.0%) |
| 65 to 74 Years | 51 (64.6%) | 0 (0.0%) |
| 75 Years and over | 23 (41.8%) | 5 (41.7%) |
Disability Class by Sex by Age in Rocksprings
Disability Class: Hearing Difficulty
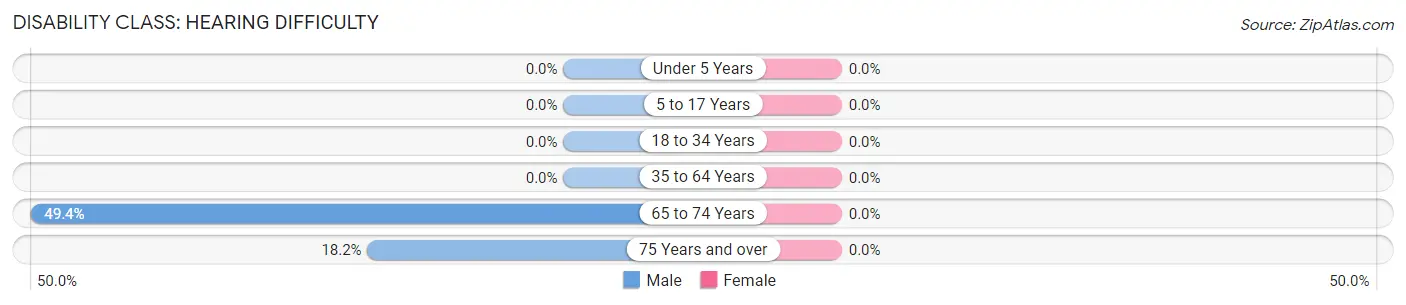
| Age Bracket | Male | Female |
| Under 5 Years | 0 (0.0%) | 0 (0.0%) |
| 5 to 17 Years | 0 (0.0%) | 0 (0.0%) |
| 18 to 34 Years | 0 (0.0%) | 0 (0.0%) |
| 35 to 64 Years | 0 (0.0%) | 0 (0.0%) |
| 65 to 74 Years | 39 (49.4%) | 0 (0.0%) |
| 75 Years and over | 10 (18.2%) | 0 (0.0%) |
Disability Class: Vision Difficulty
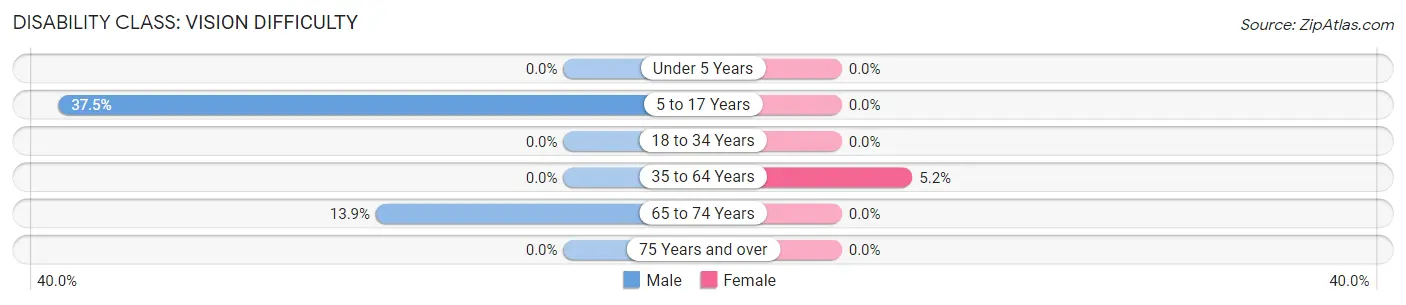
| Age Bracket | Male | Female |
| Under 5 Years | 0 (0.0%) | 0 (0.0%) |
| 5 to 17 Years | 21 (37.5%) | 0 (0.0%) |
| 18 to 34 Years | 0 (0.0%) | 0 (0.0%) |
| 35 to 64 Years | 0 (0.0%) | 12 (5.2%) |
| 65 to 74 Years | 11 (13.9%) | 0 (0.0%) |
| 75 Years and over | 0 (0.0%) | 0 (0.0%) |
Disability Class: Cognitive Difficulty
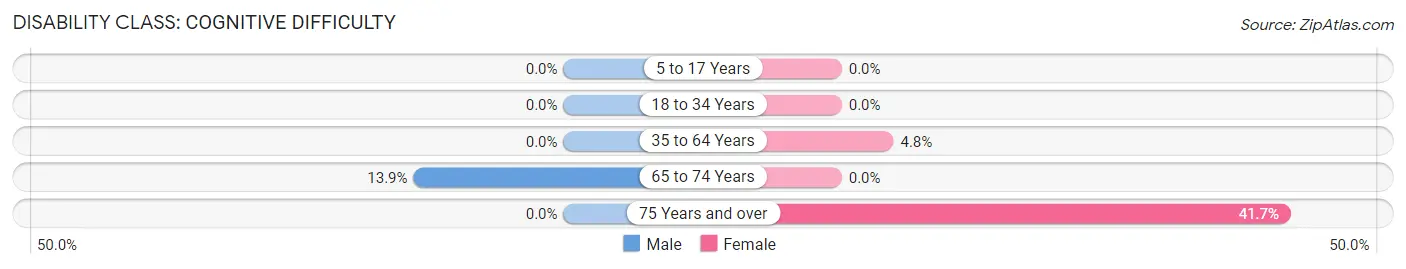
| Age Bracket | Male | Female |
| 5 to 17 Years | 0 (0.0%) | 0 (0.0%) |
| 18 to 34 Years | 0 (0.0%) | 0 (0.0%) |
| 35 to 64 Years | 0 (0.0%) | 11 (4.8%) |
| 65 to 74 Years | 11 (13.9%) | 0 (0.0%) |
| 75 Years and over | 0 (0.0%) | 5 (41.7%) |
Disability Class: Ambulatory Difficulty
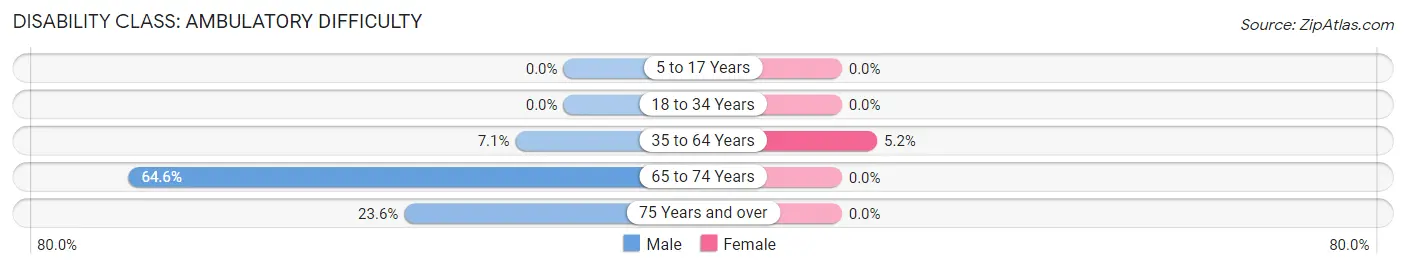
| Age Bracket | Male | Female |
| 5 to 17 Years | 0 (0.0%) | 0 (0.0%) |
| 18 to 34 Years | 0 (0.0%) | 0 (0.0%) |
| 35 to 64 Years | 8 (7.1%) | 12 (5.2%) |
| 65 to 74 Years | 51 (64.6%) | 0 (0.0%) |
| 75 Years and over | 13 (23.6%) | 0 (0.0%) |
Disability Class: Self-Care Difficulty
| Age Bracket | Male | Female |
| 5 to 17 Years | 0 (0.0%) | 0 (0.0%) |
| 18 to 34 Years | 0 (0.0%) | 0 (0.0%) |
| 35 to 64 Years | 0 (0.0%) | 0 (0.0%) |
| 65 to 74 Years | 0 (0.0%) | 0 (0.0%) |
| 75 Years and over | 0 (0.0%) | 0 (0.0%) |
Technology Access in Rocksprings
Computing Device Access in Rocksprings
| Device Type | # Households | % Households |
| Desktop or Laptop | 213 | 56.7% |
| Smartphone | 203 | 54.0% |
| Tablet | 113 | 30.0% |
| No Computing Device | 129 | 34.3% |
| Total | 376 | 100.0% |
Internet Access in Rocksprings
| Internet Type | # Households | % Households |
| Dial-Up Internet | 0 | 0.0% |
| Broadband Home | 198 | 52.7% |
| Cellular Data Only | 0 | 0.0% |
| Satellite Internet | 0 | 0.0% |
| No Internet | 178 | 47.3% |
| Total | 376 | 100.0% |
Rocksprings Summary
Rocksprings is a small town located in Edwards County, Texas. It is the county seat of Edwards County and is located in the heart of the Texas Hill Country. The town has a population of 1,182 as of the 2010 census.
History
Rocksprings was founded in 1891 by the Edwards County Land Company. The town was named after the nearby springs that provided water to the area. The town was originally a stop on the San Antonio and Aransas Pass Railway. The town was incorporated in 1895 and the first post office was established in 1896.
In the early 1900s, the town was a center for ranching and farming. The town was also home to a number of businesses, including a bank, a hotel, a general store, and a blacksmith shop.
In the 1920s, the town began to experience a decline in population due to the Great Depression. The population of the town decreased from 1,500 in 1920 to just over 1,000 in 1930.
In the 1940s, the town began to experience a resurgence in population due to the discovery of oil in the area. The population of the town increased to 1,500 in 1950.
Geography
Rocksprings is located in the Edwards Plateau region of Texas. The town is situated at the intersection of U.S. Highway 377 and State Highway 55. The town is located approximately 80 miles west of San Antonio and 100 miles south of Austin.
The terrain around Rocksprings is mostly flat with some rolling hills. The town is located in an area of limestone outcroppings and is surrounded by oak and juniper trees. The town is located in an area of karst topography, which is characterized by sinkholes, caves, and underground streams.
The climate in Rocksprings is semi-arid with hot summers and mild winters. The average annual temperature is 68 degrees Fahrenheit. The average annual precipitation is 22 inches.
Economy
The economy of Rocksprings is largely based on agriculture and ranching. The town is home to a number of ranches and farms that produce cattle, sheep, goats, and hay. The town is also home to a number of businesses, including a bank, a hotel, a general store, and a blacksmith shop.
The town is also home to a number of oil and gas companies. The town is located in an area of oil and gas production and is home to a number of oil and gas wells.
Demographics
As of the 2010 census, the population of Rocksprings was 1,182. The racial makeup of the town was 94.3% White, 0.3% African American, 0.2% Native American, 0.2% Asian, 0.1% Pacific Islander, 3.3% from other races, and 1.6% from two or more races. Hispanic or Latino of any race were 8.2% of the population.
The median household income in Rocksprings was $30,938 and the median family income was $35,625. The per capita income in Rocksprings was $15,945. About 17.2% of the population was below the poverty line.
Common Questions
What is Per Capita Income in Rocksprings?
Per Capita income in Rocksprings is $22,332.
What is the Median Household income in Rocksprings?
Median Household Income in Rocksprings is $41,176.
What is Income or Wage Gap in Rocksprings?
Income or Wage Gap in Rocksprings is 13.6%.
Women in Rocksprings earn 86.4 cents for every dollar earned by a man.
What is Inequality or Gini Index in Rocksprings?
Inequality or Gini Index in Rocksprings is 0.47.
What is the Total Population of Rocksprings?
Total Population of Rocksprings is 1,002.
What is the Total Male Population of Rocksprings?
Total Male Population of Rocksprings is 518.
What is the Total Female Population of Rocksprings?
Total Female Population of Rocksprings is 484.
What is the Ratio of Males per 100 Females in Rocksprings?
There are 107.02 Males per 100 Females in Rocksprings.
What is the Ratio of Females per 100 Males in Rocksprings?
There are 93.44 Females per 100 Males in Rocksprings.
What is the Median Population Age in Rocksprings?
Median Population Age in Rocksprings is 40.2 Years.
What is the Average Family Size in Rocksprings
Average Family Size in Rocksprings is 4.5 People.
What is the Average Household Size in Rocksprings
Average Household Size in Rocksprings is 2.6 People.
How Large is the Labor Force in Rocksprings?
There are 560 People in the Labor Forcein in Rocksprings.
What is the Percentage of People in the Labor Force in Rocksprings?
72.9% of People are in the Labor Force in Rocksprings.