Rockport, TX Map & Demographics
Rockport Map
Rockport Overview
$48,395
PER CAPITA INCOME
$84,737
AVG FAMILY INCOME
$62,394
AVG HOUSEHOLD INCOME
25.7%
WAGE / INCOME GAP [ % ]
74.3¢/ $1
WAGE / INCOME GAP [ $ ]
0.53
INEQUALITY / GINI INDEX
10,265
TOTAL POPULATION
5,107
MALE POPULATION
5,158
FEMALE POPULATION
99.01
MALES / 100 FEMALES
101.00
FEMALES / 100 MALES
54.6
MEDIAN AGE
2.4
AVG FAMILY SIZE
2.0
AVG HOUSEHOLD SIZE
4,508
LABOR FORCE [ PEOPLE ]
49.6%
PERCENT IN LABOR FORCE
5.0%
UNEMPLOYMENT RATE
Rockport Zip Codes
Rockport Area Codes
Income in Rockport
Income Overview in Rockport
Per Capita Income in Rockport is $48,395, while median incomes of families and households are $84,737 and $62,394 respectively.
| Characteristic | Number | Measure |
| Per Capita Income | 10,265 | $48,395 |
| Median Family Income | 2,948 | $84,737 |
| Mean Family Income | 2,948 | $119,595 |
| Median Household Income | 5,096 | $62,394 |
| Mean Household Income | 5,096 | $98,181 |
| Income Deficit | 2,948 | $0 |
| Wage / Income Gap (%) | 10,265 | 25.67% |
| Wage / Income Gap ($) | 10,265 | 74.33¢ per $1 |
| Gini / Inequality Index | 10,265 | 0.53 |
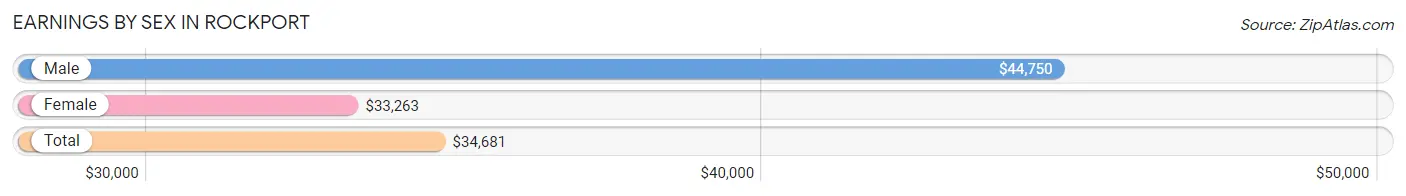
Earnings by Sex in Rockport
Average Earnings in Rockport are $34,681, $44,750 for men and $33,263 for women, a difference of 25.7%.
| Sex | Number | Average Earnings |
| Male | 2,590 (52.4%) | $44,750 |
| Female | 2,348 (47.5%) | $33,263 |
| Total | 4,938 (100.0%) | $34,681 |
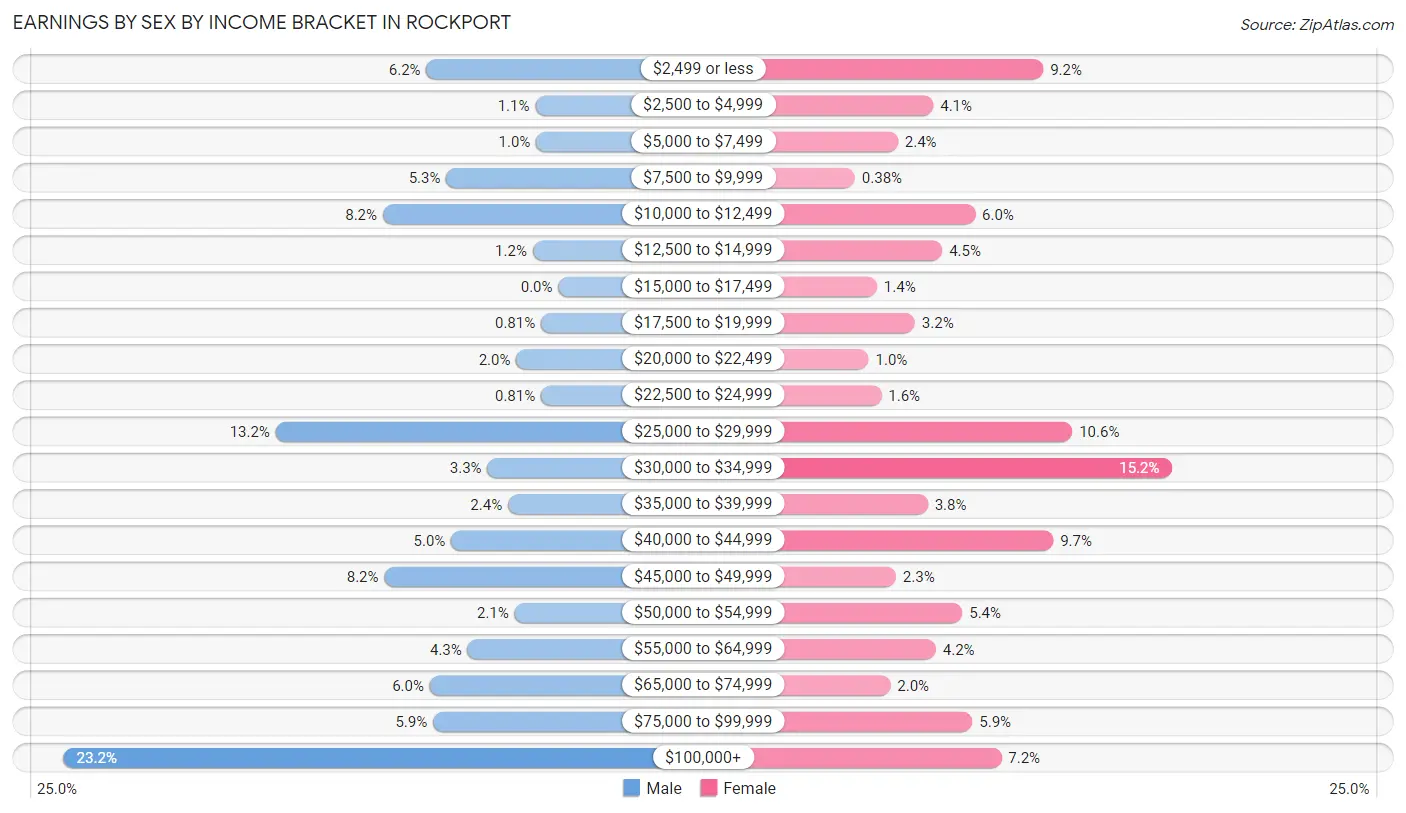
Earnings by Sex by Income Bracket in Rockport
The most common earnings brackets in Rockport are $100,000+ for men (600 | 23.2%) and $30,000 to $34,999 for women (357 | 15.2%).
| Income | Male | Female |
| $2,499 or less | 160 (6.2%) | 216 (9.2%) |
| $2,500 to $4,999 | 28 (1.1%) | 95 (4.1%) |
| $5,000 to $7,499 | 27 (1.0%) | 56 (2.4%) |
| $7,500 to $9,999 | 136 (5.2%) | 9 (0.4%) |
| $10,000 to $12,499 | 213 (8.2%) | 141 (6.0%) |
| $12,500 to $14,999 | 31 (1.2%) | 105 (4.5%) |
| $15,000 to $17,499 | 0 (0.0%) | 33 (1.4%) |
| $17,500 to $19,999 | 21 (0.8%) | 75 (3.2%) |
| $20,000 to $22,499 | 51 (2.0%) | 24 (1.0%) |
| $22,500 to $24,999 | 21 (0.8%) | 38 (1.6%) |
| $25,000 to $29,999 | 343 (13.2%) | 248 (10.6%) |
| $30,000 to $34,999 | 86 (3.3%) | 357 (15.2%) |
| $35,000 to $39,999 | 61 (2.4%) | 89 (3.8%) |
| $40,000 to $44,999 | 130 (5.0%) | 227 (9.7%) |
| $45,000 to $49,999 | 211 (8.2%) | 54 (2.3%) |
| $50,000 to $54,999 | 53 (2.1%) | 127 (5.4%) |
| $55,000 to $64,999 | 110 (4.3%) | 98 (4.2%) |
| $65,000 to $74,999 | 156 (6.0%) | 48 (2.0%) |
| $75,000 to $99,999 | 152 (5.9%) | 138 (5.9%) |
| $100,000+ | 600 (23.2%) | 170 (7.2%) |
| Total | 2,590 (100.0%) | 2,348 (100.0%) |
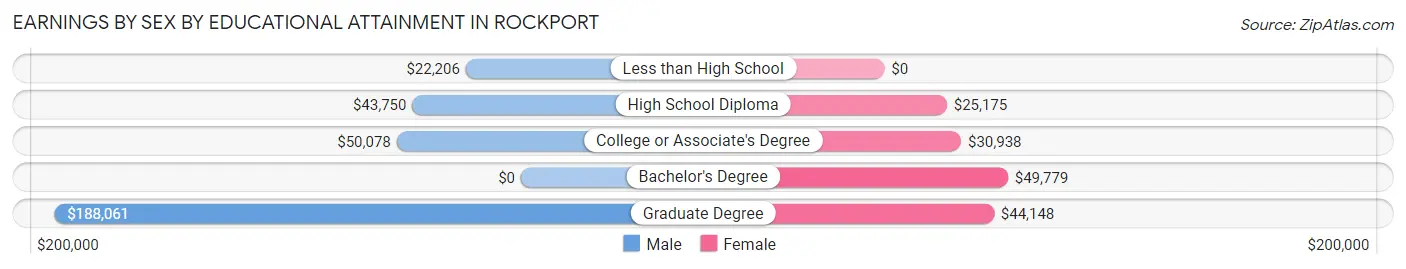
Earnings by Sex by Educational Attainment in Rockport
Average earnings in Rockport are $45,509 for men and $33,816 for women, a difference of 25.7%. Men with an educational attainment of graduate degree enjoy the highest average annual earnings of $188,061, while those with less than high school education earn the least with $22,206. Women with an educational attainment of bachelor's degree earn the most with the average annual earnings of $49,779, while those with high school diploma education have the smallest earnings of $25,175.
| Educational Attainment | Male Income | Female Income |
| Less than High School | $22,206 | $0 |
| High School Diploma | $43,750 | $25,175 |
| College or Associate's Degree | $50,078 | $30,938 |
| Bachelor's Degree | - | - |
| Graduate Degree | $188,061 | $44,148 |
| Total | $45,509 | $33,816 |
Family Income in Rockport
Family Income Brackets in Rockport
According to the Rockport family income data, there are 646 families falling into the $35,000 to $49,999 income range, which is the most common income bracket and makes up 21.9% of all families.
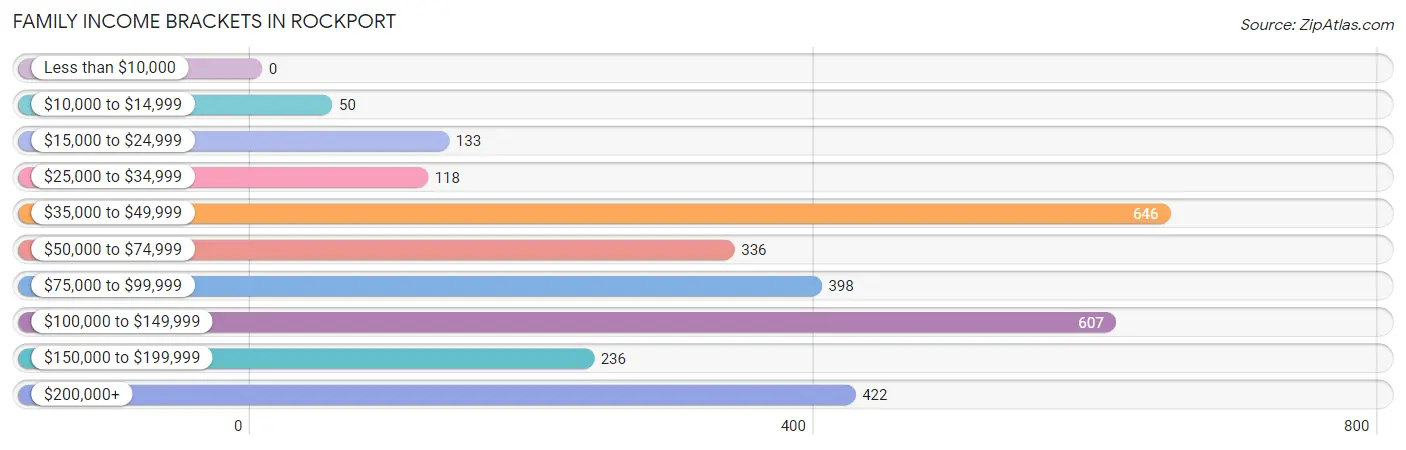
| Income Bracket | # Families | % Families |
| Less than $10,000 | 0 | 0.0% |
| $10,000 to $14,999 | 50 | 1.7% |
| $15,000 to $24,999 | 133 | 4.5% |
| $25,000 to $34,999 | 118 | 4.0% |
| $35,000 to $49,999 | 646 | 21.9% |
| $50,000 to $74,999 | 336 | 11.4% |
| $75,000 to $99,999 | 398 | 13.5% |
| $100,000 to $149,999 | 607 | 20.6% |
| $150,000 to $199,999 | 236 | 8.0% |
| $200,000+ | 422 | 14.3% |
Family Income by Famaliy Size in Rockport
5-person families (123 | 4.2%) account for the highest median family income in Rockport with $133,655 per family, while 2-person families (1,769 | 60.0%) have the highest median income of $42,319 per family member.
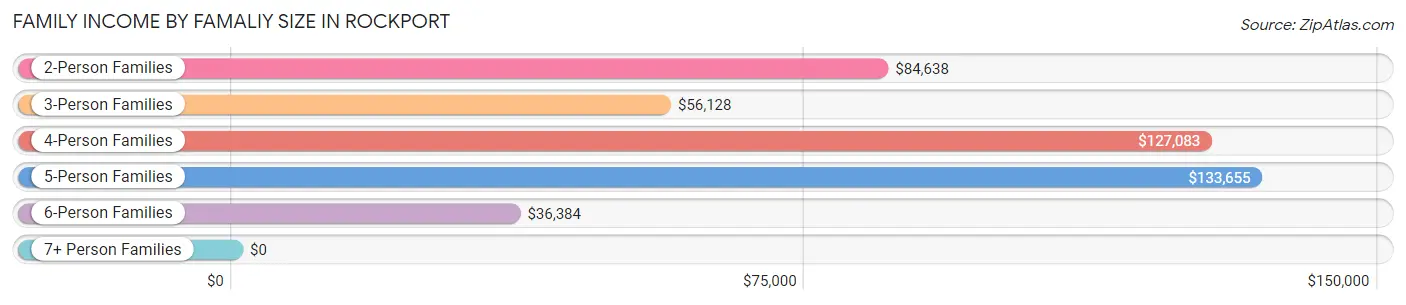
| Income Bracket | # Families | Median Income |
| 2-Person Families | 1,769 (60.0%) | $84,638 |
| 3-Person Families | 799 (27.1%) | $56,128 |
| 4-Person Families | 195 (6.6%) | $127,083 |
| 5-Person Families | 123 (4.2%) | $133,655 |
| 6-Person Families | 62 (2.1%) | $36,384 |
| 7+ Person Families | 0 (0.0%) | $0 |
| Total | 2,948 (100.0%) | $84,737 |
Family Income by Number of Earners in Rockport
The median family income in Rockport is $84,737, with families comprising 3+ earners (172) having the highest median family income of $133,315, while families with no earners (814) have the lowest median family income of $55,671, accounting for 5.8% and 27.6% of families, respectively.
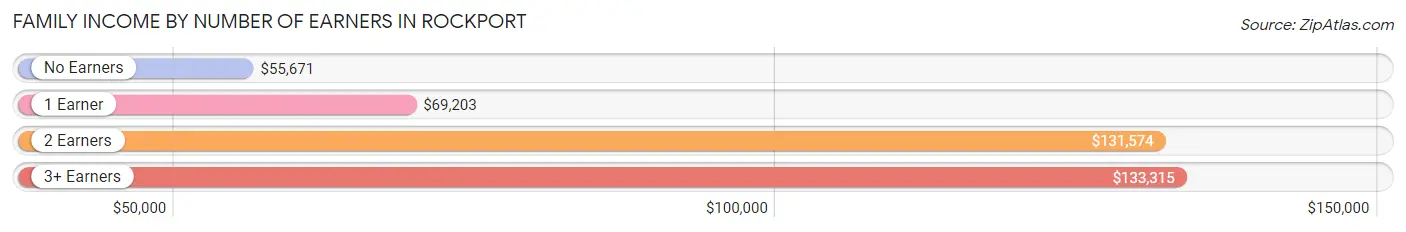
| Number of Earners | # Families | Median Income |
| No Earners | 814 (27.6%) | $55,671 |
| 1 Earner | 1,191 (40.4%) | $69,203 |
| 2 Earners | 771 (26.2%) | $131,574 |
| 3+ Earners | 172 (5.8%) | $133,315 |
| Total | 2,948 (100.0%) | $84,737 |
Household Income in Rockport
Household Income Brackets in Rockport
With 892 households falling in the category, the $35,000 to $49,999 income range is the most frequent in Rockport, accounting for 17.5% of all households. In contrast, only 245 households (4.8%) fall into the $150,000 to $199,999 income bracket, making it the least populous group.
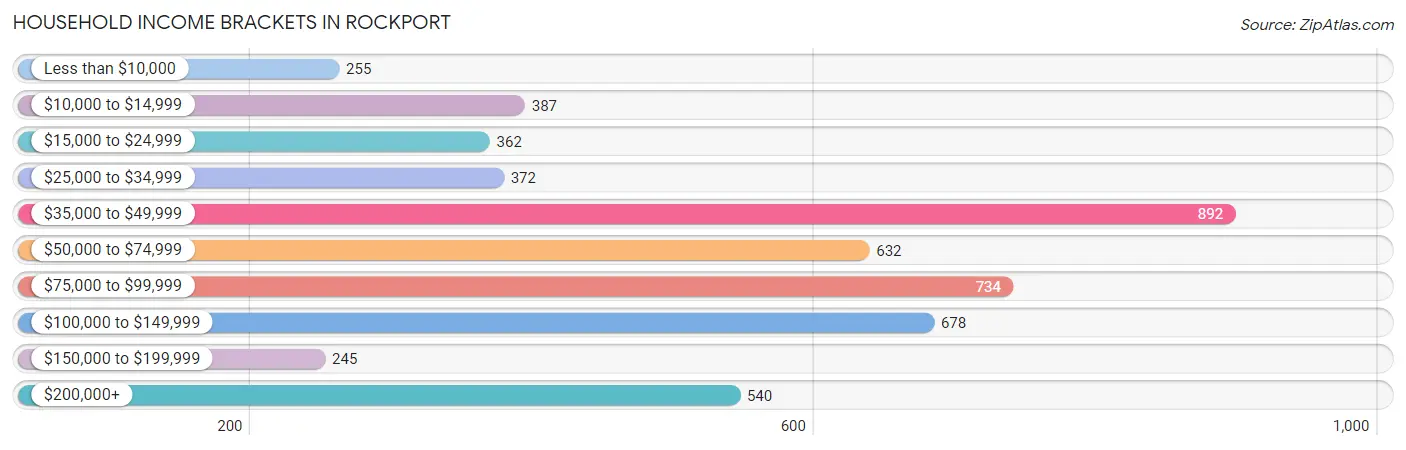
| Income Bracket | # Households | % Households |
| Less than $10,000 | 255 | 5.0% |
| $10,000 to $14,999 | 387 | 7.6% |
| $15,000 to $24,999 | 362 | 7.1% |
| $25,000 to $34,999 | 372 | 7.3% |
| $35,000 to $49,999 | 892 | 17.5% |
| $50,000 to $74,999 | 632 | 12.4% |
| $75,000 to $99,999 | 734 | 14.4% |
| $100,000 to $149,999 | 678 | 13.3% |
| $150,000 to $199,999 | 245 | 4.8% |
| $200,000+ | 540 | 10.6% |
Household Income by Householder Age in Rockport
The median household income in Rockport is $62,394, with the highest median household income of $77,793 found in the 45 to 64 years age bracket for the primary householder. A total of 1,649 households (32.4%) fall into this category. Meanwhile, the 15 to 24 years age bracket for the primary householder has the lowest median household income of $0, with 86 households (1.7%) in this group.
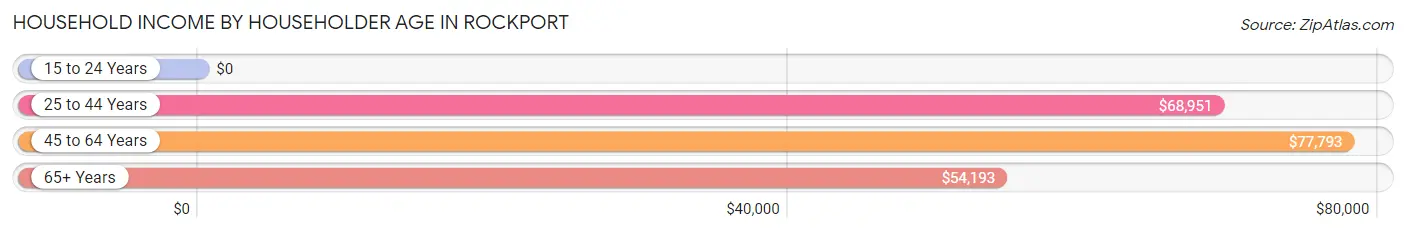
| Income Bracket | # Households | Median Income |
| 15 to 24 Years | 86 (1.7%) | $0 |
| 25 to 44 Years | 1,320 (25.9%) | $68,951 |
| 45 to 64 Years | 1,649 (32.4%) | $77,793 |
| 65+ Years | 2,041 (40.1%) | $54,193 |
| Total | 5,096 (100.0%) | $62,394 |
Poverty in Rockport
Income Below Poverty by Sex and Age in Rockport
With 10.4% poverty level for males and 17.5% for females among the residents of Rockport, 6 to 11 year old males and 15 year old females are the most vulnerable to poverty, with 146 males (35.9%) and 25 females (100.0%) in their respective age groups living below the poverty level.
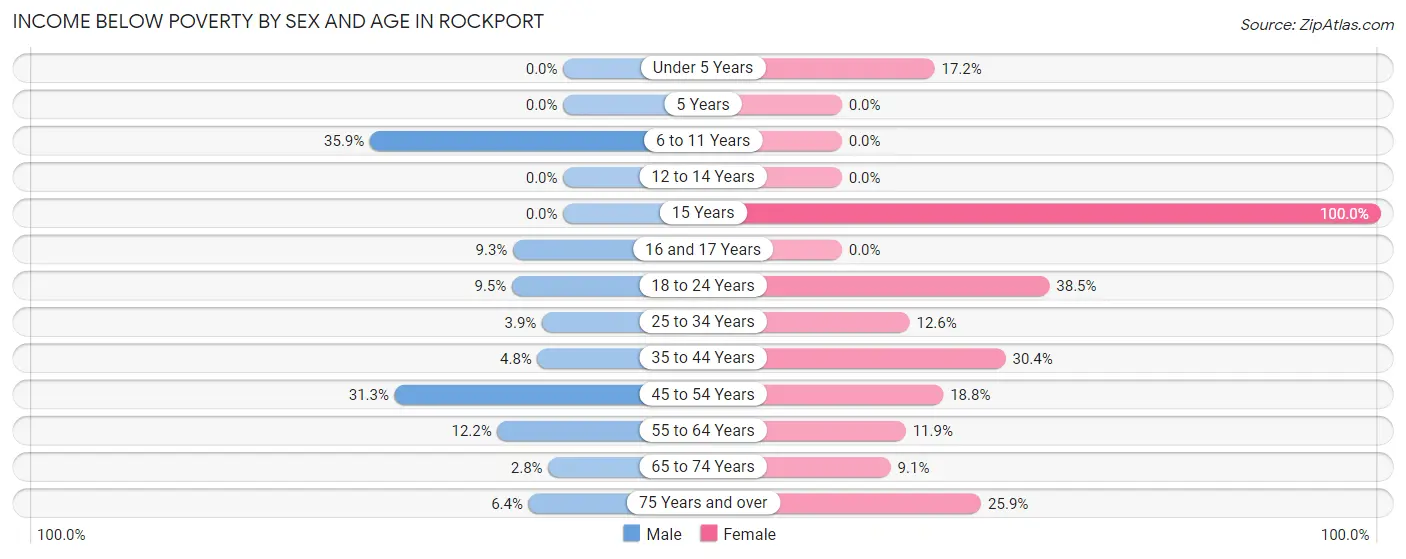
| Age Bracket | Male | Female |
| Under 5 Years | 0 (0.0%) | 26 (17.2%) |
| 5 Years | 0 (0.0%) | 0 (0.0%) |
| 6 to 11 Years | 146 (35.9%) | 0 (0.0%) |
| 12 to 14 Years | 0 (0.0%) | 0 (0.0%) |
| 15 Years | 0 (0.0%) | 25 (100.0%) |
| 16 and 17 Years | 11 (9.3%) | 0 (0.0%) |
| 18 to 24 Years | 27 (9.5%) | 84 (38.5%) |
| 25 to 34 Years | 23 (3.9%) | 93 (12.6%) |
| 35 to 44 Years | 20 (4.8%) | 166 (30.4%) |
| 45 to 54 Years | 132 (31.3%) | 113 (18.8%) |
| 55 to 64 Years | 100 (12.2%) | 101 (11.9%) |
| 65 to 74 Years | 27 (2.8%) | 84 (9.1%) |
| 75 Years and over | 33 (6.4%) | 185 (25.9%) |
| Total | 519 (10.4%) | 877 (17.5%) |
Income Above Poverty by Sex and Age in Rockport
According to the poverty statistics in Rockport, males aged under 5 years and females aged 6 to 11 years are the age groups that are most secure financially, with 100.0% of males and 100.0% of females in these age groups living above the poverty line.
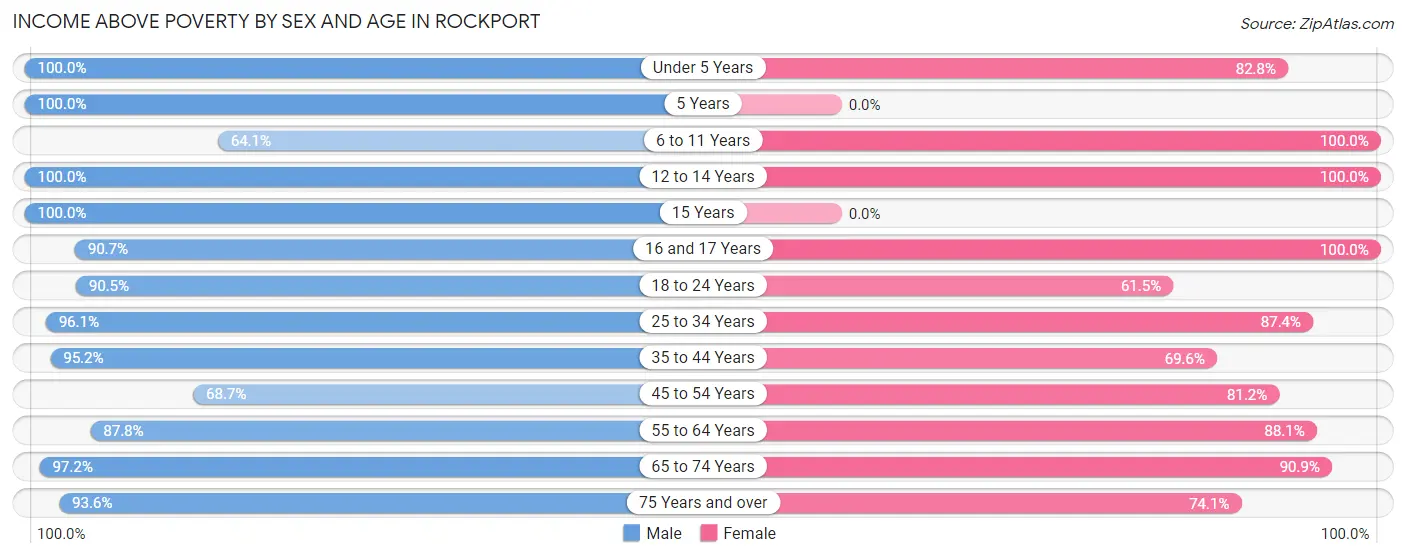
| Age Bracket | Male | Female |
| Under 5 Years | 326 (100.0%) | 125 (82.8%) |
| 5 Years | 30 (100.0%) | 0 (0.0%) |
| 6 to 11 Years | 261 (64.1%) | 79 (100.0%) |
| 12 to 14 Years | 40 (100.0%) | 94 (100.0%) |
| 15 Years | 25 (100.0%) | 0 (0.0%) |
| 16 and 17 Years | 107 (90.7%) | 69 (100.0%) |
| 18 to 24 Years | 257 (90.5%) | 134 (61.5%) |
| 25 to 34 Years | 562 (96.1%) | 647 (87.4%) |
| 35 to 44 Years | 399 (95.2%) | 380 (69.6%) |
| 45 to 54 Years | 290 (68.7%) | 487 (81.2%) |
| 55 to 64 Years | 719 (87.8%) | 750 (88.1%) |
| 65 to 74 Years | 949 (97.2%) | 842 (90.9%) |
| 75 Years and over | 482 (93.6%) | 530 (74.1%) |
| Total | 4,447 (89.5%) | 4,137 (82.5%) |
Income Below Poverty Among Married-Couple Families in Rockport
The poverty statistics for married-couple families in Rockport show that 7.9% or 178 of the total 2,267 families live below the poverty line. Families with 3 or 4 children have the highest poverty rate of 100.0%, comprising of 56 families. On the other hand, families with no children have the lowest poverty rate of 2.4%, which includes 44 families.
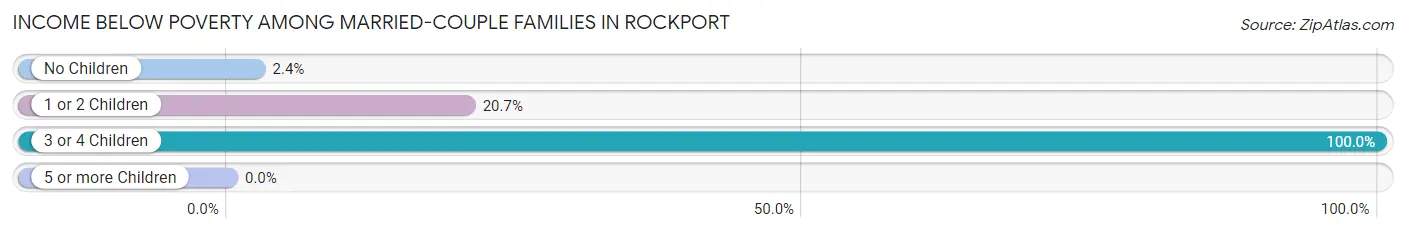
| Children | Above Poverty | Below Poverty |
| No Children | 1,790 (97.6%) | 44 (2.4%) |
| 1 or 2 Children | 299 (79.3%) | 78 (20.7%) |
| 3 or 4 Children | 0 (0.0%) | 56 (100.0%) |
| 5 or more Children | 0 (0.0%) | 0 (0.0%) |
| Total | 2,089 (92.1%) | 178 (7.9%) |
Income Below Poverty Among Single-Parent Households in Rockport
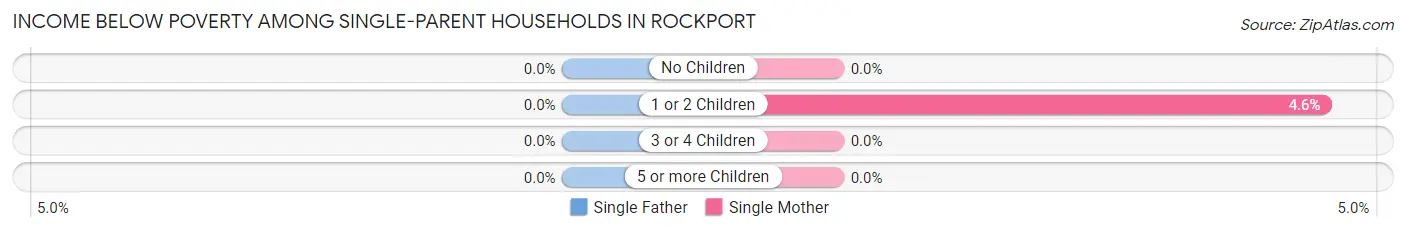
| Children | Single Father | Single Mother |
| No Children | 0 (0.0%) | 0 (0.0%) |
| 1 or 2 Children | 0 (0.0%) | 23 (4.5%) |
| 3 or 4 Children | 0 (0.0%) | 0 (0.0%) |
| 5 or more Children | 0 (0.0%) | 0 (0.0%) |
| Total | 0 (0.0%) | 23 (4.1%) |
Income Below Poverty Among Married-Couple vs Single-Parent Households in Rockport
The poverty data for Rockport shows that 178 of the married-couple family households (7.9%) and 23 of the single-parent households (3.4%) are living below the poverty level. Within the married-couple family households, those with 3 or 4 children have the highest poverty rate, with 56 households (100.0%) falling below the poverty line. Among the single-parent households, those with 1 or 2 children have the highest poverty rate, with 23 household (4.2%) living below poverty.
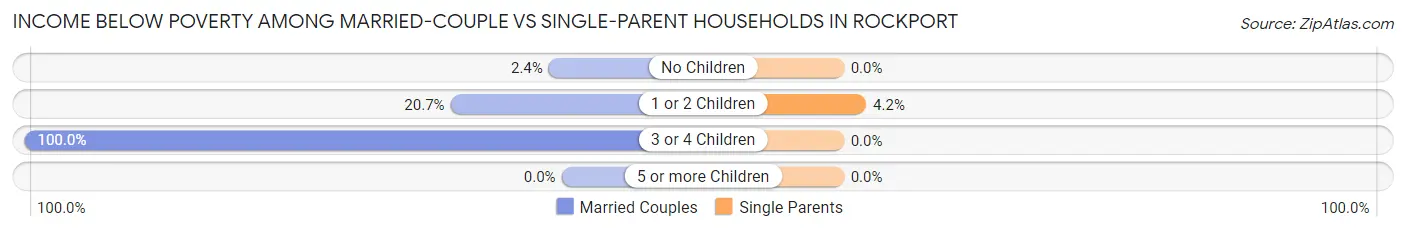
| Children | Married-Couple Families | Single-Parent Households |
| No Children | 44 (2.4%) | 0 (0.0%) |
| 1 or 2 Children | 78 (20.7%) | 23 (4.2%) |
| 3 or 4 Children | 56 (100.0%) | 0 (0.0%) |
| 5 or more Children | 0 (0.0%) | 0 (0.0%) |
| Total | 178 (7.9%) | 23 (3.4%) |
Race in Rockport
The most populous races in Rockport are White / Caucasian (8,885 | 86.6%), Hispanic or Latino (2,673 | 26.0%), and Two or more Races (883 | 8.6%).
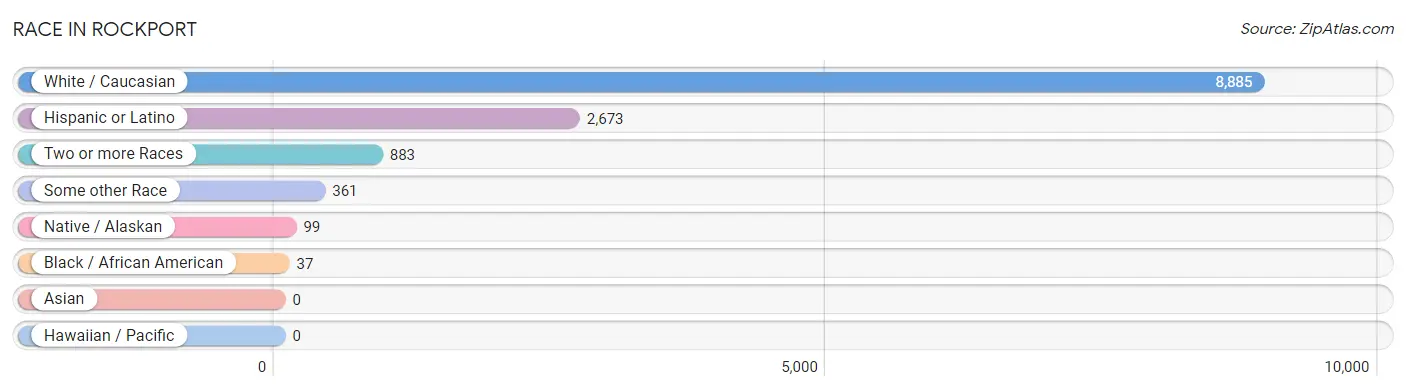
| Race | # Population | % Population |
| Asian | 0 | 0.0% |
| Black / African American | 37 | 0.4% |
| Hawaiian / Pacific | 0 | 0.0% |
| Hispanic or Latino | 2,673 | 26.0% |
| Native / Alaskan | 99 | 1.0% |
| White / Caucasian | 8,885 | 86.6% |
| Two or more Races | 883 | 8.6% |
| Some other Race | 361 | 3.5% |
| Total | 10,265 | 100.0% |
Ancestry in Rockport
The most populous ancestries reported in Rockport are German (2,423 | 23.6%), Mexican (2,343 | 22.8%), English (1,279 | 12.5%), Irish (832 | 8.1%), and American (697 | 6.8%), together accounting for 73.8% of all Rockport residents.
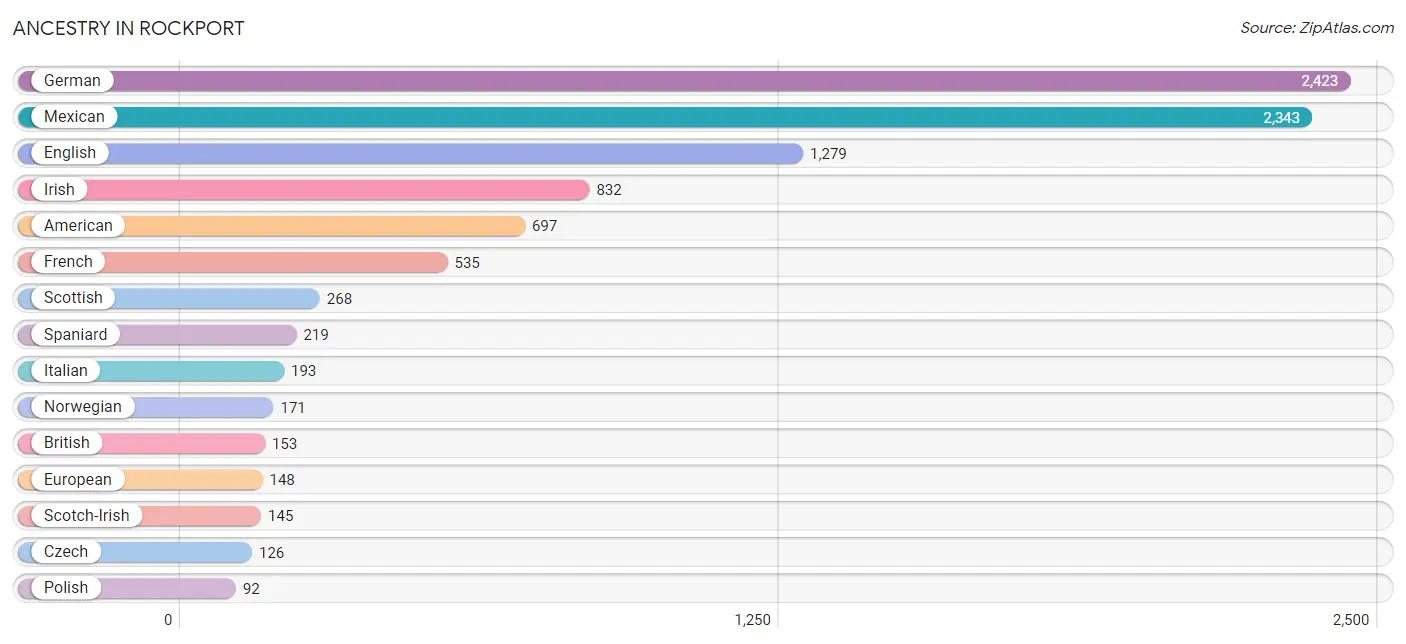
| Ancestry | # Population | % Population |
| African | 4 | 0.0% |
| American | 697 | 6.8% |
| Arab | 33 | 0.3% |
| British | 153 | 1.5% |
| Burmese | 80 | 0.8% |
| Carpatho Rusyn | 48 | 0.5% |
| Central American Indian | 41 | 0.4% |
| Cherokee | 39 | 0.4% |
| Choctaw | 28 | 0.3% |
| Cuban | 35 | 0.3% |
| Czech | 126 | 1.2% |
| Czechoslovakian | 47 | 0.5% |
| Dutch | 48 | 0.5% |
| Dutch West Indian | 11 | 0.1% |
| English | 1,279 | 12.5% |
| European | 148 | 1.4% |
| French | 535 | 5.2% |
| French Canadian | 21 | 0.2% |
| German | 2,423 | 23.6% |
| Greek | 41 | 0.4% |
| Haitian | 4 | 0.0% |
| Iraqi | 9 | 0.1% |
| Irish | 832 | 8.1% |
| Italian | 193 | 1.9% |
| Korean | 77 | 0.7% |
| Lebanese | 24 | 0.2% |
| Mexican | 2,343 | 22.8% |
| Northern European | 29 | 0.3% |
| Norwegian | 171 | 1.7% |
| Polish | 92 | 0.9% |
| Portuguese | 15 | 0.2% |
| Potawatomi | 47 | 0.5% |
| Scandinavian | 20 | 0.2% |
| Scotch-Irish | 145 | 1.4% |
| Scottish | 268 | 2.6% |
| Spaniard | 219 | 2.1% |
| Spanish | 12 | 0.1% |
| Subsaharan African | 4 | 0.0% |
| Swiss | 70 | 0.7% |
| Welsh | 11 | 0.1% | View All 40 Rows |
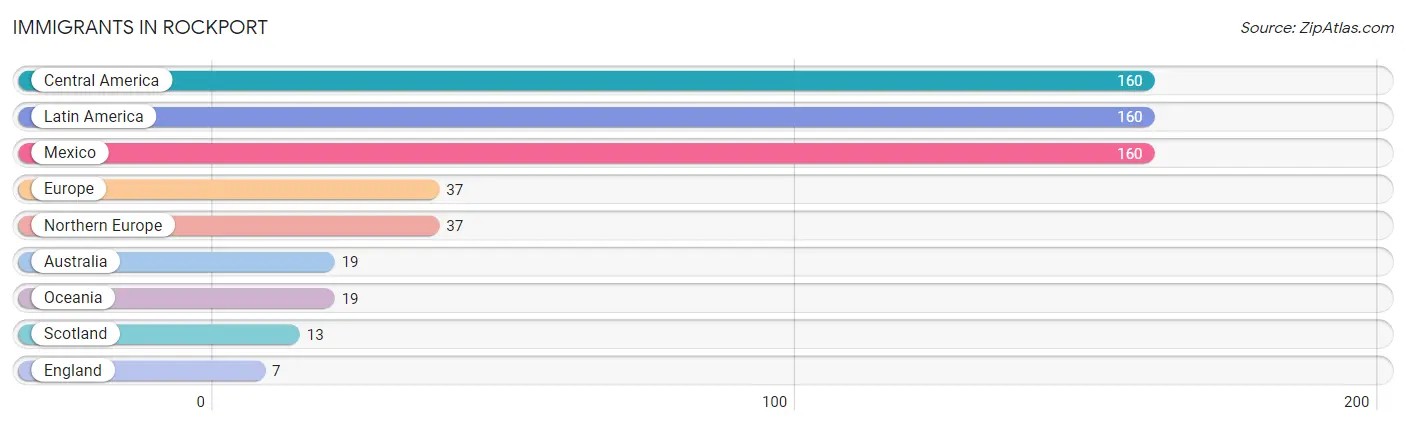
Immigrants in Rockport
The most numerous immigrant groups reported in Rockport came from Central America (160 | 1.6%), Latin America (160 | 1.6%), Mexico (160 | 1.6%), Europe (37 | 0.4%), and Northern Europe (37 | 0.4%), together accounting for 5.4% of all Rockport residents.
| Immigration Origin | # Population | % Population |
| Australia | 19 | 0.2% |
| Central America | 160 | 1.6% |
| England | 7 | 0.1% |
| Europe | 37 | 0.4% |
| Latin America | 160 | 1.6% |
| Mexico | 160 | 1.6% |
| Northern Europe | 37 | 0.4% |
| Oceania | 19 | 0.2% |
| Scotland | 13 | 0.1% | View All 9 Rows |
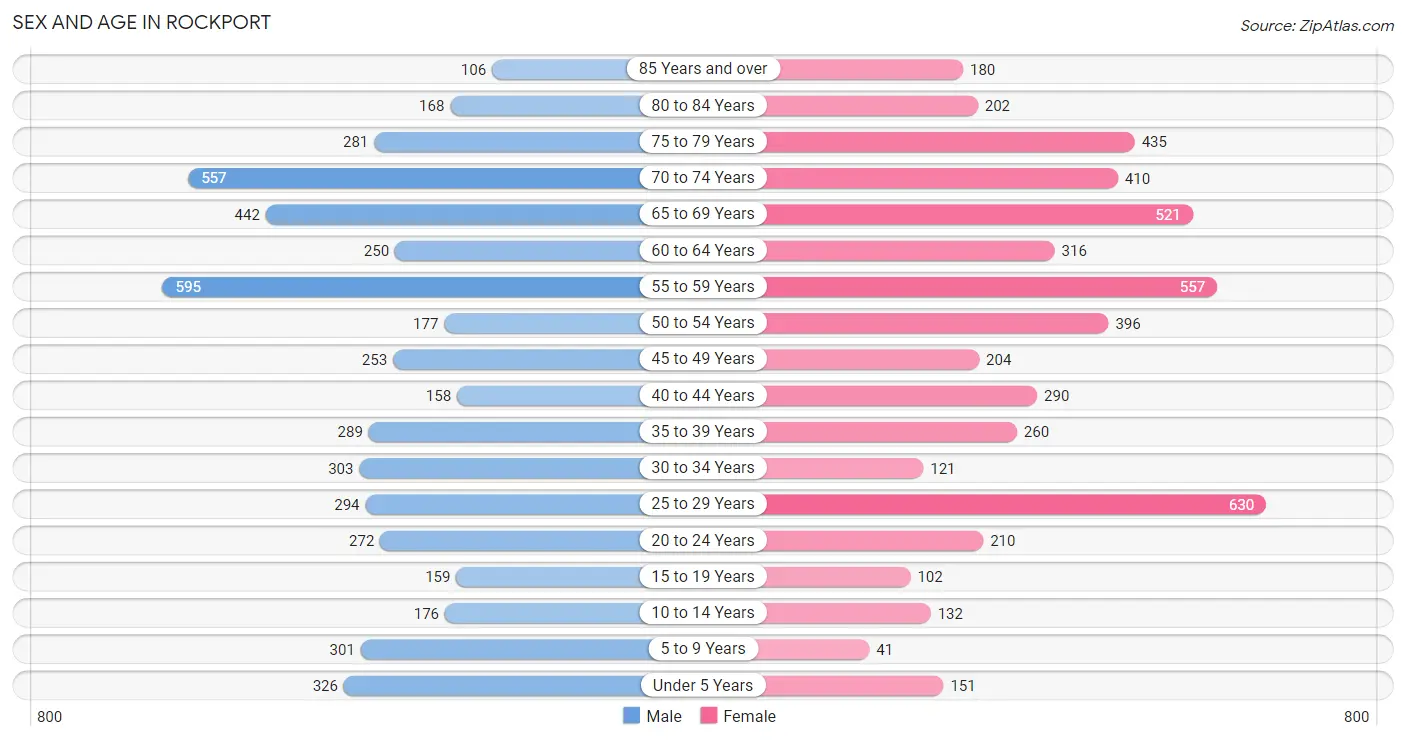
Sex and Age in Rockport
Sex and Age in Rockport
The most populous age groups in Rockport are 55 to 59 Years (595 | 11.7%) for men and 25 to 29 Years (630 | 12.2%) for women.
| Age Bracket | Male | Female |
| Under 5 Years | 326 (6.4%) | 151 (2.9%) |
| 5 to 9 Years | 301 (5.9%) | 41 (0.8%) |
| 10 to 14 Years | 176 (3.5%) | 132 (2.6%) |
| 15 to 19 Years | 159 (3.1%) | 102 (2.0%) |
| 20 to 24 Years | 272 (5.3%) | 210 (4.1%) |
| 25 to 29 Years | 294 (5.8%) | 630 (12.2%) |
| 30 to 34 Years | 303 (5.9%) | 121 (2.4%) |
| 35 to 39 Years | 289 (5.7%) | 260 (5.0%) |
| 40 to 44 Years | 158 (3.1%) | 290 (5.6%) |
| 45 to 49 Years | 253 (5.0%) | 204 (4.0%) |
| 50 to 54 Years | 177 (3.5%) | 396 (7.7%) |
| 55 to 59 Years | 595 (11.7%) | 557 (10.8%) |
| 60 to 64 Years | 250 (4.9%) | 316 (6.1%) |
| 65 to 69 Years | 442 (8.6%) | 521 (10.1%) |
| 70 to 74 Years | 557 (10.9%) | 410 (8.0%) |
| 75 to 79 Years | 281 (5.5%) | 435 (8.4%) |
| 80 to 84 Years | 168 (3.3%) | 202 (3.9%) |
| 85 Years and over | 106 (2.1%) | 180 (3.5%) |
| Total | 5,107 (100.0%) | 5,158 (100.0%) |
Families and Households in Rockport
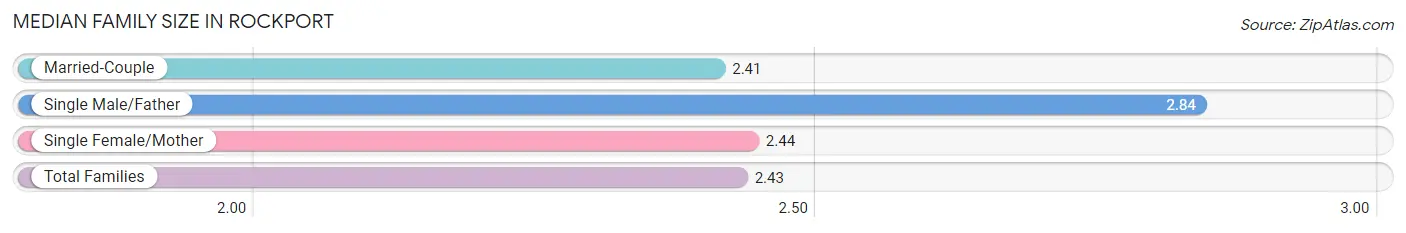
Median Family Size in Rockport
The median family size in Rockport is 2.43 persons per family, with single male/father families (124 | 4.2%) accounting for the largest median family size of 2.84 persons per family. On the other hand, married-couple families (2,267 | 76.9%) represent the smallest median family size with 2.41 persons per family.
| Family Type | # Families | Family Size |
| Married-Couple | 2,267 (76.9%) | 2.41 |
| Single Male/Father | 124 (4.2%) | 2.84 |
| Single Female/Mother | 557 (18.9%) | 2.44 |
| Total Families | 2,948 (100.0%) | 2.43 |
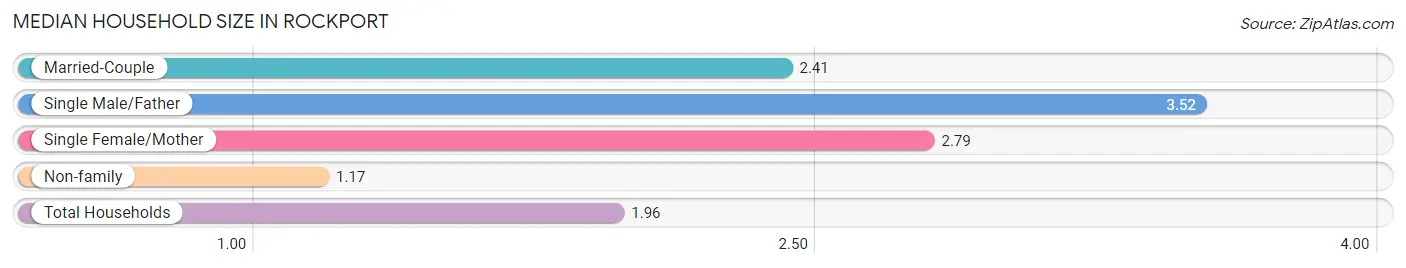
Median Household Size in Rockport
The median household size in Rockport is 1.96 persons per household, with single male/father households (124 | 2.4%) accounting for the largest median household size of 3.52 persons per household. non-family households (2,148 | 42.1%) represent the smallest median household size with 1.17 persons per household.
| Household Type | # Households | Household Size |
| Married-Couple | 2,267 (44.5%) | 2.41 |
| Single Male/Father | 124 (2.4%) | 3.52 |
| Single Female/Mother | 557 (10.9%) | 2.79 |
| Non-family | 2,148 (42.1%) | 1.17 |
| Total Households | 5,096 (100.0%) | 1.96 |
Household Size by Marriage Status in Rockport
Out of a total of 5,096 households in Rockport, 2,948 (57.9%) are family households, while 2,148 (42.1%) are nonfamily households. The most numerous type of family households are 2-person households, comprising 1,692, and the most common type of nonfamily households are 1-person households, comprising 1,766.
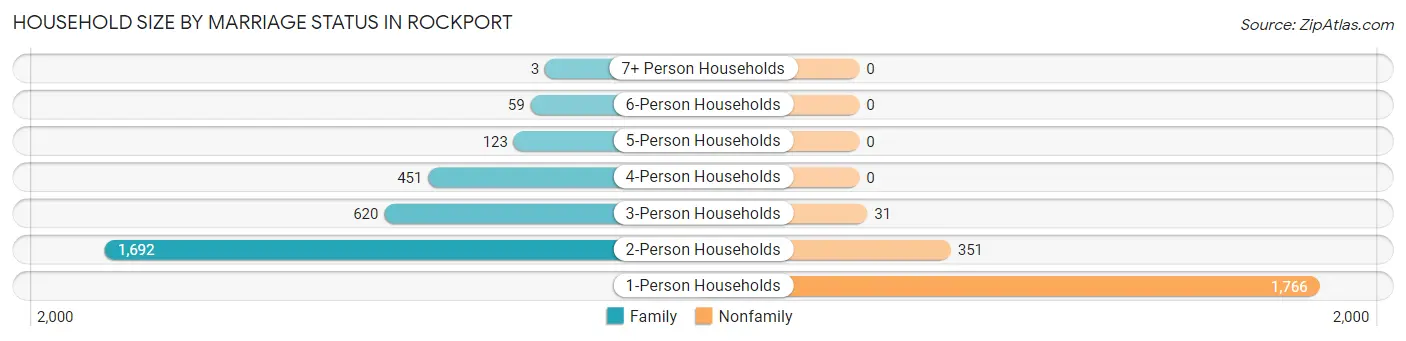
| Household Size | Family Households | Nonfamily Households |
| 1-Person Households | - | 1,766 (34.6%) |
| 2-Person Households | 1,692 (33.2%) | 351 (6.9%) |
| 3-Person Households | 620 (12.2%) | 31 (0.6%) |
| 4-Person Households | 451 (8.8%) | 0 (0.0%) |
| 5-Person Households | 123 (2.4%) | 0 (0.0%) |
| 6-Person Households | 59 (1.2%) | 0 (0.0%) |
| 7+ Person Households | 3 (0.1%) | 0 (0.0%) |
| Total | 2,948 (57.9%) | 2,148 (42.1%) |
Female Fertility in Rockport
Fertility by Age in Rockport
Average fertility rate in Rockport is 51.0 births per 1,000 women. Women in the age bracket of 20 to 34 years have the highest fertility rate with 98.0 births per 1,000 women. Women in the age bracket of 20 to 34 years acount for 100.0% of all women with births.
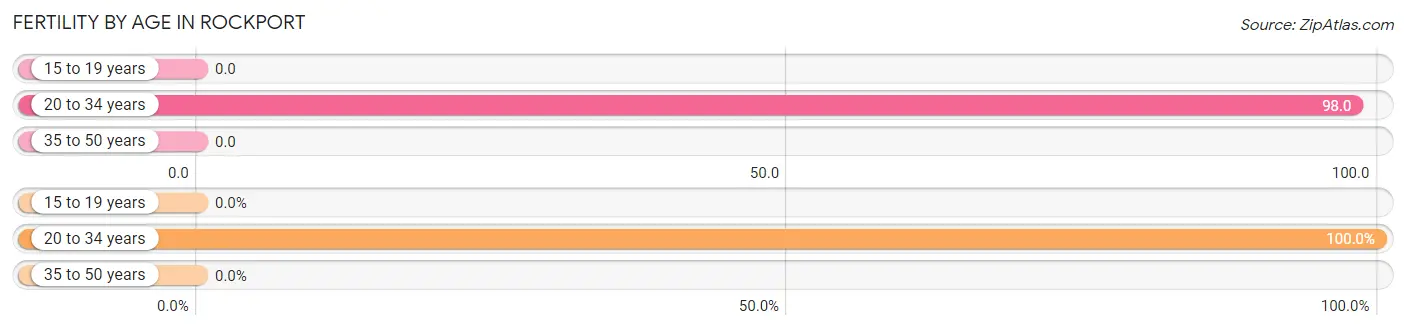
| Age Bracket | Women with Births | Births / 1,000 Women |
| 15 to 19 years | 0 (0.0%) | 0.0 |
| 20 to 34 years | 94 (100.0%) | 98.0 |
| 35 to 50 years | 0 (0.0%) | 0.0 |
| Total | 94 (100.0%) | 51.0 |
Fertility by Age by Marriage Status in Rockport
75.5% of women with births (94) in Rockport are married. The highest percentage of unmarried women with births falls into 20 to 34 years age bracket with 24.5% of them unmarried at the time of birth, while the lowest percentage of unmarried women with births belong to 20 to 34 years age bracket with 24.5% of them unmarried.
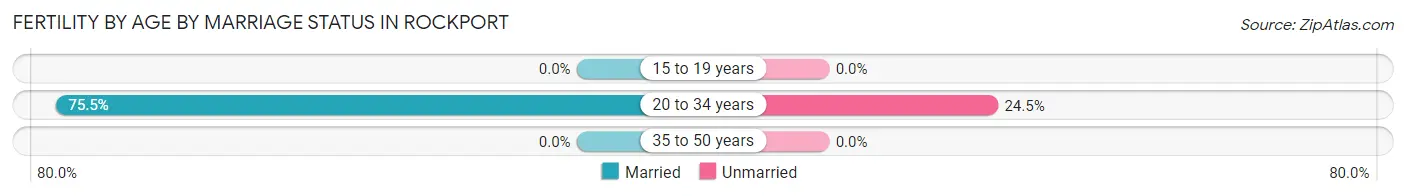
| Age Bracket | Married | Unmarried |
| 15 to 19 years | 0 (0.0%) | 0 (0.0%) |
| 20 to 34 years | 71 (75.5%) | 23 (24.5%) |
| 35 to 50 years | 0 (0.0%) | 0 (0.0%) |
| Total | 71 (75.5%) | 23 (24.5%) |
Fertility by Education in Rockport
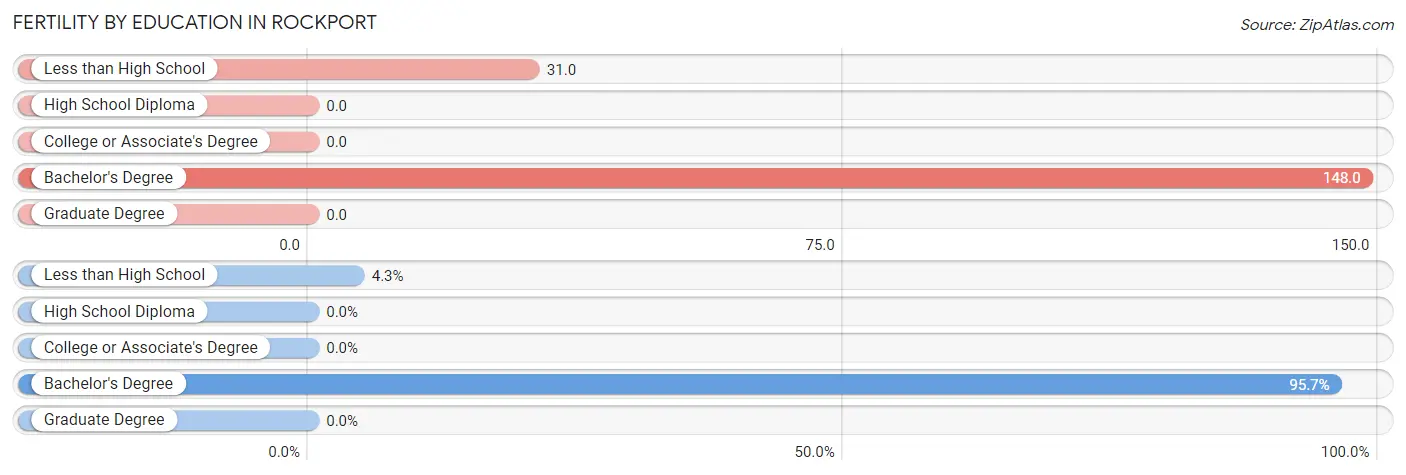
| Educational Attainment | Women with Births | Births / 1,000 Women |
| Less than High School | 4 (4.3%) | 31.0 |
| High School Diploma | 0 (0.0%) | 0.0 |
| College or Associate's Degree | 0 (0.0%) | 0.0 |
| Bachelor's Degree | 90 (95.7%) | 148.0 |
| Graduate Degree | 0 (0.0%) | 0.0 |
| Total | 94 (100.0%) | 51.0 |
Fertility by Education by Marriage Status in Rockport
24.5% of women with births in Rockport are unmarried. Women with the educational attainment of bachelor's degree are most likely to be married with 78.9% of them married at childbirth, while women with the educational attainment of less than high school are least likely to be married with 100.0% of them unmarried at childbirth.
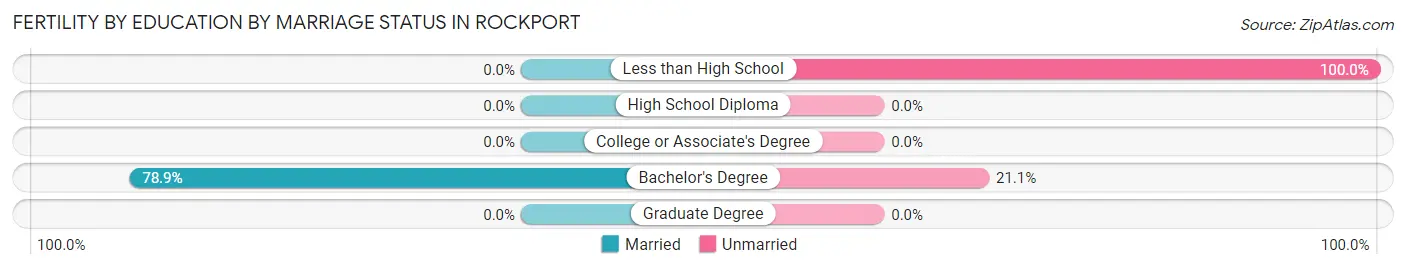
| Educational Attainment | Married | Unmarried |
| Less than High School | 0 (0.0%) | 4 (100.0%) |
| High School Diploma | 0 (0.0%) | 0 (0.0%) |
| College or Associate's Degree | 0 (0.0%) | 0 (0.0%) |
| Bachelor's Degree | 71 (78.9%) | 19 (21.1%) |
| Graduate Degree | 0 (0.0%) | 0 (0.0%) |
| Total | 71 (75.5%) | 23 (24.5%) |
Employment Characteristics in Rockport
Employment by Class of Employer in Rockport
Among the 4,186 employed individuals in Rockport, private company employees (2,032 | 48.5%), local government employees (891 | 21.3%), and self-employed (incorporated) (413 | 9.9%) make up the most common classes of employment.
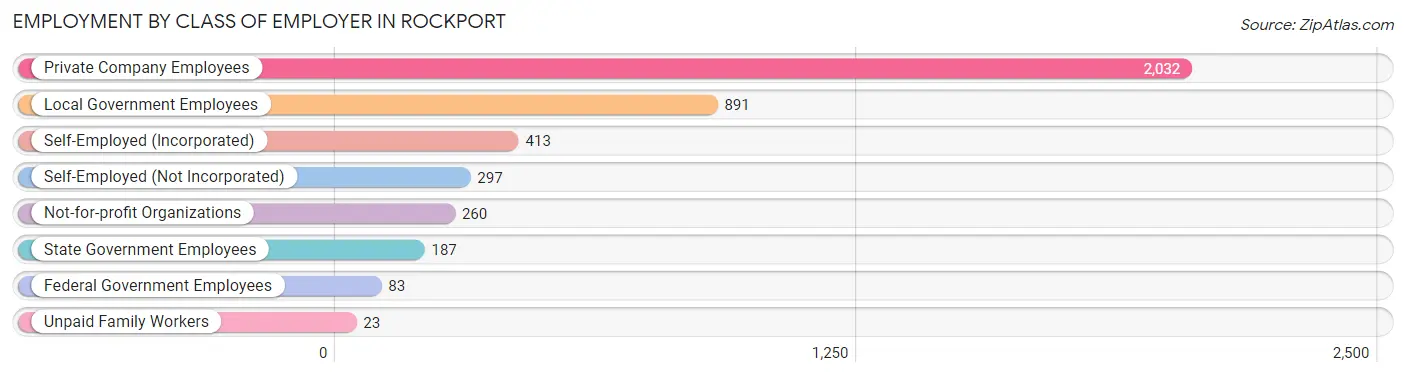
| Employer Class | # Employees | % Employees |
| Private Company Employees | 2,032 | 48.5% |
| Self-Employed (Incorporated) | 413 | 9.9% |
| Self-Employed (Not Incorporated) | 297 | 7.1% |
| Not-for-profit Organizations | 260 | 6.2% |
| Local Government Employees | 891 | 21.3% |
| State Government Employees | 187 | 4.5% |
| Federal Government Employees | 83 | 2.0% |
| Unpaid Family Workers | 23 | 0.5% |
| Total | 4,186 | 100.0% |
Employment Status by Age in Rockport
According to the labor force statistics for Rockport, out of the total population over 16 years of age (9,088), 49.6% or 4,508 individuals are in the labor force, with 5.0% or 225 of them unemployed. The age group with the highest labor force participation rate is 25 to 29 years, with 89.0% or 822 individuals in the labor force. Within the labor force, the 25 to 29 years age range has the highest percentage of unemployed individuals, with 9.9% or 81 of them being unemployed.
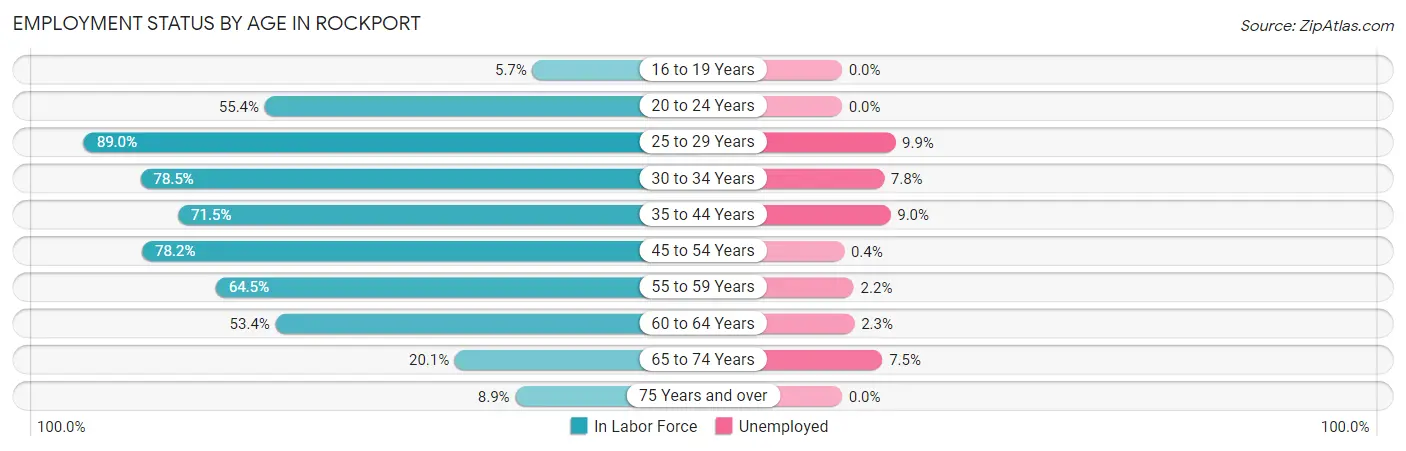
| Age Bracket | In Labor Force | Unemployed |
| 16 to 19 Years | 12 (5.7%) | 0 (0.0%) |
| 20 to 24 Years | 267 (55.4%) | 0 (0.0%) |
| 25 to 29 Years | 822 (89.0%) | 81 (9.9%) |
| 30 to 34 Years | 333 (78.5%) | 26 (7.8%) |
| 35 to 44 Years | 713 (71.5%) | 64 (9.0%) |
| 45 to 54 Years | 805 (78.2%) | 3 (0.4%) |
| 55 to 59 Years | 743 (64.5%) | 16 (2.2%) |
| 60 to 64 Years | 302 (53.4%) | 7 (2.3%) |
| 65 to 74 Years | 388 (20.1%) | 29 (7.5%) |
| 75 Years and over | 122 (8.9%) | 0 (0.0%) |
| Total | 4,508 (49.6%) | 225 (5.0%) |
Employment Status by Educational Attainment in Rockport
According to labor force statistics for Rockport, 73.0% of individuals (3,718) out of the total population between 25 and 64 years of age (5,093) are in the labor force, with 5.3% or 197 of them being unemployed. The group with the highest labor force participation rate are those with the educational attainment of less than high school, with 80.7% or 455 individuals in the labor force. Within the labor force, individuals with less than high school education have the highest percentage of unemployment, with 9.2% or 42 of them being unemployed.
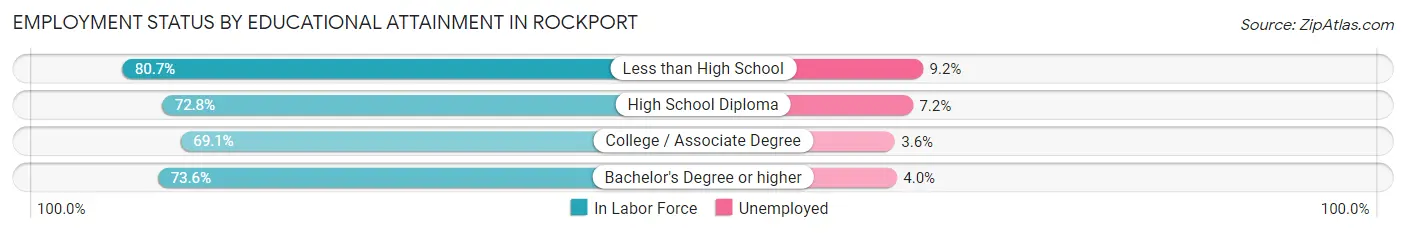
| Educational Attainment | In Labor Force | Unemployed |
| Less than High School | 455 (80.7%) | 52 (9.2%) |
| High School Diploma | 864 (72.8%) | 85 (7.2%) |
| College / Associate Degree | 938 (69.1%) | 49 (3.6%) |
| Bachelor's Degree or higher | 1,461 (73.6%) | 79 (4.0%) |
| Total | 3,718 (73.0%) | 270 (5.3%) |
Employment Occupations by Sex in Rockport
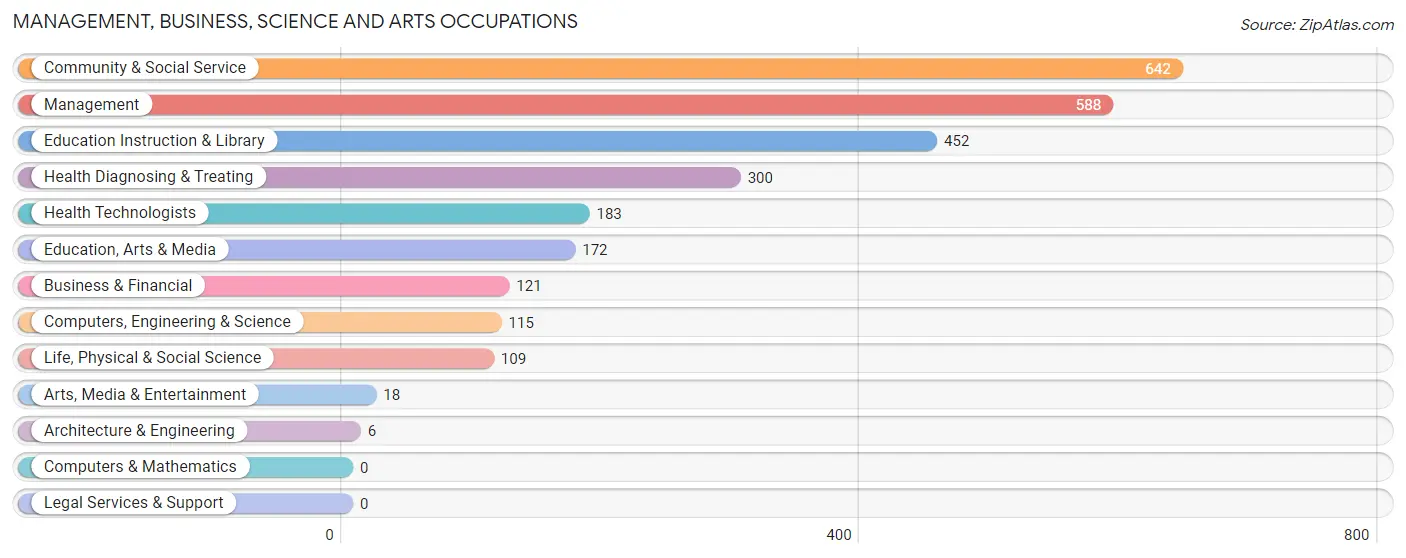
Management, Business, Science and Arts Occupations
The most common Management, Business, Science and Arts occupations in Rockport are Community & Social Service (642 | 15.0%), Management (588 | 13.7%), Education Instruction & Library (452 | 10.6%), Health Diagnosing & Treating (300 | 7.0%), and Health Technologists (183 | 4.3%).
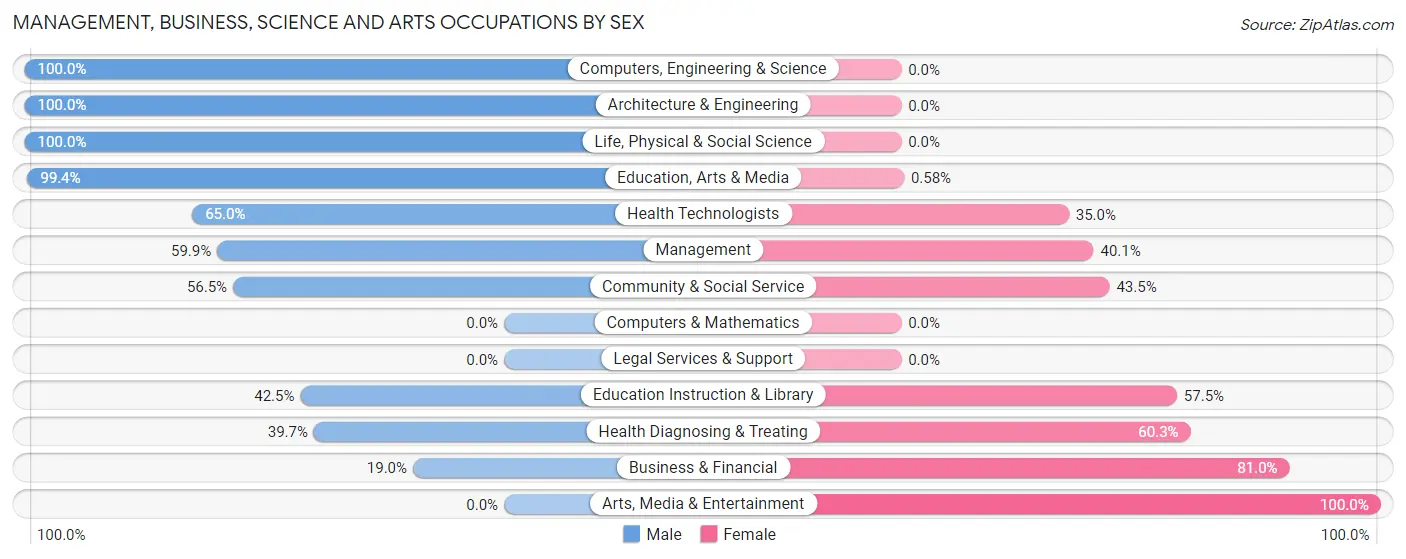
Management, Business, Science and Arts Occupations by Sex
Within the Management, Business, Science and Arts occupations in Rockport, the most male-oriented occupations are Computers, Engineering & Science (100.0%), Architecture & Engineering (100.0%), and Life, Physical & Social Science (100.0%), while the most female-oriented occupations are Arts, Media & Entertainment (100.0%), Business & Financial (81.0%), and Health Diagnosing & Treating (60.3%).
| Occupation | Male | Female |
| Management | 352 (59.9%) | 236 (40.1%) |
| Business & Financial | 23 (19.0%) | 98 (81.0%) |
| Computers, Engineering & Science | 115 (100.0%) | 0 (0.0%) |
| Computers & Mathematics | 0 (0.0%) | 0 (0.0%) |
| Architecture & Engineering | 6 (100.0%) | 0 (0.0%) |
| Life, Physical & Social Science | 109 (100.0%) | 0 (0.0%) |
| Community & Social Service | 363 (56.5%) | 279 (43.5%) |
| Education, Arts & Media | 171 (99.4%) | 1 (0.6%) |
| Legal Services & Support | 0 (0.0%) | 0 (0.0%) |
| Education Instruction & Library | 192 (42.5%) | 260 (57.5%) |
| Arts, Media & Entertainment | 0 (0.0%) | 18 (100.0%) |
| Health Diagnosing & Treating | 119 (39.7%) | 181 (60.3%) |
| Health Technologists | 119 (65.0%) | 64 (35.0%) |
| Total (Category) | 972 (55.0%) | 794 (45.0%) |
| Total (Overall) | 2,313 (54.0%) | 1,967 (46.0%) |
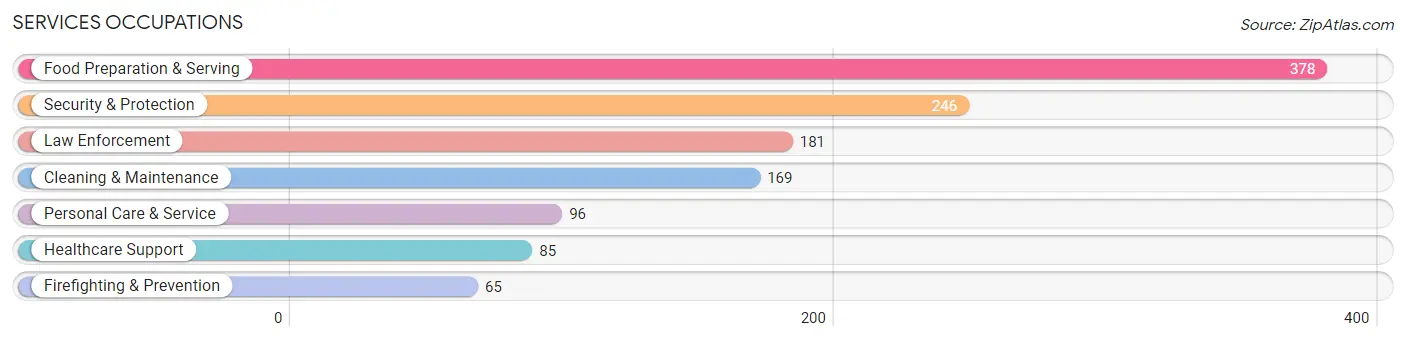
Services Occupations
The most common Services occupations in Rockport are Food Preparation & Serving (378 | 8.8%), Security & Protection (246 | 5.8%), Law Enforcement (181 | 4.2%), Cleaning & Maintenance (169 | 4.0%), and Personal Care & Service (96 | 2.2%).
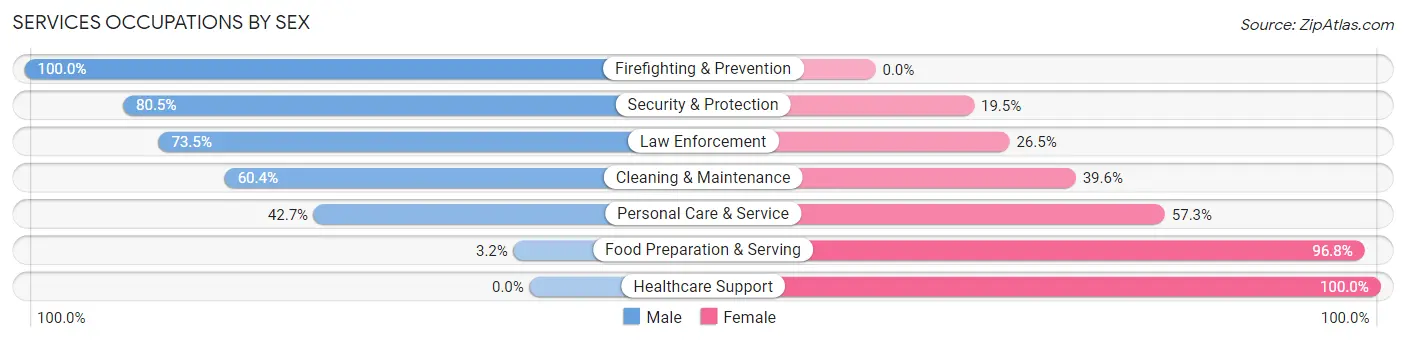
Services Occupations by Sex
Within the Services occupations in Rockport, the most male-oriented occupations are Firefighting & Prevention (100.0%), Security & Protection (80.5%), and Law Enforcement (73.5%), while the most female-oriented occupations are Healthcare Support (100.0%), Food Preparation & Serving (96.8%), and Personal Care & Service (57.3%).
| Occupation | Male | Female |
| Healthcare Support | 0 (0.0%) | 85 (100.0%) |
| Security & Protection | 198 (80.5%) | 48 (19.5%) |
| Firefighting & Prevention | 65 (100.0%) | 0 (0.0%) |
| Law Enforcement | 133 (73.5%) | 48 (26.5%) |
| Food Preparation & Serving | 12 (3.2%) | 366 (96.8%) |
| Cleaning & Maintenance | 102 (60.4%) | 67 (39.6%) |
| Personal Care & Service | 41 (42.7%) | 55 (57.3%) |
| Total (Category) | 353 (36.2%) | 621 (63.8%) |
| Total (Overall) | 2,313 (54.0%) | 1,967 (46.0%) |
Sales and Office Occupations
The most common Sales and Office occupations in Rockport are Sales & Related (384 | 9.0%), and Office & Administration (360 | 8.4%).
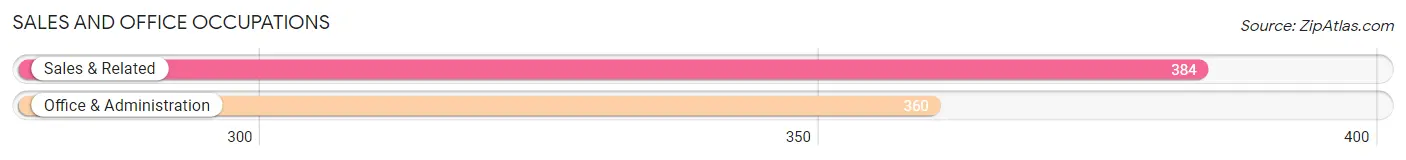
Sales and Office Occupations by Sex

| Occupation | Male | Female |
| Sales & Related | 205 (53.4%) | 179 (46.6%) |
| Office & Administration | 42 (11.7%) | 318 (88.3%) |
| Total (Category) | 247 (33.2%) | 497 (66.8%) |
| Total (Overall) | 2,313 (54.0%) | 1,967 (46.0%) |
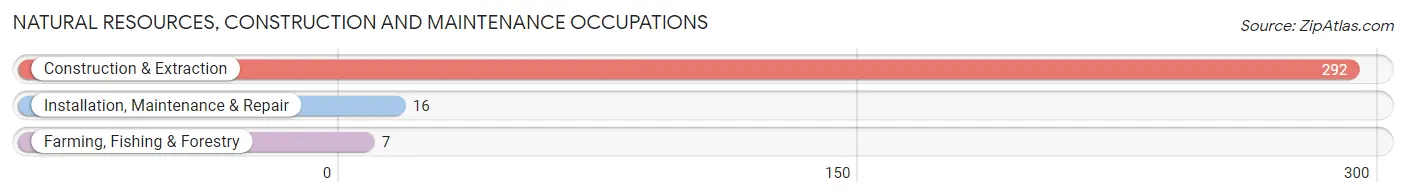
Natural Resources, Construction and Maintenance Occupations
The most common Natural Resources, Construction and Maintenance occupations in Rockport are Construction & Extraction (292 | 6.8%), Installation, Maintenance & Repair (16 | 0.4%), and Farming, Fishing & Forestry (7 | 0.2%).
Natural Resources, Construction and Maintenance Occupations by Sex
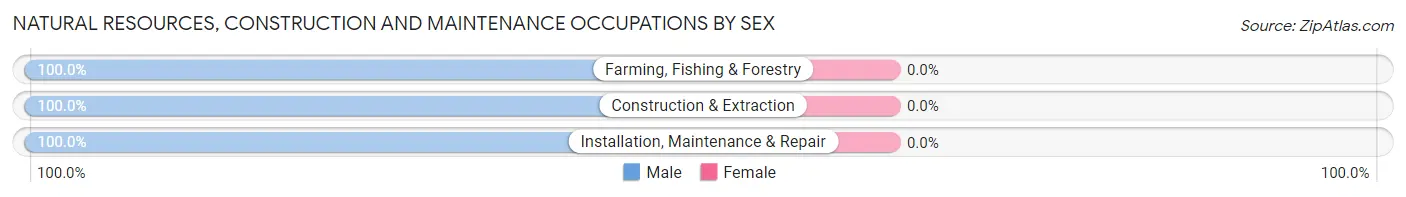
| Occupation | Male | Female |
| Farming, Fishing & Forestry | 7 (100.0%) | 0 (0.0%) |
| Construction & Extraction | 292 (100.0%) | 0 (0.0%) |
| Installation, Maintenance & Repair | 16 (100.0%) | 0 (0.0%) |
| Total (Category) | 315 (100.0%) | 0 (0.0%) |
| Total (Overall) | 2,313 (54.0%) | 1,967 (46.0%) |
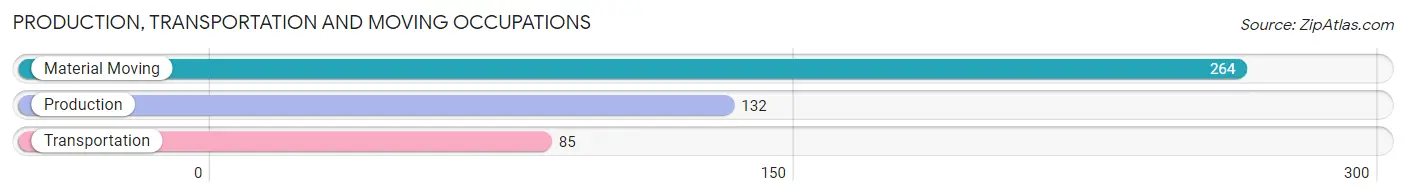
Production, Transportation and Moving Occupations
The most common Production, Transportation and Moving occupations in Rockport are Material Moving (264 | 6.2%), Production (132 | 3.1%), and Transportation (85 | 2.0%).
Production, Transportation and Moving Occupations by Sex
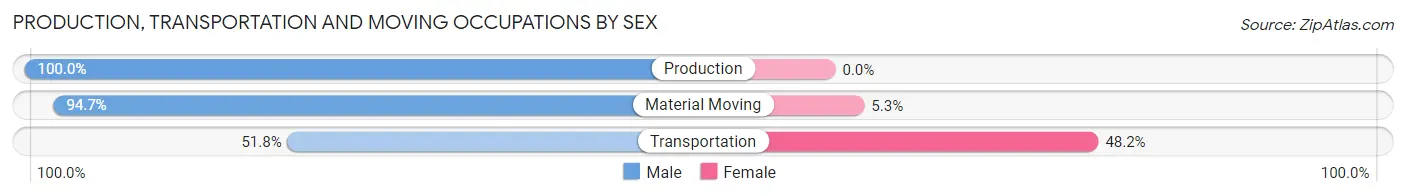
| Occupation | Male | Female |
| Production | 132 (100.0%) | 0 (0.0%) |
| Transportation | 44 (51.8%) | 41 (48.2%) |
| Material Moving | 250 (94.7%) | 14 (5.3%) |
| Total (Category) | 426 (88.6%) | 55 (11.4%) |
| Total (Overall) | 2,313 (54.0%) | 1,967 (46.0%) |
Employment Industries by Sex in Rockport
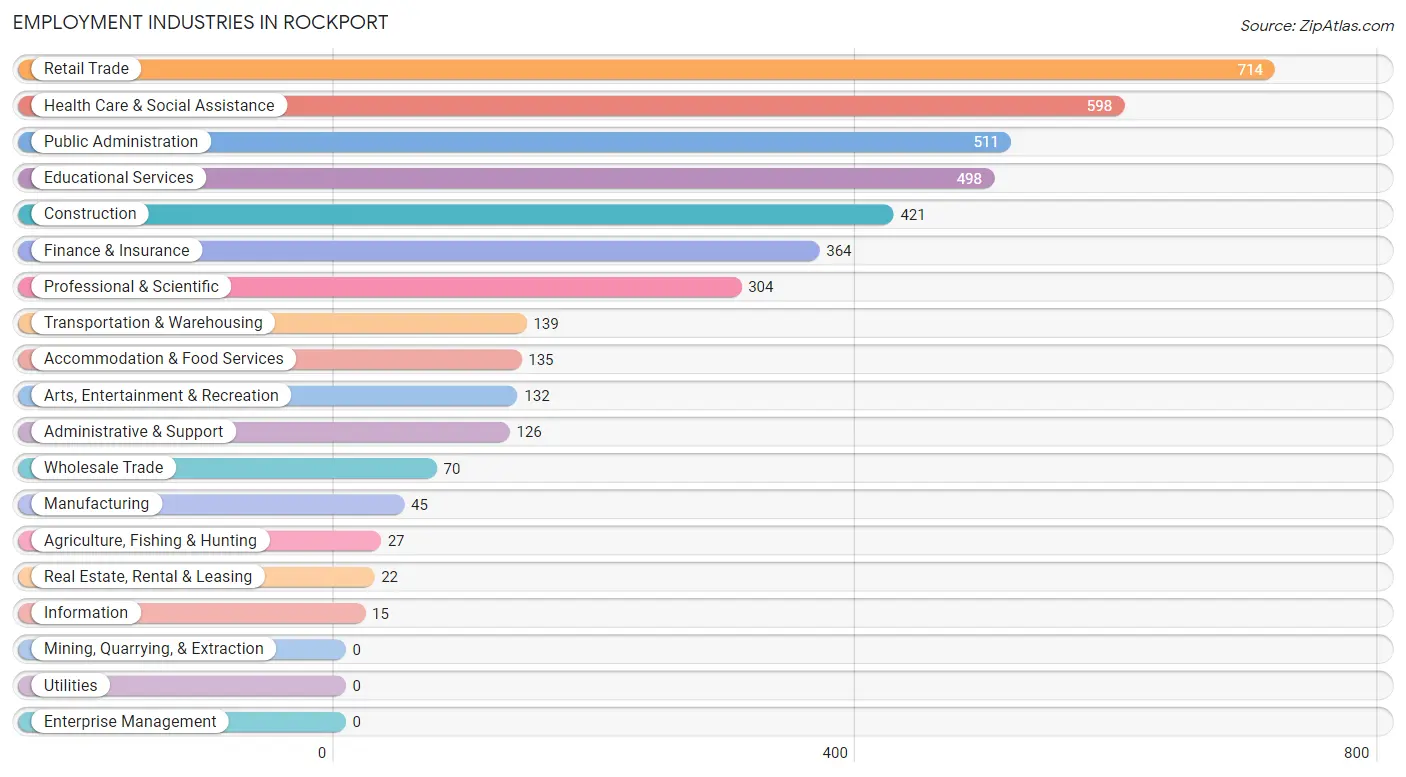
Employment Industries in Rockport
The major employment industries in Rockport include Retail Trade (714 | 16.7%), Health Care & Social Assistance (598 | 14.0%), Public Administration (511 | 11.9%), Educational Services (498 | 11.6%), and Construction (421 | 9.8%).
Employment Industries by Sex in Rockport
The Rockport industries that see more men than women are Construction (100.0%), Manufacturing (100.0%), and Information (100.0%), whereas the industries that tend to have a higher number of women are Accommodation & Food Services (74.8%), Transportation & Warehousing (72.7%), and Arts, Entertainment & Recreation (68.9%).
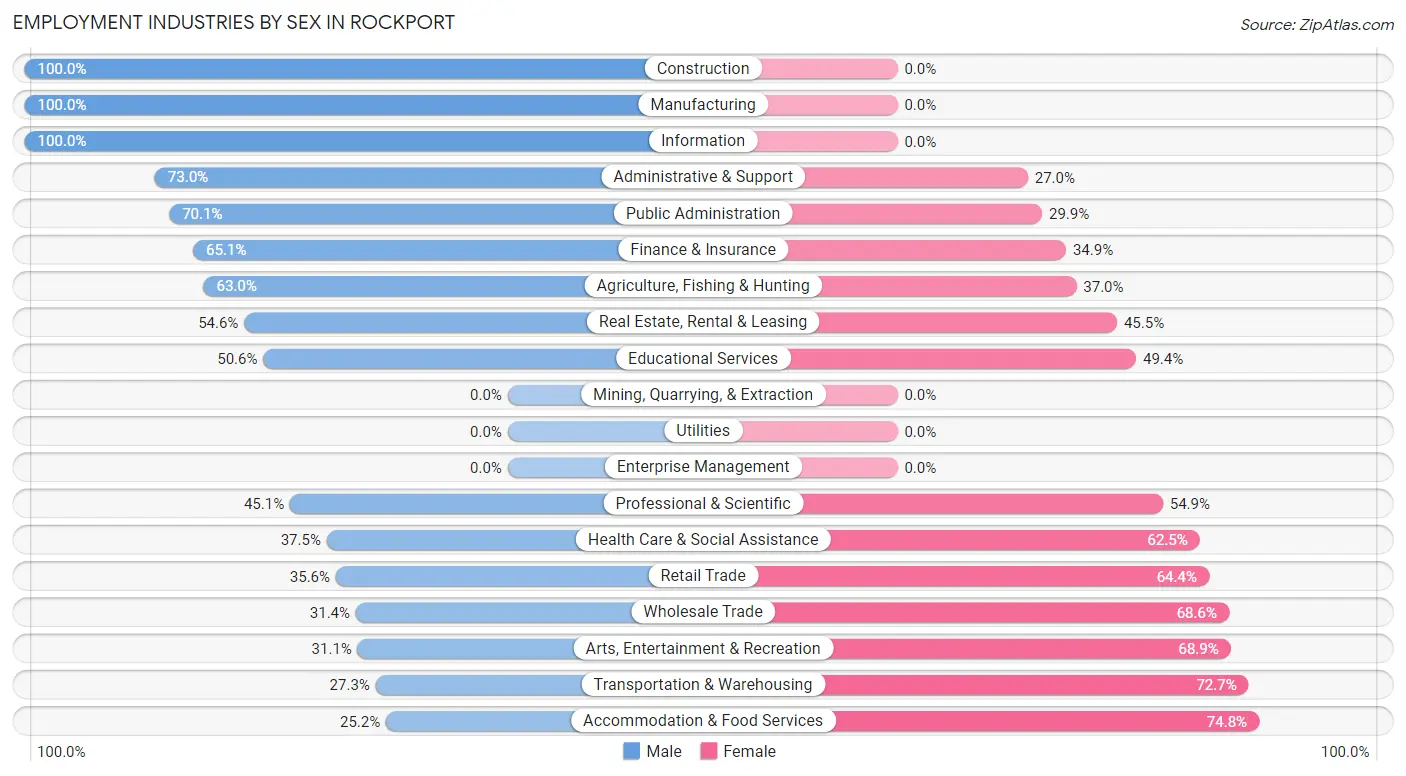
| Industry | Male | Female |
| Agriculture, Fishing & Hunting | 17 (63.0%) | 10 (37.0%) |
| Mining, Quarrying, & Extraction | 0 (0.0%) | 0 (0.0%) |
| Construction | 421 (100.0%) | 0 (0.0%) |
| Manufacturing | 45 (100.0%) | 0 (0.0%) |
| Wholesale Trade | 22 (31.4%) | 48 (68.6%) |
| Retail Trade | 254 (35.6%) | 460 (64.4%) |
| Transportation & Warehousing | 38 (27.3%) | 101 (72.7%) |
| Utilities | 0 (0.0%) | 0 (0.0%) |
| Information | 15 (100.0%) | 0 (0.0%) |
| Finance & Insurance | 237 (65.1%) | 127 (34.9%) |
| Real Estate, Rental & Leasing | 12 (54.5%) | 10 (45.5%) |
| Professional & Scientific | 137 (45.1%) | 167 (54.9%) |
| Enterprise Management | 0 (0.0%) | 0 (0.0%) |
| Administrative & Support | 92 (73.0%) | 34 (27.0%) |
| Educational Services | 252 (50.6%) | 246 (49.4%) |
| Health Care & Social Assistance | 224 (37.5%) | 374 (62.5%) |
| Arts, Entertainment & Recreation | 41 (31.1%) | 91 (68.9%) |
| Accommodation & Food Services | 34 (25.2%) | 101 (74.8%) |
| Public Administration | 358 (70.1%) | 153 (29.9%) |
| Total | 2,313 (54.0%) | 1,967 (46.0%) |
Education in Rockport
School Enrollment in Rockport
The most common levels of schooling among the 1,470 students in Rockport are college / undergraduate (413 | 28.1%), elementary school (411 | 28.0%), and high school (275 | 18.7%).
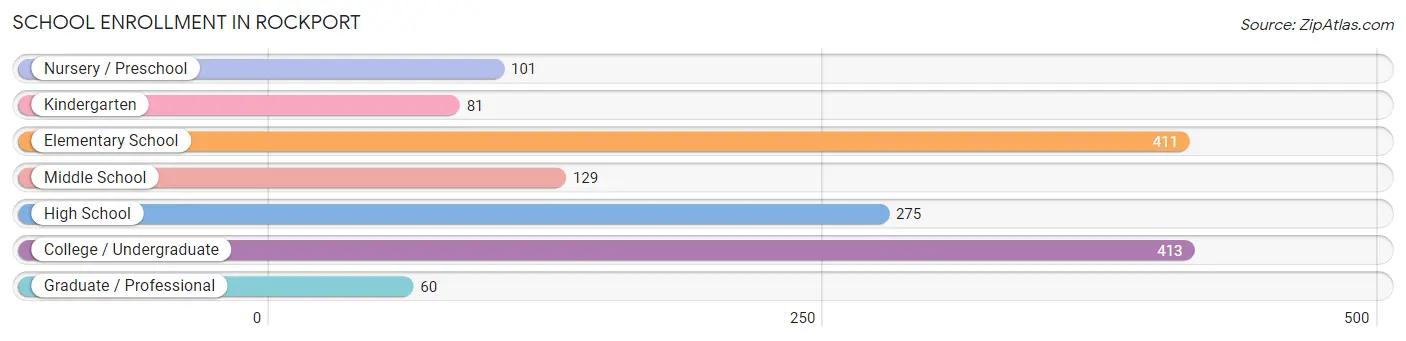
| School Level | # Students | % Students |
| Nursery / Preschool | 101 | 6.9% |
| Kindergarten | 81 | 5.5% |
| Elementary School | 411 | 28.0% |
| Middle School | 129 | 8.8% |
| High School | 275 | 18.7% |
| College / Undergraduate | 413 | 28.1% |
| Graduate / Professional | 60 | 4.1% |
| Total | 1,470 | 100.0% |
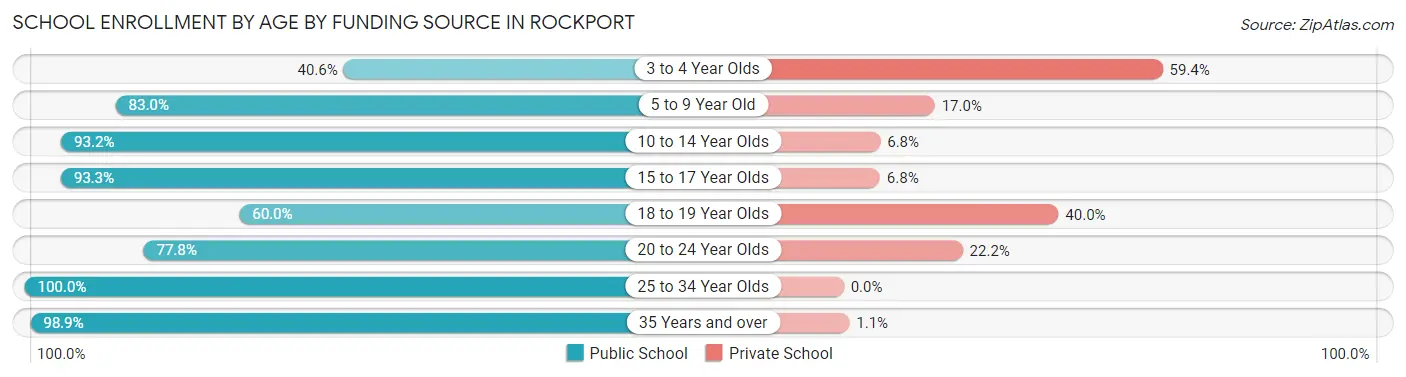
School Enrollment by Age by Funding Source in Rockport
Out of a total of 1,470 students who are enrolled in schools in Rockport, 240 (16.3%) attend a private institution, while the remaining 1,230 (83.7%) are enrolled in public schools. The age group of 3 to 4 year olds has the highest likelihood of being enrolled in private schools, with 60 (59.4% in the age bracket) enrolled. Conversely, the age group of 25 to 34 year olds has the lowest likelihood of being enrolled in a private school, with 25 (100.0% in the age bracket) attending a public institution.
| Age Bracket | Public School | Private School |
| 3 to 4 Year Olds | 41 (40.6%) | 60 (59.4%) |
| 5 to 9 Year Old | 284 (83.0%) | 58 (17.0%) |
| 10 to 14 Year Olds | 287 (93.2%) | 21 (6.8%) |
| 15 to 17 Year Olds | 221 (93.2%) | 16 (6.8%) |
| 18 to 19 Year Olds | 12 (60.0%) | 8 (40.0%) |
| 20 to 24 Year Olds | 267 (77.8%) | 76 (22.2%) |
| 25 to 34 Year Olds | 25 (100.0%) | 0 (0.0%) |
| 35 Years and over | 93 (98.9%) | 1 (1.1%) |
| Total | 1,230 (83.7%) | 240 (16.3%) |
Educational Attainment by Field of Study in Rockport
Business (678 | 21.5%), education (484 | 15.3%), science & technology (330 | 10.4%), visual & performing arts (327 | 10.3%), and liberal arts & history (233 | 7.4%) are the most common fields of study among 3,158 individuals in Rockport who have obtained a bachelor's degree or higher.
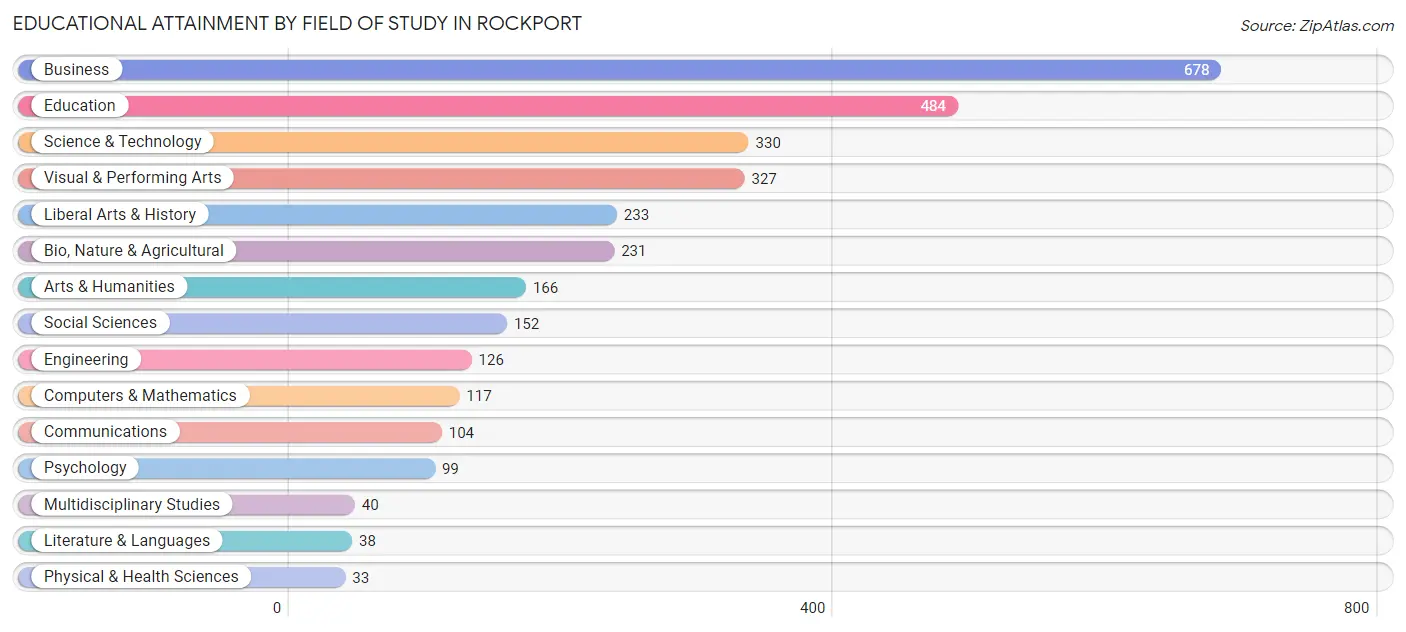
| Field of Study | # Graduates | % Graduates |
| Computers & Mathematics | 117 | 3.7% |
| Bio, Nature & Agricultural | 231 | 7.3% |
| Physical & Health Sciences | 33 | 1.0% |
| Psychology | 99 | 3.1% |
| Social Sciences | 152 | 4.8% |
| Engineering | 126 | 4.0% |
| Multidisciplinary Studies | 40 | 1.3% |
| Science & Technology | 330 | 10.4% |
| Business | 678 | 21.5% |
| Education | 484 | 15.3% |
| Literature & Languages | 38 | 1.2% |
| Liberal Arts & History | 233 | 7.4% |
| Visual & Performing Arts | 327 | 10.3% |
| Communications | 104 | 3.3% |
| Arts & Humanities | 166 | 5.3% |
| Total | 3,158 | 100.0% |
Transportation & Commute in Rockport
Vehicle Availability by Sex in Rockport
The most prevalent vehicle ownership categories in Rockport are males with 2 vehicles (1,236, accounting for 54.6%) and females with 2 vehicles (967, making up 64.3%).
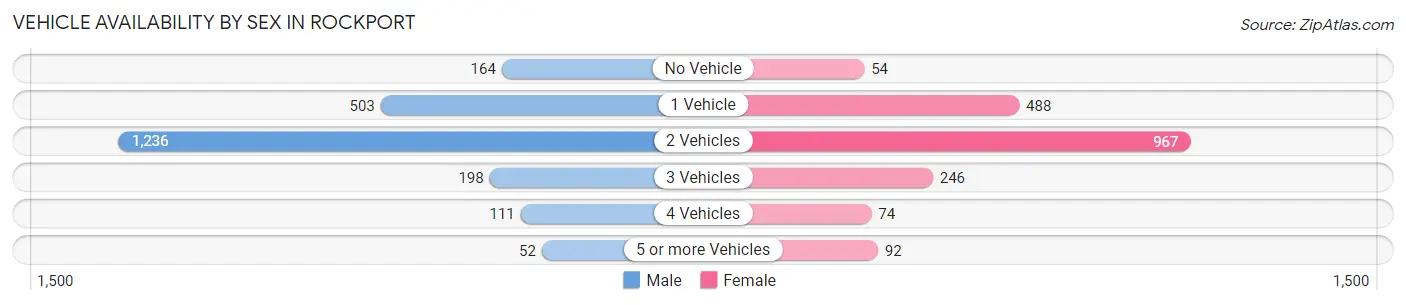
| Vehicles Available | Male | Female |
| No Vehicle | 164 (7.2%) | 54 (2.8%) |
| 1 Vehicle | 503 (22.2%) | 488 (25.4%) |
| 2 Vehicles | 1,236 (54.6%) | 967 (50.3%) |
| 3 Vehicles | 198 (8.7%) | 246 (12.8%) |
| 4 Vehicles | 111 (4.9%) | 74 (3.8%) |
| 5 or more Vehicles | 52 (2.3%) | 92 (4.8%) |
| Total | 2,264 (100.0%) | 1,921 (100.0%) |
Commute Time in Rockport
The most frequently occuring commute durations in Rockport are 10 to 14 minutes (730 commuters, 20.8%), 15 to 19 minutes (696 commuters, 19.8%), and 5 to 9 minutes (630 commuters, 17.9%).
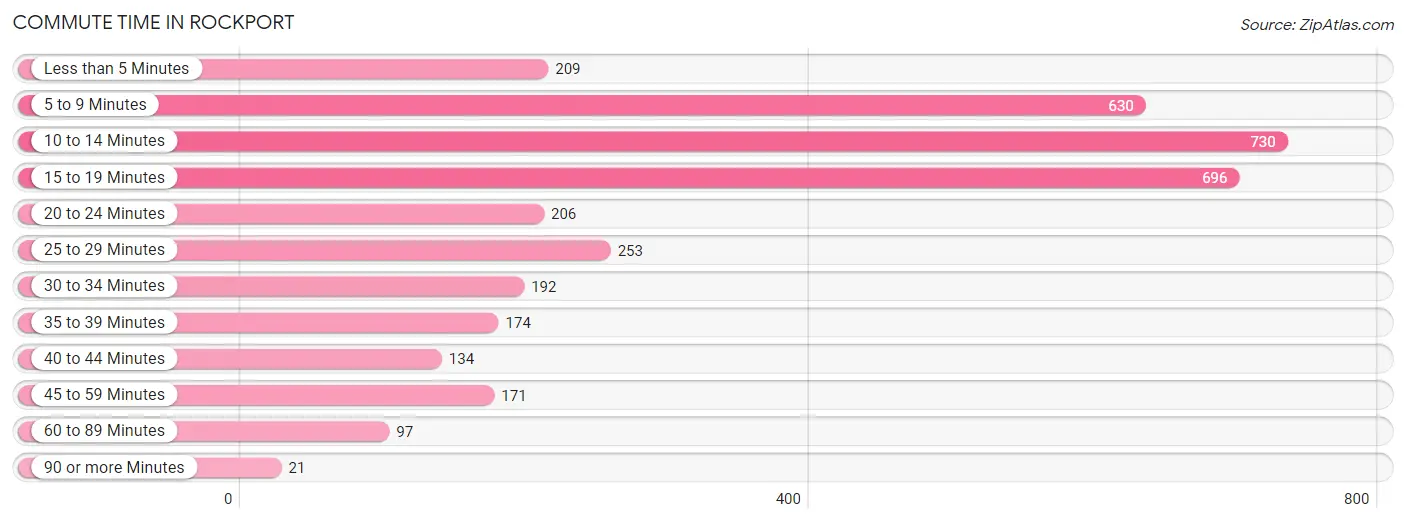
| Commute Time | # Commuters | % Commuters |
| Less than 5 Minutes | 209 | 5.9% |
| 5 to 9 Minutes | 630 | 17.9% |
| 10 to 14 Minutes | 730 | 20.8% |
| 15 to 19 Minutes | 696 | 19.8% |
| 20 to 24 Minutes | 206 | 5.9% |
| 25 to 29 Minutes | 253 | 7.2% |
| 30 to 34 Minutes | 192 | 5.5% |
| 35 to 39 Minutes | 174 | 5.0% |
| 40 to 44 Minutes | 134 | 3.8% |
| 45 to 59 Minutes | 171 | 4.9% |
| 60 to 89 Minutes | 97 | 2.8% |
| 90 or more Minutes | 21 | 0.6% |
Commute Time by Sex in Rockport
The most common commute times in Rockport are 15 to 19 minutes (619 commuters, 31.5%) for males and 5 to 9 minutes (494 commuters, 31.9%) for females.
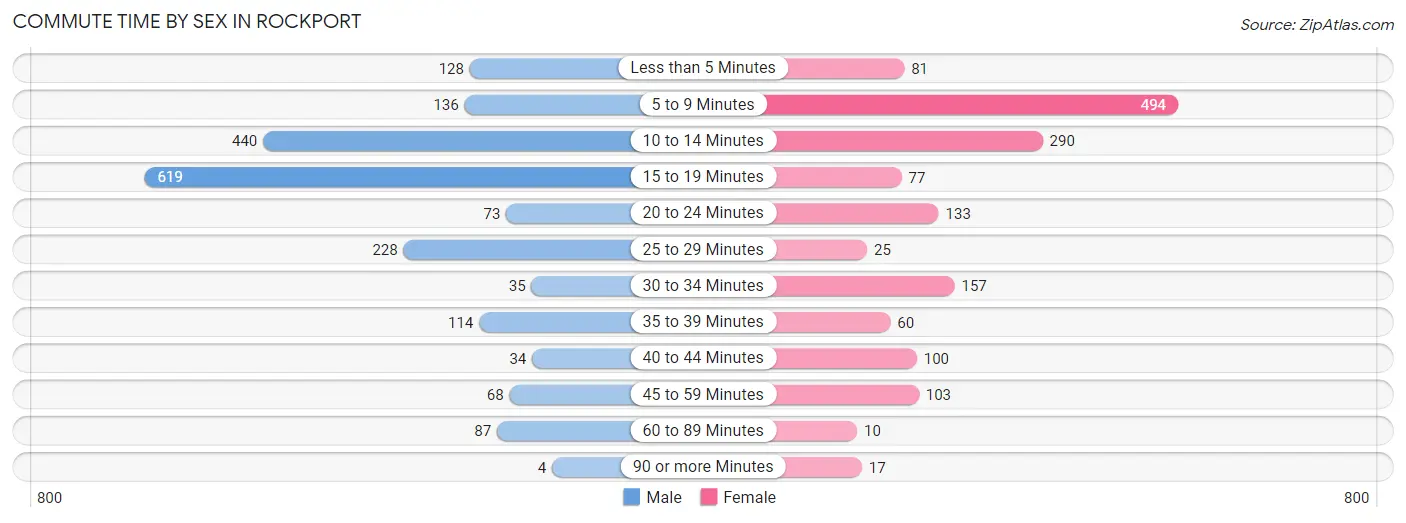
| Commute Time | Male | Female |
| Less than 5 Minutes | 128 (6.5%) | 81 (5.2%) |
| 5 to 9 Minutes | 136 (6.9%) | 494 (31.9%) |
| 10 to 14 Minutes | 440 (22.4%) | 290 (18.8%) |
| 15 to 19 Minutes | 619 (31.5%) | 77 (5.0%) |
| 20 to 24 Minutes | 73 (3.7%) | 133 (8.6%) |
| 25 to 29 Minutes | 228 (11.6%) | 25 (1.6%) |
| 30 to 34 Minutes | 35 (1.8%) | 157 (10.2%) |
| 35 to 39 Minutes | 114 (5.8%) | 60 (3.9%) |
| 40 to 44 Minutes | 34 (1.7%) | 100 (6.5%) |
| 45 to 59 Minutes | 68 (3.5%) | 103 (6.7%) |
| 60 to 89 Minutes | 87 (4.4%) | 10 (0.6%) |
| 90 or more Minutes | 4 (0.2%) | 17 (1.1%) |
Time of Departure to Work by Sex in Rockport
The most frequent times of departure to work in Rockport are 7:00 AM to 7:29 AM (436, 22.2%) for males and 8:00 AM to 8:29 AM (269, 17.4%) for females.
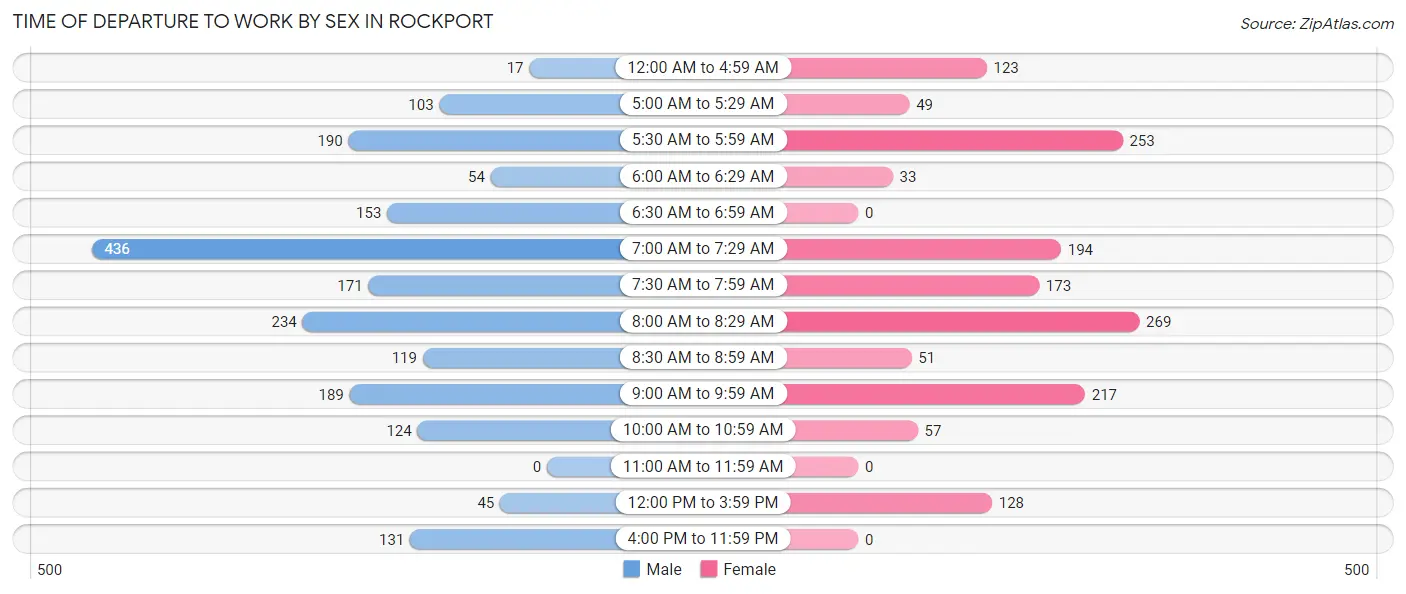
| Time of Departure | Male | Female |
| 12:00 AM to 4:59 AM | 17 (0.9%) | 123 (8.0%) |
| 5:00 AM to 5:29 AM | 103 (5.2%) | 49 (3.2%) |
| 5:30 AM to 5:59 AM | 190 (9.7%) | 253 (16.4%) |
| 6:00 AM to 6:29 AM | 54 (2.8%) | 33 (2.1%) |
| 6:30 AM to 6:59 AM | 153 (7.8%) | 0 (0.0%) |
| 7:00 AM to 7:29 AM | 436 (22.2%) | 194 (12.5%) |
| 7:30 AM to 7:59 AM | 171 (8.7%) | 173 (11.2%) |
| 8:00 AM to 8:29 AM | 234 (11.9%) | 269 (17.4%) |
| 8:30 AM to 8:59 AM | 119 (6.0%) | 51 (3.3%) |
| 9:00 AM to 9:59 AM | 189 (9.6%) | 217 (14.0%) |
| 10:00 AM to 10:59 AM | 124 (6.3%) | 57 (3.7%) |
| 11:00 AM to 11:59 AM | 0 (0.0%) | 0 (0.0%) |
| 12:00 PM to 3:59 PM | 45 (2.3%) | 128 (8.3%) |
| 4:00 PM to 11:59 PM | 131 (6.7%) | 0 (0.0%) |
| Total | 1,966 (100.0%) | 1,547 (100.0%) |
Housing Occupancy in Rockport
Occupancy by Ownership in Rockport
Of the total 5,096 dwellings in Rockport, owner-occupied units account for 3,777 (74.1%), while renter-occupied units make up 1,319 (25.9%).
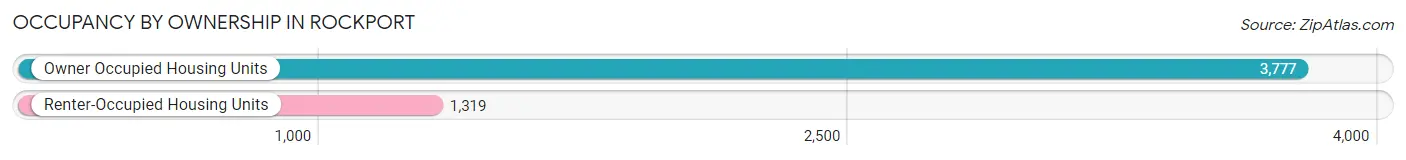
| Occupancy | # Housing Units | % Housing Units |
| Owner Occupied Housing Units | 3,777 | 74.1% |
| Renter-Occupied Housing Units | 1,319 | 25.9% |
| Total Occupied Housing Units | 5,096 | 100.0% |
Occupancy by Household Size in Rockport
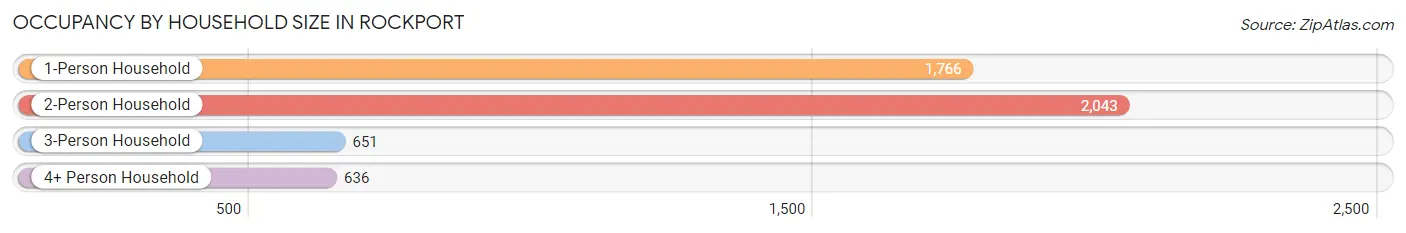
| Household Size | # Housing Units | % Housing Units |
| 1-Person Household | 1,766 | 34.6% |
| 2-Person Household | 2,043 | 40.1% |
| 3-Person Household | 651 | 12.8% |
| 4+ Person Household | 636 | 12.5% |
| Total Housing Units | 5,096 | 100.0% |
Occupancy by Ownership by Household Size in Rockport
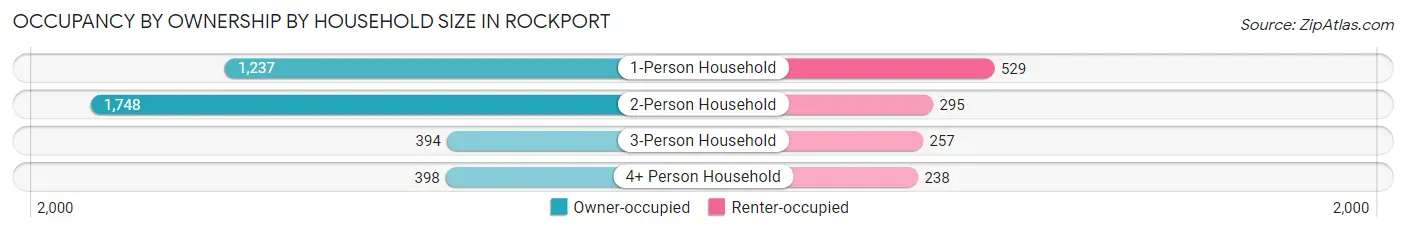
| Household Size | Owner-occupied | Renter-occupied |
| 1-Person Household | 1,237 (70.1%) | 529 (29.9%) |
| 2-Person Household | 1,748 (85.6%) | 295 (14.4%) |
| 3-Person Household | 394 (60.5%) | 257 (39.5%) |
| 4+ Person Household | 398 (62.6%) | 238 (37.4%) |
| Total Housing Units | 3,777 (74.1%) | 1,319 (25.9%) |
Occupancy by Educational Attainment in Rockport
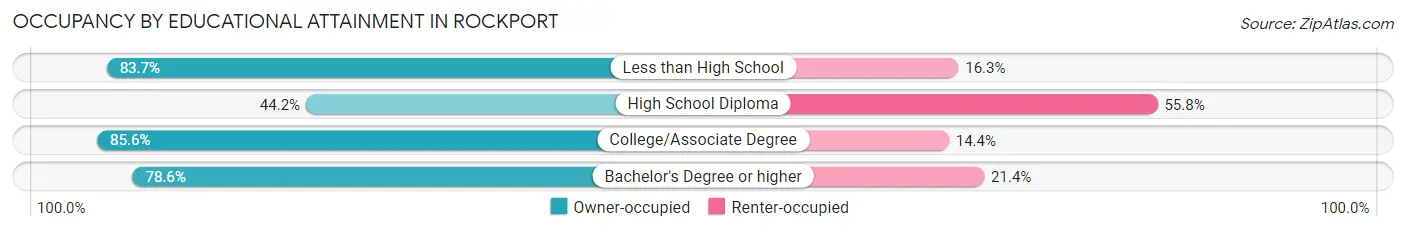
| Household Size | Owner-occupied | Renter-occupied |
| Less than High School | 401 (83.7%) | 78 (16.3%) |
| High School Diploma | 475 (44.2%) | 599 (55.8%) |
| College/Associate Degree | 1,422 (85.6%) | 239 (14.4%) |
| Bachelor's Degree or higher | 1,479 (78.6%) | 403 (21.4%) |
Occupancy by Age of Householder in Rockport
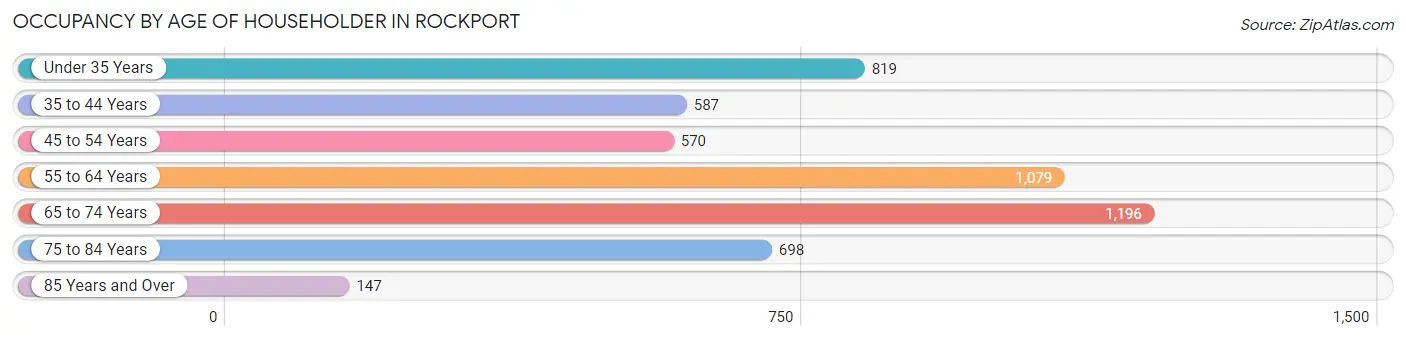
| Age Bracket | # Households | % Households |
| Under 35 Years | 819 | 16.1% |
| 35 to 44 Years | 587 | 11.5% |
| 45 to 54 Years | 570 | 11.2% |
| 55 to 64 Years | 1,079 | 21.2% |
| 65 to 74 Years | 1,196 | 23.5% |
| 75 to 84 Years | 698 | 13.7% |
| 85 Years and Over | 147 | 2.9% |
| Total | 5,096 | 100.0% |
Housing Finances in Rockport
Median Income by Occupancy in Rockport
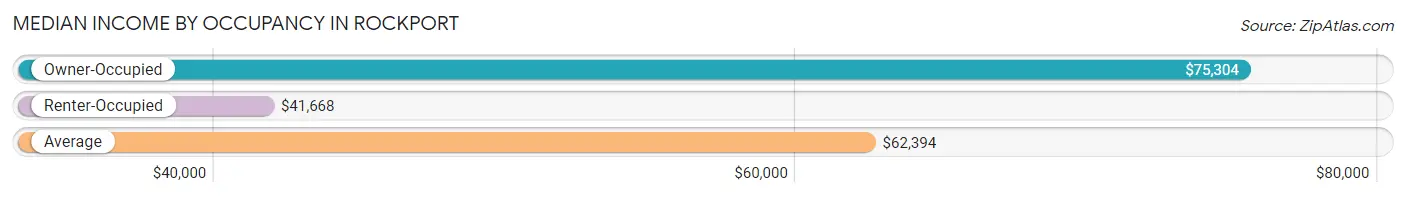
| Occupancy Type | # Households | Median Income |
| Owner-Occupied | 3,777 (74.1%) | $75,304 |
| Renter-Occupied | 1,319 (25.9%) | $41,668 |
| Average | 5,096 (100.0%) | $62,394 |
Occupancy by Householder Income Bracket in Rockport
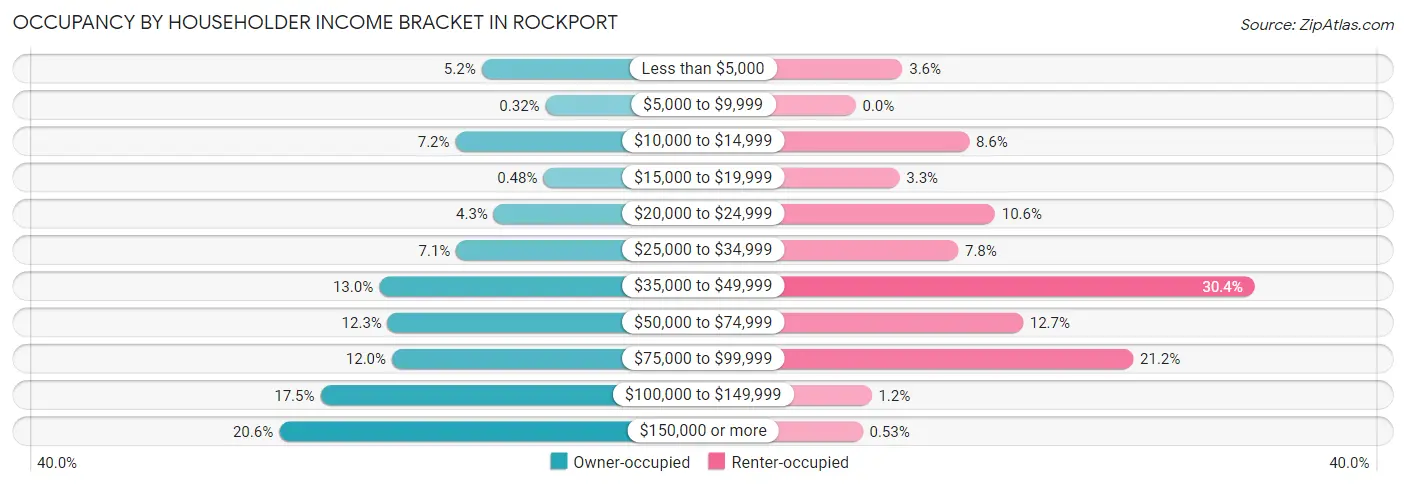
| Income Bracket | Owner-occupied | Renter-occupied |
| Less than $5,000 | 196 (5.2%) | 47 (3.6%) |
| $5,000 to $9,999 | 12 (0.3%) | 0 (0.0%) |
| $10,000 to $14,999 | 271 (7.2%) | 114 (8.6%) |
| $15,000 to $19,999 | 18 (0.5%) | 44 (3.3%) |
| $20,000 to $24,999 | 161 (4.3%) | 140 (10.6%) |
| $25,000 to $34,999 | 269 (7.1%) | 103 (7.8%) |
| $35,000 to $49,999 | 491 (13.0%) | 401 (30.4%) |
| $50,000 to $74,999 | 466 (12.3%) | 168 (12.7%) |
| $75,000 to $99,999 | 454 (12.0%) | 279 (21.1%) |
| $100,000 to $149,999 | 660 (17.5%) | 16 (1.2%) |
| $150,000 or more | 779 (20.6%) | 7 (0.5%) |
| Total | 3,777 (100.0%) | 1,319 (100.0%) |
Monthly Housing Cost Tiers in Rockport
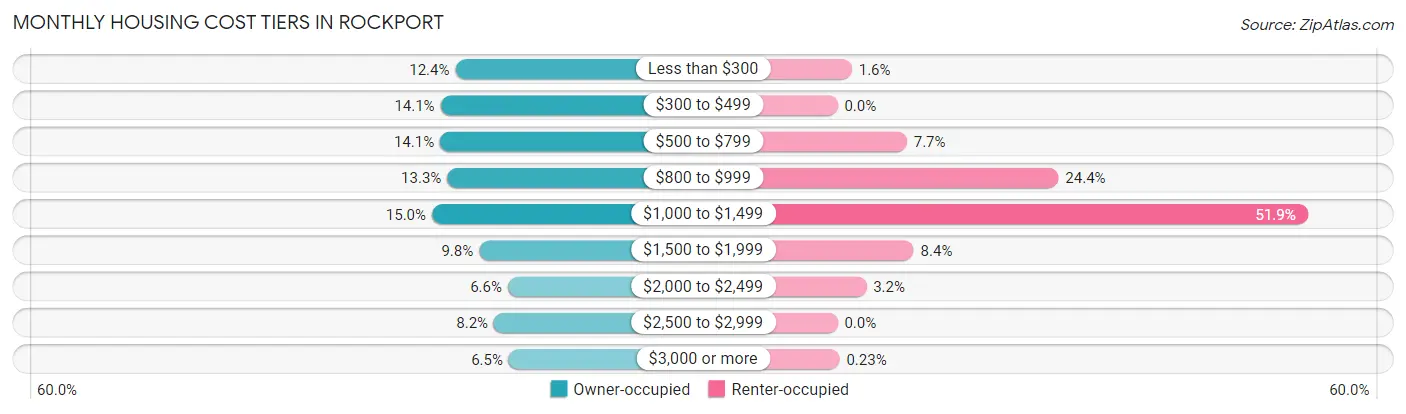
| Monthly Cost | Owner-occupied | Renter-occupied |
| Less than $300 | 469 (12.4%) | 21 (1.6%) |
| $300 to $499 | 531 (14.1%) | 0 (0.0%) |
| $500 to $799 | 533 (14.1%) | 101 (7.7%) |
| $800 to $999 | 503 (13.3%) | 322 (24.4%) |
| $1,000 to $1,499 | 567 (15.0%) | 685 (51.9%) |
| $1,500 to $1,999 | 370 (9.8%) | 111 (8.4%) |
| $2,000 to $2,499 | 250 (6.6%) | 42 (3.2%) |
| $2,500 to $2,999 | 308 (8.2%) | 0 (0.0%) |
| $3,000 or more | 246 (6.5%) | 3 (0.2%) |
| Total | 3,777 (100.0%) | 1,319 (100.0%) |
Physical Housing Characteristics in Rockport
Housing Structures in Rockport
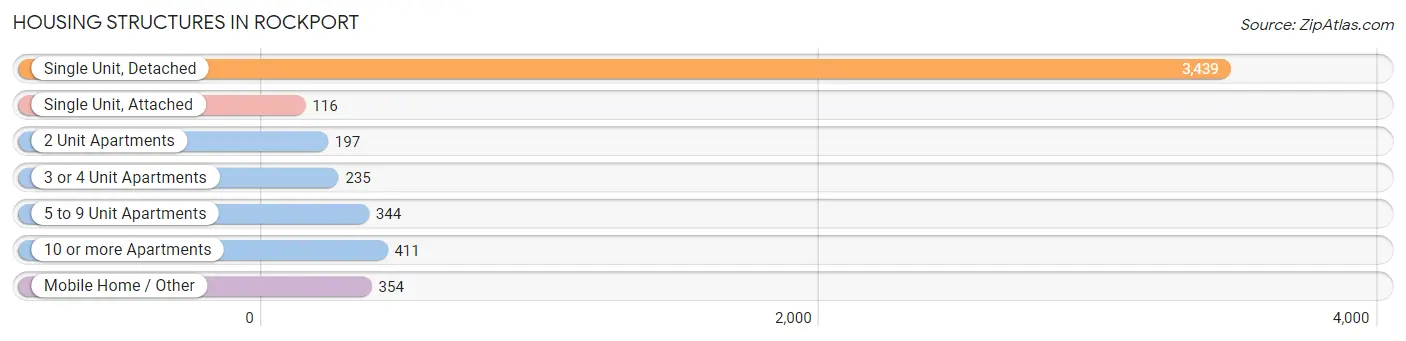
| Structure Type | # Housing Units | % Housing Units |
| Single Unit, Detached | 3,439 | 67.5% |
| Single Unit, Attached | 116 | 2.3% |
| 2 Unit Apartments | 197 | 3.9% |
| 3 or 4 Unit Apartments | 235 | 4.6% |
| 5 to 9 Unit Apartments | 344 | 6.8% |
| 10 or more Apartments | 411 | 8.1% |
| Mobile Home / Other | 354 | 7.0% |
| Total | 5,096 | 100.0% |
Housing Structures by Occupancy in Rockport
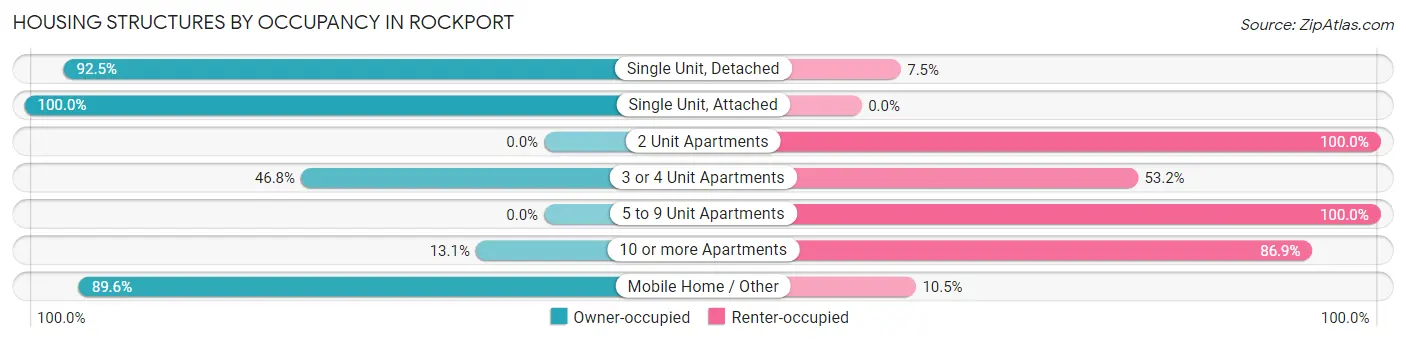
| Structure Type | Owner-occupied | Renter-occupied |
| Single Unit, Detached | 3,180 (92.5%) | 259 (7.5%) |
| Single Unit, Attached | 116 (100.0%) | 0 (0.0%) |
| 2 Unit Apartments | 0 (0.0%) | 197 (100.0%) |
| 3 or 4 Unit Apartments | 110 (46.8%) | 125 (53.2%) |
| 5 to 9 Unit Apartments | 0 (0.0%) | 344 (100.0%) |
| 10 or more Apartments | 54 (13.1%) | 357 (86.9%) |
| Mobile Home / Other | 317 (89.5%) | 37 (10.4%) |
| Total | 3,777 (74.1%) | 1,319 (25.9%) |
Housing Structures by Number of Rooms in Rockport
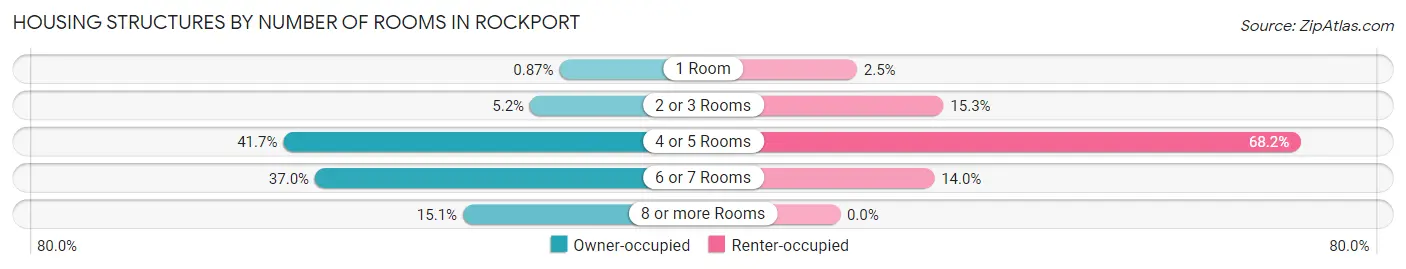
| Number of Rooms | Owner-occupied | Renter-occupied |
| 1 Room | 33 (0.9%) | 33 (2.5%) |
| 2 or 3 Rooms | 197 (5.2%) | 202 (15.3%) |
| 4 or 5 Rooms | 1,576 (41.7%) | 900 (68.2%) |
| 6 or 7 Rooms | 1,399 (37.0%) | 184 (14.0%) |
| 8 or more Rooms | 572 (15.1%) | 0 (0.0%) |
| Total | 3,777 (100.0%) | 1,319 (100.0%) |
Housing Structure by Heating Type in Rockport
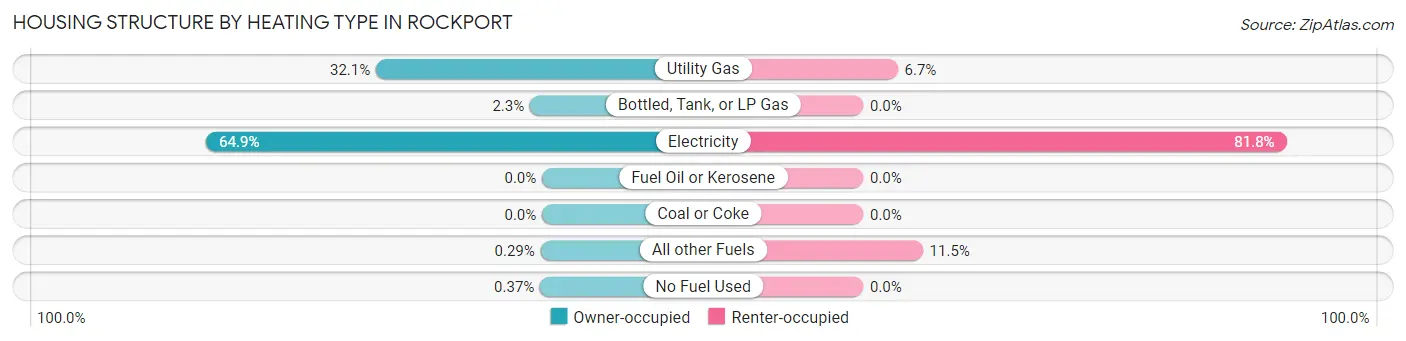
| Heating Type | Owner-occupied | Renter-occupied |
| Utility Gas | 1,212 (32.1%) | 88 (6.7%) |
| Bottled, Tank, or LP Gas | 88 (2.3%) | 0 (0.0%) |
| Electricity | 2,452 (64.9%) | 1,079 (81.8%) |
| Fuel Oil or Kerosene | 0 (0.0%) | 0 (0.0%) |
| Coal or Coke | 0 (0.0%) | 0 (0.0%) |
| All other Fuels | 11 (0.3%) | 152 (11.5%) |
| No Fuel Used | 14 (0.4%) | 0 (0.0%) |
| Total | 3,777 (100.0%) | 1,319 (100.0%) |
Household Vehicle Usage in Rockport
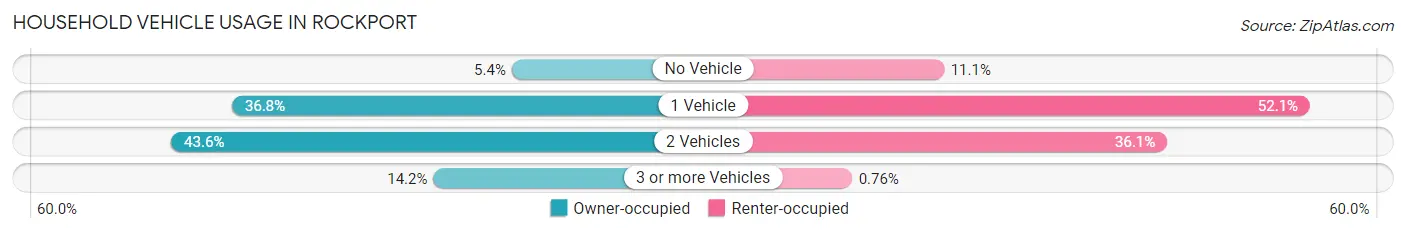
| Vehicles per Household | Owner-occupied | Renter-occupied |
| No Vehicle | 205 (5.4%) | 146 (11.1%) |
| 1 Vehicle | 1,389 (36.8%) | 687 (52.1%) |
| 2 Vehicles | 1,646 (43.6%) | 476 (36.1%) |
| 3 or more Vehicles | 537 (14.2%) | 10 (0.8%) |
| Total | 3,777 (100.0%) | 1,319 (100.0%) |
Real Estate & Mortgages in Rockport
Real Estate and Mortgage Overview in Rockport
| Characteristic | Without Mortgage | With Mortgage |
| Housing Units | 2,340 | 1,437 |
| Median Property Value | $214,200 | $348,700 |
| Median Household Income | $54,919 | $383 |
| Monthly Housing Costs | $641 | $246 |
| Real Estate Taxes | $2,383 | $86 |
Property Value by Mortgage Status in Rockport
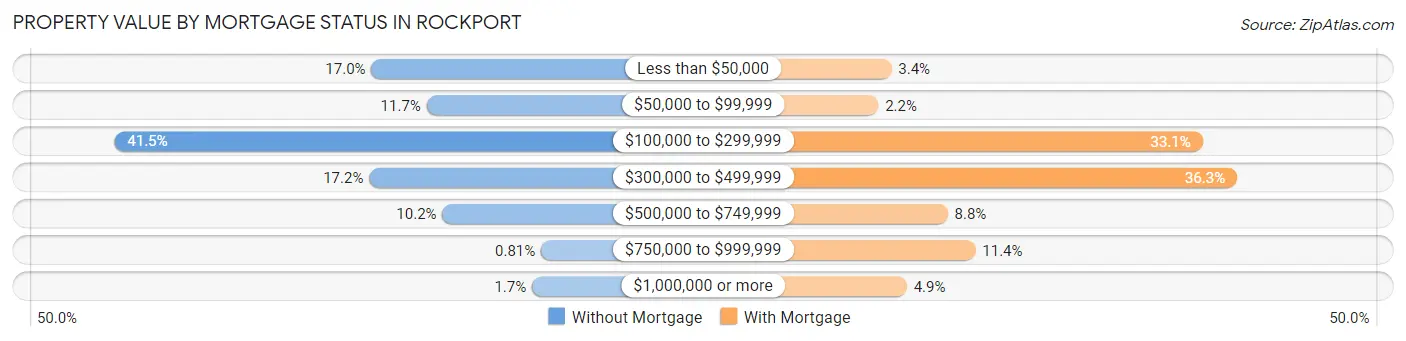
| Property Value | Without Mortgage | With Mortgage |
| Less than $50,000 | 397 (17.0%) | 49 (3.4%) |
| $50,000 to $99,999 | 274 (11.7%) | 31 (2.2%) |
| $100,000 to $299,999 | 970 (41.4%) | 475 (33.1%) |
| $300,000 to $499,999 | 402 (17.2%) | 522 (36.3%) |
| $500,000 to $749,999 | 239 (10.2%) | 126 (8.8%) |
| $750,000 to $999,999 | 19 (0.8%) | 164 (11.4%) |
| $1,000,000 or more | 39 (1.7%) | 70 (4.9%) |
| Total | 2,340 (100.0%) | 1,437 (100.0%) |
Household Income by Mortgage Status in Rockport
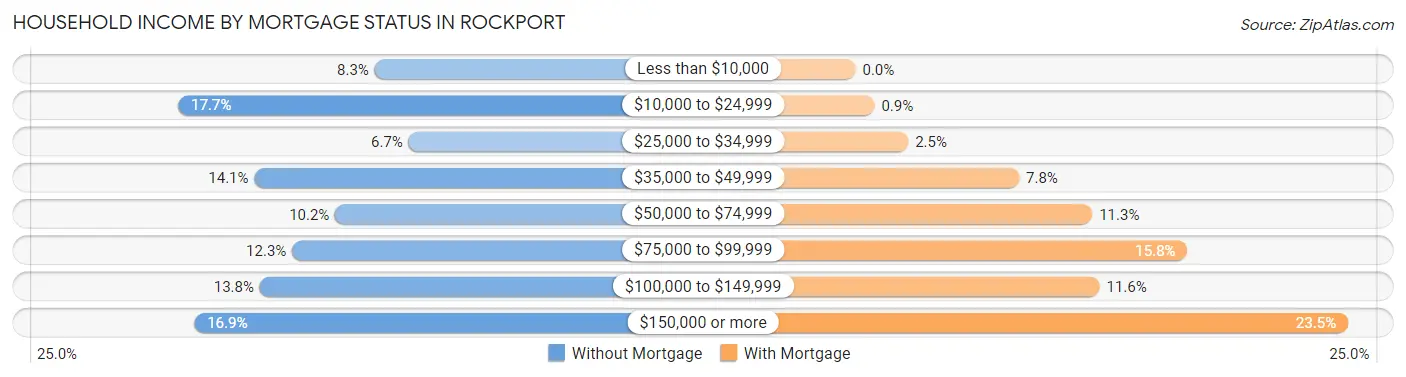
| Household Income | Without Mortgage | With Mortgage |
| Less than $10,000 | 195 (8.3%) | 0 (0.0%) |
| $10,000 to $24,999 | 414 (17.7%) | 13 (0.9%) |
| $25,000 to $34,999 | 157 (6.7%) | 36 (2.5%) |
| $35,000 to $49,999 | 329 (14.1%) | 112 (7.8%) |
| $50,000 to $74,999 | 239 (10.2%) | 162 (11.3%) |
| $75,000 to $99,999 | 287 (12.3%) | 227 (15.8%) |
| $100,000 to $149,999 | 323 (13.8%) | 167 (11.6%) |
| $150,000 or more | 396 (16.9%) | 337 (23.4%) |
| Total | 2,340 (100.0%) | 1,437 (100.0%) |
Property Value to Household Income Ratio in Rockport
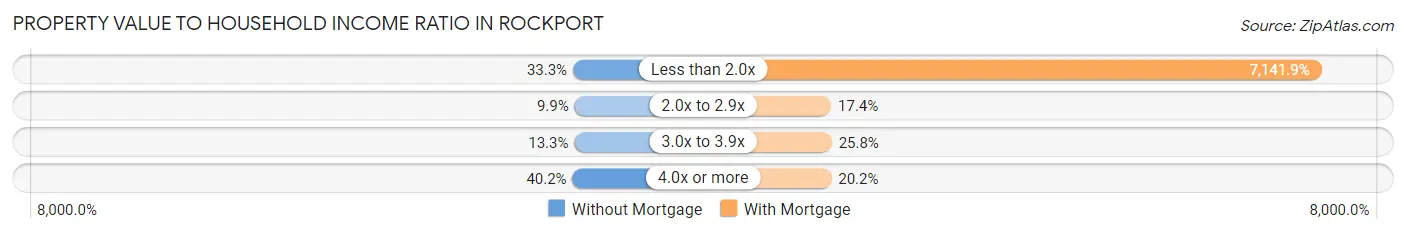
| Value-to-Income Ratio | Without Mortgage | With Mortgage |
| Less than 2.0x | 779 (33.3%) | 102,629 (7,141.9%) |
| 2.0x to 2.9x | 231 (9.9%) | 250 (17.4%) |
| 3.0x to 3.9x | 312 (13.3%) | 371 (25.8%) |
| 4.0x or more | 940 (40.2%) | 290 (20.2%) |
| Total | 2,340 (100.0%) | 1,437 (100.0%) |
Real Estate Taxes by Mortgage Status in Rockport
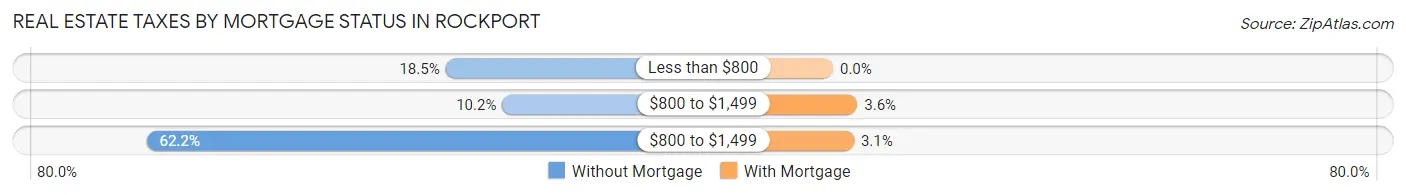
| Property Taxes | Without Mortgage | With Mortgage |
| Less than $800 | 433 (18.5%) | 0 (0.0%) |
| $800 to $1,499 | 239 (10.2%) | 51 (3.5%) |
| $800 to $1,499 | 1,455 (62.2%) | 44 (3.1%) |
| Total | 2,340 (100.0%) | 1,437 (100.0%) |
Health & Disability in Rockport
Health Insurance Coverage by Age in Rockport
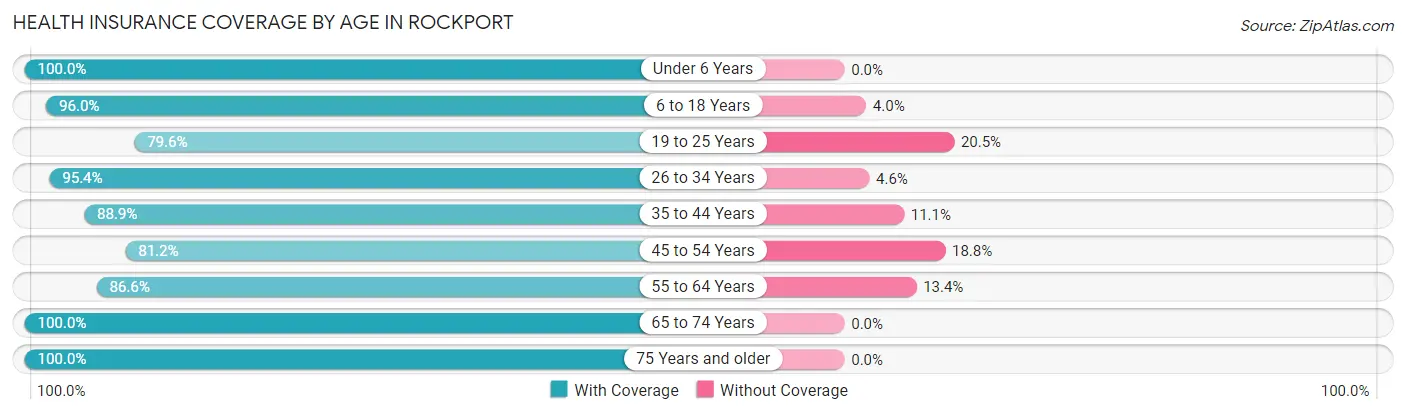
| Age Bracket | With Coverage | Without Coverage |
| Under 6 Years | 507 (100.0%) | 0 (0.0%) |
| 6 to 18 Years | 834 (96.0%) | 35 (4.0%) |
| 19 to 25 Years | 463 (79.5%) | 119 (20.4%) |
| 26 to 34 Years | 1,176 (95.4%) | 57 (4.6%) |
| 35 to 44 Years | 858 (88.9%) | 107 (11.1%) |
| 45 to 54 Years | 830 (81.2%) | 192 (18.8%) |
| 55 to 64 Years | 1,446 (86.6%) | 224 (13.4%) |
| 65 to 74 Years | 1,902 (100.0%) | 0 (0.0%) |
| 75 Years and older | 1,230 (100.0%) | 0 (0.0%) |
| Total | 9,246 (92.6%) | 734 (7.3%) |
Health Insurance Coverage by Citizenship Status in Rockport
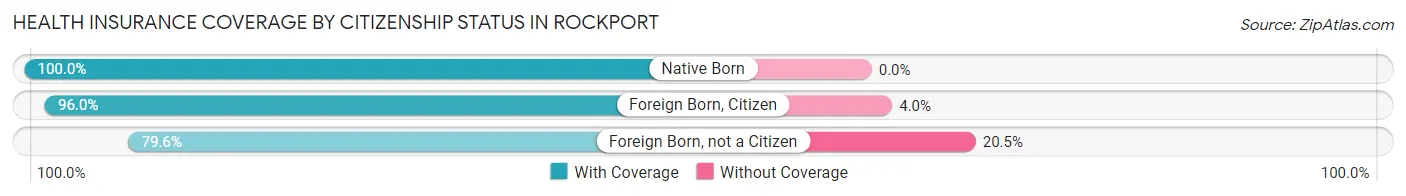
| Citizenship Status | With Coverage | Without Coverage |
| Native Born | 507 (100.0%) | 0 (0.0%) |
| Foreign Born, Citizen | 834 (96.0%) | 35 (4.0%) |
| Foreign Born, not a Citizen | 463 (79.5%) | 119 (20.4%) |
Health Insurance Coverage by Household Income in Rockport
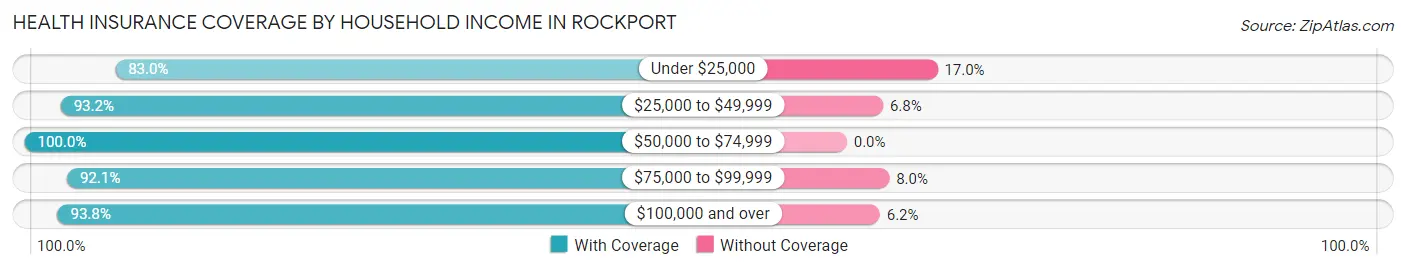
| Household Income | With Coverage | Without Coverage |
| Under $25,000 | 1,100 (83.0%) | 225 (17.0%) |
| $25,000 to $49,999 | 2,012 (93.2%) | 146 (6.8%) |
| $50,000 to $74,999 | 1,092 (100.0%) | 0 (0.0%) |
| $75,000 to $99,999 | 1,505 (92.0%) | 130 (8.0%) |
| $100,000 and over | 3,536 (93.8%) | 233 (6.2%) |
Public vs Private Health Insurance Coverage by Age in Rockport
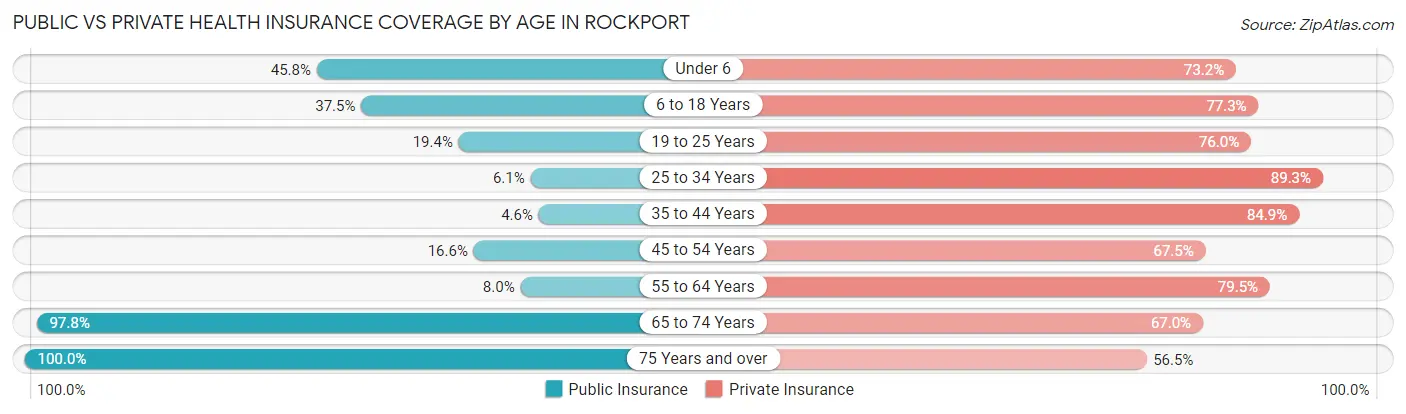
| Age Bracket | Public Insurance | Private Insurance |
| Under 6 | 232 (45.8%) | 371 (73.2%) |
| 6 to 18 Years | 326 (37.5%) | 672 (77.3%) |
| 19 to 25 Years | 113 (19.4%) | 442 (75.9%) |
| 25 to 34 Years | 75 (6.1%) | 1,101 (89.3%) |
| 35 to 44 Years | 44 (4.6%) | 819 (84.9%) |
| 45 to 54 Years | 170 (16.6%) | 690 (67.5%) |
| 55 to 64 Years | 133 (8.0%) | 1,327 (79.5%) |
| 65 to 74 Years | 1,860 (97.8%) | 1,275 (67.0%) |
| 75 Years and over | 1,230 (100.0%) | 695 (56.5%) |
| Total | 4,183 (41.9%) | 7,392 (74.1%) |
Disability Status by Sex by Age in Rockport
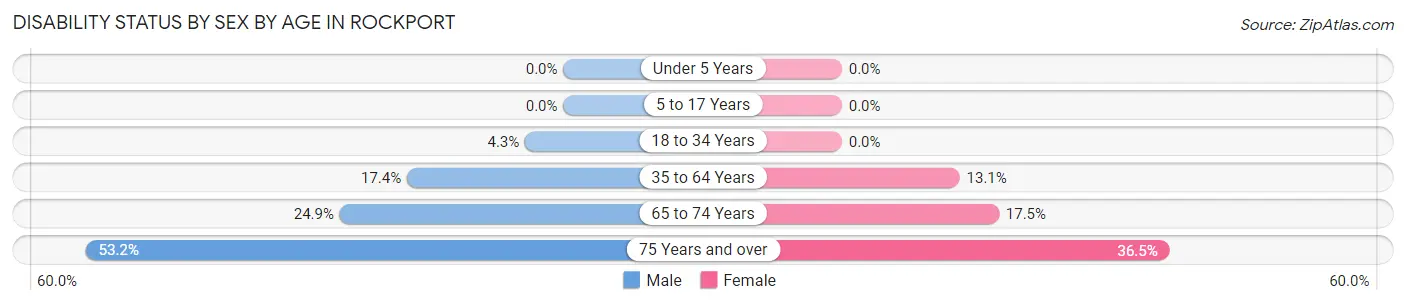
| Age Bracket | Male | Female |
| Under 5 Years | 0 (0.0%) | 0 (0.0%) |
| 5 to 17 Years | 0 (0.0%) | 0 (0.0%) |
| 18 to 34 Years | 37 (4.3%) | 0 (0.0%) |
| 35 to 64 Years | 289 (17.4%) | 262 (13.1%) |
| 65 to 74 Years | 243 (24.9%) | 162 (17.5%) |
| 75 Years and over | 274 (53.2%) | 261 (36.5%) |
Disability Class by Sex by Age in Rockport
Disability Class: Hearing Difficulty
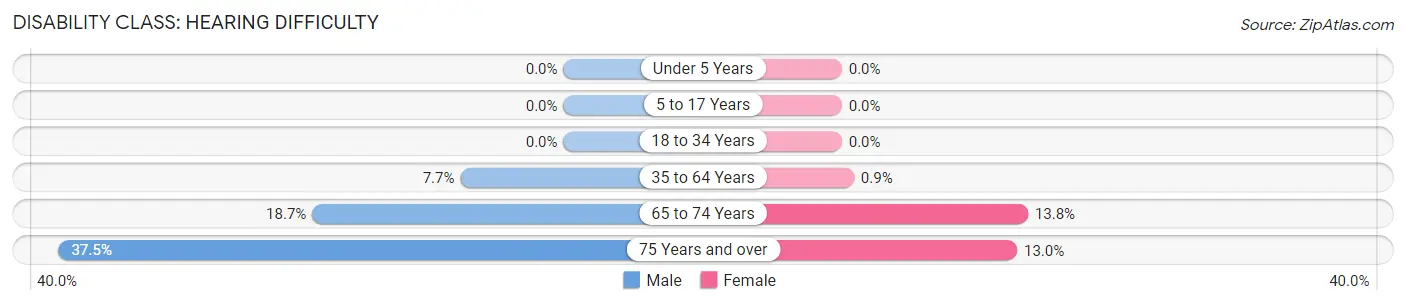
| Age Bracket | Male | Female |
| Under 5 Years | 0 (0.0%) | 0 (0.0%) |
| 5 to 17 Years | 0 (0.0%) | 0 (0.0%) |
| 18 to 34 Years | 0 (0.0%) | 0 (0.0%) |
| 35 to 64 Years | 127 (7.6%) | 18 (0.9%) |
| 65 to 74 Years | 182 (18.6%) | 128 (13.8%) |
| 75 Years and over | 193 (37.5%) | 93 (13.0%) |
Disability Class: Vision Difficulty
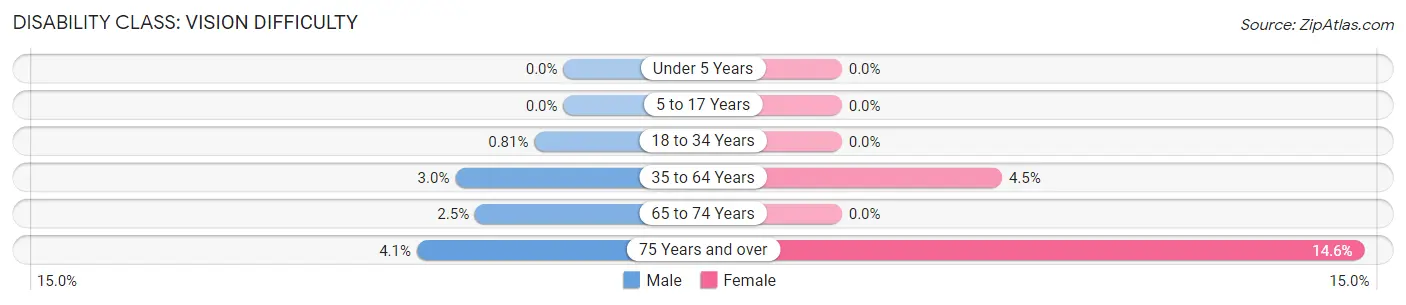
| Age Bracket | Male | Female |
| Under 5 Years | 0 (0.0%) | 0 (0.0%) |
| 5 to 17 Years | 0 (0.0%) | 0 (0.0%) |
| 18 to 34 Years | 7 (0.8%) | 0 (0.0%) |
| 35 to 64 Years | 50 (3.0%) | 89 (4.5%) |
| 65 to 74 Years | 24 (2.5%) | 0 (0.0%) |
| 75 Years and over | 21 (4.1%) | 104 (14.5%) |
Disability Class: Cognitive Difficulty
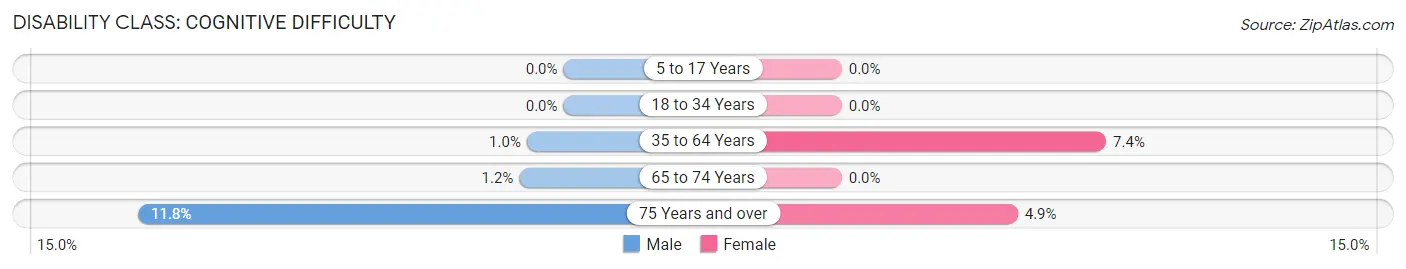
| Age Bracket | Male | Female |
| 5 to 17 Years | 0 (0.0%) | 0 (0.0%) |
| 18 to 34 Years | 0 (0.0%) | 0 (0.0%) |
| 35 to 64 Years | 17 (1.0%) | 147 (7.4%) |
| 65 to 74 Years | 12 (1.2%) | 0 (0.0%) |
| 75 Years and over | 61 (11.8%) | 35 (4.9%) |
Disability Class: Ambulatory Difficulty
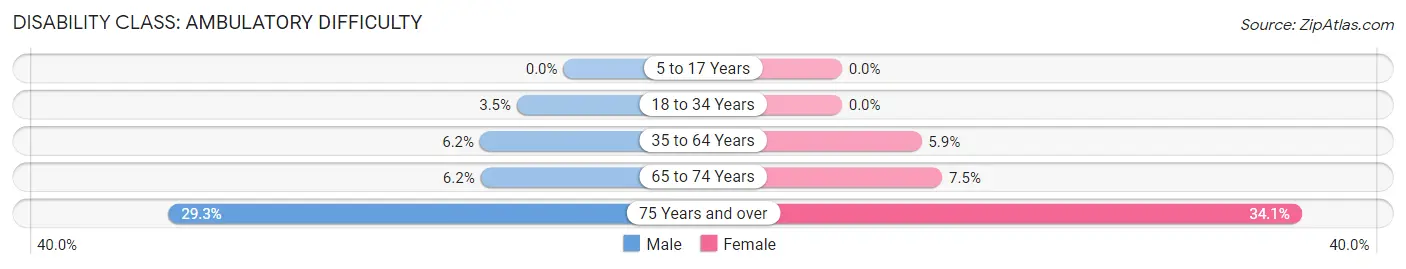
| Age Bracket | Male | Female |
| 5 to 17 Years | 0 (0.0%) | 0 (0.0%) |
| 18 to 34 Years | 30 (3.5%) | 0 (0.0%) |
| 35 to 64 Years | 103 (6.2%) | 118 (5.9%) |
| 65 to 74 Years | 60 (6.1%) | 69 (7.4%) |
| 75 Years and over | 151 (29.3%) | 244 (34.1%) |
Disability Class: Self-Care Difficulty
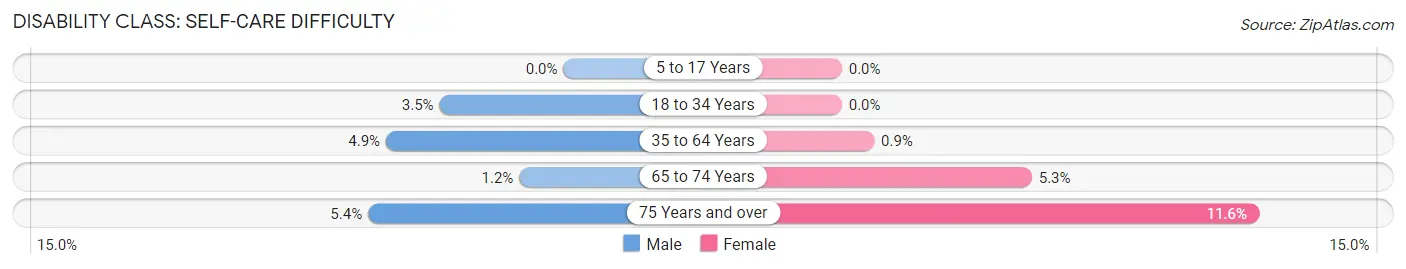
| Age Bracket | Male | Female |
| 5 to 17 Years | 0 (0.0%) | 0 (0.0%) |
| 18 to 34 Years | 30 (3.5%) | 0 (0.0%) |
| 35 to 64 Years | 82 (4.9%) | 18 (0.9%) |
| 65 to 74 Years | 12 (1.2%) | 49 (5.3%) |
| 75 Years and over | 28 (5.4%) | 83 (11.6%) |
Technology Access in Rockport
Computing Device Access in Rockport
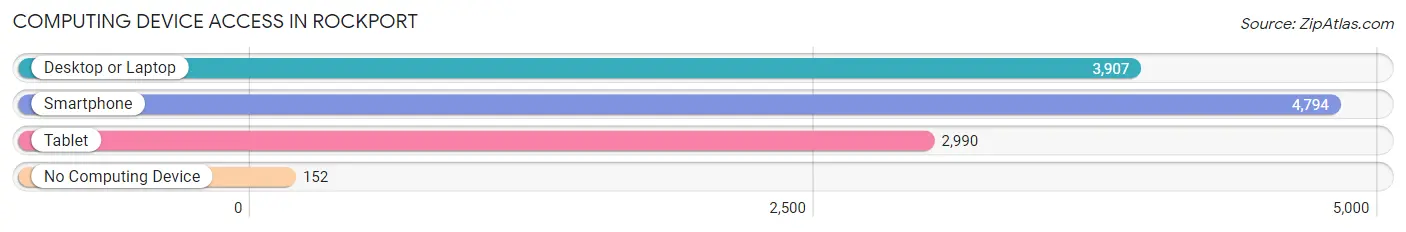
| Device Type | # Households | % Households |
| Desktop or Laptop | 3,907 | 76.7% |
| Smartphone | 4,794 | 94.1% |
| Tablet | 2,990 | 58.7% |
| No Computing Device | 152 | 3.0% |
| Total | 5,096 | 100.0% |
Internet Access in Rockport
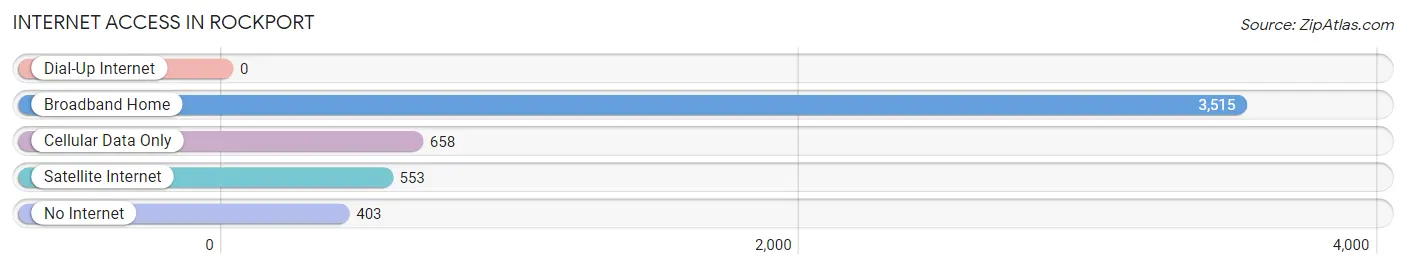
| Internet Type | # Households | % Households |
| Dial-Up Internet | 0 | 0.0% |
| Broadband Home | 3,515 | 69.0% |
| Cellular Data Only | 658 | 12.9% |
| Satellite Internet | 553 | 10.8% |
| No Internet | 403 | 7.9% |
| Total | 5,096 | 100.0% |
Rockport Summary
Rockport, Texas is a small coastal town located in Aransas County, Texas. It is situated on the Aransas Bay, just north of Corpus Christi. The town has a population of approximately 8,000 people and is a popular tourist destination due to its proximity to the Gulf of Mexico.
History
Rockport was founded in 1867 by a group of settlers from the nearby town of Refugio. The town was originally named “Rockport” due to the abundance of rocks in the area. The town was officially incorporated in 1871 and quickly became a popular port for shipping and fishing. In the late 19th century, the town was a major hub for the cattle industry, with many of the local ranches shipping their cattle to the port.
In the early 20th century, Rockport began to develop as a tourist destination. The town was home to several resorts and hotels, as well as a number of fishing charters. The town also became a popular destination for birdwatchers, as the area is home to a variety of species.
Geography
Rockport is located on the Aransas Bay, just north of Corpus Christi. The town is situated on a peninsula, with the Gulf of Mexico to the east and the Aransas Bay to the west. The town is surrounded by a number of small islands, including St. Joseph Island, Mustang Island, and Matagorda Island. The town is also home to a number of parks and nature preserves, including Goose Island State Park and Aransas National Wildlife Refuge.
Economy
Rockport’s economy is largely based on tourism and fishing. The town is home to a number of resorts and hotels, as well as a number of fishing charters. The town is also home to a number of restaurants, bars, and shops. The town is also home to a number of art galleries and museums, as well as a number of historic sites.
Demographics
As of the 2010 census, Rockport had a population of 8,766 people. The town is predominantly white, with approximately 79% of the population identifying as such. The town is also home to a number of Hispanic and Latino residents, with approximately 17% of the population identifying as such. The town is also home to a number of African American residents, with approximately 3% of the population identifying as such. The median household income in Rockport is approximately $41,000, and the median home value is approximately $150,000.
Common Questions
What is Per Capita Income in Rockport?
Per Capita income in Rockport is $48,395.
What is the Median Family Income in Rockport?
Median Family Income in Rockport is $84,737.
What is the Median Household income in Rockport?
Median Household Income in Rockport is $62,394.
What is Income or Wage Gap in Rockport?
Income or Wage Gap in Rockport is 25.7%.
Women in Rockport earn 74.3 cents for every dollar earned by a man.
What is Inequality or Gini Index in Rockport?
Inequality or Gini Index in Rockport is 0.53.
What is the Total Population of Rockport?
Total Population of Rockport is 10,265.
What is the Total Male Population of Rockport?
Total Male Population of Rockport is 5,107.
What is the Total Female Population of Rockport?
Total Female Population of Rockport is 5,158.
What is the Ratio of Males per 100 Females in Rockport?
There are 99.01 Males per 100 Females in Rockport.
What is the Ratio of Females per 100 Males in Rockport?
There are 101.00 Females per 100 Males in Rockport.
What is the Median Population Age in Rockport?
Median Population Age in Rockport is 54.6 Years.
What is the Average Family Size in Rockport
Average Family Size in Rockport is 2.4 People.
What is the Average Household Size in Rockport
Average Household Size in Rockport is 2.0 People.
How Large is the Labor Force in Rockport?
There are 4,508 People in the Labor Forcein in Rockport.
What is the Percentage of People in the Labor Force in Rockport?
49.6% of People are in the Labor Force in Rockport.
What is the Unemployment Rate in Rockport?
Unemployment Rate in Rockport is 5.0%.