Rockdale, TX Map & Demographics
Rockdale Map
Rockdale Overview
$37,086
PER CAPITA INCOME
$83,984
AVG FAMILY INCOME
$39,911
AVG HOUSEHOLD INCOME
24.5%
WAGE / INCOME GAP [ % ]
75.5¢/ $1
WAGE / INCOME GAP [ $ ]
$13,138
FAMILY INCOME DEFICIT
0.58
INEQUALITY / GINI INDEX
5,424
TOTAL POPULATION
2,574
MALE POPULATION
2,850
FEMALE POPULATION
90.32
MALES / 100 FEMALES
110.72
FEMALES / 100 MALES
40.1
MEDIAN AGE
3.5
AVG FAMILY SIZE
2.4
AVG HOUSEHOLD SIZE
2,752
LABOR FORCE [ PEOPLE ]
62.1%
PERCENT IN LABOR FORCE
4.6%
UNEMPLOYMENT RATE
Rockdale Zip Codes
Rockdale Area Codes
Income in Rockdale
Income Overview in Rockdale
Per Capita Income in Rockdale is $37,086, while median incomes of families and households are $83,984 and $39,911 respectively.
| Characteristic | Number | Measure |
| Per Capita Income | 5,424 | $37,086 |
| Median Family Income | 1,121 | $83,984 |
| Mean Family Income | 1,121 | $137,155 |
| Median Household Income | 2,198 | $39,911 |
| Mean Household Income | 2,198 | $89,740 |
| Income Deficit | 1,121 | $13,138 |
| Wage / Income Gap (%) | 5,424 | 24.53% |
| Wage / Income Gap ($) | 5,424 | 75.47¢ per $1 |
| Gini / Inequality Index | 5,424 | 0.58 |
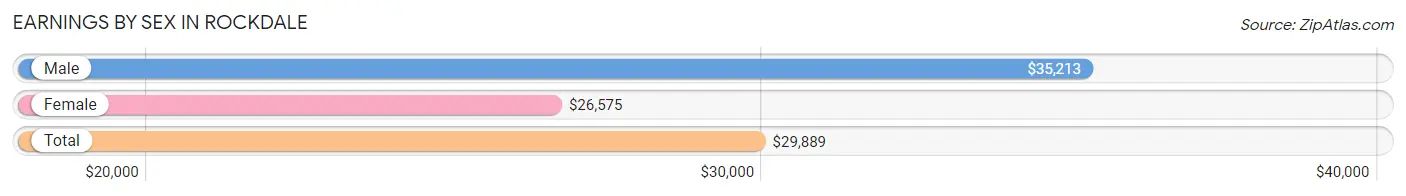
Earnings by Sex in Rockdale
Average Earnings in Rockdale are $29,889, $35,213 for men and $26,575 for women, a difference of 24.5%.
| Sex | Number | Average Earnings |
| Male | 1,397 (48.7%) | $35,213 |
| Female | 1,471 (51.3%) | $26,575 |
| Total | 2,868 (100.0%) | $29,889 |
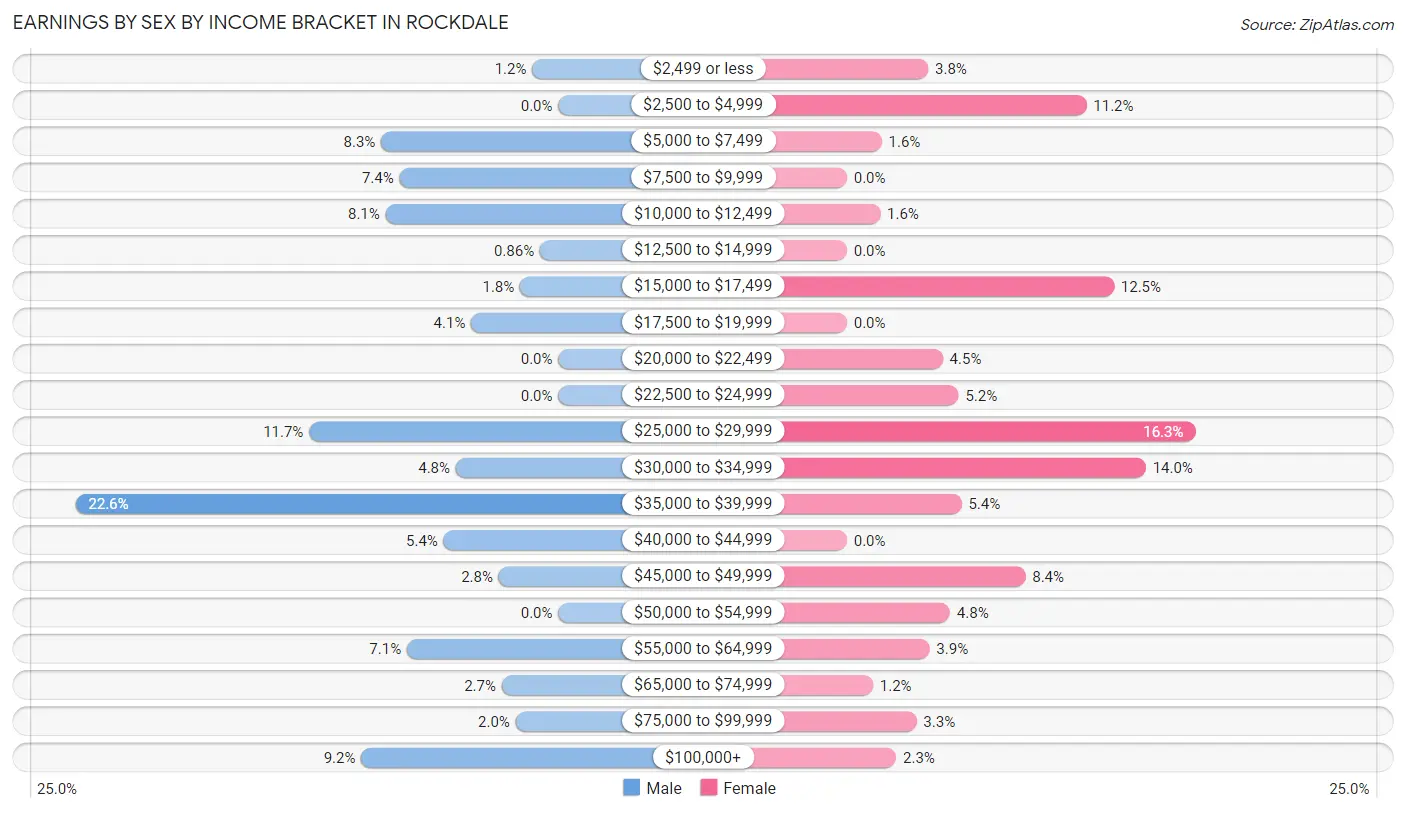
Earnings by Sex by Income Bracket in Rockdale
The most common earnings brackets in Rockdale are $35,000 to $39,999 for men (316 | 22.6%) and $25,000 to $29,999 for women (240 | 16.3%).
| Income | Male | Female |
| $2,499 or less | 17 (1.2%) | 56 (3.8%) |
| $2,500 to $4,999 | 0 (0.0%) | 165 (11.2%) |
| $5,000 to $7,499 | 116 (8.3%) | 24 (1.6%) |
| $7,500 to $9,999 | 104 (7.4%) | 0 (0.0%) |
| $10,000 to $12,499 | 113 (8.1%) | 23 (1.6%) |
| $12,500 to $14,999 | 12 (0.9%) | 0 (0.0%) |
| $15,000 to $17,499 | 25 (1.8%) | 184 (12.5%) |
| $17,500 to $19,999 | 57 (4.1%) | 0 (0.0%) |
| $20,000 to $22,499 | 0 (0.0%) | 66 (4.5%) |
| $22,500 to $24,999 | 0 (0.0%) | 77 (5.2%) |
| $25,000 to $29,999 | 163 (11.7%) | 240 (16.3%) |
| $30,000 to $34,999 | 67 (4.8%) | 206 (14.0%) |
| $35,000 to $39,999 | 316 (22.6%) | 79 (5.4%) |
| $40,000 to $44,999 | 75 (5.4%) | 0 (0.0%) |
| $45,000 to $49,999 | 39 (2.8%) | 123 (8.4%) |
| $50,000 to $54,999 | 0 (0.0%) | 71 (4.8%) |
| $55,000 to $64,999 | 99 (7.1%) | 57 (3.9%) |
| $65,000 to $74,999 | 37 (2.6%) | 18 (1.2%) |
| $75,000 to $99,999 | 28 (2.0%) | 48 (3.3%) |
| $100,000+ | 129 (9.2%) | 34 (2.3%) |
| Total | 1,397 (100.0%) | 1,471 (100.0%) |
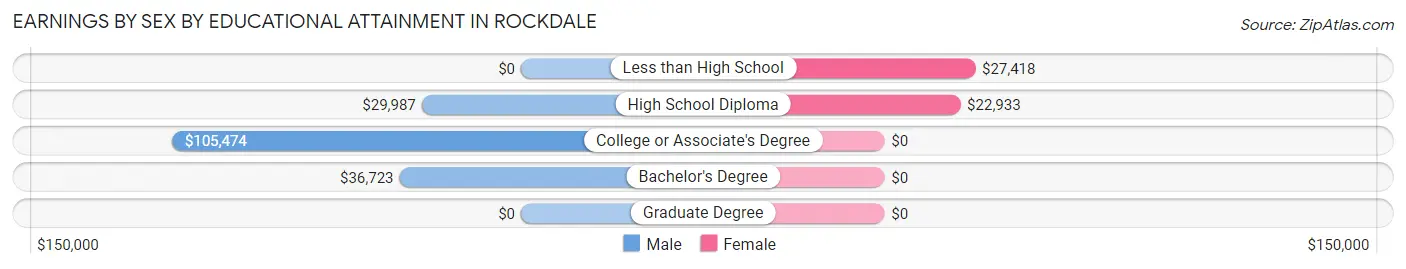
Earnings by Sex by Educational Attainment in Rockdale
Average earnings in Rockdale are $36,306 for men and $30,492 for women, a difference of 16.0%. Men with an educational attainment of college or associate's degree enjoy the highest average annual earnings of $105,474, while those with high school diploma education earn the least with $29,987. Women with an educational attainment of less than high school earn the most with the average annual earnings of $27,418, while those with high school diploma education have the smallest earnings of $22,933.
| Educational Attainment | Male Income | Female Income |
| Less than High School | - | - |
| High School Diploma | $29,987 | $22,933 |
| College or Associate's Degree | $105,474 | $0 |
| Bachelor's Degree | $36,723 | $0 |
| Graduate Degree | - | - |
| Total | $36,306 | $30,492 |
Family Income in Rockdale
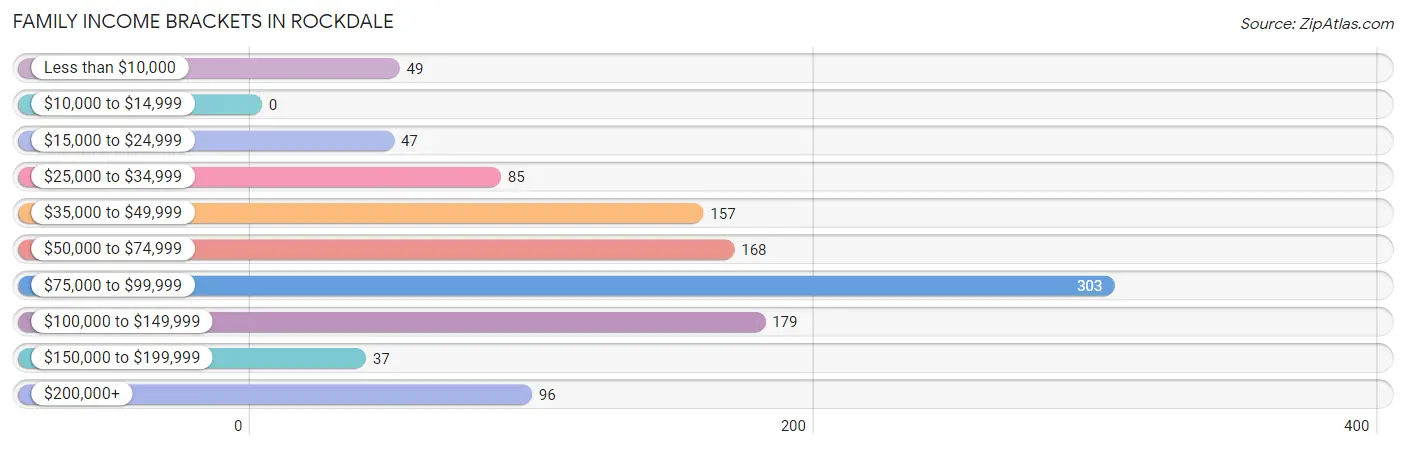
Family Income Brackets in Rockdale
According to the Rockdale family income data, there are 303 families falling into the $75,000 to $99,999 income range, which is the most common income bracket and makes up 27.0% of all families.
| Income Bracket | # Families | % Families |
| Less than $10,000 | 49 | 4.4% |
| $10,000 to $14,999 | 0 | 0.0% |
| $15,000 to $24,999 | 47 | 4.2% |
| $25,000 to $34,999 | 85 | 7.6% |
| $35,000 to $49,999 | 157 | 14.0% |
| $50,000 to $74,999 | 168 | 15.0% |
| $75,000 to $99,999 | 303 | 27.0% |
| $100,000 to $149,999 | 179 | 16.0% |
| $150,000 to $199,999 | 37 | 3.3% |
| $200,000+ | 96 | 8.6% |
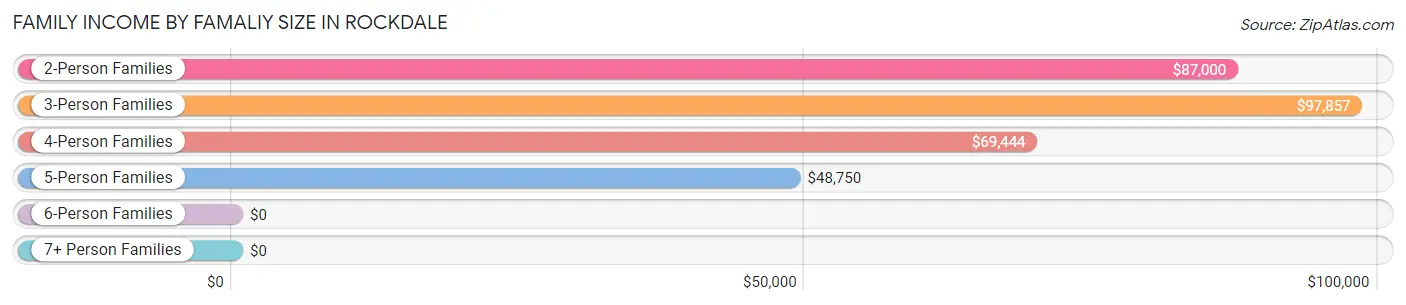
Family Income by Famaliy Size in Rockdale
3-person families (116 | 10.3%) account for the highest median family income in Rockdale with $97,857 per family, while 2-person families (548 | 48.9%) have the highest median income of $43,500 per family member.
| Income Bracket | # Families | Median Income |
| 2-Person Families | 548 (48.9%) | $87,000 |
| 3-Person Families | 116 (10.3%) | $97,857 |
| 4-Person Families | 160 (14.3%) | $69,444 |
| 5-Person Families | 171 (15.2%) | $48,750 |
| 6-Person Families | 126 (11.2%) | $0 |
| 7+ Person Families | 0 (0.0%) | $0 |
| Total | 1,121 (100.0%) | $83,984 |
Family Income by Number of Earners in Rockdale

| Number of Earners | # Families | Median Income |
| No Earners | 156 (13.9%) | $0 |
| 1 Earner | 368 (32.8%) | $65,307 |
| 2 Earners | 478 (42.6%) | $105,481 |
| 3+ Earners | 119 (10.6%) | $0 |
| Total | 1,121 (100.0%) | $83,984 |
Household Income in Rockdale
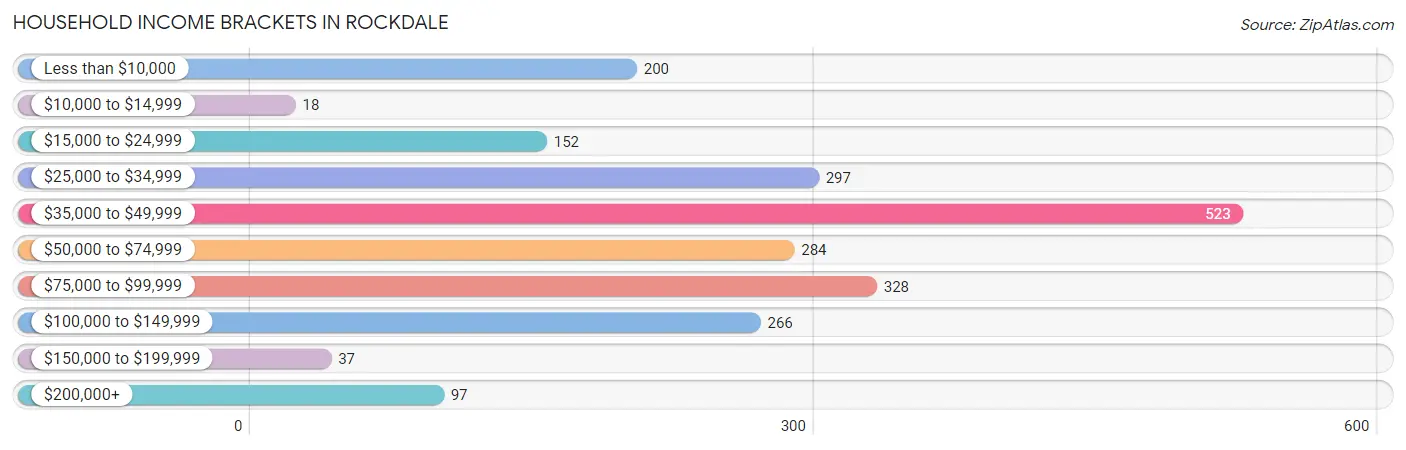
Household Income Brackets in Rockdale
With 523 households falling in the category, the $35,000 to $49,999 income range is the most frequent in Rockdale, accounting for 23.8% of all households. In contrast, only 18 households (0.8%) fall into the $10,000 to $14,999 income bracket, making it the least populous group.
| Income Bracket | # Households | % Households |
| Less than $10,000 | 200 | 9.1% |
| $10,000 to $14,999 | 18 | 0.8% |
| $15,000 to $24,999 | 152 | 6.9% |
| $25,000 to $34,999 | 297 | 13.5% |
| $35,000 to $49,999 | 523 | 23.8% |
| $50,000 to $74,999 | 284 | 12.9% |
| $75,000 to $99,999 | 328 | 14.9% |
| $100,000 to $149,999 | 266 | 12.1% |
| $150,000 to $199,999 | 37 | 1.7% |
| $200,000+ | 97 | 4.4% |
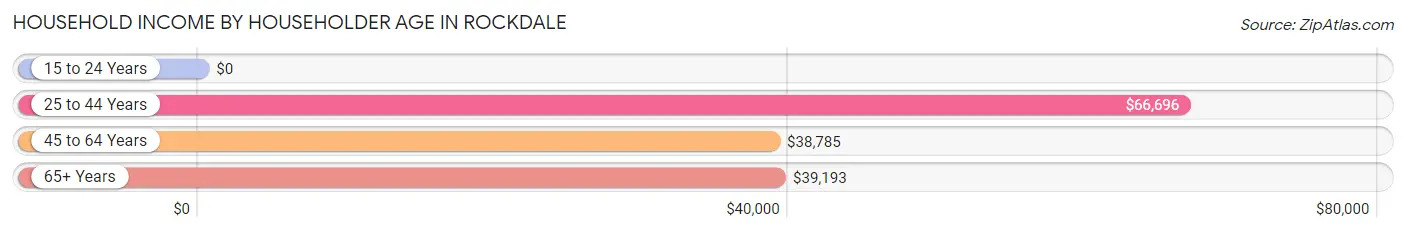
Household Income by Householder Age in Rockdale
The median household income in Rockdale is $39,911, with the highest median household income of $66,696 found in the 25 to 44 years age bracket for the primary householder. A total of 618 households (28.1%) fall into this category. Meanwhile, the 15 to 24 years age bracket for the primary householder has the lowest median household income of $0, with 112 households (5.1%) in this group.
| Income Bracket | # Households | Median Income |
| 15 to 24 Years | 112 (5.1%) | $0 |
| 25 to 44 Years | 618 (28.1%) | $66,696 |
| 45 to 64 Years | 918 (41.8%) | $38,785 |
| 65+ Years | 550 (25.0%) | $39,193 |
| Total | 2,198 (100.0%) | $39,911 |
Poverty in Rockdale
Income Below Poverty by Sex and Age in Rockdale
With 16.9% poverty level for males and 11.2% for females among the residents of Rockdale, 12 to 14 year old males and 65 to 74 year old females are the most vulnerable to poverty, with 108 males (71.5%) and 123 females (39.6%) in their respective age groups living below the poverty level.
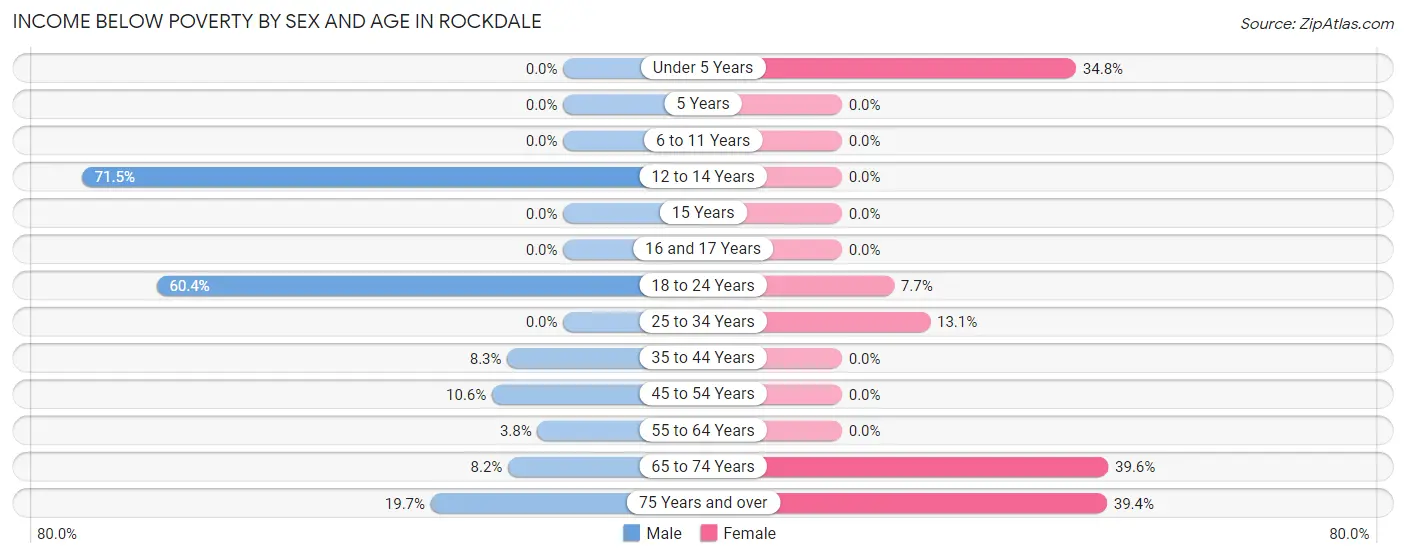
| Age Bracket | Male | Female |
| Under 5 Years | 0 (0.0%) | 57 (34.8%) |
| 5 Years | 0 (0.0%) | 0 (0.0%) |
| 6 to 11 Years | 0 (0.0%) | 0 (0.0%) |
| 12 to 14 Years | 108 (71.5%) | 0 (0.0%) |
| 15 Years | 0 (0.0%) | 0 (0.0%) |
| 16 and 17 Years | 0 (0.0%) | 0 (0.0%) |
| 18 to 24 Years | 171 (60.4%) | 25 (7.7%) |
| 25 to 34 Years | 0 (0.0%) | 44 (13.1%) |
| 35 to 44 Years | 27 (8.3%) | 0 (0.0%) |
| 45 to 54 Years | 49 (10.6%) | 0 (0.0%) |
| 55 to 64 Years | 13 (3.8%) | 0 (0.0%) |
| 65 to 74 Years | 23 (8.2%) | 123 (39.6%) |
| 75 Years and over | 36 (19.7%) | 61 (39.4%) |
| Total | 427 (16.9%) | 310 (11.2%) |
Income Above Poverty by Sex and Age in Rockdale
According to the poverty statistics in Rockdale, males aged under 5 years and females aged 5 years are the age groups that are most secure financially, with 100.0% of males and 100.0% of females in these age groups living above the poverty line.
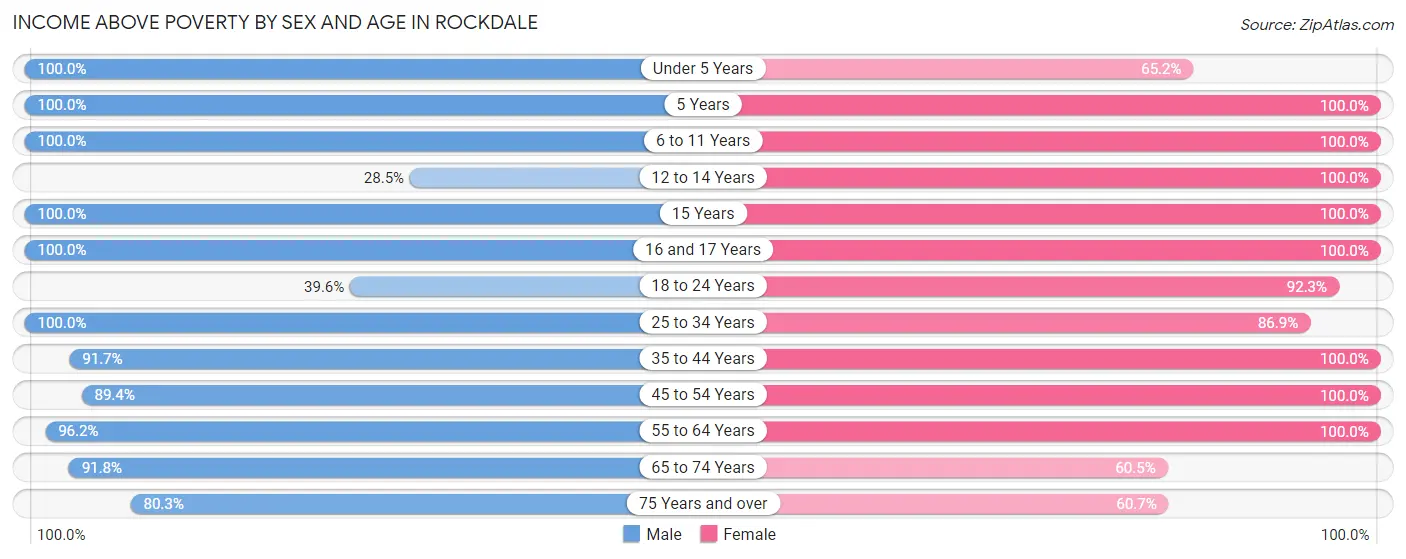
| Age Bracket | Male | Female |
| Under 5 Years | 81 (100.0%) | 107 (65.2%) |
| 5 Years | 30 (100.0%) | 37 (100.0%) |
| 6 to 11 Years | 132 (100.0%) | 239 (100.0%) |
| 12 to 14 Years | 43 (28.5%) | 36 (100.0%) |
| 15 Years | 73 (100.0%) | 49 (100.0%) |
| 16 and 17 Years | 17 (100.0%) | 185 (100.0%) |
| 18 to 24 Years | 112 (39.6%) | 298 (92.3%) |
| 25 to 34 Years | 168 (100.0%) | 292 (86.9%) |
| 35 to 44 Years | 298 (91.7%) | 327 (100.0%) |
| 45 to 54 Years | 414 (89.4%) | 330 (100.0%) |
| 55 to 64 Years | 326 (96.2%) | 269 (100.0%) |
| 65 to 74 Years | 258 (91.8%) | 188 (60.5%) |
| 75 Years and over | 147 (80.3%) | 94 (60.7%) |
| Total | 2,099 (83.1%) | 2,451 (88.8%) |
Income Below Poverty Among Married-Couple Families in Rockdale
The poverty statistics for married-couple families in Rockdale show that 10.7% or 96 of the total 898 families live below the poverty line. Families with 3 or 4 children have the highest poverty rate of 36.8%, comprising of 49 families. On the other hand, families with 1 or 2 children have the lowest poverty rate of 0.0%, which includes 0 families.
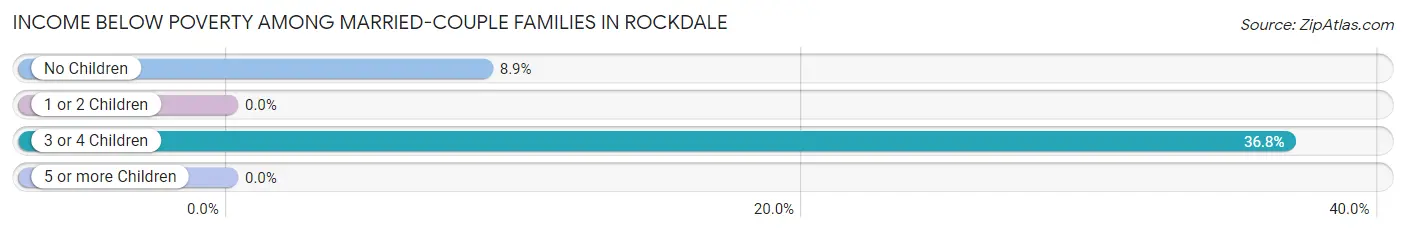
| Children | Above Poverty | Below Poverty |
| No Children | 483 (91.1%) | 47 (8.9%) |
| 1 or 2 Children | 235 (100.0%) | 0 (0.0%) |
| 3 or 4 Children | 84 (63.2%) | 49 (36.8%) |
| 5 or more Children | 0 (0.0%) | 0 (0.0%) |
| Total | 802 (89.3%) | 96 (10.7%) |
Income Below Poverty Among Single-Parent Households in Rockdale
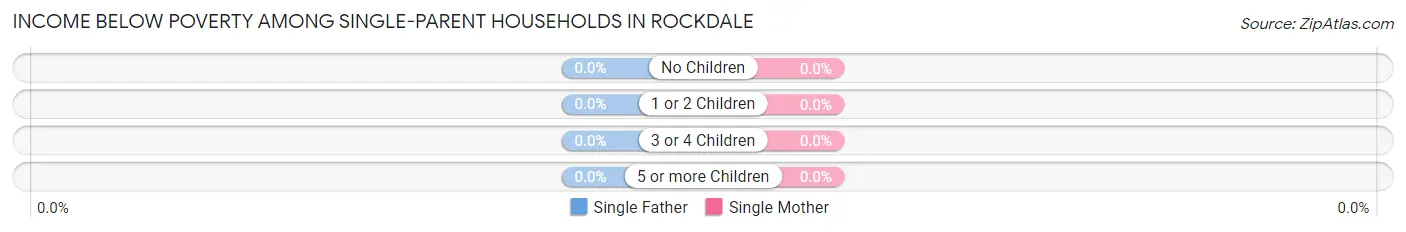
| Children | Single Father | Single Mother |
| No Children | 0 (0.0%) | 0 (0.0%) |
| 1 or 2 Children | 0 (0.0%) | 0 (0.0%) |
| 3 or 4 Children | 0 (0.0%) | 0 (0.0%) |
| 5 or more Children | 0 (0.0%) | 0 (0.0%) |
| Total | 0 (0.0%) | 0 (0.0%) |
Income Below Poverty Among Married-Couple vs Single-Parent Households in Rockdale
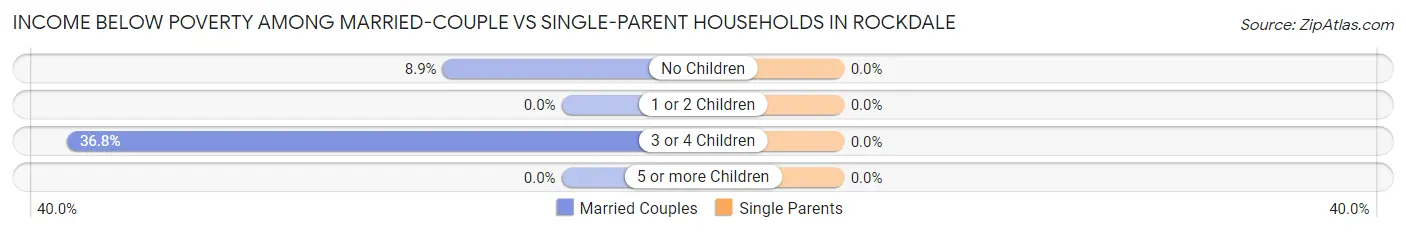
| Children | Married-Couple Families | Single-Parent Households |
| No Children | 47 (8.9%) | 0 (0.0%) |
| 1 or 2 Children | 0 (0.0%) | 0 (0.0%) |
| 3 or 4 Children | 49 (36.8%) | 0 (0.0%) |
| 5 or more Children | 0 (0.0%) | 0 (0.0%) |
| Total | 96 (10.7%) | 0 (0.0%) |
Race in Rockdale
The most populous races in Rockdale are White / Caucasian (4,272 | 78.8%), Hispanic or Latino (2,016 | 37.2%), and Black / African American (497 | 9.2%).
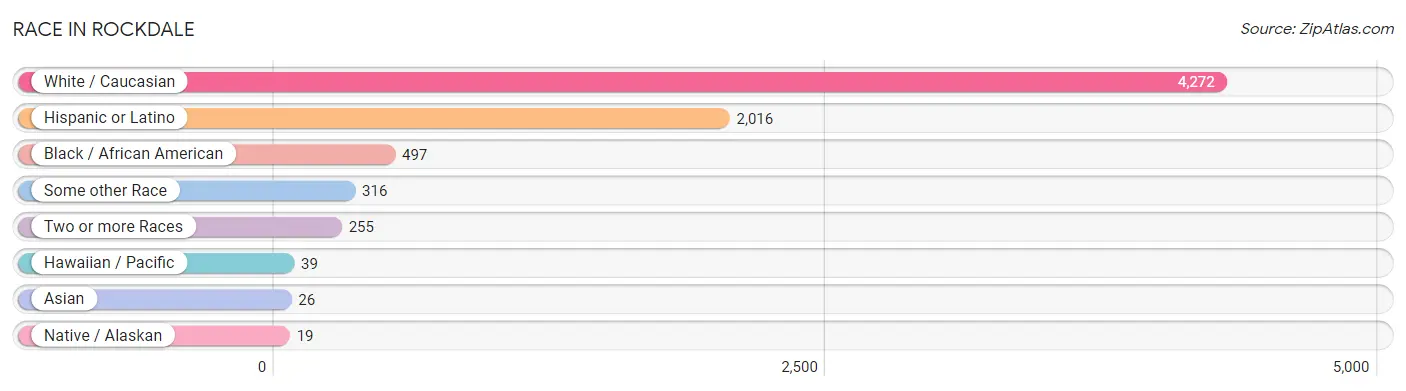
| Race | # Population | % Population |
| Asian | 26 | 0.5% |
| Black / African American | 497 | 9.2% |
| Hawaiian / Pacific | 39 | 0.7% |
| Hispanic or Latino | 2,016 | 37.2% |
| Native / Alaskan | 19 | 0.4% |
| White / Caucasian | 4,272 | 78.8% |
| Two or more Races | 255 | 4.7% |
| Some other Race | 316 | 5.8% |
| Total | 5,424 | 100.0% |
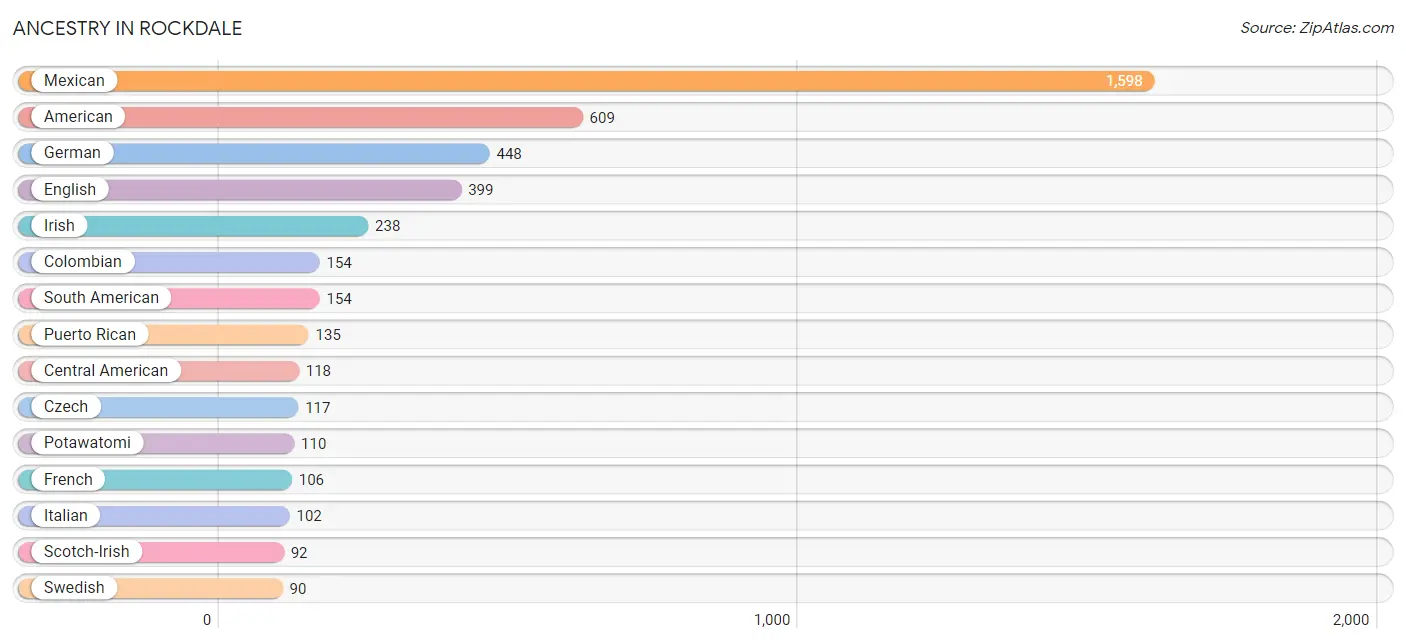
Ancestry in Rockdale
The most populous ancestries reported in Rockdale are Mexican (1,598 | 29.5%), American (609 | 11.2%), German (448 | 8.3%), English (399 | 7.4%), and Irish (238 | 4.4%), together accounting for 60.7% of all Rockdale residents.
| Ancestry | # Population | % Population |
| American | 609 | 11.2% |
| Austrian | 22 | 0.4% |
| Bhutanese | 15 | 0.3% |
| Canadian | 50 | 0.9% |
| Central American | 118 | 2.2% |
| Cherokee | 14 | 0.3% |
| Colombian | 154 | 2.8% |
| Czech | 117 | 2.2% |
| Czechoslovakian | 16 | 0.3% |
| Dutch | 27 | 0.5% |
| English | 399 | 7.4% |
| European | 18 | 0.3% |
| Finnish | 16 | 0.3% |
| French | 106 | 1.9% |
| French Canadian | 32 | 0.6% |
| German | 448 | 8.3% |
| Guatemalan | 71 | 1.3% |
| Honduran | 8 | 0.2% |
| Hungarian | 22 | 0.4% |
| Irish | 238 | 4.4% |
| Italian | 102 | 1.9% |
| Lithuanian | 27 | 0.5% |
| Mexican | 1,598 | 29.5% |
| Panamanian | 39 | 0.7% |
| Polish | 28 | 0.5% |
| Potawatomi | 110 | 2.0% |
| Puerto Rican | 135 | 2.5% |
| Russian | 24 | 0.4% |
| Scotch-Irish | 92 | 1.7% |
| Scottish | 75 | 1.4% |
| South American | 154 | 2.8% |
| Sri Lankan | 11 | 0.2% |
| Swedish | 90 | 1.7% |
| Swiss | 27 | 0.5% | View All 34 Rows |
Immigrants in Rockdale
The most numerous immigrant groups reported in Rockdale came from Latin America (485 | 8.9%), Central America (374 | 6.9%), Mexico (298 | 5.5%), Colombia (111 | 2.1%), and South America (111 | 2.1%), together accounting for 25.4% of all Rockdale residents.
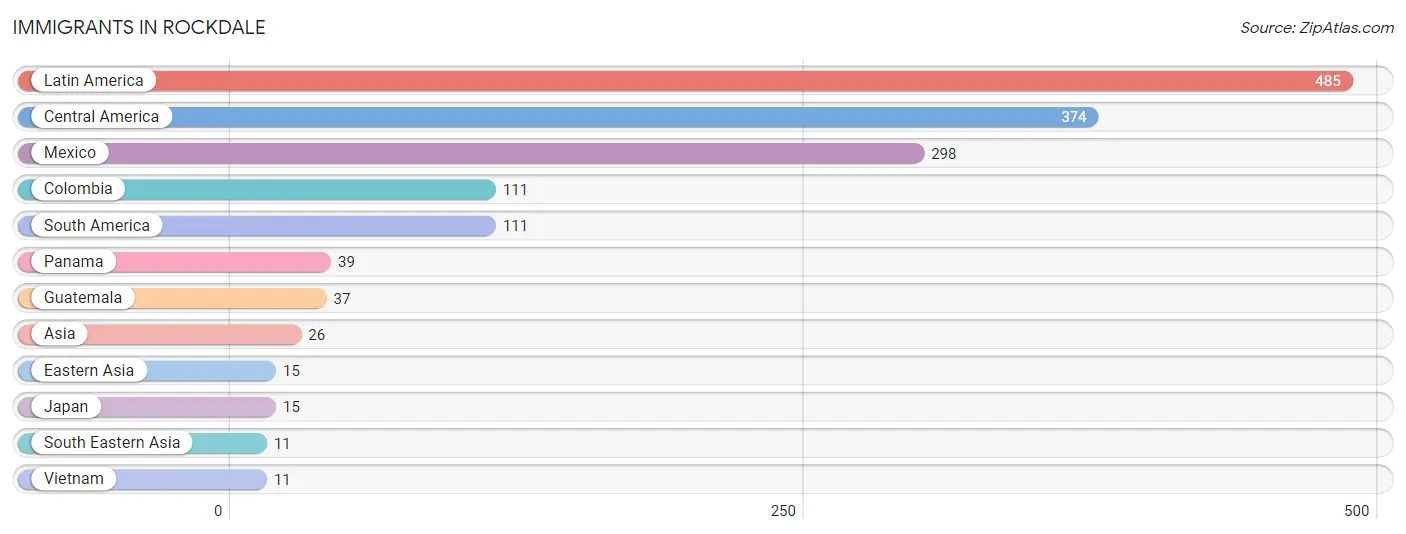
| Immigration Origin | # Population | % Population |
| Asia | 26 | 0.5% |
| Central America | 374 | 6.9% |
| Colombia | 111 | 2.1% |
| Eastern Asia | 15 | 0.3% |
| Guatemala | 37 | 0.7% |
| Japan | 15 | 0.3% |
| Latin America | 485 | 8.9% |
| Mexico | 298 | 5.5% |
| Panama | 39 | 0.7% |
| South America | 111 | 2.1% |
| South Eastern Asia | 11 | 0.2% |
| Vietnam | 11 | 0.2% | View All 12 Rows |
Sex and Age in Rockdale
Sex and Age in Rockdale
The most populous age groups in Rockdale are 10 to 14 Years (257 | 10.0%) for men and 15 to 19 Years (322 | 11.3%) for women.
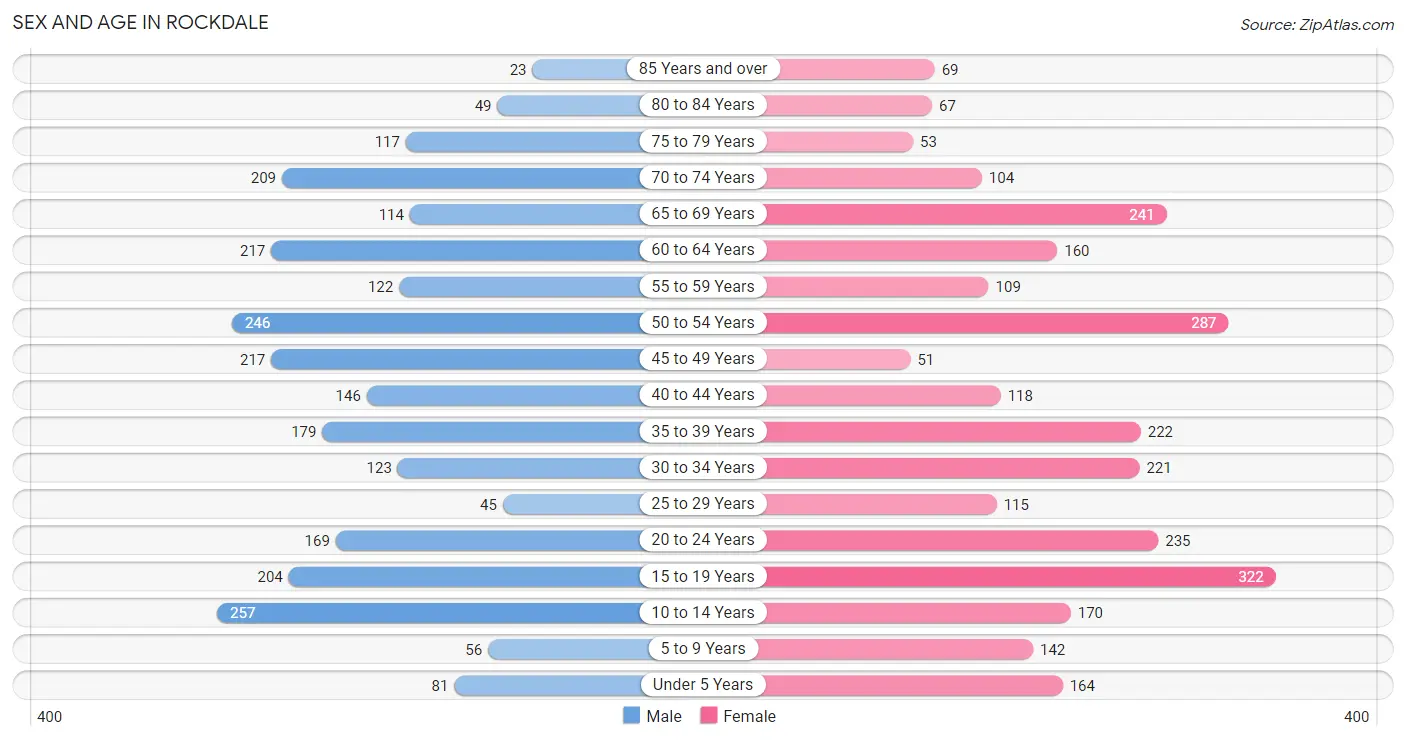
| Age Bracket | Male | Female |
| Under 5 Years | 81 (3.2%) | 164 (5.8%) |
| 5 to 9 Years | 56 (2.2%) | 142 (5.0%) |
| 10 to 14 Years | 257 (10.0%) | 170 (6.0%) |
| 15 to 19 Years | 204 (7.9%) | 322 (11.3%) |
| 20 to 24 Years | 169 (6.6%) | 235 (8.3%) |
| 25 to 29 Years | 45 (1.8%) | 115 (4.0%) |
| 30 to 34 Years | 123 (4.8%) | 221 (7.7%) |
| 35 to 39 Years | 179 (7.0%) | 222 (7.8%) |
| 40 to 44 Years | 146 (5.7%) | 118 (4.1%) |
| 45 to 49 Years | 217 (8.4%) | 51 (1.8%) |
| 50 to 54 Years | 246 (9.6%) | 287 (10.1%) |
| 55 to 59 Years | 122 (4.7%) | 109 (3.8%) |
| 60 to 64 Years | 217 (8.4%) | 160 (5.6%) |
| 65 to 69 Years | 114 (4.4%) | 241 (8.5%) |
| 70 to 74 Years | 209 (8.1%) | 104 (3.6%) |
| 75 to 79 Years | 117 (4.5%) | 53 (1.9%) |
| 80 to 84 Years | 49 (1.9%) | 67 (2.4%) |
| 85 Years and over | 23 (0.9%) | 69 (2.4%) |
| Total | 2,574 (100.0%) | 2,850 (100.0%) |
Families and Households in Rockdale
Median Family Size in Rockdale
The median family size in Rockdale is 3.53 persons per family, with single male/father families (49 | 4.4%) accounting for the largest median family size of 4.57 persons per family. On the other hand, single female/mother families (174 | 15.5%) represent the smallest median family size with 2.76 persons per family.
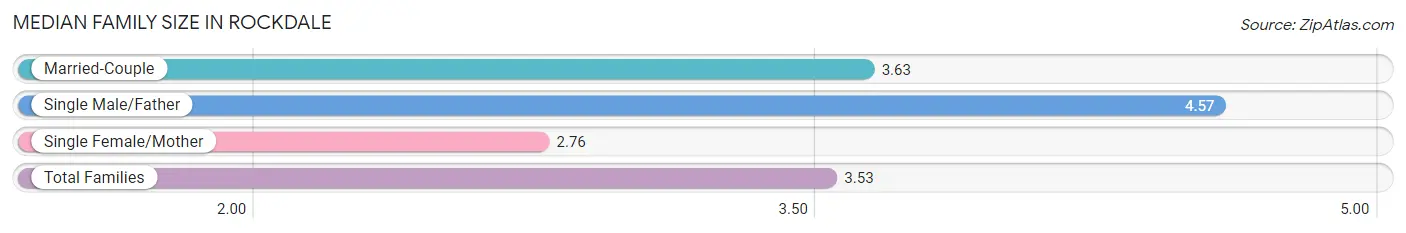
| Family Type | # Families | Family Size |
| Married-Couple | 898 (80.1%) | 3.63 |
| Single Male/Father | 49 (4.4%) | 4.57 |
| Single Female/Mother | 174 (15.5%) | 2.76 |
| Total Families | 1,121 (100.0%) | 3.53 |
Median Household Size in Rockdale
The median household size in Rockdale is 2.41 persons per household, with single male/father households (49 | 2.2%) accounting for the largest median household size of 4.57 persons per household. non-family households (1,077 | 49.0%) represent the smallest median household size with 1.23 persons per household.
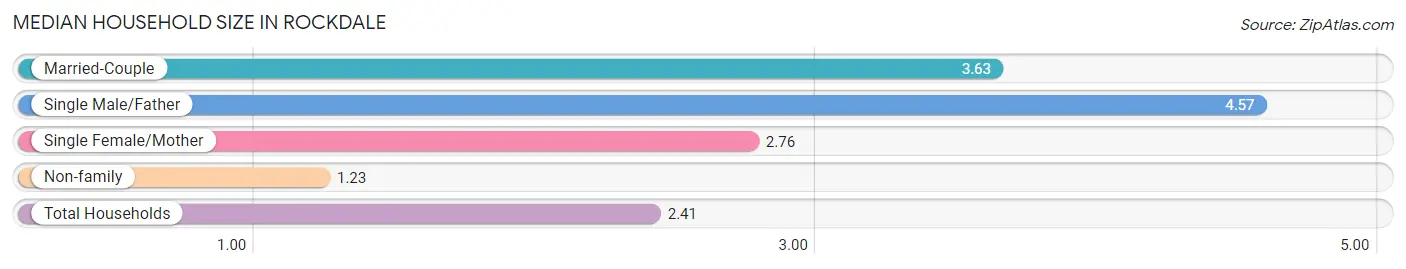
| Household Type | # Households | Household Size |
| Married-Couple | 898 (40.9%) | 3.63 |
| Single Male/Father | 49 (2.2%) | 4.57 |
| Single Female/Mother | 174 (7.9%) | 2.76 |
| Non-family | 1,077 (49.0%) | 1.23 |
| Total Households | 2,198 (100.0%) | 2.41 |
Household Size by Marriage Status in Rockdale
Out of a total of 2,198 households in Rockdale, 1,121 (51.0%) are family households, while 1,077 (49.0%) are nonfamily households. The most numerous type of family households are 2-person households, comprising 548, and the most common type of nonfamily households are 1-person households, comprising 875.
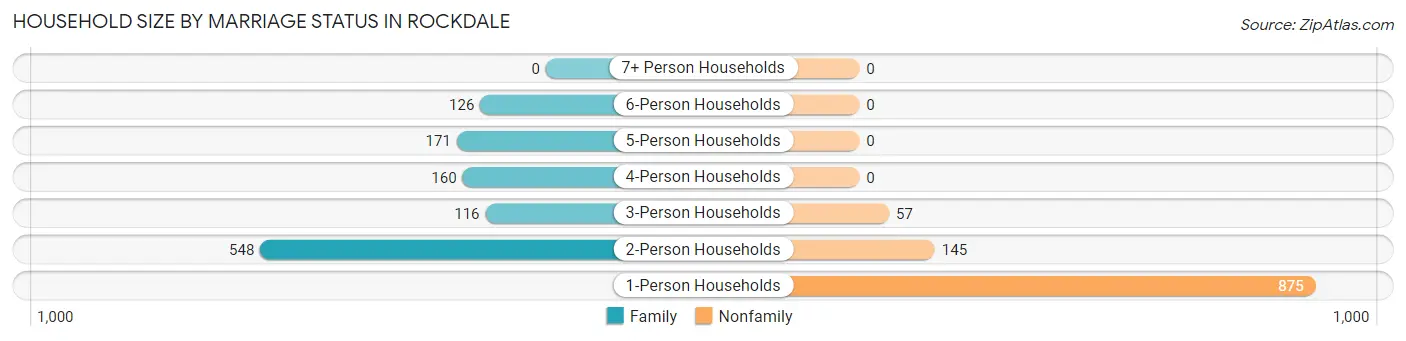
| Household Size | Family Households | Nonfamily Households |
| 1-Person Households | - | 875 (39.8%) |
| 2-Person Households | 548 (24.9%) | 145 (6.6%) |
| 3-Person Households | 116 (5.3%) | 57 (2.6%) |
| 4-Person Households | 160 (7.3%) | 0 (0.0%) |
| 5-Person Households | 171 (7.8%) | 0 (0.0%) |
| 6-Person Households | 126 (5.7%) | 0 (0.0%) |
| 7+ Person Households | 0 (0.0%) | 0 (0.0%) |
| Total | 1,121 (51.0%) | 1,077 (49.0%) |
Female Fertility in Rockdale
Fertility by Age in Rockdale
Average fertility rate in Rockdale is 42.0 births per 1,000 women. Women in the age bracket of 20 to 34 years have the highest fertility rate with 103.0 births per 1,000 women. Women in the age bracket of 20 to 34 years acount for 100.0% of all women with births.
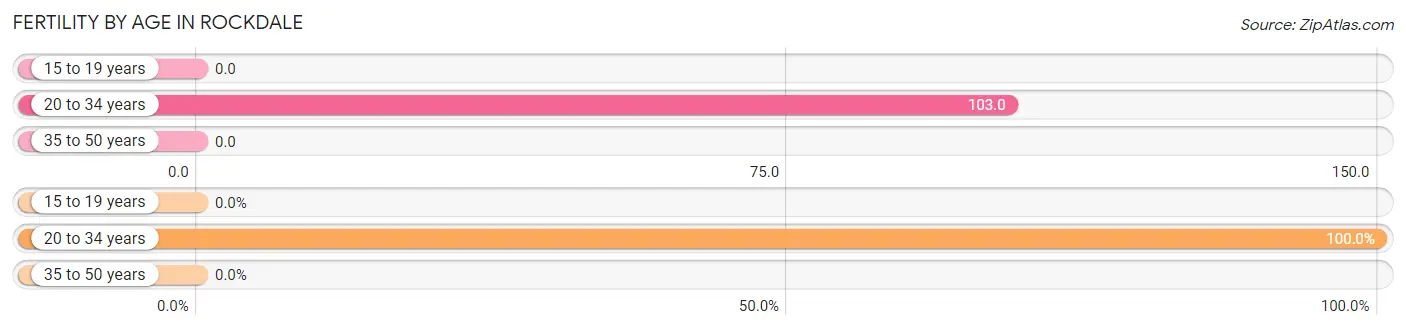
| Age Bracket | Women with Births | Births / 1,000 Women |
| 15 to 19 years | 0 (0.0%) | 0.0 |
| 20 to 34 years | 59 (100.0%) | 103.0 |
| 35 to 50 years | 0 (0.0%) | 0.0 |
| Total | 59 (100.0%) | 42.0 |
Fertility by Age by Marriage Status in Rockdale
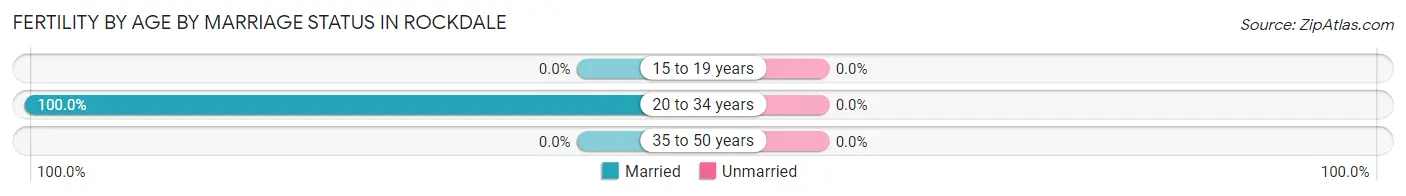
| Age Bracket | Married | Unmarried |
| 15 to 19 years | 0 (0.0%) | 0 (0.0%) |
| 20 to 34 years | 59 (100.0%) | 0 (0.0%) |
| 35 to 50 years | 0 (0.0%) | 0 (0.0%) |
| Total | 59 (100.0%) | 0 (0.0%) |
Fertility by Education in Rockdale
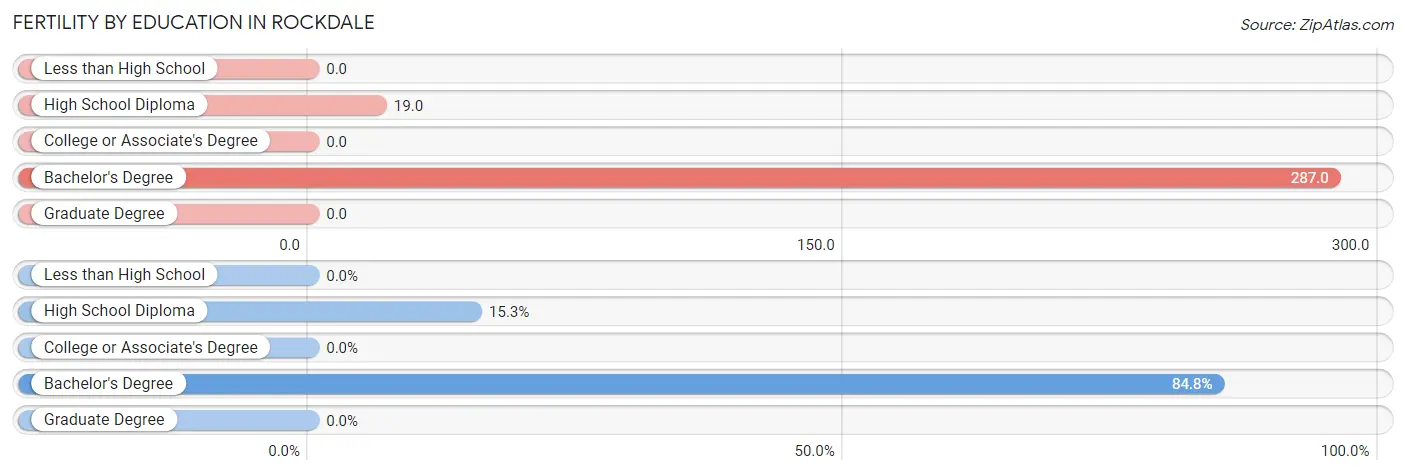
| Educational Attainment | Women with Births | Births / 1,000 Women |
| Less than High School | 0 (0.0%) | 0.0 |
| High School Diploma | 9 (15.2%) | 19.0 |
| College or Associate's Degree | 0 (0.0%) | 0.0 |
| Bachelor's Degree | 50 (84.8%) | 287.0 |
| Graduate Degree | 0 (0.0%) | 0.0 |
| Total | 59 (100.0%) | 42.0 |
Fertility by Education by Marriage Status in Rockdale
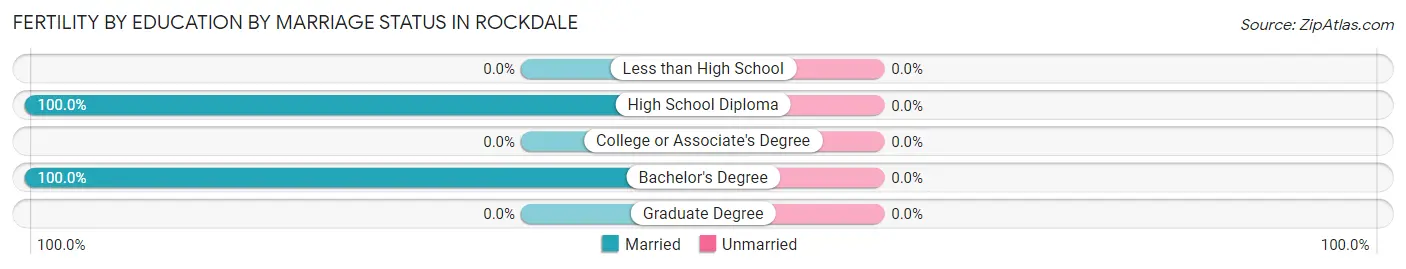
| Educational Attainment | Married | Unmarried |
| Less than High School | 0 (0.0%) | 0 (0.0%) |
| High School Diploma | 9 (100.0%) | 0 (0.0%) |
| College or Associate's Degree | 0 (0.0%) | 0 (0.0%) |
| Bachelor's Degree | 50 (100.0%) | 0 (0.0%) |
| Graduate Degree | 0 (0.0%) | 0 (0.0%) |
| Total | 59 (100.0%) | 0 (0.0%) |
Employment Characteristics in Rockdale
Employment by Class of Employer in Rockdale
Among the 2,470 employed individuals in Rockdale, private company employees (1,860 | 75.3%), not-for-profit organizations (167 | 6.8%), and self-employed (not incorporated) (140 | 5.7%) make up the most common classes of employment.
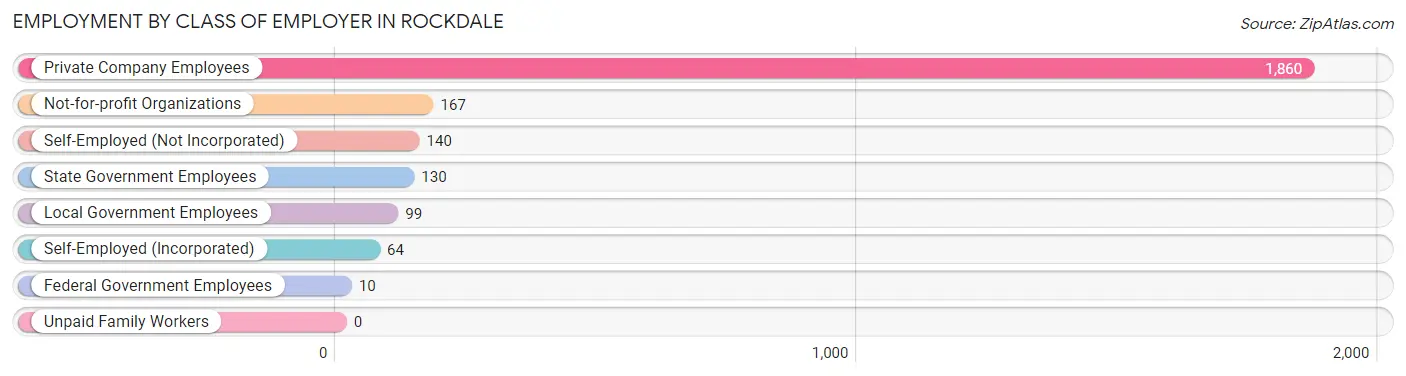
| Employer Class | # Employees | % Employees |
| Private Company Employees | 1,860 | 75.3% |
| Self-Employed (Incorporated) | 64 | 2.6% |
| Self-Employed (Not Incorporated) | 140 | 5.7% |
| Not-for-profit Organizations | 167 | 6.8% |
| Local Government Employees | 99 | 4.0% |
| State Government Employees | 130 | 5.3% |
| Federal Government Employees | 10 | 0.4% |
| Unpaid Family Workers | 0 | 0.0% |
| Total | 2,470 | 100.0% |
Employment Status by Age in Rockdale
According to the labor force statistics for Rockdale, out of the total population over 16 years of age (4,432), 62.1% or 2,752 individuals are in the labor force, with 4.6% or 127 of them unemployed. The age group with the highest labor force participation rate is 20 to 24 years, with 100.0% or 404 individuals in the labor force. Within the labor force, the 16 to 19 years age range has the highest percentage of unemployed individuals, with 38.9% or 42 of them being unemployed.
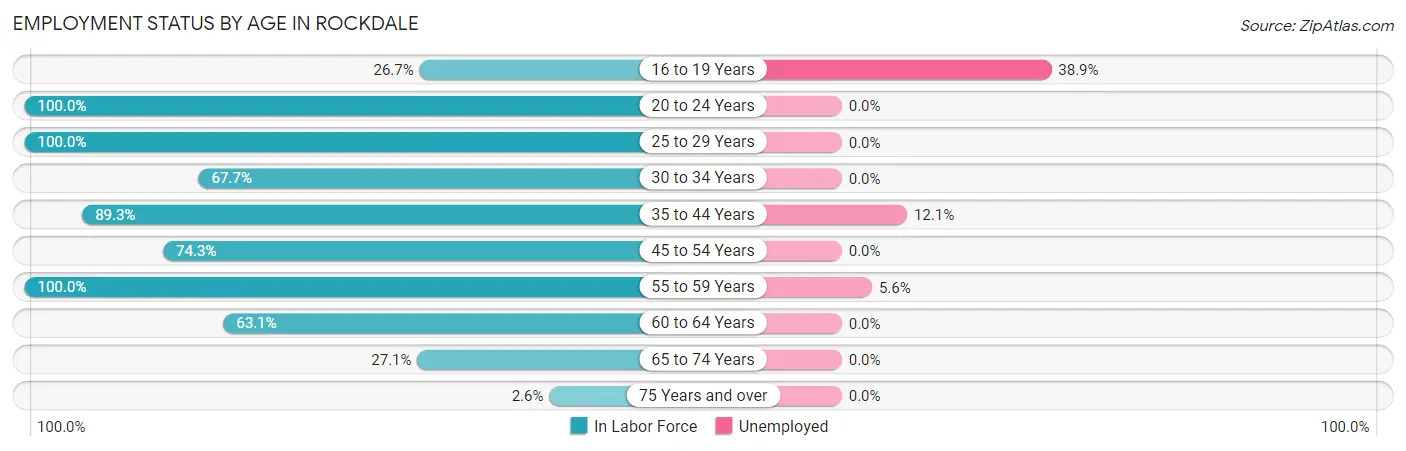
| Age Bracket | In Labor Force | Unemployed |
| 16 to 19 Years | 108 (26.7%) | 42 (38.9%) |
| 20 to 24 Years | 404 (100.0%) | 0 (0.0%) |
| 25 to 29 Years | 160 (100.0%) | 0 (0.0%) |
| 30 to 34 Years | 233 (67.7%) | 0 (0.0%) |
| 35 to 44 Years | 594 (89.3%) | 72 (12.1%) |
| 45 to 54 Years | 595 (74.3%) | 0 (0.0%) |
| 55 to 59 Years | 231 (100.0%) | 13 (5.6%) |
| 60 to 64 Years | 238 (63.1%) | 0 (0.0%) |
| 65 to 74 Years | 181 (27.1%) | 0 (0.0%) |
| 75 Years and over | 10 (2.6%) | 0 (0.0%) |
| Total | 2,752 (62.1%) | 127 (4.6%) |
Employment Status by Educational Attainment in Rockdale
According to labor force statistics for Rockdale, 79.6% of individuals (2,052) out of the total population between 25 and 64 years of age (2,578) are in the labor force, with 4.1% or 84 of them being unemployed. The group with the highest labor force participation rate are those with the educational attainment of bachelor's degree or higher, with 91.4% or 424 individuals in the labor force. Within the labor force, individuals with bachelor's degree or higher education have the highest percentage of unemployment, with 17.0% or 72 of them being unemployed.
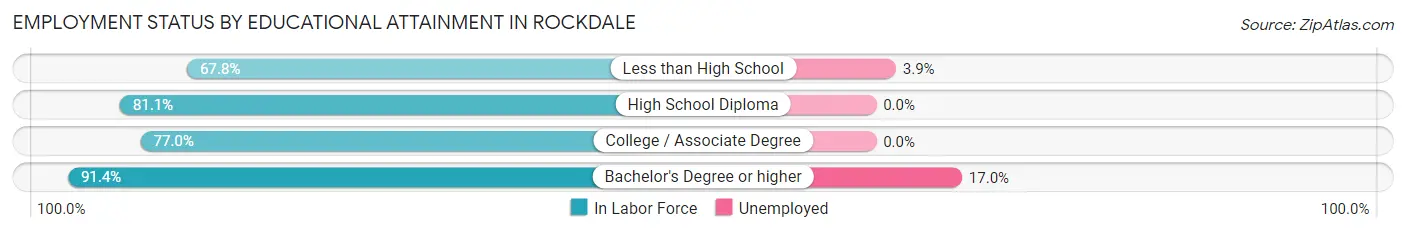
| Educational Attainment | In Labor Force | Unemployed |
| Less than High School | 335 (67.8%) | 19 (3.9%) |
| High School Diploma | 881 (81.1%) | 0 (0.0%) |
| College / Associate Degree | 411 (77.0%) | 0 (0.0%) |
| Bachelor's Degree or higher | 424 (91.4%) | 79 (17.0%) |
| Total | 2,052 (79.6%) | 106 (4.1%) |
Employment Occupations by Sex in Rockdale
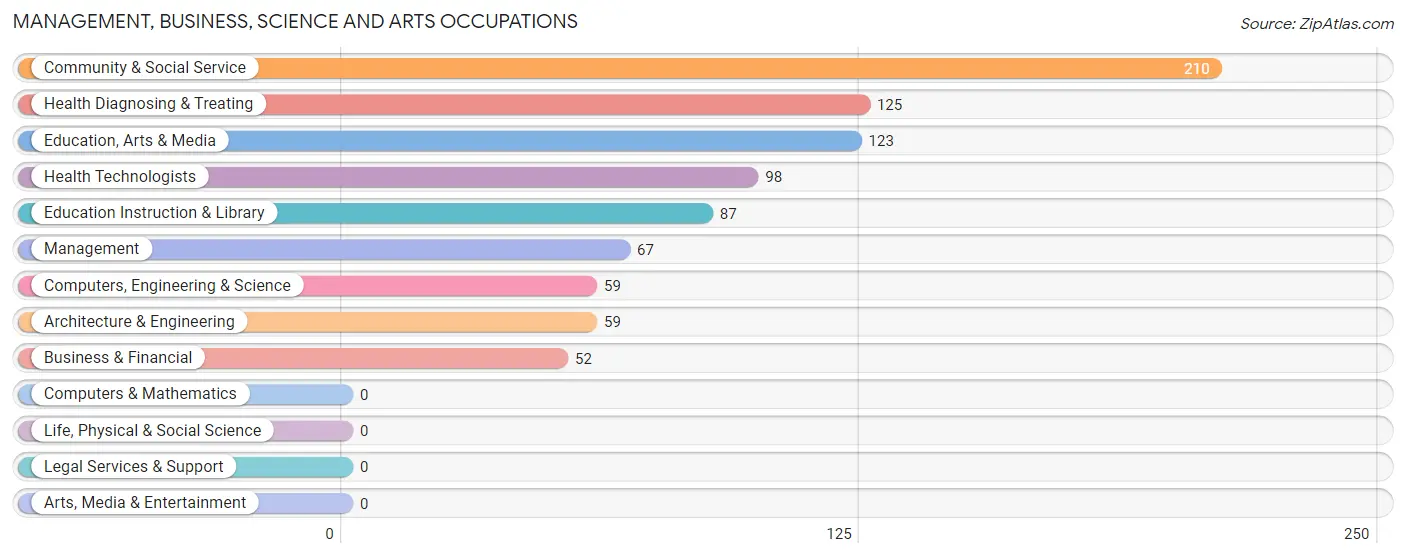
Management, Business, Science and Arts Occupations
The most common Management, Business, Science and Arts occupations in Rockdale are Community & Social Service (210 | 8.0%), Health Diagnosing & Treating (125 | 4.8%), Education, Arts & Media (123 | 4.7%), Health Technologists (98 | 3.7%), and Education Instruction & Library (87 | 3.3%).
Management, Business, Science and Arts Occupations by Sex
Within the Management, Business, Science and Arts occupations in Rockdale, the most male-oriented occupations are Computers, Engineering & Science (100.0%), Architecture & Engineering (100.0%), and Education, Arts & Media (100.0%), while the most female-oriented occupations are Health Diagnosing & Treating (100.0%), Health Technologists (100.0%), and Education Instruction & Library (32.2%).
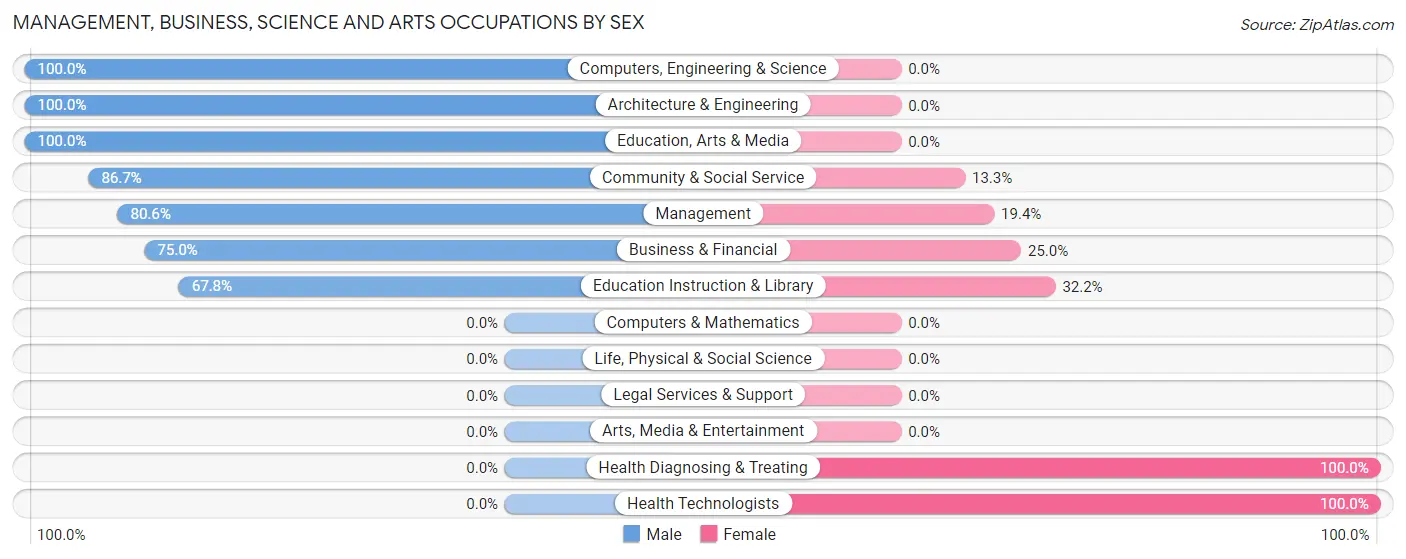
| Occupation | Male | Female |
| Management | 54 (80.6%) | 13 (19.4%) |
| Business & Financial | 39 (75.0%) | 13 (25.0%) |
| Computers, Engineering & Science | 59 (100.0%) | 0 (0.0%) |
| Computers & Mathematics | 0 (0.0%) | 0 (0.0%) |
| Architecture & Engineering | 59 (100.0%) | 0 (0.0%) |
| Life, Physical & Social Science | 0 (0.0%) | 0 (0.0%) |
| Community & Social Service | 182 (86.7%) | 28 (13.3%) |
| Education, Arts & Media | 123 (100.0%) | 0 (0.0%) |
| Legal Services & Support | 0 (0.0%) | 0 (0.0%) |
| Education Instruction & Library | 59 (67.8%) | 28 (32.2%) |
| Arts, Media & Entertainment | 0 (0.0%) | 0 (0.0%) |
| Health Diagnosing & Treating | 0 (0.0%) | 125 (100.0%) |
| Health Technologists | 0 (0.0%) | 98 (100.0%) |
| Total (Category) | 334 (65.1%) | 179 (34.9%) |
| Total (Overall) | 1,380 (52.5%) | 1,247 (47.5%) |
Services Occupations
The most common Services occupations in Rockdale are Food Preparation & Serving (124 | 4.7%), Cleaning & Maintenance (64 | 2.4%), Personal Care & Service (52 | 2.0%), Healthcare Support (17 | 0.6%), and Security & Protection (12 | 0.5%).
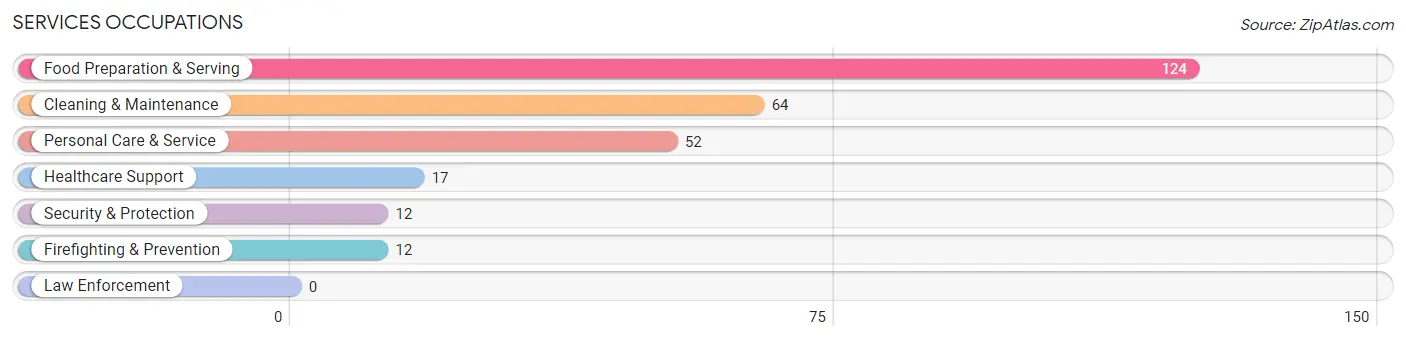
Services Occupations by Sex
Within the Services occupations in Rockdale, the most male-oriented occupations are Security & Protection (100.0%), Firefighting & Prevention (100.0%), and Cleaning & Maintenance (100.0%), while the most female-oriented occupations are Healthcare Support (100.0%), Personal Care & Service (100.0%), and Food Preparation & Serving (94.4%).
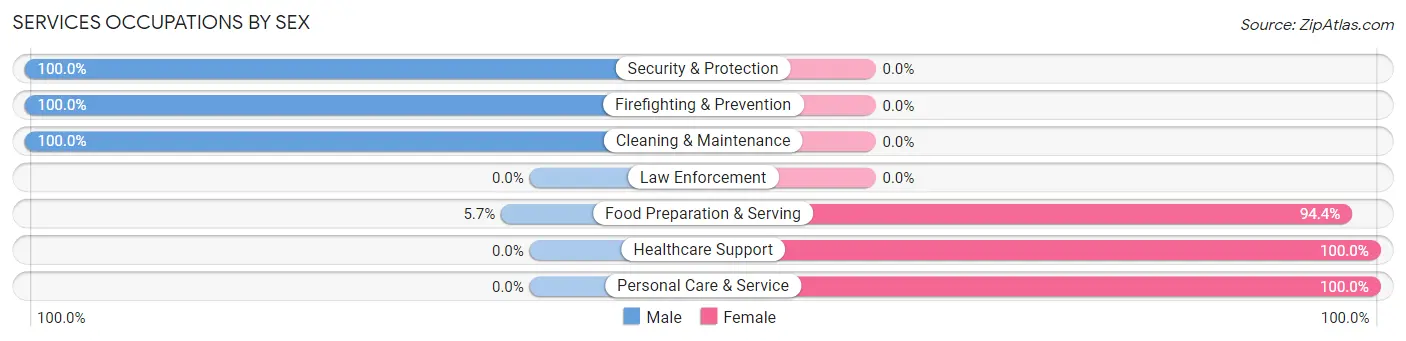
| Occupation | Male | Female |
| Healthcare Support | 0 (0.0%) | 17 (100.0%) |
| Security & Protection | 12 (100.0%) | 0 (0.0%) |
| Firefighting & Prevention | 12 (100.0%) | 0 (0.0%) |
| Law Enforcement | 0 (0.0%) | 0 (0.0%) |
| Food Preparation & Serving | 7 (5.7%) | 117 (94.4%) |
| Cleaning & Maintenance | 64 (100.0%) | 0 (0.0%) |
| Personal Care & Service | 0 (0.0%) | 52 (100.0%) |
| Total (Category) | 83 (30.9%) | 186 (69.1%) |
| Total (Overall) | 1,380 (52.5%) | 1,247 (47.5%) |
Sales and Office Occupations
The most common Sales and Office occupations in Rockdale are Office & Administration (671 | 25.5%), and Sales & Related (376 | 14.3%).
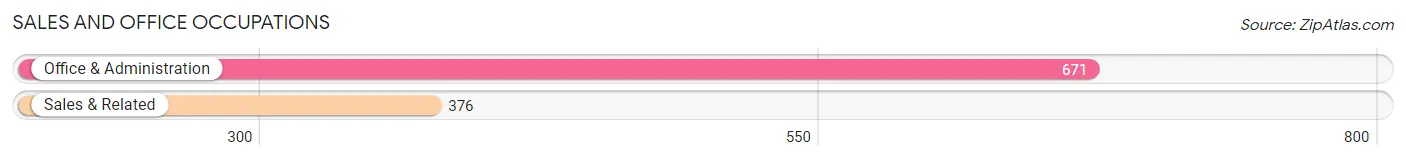
Sales and Office Occupations by Sex

| Occupation | Male | Female |
| Sales & Related | 164 (43.6%) | 212 (56.4%) |
| Office & Administration | 52 (7.7%) | 619 (92.2%) |
| Total (Category) | 216 (20.6%) | 831 (79.4%) |
| Total (Overall) | 1,380 (52.5%) | 1,247 (47.5%) |
Natural Resources, Construction and Maintenance Occupations
The most common Natural Resources, Construction and Maintenance occupations in Rockdale are Construction & Extraction (475 | 18.1%), and Installation, Maintenance & Repair (49 | 1.9%).
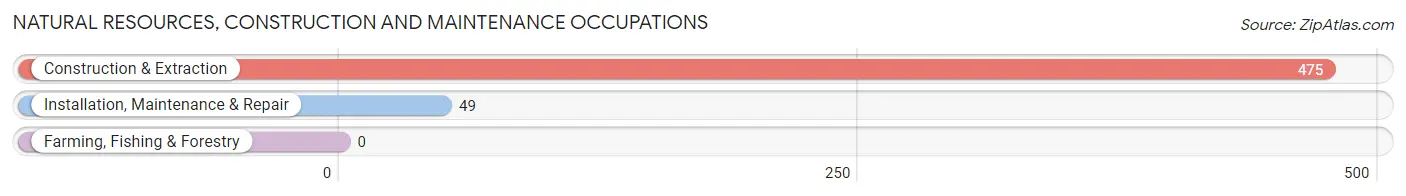
Natural Resources, Construction and Maintenance Occupations by Sex

| Occupation | Male | Female |
| Farming, Fishing & Forestry | 0 (0.0%) | 0 (0.0%) |
| Construction & Extraction | 475 (100.0%) | 0 (0.0%) |
| Installation, Maintenance & Repair | 49 (100.0%) | 0 (0.0%) |
| Total (Category) | 524 (100.0%) | 0 (0.0%) |
| Total (Overall) | 1,380 (52.5%) | 1,247 (47.5%) |
Production, Transportation and Moving Occupations
The most common Production, Transportation and Moving occupations in Rockdale are Material Moving (128 | 4.9%), Production (94 | 3.6%), and Transportation (52 | 2.0%).
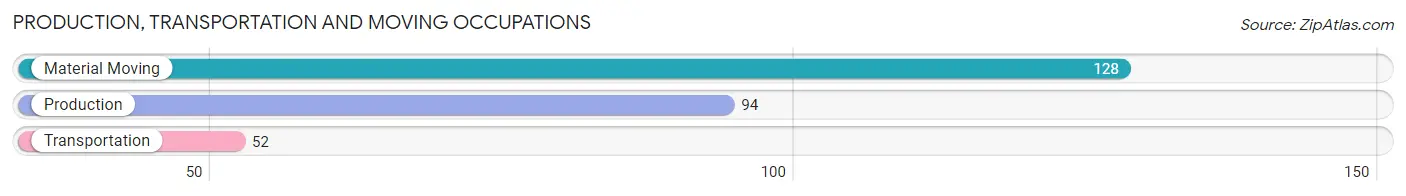
Production, Transportation and Moving Occupations by Sex
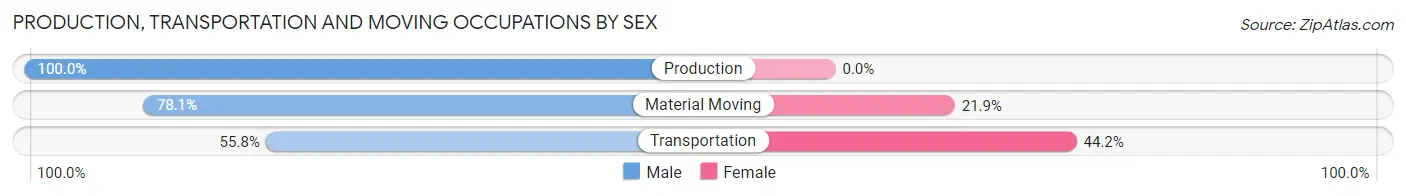
| Occupation | Male | Female |
| Production | 94 (100.0%) | 0 (0.0%) |
| Transportation | 29 (55.8%) | 23 (44.2%) |
| Material Moving | 100 (78.1%) | 28 (21.9%) |
| Total (Category) | 223 (81.4%) | 51 (18.6%) |
| Total (Overall) | 1,380 (52.5%) | 1,247 (47.5%) |
Employment Industries by Sex in Rockdale
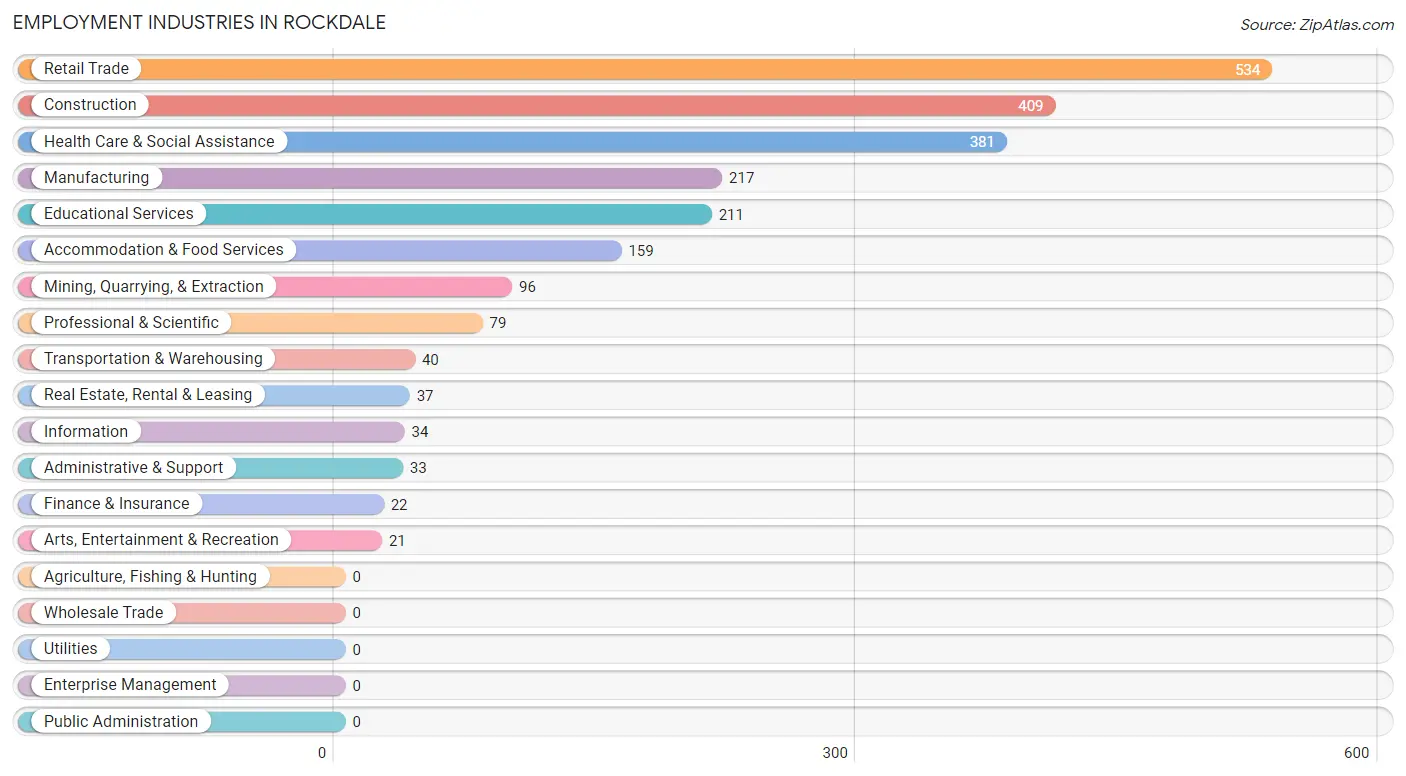
Employment Industries in Rockdale
The major employment industries in Rockdale include Retail Trade (534 | 20.3%), Construction (409 | 15.6%), Health Care & Social Assistance (381 | 14.5%), Manufacturing (217 | 8.3%), and Educational Services (211 | 8.0%).
Employment Industries by Sex in Rockdale
The Rockdale industries that see more men than women are Mining, Quarrying, & Extraction (100.0%), Manufacturing (100.0%), and Real Estate, Rental & Leasing (100.0%), whereas the industries that tend to have a higher number of women are Information (100.0%), Finance & Insurance (100.0%), and Arts, Entertainment & Recreation (100.0%).
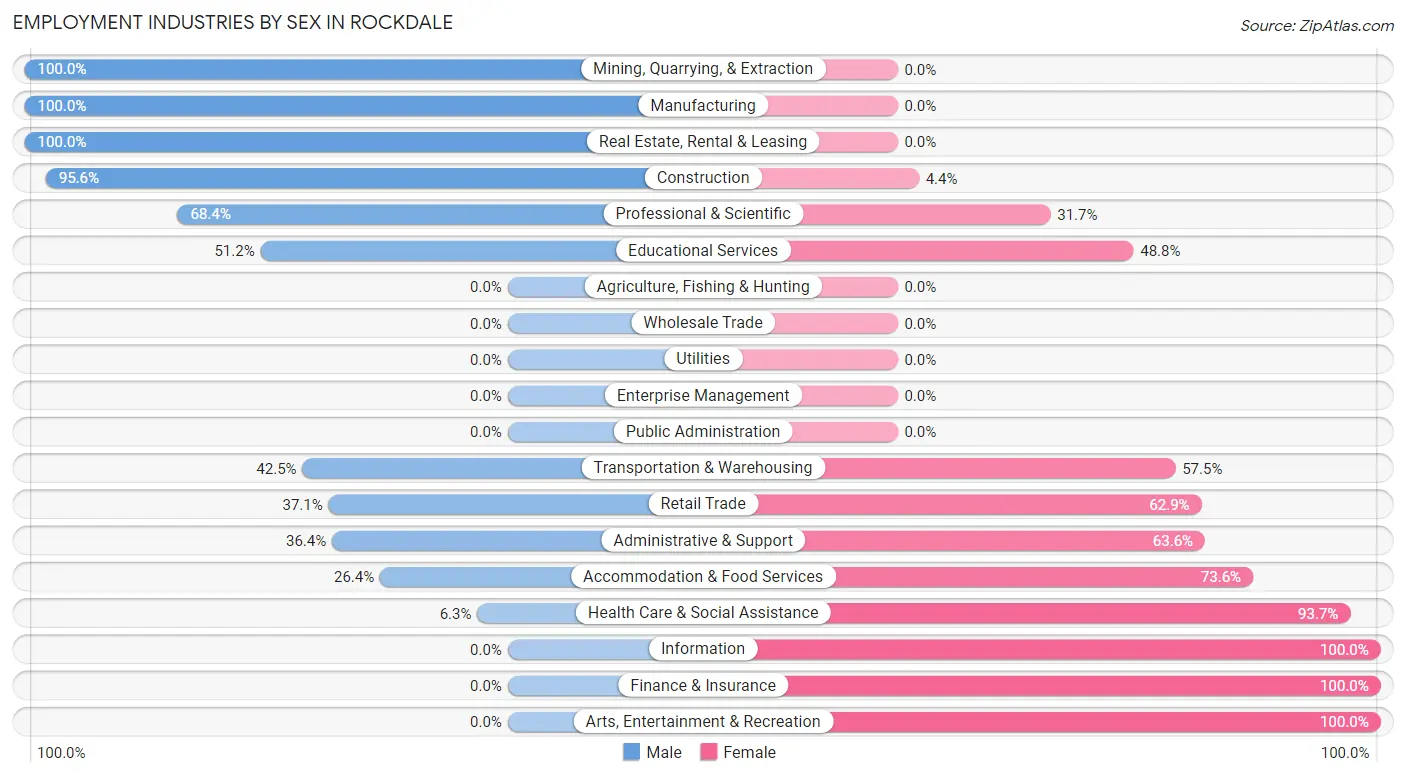
| Industry | Male | Female |
| Agriculture, Fishing & Hunting | 0 (0.0%) | 0 (0.0%) |
| Mining, Quarrying, & Extraction | 96 (100.0%) | 0 (0.0%) |
| Construction | 391 (95.6%) | 18 (4.4%) |
| Manufacturing | 217 (100.0%) | 0 (0.0%) |
| Wholesale Trade | 0 (0.0%) | 0 (0.0%) |
| Retail Trade | 198 (37.1%) | 336 (62.9%) |
| Transportation & Warehousing | 17 (42.5%) | 23 (57.5%) |
| Utilities | 0 (0.0%) | 0 (0.0%) |
| Information | 0 (0.0%) | 34 (100.0%) |
| Finance & Insurance | 0 (0.0%) | 22 (100.0%) |
| Real Estate, Rental & Leasing | 37 (100.0%) | 0 (0.0%) |
| Professional & Scientific | 54 (68.3%) | 25 (31.7%) |
| Enterprise Management | 0 (0.0%) | 0 (0.0%) |
| Administrative & Support | 12 (36.4%) | 21 (63.6%) |
| Educational Services | 108 (51.2%) | 103 (48.8%) |
| Health Care & Social Assistance | 24 (6.3%) | 357 (93.7%) |
| Arts, Entertainment & Recreation | 0 (0.0%) | 21 (100.0%) |
| Accommodation & Food Services | 42 (26.4%) | 117 (73.6%) |
| Public Administration | 0 (0.0%) | 0 (0.0%) |
| Total | 1,380 (52.5%) | 1,247 (47.5%) |
Education in Rockdale
School Enrollment in Rockdale
The most common levels of schooling among the 1,205 students in Rockdale are middle school (384 | 31.9%), high school (348 | 28.9%), and college / undergraduate (274 | 22.7%).
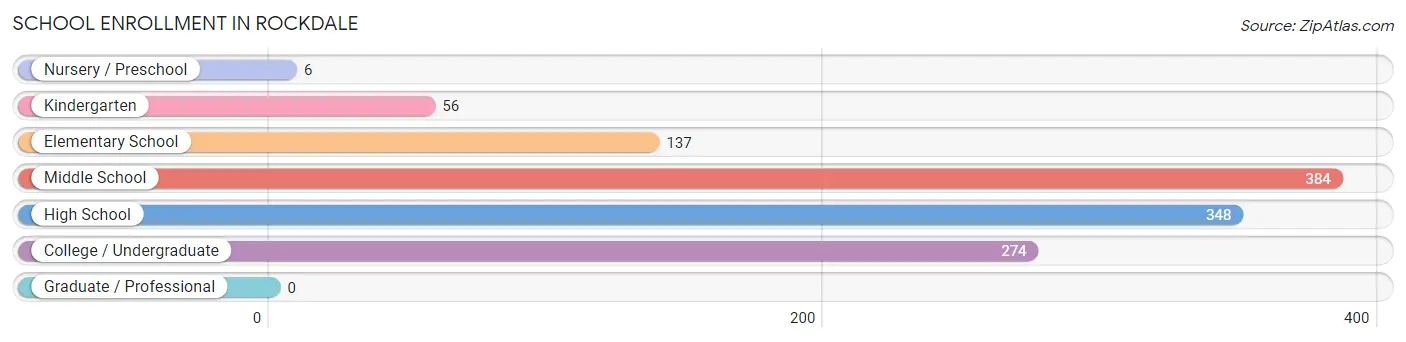
| School Level | # Students | % Students |
| Nursery / Preschool | 6 | 0.5% |
| Kindergarten | 56 | 4.6% |
| Elementary School | 137 | 11.4% |
| Middle School | 384 | 31.9% |
| High School | 348 | 28.9% |
| College / Undergraduate | 274 | 22.7% |
| Graduate / Professional | 0 | 0.0% |
| Total | 1,205 | 100.0% |
School Enrollment by Age by Funding Source in Rockdale
Out of a total of 1,205 students who are enrolled in schools in Rockdale, 224 (18.6%) attend a private institution, while the remaining 981 (81.4%) are enrolled in public schools. The age group of 20 to 24 year olds has the highest likelihood of being enrolled in private schools, with 131 (71.6% in the age bracket) enrolled. Conversely, the age group of 3 to 4 year olds has the lowest likelihood of being enrolled in a private school, with 6 (100.0% in the age bracket) attending a public institution.
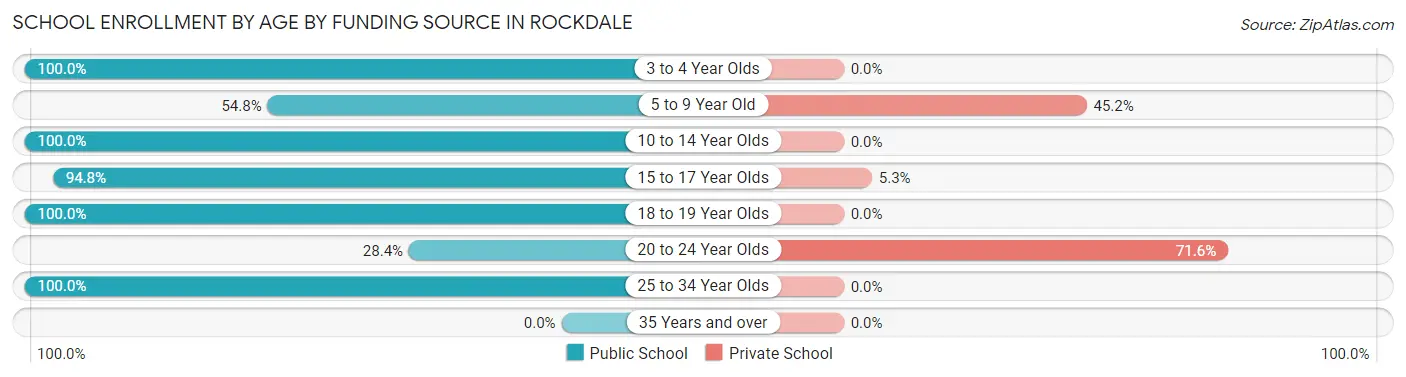
| Age Bracket | Public School | Private School |
| 3 to 4 Year Olds | 6 (100.0%) | 0 (0.0%) |
| 5 to 9 Year Old | 92 (54.8%) | 76 (45.2%) |
| 10 to 14 Year Olds | 427 (100.0%) | 0 (0.0%) |
| 15 to 17 Year Olds | 307 (94.8%) | 17 (5.2%) |
| 18 to 19 Year Olds | 72 (100.0%) | 0 (0.0%) |
| 20 to 24 Year Olds | 52 (28.4%) | 131 (71.6%) |
| 25 to 34 Year Olds | 25 (100.0%) | 0 (0.0%) |
| 35 Years and over | 0 (0.0%) | 0 (0.0%) |
| Total | 981 (81.4%) | 224 (18.6%) |
Educational Attainment by Field of Study in Rockdale
Business (183 | 27.9%), arts & humanities (101 | 15.4%), liberal arts & history (82 | 12.5%), engineering (72 | 11.0%), and literature & languages (54 | 8.2%) are the most common fields of study among 656 individuals in Rockdale who have obtained a bachelor's degree or higher.
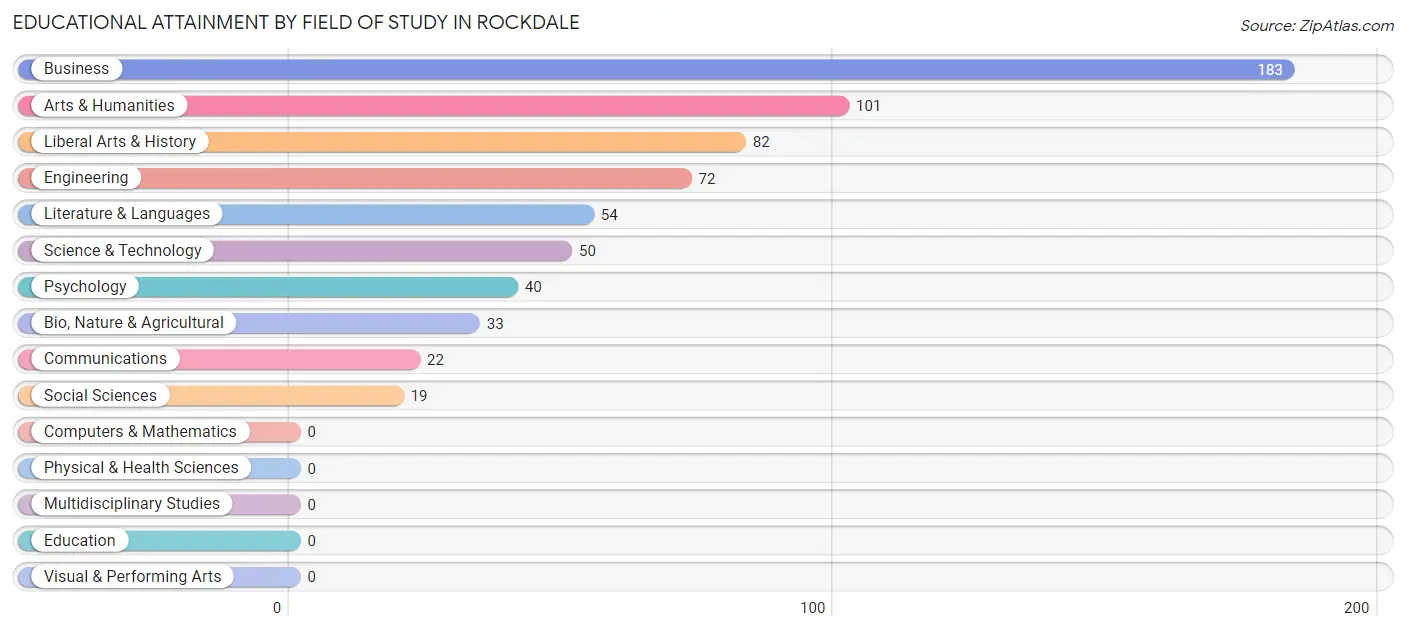
| Field of Study | # Graduates | % Graduates |
| Computers & Mathematics | 0 | 0.0% |
| Bio, Nature & Agricultural | 33 | 5.0% |
| Physical & Health Sciences | 0 | 0.0% |
| Psychology | 40 | 6.1% |
| Social Sciences | 19 | 2.9% |
| Engineering | 72 | 11.0% |
| Multidisciplinary Studies | 0 | 0.0% |
| Science & Technology | 50 | 7.6% |
| Business | 183 | 27.9% |
| Education | 0 | 0.0% |
| Literature & Languages | 54 | 8.2% |
| Liberal Arts & History | 82 | 12.5% |
| Visual & Performing Arts | 0 | 0.0% |
| Communications | 22 | 3.4% |
| Arts & Humanities | 101 | 15.4% |
| Total | 656 | 100.0% |
Transportation & Commute in Rockdale
Vehicle Availability by Sex in Rockdale
The most prevalent vehicle ownership categories in Rockdale are males with 1 vehicle (576, accounting for 41.7%) and females with 1 vehicle (354, making up 52.8%).
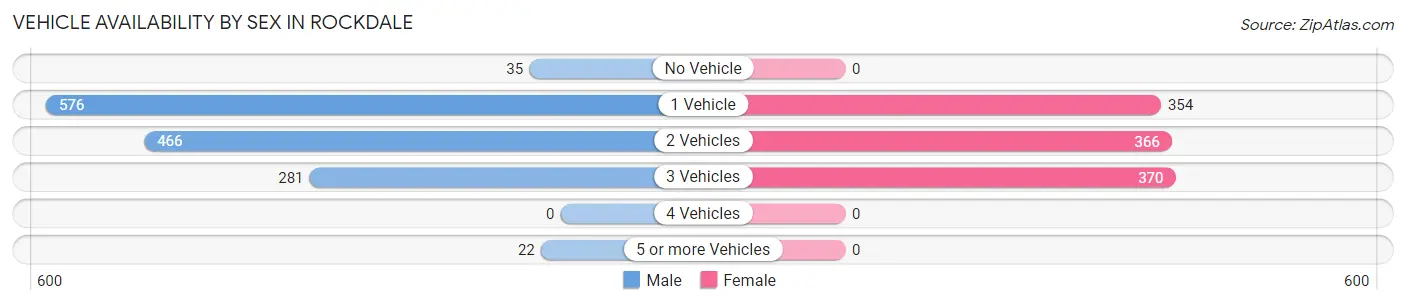
| Vehicles Available | Male | Female |
| No Vehicle | 35 (2.5%) | 0 (0.0%) |
| 1 Vehicle | 576 (41.7%) | 354 (32.5%) |
| 2 Vehicles | 466 (33.8%) | 366 (33.6%) |
| 3 Vehicles | 281 (20.4%) | 370 (33.9%) |
| 4 Vehicles | 0 (0.0%) | 0 (0.0%) |
| 5 or more Vehicles | 22 (1.6%) | 0 (0.0%) |
| Total | 1,380 (100.0%) | 1,090 (100.0%) |
Commute Time in Rockdale
The most frequently occuring commute durations in Rockdale are 5 to 9 minutes (369 commuters, 16.2%), 60 to 89 minutes (358 commuters, 15.7%), and 45 to 59 minutes (300 commuters, 13.2%).
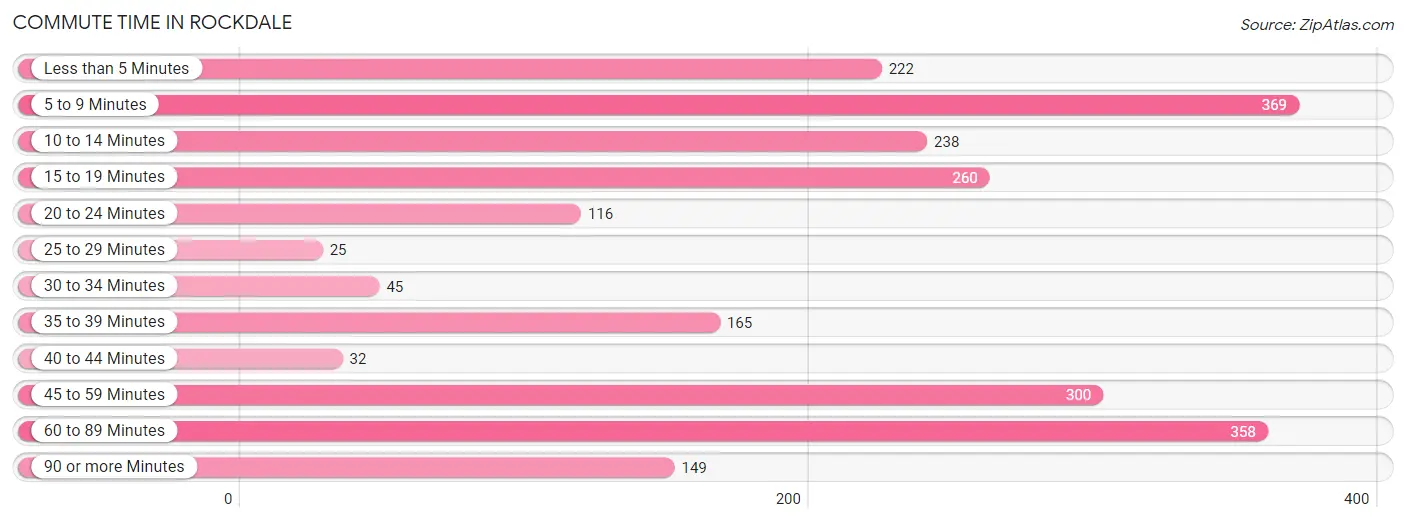
| Commute Time | # Commuters | % Commuters |
| Less than 5 Minutes | 222 | 9.7% |
| 5 to 9 Minutes | 369 | 16.2% |
| 10 to 14 Minutes | 238 | 10.4% |
| 15 to 19 Minutes | 260 | 11.4% |
| 20 to 24 Minutes | 116 | 5.1% |
| 25 to 29 Minutes | 25 | 1.1% |
| 30 to 34 Minutes | 45 | 2.0% |
| 35 to 39 Minutes | 165 | 7.2% |
| 40 to 44 Minutes | 32 | 1.4% |
| 45 to 59 Minutes | 300 | 13.2% |
| 60 to 89 Minutes | 358 | 15.7% |
| 90 or more Minutes | 149 | 6.5% |
Commute Time by Sex in Rockdale
The most common commute times in Rockdale are 5 to 9 minutes (273 commuters, 21.6%) for males and 15 to 19 minutes (199 commuters, 19.6%) for females.
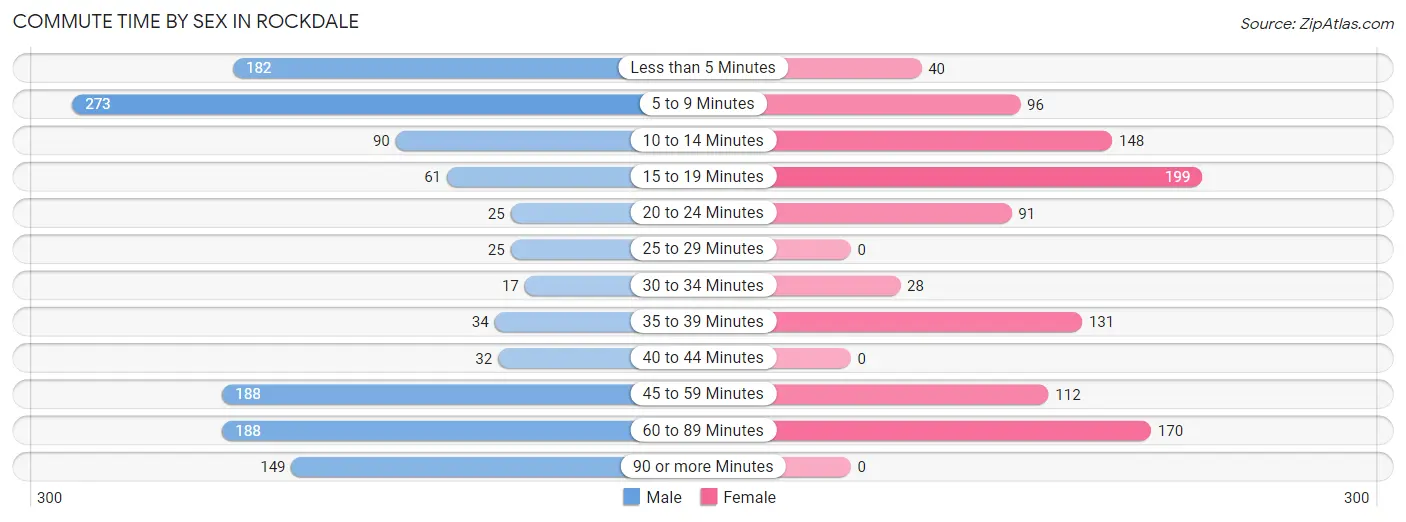
| Commute Time | Male | Female |
| Less than 5 Minutes | 182 (14.4%) | 40 (3.9%) |
| 5 to 9 Minutes | 273 (21.6%) | 96 (9.5%) |
| 10 to 14 Minutes | 90 (7.1%) | 148 (14.6%) |
| 15 to 19 Minutes | 61 (4.8%) | 199 (19.6%) |
| 20 to 24 Minutes | 25 (2.0%) | 91 (9.0%) |
| 25 to 29 Minutes | 25 (2.0%) | 0 (0.0%) |
| 30 to 34 Minutes | 17 (1.3%) | 28 (2.8%) |
| 35 to 39 Minutes | 34 (2.7%) | 131 (12.9%) |
| 40 to 44 Minutes | 32 (2.5%) | 0 (0.0%) |
| 45 to 59 Minutes | 188 (14.9%) | 112 (11.0%) |
| 60 to 89 Minutes | 188 (14.9%) | 170 (16.8%) |
| 90 or more Minutes | 149 (11.8%) | 0 (0.0%) |
Time of Departure to Work by Sex in Rockdale
The most frequent times of departure to work in Rockdale are 6:00 AM to 6:29 AM (288, 22.8%) for males and 8:00 AM to 8:29 AM (348, 34.3%) for females.
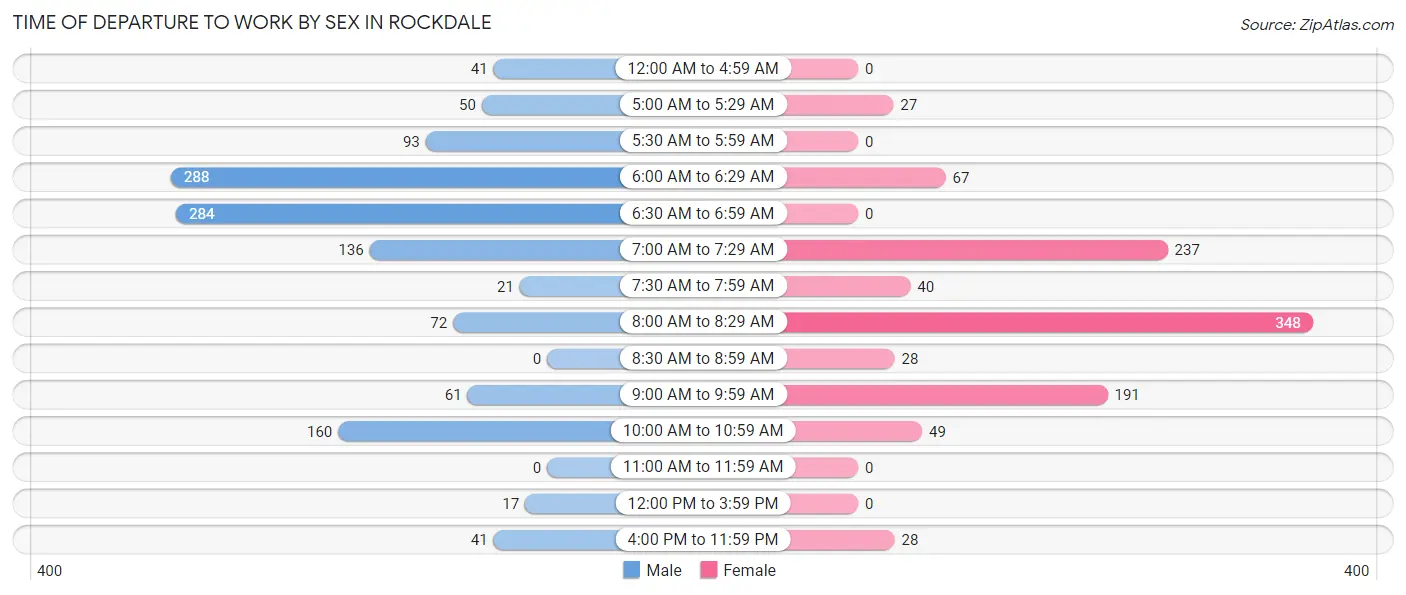
| Time of Departure | Male | Female |
| 12:00 AM to 4:59 AM | 41 (3.2%) | 0 (0.0%) |
| 5:00 AM to 5:29 AM | 50 (4.0%) | 27 (2.7%) |
| 5:30 AM to 5:59 AM | 93 (7.4%) | 0 (0.0%) |
| 6:00 AM to 6:29 AM | 288 (22.8%) | 67 (6.6%) |
| 6:30 AM to 6:59 AM | 284 (22.5%) | 0 (0.0%) |
| 7:00 AM to 7:29 AM | 136 (10.8%) | 237 (23.4%) |
| 7:30 AM to 7:59 AM | 21 (1.7%) | 40 (3.9%) |
| 8:00 AM to 8:29 AM | 72 (5.7%) | 348 (34.3%) |
| 8:30 AM to 8:59 AM | 0 (0.0%) | 28 (2.8%) |
| 9:00 AM to 9:59 AM | 61 (4.8%) | 191 (18.8%) |
| 10:00 AM to 10:59 AM | 160 (12.7%) | 49 (4.8%) |
| 11:00 AM to 11:59 AM | 0 (0.0%) | 0 (0.0%) |
| 12:00 PM to 3:59 PM | 17 (1.3%) | 0 (0.0%) |
| 4:00 PM to 11:59 PM | 41 (3.2%) | 28 (2.8%) |
| Total | 1,264 (100.0%) | 1,015 (100.0%) |
Housing Occupancy in Rockdale
Occupancy by Ownership in Rockdale
Of the total 2,198 dwellings in Rockdale, owner-occupied units account for 1,312 (59.7%), while renter-occupied units make up 886 (40.3%).
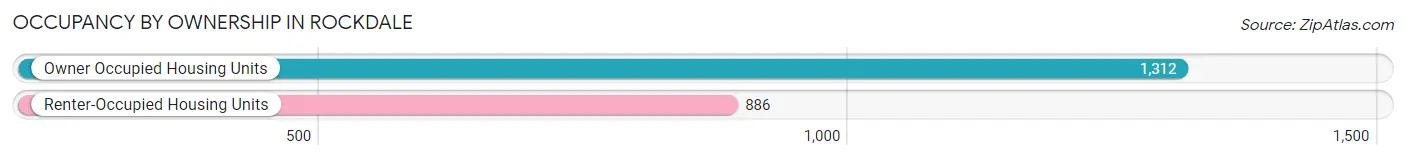
| Occupancy | # Housing Units | % Housing Units |
| Owner Occupied Housing Units | 1,312 | 59.7% |
| Renter-Occupied Housing Units | 886 | 40.3% |
| Total Occupied Housing Units | 2,198 | 100.0% |
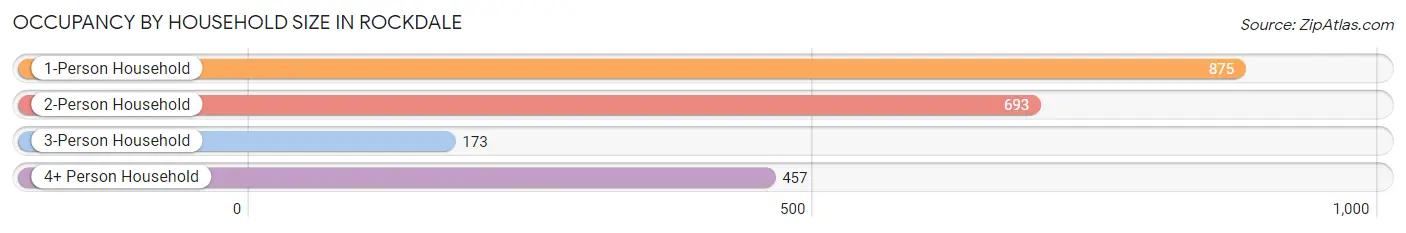
Occupancy by Household Size in Rockdale
| Household Size | # Housing Units | % Housing Units |
| 1-Person Household | 875 | 39.8% |
| 2-Person Household | 693 | 31.5% |
| 3-Person Household | 173 | 7.9% |
| 4+ Person Household | 457 | 20.8% |
| Total Housing Units | 2,198 | 100.0% |
Occupancy by Ownership by Household Size in Rockdale
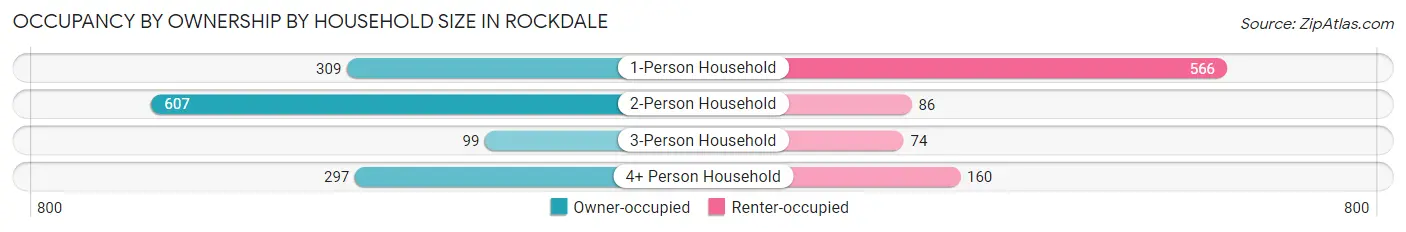
| Household Size | Owner-occupied | Renter-occupied |
| 1-Person Household | 309 (35.3%) | 566 (64.7%) |
| 2-Person Household | 607 (87.6%) | 86 (12.4%) |
| 3-Person Household | 99 (57.2%) | 74 (42.8%) |
| 4+ Person Household | 297 (65.0%) | 160 (35.0%) |
| Total Housing Units | 1,312 (59.7%) | 886 (40.3%) |
Occupancy by Educational Attainment in Rockdale
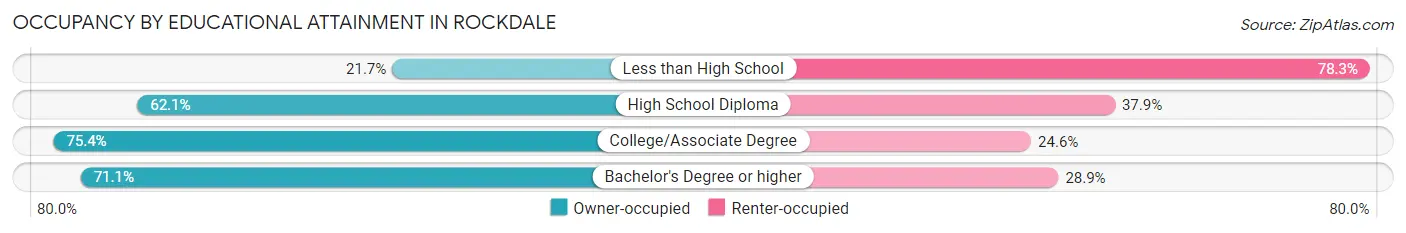
| Household Size | Owner-occupied | Renter-occupied |
| Less than High School | 94 (21.7%) | 339 (78.3%) |
| High School Diploma | 451 (62.1%) | 275 (37.9%) |
| College/Associate Degree | 494 (75.4%) | 161 (24.6%) |
| Bachelor's Degree or higher | 273 (71.1%) | 111 (28.9%) |
Occupancy by Age of Householder in Rockdale
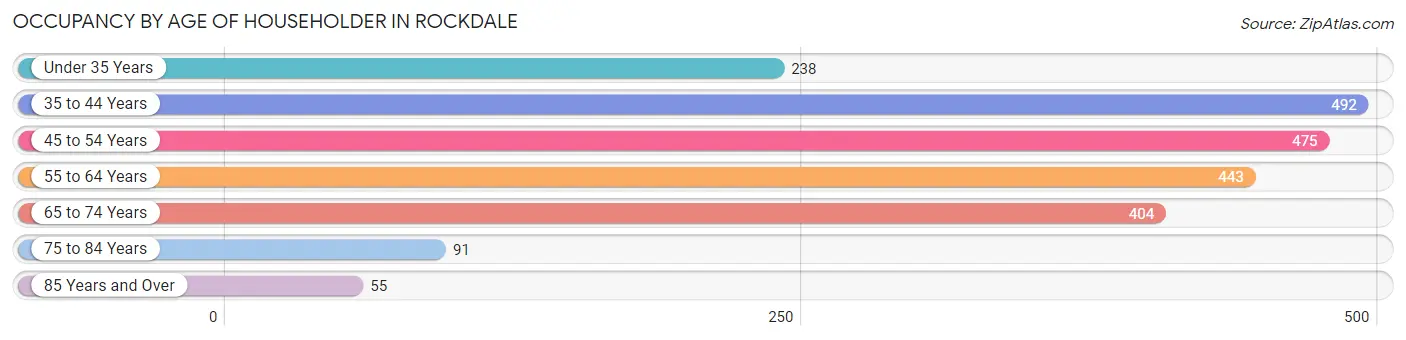
| Age Bracket | # Households | % Households |
| Under 35 Years | 238 | 10.8% |
| 35 to 44 Years | 492 | 22.4% |
| 45 to 54 Years | 475 | 21.6% |
| 55 to 64 Years | 443 | 20.2% |
| 65 to 74 Years | 404 | 18.4% |
| 75 to 84 Years | 91 | 4.1% |
| 85 Years and Over | 55 | 2.5% |
| Total | 2,198 | 100.0% |
Housing Finances in Rockdale
Median Income by Occupancy in Rockdale
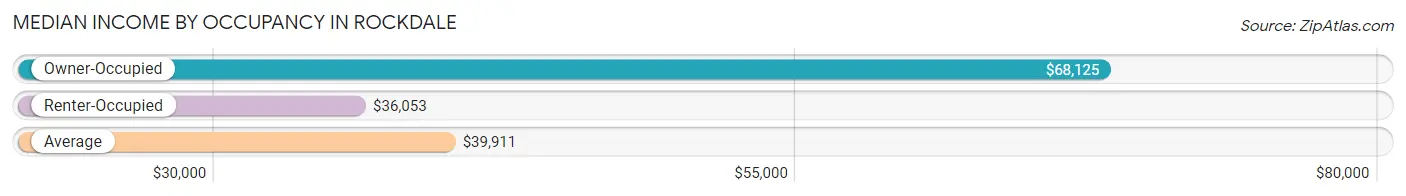
| Occupancy Type | # Households | Median Income |
| Owner-Occupied | 1,312 (59.7%) | $68,125 |
| Renter-Occupied | 886 (40.3%) | $36,053 |
| Average | 2,198 (100.0%) | $39,911 |
Occupancy by Householder Income Bracket in Rockdale
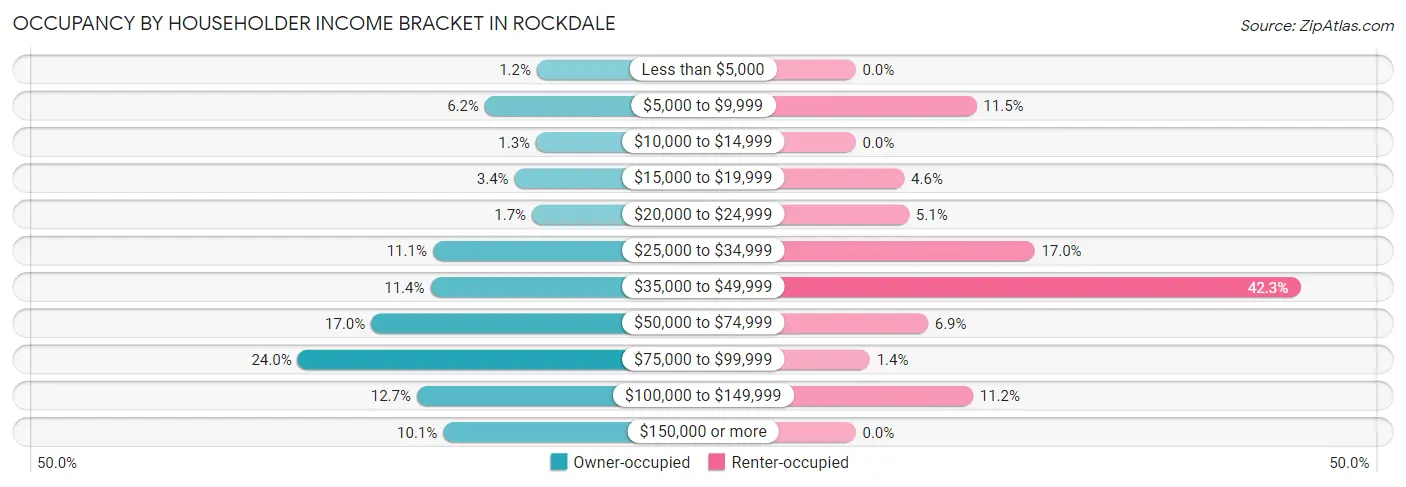
| Income Bracket | Owner-occupied | Renter-occupied |
| Less than $5,000 | 16 (1.2%) | 0 (0.0%) |
| $5,000 to $9,999 | 81 (6.2%) | 102 (11.5%) |
| $10,000 to $14,999 | 17 (1.3%) | 0 (0.0%) |
| $15,000 to $19,999 | 44 (3.4%) | 41 (4.6%) |
| $20,000 to $24,999 | 22 (1.7%) | 45 (5.1%) |
| $25,000 to $34,999 | 146 (11.1%) | 151 (17.0%) |
| $35,000 to $49,999 | 149 (11.4%) | 375 (42.3%) |
| $50,000 to $74,999 | 223 (17.0%) | 61 (6.9%) |
| $75,000 to $99,999 | 315 (24.0%) | 12 (1.3%) |
| $100,000 to $149,999 | 166 (12.7%) | 99 (11.2%) |
| $150,000 or more | 133 (10.1%) | 0 (0.0%) |
| Total | 1,312 (100.0%) | 886 (100.0%) |
Monthly Housing Cost Tiers in Rockdale
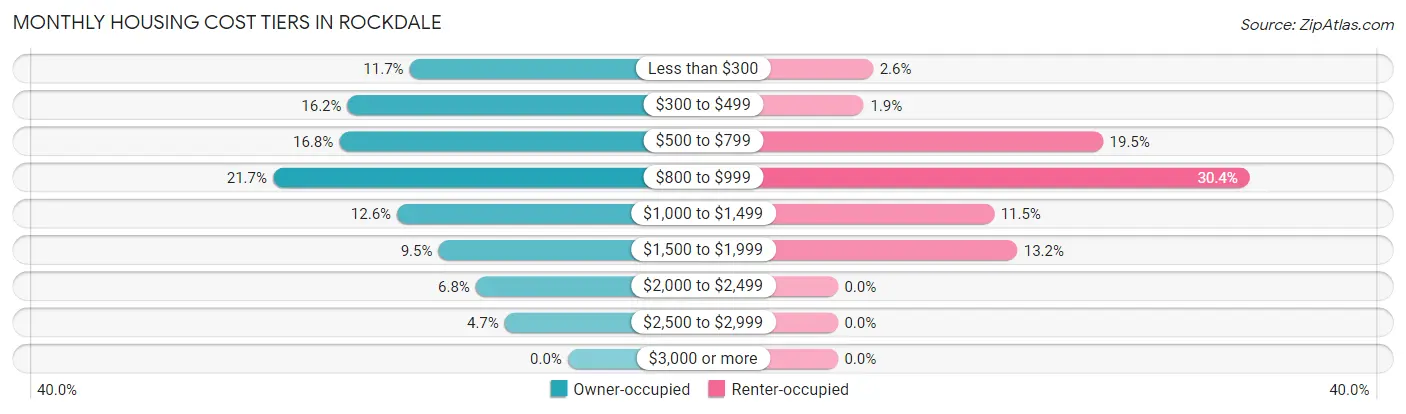
| Monthly Cost | Owner-occupied | Renter-occupied |
| Less than $300 | 153 (11.7%) | 23 (2.6%) |
| $300 to $499 | 213 (16.2%) | 17 (1.9%) |
| $500 to $799 | 221 (16.8%) | 173 (19.5%) |
| $800 to $999 | 285 (21.7%) | 269 (30.4%) |
| $1,000 to $1,499 | 165 (12.6%) | 102 (11.5%) |
| $1,500 to $1,999 | 125 (9.5%) | 117 (13.2%) |
| $2,000 to $2,499 | 89 (6.8%) | 0 (0.0%) |
| $2,500 to $2,999 | 61 (4.6%) | 0 (0.0%) |
| $3,000 or more | 0 (0.0%) | 0 (0.0%) |
| Total | 1,312 (100.0%) | 886 (100.0%) |
Physical Housing Characteristics in Rockdale
Housing Structures in Rockdale
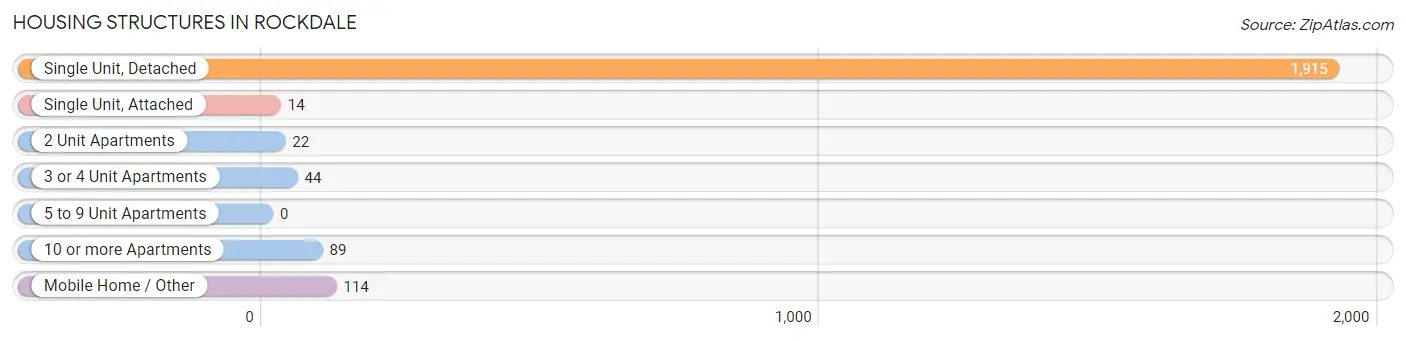
| Structure Type | # Housing Units | % Housing Units |
| Single Unit, Detached | 1,915 | 87.1% |
| Single Unit, Attached | 14 | 0.6% |
| 2 Unit Apartments | 22 | 1.0% |
| 3 or 4 Unit Apartments | 44 | 2.0% |
| 5 to 9 Unit Apartments | 0 | 0.0% |
| 10 or more Apartments | 89 | 4.1% |
| Mobile Home / Other | 114 | 5.2% |
| Total | 2,198 | 100.0% |
Housing Structures by Occupancy in Rockdale
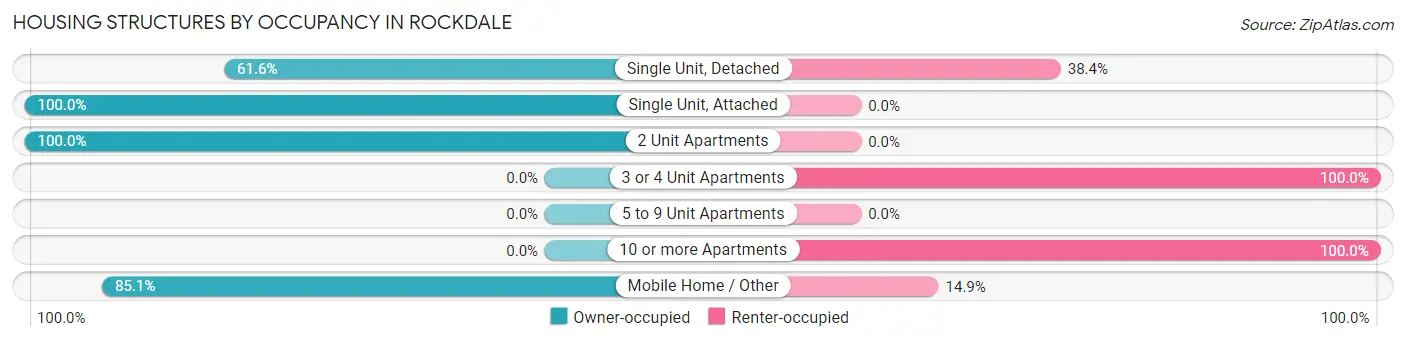
| Structure Type | Owner-occupied | Renter-occupied |
| Single Unit, Detached | 1,179 (61.6%) | 736 (38.4%) |
| Single Unit, Attached | 14 (100.0%) | 0 (0.0%) |
| 2 Unit Apartments | 22 (100.0%) | 0 (0.0%) |
| 3 or 4 Unit Apartments | 0 (0.0%) | 44 (100.0%) |
| 5 to 9 Unit Apartments | 0 (0.0%) | 0 (0.0%) |
| 10 or more Apartments | 0 (0.0%) | 89 (100.0%) |
| Mobile Home / Other | 97 (85.1%) | 17 (14.9%) |
| Total | 1,312 (59.7%) | 886 (40.3%) |
Housing Structures by Number of Rooms in Rockdale
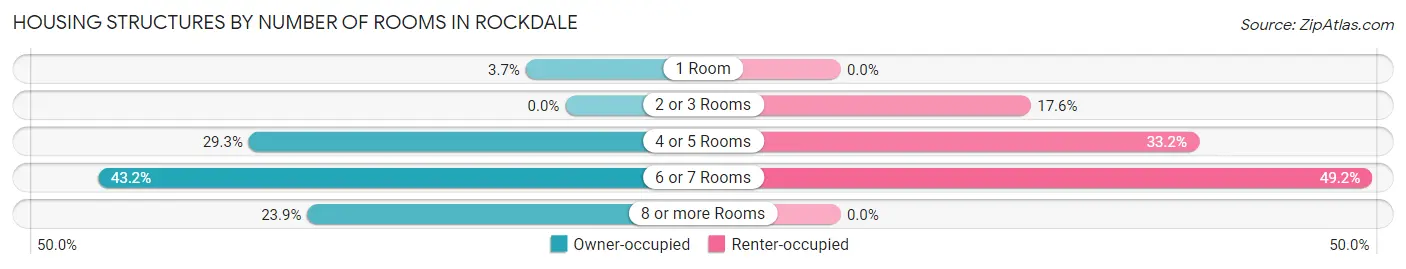
| Number of Rooms | Owner-occupied | Renter-occupied |
| 1 Room | 48 (3.7%) | 0 (0.0%) |
| 2 or 3 Rooms | 0 (0.0%) | 156 (17.6%) |
| 4 or 5 Rooms | 384 (29.3%) | 294 (33.2%) |
| 6 or 7 Rooms | 567 (43.2%) | 436 (49.2%) |
| 8 or more Rooms | 313 (23.9%) | 0 (0.0%) |
| Total | 1,312 (100.0%) | 886 (100.0%) |
Housing Structure by Heating Type in Rockdale
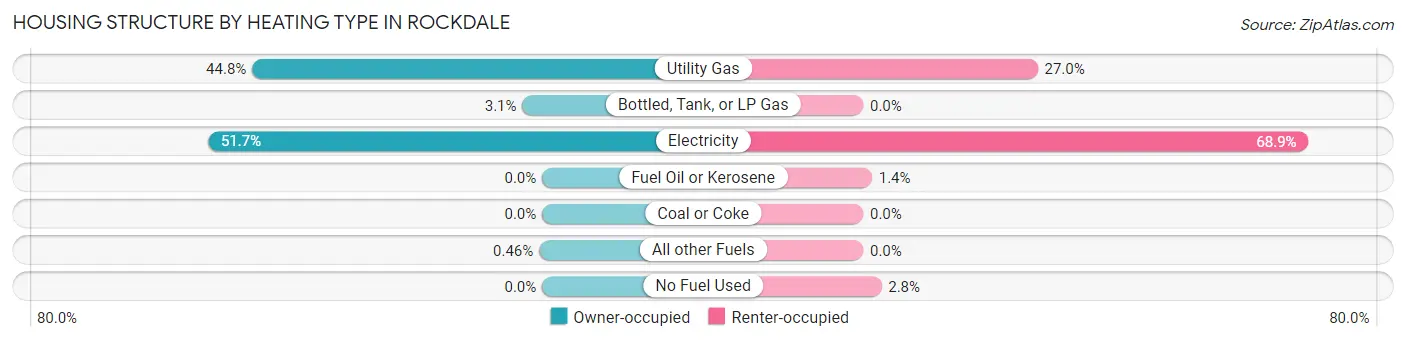
| Heating Type | Owner-occupied | Renter-occupied |
| Utility Gas | 588 (44.8%) | 239 (27.0%) |
| Bottled, Tank, or LP Gas | 40 (3.0%) | 0 (0.0%) |
| Electricity | 678 (51.7%) | 610 (68.9%) |
| Fuel Oil or Kerosene | 0 (0.0%) | 12 (1.3%) |
| Coal or Coke | 0 (0.0%) | 0 (0.0%) |
| All other Fuels | 6 (0.5%) | 0 (0.0%) |
| No Fuel Used | 0 (0.0%) | 25 (2.8%) |
| Total | 1,312 (100.0%) | 886 (100.0%) |
Household Vehicle Usage in Rockdale
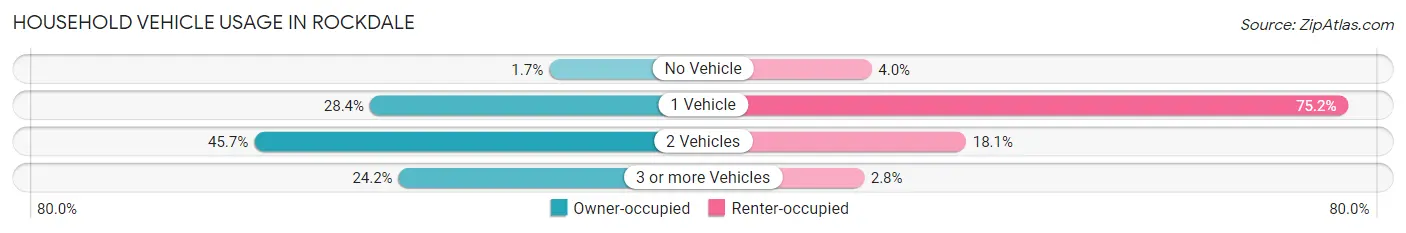
| Vehicles per Household | Owner-occupied | Renter-occupied |
| No Vehicle | 22 (1.7%) | 35 (4.0%) |
| 1 Vehicle | 373 (28.4%) | 666 (75.2%) |
| 2 Vehicles | 600 (45.7%) | 160 (18.1%) |
| 3 or more Vehicles | 317 (24.2%) | 25 (2.8%) |
| Total | 1,312 (100.0%) | 886 (100.0%) |
Real Estate & Mortgages in Rockdale
Real Estate and Mortgage Overview in Rockdale
| Characteristic | Without Mortgage | With Mortgage |
| Housing Units | 874 | 438 |
| Median Property Value | $108,200 | $209,100 |
| Median Household Income | $65,070 | $98 |
| Monthly Housing Costs | $582 | $0 |
| Real Estate Taxes | $2,035 | $20 |
Property Value by Mortgage Status in Rockdale
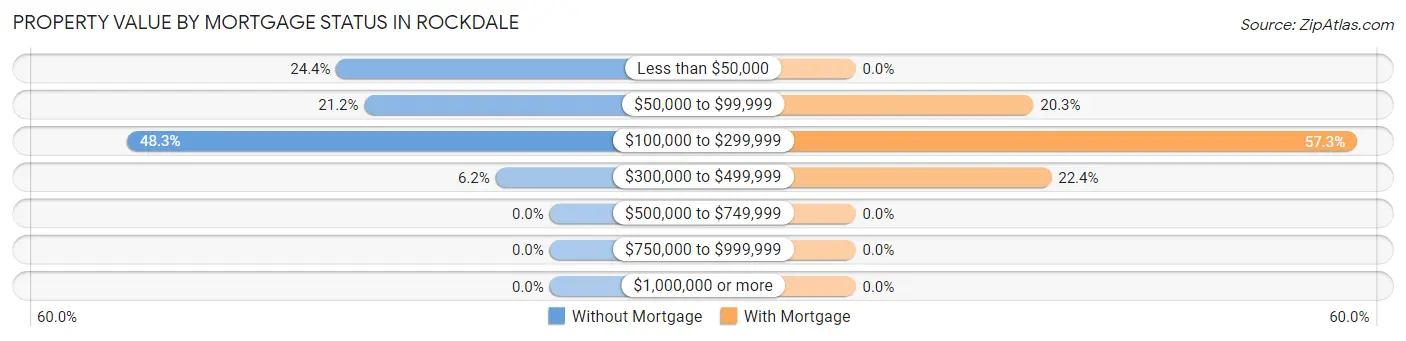
| Property Value | Without Mortgage | With Mortgage |
| Less than $50,000 | 213 (24.4%) | 0 (0.0%) |
| $50,000 to $99,999 | 185 (21.2%) | 89 (20.3%) |
| $100,000 to $299,999 | 422 (48.3%) | 251 (57.3%) |
| $300,000 to $499,999 | 54 (6.2%) | 98 (22.4%) |
| $500,000 to $749,999 | 0 (0.0%) | 0 (0.0%) |
| $750,000 to $999,999 | 0 (0.0%) | 0 (0.0%) |
| $1,000,000 or more | 0 (0.0%) | 0 (0.0%) |
| Total | 874 (100.0%) | 438 (100.0%) |
Household Income by Mortgage Status in Rockdale
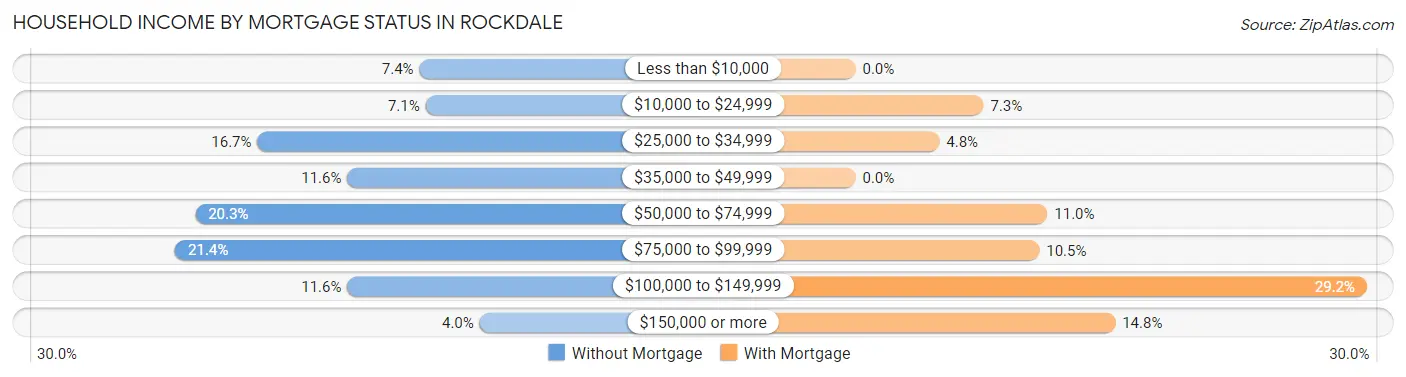
| Household Income | Without Mortgage | With Mortgage |
| Less than $10,000 | 65 (7.4%) | 0 (0.0%) |
| $10,000 to $24,999 | 62 (7.1%) | 32 (7.3%) |
| $25,000 to $34,999 | 146 (16.7%) | 21 (4.8%) |
| $35,000 to $49,999 | 101 (11.6%) | 0 (0.0%) |
| $50,000 to $74,999 | 177 (20.3%) | 48 (11.0%) |
| $75,000 to $99,999 | 187 (21.4%) | 46 (10.5%) |
| $100,000 to $149,999 | 101 (11.6%) | 128 (29.2%) |
| $150,000 or more | 35 (4.0%) | 65 (14.8%) |
| Total | 874 (100.0%) | 438 (100.0%) |
Property Value to Household Income Ratio in Rockdale
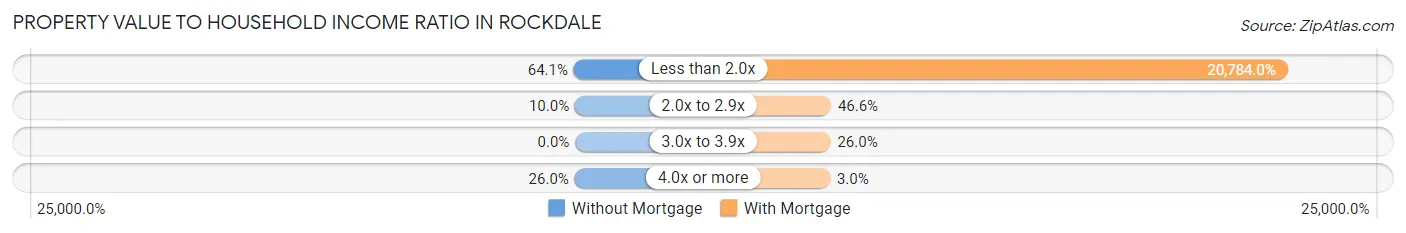
| Value-to-Income Ratio | Without Mortgage | With Mortgage |
| Less than 2.0x | 560 (64.1%) | 91,034 (20,784.0%) |
| 2.0x to 2.9x | 87 (10.0%) | 204 (46.6%) |
| 3.0x to 3.9x | 0 (0.0%) | 114 (26.0%) |
| 4.0x or more | 227 (26.0%) | 13 (3.0%) |
| Total | 874 (100.0%) | 438 (100.0%) |
Real Estate Taxes by Mortgage Status in Rockdale
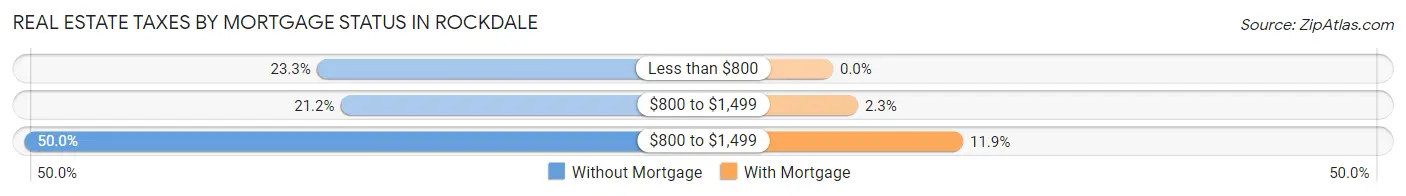
| Property Taxes | Without Mortgage | With Mortgage |
| Less than $800 | 204 (23.3%) | 0 (0.0%) |
| $800 to $1,499 | 185 (21.2%) | 10 (2.3%) |
| $800 to $1,499 | 437 (50.0%) | 52 (11.9%) |
| Total | 874 (100.0%) | 438 (100.0%) |
Health & Disability in Rockdale
Health Insurance Coverage by Age in Rockdale
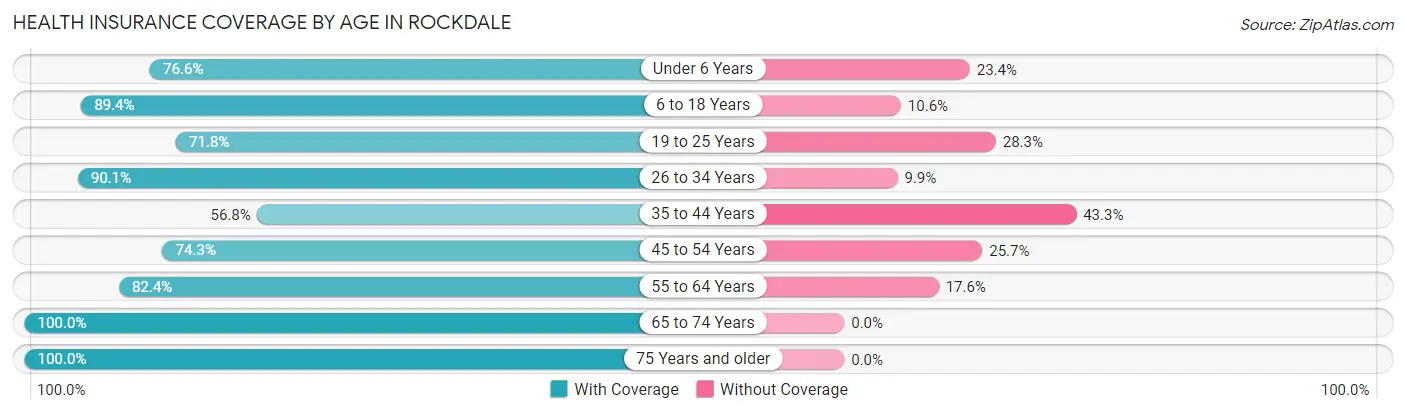
| Age Bracket | With Coverage | Without Coverage |
| Under 6 Years | 239 (76.6%) | 73 (23.4%) |
| 6 to 18 Years | 932 (89.4%) | 110 (10.6%) |
| 19 to 25 Years | 320 (71.8%) | 126 (28.2%) |
| 26 to 34 Years | 454 (90.1%) | 50 (9.9%) |
| 35 to 44 Years | 370 (56.8%) | 282 (43.2%) |
| 45 to 54 Years | 589 (74.3%) | 204 (25.7%) |
| 55 to 64 Years | 501 (82.4%) | 107 (17.6%) |
| 65 to 74 Years | 592 (100.0%) | 0 (0.0%) |
| 75 Years and older | 338 (100.0%) | 0 (0.0%) |
| Total | 4,335 (82.0%) | 952 (18.0%) |
Health Insurance Coverage by Citizenship Status in Rockdale
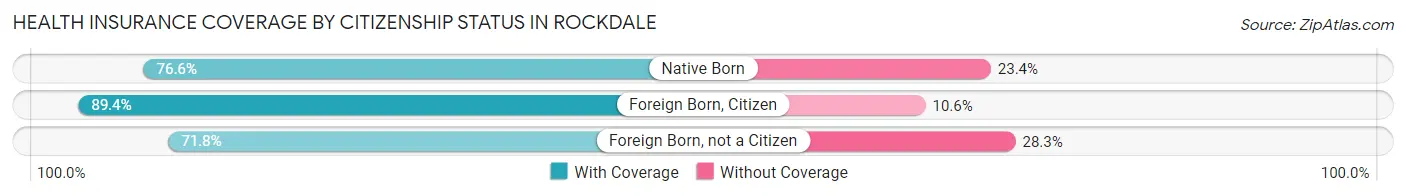
| Citizenship Status | With Coverage | Without Coverage |
| Native Born | 239 (76.6%) | 73 (23.4%) |
| Foreign Born, Citizen | 932 (89.4%) | 110 (10.6%) |
| Foreign Born, not a Citizen | 320 (71.8%) | 126 (28.2%) |
Health Insurance Coverage by Household Income in Rockdale
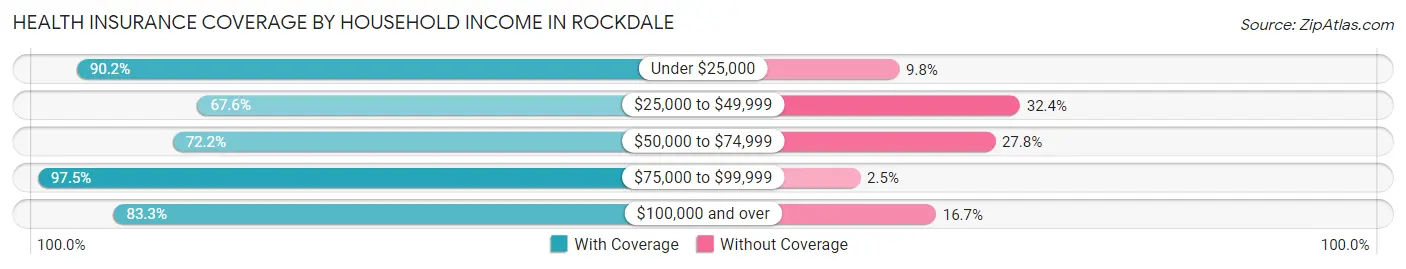
| Household Income | With Coverage | Without Coverage |
| Under $25,000 | 635 (90.2%) | 69 (9.8%) |
| $25,000 to $49,999 | 1,020 (67.6%) | 489 (32.4%) |
| $50,000 to $74,999 | 484 (72.2%) | 186 (27.8%) |
| $75,000 to $99,999 | 1,326 (97.5%) | 34 (2.5%) |
| $100,000 and over | 870 (83.3%) | 174 (16.7%) |
Public vs Private Health Insurance Coverage by Age in Rockdale
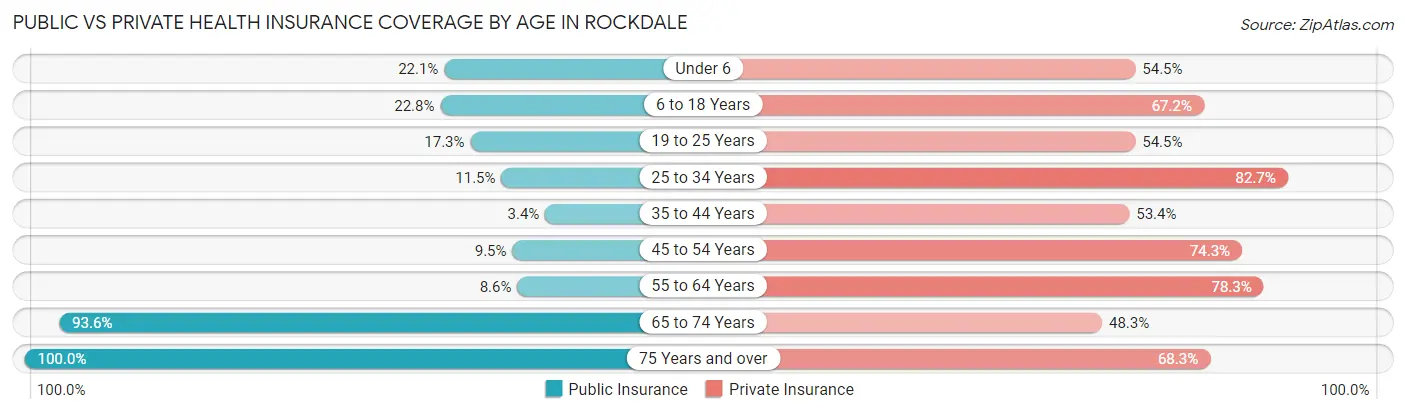
| Age Bracket | Public Insurance | Private Insurance |
| Under 6 | 69 (22.1%) | 170 (54.5%) |
| 6 to 18 Years | 238 (22.8%) | 700 (67.2%) |
| 19 to 25 Years | 77 (17.3%) | 243 (54.5%) |
| 25 to 34 Years | 58 (11.5%) | 417 (82.7%) |
| 35 to 44 Years | 22 (3.4%) | 348 (53.4%) |
| 45 to 54 Years | 75 (9.5%) | 589 (74.3%) |
| 55 to 64 Years | 52 (8.6%) | 476 (78.3%) |
| 65 to 74 Years | 554 (93.6%) | 286 (48.3%) |
| 75 Years and over | 338 (100.0%) | 231 (68.3%) |
| Total | 1,483 (28.1%) | 3,460 (65.4%) |
Disability Status by Sex by Age in Rockdale
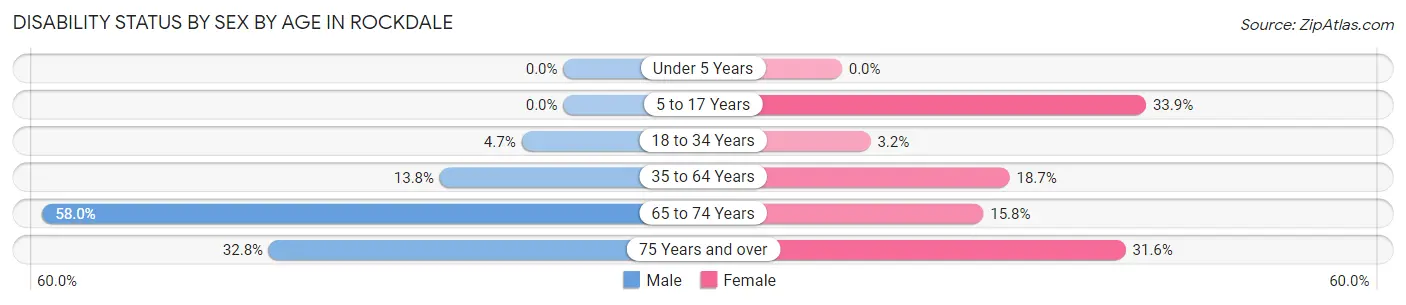
| Age Bracket | Male | Female |
| Under 5 Years | 0 (0.0%) | 0 (0.0%) |
| 5 to 17 Years | 0 (0.0%) | 185 (33.9%) |
| 18 to 34 Years | 21 (4.7%) | 21 (3.2%) |
| 35 to 64 Years | 155 (13.8%) | 173 (18.7%) |
| 65 to 74 Years | 163 (58.0%) | 49 (15.8%) |
| 75 Years and over | 60 (32.8%) | 49 (31.6%) |
Disability Class by Sex by Age in Rockdale
Disability Class: Hearing Difficulty
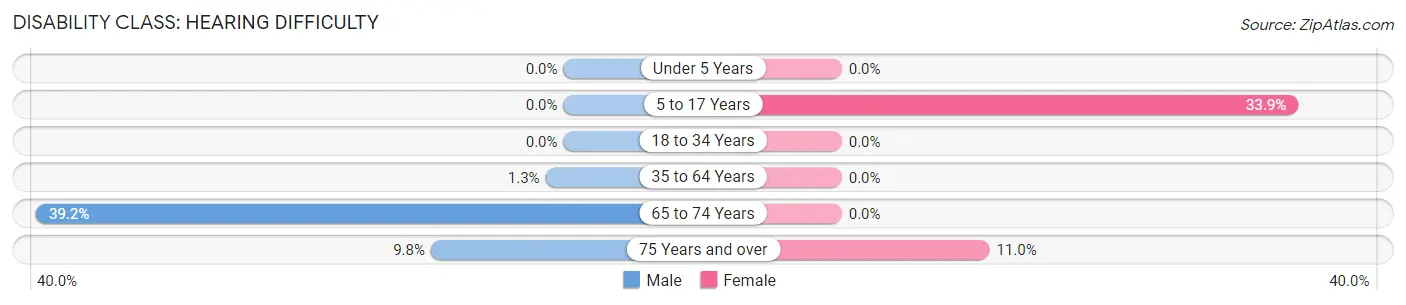
| Age Bracket | Male | Female |
| Under 5 Years | 0 (0.0%) | 0 (0.0%) |
| 5 to 17 Years | 0 (0.0%) | 185 (33.9%) |
| 18 to 34 Years | 0 (0.0%) | 0 (0.0%) |
| 35 to 64 Years | 15 (1.3%) | 0 (0.0%) |
| 65 to 74 Years | 110 (39.2%) | 0 (0.0%) |
| 75 Years and over | 18 (9.8%) | 17 (11.0%) |
Disability Class: Vision Difficulty
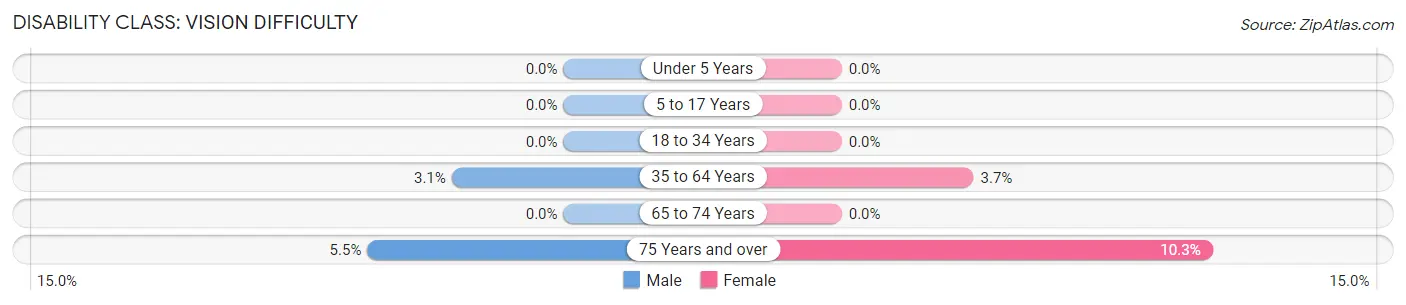
| Age Bracket | Male | Female |
| Under 5 Years | 0 (0.0%) | 0 (0.0%) |
| 5 to 17 Years | 0 (0.0%) | 0 (0.0%) |
| 18 to 34 Years | 0 (0.0%) | 0 (0.0%) |
| 35 to 64 Years | 35 (3.1%) | 34 (3.7%) |
| 65 to 74 Years | 0 (0.0%) | 0 (0.0%) |
| 75 Years and over | 10 (5.5%) | 16 (10.3%) |
Disability Class: Cognitive Difficulty
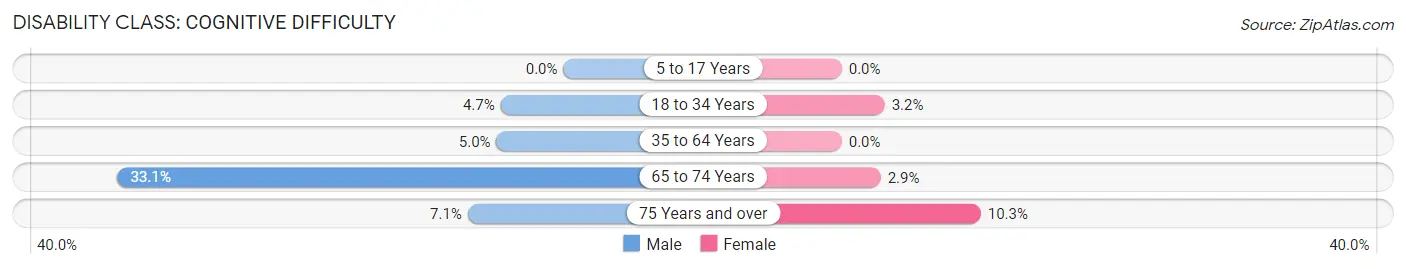
| Age Bracket | Male | Female |
| 5 to 17 Years | 0 (0.0%) | 0 (0.0%) |
| 18 to 34 Years | 21 (4.7%) | 21 (3.2%) |
| 35 to 64 Years | 56 (5.0%) | 0 (0.0%) |
| 65 to 74 Years | 93 (33.1%) | 9 (2.9%) |
| 75 Years and over | 13 (7.1%) | 16 (10.3%) |
Disability Class: Ambulatory Difficulty
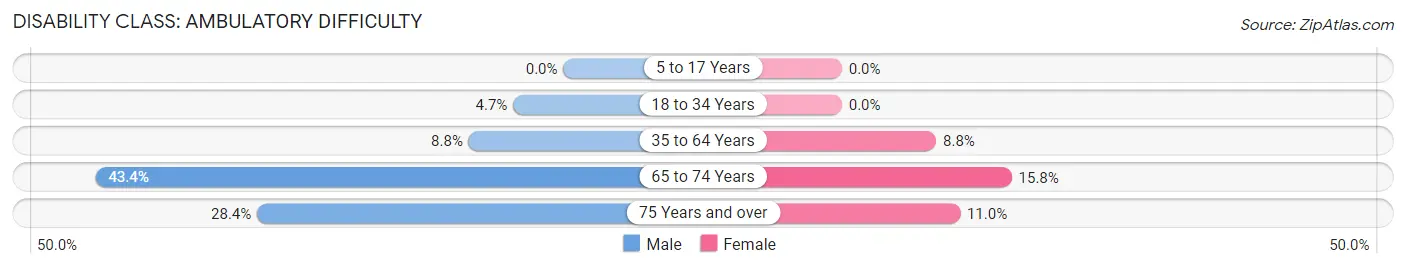
| Age Bracket | Male | Female |
| 5 to 17 Years | 0 (0.0%) | 0 (0.0%) |
| 18 to 34 Years | 21 (4.7%) | 0 (0.0%) |
| 35 to 64 Years | 99 (8.8%) | 81 (8.7%) |
| 65 to 74 Years | 122 (43.4%) | 49 (15.8%) |
| 75 Years and over | 52 (28.4%) | 17 (11.0%) |
Disability Class: Self-Care Difficulty
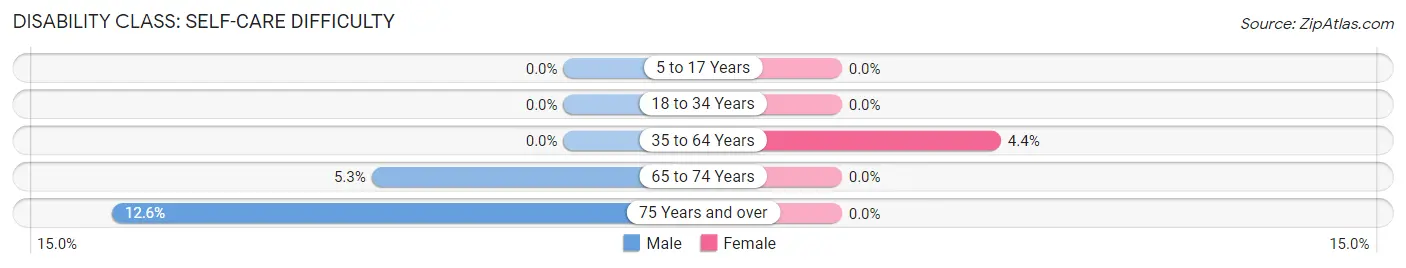
| Age Bracket | Male | Female |
| 5 to 17 Years | 0 (0.0%) | 0 (0.0%) |
| 18 to 34 Years | 0 (0.0%) | 0 (0.0%) |
| 35 to 64 Years | 0 (0.0%) | 41 (4.4%) |
| 65 to 74 Years | 15 (5.3%) | 0 (0.0%) |
| 75 Years and over | 23 (12.6%) | 0 (0.0%) |
Technology Access in Rockdale
Computing Device Access in Rockdale
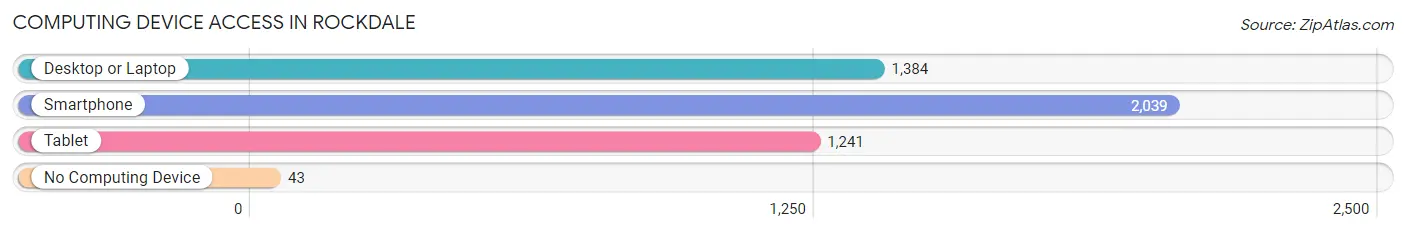
| Device Type | # Households | % Households |
| Desktop or Laptop | 1,384 | 63.0% |
| Smartphone | 2,039 | 92.8% |
| Tablet | 1,241 | 56.5% |
| No Computing Device | 43 | 2.0% |
| Total | 2,198 | 100.0% |
Internet Access in Rockdale
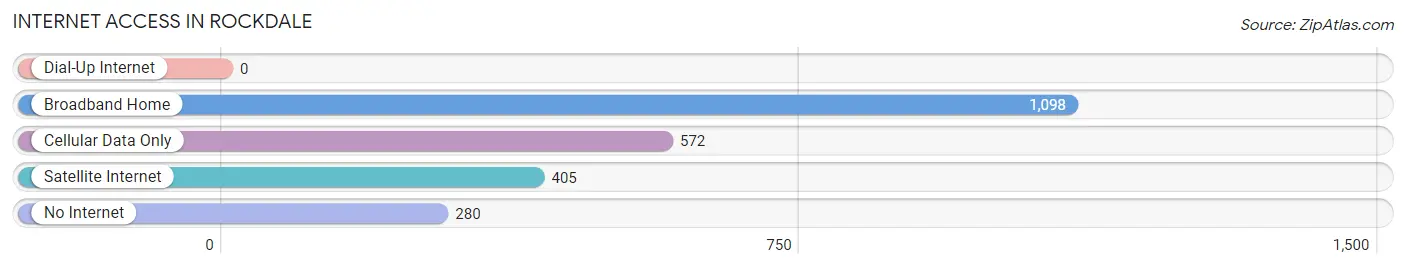
| Internet Type | # Households | % Households |
| Dial-Up Internet | 0 | 0.0% |
| Broadband Home | 1,098 | 49.9% |
| Cellular Data Only | 572 | 26.0% |
| Satellite Internet | 405 | 18.4% |
| No Internet | 280 | 12.7% |
| Total | 2,198 | 100.0% |
Rockdale Summary
Rockdale, Texas is a small city located in Milam County, Texas, United States. It is situated about 40 miles east of Austin and is part of the Killeen-Temple-Fort Hood Metropolitan Statistical Area. The city has a population of 5,851 as of the 2010 census.
History
Rockdale was founded in 1873 by the International-Great Northern Railroad. The city was named after a nearby rock formation. The first post office was established in 1874. The city was incorporated in 1876 and the first mayor was elected in 1877.
In the late 19th century, Rockdale was a major center for cotton production and processing. The city was also home to several brickyards and a large lumber mill.
Geography
Rockdale is located at the intersection of U.S. Highway 79 and State Highway 77. It is situated about 40 miles east of Austin and is part of the Killeen-Temple-Fort Hood Metropolitan Statistical Area. The city has a total area of 4.2 square miles, all of which is land.
Economy
Rockdale’s economy is largely based on agriculture and manufacturing. The city is home to several large employers, including Alcoa, which operates an aluminum smelter and a power plant in the city. Other major employers include Rockdale Resources, a coal-fired power plant, and the Rockdale Independent School District.
Demographics
As of the 2010 census, Rockdale had a population of 5,851. The racial makeup of the city was 73.3% White, 17.2% African American, 0.4% Native American, 0.3% Asian, 6.7% from other races, and 2.1% from two or more races. Hispanic or Latino of any race were 18.2% of the population.
The median income for a household in Rockdale was $35,938, and the median income for a family was $41,944. The per capita income for the city was $17,845. About 17.2% of families and 20.2% of the population were below the poverty line, including 28.2% of those under age 18 and 14.2% of those age 65 or over.
Rockdale is served by the Rockdale Independent School District, which includes three elementary schools, one middle school, and one high school. The city is also home to several churches, including the First United Methodist Church, the First Baptist Church, and the Church of Christ.
Rockdale is a small city with a rich history and a diverse population. It is home to several large employers and is served by the Rockdale Independent School District. The city has a median income of $35,938 and a poverty rate of 17.2%. Rockdale is a great place to live and work, and is a great example of a small Texas town.
Common Questions
What is Per Capita Income in Rockdale?
Per Capita income in Rockdale is $37,086.
What is the Median Family Income in Rockdale?
Median Family Income in Rockdale is $83,984.
What is the Median Household income in Rockdale?
Median Household Income in Rockdale is $39,911.
What is Income or Wage Gap in Rockdale?
Income or Wage Gap in Rockdale is 24.5%.
Women in Rockdale earn 75.5 cents for every dollar earned by a man.
What is Family Income Deficit in Rockdale?
Family Income Deficit in Rockdale is $13,138.
Families that are below poverty line in Rockdale earn $13,138 less on average than the poverty threshold level.
What is Inequality or Gini Index in Rockdale?
Inequality or Gini Index in Rockdale is 0.58.
What is the Total Population of Rockdale?
Total Population of Rockdale is 5,424.
What is the Total Male Population of Rockdale?
Total Male Population of Rockdale is 2,574.
What is the Total Female Population of Rockdale?
Total Female Population of Rockdale is 2,850.
What is the Ratio of Males per 100 Females in Rockdale?
There are 90.32 Males per 100 Females in Rockdale.
What is the Ratio of Females per 100 Males in Rockdale?
There are 110.72 Females per 100 Males in Rockdale.
What is the Median Population Age in Rockdale?
Median Population Age in Rockdale is 40.1 Years.
What is the Average Family Size in Rockdale
Average Family Size in Rockdale is 3.5 People.
What is the Average Household Size in Rockdale
Average Household Size in Rockdale is 2.4 People.
How Large is the Labor Force in Rockdale?
There are 2,752 People in the Labor Forcein in Rockdale.
What is the Percentage of People in the Labor Force in Rockdale?
62.1% of People are in the Labor Force in Rockdale.
What is the Unemployment Rate in Rockdale?
Unemployment Rate in Rockdale is 4.6%.