Rio Grande City, TX Map & Demographics
Rio Grande City Map
Rio Grande City Overview
$20,612
PER CAPITA INCOME
$46,791
AVG FAMILY INCOME
$44,307
AVG HOUSEHOLD INCOME
7.2%
WAGE / INCOME GAP [ % ]
92.8¢/ $1
WAGE / INCOME GAP [ $ ]
0.55
INEQUALITY / GINI INDEX
15,256
TOTAL POPULATION
7,805
MALE POPULATION
7,451
FEMALE POPULATION
104.75
MALES / 100 FEMALES
95.46
FEMALES / 100 MALES
30.2
MEDIAN AGE
3.8
AVG FAMILY SIZE
3.3
AVG HOUSEHOLD SIZE
6,545
LABOR FORCE [ PEOPLE ]
60.1%
PERCENT IN LABOR FORCE
8.9%
UNEMPLOYMENT RATE
Rio Grande City Zip Codes
Rio Grande City Area Codes
Income in Rio Grande City
Income Overview in Rio Grande City
Per Capita Income in Rio Grande City is $20,612, while median incomes of families and households are $46,791 and $44,307 respectively.
| Characteristic | Number | Measure |
| Per Capita Income | 15,256 | $20,612 |
| Median Family Income | 3,553 | $46,791 |
| Mean Family Income | 3,553 | $73,734 |
| Median Household Income | 4,471 | $44,307 |
| Mean Household Income | 4,471 | $65,307 |
| Income Deficit | 3,553 | $0 |
| Wage / Income Gap (%) | 15,256 | 7.20% |
| Wage / Income Gap ($) | 15,256 | 92.80¢ per $1 |
| Gini / Inequality Index | 15,256 | 0.55 |
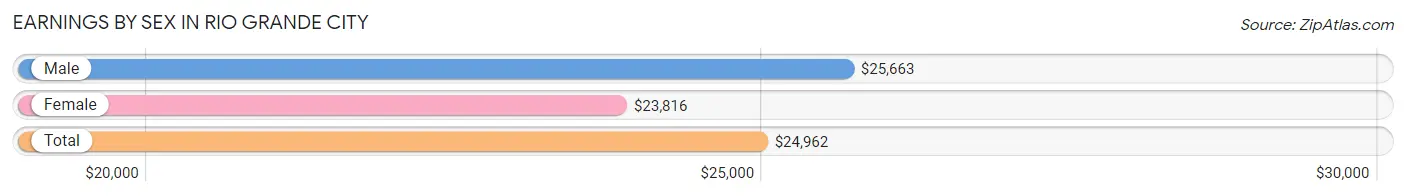
Earnings by Sex in Rio Grande City
Average Earnings in Rio Grande City are $24,962, $25,663 for men and $23,816 for women, a difference of 7.2%.
| Sex | Number | Average Earnings |
| Male | 3,641 (52.7%) | $25,663 |
| Female | 3,268 (47.3%) | $23,816 |
| Total | 6,909 (100.0%) | $24,962 |
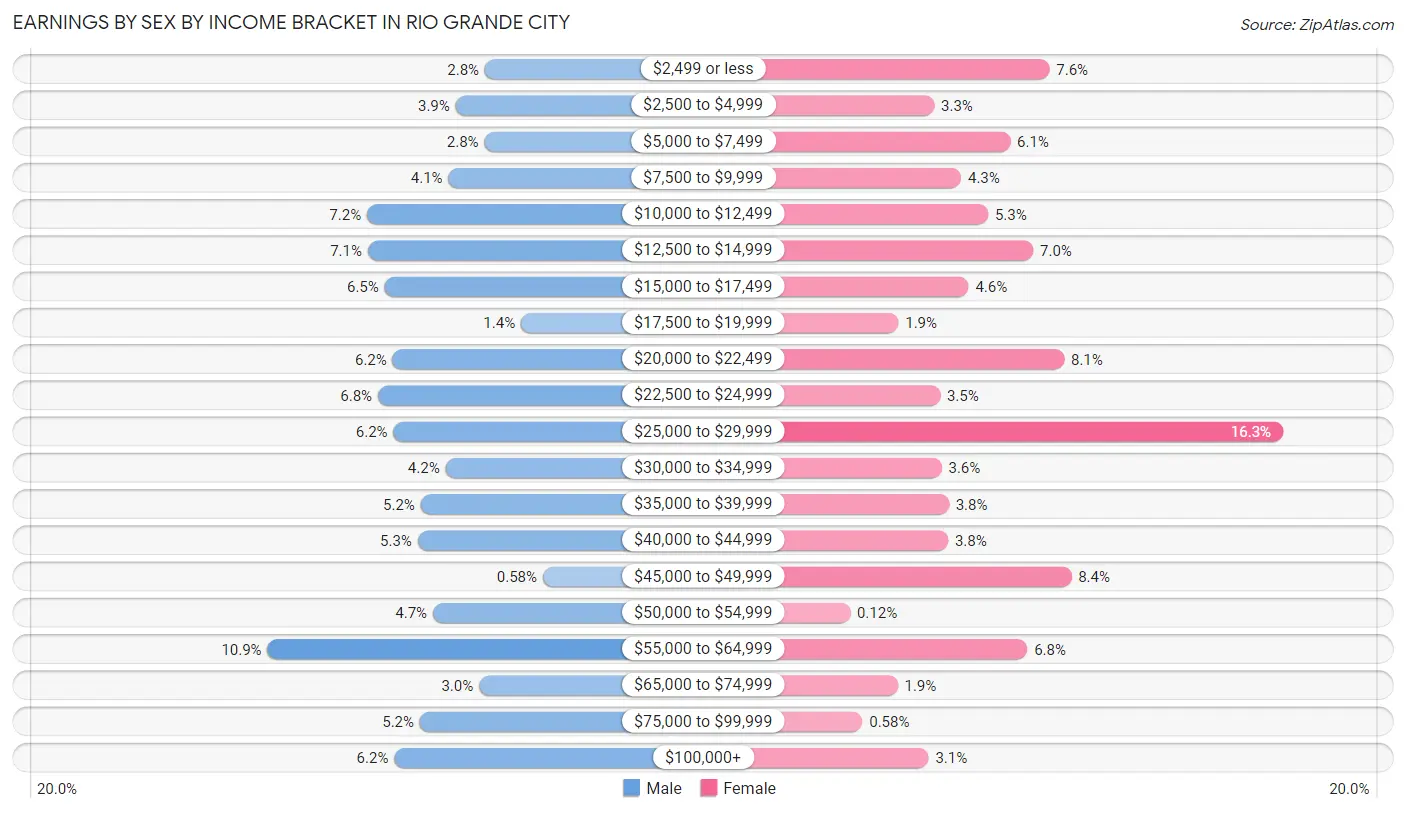
Earnings by Sex by Income Bracket in Rio Grande City
The most common earnings brackets in Rio Grande City are $55,000 to $64,999 for men (397 | 10.9%) and $25,000 to $29,999 for women (534 | 16.3%).
| Income | Male | Female |
| $2,499 or less | 100 (2.8%) | 248 (7.6%) |
| $2,500 to $4,999 | 140 (3.8%) | 107 (3.3%) |
| $5,000 to $7,499 | 101 (2.8%) | 200 (6.1%) |
| $7,500 to $9,999 | 150 (4.1%) | 140 (4.3%) |
| $10,000 to $12,499 | 261 (7.2%) | 173 (5.3%) |
| $12,500 to $14,999 | 260 (7.1%) | 228 (7.0%) |
| $15,000 to $17,499 | 237 (6.5%) | 149 (4.6%) |
| $17,500 to $19,999 | 51 (1.4%) | 63 (1.9%) |
| $20,000 to $22,499 | 226 (6.2%) | 266 (8.1%) |
| $22,500 to $24,999 | 246 (6.8%) | 114 (3.5%) |
| $25,000 to $29,999 | 225 (6.2%) | 534 (16.3%) |
| $30,000 to $34,999 | 154 (4.2%) | 116 (3.5%) |
| $35,000 to $39,999 | 188 (5.2%) | 125 (3.8%) |
| $40,000 to $44,999 | 192 (5.3%) | 124 (3.8%) |
| $45,000 to $49,999 | 21 (0.6%) | 275 (8.4%) |
| $50,000 to $54,999 | 171 (4.7%) | 4 (0.1%) |
| $55,000 to $64,999 | 397 (10.9%) | 221 (6.8%) |
| $65,000 to $74,999 | 108 (3.0%) | 62 (1.9%) |
| $75,000 to $99,999 | 189 (5.2%) | 19 (0.6%) |
| $100,000+ | 224 (6.1%) | 100 (3.1%) |
| Total | 3,641 (100.0%) | 3,268 (100.0%) |
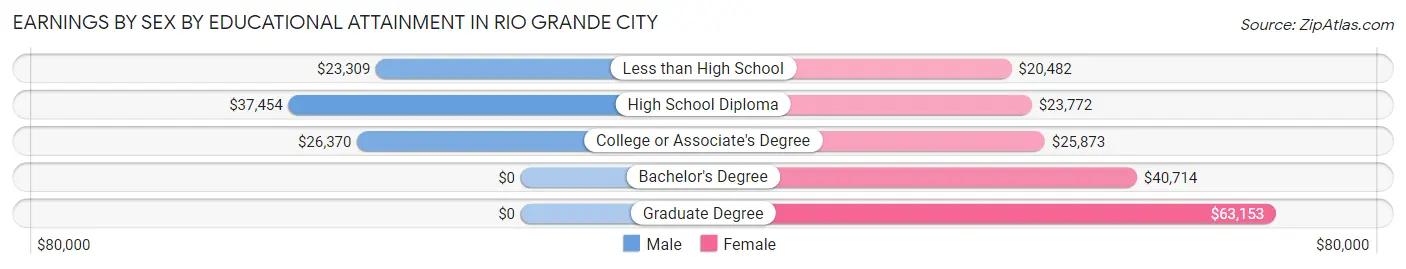
Earnings by Sex by Educational Attainment in Rio Grande City
Average earnings in Rio Grande City are $30,514 for men and $26,178 for women, a difference of 14.2%. Men with an educational attainment of high school diploma enjoy the highest average annual earnings of $37,454, while those with less than high school education earn the least with $23,309. Women with an educational attainment of graduate degree earn the most with the average annual earnings of $63,153, while those with less than high school education have the smallest earnings of $20,482.
| Educational Attainment | Male Income | Female Income |
| Less than High School | $23,309 | $20,482 |
| High School Diploma | $37,454 | $23,772 |
| College or Associate's Degree | $26,370 | $25,873 |
| Bachelor's Degree | - | - |
| Graduate Degree | - | - |
| Total | $30,514 | $26,178 |
Family Income in Rio Grande City
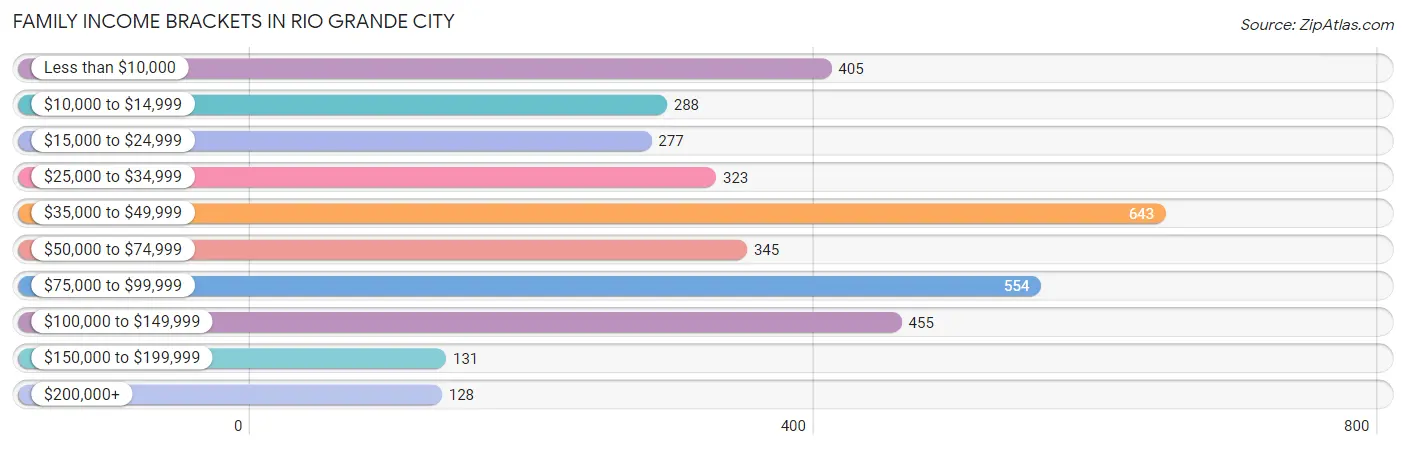
Family Income Brackets in Rio Grande City
According to the Rio Grande City family income data, there are 643 families falling into the $35,000 to $49,999 income range, which is the most common income bracket and makes up 18.1% of all families. Conversely, the $200,000+ income bracket is the least frequent group with only 128 families (3.6%) belonging to this category.
| Income Bracket | # Families | % Families |
| Less than $10,000 | 405 | 11.4% |
| $10,000 to $14,999 | 288 | 8.1% |
| $15,000 to $24,999 | 277 | 7.8% |
| $25,000 to $34,999 | 323 | 9.1% |
| $35,000 to $49,999 | 643 | 18.1% |
| $50,000 to $74,999 | 345 | 9.7% |
| $75,000 to $99,999 | 554 | 15.6% |
| $100,000 to $149,999 | 455 | 12.8% |
| $150,000 to $199,999 | 131 | 3.7% |
| $200,000+ | 128 | 3.6% |
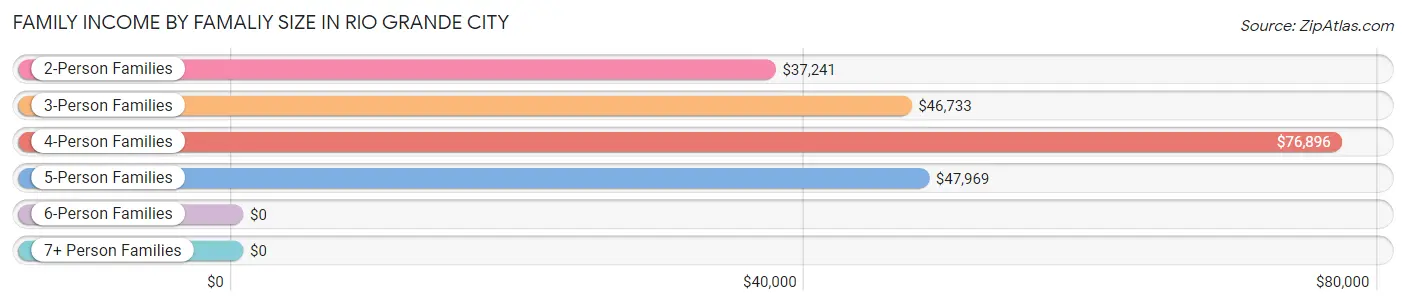
Family Income by Famaliy Size in Rio Grande City
4-person families (839 | 23.6%) account for the highest median family income in Rio Grande City with $76,896 per family, while 4-person families (839 | 23.6%) have the highest median income of $19,224 per family member.
| Income Bracket | # Families | Median Income |
| 2-Person Families | 1,214 (34.2%) | $37,241 |
| 3-Person Families | 862 (24.3%) | $46,733 |
| 4-Person Families | 839 (23.6%) | $76,896 |
| 5-Person Families | 515 (14.5%) | $47,969 |
| 6-Person Families | 75 (2.1%) | $0 |
| 7+ Person Families | 48 (1.3%) | $0 |
| Total | 3,553 (100.0%) | $46,791 |
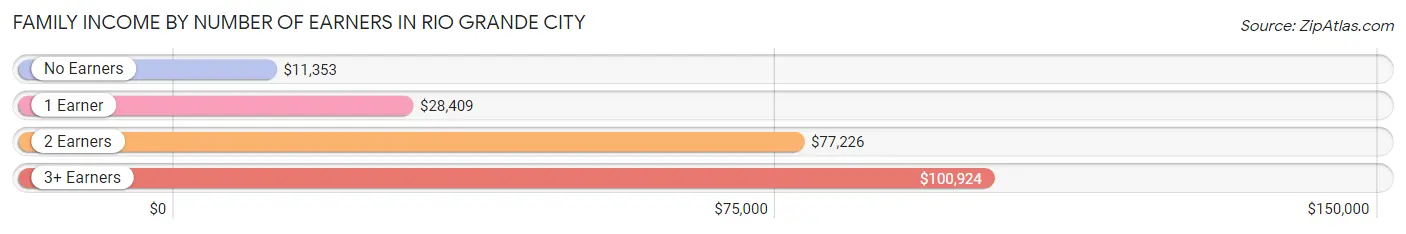
Family Income by Number of Earners in Rio Grande City
The median family income in Rio Grande City is $46,791, with families comprising 3+ earners (321) having the highest median family income of $100,924, while families with no earners (415) have the lowest median family income of $11,353, accounting for 9.0% and 11.7% of families, respectively.
| Number of Earners | # Families | Median Income |
| No Earners | 415 (11.7%) | $11,353 |
| 1 Earner | 1,410 (39.7%) | $28,409 |
| 2 Earners | 1,407 (39.6%) | $77,226 |
| 3+ Earners | 321 (9.0%) | $100,924 |
| Total | 3,553 (100.0%) | $46,791 |
Household Income in Rio Grande City
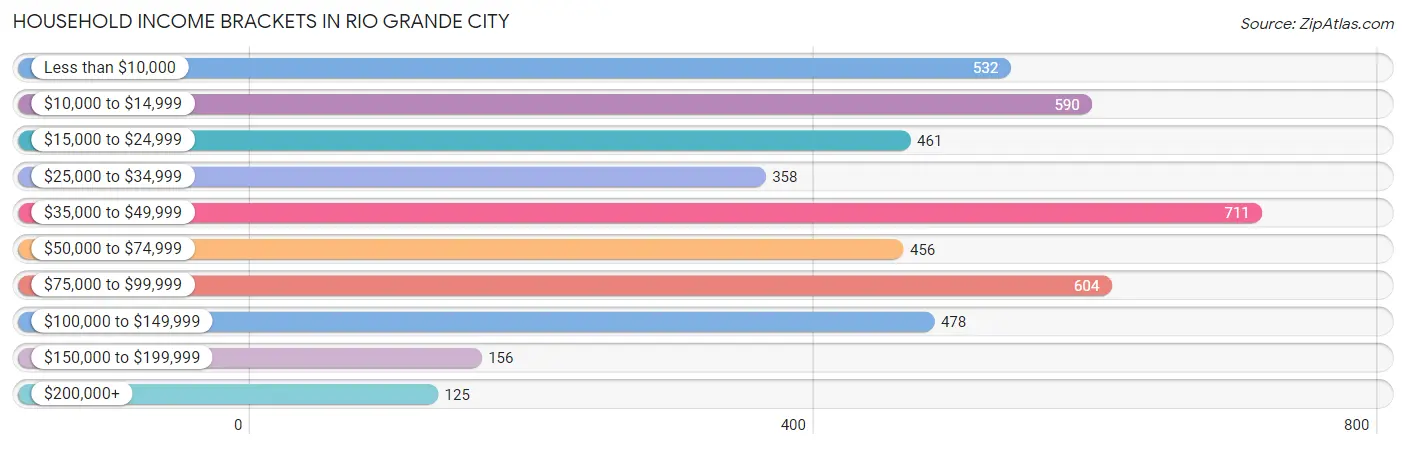
Household Income Brackets in Rio Grande City
With 711 households falling in the category, the $35,000 to $49,999 income range is the most frequent in Rio Grande City, accounting for 15.9% of all households. In contrast, only 125 households (2.8%) fall into the $200,000+ income bracket, making it the least populous group.
| Income Bracket | # Households | % Households |
| Less than $10,000 | 532 | 11.9% |
| $10,000 to $14,999 | 590 | 13.2% |
| $15,000 to $24,999 | 461 | 10.3% |
| $25,000 to $34,999 | 358 | 8.0% |
| $35,000 to $49,999 | 711 | 15.9% |
| $50,000 to $74,999 | 456 | 10.2% |
| $75,000 to $99,999 | 604 | 13.5% |
| $100,000 to $149,999 | 478 | 10.7% |
| $150,000 to $199,999 | 156 | 3.5% |
| $200,000+ | 125 | 2.8% |
Household Income by Householder Age in Rio Grande City
The median household income in Rio Grande City is $44,307, with the highest median household income of $55,324 found in the 25 to 44 years age bracket for the primary householder. A total of 1,769 households (39.6%) fall into this category. Meanwhile, the 15 to 24 years age bracket for the primary householder has the lowest median household income of $14,226, with 127 households (2.8%) in this group.
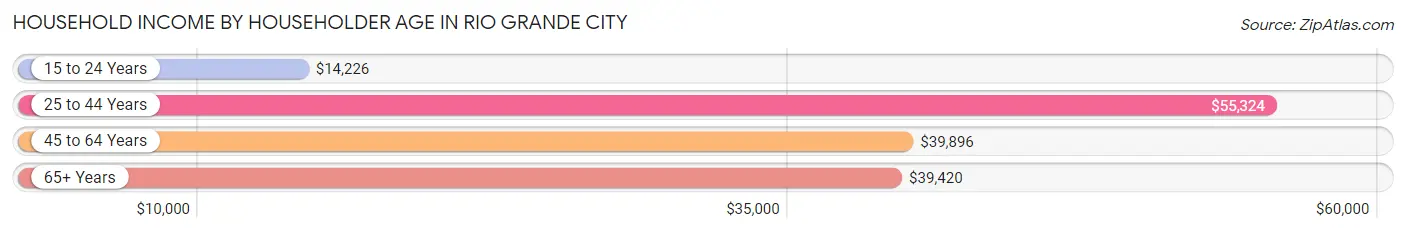
| Income Bracket | # Households | Median Income |
| 15 to 24 Years | 127 (2.8%) | $14,226 |
| 25 to 44 Years | 1,769 (39.6%) | $55,324 |
| 45 to 64 Years | 1,471 (32.9%) | $39,896 |
| 65+ Years | 1,104 (24.7%) | $39,420 |
| Total | 4,471 (100.0%) | $44,307 |
Poverty in Rio Grande City
Income Below Poverty by Sex and Age in Rio Grande City
With 22.7% poverty level for males and 37.3% for females among the residents of Rio Grande City, 5 year old males and 15 year old females are the most vulnerable to poverty, with 108 males (49.3%) and 90 females (72.6%) in their respective age groups living below the poverty level.
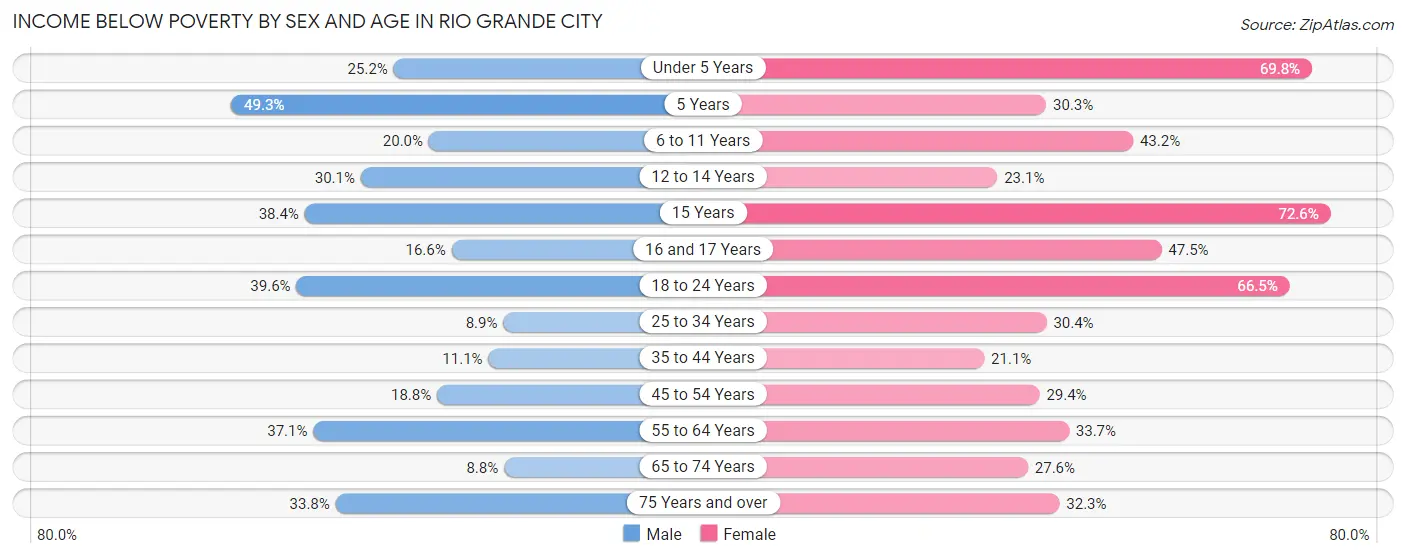
| Age Bracket | Male | Female |
| Under 5 Years | 160 (25.2%) | 370 (69.8%) |
| 5 Years | 108 (49.3%) | 81 (30.3%) |
| 6 to 11 Years | 143 (20.0%) | 390 (43.2%) |
| 12 to 14 Years | 157 (30.1%) | 72 (23.1%) |
| 15 Years | 53 (38.4%) | 90 (72.6%) |
| 16 and 17 Years | 41 (16.6%) | 131 (47.5%) |
| 18 to 24 Years | 327 (39.6%) | 377 (66.5%) |
| 25 to 34 Years | 84 (8.9%) | 334 (30.4%) |
| 35 to 44 Years | 106 (11.1%) | 234 (21.1%) |
| 45 to 54 Years | 156 (18.8%) | 226 (29.3%) |
| 55 to 64 Years | 199 (37.1%) | 203 (33.7%) |
| 65 to 74 Years | 45 (8.8%) | 139 (27.6%) |
| 75 Years and over | 92 (33.8%) | 105 (32.3%) |
| Total | 1,671 (22.7%) | 2,752 (37.3%) |
Income Above Poverty by Sex and Age in Rio Grande City
According to the poverty statistics in Rio Grande City, males aged 65 to 74 years and females aged 35 to 44 years are the age groups that are most secure financially, with 91.2% of males and 78.9% of females in these age groups living above the poverty line.
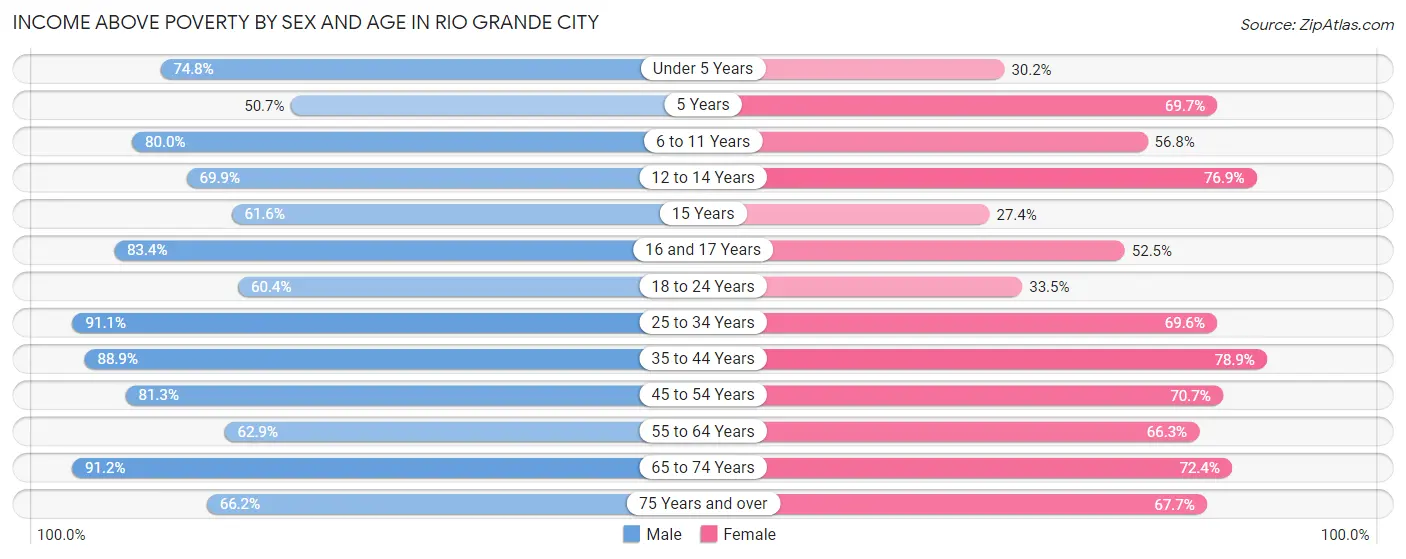
| Age Bracket | Male | Female |
| Under 5 Years | 475 (74.8%) | 160 (30.2%) |
| 5 Years | 111 (50.7%) | 186 (69.7%) |
| 6 to 11 Years | 573 (80.0%) | 512 (56.8%) |
| 12 to 14 Years | 365 (69.9%) | 240 (76.9%) |
| 15 Years | 85 (61.6%) | 34 (27.4%) |
| 16 and 17 Years | 206 (83.4%) | 145 (52.5%) |
| 18 to 24 Years | 498 (60.4%) | 190 (33.5%) |
| 25 to 34 Years | 858 (91.1%) | 765 (69.6%) |
| 35 to 44 Years | 846 (88.9%) | 873 (78.9%) |
| 45 to 54 Years | 676 (81.2%) | 544 (70.7%) |
| 55 to 64 Years | 337 (62.9%) | 399 (66.3%) |
| 65 to 74 Years | 466 (91.2%) | 364 (72.4%) |
| 75 Years and over | 180 (66.2%) | 220 (67.7%) |
| Total | 5,676 (77.3%) | 4,632 (62.7%) |
Income Below Poverty Among Married-Couple Families in Rio Grande City
The poverty statistics for married-couple families in Rio Grande City show that 16.2% or 344 of the total 2,119 families live below the poverty line. Families with 1 or 2 children have the highest poverty rate of 22.5%, comprising of 195 families. On the other hand, families with 5 or more children have the lowest poverty rate of 0.0%, which includes 0 families.
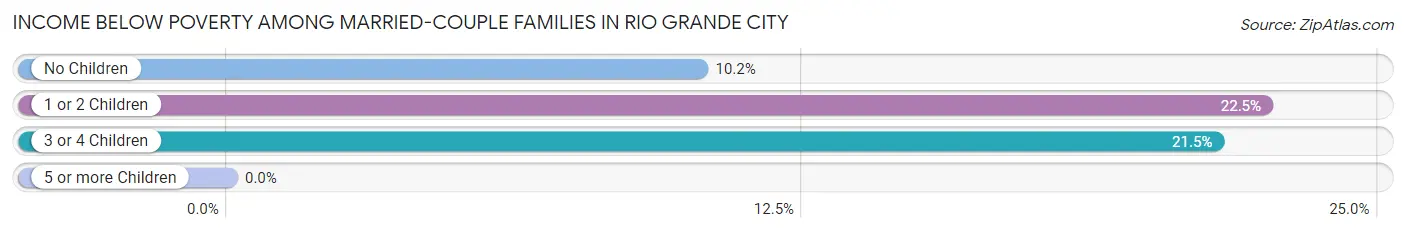
| Children | Above Poverty | Below Poverty |
| No Children | 920 (89.8%) | 105 (10.2%) |
| 1 or 2 Children | 671 (77.5%) | 195 (22.5%) |
| 3 or 4 Children | 161 (78.5%) | 44 (21.5%) |
| 5 or more Children | 23 (100.0%) | 0 (0.0%) |
| Total | 1,775 (83.8%) | 344 (16.2%) |
Income Below Poverty Among Single-Parent Households in Rio Grande City
According to the poverty data in Rio Grande City, 15.8% or 43 single-father households and 51.9% or 603 single-mother households are living below the poverty line. Among single-father households, those with 3 or 4 children have the highest poverty rate, with 43 households (37.1%) experiencing poverty. Likewise, among single-mother households, those with 3 or 4 children have the highest poverty rate, with 174 households (69.6%) falling below the poverty line.
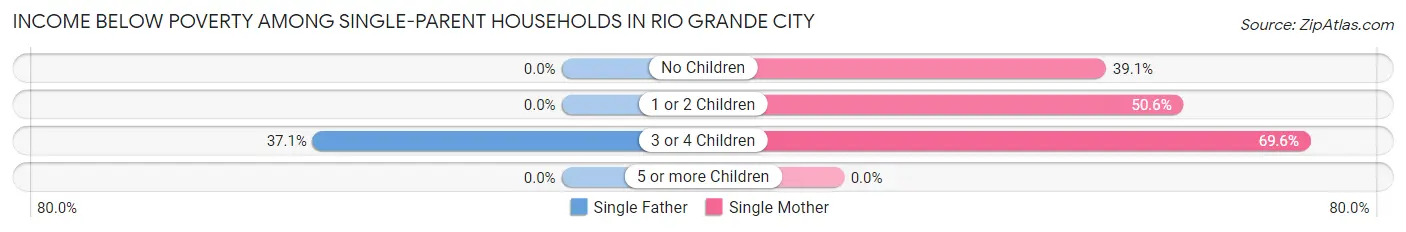
| Children | Single Father | Single Mother |
| No Children | 0 (0.0%) | 111 (39.1%) |
| 1 or 2 Children | 0 (0.0%) | 318 (50.6%) |
| 3 or 4 Children | 43 (37.1%) | 174 (69.6%) |
| 5 or more Children | 0 (0.0%) | 0 (0.0%) |
| Total | 43 (15.8%) | 603 (51.9%) |
Income Below Poverty Among Married-Couple vs Single-Parent Households in Rio Grande City
The poverty data for Rio Grande City shows that 344 of the married-couple family households (16.2%) and 646 of the single-parent households (45.1%) are living below the poverty level. Within the married-couple family households, those with 1 or 2 children have the highest poverty rate, with 195 households (22.5%) falling below the poverty line. Among the single-parent households, those with 3 or 4 children have the highest poverty rate, with 217 household (59.3%) living below poverty.
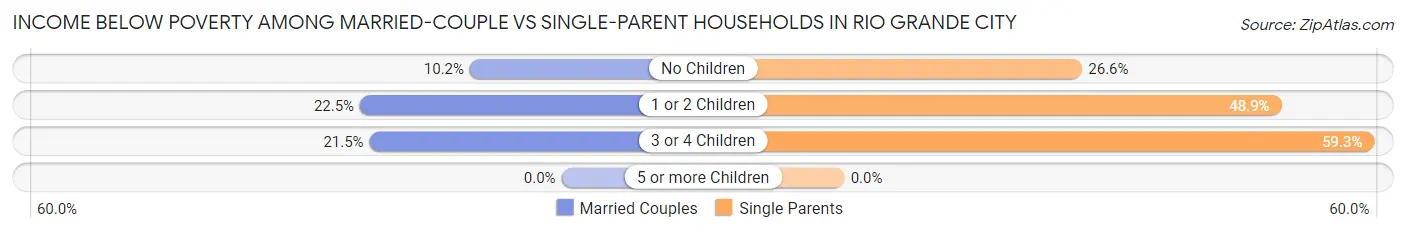
| Children | Married-Couple Families | Single-Parent Households |
| No Children | 105 (10.2%) | 111 (26.6%) |
| 1 or 2 Children | 195 (22.5%) | 318 (48.9%) |
| 3 or 4 Children | 44 (21.5%) | 217 (59.3%) |
| 5 or more Children | 0 (0.0%) | 0 (0.0%) |
| Total | 344 (16.2%) | 646 (45.1%) |
Race in Rio Grande City
The most populous races in Rio Grande City are Hispanic or Latino (14,515 | 95.1%), White / Caucasian (7,522 | 49.3%), and Two or more Races (6,642 | 43.5%).
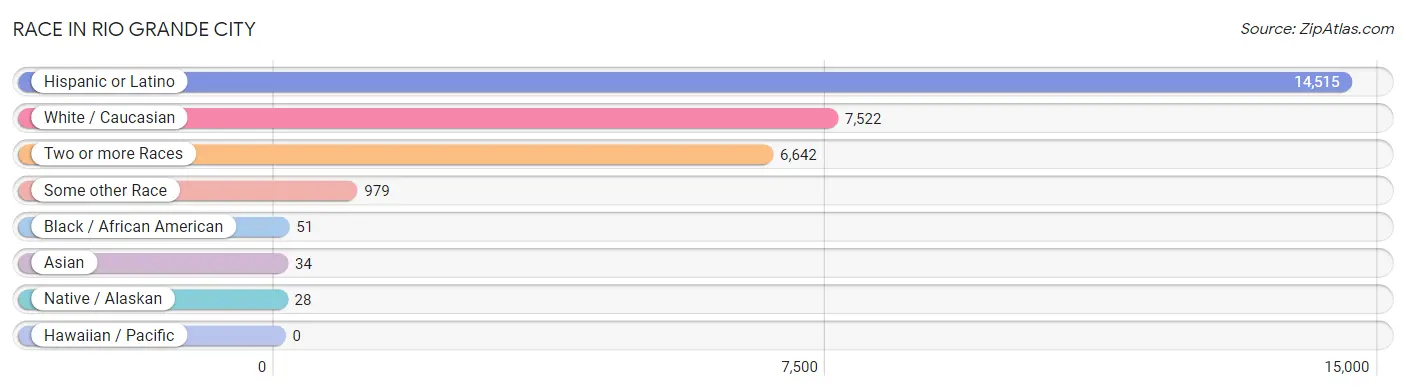
| Race | # Population | % Population |
| Asian | 34 | 0.2% |
| Black / African American | 51 | 0.3% |
| Hawaiian / Pacific | 0 | 0.0% |
| Hispanic or Latino | 14,515 | 95.1% |
| Native / Alaskan | 28 | 0.2% |
| White / Caucasian | 7,522 | 49.3% |
| Two or more Races | 6,642 | 43.5% |
| Some other Race | 979 | 6.4% |
| Total | 15,256 | 100.0% |
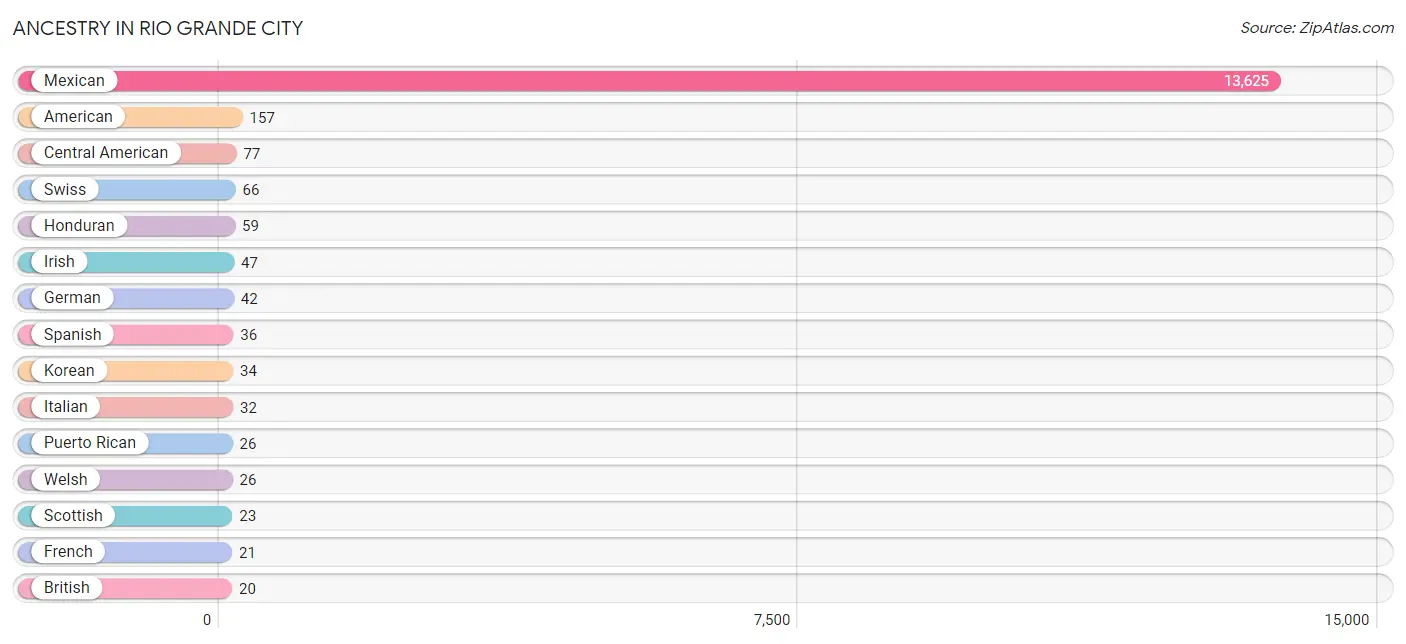
Ancestry in Rio Grande City
The most populous ancestries reported in Rio Grande City are Mexican (13,625 | 89.3%), American (157 | 1.0%), Central American (77 | 0.5%), Swiss (66 | 0.4%), and Honduran (59 | 0.4%), together accounting for 91.7% of all Rio Grande City residents.
| Ancestry | # Population | % Population |
| African | 8 | 0.1% |
| American | 157 | 1.0% |
| Arab | 1 | 0.0% |
| Basque | 18 | 0.1% |
| British | 20 | 0.1% |
| Central American | 77 | 0.5% |
| Danish | 2 | 0.0% |
| Egyptian | 1 | 0.0% |
| English | 1 | 0.0% |
| French | 21 | 0.1% |
| German | 42 | 0.3% |
| Greek | 16 | 0.1% |
| Guatemalan | 13 | 0.1% |
| Honduran | 59 | 0.4% |
| Irish | 47 | 0.3% |
| Italian | 32 | 0.2% |
| Korean | 34 | 0.2% |
| Mexican | 13,625 | 89.3% |
| Nicaraguan | 5 | 0.0% |
| Norwegian | 9 | 0.1% |
| Polish | 2 | 0.0% |
| Puerto Rican | 26 | 0.2% |
| Scottish | 23 | 0.2% |
| Spanish | 36 | 0.2% |
| Subsaharan African | 8 | 0.1% |
| Swiss | 66 | 0.4% |
| Welsh | 26 | 0.2% | View All 27 Rows |
Immigrants in Rio Grande City
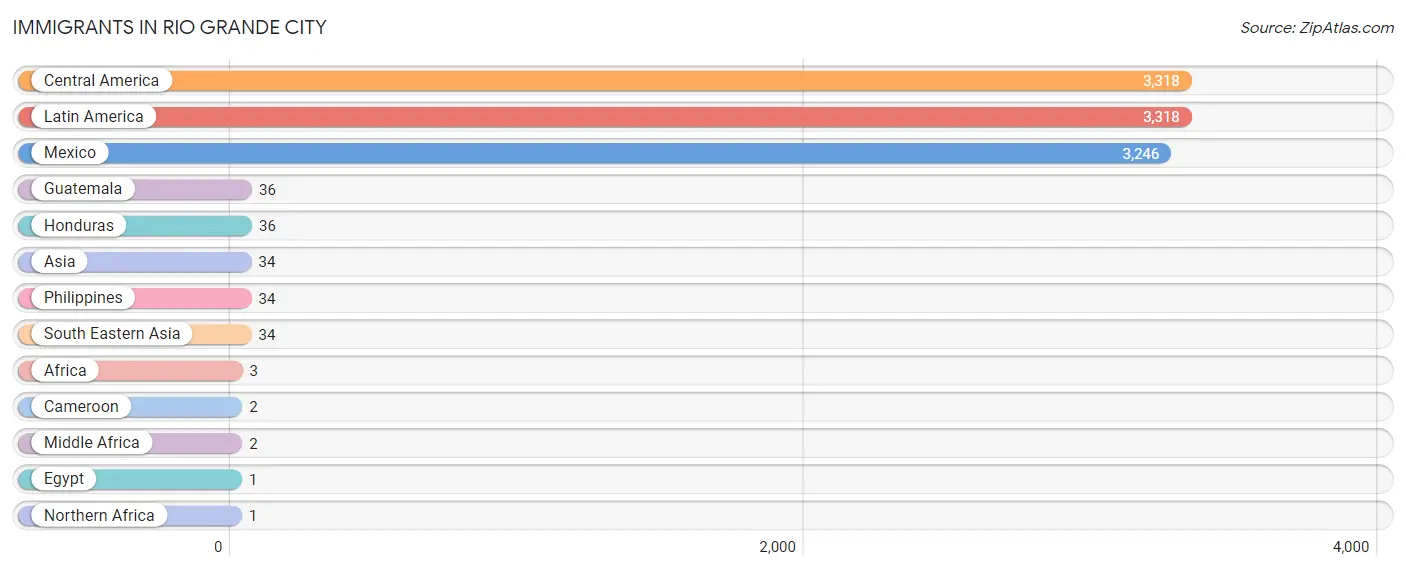
The most numerous immigrant groups reported in Rio Grande City came from Central America (3,318 | 21.7%), Latin America (3,318 | 21.7%), Mexico (3,246 | 21.3%), Guatemala (36 | 0.2%), and Honduras (36 | 0.2%), together accounting for 65.3% of all Rio Grande City residents.
| Immigration Origin | # Population | % Population |
| Africa | 3 | 0.0% |
| Asia | 34 | 0.2% |
| Cameroon | 2 | 0.0% |
| Central America | 3,318 | 21.7% |
| Egypt | 1 | 0.0% |
| Guatemala | 36 | 0.2% |
| Honduras | 36 | 0.2% |
| Latin America | 3,318 | 21.7% |
| Mexico | 3,246 | 21.3% |
| Middle Africa | 2 | 0.0% |
| Northern Africa | 1 | 0.0% |
| Philippines | 34 | 0.2% |
| South Eastern Asia | 34 | 0.2% | View All 13 Rows |
Sex and Age in Rio Grande City
Sex and Age in Rio Grande City
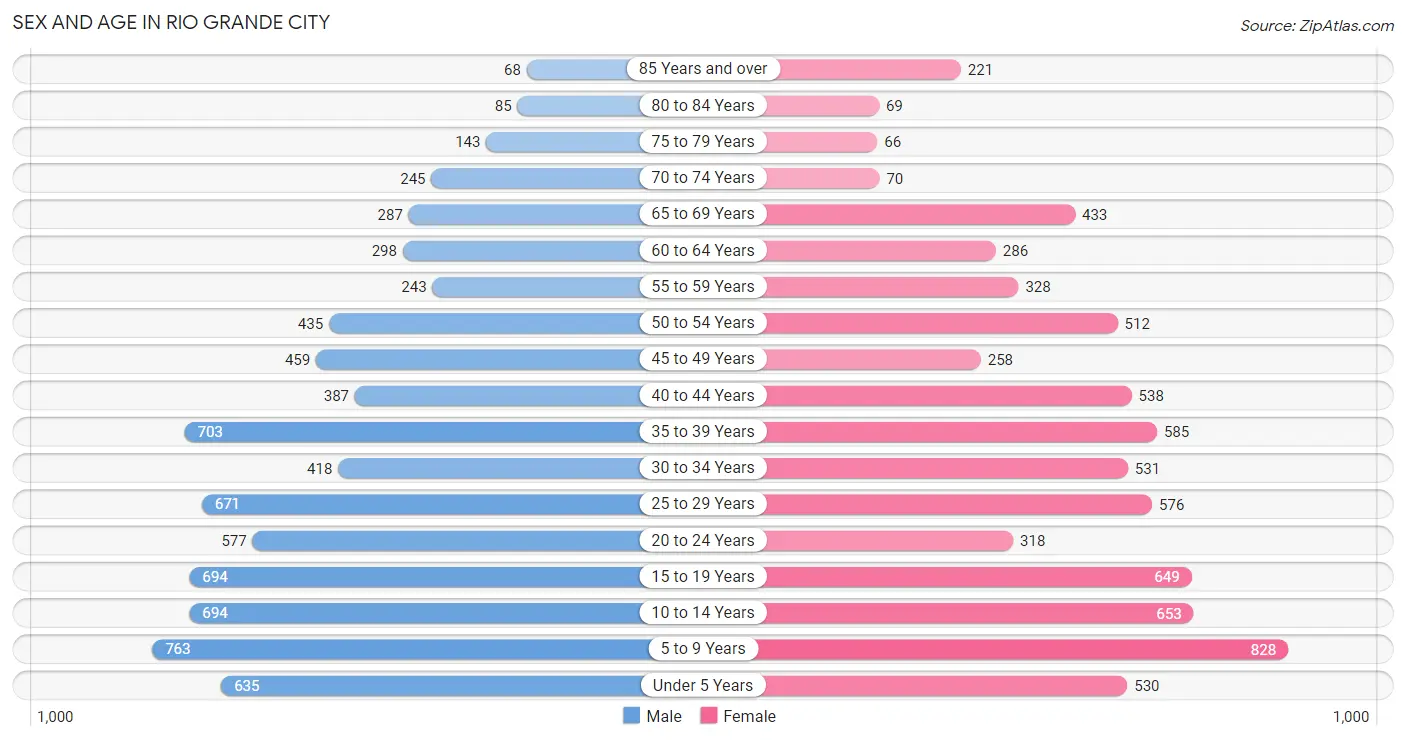
The most populous age groups in Rio Grande City are 5 to 9 Years (763 | 9.8%) for men and 5 to 9 Years (828 | 11.1%) for women.
| Age Bracket | Male | Female |
| Under 5 Years | 635 (8.1%) | 530 (7.1%) |
| 5 to 9 Years | 763 (9.8%) | 828 (11.1%) |
| 10 to 14 Years | 694 (8.9%) | 653 (8.8%) |
| 15 to 19 Years | 694 (8.9%) | 649 (8.7%) |
| 20 to 24 Years | 577 (7.4%) | 318 (4.3%) |
| 25 to 29 Years | 671 (8.6%) | 576 (7.7%) |
| 30 to 34 Years | 418 (5.4%) | 531 (7.1%) |
| 35 to 39 Years | 703 (9.0%) | 585 (7.9%) |
| 40 to 44 Years | 387 (5.0%) | 538 (7.2%) |
| 45 to 49 Years | 459 (5.9%) | 258 (3.5%) |
| 50 to 54 Years | 435 (5.6%) | 512 (6.9%) |
| 55 to 59 Years | 243 (3.1%) | 328 (4.4%) |
| 60 to 64 Years | 298 (3.8%) | 286 (3.8%) |
| 65 to 69 Years | 287 (3.7%) | 433 (5.8%) |
| 70 to 74 Years | 245 (3.1%) | 70 (0.9%) |
| 75 to 79 Years | 143 (1.8%) | 66 (0.9%) |
| 80 to 84 Years | 85 (1.1%) | 69 (0.9%) |
| 85 Years and over | 68 (0.9%) | 221 (3.0%) |
| Total | 7,805 (100.0%) | 7,451 (100.0%) |
Families and Households in Rio Grande City
Median Family Size in Rio Grande City
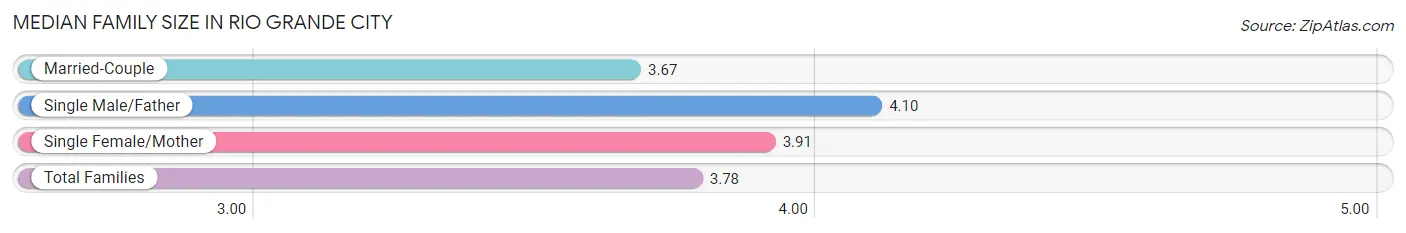
The median family size in Rio Grande City is 3.78 persons per family, with single male/father families (272 | 7.7%) accounting for the largest median family size of 4.1 persons per family. On the other hand, married-couple families (2,119 | 59.6%) represent the smallest median family size with 3.67 persons per family.
| Family Type | # Families | Family Size |
| Married-Couple | 2,119 (59.6%) | 3.67 |
| Single Male/Father | 272 (7.7%) | 4.10 |
| Single Female/Mother | 1,162 (32.7%) | 3.91 |
| Total Families | 3,553 (100.0%) | 3.78 |
Median Household Size in Rio Grande City
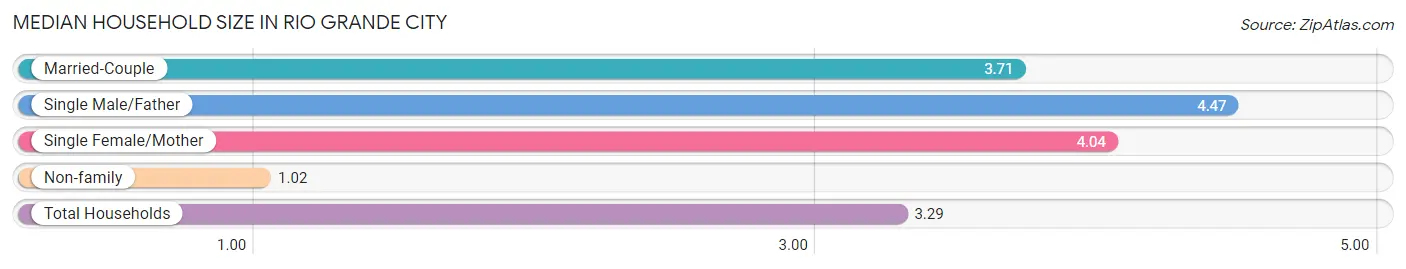
The median household size in Rio Grande City is 3.29 persons per household, with single male/father households (272 | 6.1%) accounting for the largest median household size of 4.47 persons per household. non-family households (918 | 20.5%) represent the smallest median household size with 1.02 persons per household.
| Household Type | # Households | Household Size |
| Married-Couple | 2,119 (47.4%) | 3.71 |
| Single Male/Father | 272 (6.1%) | 4.47 |
| Single Female/Mother | 1,162 (26.0%) | 4.04 |
| Non-family | 918 (20.5%) | 1.02 |
| Total Households | 4,471 (100.0%) | 3.29 |
Household Size by Marriage Status in Rio Grande City
Out of a total of 4,471 households in Rio Grande City, 3,553 (79.5%) are family households, while 918 (20.5%) are nonfamily households. The most numerous type of family households are 2-person households, comprising 1,142, and the most common type of nonfamily households are 1-person households, comprising 901.
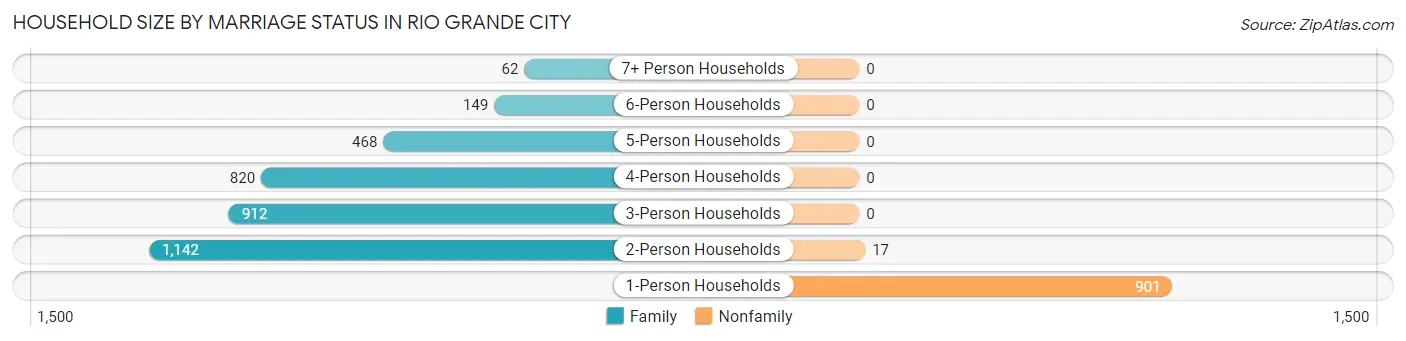
| Household Size | Family Households | Nonfamily Households |
| 1-Person Households | - | 901 (20.2%) |
| 2-Person Households | 1,142 (25.5%) | 17 (0.4%) |
| 3-Person Households | 912 (20.4%) | 0 (0.0%) |
| 4-Person Households | 820 (18.3%) | 0 (0.0%) |
| 5-Person Households | 468 (10.5%) | 0 (0.0%) |
| 6-Person Households | 149 (3.3%) | 0 (0.0%) |
| 7+ Person Households | 62 (1.4%) | 0 (0.0%) |
| Total | 3,553 (79.5%) | 918 (20.5%) |
Female Fertility in Rio Grande City
Fertility by Age in Rio Grande City
Average fertility rate in Rio Grande City is 30.0 births per 1,000 women. Women in the age bracket of 20 to 34 years have the highest fertility rate with 44.0 births per 1,000 women. Women in the age bracket of 20 to 34 years acount for 59.1% of all women with births.
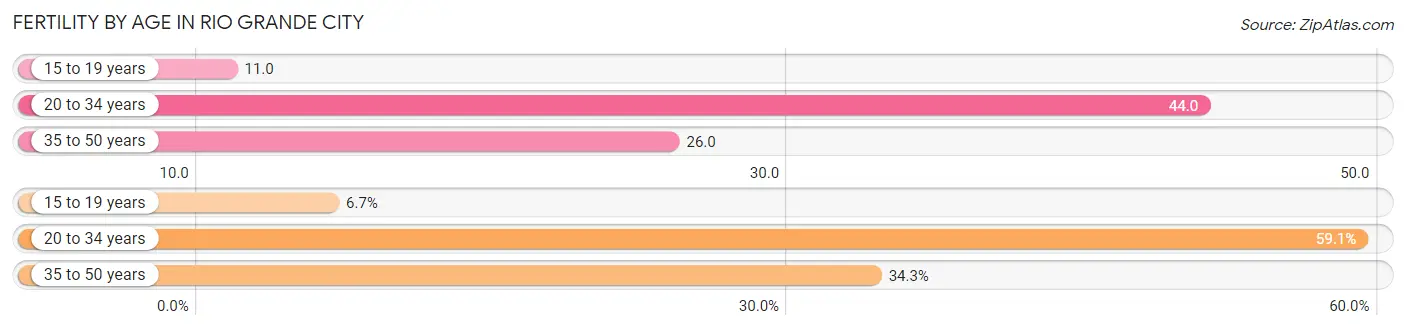
| Age Bracket | Women with Births | Births / 1,000 Women |
| 15 to 19 years | 7 (6.7%) | 11.0 |
| 20 to 34 years | 62 (59.1%) | 44.0 |
| 35 to 50 years | 36 (34.3%) | 26.0 |
| Total | 105 (100.0%) | 30.0 |
Fertility by Age by Marriage Status in Rio Grande City
89.5% of women with births (105) in Rio Grande City are married. The highest percentage of unmarried women with births falls into 15 to 19 years age bracket with 100.0% of them unmarried at the time of birth, while the lowest percentage of unmarried women with births belong to 35 to 50 years age bracket with 0.0% of them unmarried.
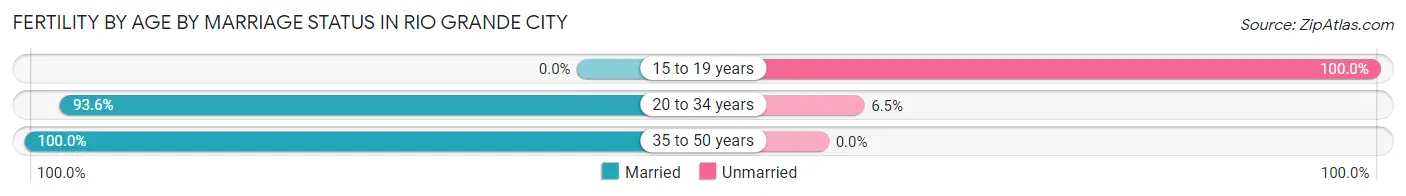
| Age Bracket | Married | Unmarried |
| 15 to 19 years | 0 (0.0%) | 7 (100.0%) |
| 20 to 34 years | 58 (93.5%) | 4 (6.5%) |
| 35 to 50 years | 36 (100.0%) | 0 (0.0%) |
| Total | 94 (89.5%) | 11 (10.5%) |
Fertility by Education in Rio Grande City
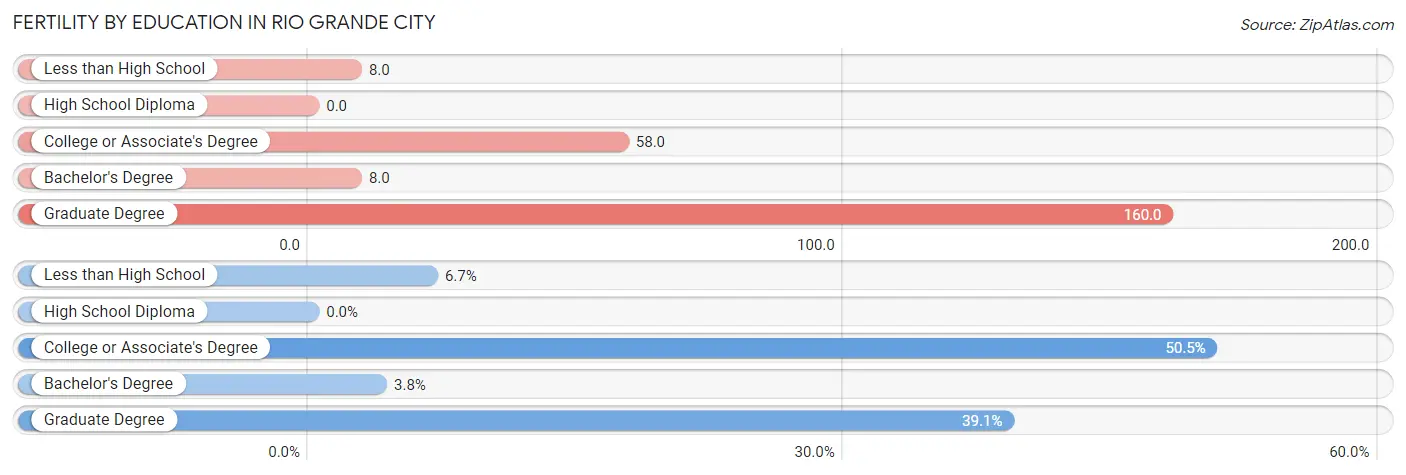
| Educational Attainment | Women with Births | Births / 1,000 Women |
| Less than High School | 7 (6.7%) | 8.0 |
| High School Diploma | 0 (0.0%) | 0.0 |
| College or Associate's Degree | 53 (50.5%) | 58.0 |
| Bachelor's Degree | 4 (3.8%) | 8.0 |
| Graduate Degree | 41 (39.1%) | 160.0 |
| Total | 105 (100.0%) | 30.0 |
Fertility by Education by Marriage Status in Rio Grande City
10.5% of women with births in Rio Grande City are unmarried. Women with the educational attainment of college or associate's degree are most likely to be married with 100.0% of them married at childbirth, while women with the educational attainment of less than high school are least likely to be married with 100.0% of them unmarried at childbirth.
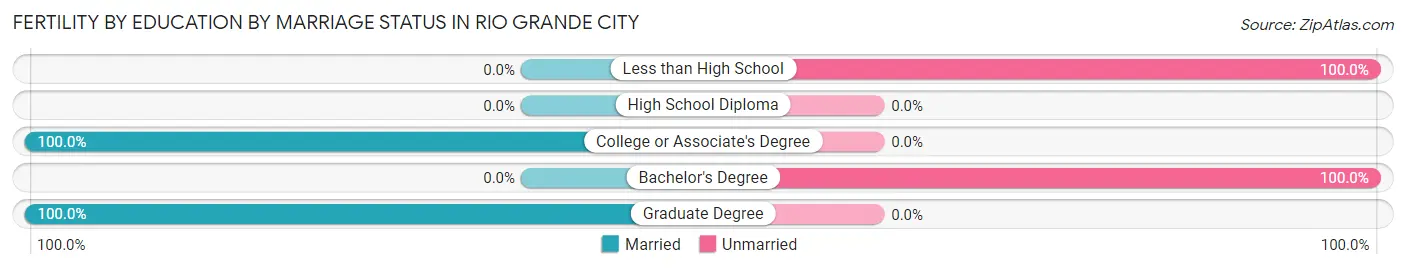
| Educational Attainment | Married | Unmarried |
| Less than High School | 0 (0.0%) | 7 (100.0%) |
| High School Diploma | 0 (0.0%) | 0 (0.0%) |
| College or Associate's Degree | 53 (100.0%) | 0 (0.0%) |
| Bachelor's Degree | 0 (0.0%) | 4 (100.0%) |
| Graduate Degree | 41 (100.0%) | 0 (0.0%) |
| Total | 94 (89.5%) | 11 (10.5%) |
Employment Characteristics in Rio Grande City
Employment by Class of Employer in Rio Grande City
Among the 5,850 employed individuals in Rio Grande City, private company employees (2,917 | 49.9%), state government employees (1,018 | 17.4%), and local government employees (761 | 13.0%) make up the most common classes of employment.
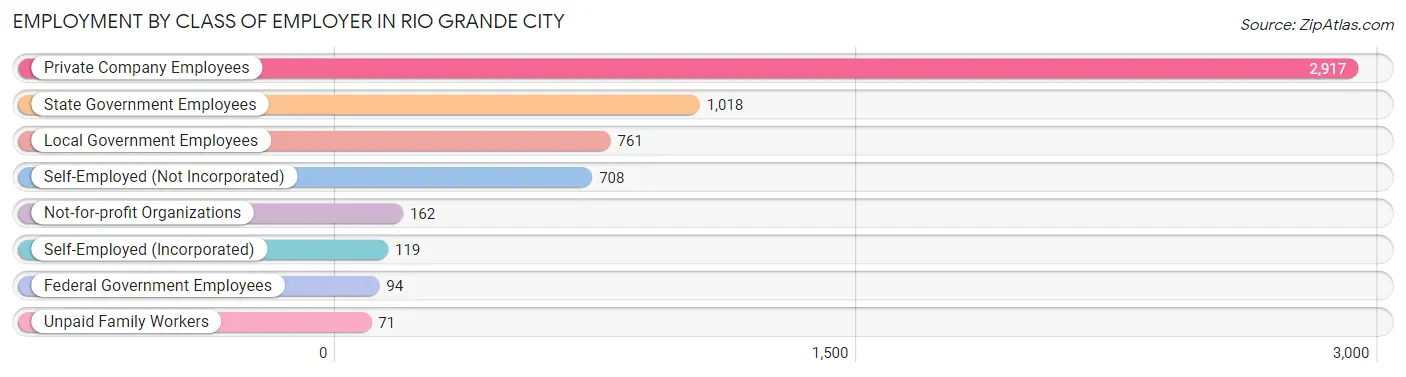
| Employer Class | # Employees | % Employees |
| Private Company Employees | 2,917 | 49.9% |
| Self-Employed (Incorporated) | 119 | 2.0% |
| Self-Employed (Not Incorporated) | 708 | 12.1% |
| Not-for-profit Organizations | 162 | 2.8% |
| Local Government Employees | 761 | 13.0% |
| State Government Employees | 1,018 | 17.4% |
| Federal Government Employees | 94 | 1.6% |
| Unpaid Family Workers | 71 | 1.2% |
| Total | 5,850 | 100.0% |
Employment Status by Age in Rio Grande City
According to the labor force statistics for Rio Grande City, out of the total population over 16 years of age (10,891), 60.1% or 6,545 individuals are in the labor force, with 8.9% or 583 of them unemployed. The age group with the highest labor force participation rate is 45 to 54 years, with 80.5% or 1,340 individuals in the labor force. Within the labor force, the 16 to 19 years age range has the highest percentage of unemployed individuals, with 45.9% or 158 of them being unemployed.
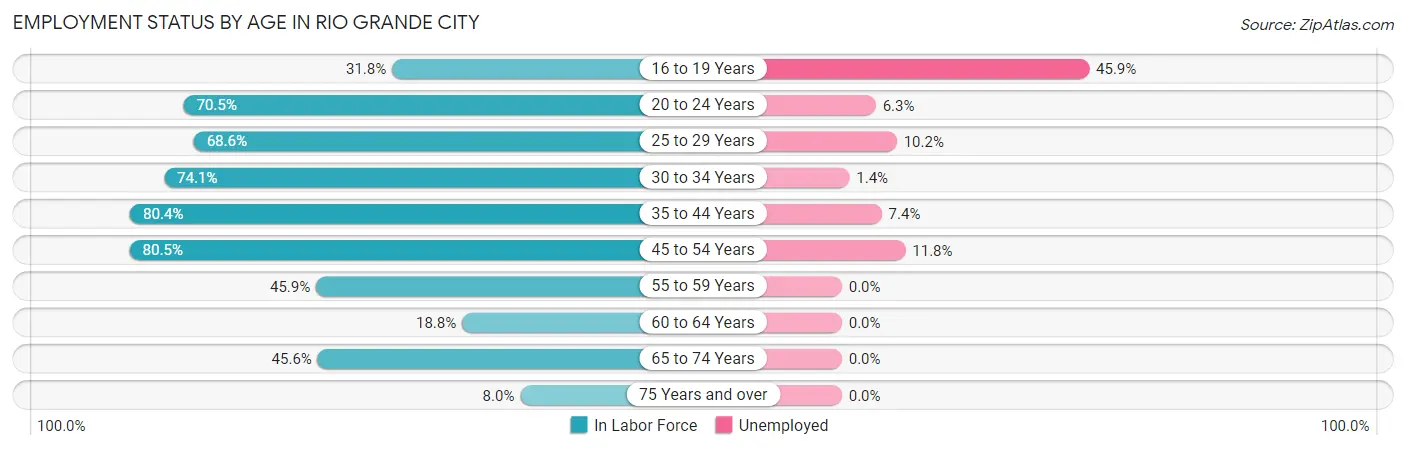
| Age Bracket | In Labor Force | Unemployed |
| 16 to 19 Years | 344 (31.8%) | 158 (45.9%) |
| 20 to 24 Years | 631 (70.5%) | 40 (6.3%) |
| 25 to 29 Years | 855 (68.6%) | 87 (10.2%) |
| 30 to 34 Years | 703 (74.1%) | 10 (1.4%) |
| 35 to 44 Years | 1,779 (80.4%) | 132 (7.4%) |
| 45 to 54 Years | 1,340 (80.5%) | 158 (11.8%) |
| 55 to 59 Years | 262 (45.9%) | 0 (0.0%) |
| 60 to 64 Years | 110 (18.8%) | 0 (0.0%) |
| 65 to 74 Years | 472 (45.6%) | 0 (0.0%) |
| 75 Years and over | 52 (8.0%) | 0 (0.0%) |
| Total | 6,545 (60.1%) | 583 (8.9%) |
Employment Status by Educational Attainment in Rio Grande City
According to labor force statistics for Rio Grande City, 69.9% of individuals (5,052) out of the total population between 25 and 64 years of age (7,228) are in the labor force, with 7.6% or 384 of them being unemployed. The group with the highest labor force participation rate are those with the educational attainment of bachelor's degree or higher, with 94.9% or 1,384 individuals in the labor force. Within the labor force, individuals with less than high school education have the highest percentage of unemployment, with 16.4% or 195 of them being unemployed.
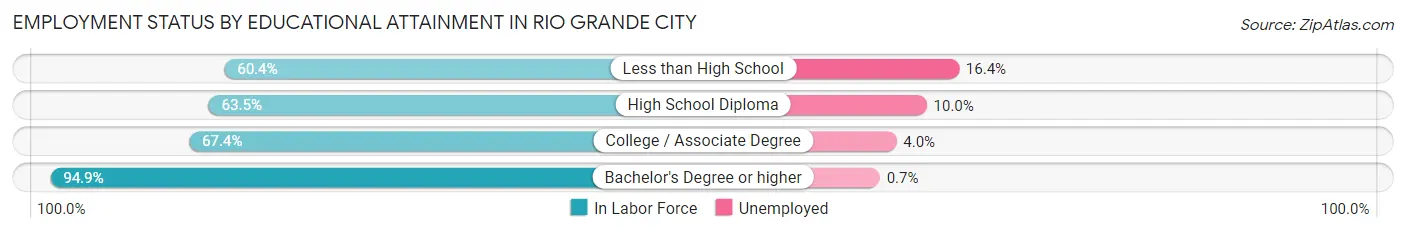
| Educational Attainment | In Labor Force | Unemployed |
| Less than High School | 1,192 (60.4%) | 324 (16.4%) |
| High School Diploma | 1,351 (63.5%) | 213 (10.0%) |
| College / Associate Degree | 1,125 (67.4%) | 67 (4.0%) |
| Bachelor's Degree or higher | 1,384 (94.9%) | 10 (0.7%) |
| Total | 5,052 (69.9%) | 549 (7.6%) |
Employment Occupations by Sex in Rio Grande City
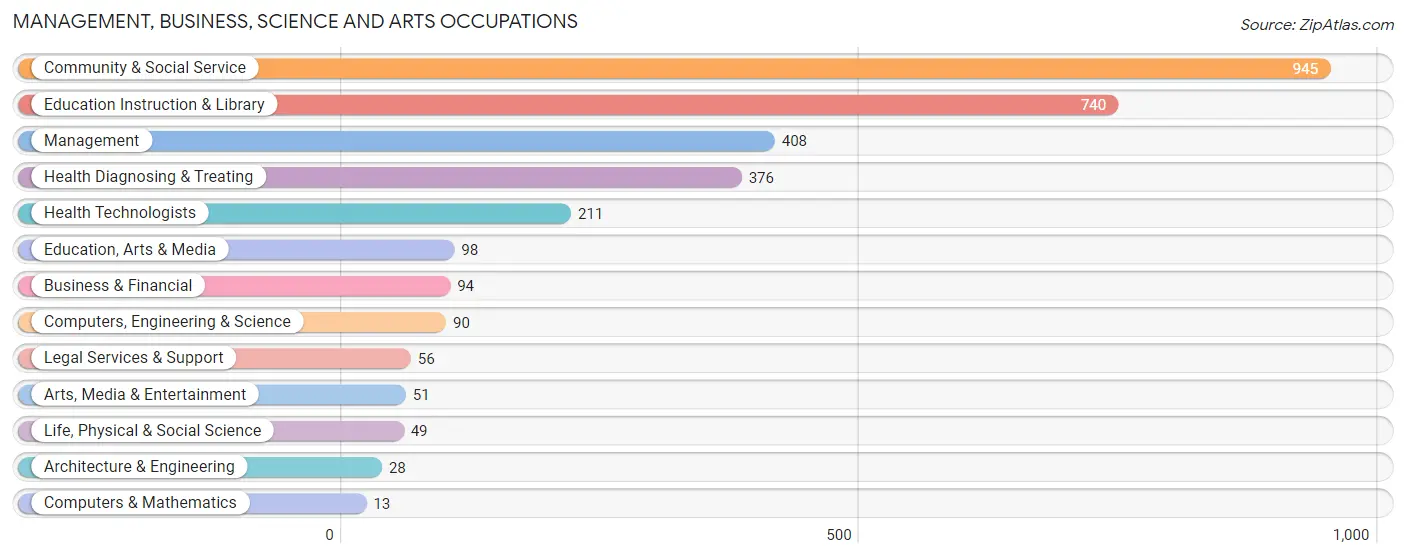
Management, Business, Science and Arts Occupations
The most common Management, Business, Science and Arts occupations in Rio Grande City are Community & Social Service (945 | 15.8%), Education Instruction & Library (740 | 12.4%), Management (408 | 6.8%), Health Diagnosing & Treating (376 | 6.3%), and Health Technologists (211 | 3.5%).
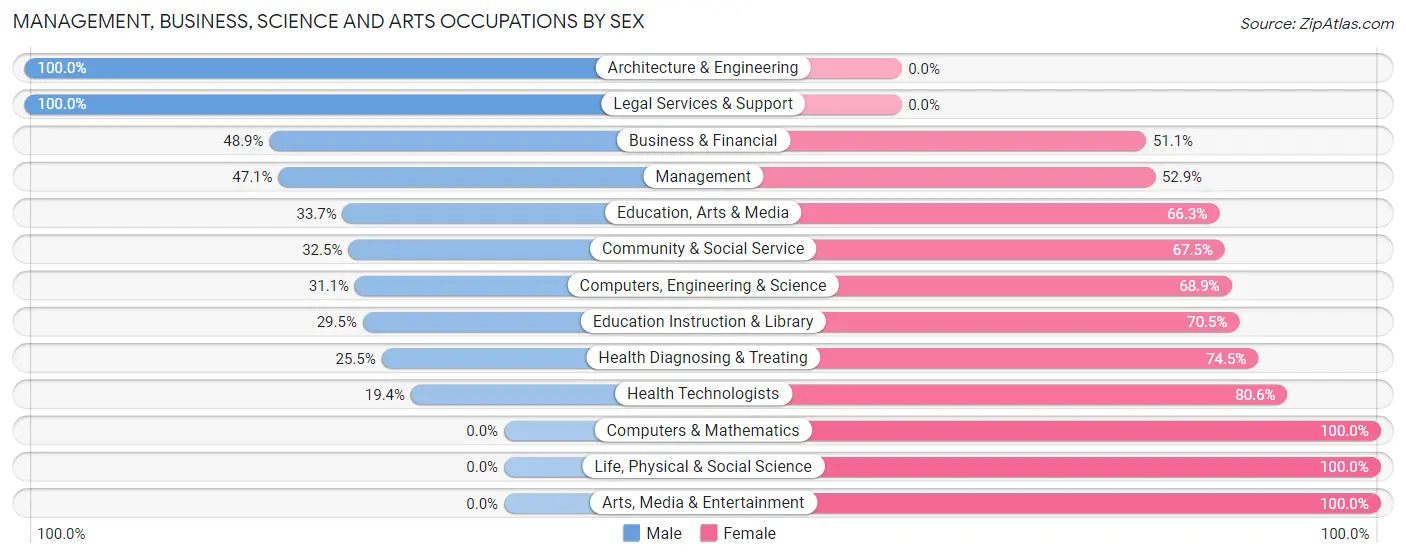
Management, Business, Science and Arts Occupations by Sex
Within the Management, Business, Science and Arts occupations in Rio Grande City, the most male-oriented occupations are Architecture & Engineering (100.0%), Legal Services & Support (100.0%), and Business & Financial (48.9%), while the most female-oriented occupations are Computers & Mathematics (100.0%), Life, Physical & Social Science (100.0%), and Arts, Media & Entertainment (100.0%).
| Occupation | Male | Female |
| Management | 192 (47.1%) | 216 (52.9%) |
| Business & Financial | 46 (48.9%) | 48 (51.1%) |
| Computers, Engineering & Science | 28 (31.1%) | 62 (68.9%) |
| Computers & Mathematics | 0 (0.0%) | 13 (100.0%) |
| Architecture & Engineering | 28 (100.0%) | 0 (0.0%) |
| Life, Physical & Social Science | 0 (0.0%) | 49 (100.0%) |
| Community & Social Service | 307 (32.5%) | 638 (67.5%) |
| Education, Arts & Media | 33 (33.7%) | 65 (66.3%) |
| Legal Services & Support | 56 (100.0%) | 0 (0.0%) |
| Education Instruction & Library | 218 (29.5%) | 522 (70.5%) |
| Arts, Media & Entertainment | 0 (0.0%) | 51 (100.0%) |
| Health Diagnosing & Treating | 96 (25.5%) | 280 (74.5%) |
| Health Technologists | 41 (19.4%) | 170 (80.6%) |
| Total (Category) | 669 (35.0%) | 1,244 (65.0%) |
| Total (Overall) | 3,111 (52.1%) | 2,854 (47.8%) |
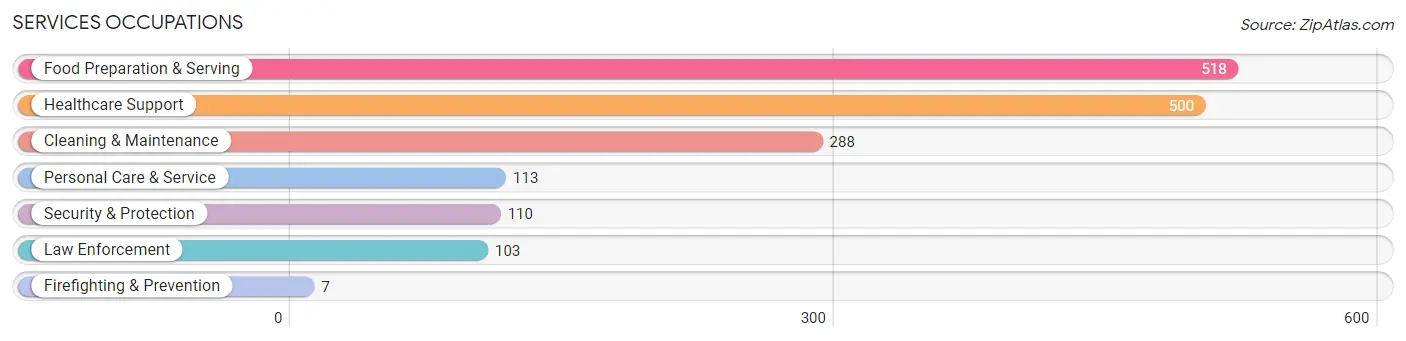
Services Occupations
The most common Services occupations in Rio Grande City are Food Preparation & Serving (518 | 8.7%), Healthcare Support (500 | 8.4%), Cleaning & Maintenance (288 | 4.8%), Personal Care & Service (113 | 1.9%), and Security & Protection (110 | 1.8%).
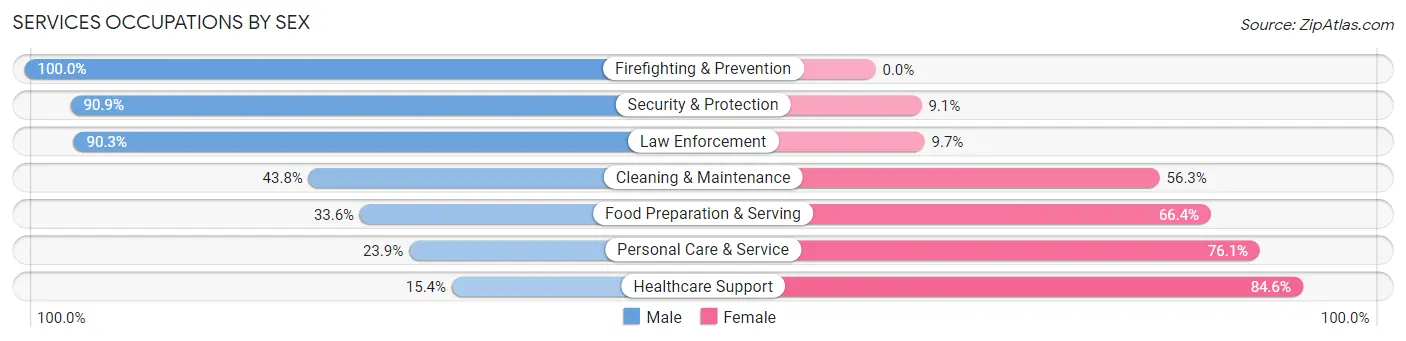
Services Occupations by Sex
Within the Services occupations in Rio Grande City, the most male-oriented occupations are Firefighting & Prevention (100.0%), Security & Protection (90.9%), and Law Enforcement (90.3%), while the most female-oriented occupations are Healthcare Support (84.6%), Personal Care & Service (76.1%), and Food Preparation & Serving (66.4%).
| Occupation | Male | Female |
| Healthcare Support | 77 (15.4%) | 423 (84.6%) |
| Security & Protection | 100 (90.9%) | 10 (9.1%) |
| Firefighting & Prevention | 7 (100.0%) | 0 (0.0%) |
| Law Enforcement | 93 (90.3%) | 10 (9.7%) |
| Food Preparation & Serving | 174 (33.6%) | 344 (66.4%) |
| Cleaning & Maintenance | 126 (43.8%) | 162 (56.2%) |
| Personal Care & Service | 27 (23.9%) | 86 (76.1%) |
| Total (Category) | 504 (33.0%) | 1,025 (67.0%) |
| Total (Overall) | 3,111 (52.1%) | 2,854 (47.8%) |
Sales and Office Occupations
The most common Sales and Office occupations in Rio Grande City are Sales & Related (570 | 9.6%), and Office & Administration (330 | 5.5%).
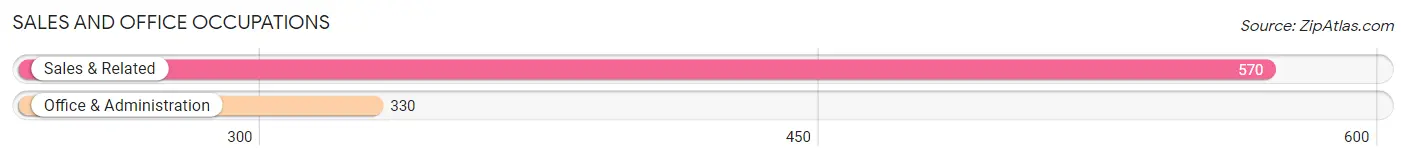
Sales and Office Occupations by Sex

| Occupation | Male | Female |
| Sales & Related | 351 (61.6%) | 219 (38.4%) |
| Office & Administration | 44 (13.3%) | 286 (86.7%) |
| Total (Category) | 395 (43.9%) | 505 (56.1%) |
| Total (Overall) | 3,111 (52.1%) | 2,854 (47.8%) |
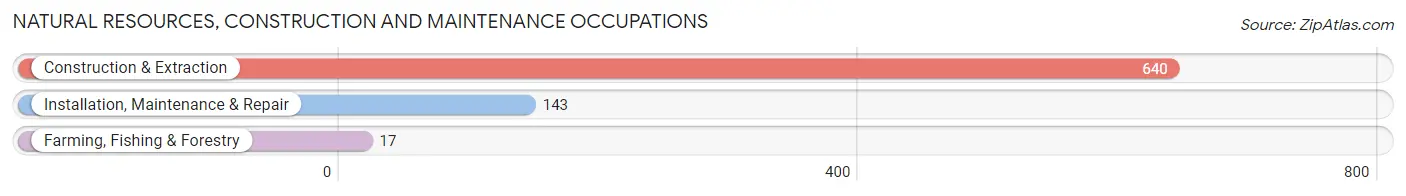
Natural Resources, Construction and Maintenance Occupations
The most common Natural Resources, Construction and Maintenance occupations in Rio Grande City are Construction & Extraction (640 | 10.7%), Installation, Maintenance & Repair (143 | 2.4%), and Farming, Fishing & Forestry (17 | 0.3%).
Natural Resources, Construction and Maintenance Occupations by Sex
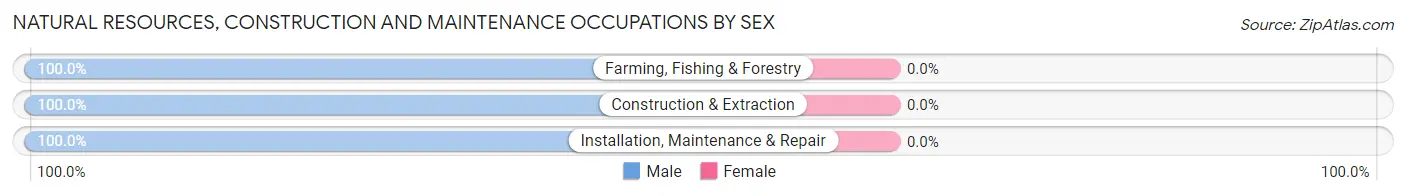
| Occupation | Male | Female |
| Farming, Fishing & Forestry | 17 (100.0%) | 0 (0.0%) |
| Construction & Extraction | 640 (100.0%) | 0 (0.0%) |
| Installation, Maintenance & Repair | 143 (100.0%) | 0 (0.0%) |
| Total (Category) | 800 (100.0%) | 0 (0.0%) |
| Total (Overall) | 3,111 (52.1%) | 2,854 (47.8%) |
Production, Transportation and Moving Occupations
The most common Production, Transportation and Moving occupations in Rio Grande City are Transportation (398 | 6.7%), Material Moving (391 | 6.6%), and Production (34 | 0.6%).
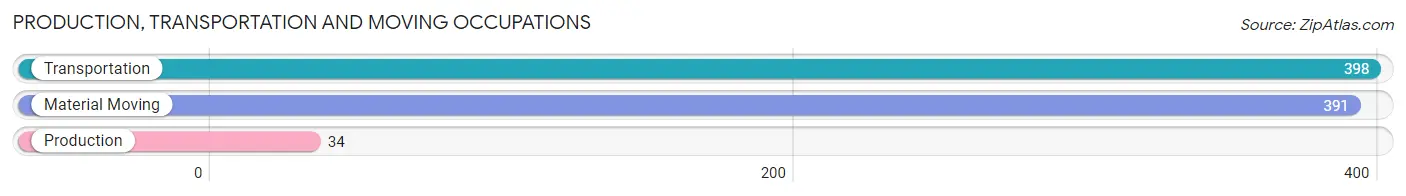
Production, Transportation and Moving Occupations by Sex
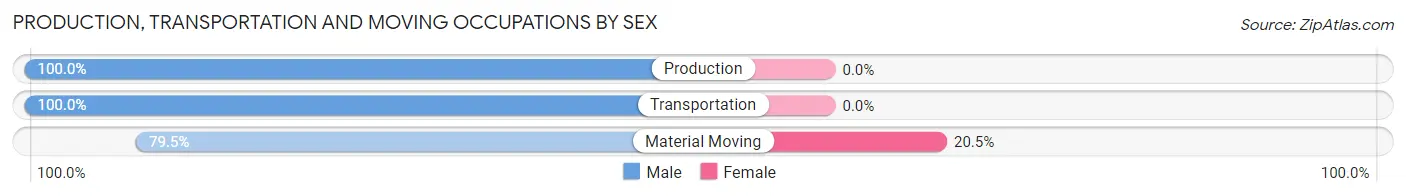
| Occupation | Male | Female |
| Production | 34 (100.0%) | 0 (0.0%) |
| Transportation | 398 (100.0%) | 0 (0.0%) |
| Material Moving | 311 (79.5%) | 80 (20.5%) |
| Total (Category) | 743 (90.3%) | 80 (9.7%) |
| Total (Overall) | 3,111 (52.1%) | 2,854 (47.8%) |
Employment Industries by Sex in Rio Grande City
Employment Industries in Rio Grande City
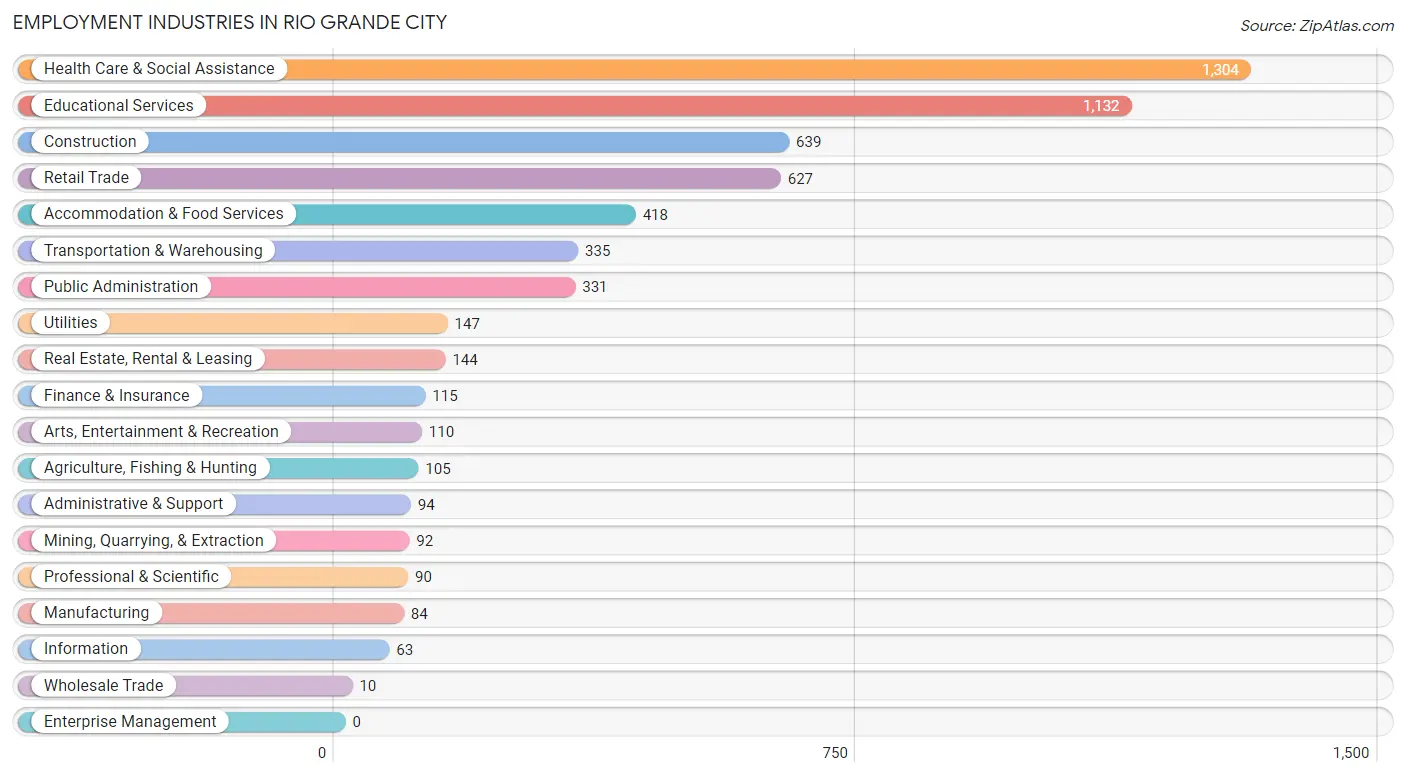
The major employment industries in Rio Grande City include Health Care & Social Assistance (1,304 | 21.9%), Educational Services (1,132 | 19.0%), Construction (639 | 10.7%), Retail Trade (627 | 10.5%), and Accommodation & Food Services (418 | 7.0%).
Employment Industries by Sex in Rio Grande City
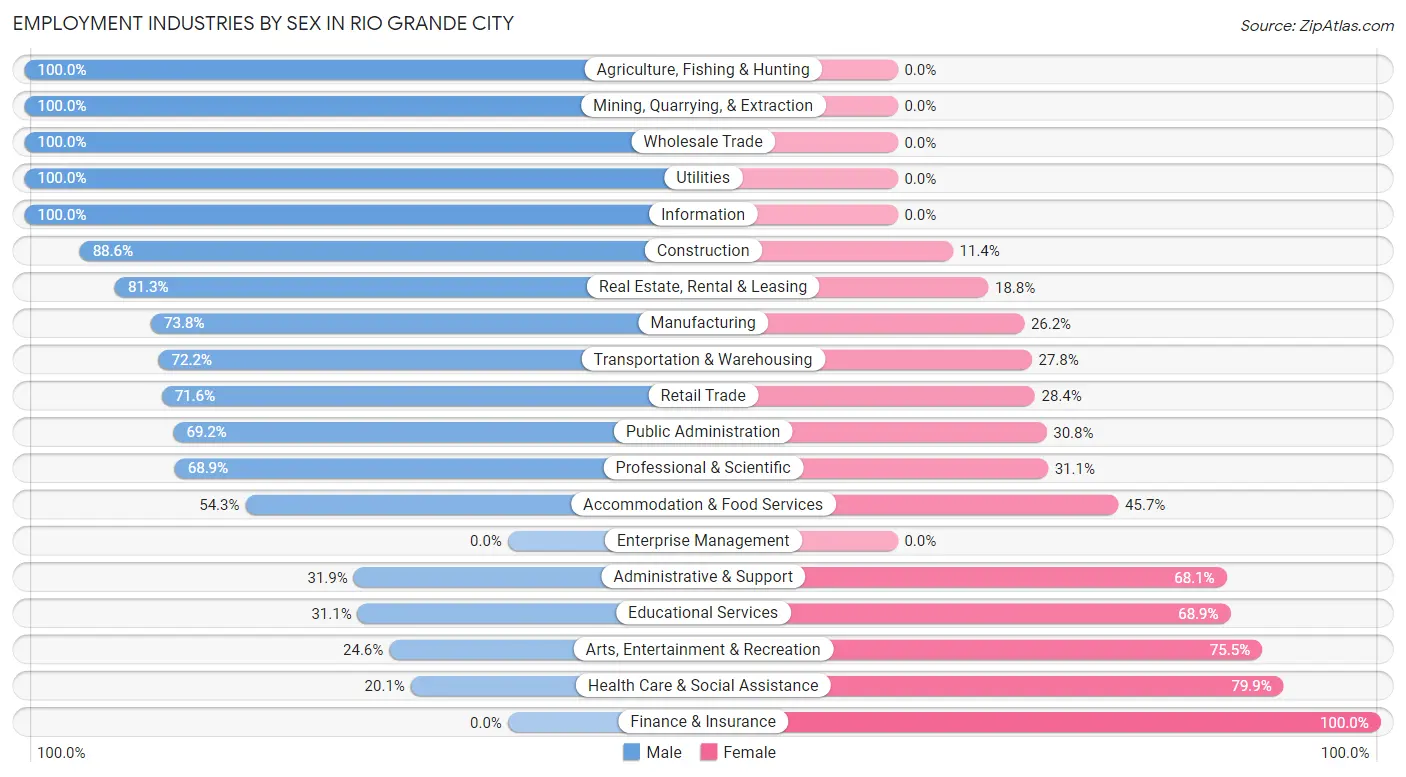
The Rio Grande City industries that see more men than women are Agriculture, Fishing & Hunting (100.0%), Mining, Quarrying, & Extraction (100.0%), and Wholesale Trade (100.0%), whereas the industries that tend to have a higher number of women are Finance & Insurance (100.0%), Health Care & Social Assistance (79.9%), and Arts, Entertainment & Recreation (75.4%).
| Industry | Male | Female |
| Agriculture, Fishing & Hunting | 105 (100.0%) | 0 (0.0%) |
| Mining, Quarrying, & Extraction | 92 (100.0%) | 0 (0.0%) |
| Construction | 566 (88.6%) | 73 (11.4%) |
| Manufacturing | 62 (73.8%) | 22 (26.2%) |
| Wholesale Trade | 10 (100.0%) | 0 (0.0%) |
| Retail Trade | 449 (71.6%) | 178 (28.4%) |
| Transportation & Warehousing | 242 (72.2%) | 93 (27.8%) |
| Utilities | 147 (100.0%) | 0 (0.0%) |
| Information | 63 (100.0%) | 0 (0.0%) |
| Finance & Insurance | 0 (0.0%) | 115 (100.0%) |
| Real Estate, Rental & Leasing | 117 (81.2%) | 27 (18.8%) |
| Professional & Scientific | 62 (68.9%) | 28 (31.1%) |
| Enterprise Management | 0 (0.0%) | 0 (0.0%) |
| Administrative & Support | 30 (31.9%) | 64 (68.1%) |
| Educational Services | 352 (31.1%) | 780 (68.9%) |
| Health Care & Social Assistance | 262 (20.1%) | 1,042 (79.9%) |
| Arts, Entertainment & Recreation | 27 (24.5%) | 83 (75.4%) |
| Accommodation & Food Services | 227 (54.3%) | 191 (45.7%) |
| Public Administration | 229 (69.2%) | 102 (30.8%) |
| Total | 3,111 (52.1%) | 2,854 (47.8%) |
Education in Rio Grande City
School Enrollment in Rio Grande City
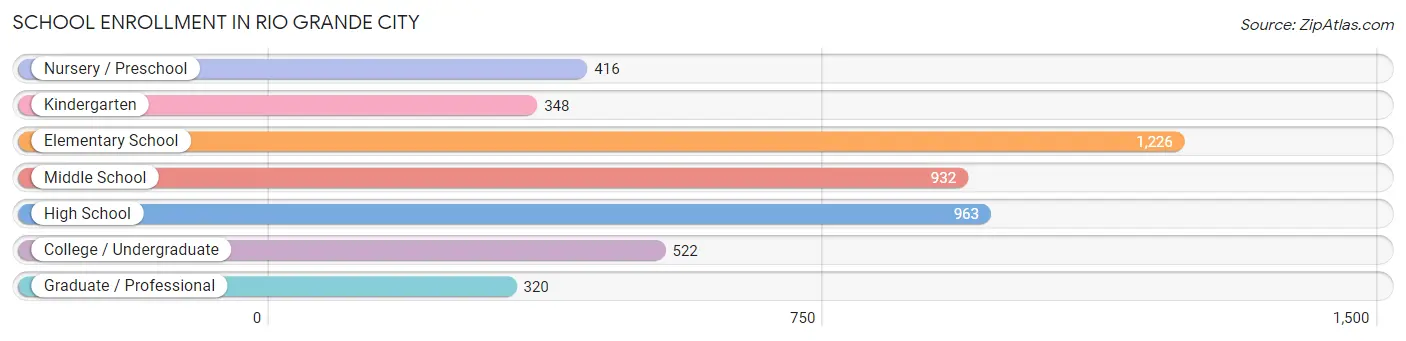
The most common levels of schooling among the 4,727 students in Rio Grande City are elementary school (1,226 | 25.9%), high school (963 | 20.4%), and middle school (932 | 19.7%).
| School Level | # Students | % Students |
| Nursery / Preschool | 416 | 8.8% |
| Kindergarten | 348 | 7.4% |
| Elementary School | 1,226 | 25.9% |
| Middle School | 932 | 19.7% |
| High School | 963 | 20.4% |
| College / Undergraduate | 522 | 11.0% |
| Graduate / Professional | 320 | 6.8% |
| Total | 4,727 | 100.0% |
School Enrollment by Age by Funding Source in Rio Grande City
Out of a total of 4,727 students who are enrolled in schools in Rio Grande City, 109 (2.3%) attend a private institution, while the remaining 4,618 (97.7%) are enrolled in public schools. The age group of 20 to 24 year olds has the highest likelihood of being enrolled in private schools, with 44 (15.4% in the age bracket) enrolled. Conversely, the age group of 3 to 4 year olds has the lowest likelihood of being enrolled in a private school, with 218 (100.0% in the age bracket) attending a public institution.
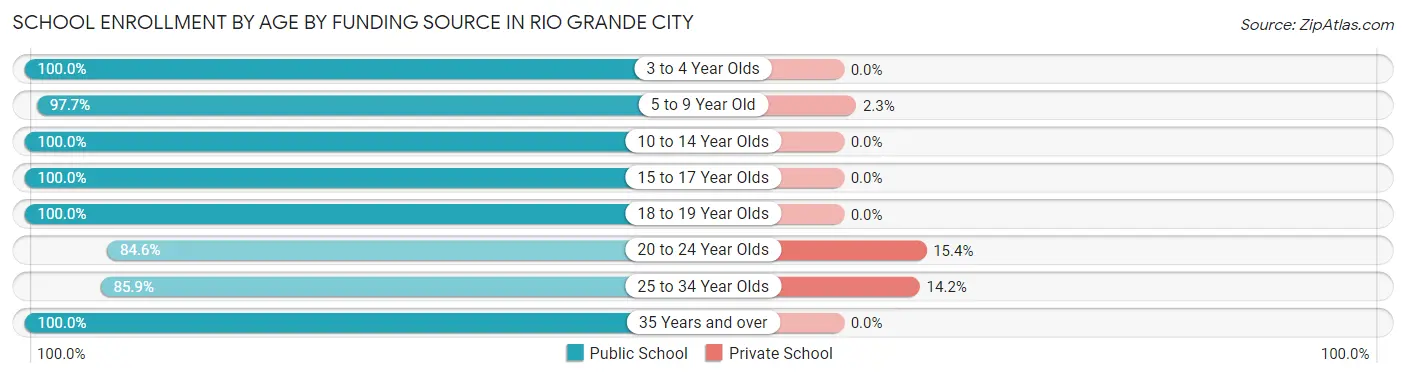
| Age Bracket | Public School | Private School |
| 3 to 4 Year Olds | 218 (100.0%) | 0 (0.0%) |
| 5 to 9 Year Old | 1,533 (97.7%) | 36 (2.3%) |
| 10 to 14 Year Olds | 1,307 (100.0%) | 0 (0.0%) |
| 15 to 17 Year Olds | 764 (100.0%) | 0 (0.0%) |
| 18 to 19 Year Olds | 203 (100.0%) | 0 (0.0%) |
| 20 to 24 Year Olds | 242 (84.6%) | 44 (15.4%) |
| 25 to 34 Year Olds | 182 (85.9%) | 30 (14.1%) |
| 35 Years and over | 168 (100.0%) | 0 (0.0%) |
| Total | 4,618 (97.7%) | 109 (2.3%) |
Educational Attainment by Field of Study in Rio Grande City
Education (311 | 18.7%), science & technology (276 | 16.6%), business (223 | 13.4%), arts & humanities (201 | 12.1%), and social sciences (128 | 7.7%) are the most common fields of study among 1,667 individuals in Rio Grande City who have obtained a bachelor's degree or higher.
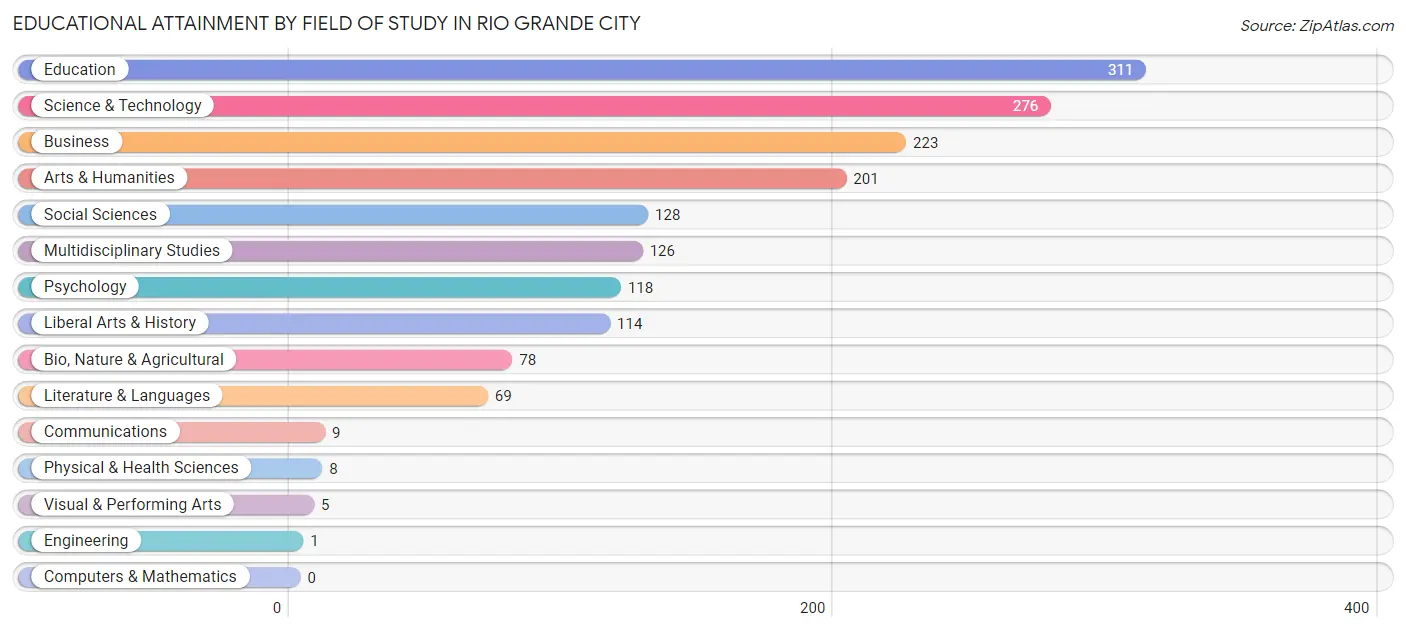
| Field of Study | # Graduates | % Graduates |
| Computers & Mathematics | 0 | 0.0% |
| Bio, Nature & Agricultural | 78 | 4.7% |
| Physical & Health Sciences | 8 | 0.5% |
| Psychology | 118 | 7.1% |
| Social Sciences | 128 | 7.7% |
| Engineering | 1 | 0.1% |
| Multidisciplinary Studies | 126 | 7.6% |
| Science & Technology | 276 | 16.6% |
| Business | 223 | 13.4% |
| Education | 311 | 18.7% |
| Literature & Languages | 69 | 4.1% |
| Liberal Arts & History | 114 | 6.8% |
| Visual & Performing Arts | 5 | 0.3% |
| Communications | 9 | 0.5% |
| Arts & Humanities | 201 | 12.1% |
| Total | 1,667 | 100.0% |
Transportation & Commute in Rio Grande City
Vehicle Availability by Sex in Rio Grande City
The most prevalent vehicle ownership categories in Rio Grande City are males with 2 vehicles (1,300, accounting for 42.6%) and females with 2 vehicles (1,070, making up 46.5%).
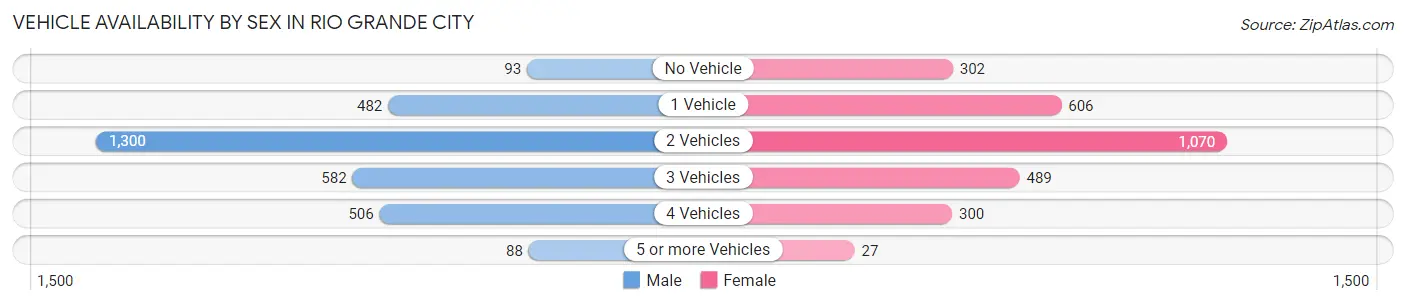
| Vehicles Available | Male | Female |
| No Vehicle | 93 (3.0%) | 302 (10.8%) |
| 1 Vehicle | 482 (15.8%) | 606 (21.7%) |
| 2 Vehicles | 1,300 (42.6%) | 1,070 (38.3%) |
| 3 Vehicles | 582 (19.1%) | 489 (17.5%) |
| 4 Vehicles | 506 (16.6%) | 300 (10.7%) |
| 5 or more Vehicles | 88 (2.9%) | 27 (1.0%) |
| Total | 3,051 (100.0%) | 2,794 (100.0%) |
Commute Time in Rio Grande City
The most frequently occuring commute durations in Rio Grande City are 10 to 14 minutes (1,093 commuters, 20.1%), 15 to 19 minutes (1,068 commuters, 19.7%), and 5 to 9 minutes (909 commuters, 16.7%).
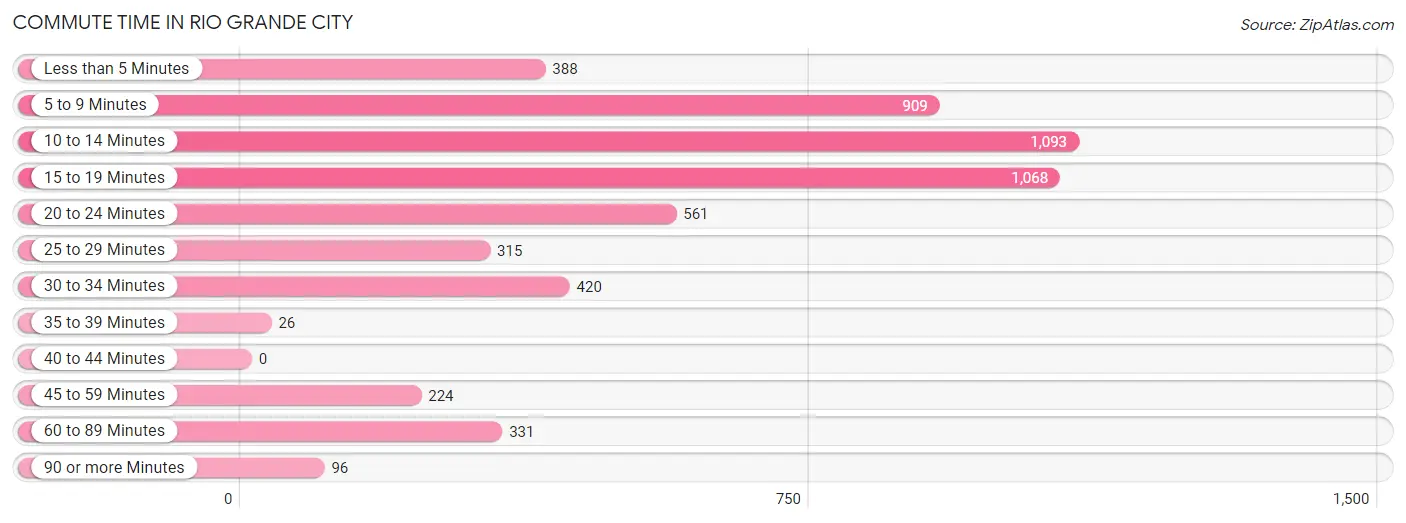
| Commute Time | # Commuters | % Commuters |
| Less than 5 Minutes | 388 | 7.1% |
| 5 to 9 Minutes | 909 | 16.7% |
| 10 to 14 Minutes | 1,093 | 20.1% |
| 15 to 19 Minutes | 1,068 | 19.7% |
| 20 to 24 Minutes | 561 | 10.3% |
| 25 to 29 Minutes | 315 | 5.8% |
| 30 to 34 Minutes | 420 | 7.7% |
| 35 to 39 Minutes | 26 | 0.5% |
| 40 to 44 Minutes | 0 | 0.0% |
| 45 to 59 Minutes | 224 | 4.1% |
| 60 to 89 Minutes | 331 | 6.1% |
| 90 or more Minutes | 96 | 1.8% |
Commute Time by Sex in Rio Grande City
The most common commute times in Rio Grande City are 10 to 14 minutes (584 commuters, 19.5%) for males and 10 to 14 minutes (509 commuters, 20.8%) for females.
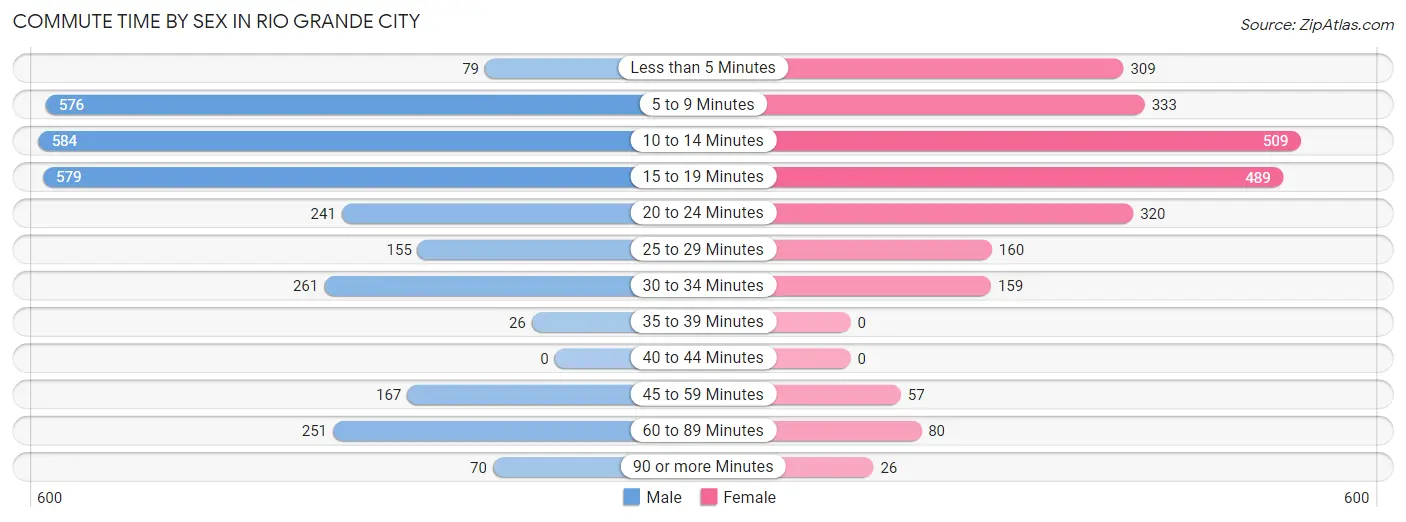
| Commute Time | Male | Female |
| Less than 5 Minutes | 79 (2.6%) | 309 (12.7%) |
| 5 to 9 Minutes | 576 (19.3%) | 333 (13.6%) |
| 10 to 14 Minutes | 584 (19.5%) | 509 (20.8%) |
| 15 to 19 Minutes | 579 (19.4%) | 489 (20.0%) |
| 20 to 24 Minutes | 241 (8.1%) | 320 (13.1%) |
| 25 to 29 Minutes | 155 (5.2%) | 160 (6.6%) |
| 30 to 34 Minutes | 261 (8.7%) | 159 (6.5%) |
| 35 to 39 Minutes | 26 (0.9%) | 0 (0.0%) |
| 40 to 44 Minutes | 0 (0.0%) | 0 (0.0%) |
| 45 to 59 Minutes | 167 (5.6%) | 57 (2.3%) |
| 60 to 89 Minutes | 251 (8.4%) | 80 (3.3%) |
| 90 or more Minutes | 70 (2.3%) | 26 (1.1%) |
Time of Departure to Work by Sex in Rio Grande City
The most frequent times of departure to work in Rio Grande City are 7:30 AM to 7:59 AM (609, 20.4%) for males and 8:00 AM to 8:29 AM (561, 23.0%) for females.
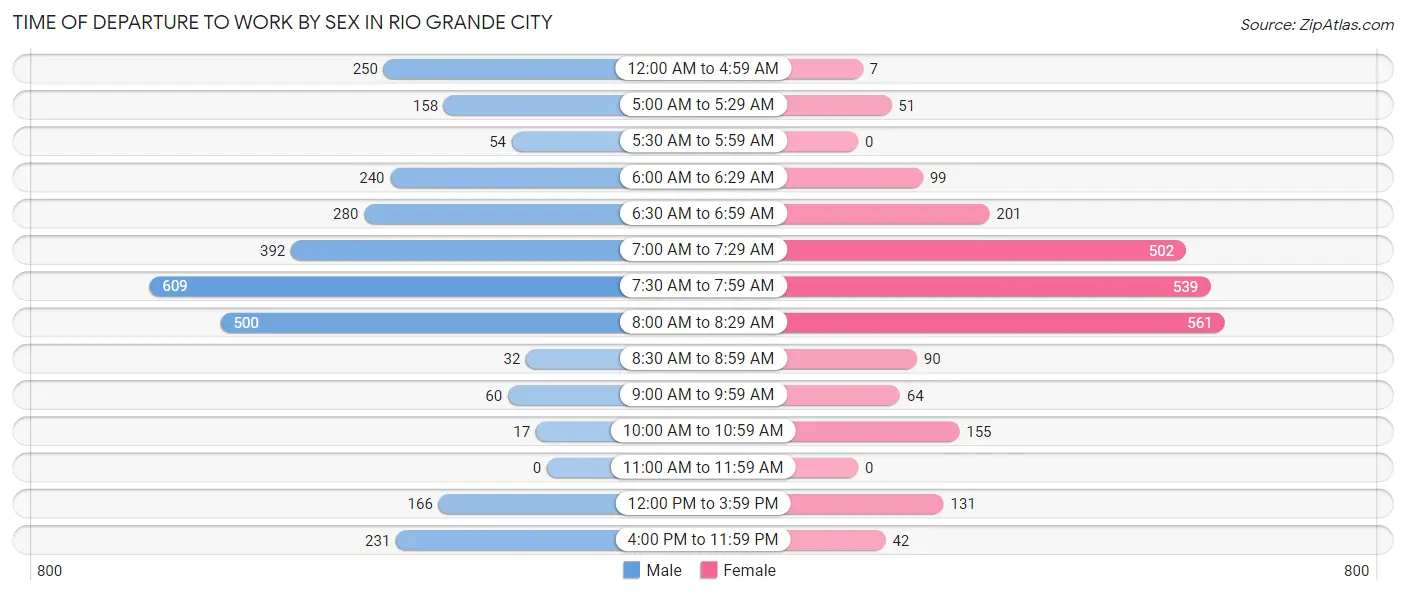
| Time of Departure | Male | Female |
| 12:00 AM to 4:59 AM | 250 (8.4%) | 7 (0.3%) |
| 5:00 AM to 5:29 AM | 158 (5.3%) | 51 (2.1%) |
| 5:30 AM to 5:59 AM | 54 (1.8%) | 0 (0.0%) |
| 6:00 AM to 6:29 AM | 240 (8.0%) | 99 (4.1%) |
| 6:30 AM to 6:59 AM | 280 (9.4%) | 201 (8.2%) |
| 7:00 AM to 7:29 AM | 392 (13.1%) | 502 (20.6%) |
| 7:30 AM to 7:59 AM | 609 (20.4%) | 539 (22.1%) |
| 8:00 AM to 8:29 AM | 500 (16.7%) | 561 (23.0%) |
| 8:30 AM to 8:59 AM | 32 (1.1%) | 90 (3.7%) |
| 9:00 AM to 9:59 AM | 60 (2.0%) | 64 (2.6%) |
| 10:00 AM to 10:59 AM | 17 (0.6%) | 155 (6.4%) |
| 11:00 AM to 11:59 AM | 0 (0.0%) | 0 (0.0%) |
| 12:00 PM to 3:59 PM | 166 (5.6%) | 131 (5.4%) |
| 4:00 PM to 11:59 PM | 231 (7.7%) | 42 (1.7%) |
| Total | 2,989 (100.0%) | 2,442 (100.0%) |
Housing Occupancy in Rio Grande City
Occupancy by Ownership in Rio Grande City
Of the total 4,471 dwellings in Rio Grande City, owner-occupied units account for 3,246 (72.6%), while renter-occupied units make up 1,225 (27.4%).
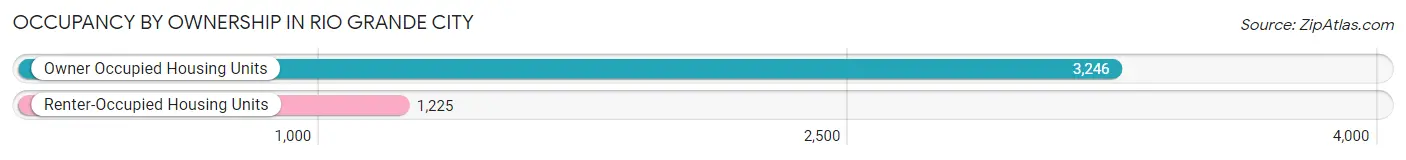
| Occupancy | # Housing Units | % Housing Units |
| Owner Occupied Housing Units | 3,246 | 72.6% |
| Renter-Occupied Housing Units | 1,225 | 27.4% |
| Total Occupied Housing Units | 4,471 | 100.0% |
Occupancy by Household Size in Rio Grande City
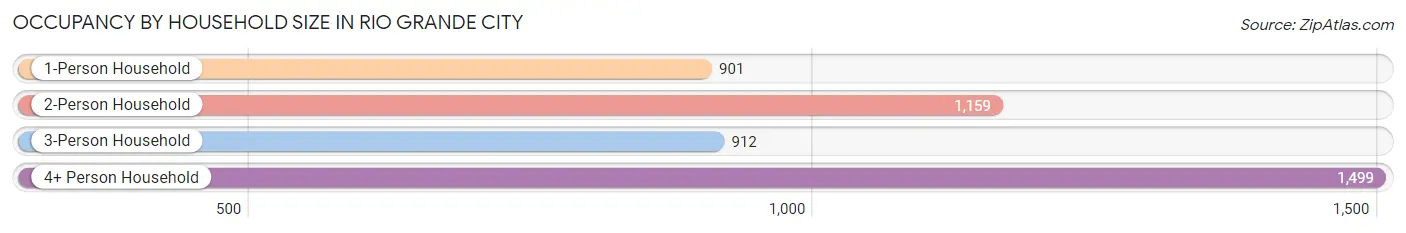
| Household Size | # Housing Units | % Housing Units |
| 1-Person Household | 901 | 20.2% |
| 2-Person Household | 1,159 | 25.9% |
| 3-Person Household | 912 | 20.4% |
| 4+ Person Household | 1,499 | 33.5% |
| Total Housing Units | 4,471 | 100.0% |
Occupancy by Ownership by Household Size in Rio Grande City
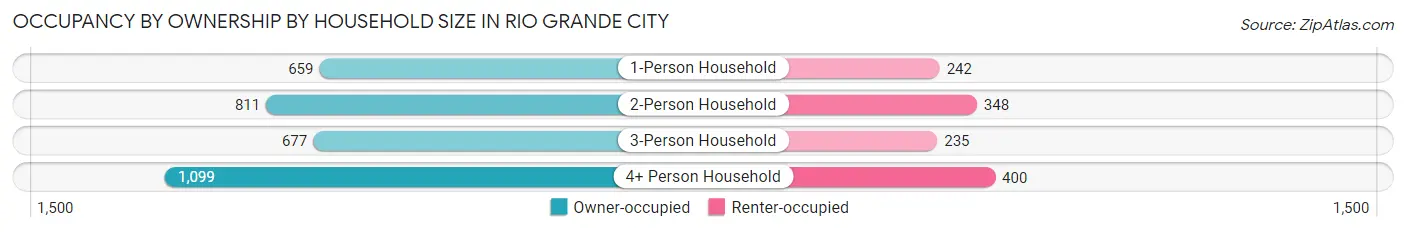
| Household Size | Owner-occupied | Renter-occupied |
| 1-Person Household | 659 (73.1%) | 242 (26.9%) |
| 2-Person Household | 811 (70.0%) | 348 (30.0%) |
| 3-Person Household | 677 (74.2%) | 235 (25.8%) |
| 4+ Person Household | 1,099 (73.3%) | 400 (26.7%) |
| Total Housing Units | 3,246 (72.6%) | 1,225 (27.4%) |
Occupancy by Educational Attainment in Rio Grande City
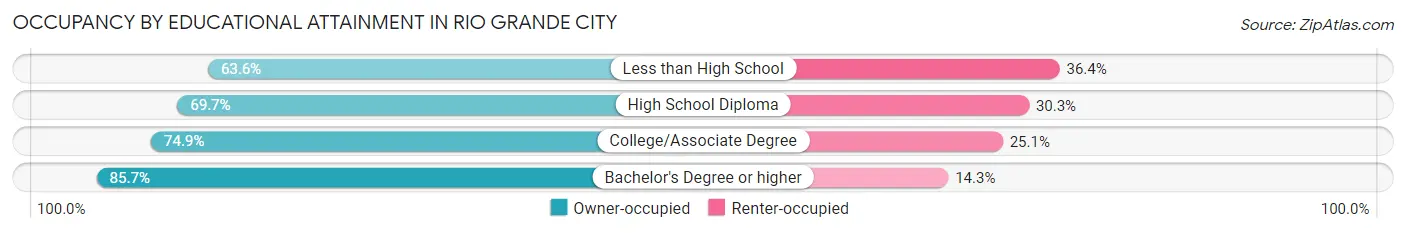
| Household Size | Owner-occupied | Renter-occupied |
| Less than High School | 856 (63.6%) | 489 (36.4%) |
| High School Diploma | 854 (69.7%) | 371 (30.3%) |
| College/Associate Degree | 648 (74.9%) | 217 (25.1%) |
| Bachelor's Degree or higher | 888 (85.7%) | 148 (14.3%) |
Occupancy by Age of Householder in Rio Grande City
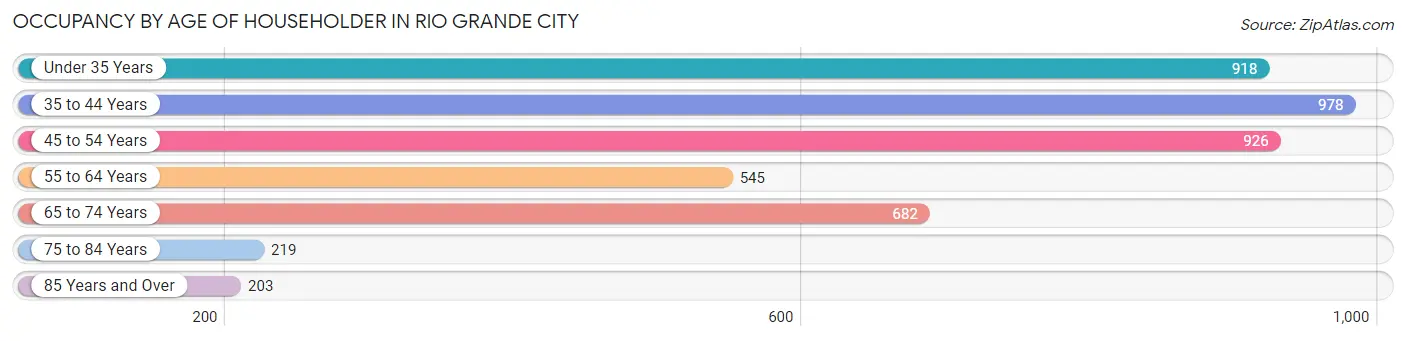
| Age Bracket | # Households | % Households |
| Under 35 Years | 918 | 20.5% |
| 35 to 44 Years | 978 | 21.9% |
| 45 to 54 Years | 926 | 20.7% |
| 55 to 64 Years | 545 | 12.2% |
| 65 to 74 Years | 682 | 15.2% |
| 75 to 84 Years | 219 | 4.9% |
| 85 Years and Over | 203 | 4.5% |
| Total | 4,471 | 100.0% |
Housing Finances in Rio Grande City
Median Income by Occupancy in Rio Grande City
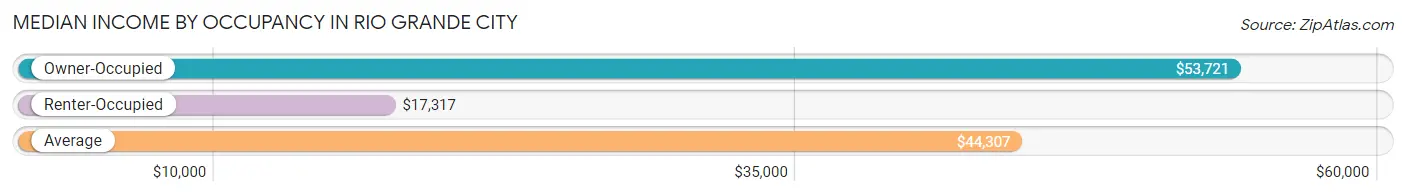
| Occupancy Type | # Households | Median Income |
| Owner-Occupied | 3,246 (72.6%) | $53,721 |
| Renter-Occupied | 1,225 (27.4%) | $17,317 |
| Average | 4,471 (100.0%) | $44,307 |
Occupancy by Householder Income Bracket in Rio Grande City
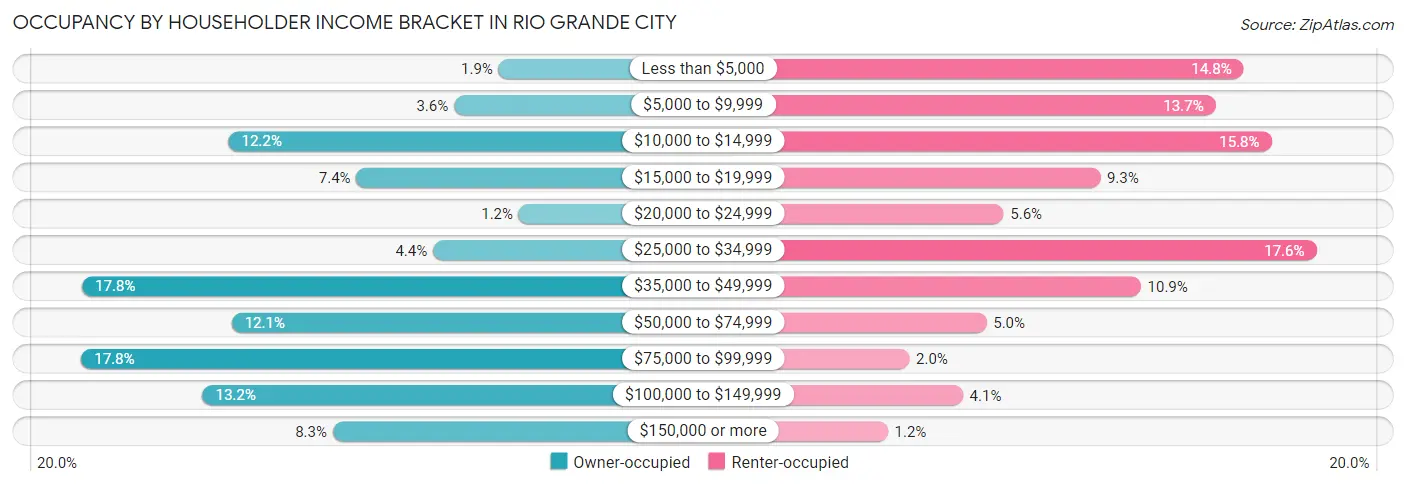
| Income Bracket | Owner-occupied | Renter-occupied |
| Less than $5,000 | 63 (1.9%) | 181 (14.8%) |
| $5,000 to $9,999 | 118 (3.6%) | 168 (13.7%) |
| $10,000 to $14,999 | 397 (12.2%) | 194 (15.8%) |
| $15,000 to $19,999 | 239 (7.4%) | 114 (9.3%) |
| $20,000 to $24,999 | 38 (1.2%) | 69 (5.6%) |
| $25,000 to $34,999 | 144 (4.4%) | 215 (17.5%) |
| $35,000 to $49,999 | 578 (17.8%) | 133 (10.9%) |
| $50,000 to $74,999 | 393 (12.1%) | 61 (5.0%) |
| $75,000 to $99,999 | 579 (17.8%) | 25 (2.0%) |
| $100,000 to $149,999 | 429 (13.2%) | 50 (4.1%) |
| $150,000 or more | 268 (8.3%) | 15 (1.2%) |
| Total | 3,246 (100.0%) | 1,225 (100.0%) |
Monthly Housing Cost Tiers in Rio Grande City
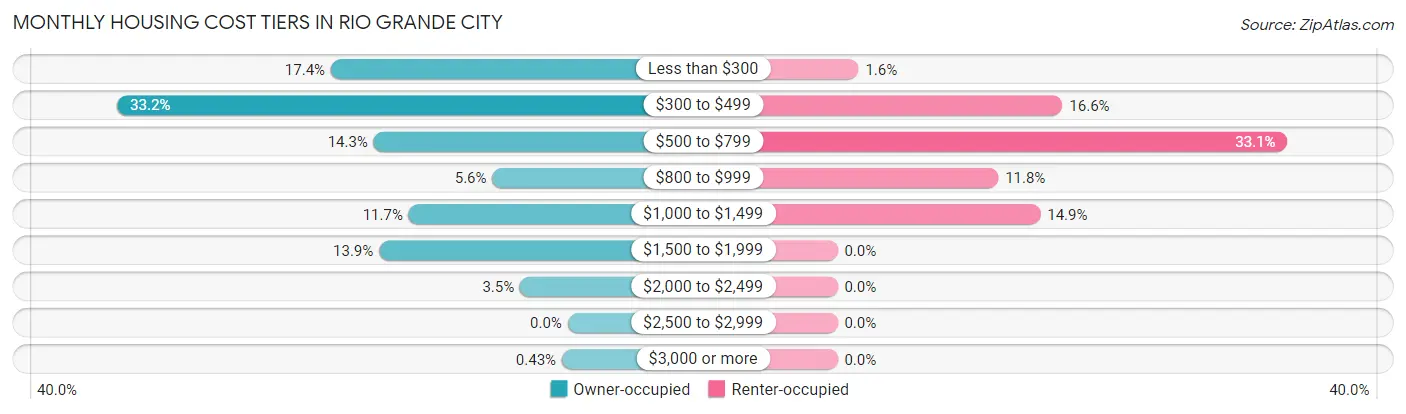
| Monthly Cost | Owner-occupied | Renter-occupied |
| Less than $300 | 566 (17.4%) | 19 (1.5%) |
| $300 to $499 | 1,077 (33.2%) | 203 (16.6%) |
| $500 to $799 | 464 (14.3%) | 406 (33.1%) |
| $800 to $999 | 180 (5.6%) | 145 (11.8%) |
| $1,000 to $1,499 | 380 (11.7%) | 183 (14.9%) |
| $1,500 to $1,999 | 451 (13.9%) | 0 (0.0%) |
| $2,000 to $2,499 | 114 (3.5%) | 0 (0.0%) |
| $2,500 to $2,999 | 0 (0.0%) | 0 (0.0%) |
| $3,000 or more | 14 (0.4%) | 0 (0.0%) |
| Total | 3,246 (100.0%) | 1,225 (100.0%) |
Physical Housing Characteristics in Rio Grande City
Housing Structures in Rio Grande City
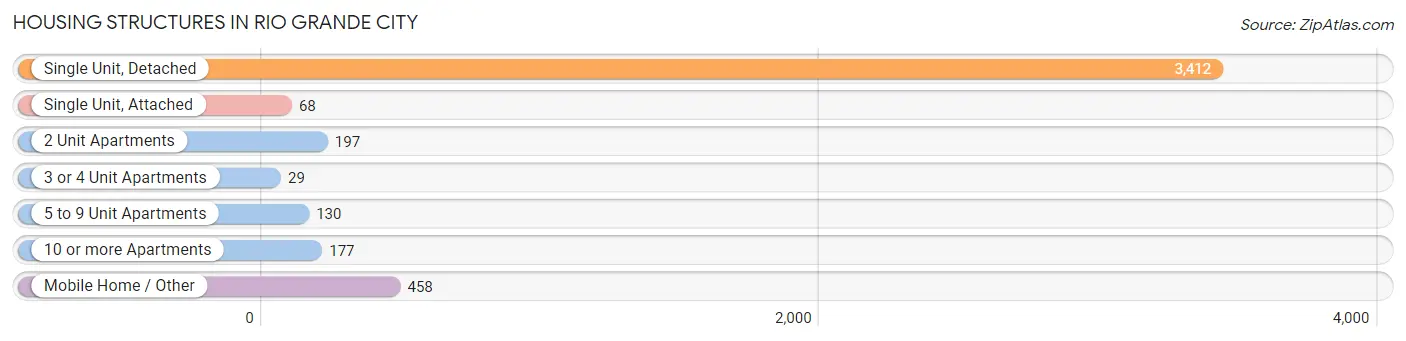
| Structure Type | # Housing Units | % Housing Units |
| Single Unit, Detached | 3,412 | 76.3% |
| Single Unit, Attached | 68 | 1.5% |
| 2 Unit Apartments | 197 | 4.4% |
| 3 or 4 Unit Apartments | 29 | 0.6% |
| 5 to 9 Unit Apartments | 130 | 2.9% |
| 10 or more Apartments | 177 | 4.0% |
| Mobile Home / Other | 458 | 10.2% |
| Total | 4,471 | 100.0% |
Housing Structures by Occupancy in Rio Grande City
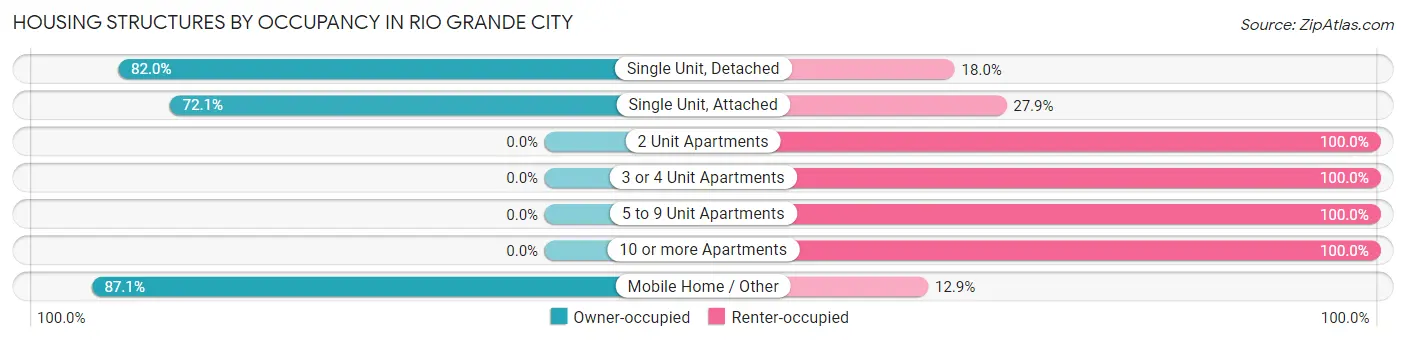
| Structure Type | Owner-occupied | Renter-occupied |
| Single Unit, Detached | 2,798 (82.0%) | 614 (18.0%) |
| Single Unit, Attached | 49 (72.1%) | 19 (27.9%) |
| 2 Unit Apartments | 0 (0.0%) | 197 (100.0%) |
| 3 or 4 Unit Apartments | 0 (0.0%) | 29 (100.0%) |
| 5 to 9 Unit Apartments | 0 (0.0%) | 130 (100.0%) |
| 10 or more Apartments | 0 (0.0%) | 177 (100.0%) |
| Mobile Home / Other | 399 (87.1%) | 59 (12.9%) |
| Total | 3,246 (72.6%) | 1,225 (27.4%) |
Housing Structures by Number of Rooms in Rio Grande City
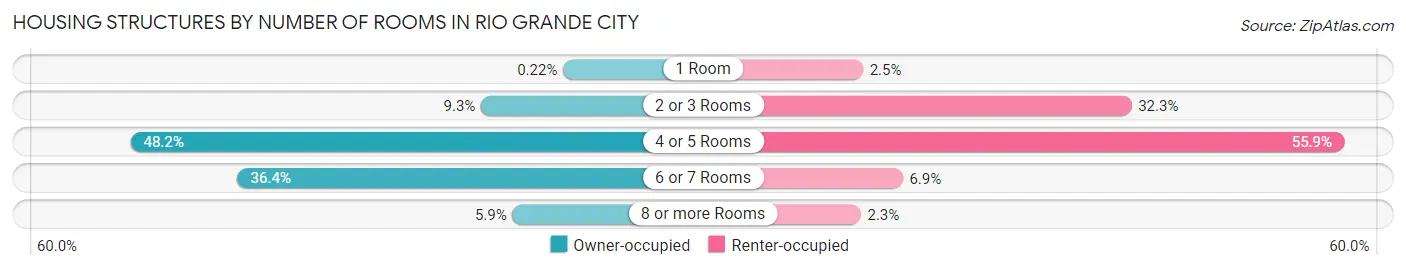
| Number of Rooms | Owner-occupied | Renter-occupied |
| 1 Room | 7 (0.2%) | 31 (2.5%) |
| 2 or 3 Rooms | 303 (9.3%) | 396 (32.3%) |
| 4 or 5 Rooms | 1,566 (48.2%) | 685 (55.9%) |
| 6 or 7 Rooms | 1,180 (36.3%) | 85 (6.9%) |
| 8 or more Rooms | 190 (5.9%) | 28 (2.3%) |
| Total | 3,246 (100.0%) | 1,225 (100.0%) |
Housing Structure by Heating Type in Rio Grande City
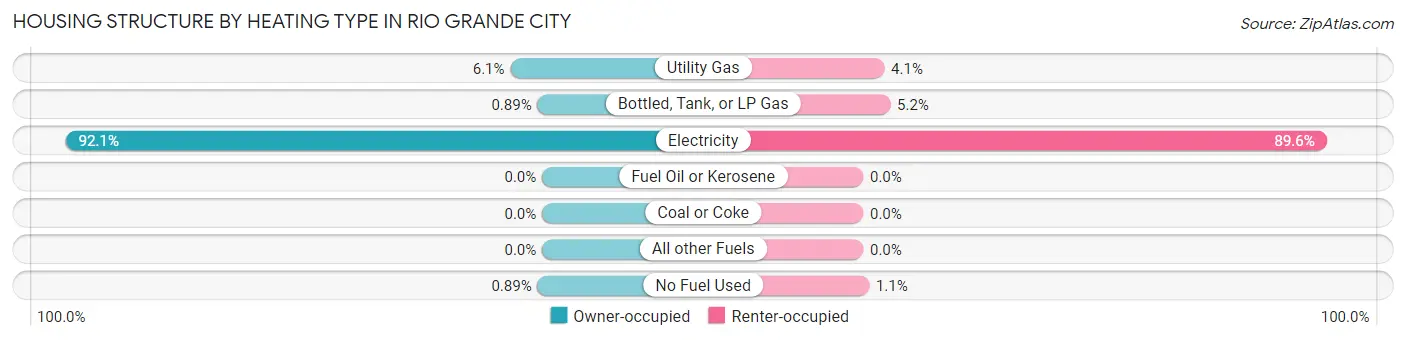
| Heating Type | Owner-occupied | Renter-occupied |
| Utility Gas | 199 (6.1%) | 50 (4.1%) |
| Bottled, Tank, or LP Gas | 29 (0.9%) | 64 (5.2%) |
| Electricity | 2,989 (92.1%) | 1,097 (89.5%) |
| Fuel Oil or Kerosene | 0 (0.0%) | 0 (0.0%) |
| Coal or Coke | 0 (0.0%) | 0 (0.0%) |
| All other Fuels | 0 (0.0%) | 0 (0.0%) |
| No Fuel Used | 29 (0.9%) | 14 (1.1%) |
| Total | 3,246 (100.0%) | 1,225 (100.0%) |
Household Vehicle Usage in Rio Grande City
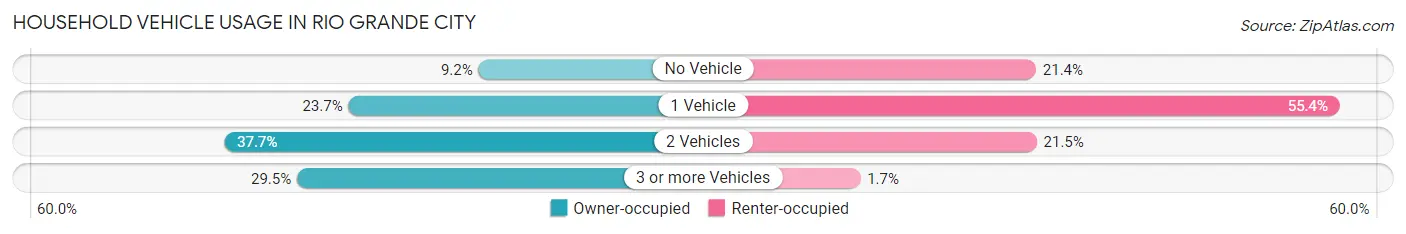
| Vehicles per Household | Owner-occupied | Renter-occupied |
| No Vehicle | 297 (9.1%) | 262 (21.4%) |
| 1 Vehicle | 770 (23.7%) | 679 (55.4%) |
| 2 Vehicles | 1,222 (37.7%) | 263 (21.5%) |
| 3 or more Vehicles | 957 (29.5%) | 21 (1.7%) |
| Total | 3,246 (100.0%) | 1,225 (100.0%) |
Real Estate & Mortgages in Rio Grande City
Real Estate and Mortgage Overview in Rio Grande City
| Characteristic | Without Mortgage | With Mortgage |
| Housing Units | 2,256 | 990 |
| Median Property Value | $89,000 | $137,000 |
| Median Household Income | $45,783 | $91 |
| Monthly Housing Costs | $389 | $14 |
| Real Estate Taxes | $1,204 | $50 |
Property Value by Mortgage Status in Rio Grande City
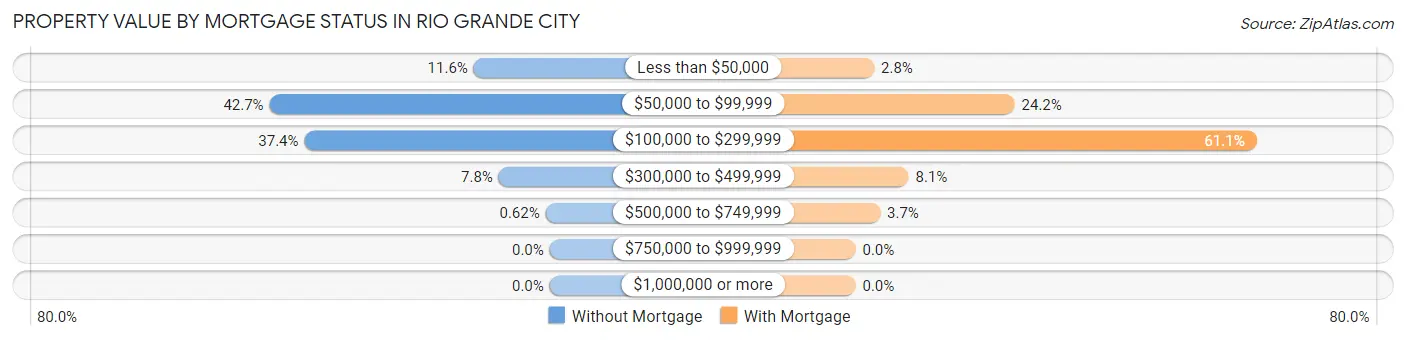
| Property Value | Without Mortgage | With Mortgage |
| Less than $50,000 | 261 (11.6%) | 28 (2.8%) |
| $50,000 to $99,999 | 963 (42.7%) | 240 (24.2%) |
| $100,000 to $299,999 | 843 (37.4%) | 605 (61.1%) |
| $300,000 to $499,999 | 175 (7.8%) | 80 (8.1%) |
| $500,000 to $749,999 | 14 (0.6%) | 37 (3.7%) |
| $750,000 to $999,999 | 0 (0.0%) | 0 (0.0%) |
| $1,000,000 or more | 0 (0.0%) | 0 (0.0%) |
| Total | 2,256 (100.0%) | 990 (100.0%) |
Household Income by Mortgage Status in Rio Grande City
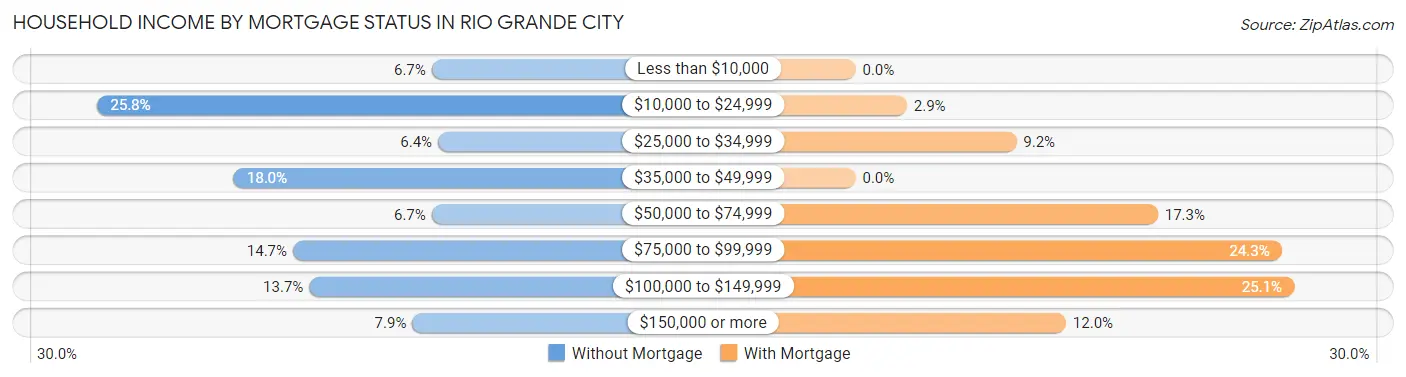
| Household Income | Without Mortgage | With Mortgage |
| Less than $10,000 | 152 (6.7%) | 0 (0.0%) |
| $10,000 to $24,999 | 583 (25.8%) | 29 (2.9%) |
| $25,000 to $34,999 | 144 (6.4%) | 91 (9.2%) |
| $35,000 to $49,999 | 407 (18.0%) | 0 (0.0%) |
| $50,000 to $74,999 | 152 (6.7%) | 171 (17.3%) |
| $75,000 to $99,999 | 331 (14.7%) | 241 (24.3%) |
| $100,000 to $149,999 | 310 (13.7%) | 248 (25.1%) |
| $150,000 or more | 177 (7.9%) | 119 (12.0%) |
| Total | 2,256 (100.0%) | 990 (100.0%) |
Property Value to Household Income Ratio in Rio Grande City
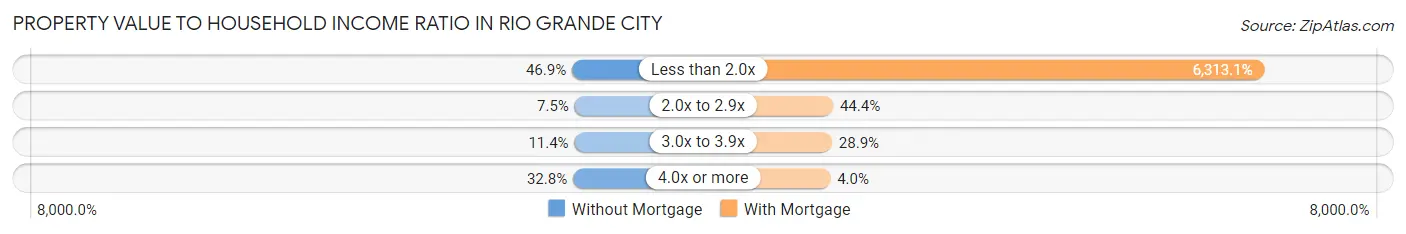
| Value-to-Income Ratio | Without Mortgage | With Mortgage |
| Less than 2.0x | 1,057 (46.9%) | 62,500 (6,313.1%) |
| 2.0x to 2.9x | 168 (7.4%) | 440 (44.4%) |
| 3.0x to 3.9x | 256 (11.4%) | 286 (28.9%) |
| 4.0x or more | 739 (32.8%) | 40 (4.0%) |
| Total | 2,256 (100.0%) | 990 (100.0%) |
Real Estate Taxes by Mortgage Status in Rio Grande City
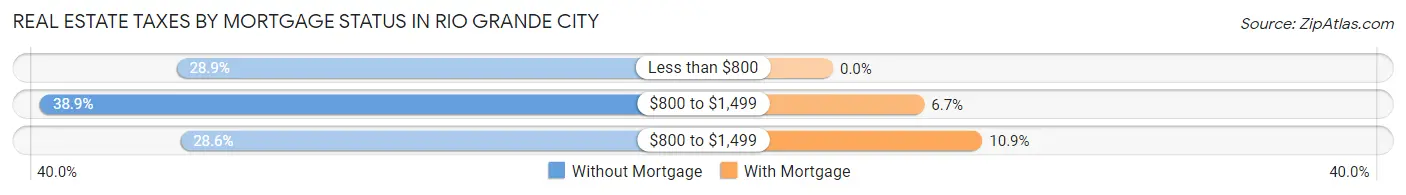
| Property Taxes | Without Mortgage | With Mortgage |
| Less than $800 | 652 (28.9%) | 0 (0.0%) |
| $800 to $1,499 | 877 (38.9%) | 66 (6.7%) |
| $800 to $1,499 | 646 (28.6%) | 108 (10.9%) |
| Total | 2,256 (100.0%) | 990 (100.0%) |
Health & Disability in Rio Grande City
Health Insurance Coverage by Age in Rio Grande City
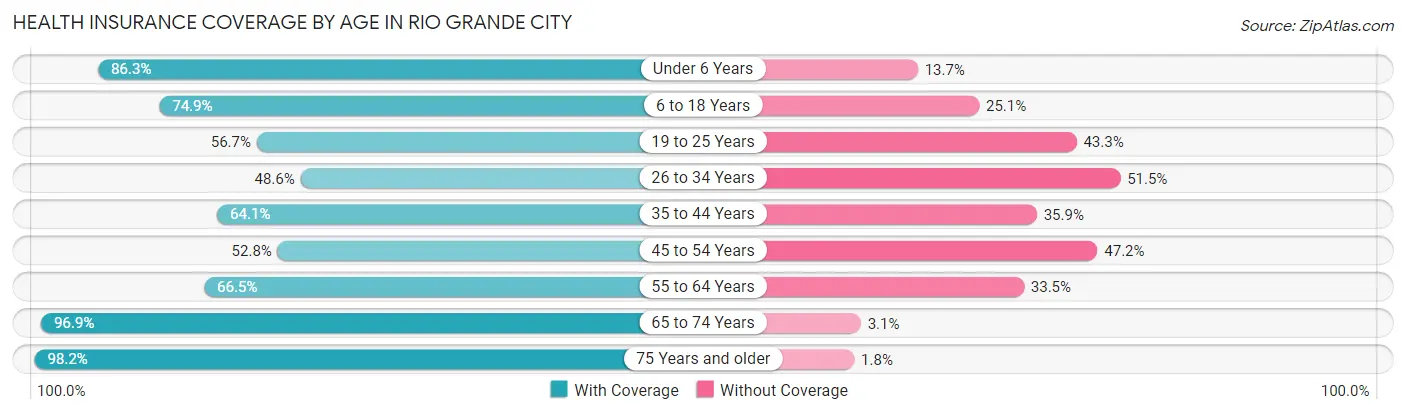
| Age Bracket | With Coverage | Without Coverage |
| Under 6 Years | 1,425 (86.3%) | 226 (13.7%) |
| 6 to 18 Years | 2,500 (74.9%) | 839 (25.1%) |
| 19 to 25 Years | 1,007 (56.7%) | 769 (43.3%) |
| 26 to 34 Years | 755 (48.5%) | 800 (51.4%) |
| 35 to 44 Years | 1,320 (64.1%) | 739 (35.9%) |
| 45 to 54 Years | 846 (52.8%) | 756 (47.2%) |
| 55 to 64 Years | 757 (66.5%) | 381 (33.5%) |
| 65 to 74 Years | 983 (96.9%) | 31 (3.1%) |
| 75 Years and older | 586 (98.2%) | 11 (1.8%) |
| Total | 10,179 (69.1%) | 4,552 (30.9%) |
Health Insurance Coverage by Citizenship Status in Rio Grande City
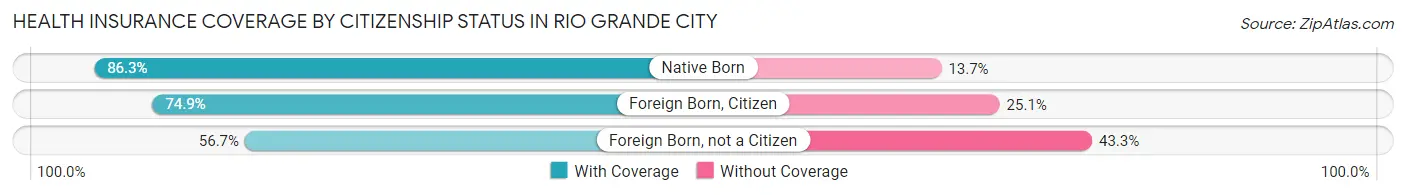
| Citizenship Status | With Coverage | Without Coverage |
| Native Born | 1,425 (86.3%) | 226 (13.7%) |
| Foreign Born, Citizen | 2,500 (74.9%) | 839 (25.1%) |
| Foreign Born, not a Citizen | 1,007 (56.7%) | 769 (43.3%) |
Health Insurance Coverage by Household Income in Rio Grande City
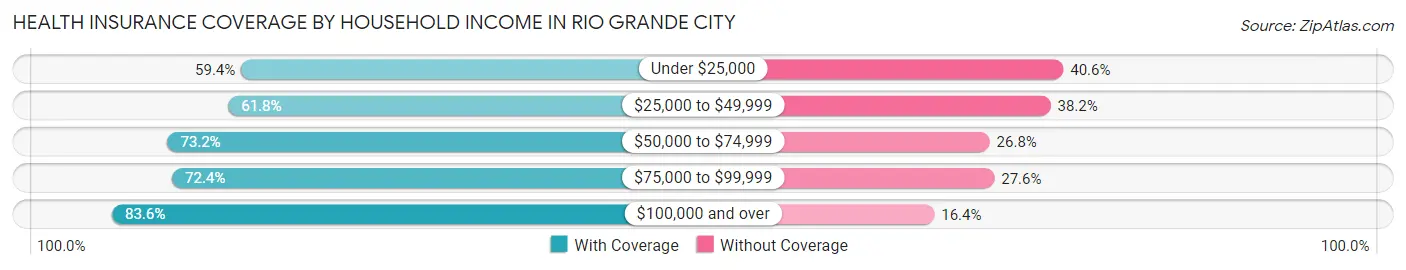
| Household Income | With Coverage | Without Coverage |
| Under $25,000 | 2,386 (59.4%) | 1,628 (40.6%) |
| $25,000 to $49,999 | 2,137 (61.8%) | 1,319 (38.2%) |
| $50,000 to $74,999 | 1,094 (73.2%) | 400 (26.8%) |
| $75,000 to $99,999 | 1,652 (72.4%) | 631 (27.6%) |
| $100,000 and over | 2,902 (83.6%) | 569 (16.4%) |
Public vs Private Health Insurance Coverage by Age in Rio Grande City
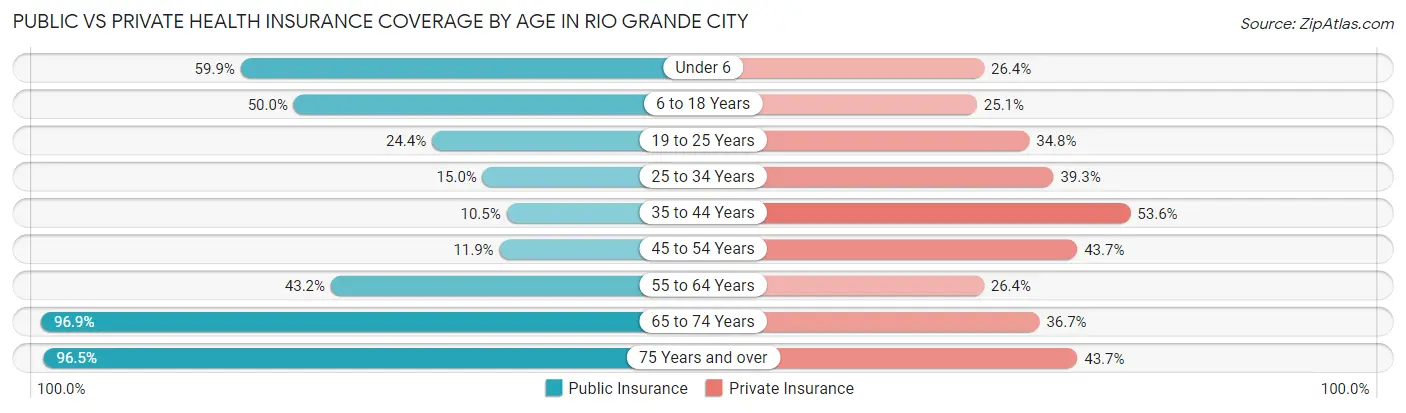
| Age Bracket | Public Insurance | Private Insurance |
| Under 6 | 989 (59.9%) | 436 (26.4%) |
| 6 to 18 Years | 1,671 (50.0%) | 837 (25.1%) |
| 19 to 25 Years | 433 (24.4%) | 618 (34.8%) |
| 25 to 34 Years | 233 (15.0%) | 611 (39.3%) |
| 35 to 44 Years | 217 (10.5%) | 1,103 (53.6%) |
| 45 to 54 Years | 190 (11.9%) | 700 (43.7%) |
| 55 to 64 Years | 491 (43.1%) | 300 (26.4%) |
| 65 to 74 Years | 983 (96.9%) | 372 (36.7%) |
| 75 Years and over | 576 (96.5%) | 261 (43.7%) |
| Total | 5,783 (39.3%) | 5,238 (35.6%) |
Disability Status by Sex by Age in Rio Grande City
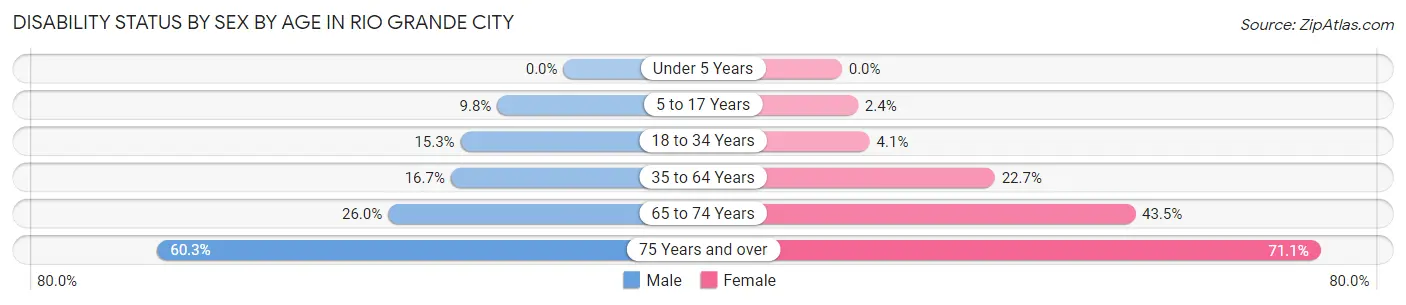
| Age Bracket | Male | Female |
| Under 5 Years | 0 (0.0%) | 0 (0.0%) |
| 5 to 17 Years | 181 (9.8%) | 45 (2.4%) |
| 18 to 34 Years | 270 (15.3%) | 69 (4.1%) |
| 35 to 64 Years | 388 (16.7%) | 563 (22.7%) |
| 65 to 74 Years | 133 (26.0%) | 219 (43.5%) |
| 75 Years and over | 164 (60.3%) | 231 (71.1%) |
Disability Class by Sex by Age in Rio Grande City
Disability Class: Hearing Difficulty
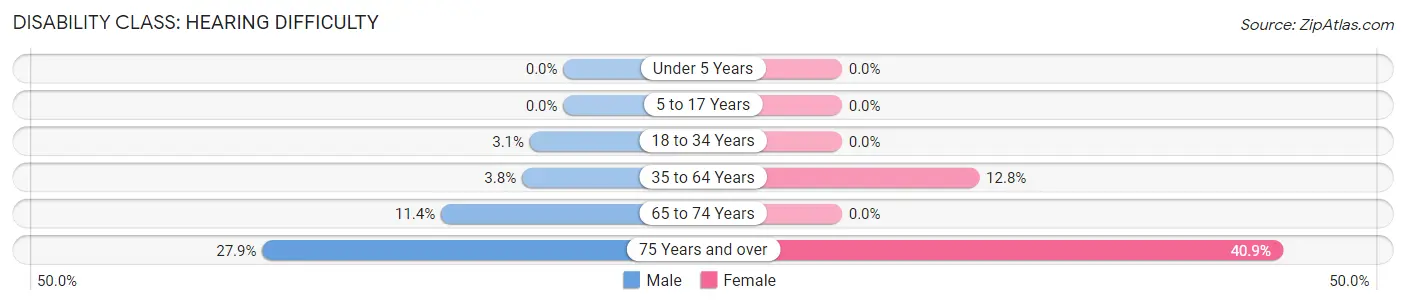
| Age Bracket | Male | Female |
| Under 5 Years | 0 (0.0%) | 0 (0.0%) |
| 5 to 17 Years | 0 (0.0%) | 0 (0.0%) |
| 18 to 34 Years | 55 (3.1%) | 0 (0.0%) |
| 35 to 64 Years | 89 (3.8%) | 316 (12.8%) |
| 65 to 74 Years | 58 (11.4%) | 0 (0.0%) |
| 75 Years and over | 76 (27.9%) | 133 (40.9%) |
Disability Class: Vision Difficulty
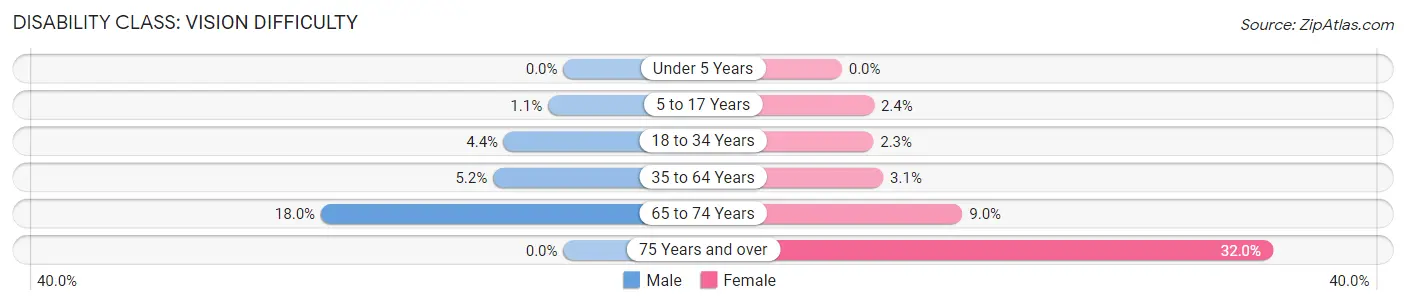
| Age Bracket | Male | Female |
| Under 5 Years | 0 (0.0%) | 0 (0.0%) |
| 5 to 17 Years | 21 (1.1%) | 45 (2.4%) |
| 18 to 34 Years | 78 (4.4%) | 39 (2.3%) |
| 35 to 64 Years | 121 (5.2%) | 76 (3.1%) |
| 65 to 74 Years | 92 (18.0%) | 45 (8.9%) |
| 75 Years and over | 0 (0.0%) | 104 (32.0%) |
Disability Class: Cognitive Difficulty
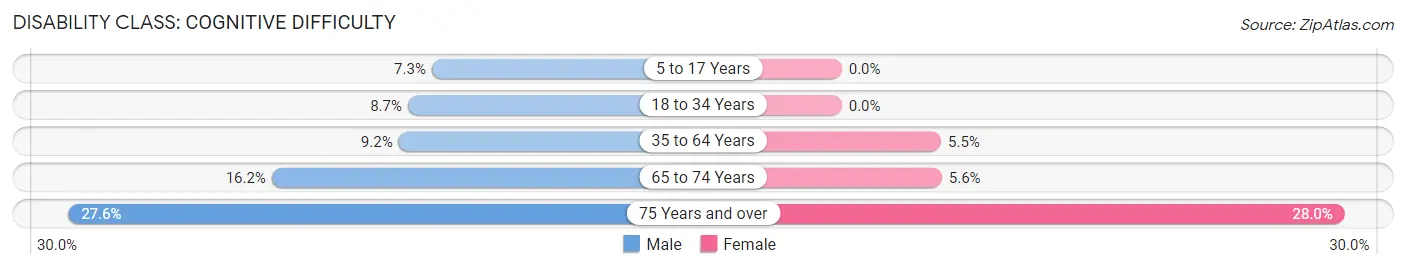
| Age Bracket | Male | Female |
| 5 to 17 Years | 135 (7.3%) | 0 (0.0%) |
| 18 to 34 Years | 153 (8.7%) | 0 (0.0%) |
| 35 to 64 Years | 213 (9.2%) | 137 (5.5%) |
| 65 to 74 Years | 83 (16.2%) | 28 (5.6%) |
| 75 Years and over | 75 (27.6%) | 91 (28.0%) |
Disability Class: Ambulatory Difficulty
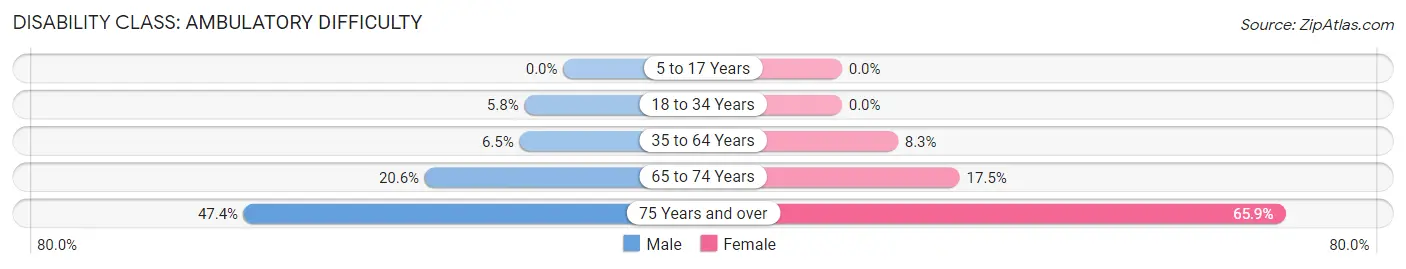
| Age Bracket | Male | Female |
| 5 to 17 Years | 0 (0.0%) | 0 (0.0%) |
| 18 to 34 Years | 102 (5.8%) | 0 (0.0%) |
| 35 to 64 Years | 151 (6.5%) | 206 (8.3%) |
| 65 to 74 Years | 105 (20.5%) | 88 (17.5%) |
| 75 Years and over | 129 (47.4%) | 214 (65.8%) |
Disability Class: Self-Care Difficulty
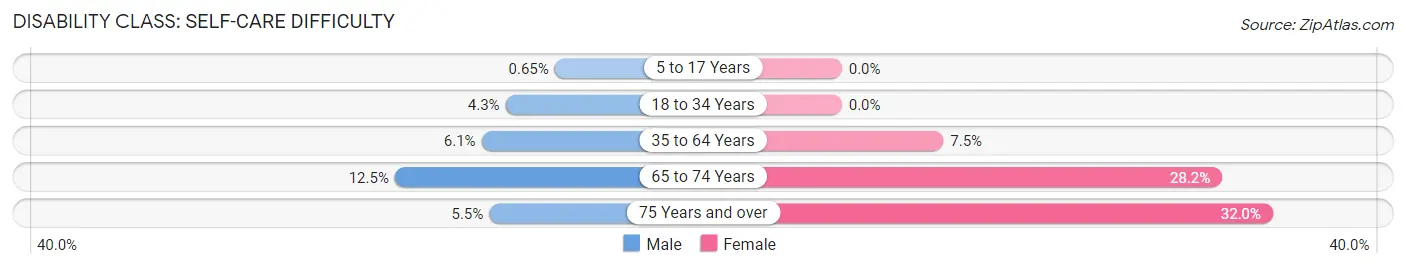
| Age Bracket | Male | Female |
| 5 to 17 Years | 12 (0.6%) | 0 (0.0%) |
| 18 to 34 Years | 76 (4.3%) | 0 (0.0%) |
| 35 to 64 Years | 141 (6.1%) | 187 (7.5%) |
| 65 to 74 Years | 64 (12.5%) | 142 (28.2%) |
| 75 Years and over | 15 (5.5%) | 104 (32.0%) |
Technology Access in Rio Grande City
Computing Device Access in Rio Grande City
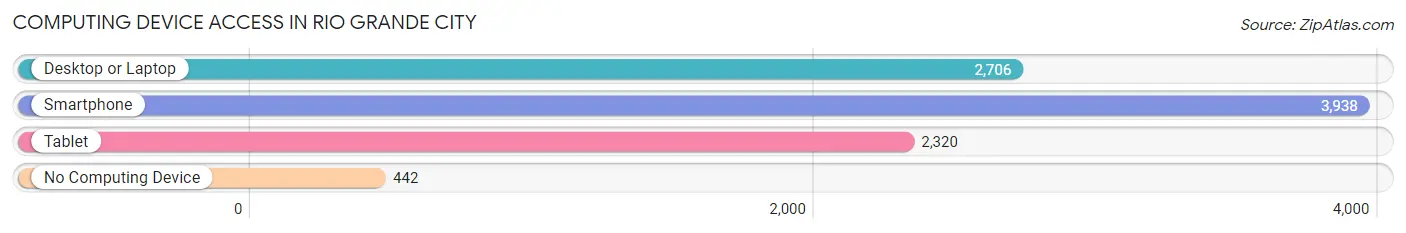
| Device Type | # Households | % Households |
| Desktop or Laptop | 2,706 | 60.5% |
| Smartphone | 3,938 | 88.1% |
| Tablet | 2,320 | 51.9% |
| No Computing Device | 442 | 9.9% |
| Total | 4,471 | 100.0% |
Internet Access in Rio Grande City
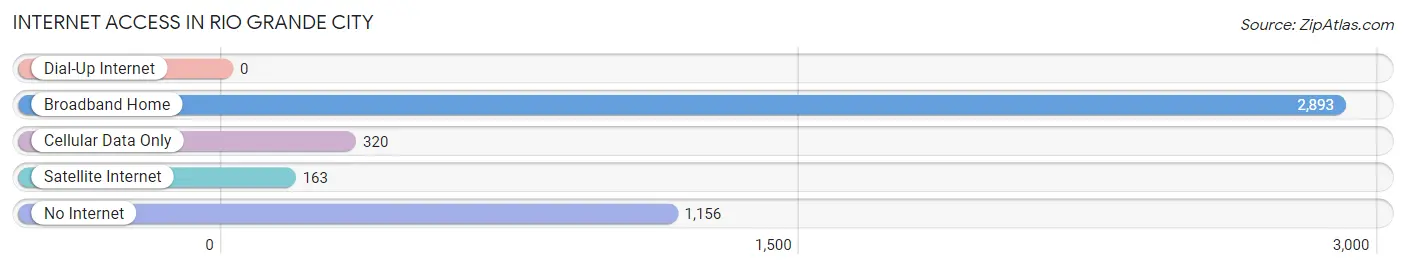
| Internet Type | # Households | % Households |
| Dial-Up Internet | 0 | 0.0% |
| Broadband Home | 2,893 | 64.7% |
| Cellular Data Only | 320 | 7.2% |
| Satellite Internet | 163 | 3.6% |
| No Internet | 1,156 | 25.9% |
| Total | 4,471 | 100.0% |
Rio Grande City Summary
Rio Grande City is a city located in Starr County, Texas, United States. It is the county seat of Starr County and is located along the Rio Grande, across from the Mexican city of Miguel Alemán. As of the 2010 census, the city had a population of 9,834.
History
Rio Grande City was founded in 1848 by José Antonio Saucedo, a Mexican rancher. The city was named after the Rio Grande, which forms the border between the United States and Mexico. The city was originally part of the Mexican state of Tamaulipas, but was annexed by the United States after the Mexican-American War in 1848.
In the late 19th century, the city was a major center of trade between the United States and Mexico. The city was also a major center of the cattle industry, with many ranches in the area.
In the early 20th century, the city was a major center of the Mexican Revolution. The city was the site of several battles between the forces of Pancho Villa and the Mexican government.
Geography
Rio Grande City is located in Starr County, Texas, at the intersection of U.S. Route 83 and State Highway 44. The city is located along the Rio Grande, across from the Mexican city of Miguel Alemán. The city is located about 40 miles (64 km) west of McAllen, Texas, and about 120 miles (193 km) south of San Antonio, Texas.
The city has a total area of 4 2 square miles 10 8 km2 all of it land
Economy
Rio Grande City is a major center of trade between the United States and Mexico. The city is home to several major manufacturing plants, including a Coca-Cola bottling plant and a Nestlé plant. The city is also a major center of the cattle industry, with many ranches in the area.
The city is home to several major retail stores, including Walmart, Target, and Lowe's. The city is also home to several restaurants, including Mexican, American, and Italian cuisine.
Demographics
As of the 2010 census, the city had a population of 9,834. The racial makeup of the city was 77.3% White, 0.7% African American, 0.3% Native American, 0.2% Asian, 0.1% Pacific Islander, 19.7% from other races, and 1.9% from two or more races. Hispanic or Latino of any race were 97.2% of the population.
The median income for a household in the city was $20,917, and the median income for a family was $25,917. The per capita income for the city was $9,834. About 33.3% of families and 37.2% of the population were below the poverty line, including 45.2% of those under age 18 and 33.3% of those age 65 or over.
Common Questions
What is Per Capita Income in Rio Grande City?
Per Capita income in Rio Grande City is $20,612.
What is the Median Family Income in Rio Grande City?
Median Family Income in Rio Grande City is $46,791.
What is the Median Household income in Rio Grande City?
Median Household Income in Rio Grande City is $44,307.
What is Income or Wage Gap in Rio Grande City?
Income or Wage Gap in Rio Grande City is 7.2%.
Women in Rio Grande City earn 92.8 cents for every dollar earned by a man.
What is Inequality or Gini Index in Rio Grande City?
Inequality or Gini Index in Rio Grande City is 0.55.
What is the Total Population of Rio Grande City?
Total Population of Rio Grande City is 15,256.
What is the Total Male Population of Rio Grande City?
Total Male Population of Rio Grande City is 7,805.
What is the Total Female Population of Rio Grande City?
Total Female Population of Rio Grande City is 7,451.
What is the Ratio of Males per 100 Females in Rio Grande City?
There are 104.75 Males per 100 Females in Rio Grande City.
What is the Ratio of Females per 100 Males in Rio Grande City?
There are 95.46 Females per 100 Males in Rio Grande City.
What is the Median Population Age in Rio Grande City?
Median Population Age in Rio Grande City is 30.2 Years.
What is the Average Family Size in Rio Grande City
Average Family Size in Rio Grande City is 3.8 People.
What is the Average Household Size in Rio Grande City
Average Household Size in Rio Grande City is 3.3 People.
How Large is the Labor Force in Rio Grande City?
There are 6,545 People in the Labor Forcein in Rio Grande City.
What is the Percentage of People in the Labor Force in Rio Grande City?
60.1% of People are in the Labor Force in Rio Grande City.
What is the Unemployment Rate in Rio Grande City?
Unemployment Rate in Rio Grande City is 8.9%.