Ralls, TX Map & Demographics
Ralls Map
Ralls Overview
$23,271
PER CAPITA INCOME
$65,273
AVG FAMILY INCOME
$51,767
AVG HOUSEHOLD INCOME
46.0%
WAGE / INCOME GAP [ % ]
54.0¢/ $1
WAGE / INCOME GAP [ $ ]
0.37
INEQUALITY / GINI INDEX
1,634
TOTAL POPULATION
791
MALE POPULATION
843
FEMALE POPULATION
93.83
MALES / 100 FEMALES
106.57
FEMALES / 100 MALES
40.9
MEDIAN AGE
2.8
AVG FAMILY SIZE
2.4
AVG HOUSEHOLD SIZE
892
LABOR FORCE [ PEOPLE ]
70.0%
PERCENT IN LABOR FORCE
5.3%
UNEMPLOYMENT RATE
Ralls Zip Codes
Ralls Area Codes
Income in Ralls
Income Overview in Ralls
Per Capita Income in Ralls is $23,271, while median incomes of families and households are $65,273 and $51,767 respectively.
| Characteristic | Number | Measure |
| Per Capita Income | 1,634 | $23,271 |
| Median Family Income | 502 | $65,273 |
| Mean Family Income | 502 | $65,807 |
| Median Household Income | 677 | $51,767 |
| Mean Household Income | 677 | $58,188 |
| Income Deficit | 502 | $0 |
| Wage / Income Gap (%) | 1,634 | 45.99% |
| Wage / Income Gap ($) | 1,634 | 54.01¢ per $1 |
| Gini / Inequality Index | 1,634 | 0.37 |
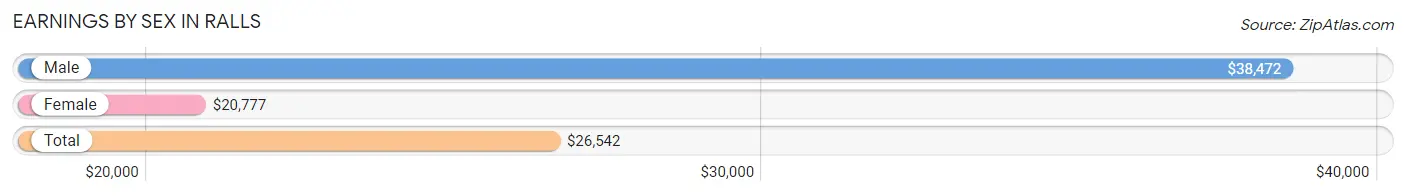
Earnings by Sex in Ralls
Average Earnings in Ralls are $26,542, $38,472 for men and $20,777 for women, a difference of 46.0%.
| Sex | Number | Average Earnings |
| Male | 478 (53.2%) | $38,472 |
| Female | 421 (46.8%) | $20,777 |
| Total | 899 (100.0%) | $26,542 |
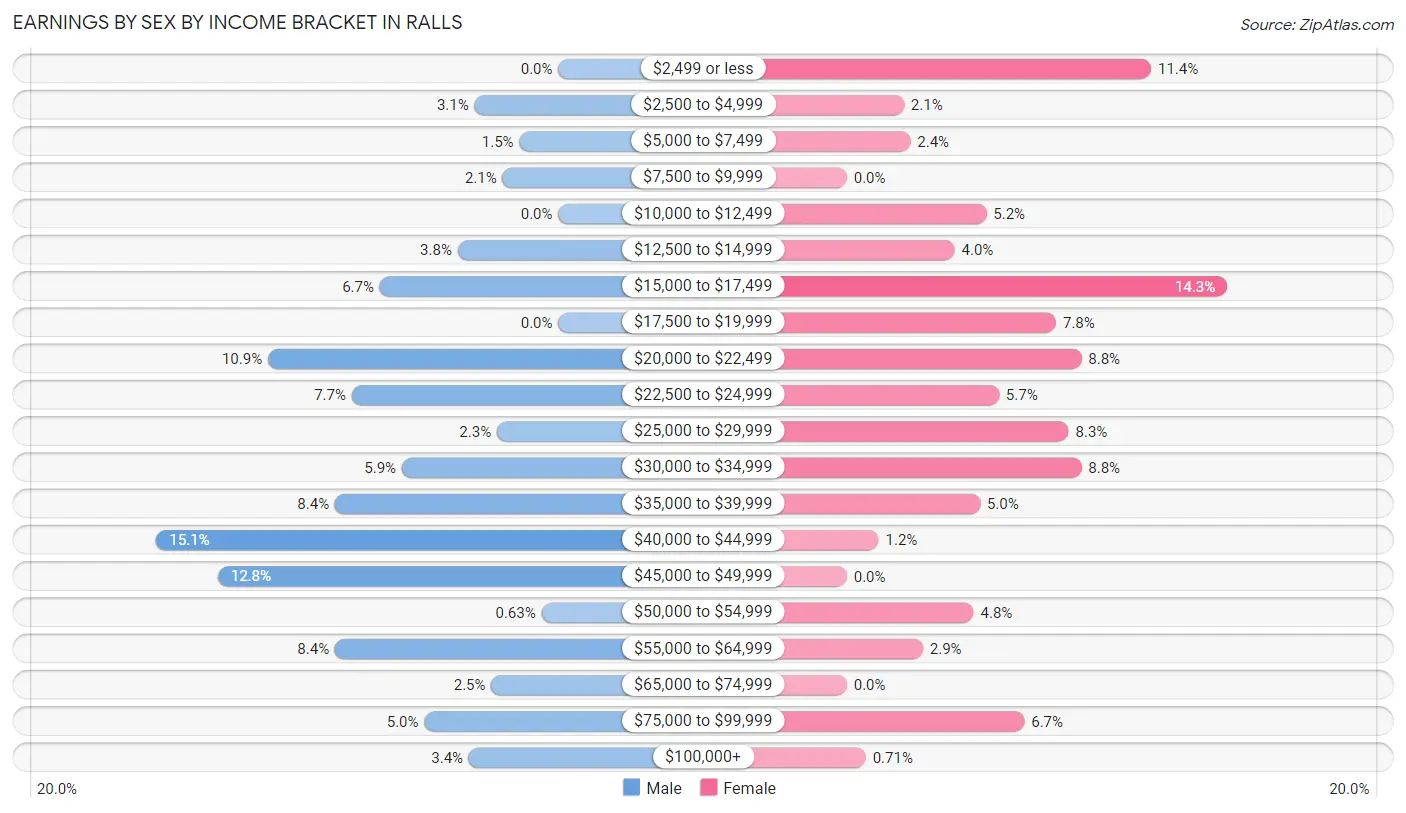
Earnings by Sex by Income Bracket in Ralls
The most common earnings brackets in Ralls are $40,000 to $44,999 for men (72 | 15.1%) and $15,000 to $17,499 for women (60 | 14.2%).
| Income | Male | Female |
| $2,499 or less | 0 (0.0%) | 48 (11.4%) |
| $2,500 to $4,999 | 15 (3.1%) | 9 (2.1%) |
| $5,000 to $7,499 | 7 (1.5%) | 10 (2.4%) |
| $7,500 to $9,999 | 10 (2.1%) | 0 (0.0%) |
| $10,000 to $12,499 | 0 (0.0%) | 22 (5.2%) |
| $12,500 to $14,999 | 18 (3.8%) | 17 (4.0%) |
| $15,000 to $17,499 | 32 (6.7%) | 60 (14.2%) |
| $17,500 to $19,999 | 0 (0.0%) | 33 (7.8%) |
| $20,000 to $22,499 | 52 (10.9%) | 37 (8.8%) |
| $22,500 to $24,999 | 37 (7.7%) | 24 (5.7%) |
| $25,000 to $29,999 | 11 (2.3%) | 35 (8.3%) |
| $30,000 to $34,999 | 28 (5.9%) | 37 (8.8%) |
| $35,000 to $39,999 | 40 (8.4%) | 21 (5.0%) |
| $40,000 to $44,999 | 72 (15.1%) | 5 (1.2%) |
| $45,000 to $49,999 | 61 (12.8%) | 0 (0.0%) |
| $50,000 to $54,999 | 3 (0.6%) | 20 (4.8%) |
| $55,000 to $64,999 | 40 (8.4%) | 12 (2.9%) |
| $65,000 to $74,999 | 12 (2.5%) | 0 (0.0%) |
| $75,000 to $99,999 | 24 (5.0%) | 28 (6.7%) |
| $100,000+ | 16 (3.4%) | 3 (0.7%) |
| Total | 478 (100.0%) | 421 (100.0%) |
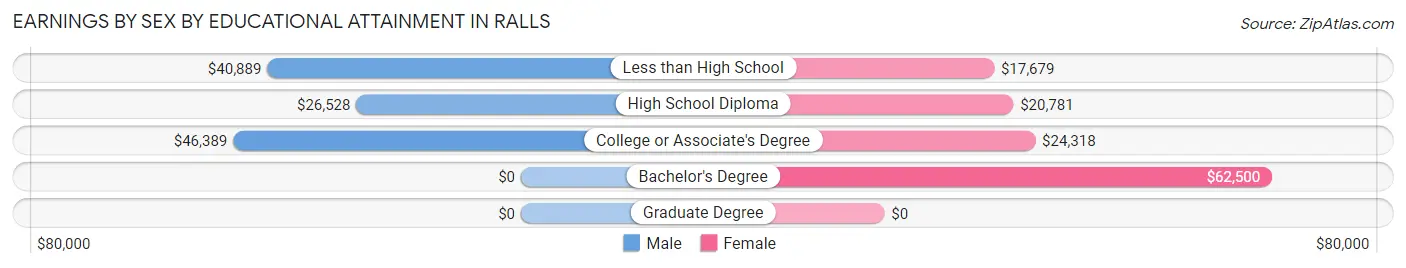
Earnings by Sex by Educational Attainment in Ralls
Average earnings in Ralls are $40,680 for men and $23,958 for women, a difference of 41.1%. Men with an educational attainment of college or associate's degree enjoy the highest average annual earnings of $46,389, while those with high school diploma education earn the least with $26,528. Women with an educational attainment of bachelor's degree earn the most with the average annual earnings of $62,500, while those with less than high school education have the smallest earnings of $17,679.
| Educational Attainment | Male Income | Female Income |
| Less than High School | $40,889 | $17,679 |
| High School Diploma | $26,528 | $20,781 |
| College or Associate's Degree | $46,389 | $24,318 |
| Bachelor's Degree | - | - |
| Graduate Degree | - | - |
| Total | $40,680 | $23,958 |
Family Income in Ralls
Family Income Brackets in Ralls
According to the Ralls family income data, there are 190 families falling into the $50,000 to $74,999 income range, which is the most common income bracket and makes up 37.9% of all families. Conversely, the $10,000 to $14,999 income bracket is the least frequent group with only 6 families (1.2%) belonging to this category.
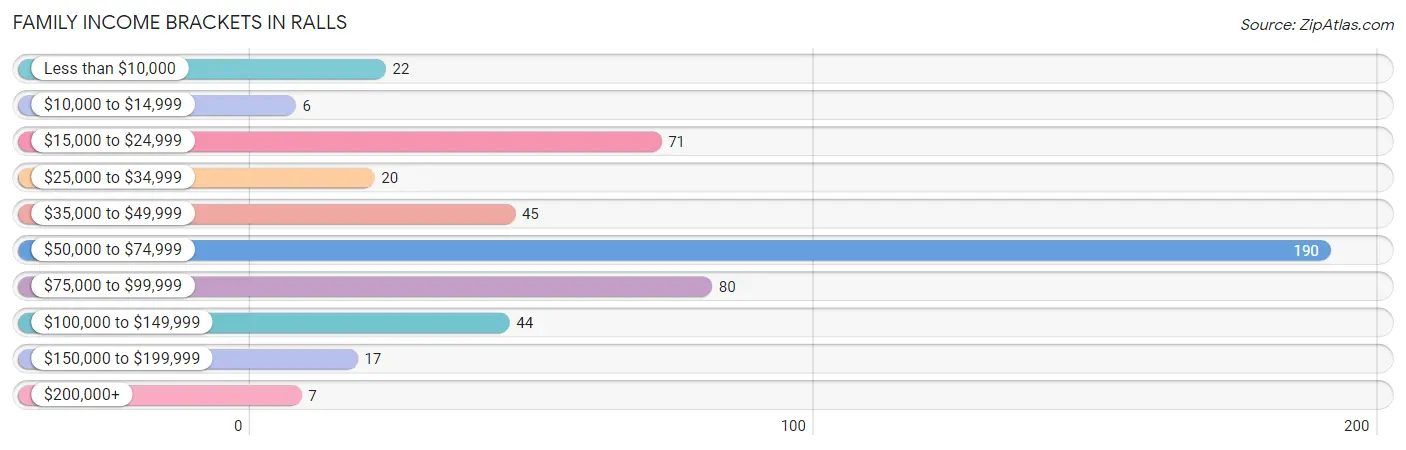
| Income Bracket | # Families | % Families |
| Less than $10,000 | 22 | 4.4% |
| $10,000 to $14,999 | 6 | 1.2% |
| $15,000 to $24,999 | 71 | 14.1% |
| $25,000 to $34,999 | 20 | 4.0% |
| $35,000 to $49,999 | 45 | 9.0% |
| $50,000 to $74,999 | 190 | 37.8% |
| $75,000 to $99,999 | 80 | 15.9% |
| $100,000 to $149,999 | 44 | 8.8% |
| $150,000 to $199,999 | 17 | 3.4% |
| $200,000+ | 7 | 1.4% |
Family Income by Famaliy Size in Ralls
3-person families (107 | 21.3%) account for the highest median family income in Ralls with $77,083 per family, while 2-person families (158 | 31.5%) have the highest median income of $29,294 per family member.
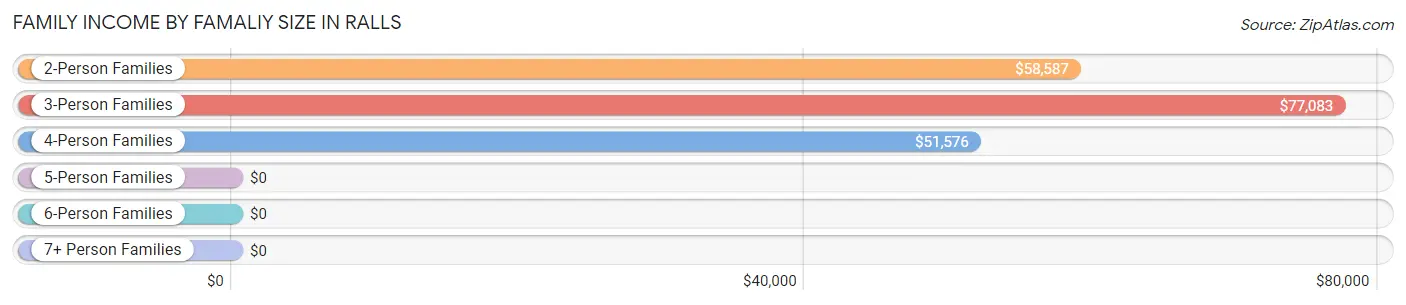
| Income Bracket | # Families | Median Income |
| 2-Person Families | 158 (31.5%) | $58,587 |
| 3-Person Families | 107 (21.3%) | $77,083 |
| 4-Person Families | 153 (30.5%) | $51,576 |
| 5-Person Families | 59 (11.7%) | $0 |
| 6-Person Families | 19 (3.8%) | $0 |
| 7+ Person Families | 6 (1.2%) | $0 |
| Total | 502 (100.0%) | $65,273 |
Family Income by Number of Earners in Ralls
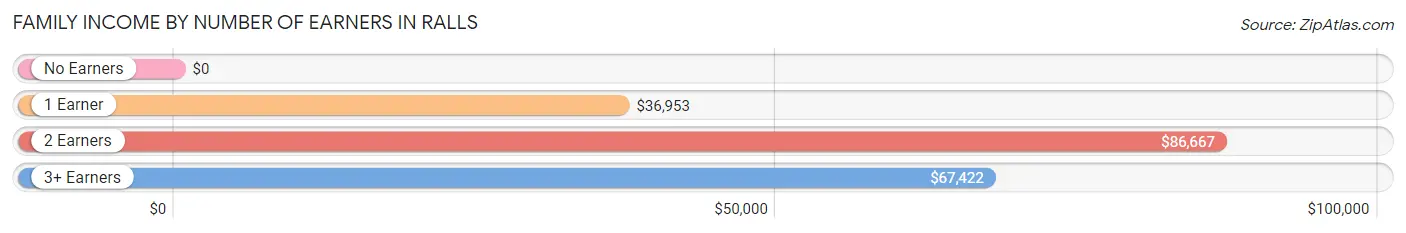
| Number of Earners | # Families | Median Income |
| No Earners | 41 (8.2%) | $0 |
| 1 Earner | 217 (43.2%) | $36,953 |
| 2 Earners | 116 (23.1%) | $86,667 |
| 3+ Earners | 128 (25.5%) | $67,422 |
| Total | 502 (100.0%) | $65,273 |
Household Income in Ralls
Household Income Brackets in Ralls
With 190 households falling in the category, the $50,000 to $74,999 income range is the most frequent in Ralls, accounting for 28.1% of all households. In contrast, only 7 households (1.0%) fall into the $200,000+ income bracket, making it the least populous group.
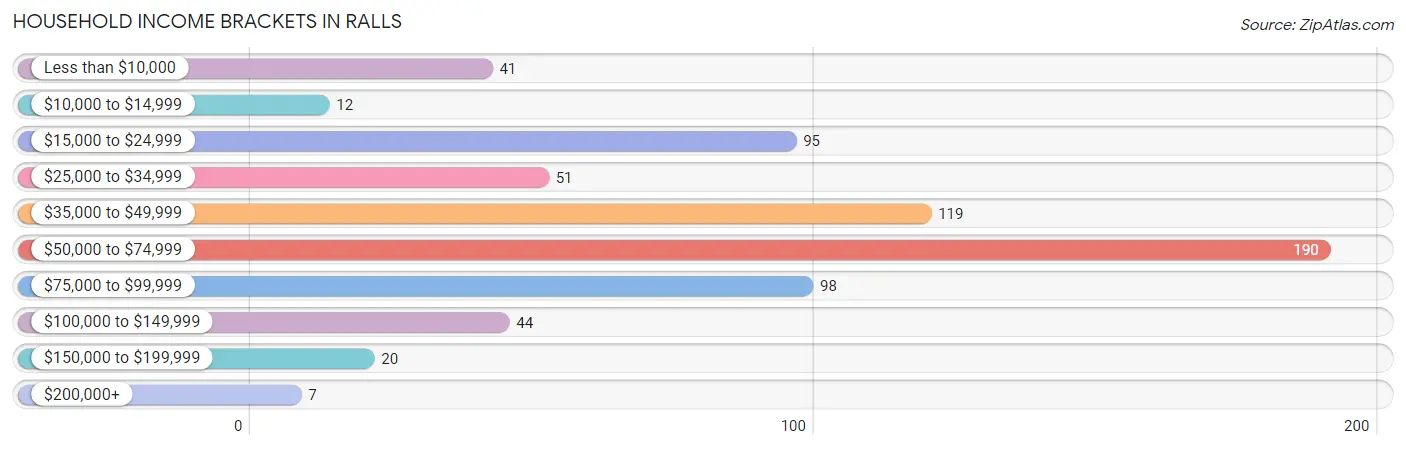
| Income Bracket | # Households | % Households |
| Less than $10,000 | 41 | 6.1% |
| $10,000 to $14,999 | 12 | 1.8% |
| $15,000 to $24,999 | 95 | 14.0% |
| $25,000 to $34,999 | 51 | 7.5% |
| $35,000 to $49,999 | 119 | 17.6% |
| $50,000 to $74,999 | 190 | 28.1% |
| $75,000 to $99,999 | 98 | 14.5% |
| $100,000 to $149,999 | 44 | 6.5% |
| $150,000 to $199,999 | 20 | 3.0% |
| $200,000+ | 7 | 1.0% |
Household Income by Householder Age in Ralls
The median household income in Ralls is $51,767, with the highest median household income of $67,083 found in the 45 to 64 years age bracket for the primary householder. A total of 176 households (26.0%) fall into this category. Meanwhile, the 15 to 24 years age bracket for the primary householder has the lowest median household income of $0, with 50 households (7.4%) in this group.
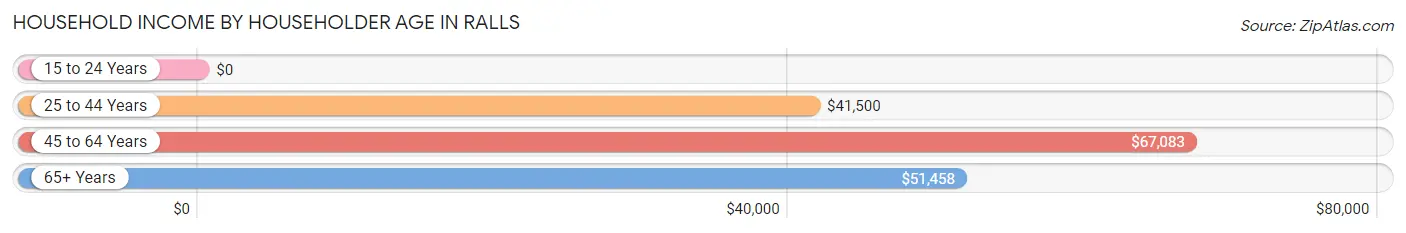
| Income Bracket | # Households | Median Income |
| 15 to 24 Years | 50 (7.4%) | $0 |
| 25 to 44 Years | 276 (40.8%) | $41,500 |
| 45 to 64 Years | 176 (26.0%) | $67,083 |
| 65+ Years | 175 (25.9%) | $51,458 |
| Total | 677 (100.0%) | $51,767 |
Poverty in Ralls
Income Below Poverty by Sex and Age in Ralls
With 16.1% poverty level for males and 21.0% for females among the residents of Ralls, under 5 year old males and 6 to 11 year old females are the most vulnerable to poverty, with 48 males (100.0%) and 55 females (65.5%) in their respective age groups living below the poverty level.
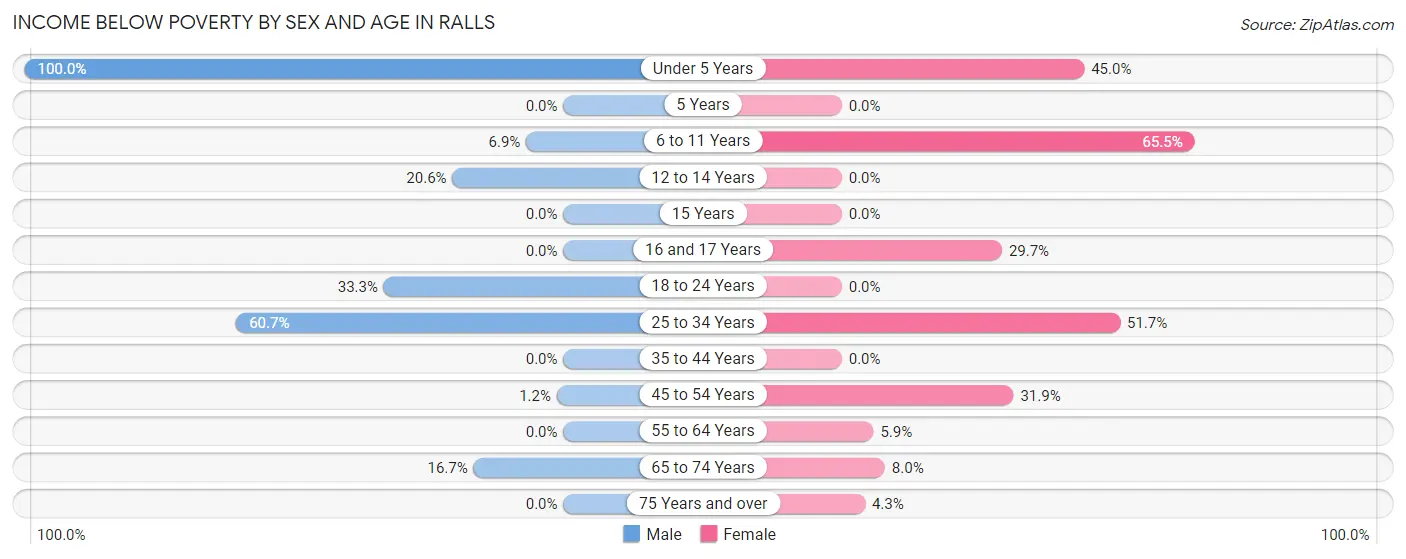
| Age Bracket | Male | Female |
| Under 5 Years | 48 (100.0%) | 18 (45.0%) |
| 5 Years | 0 (0.0%) | 0 (0.0%) |
| 6 to 11 Years | 4 (6.9%) | 55 (65.5%) |
| 12 to 14 Years | 14 (20.6%) | 0 (0.0%) |
| 15 Years | 0 (0.0%) | 0 (0.0%) |
| 16 and 17 Years | 0 (0.0%) | 11 (29.7%) |
| 18 to 24 Years | 18 (33.3%) | 0 (0.0%) |
| 25 to 34 Years | 34 (60.7%) | 47 (51.6%) |
| 35 to 44 Years | 0 (0.0%) | 0 (0.0%) |
| 45 to 54 Years | 1 (1.2%) | 29 (31.9%) |
| 55 to 64 Years | 0 (0.0%) | 3 (5.9%) |
| 65 to 74 Years | 6 (16.7%) | 6 (8.0%) |
| 75 Years and over | 0 (0.0%) | 4 (4.3%) |
| Total | 125 (16.1%) | 173 (21.0%) |
Income Above Poverty by Sex and Age in Ralls
According to the poverty statistics in Ralls, males aged 5 years and females aged 5 years are the age groups that are most secure financially, with 100.0% of males and 100.0% of females in these age groups living above the poverty line.
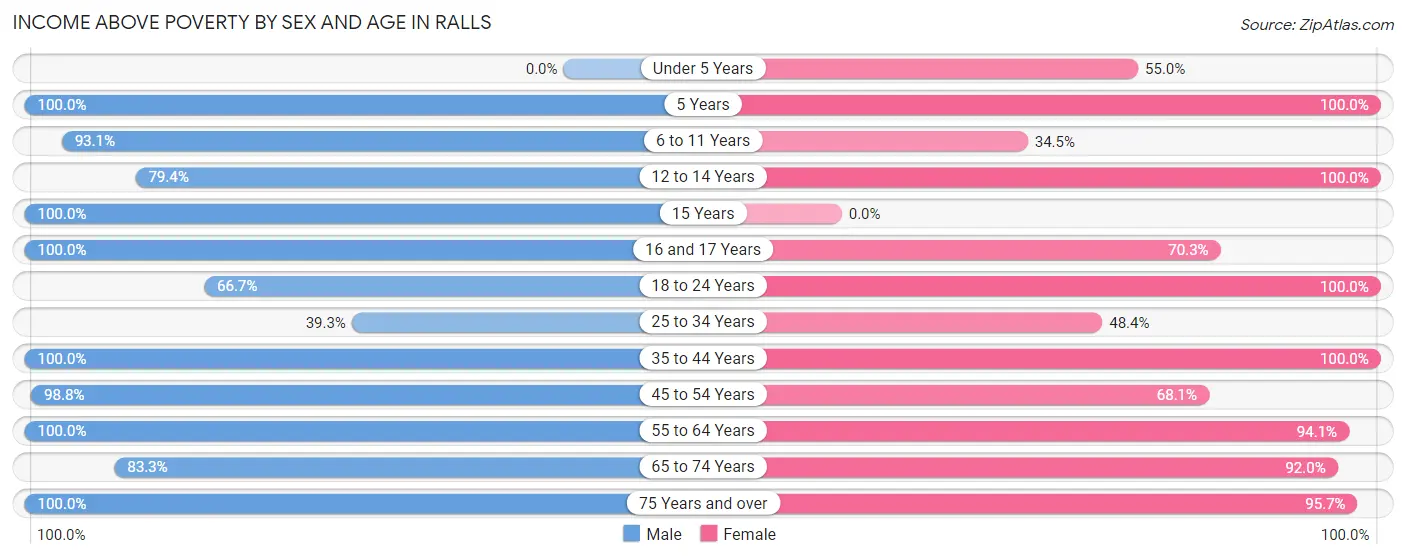
| Age Bracket | Male | Female |
| Under 5 Years | 0 (0.0%) | 22 (55.0%) |
| 5 Years | 17 (100.0%) | 9 (100.0%) |
| 6 to 11 Years | 54 (93.1%) | 29 (34.5%) |
| 12 to 14 Years | 54 (79.4%) | 24 (100.0%) |
| 15 Years | 11 (100.0%) | 0 (0.0%) |
| 16 and 17 Years | 37 (100.0%) | 26 (70.3%) |
| 18 to 24 Years | 36 (66.7%) | 81 (100.0%) |
| 25 to 34 Years | 22 (39.3%) | 44 (48.3%) |
| 35 to 44 Years | 162 (100.0%) | 147 (100.0%) |
| 45 to 54 Years | 81 (98.8%) | 62 (68.1%) |
| 55 to 64 Years | 80 (100.0%) | 48 (94.1%) |
| 65 to 74 Years | 30 (83.3%) | 69 (92.0%) |
| 75 Years and over | 67 (100.0%) | 89 (95.7%) |
| Total | 651 (83.9%) | 650 (79.0%) |
Income Below Poverty Among Married-Couple Families in Ralls
The poverty statistics for married-couple families in Ralls show that 10.3% or 32 of the total 310 families live below the poverty line. Families with 3 or 4 children have the highest poverty rate of 38.2%, comprising of 26 families. On the other hand, families with 1 or 2 children have the lowest poverty rate of 0.0%, which includes 0 families.
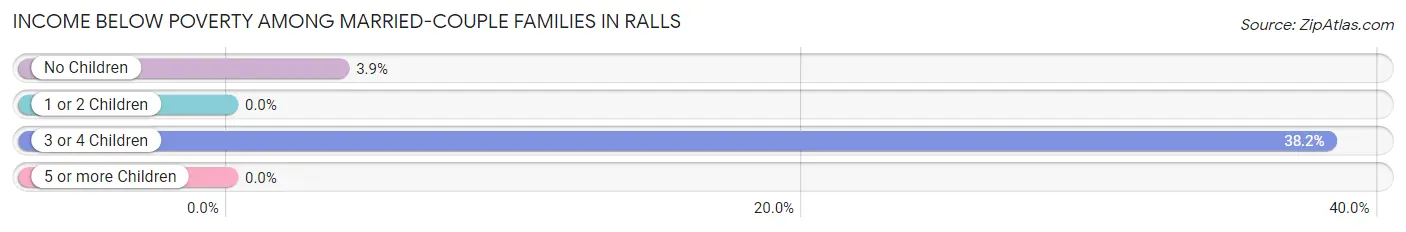
| Children | Above Poverty | Below Poverty |
| No Children | 149 (96.1%) | 6 (3.9%) |
| 1 or 2 Children | 87 (100.0%) | 0 (0.0%) |
| 3 or 4 Children | 42 (61.8%) | 26 (38.2%) |
| 5 or more Children | 0 (0.0%) | 0 (0.0%) |
| Total | 278 (89.7%) | 32 (10.3%) |
Income Below Poverty Among Single-Parent Households in Ralls
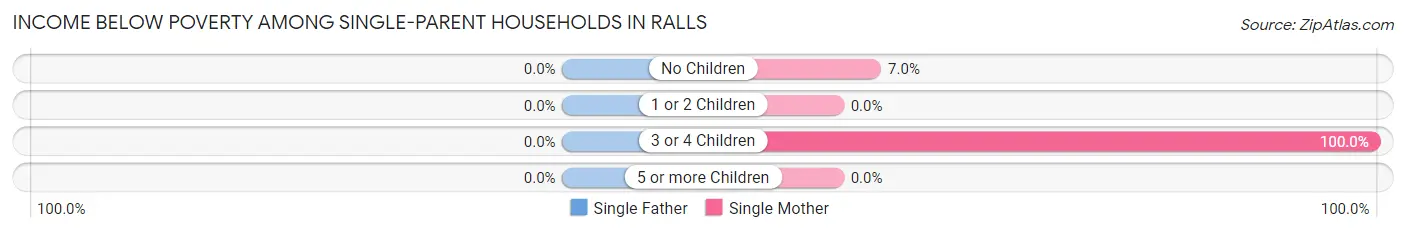
| Children | Single Father | Single Mother |
| No Children | 0 (0.0%) | 3 (7.0%) |
| 1 or 2 Children | 0 (0.0%) | 0 (0.0%) |
| 3 or 4 Children | 0 (0.0%) | 55 (100.0%) |
| 5 or more Children | 0 (0.0%) | 0 (0.0%) |
| Total | 0 (0.0%) | 58 (38.9%) |
Income Below Poverty Among Married-Couple vs Single-Parent Households in Ralls
The poverty data for Ralls shows that 32 of the married-couple family households (10.3%) and 58 of the single-parent households (30.2%) are living below the poverty level. Within the married-couple family households, those with 3 or 4 children have the highest poverty rate, with 26 households (38.2%) falling below the poverty line. Among the single-parent households, those with 3 or 4 children have the highest poverty rate, with 55 household (100.0%) living below poverty.
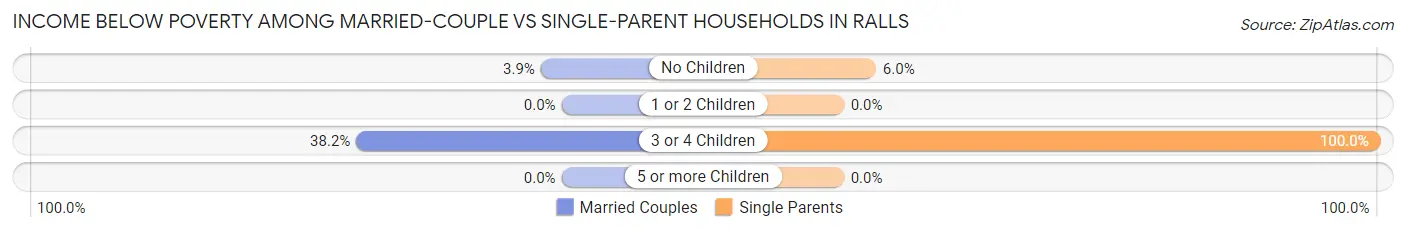
| Children | Married-Couple Families | Single-Parent Households |
| No Children | 6 (3.9%) | 3 (6.0%) |
| 1 or 2 Children | 0 (0.0%) | 0 (0.0%) |
| 3 or 4 Children | 26 (38.2%) | 55 (100.0%) |
| 5 or more Children | 0 (0.0%) | 0 (0.0%) |
| Total | 32 (10.3%) | 58 (30.2%) |
Race in Ralls
The most populous races in Ralls are White / Caucasian (1,180 | 72.2%), Hispanic or Latino (1,015 | 62.1%), and Some other Race (191 | 11.7%).
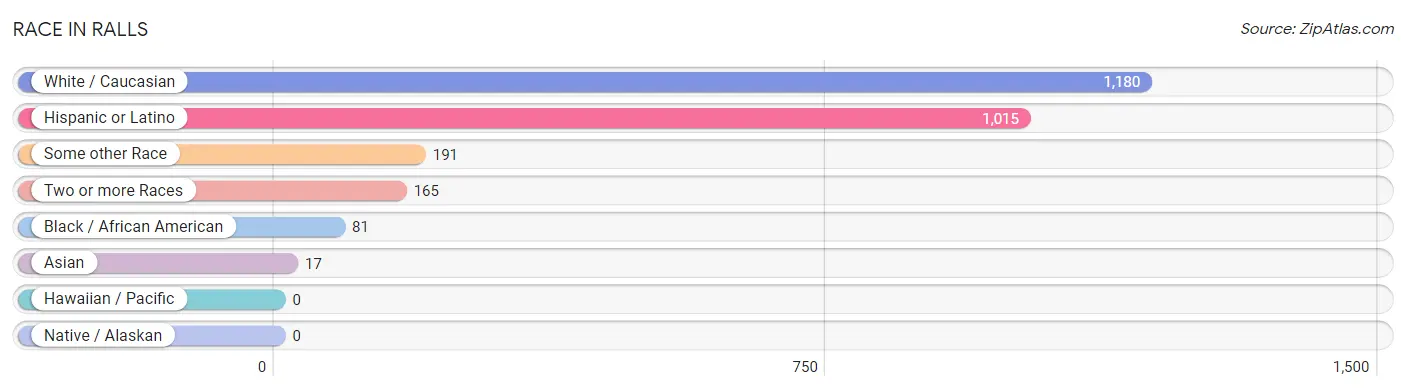
| Race | # Population | % Population |
| Asian | 17 | 1.0% |
| Black / African American | 81 | 5.0% |
| Hawaiian / Pacific | 0 | 0.0% |
| Hispanic or Latino | 1,015 | 62.1% |
| Native / Alaskan | 0 | 0.0% |
| White / Caucasian | 1,180 | 72.2% |
| Two or more Races | 165 | 10.1% |
| Some other Race | 191 | 11.7% |
| Total | 1,634 | 100.0% |
Ancestry in Ralls
The most populous ancestries reported in Ralls are Mexican (787 | 48.2%), Central American (74 | 4.5%), Salvadoran (74 | 4.5%), Irish (63 | 3.9%), and German (48 | 2.9%), together accounting for 64.0% of all Ralls residents.
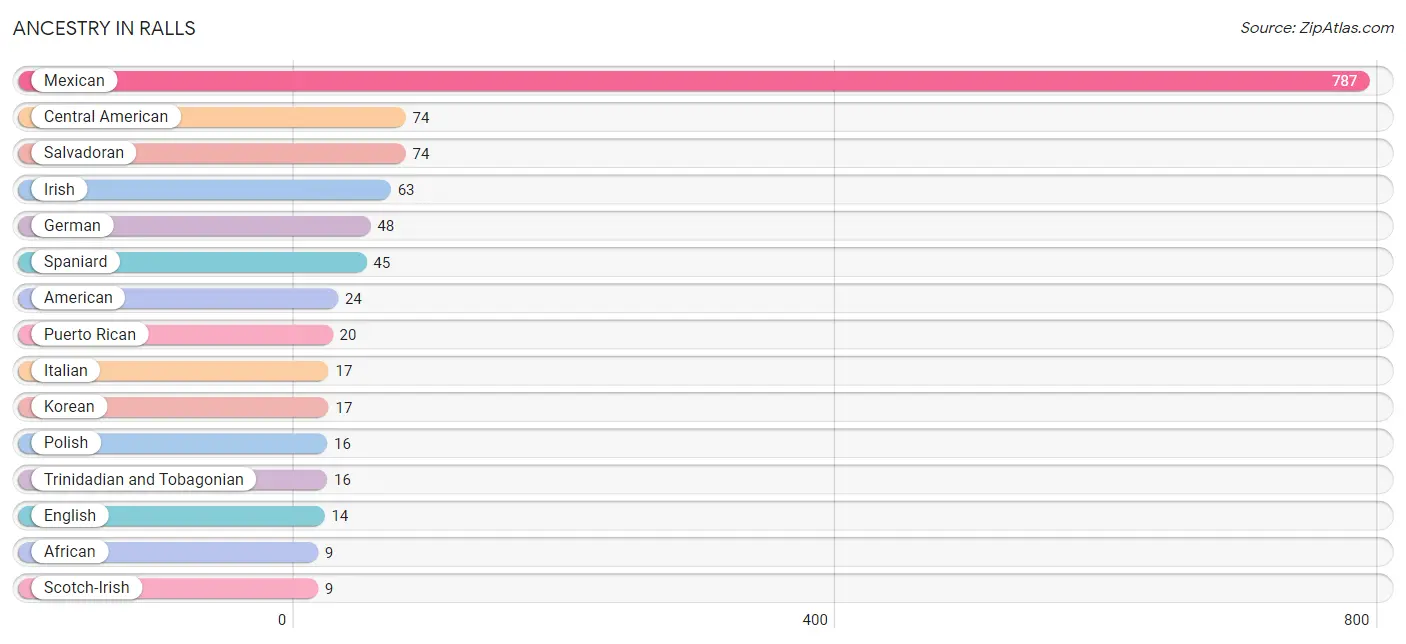
| Ancestry | # Population | % Population |
| African | 9 | 0.5% |
| American | 24 | 1.5% |
| Central American | 74 | 4.5% |
| Croatian | 8 | 0.5% |
| Danish | 4 | 0.2% |
| Dutch | 7 | 0.4% |
| English | 14 | 0.9% |
| French Canadian | 3 | 0.2% |
| German | 48 | 2.9% |
| Irish | 63 | 3.9% |
| Italian | 17 | 1.0% |
| Korean | 17 | 1.0% |
| Mexican | 787 | 48.2% |
| Polish | 16 | 1.0% |
| Puerto Rican | 20 | 1.2% |
| Salvadoran | 74 | 4.5% |
| Scotch-Irish | 9 | 0.5% |
| Scottish | 3 | 0.2% |
| Spaniard | 45 | 2.8% |
| Subsaharan African | 9 | 0.5% |
| Trinidadian and Tobagonian | 16 | 1.0% | View All 21 Rows |
Immigrants in Ralls
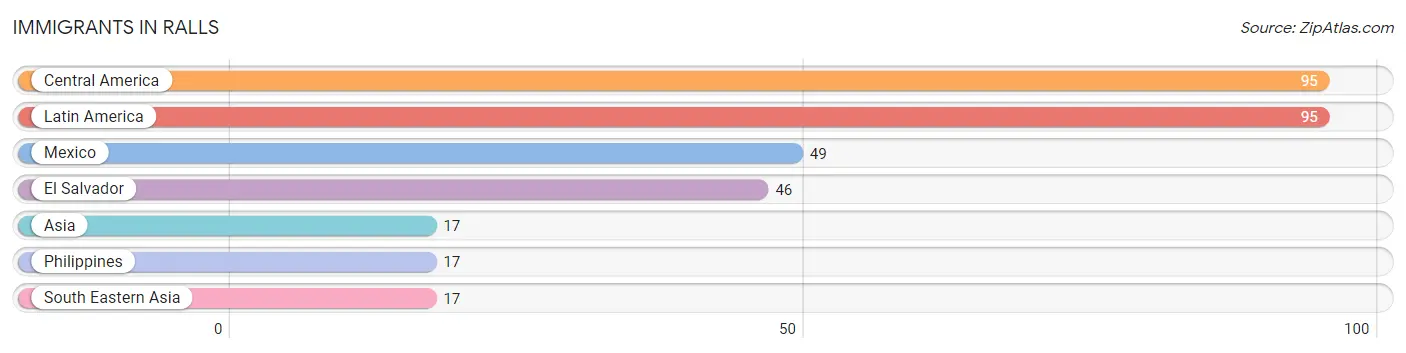
The most numerous immigrant groups reported in Ralls came from Central America (95 | 5.8%), Latin America (95 | 5.8%), Mexico (49 | 3.0%), El Salvador (46 | 2.8%), and Asia (17 | 1.0%), together accounting for 18.5% of all Ralls residents.
| Immigration Origin | # Population | % Population |
| Asia | 17 | 1.0% |
| Central America | 95 | 5.8% |
| El Salvador | 46 | 2.8% |
| Latin America | 95 | 5.8% |
| Mexico | 49 | 3.0% |
| Philippines | 17 | 1.0% |
| South Eastern Asia | 17 | 1.0% | View All 7 Rows |
Sex and Age in Ralls
Sex and Age in Ralls
The most populous age groups in Ralls are 40 to 44 Years (126 | 15.9%) for men and 40 to 44 Years (122 | 14.5%) for women.
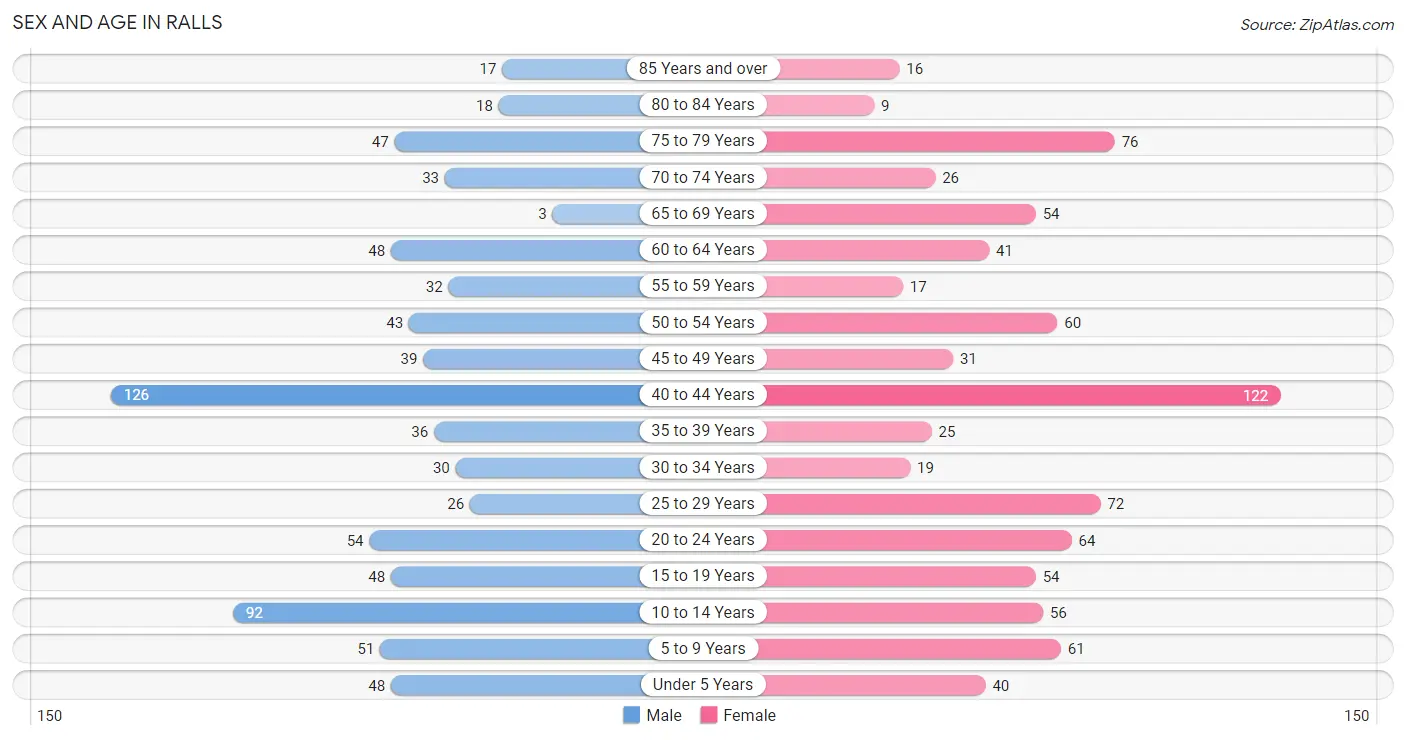
| Age Bracket | Male | Female |
| Under 5 Years | 48 (6.1%) | 40 (4.7%) |
| 5 to 9 Years | 51 (6.5%) | 61 (7.2%) |
| 10 to 14 Years | 92 (11.6%) | 56 (6.6%) |
| 15 to 19 Years | 48 (6.1%) | 54 (6.4%) |
| 20 to 24 Years | 54 (6.8%) | 64 (7.6%) |
| 25 to 29 Years | 26 (3.3%) | 72 (8.5%) |
| 30 to 34 Years | 30 (3.8%) | 19 (2.2%) |
| 35 to 39 Years | 36 (4.5%) | 25 (3.0%) |
| 40 to 44 Years | 126 (15.9%) | 122 (14.5%) |
| 45 to 49 Years | 39 (4.9%) | 31 (3.7%) |
| 50 to 54 Years | 43 (5.4%) | 60 (7.1%) |
| 55 to 59 Years | 32 (4.1%) | 17 (2.0%) |
| 60 to 64 Years | 48 (6.1%) | 41 (4.9%) |
| 65 to 69 Years | 3 (0.4%) | 54 (6.4%) |
| 70 to 74 Years | 33 (4.2%) | 26 (3.1%) |
| 75 to 79 Years | 47 (5.9%) | 76 (9.0%) |
| 80 to 84 Years | 18 (2.3%) | 9 (1.1%) |
| 85 Years and over | 17 (2.1%) | 16 (1.9%) |
| Total | 791 (100.0%) | 843 (100.0%) |
Families and Households in Ralls
Median Family Size in Ralls
The median family size in Ralls is 2.79 persons per family, with married-couple families (310 | 61.8%) accounting for the largest median family size of 2.85 persons per family. On the other hand, single male/father families (43 | 8.6%) represent the smallest median family size with 2.26 persons per family.
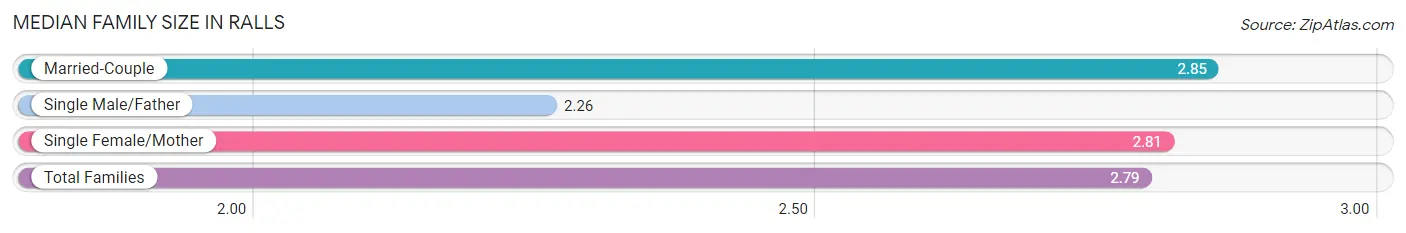
| Family Type | # Families | Family Size |
| Married-Couple | 310 (61.8%) | 2.85 |
| Single Male/Father | 43 (8.6%) | 2.26 |
| Single Female/Mother | 149 (29.7%) | 2.81 |
| Total Families | 502 (100.0%) | 2.79 |
Median Household Size in Ralls
The median household size in Ralls is 2.36 persons per household, with married-couple households (310 | 45.8%) accounting for the largest median household size of 2.85 persons per household. non-family households (175 | 25.9%) represent the smallest median household size with 1.06 persons per household.
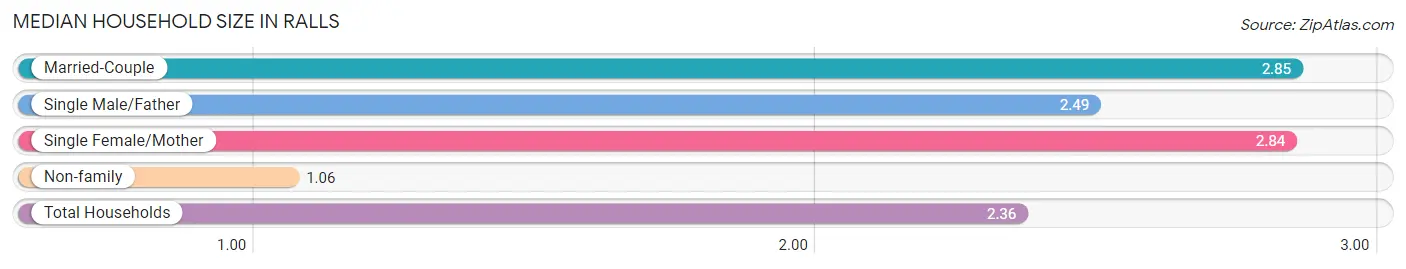
| Household Type | # Households | Household Size |
| Married-Couple | 310 (45.8%) | 2.85 |
| Single Male/Father | 43 (6.4%) | 2.49 |
| Single Female/Mother | 149 (22.0%) | 2.84 |
| Non-family | 175 (25.9%) | 1.06 |
| Total Households | 677 (100.0%) | 2.36 |
Household Size by Marriage Status in Ralls
Out of a total of 677 households in Ralls, 502 (74.2%) are family households, while 175 (25.9%) are nonfamily households. The most numerous type of family households are 2-person households, comprising 157, and the most common type of nonfamily households are 1-person households, comprising 151.
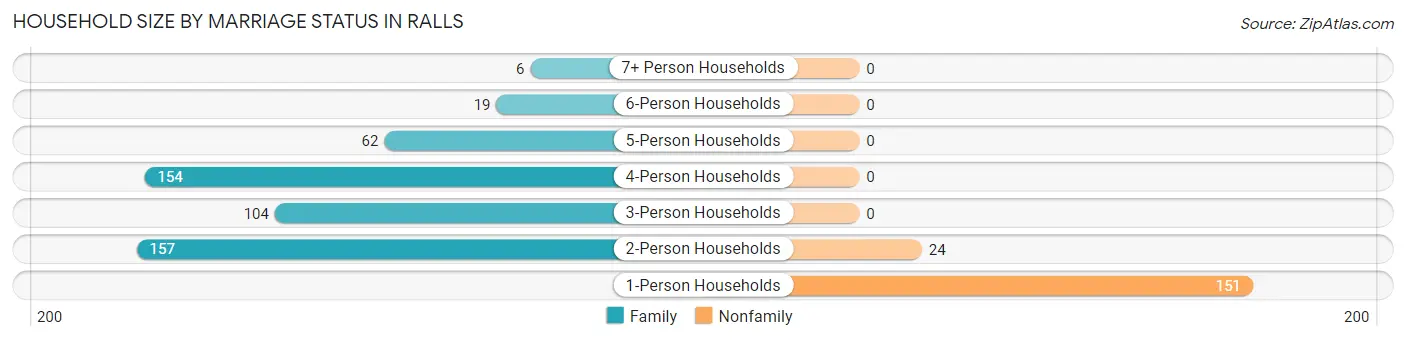
| Household Size | Family Households | Nonfamily Households |
| 1-Person Households | - | 151 (22.3%) |
| 2-Person Households | 157 (23.2%) | 24 (3.5%) |
| 3-Person Households | 104 (15.4%) | 0 (0.0%) |
| 4-Person Households | 154 (22.8%) | 0 (0.0%) |
| 5-Person Households | 62 (9.2%) | 0 (0.0%) |
| 6-Person Households | 19 (2.8%) | 0 (0.0%) |
| 7+ Person Households | 6 (0.9%) | 0 (0.0%) |
| Total | 502 (74.2%) | 175 (25.9%) |
Female Fertility in Ralls
Fertility by Age in Ralls
| Age Bracket | Women with Births | Births / 1,000 Women |
| 15 to 19 years | 0 (0.0%) | 0.0 |
| 20 to 34 years | 0 (0.0%) | 0.0 |
| 35 to 50 years | 0 (0.0%) | 0.0 |
| Total | 0 (0.0%) | 0.0 |
Fertility by Age by Marriage Status in Ralls
| Age Bracket | Married | Unmarried |
| 15 to 19 years | 0 (0.0%) | 0 (0.0%) |
| 20 to 34 years | 0 (0.0%) | 0 (0.0%) |
| 35 to 50 years | 0 (0.0%) | 0 (0.0%) |
| Total | 0 (0.0%) | 0 (0.0%) |
Fertility by Education in Ralls
| Educational Attainment | Women with Births | Births / 1,000 Women |
| Less than High School | 0 (0.0%) | 0.0 |
| High School Diploma | 0 (0.0%) | 0.0 |
| College or Associate's Degree | 0 (0.0%) | 0.0 |
| Bachelor's Degree | 0 (0.0%) | 0.0 |
| Graduate Degree | 0 (0.0%) | 0.0 |
| Total | 0 (0.0%) | 0.0 |
Fertility by Education by Marriage Status in Ralls
| Educational Attainment | Married | Unmarried |
| Less than High School | 0 (0.0%) | 0 (0.0%) |
| High School Diploma | 0 (0.0%) | 0 (0.0%) |
| College or Associate's Degree | 0 (0.0%) | 0 (0.0%) |
| Bachelor's Degree | 0 (0.0%) | 0 (0.0%) |
| Graduate Degree | 0 (0.0%) | 0 (0.0%) |
| Total | 0 (0.0%) | 0 (0.0%) |
Employment Characteristics in Ralls
Employment by Class of Employer in Ralls
Among the 829 employed individuals in Ralls, private company employees (527 | 63.6%), self-employed (not incorporated) (98 | 11.8%), and not-for-profit organizations (63 | 7.6%) make up the most common classes of employment.
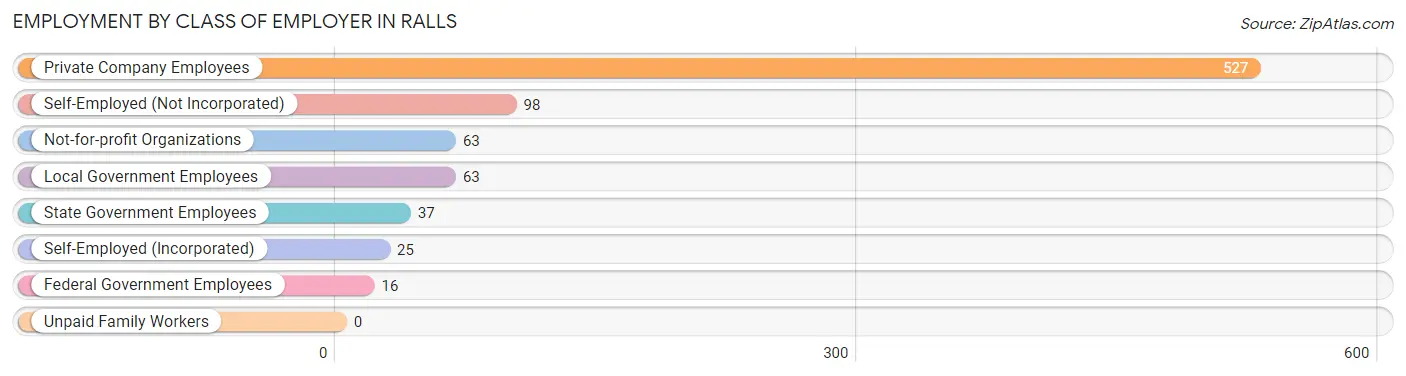
| Employer Class | # Employees | % Employees |
| Private Company Employees | 527 | 63.6% |
| Self-Employed (Incorporated) | 25 | 3.0% |
| Self-Employed (Not Incorporated) | 98 | 11.8% |
| Not-for-profit Organizations | 63 | 7.6% |
| Local Government Employees | 63 | 7.6% |
| State Government Employees | 37 | 4.5% |
| Federal Government Employees | 16 | 1.9% |
| Unpaid Family Workers | 0 | 0.0% |
| Total | 829 | 100.0% |
Employment Status by Age in Ralls
According to the labor force statistics for Ralls, out of the total population over 16 years of age (1,275), 70.0% or 892 individuals are in the labor force, with 5.3% or 47 of them unemployed. The age group with the highest labor force participation rate is 25 to 29 years, with 100.0% or 98 individuals in the labor force. Within the labor force, the 16 to 19 years age range has the highest percentage of unemployed individuals, with 34.5% or 10 of them being unemployed.
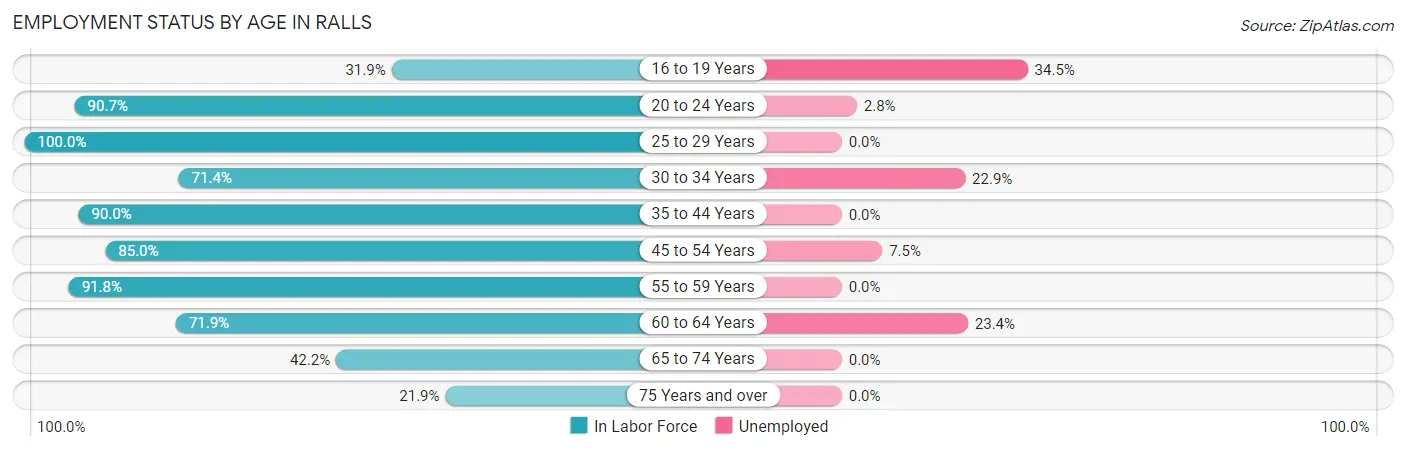
| Age Bracket | In Labor Force | Unemployed |
| 16 to 19 Years | 29 (31.9%) | 10 (34.5%) |
| 20 to 24 Years | 107 (90.7%) | 3 (2.8%) |
| 25 to 29 Years | 98 (100.0%) | 0 (0.0%) |
| 30 to 34 Years | 35 (71.4%) | 8 (22.9%) |
| 35 to 44 Years | 278 (90.0%) | 0 (0.0%) |
| 45 to 54 Years | 147 (85.0%) | 11 (7.5%) |
| 55 to 59 Years | 45 (91.8%) | 0 (0.0%) |
| 60 to 64 Years | 64 (71.9%) | 15 (23.4%) |
| 65 to 74 Years | 49 (42.2%) | 0 (0.0%) |
| 75 Years and over | 40 (21.9%) | 0 (0.0%) |
| Total | 892 (70.0%) | 47 (5.3%) |
Employment Status by Educational Attainment in Ralls
According to labor force statistics for Ralls, 87.0% of individuals (667) out of the total population between 25 and 64 years of age (767) are in the labor force, with 5.1% or 34 of them being unemployed. The group with the highest labor force participation rate are those with the educational attainment of high school diploma, with 90.5% or 247 individuals in the labor force. Within the labor force, individuals with college / associate degree education have the highest percentage of unemployment, with 9.9% or 15 of them being unemployed.
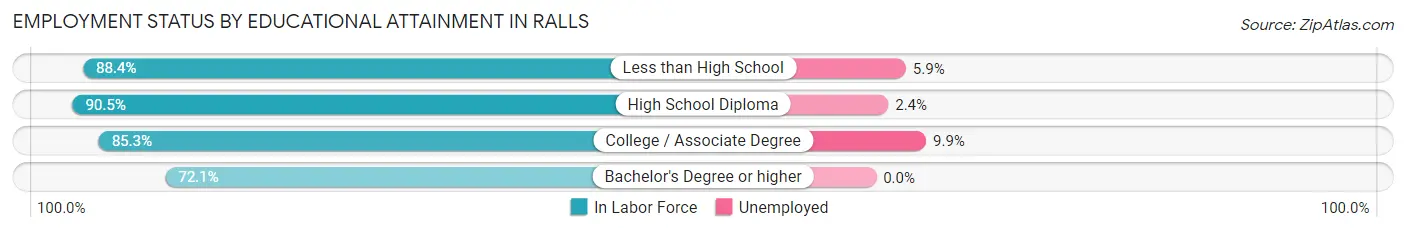
| Educational Attainment | In Labor Force | Unemployed |
| Less than High School | 220 (88.4%) | 15 (5.9%) |
| High School Diploma | 247 (90.5%) | 7 (2.4%) |
| College / Associate Degree | 151 (85.3%) | 18 (9.9%) |
| Bachelor's Degree or higher | 49 (72.1%) | 0 (0.0%) |
| Total | 667 (87.0%) | 39 (5.1%) |
Employment Occupations by Sex in Ralls
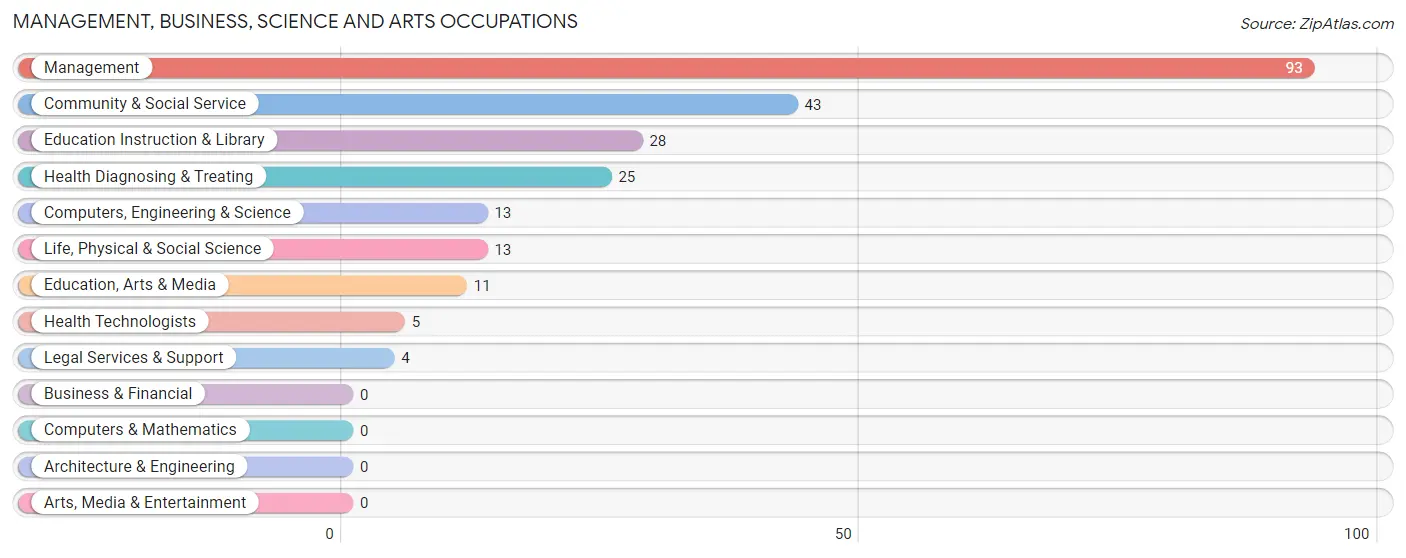
Management, Business, Science and Arts Occupations
The most common Management, Business, Science and Arts occupations in Ralls are Management (93 | 11.0%), Community & Social Service (43 | 5.1%), Education Instruction & Library (28 | 3.3%), Health Diagnosing & Treating (25 | 3.0%), and Computers, Engineering & Science (13 | 1.5%).
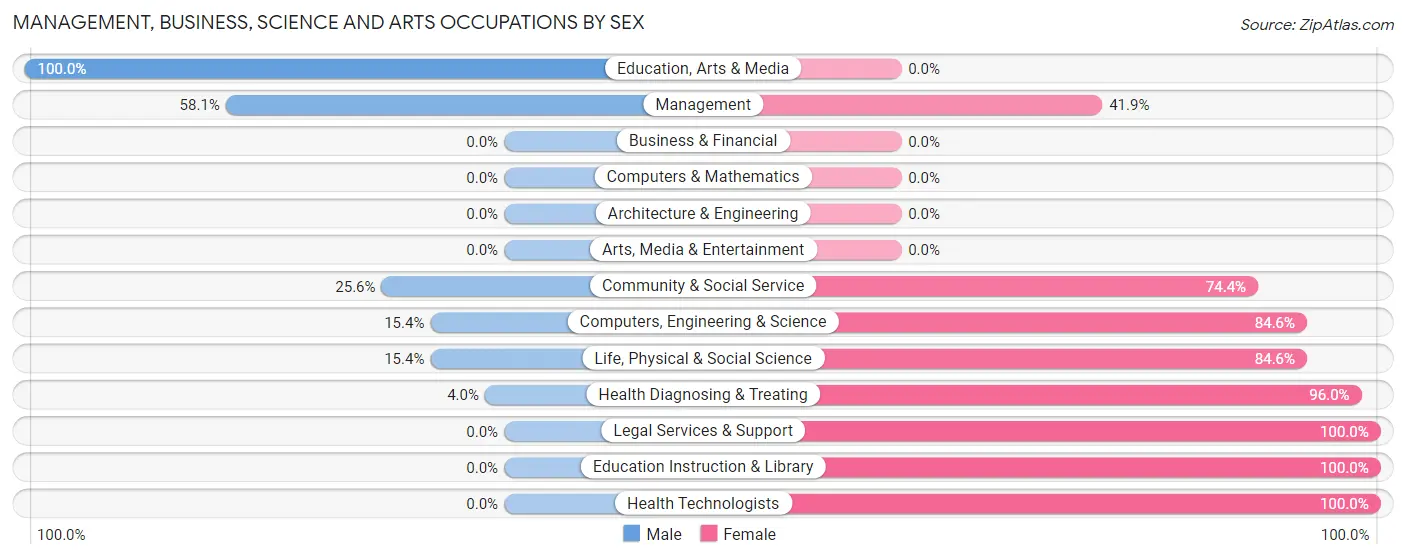
Management, Business, Science and Arts Occupations by Sex
Within the Management, Business, Science and Arts occupations in Ralls, the most male-oriented occupations are Education, Arts & Media (100.0%), Management (58.1%), and Community & Social Service (25.6%), while the most female-oriented occupations are Legal Services & Support (100.0%), Education Instruction & Library (100.0%), and Health Technologists (100.0%).
| Occupation | Male | Female |
| Management | 54 (58.1%) | 39 (41.9%) |
| Business & Financial | 0 (0.0%) | 0 (0.0%) |
| Computers, Engineering & Science | 2 (15.4%) | 11 (84.6%) |
| Computers & Mathematics | 0 (0.0%) | 0 (0.0%) |
| Architecture & Engineering | 0 (0.0%) | 0 (0.0%) |
| Life, Physical & Social Science | 2 (15.4%) | 11 (84.6%) |
| Community & Social Service | 11 (25.6%) | 32 (74.4%) |
| Education, Arts & Media | 11 (100.0%) | 0 (0.0%) |
| Legal Services & Support | 0 (0.0%) | 4 (100.0%) |
| Education Instruction & Library | 0 (0.0%) | 28 (100.0%) |
| Arts, Media & Entertainment | 0 (0.0%) | 0 (0.0%) |
| Health Diagnosing & Treating | 1 (4.0%) | 24 (96.0%) |
| Health Technologists | 0 (0.0%) | 5 (100.0%) |
| Total (Category) | 68 (39.1%) | 106 (60.9%) |
| Total (Overall) | 454 (53.7%) | 391 (46.3%) |
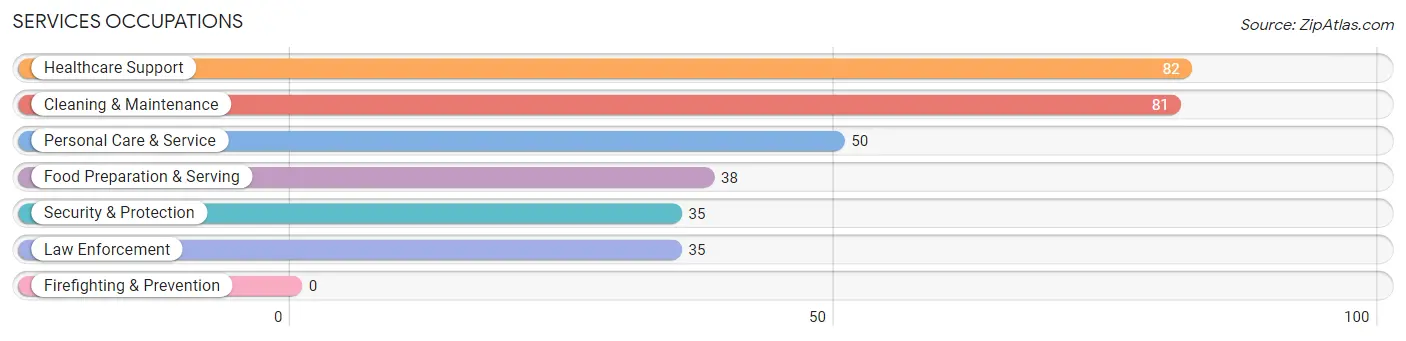
Services Occupations
The most common Services occupations in Ralls are Healthcare Support (82 | 9.7%), Cleaning & Maintenance (81 | 9.6%), Personal Care & Service (50 | 5.9%), Food Preparation & Serving (38 | 4.5%), and Security & Protection (35 | 4.1%).
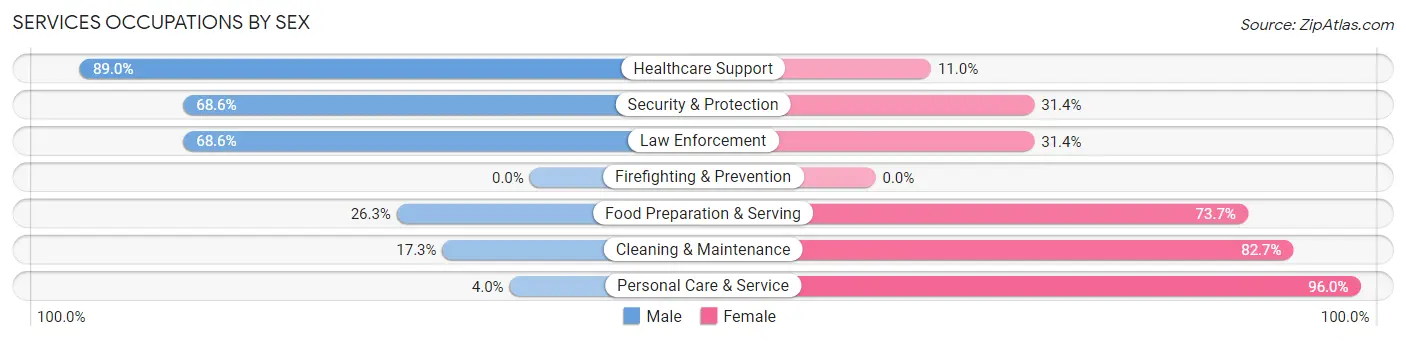
Services Occupations by Sex
Within the Services occupations in Ralls, the most male-oriented occupations are Healthcare Support (89.0%), Security & Protection (68.6%), and Law Enforcement (68.6%), while the most female-oriented occupations are Personal Care & Service (96.0%), Cleaning & Maintenance (82.7%), and Food Preparation & Serving (73.7%).
| Occupation | Male | Female |
| Healthcare Support | 73 (89.0%) | 9 (11.0%) |
| Security & Protection | 24 (68.6%) | 11 (31.4%) |
| Firefighting & Prevention | 0 (0.0%) | 0 (0.0%) |
| Law Enforcement | 24 (68.6%) | 11 (31.4%) |
| Food Preparation & Serving | 10 (26.3%) | 28 (73.7%) |
| Cleaning & Maintenance | 14 (17.3%) | 67 (82.7%) |
| Personal Care & Service | 2 (4.0%) | 48 (96.0%) |
| Total (Category) | 123 (43.0%) | 163 (57.0%) |
| Total (Overall) | 454 (53.7%) | 391 (46.3%) |
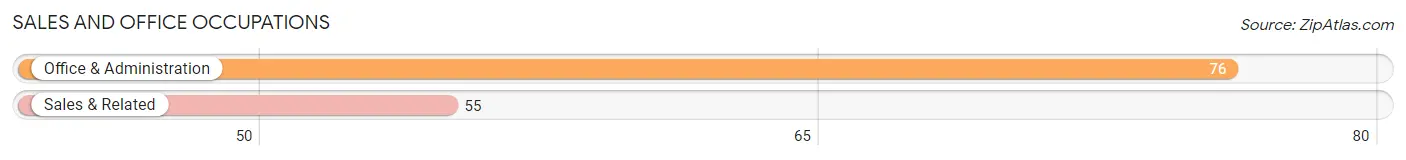
Sales and Office Occupations
The most common Sales and Office occupations in Ralls are Office & Administration (76 | 9.0%), and Sales & Related (55 | 6.5%).
Sales and Office Occupations by Sex
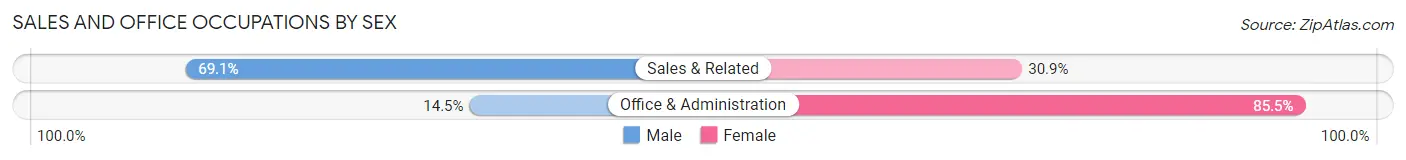
| Occupation | Male | Female |
| Sales & Related | 38 (69.1%) | 17 (30.9%) |
| Office & Administration | 11 (14.5%) | 65 (85.5%) |
| Total (Category) | 49 (37.4%) | 82 (62.6%) |
| Total (Overall) | 454 (53.7%) | 391 (46.3%) |
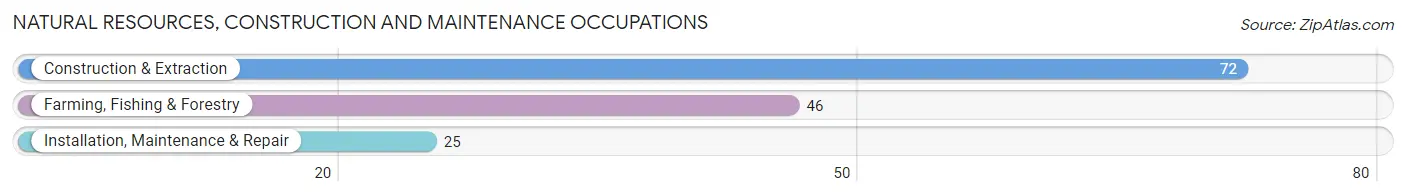
Natural Resources, Construction and Maintenance Occupations
The most common Natural Resources, Construction and Maintenance occupations in Ralls are Construction & Extraction (72 | 8.5%), Farming, Fishing & Forestry (46 | 5.4%), and Installation, Maintenance & Repair (25 | 3.0%).
Natural Resources, Construction and Maintenance Occupations by Sex
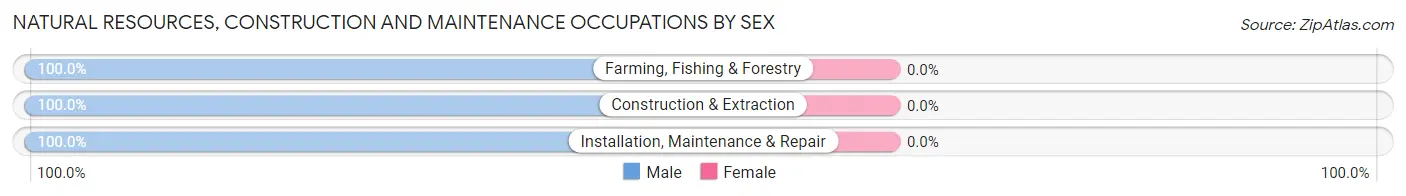
| Occupation | Male | Female |
| Farming, Fishing & Forestry | 46 (100.0%) | 0 (0.0%) |
| Construction & Extraction | 72 (100.0%) | 0 (0.0%) |
| Installation, Maintenance & Repair | 25 (100.0%) | 0 (0.0%) |
| Total (Category) | 143 (100.0%) | 0 (0.0%) |
| Total (Overall) | 454 (53.7%) | 391 (46.3%) |
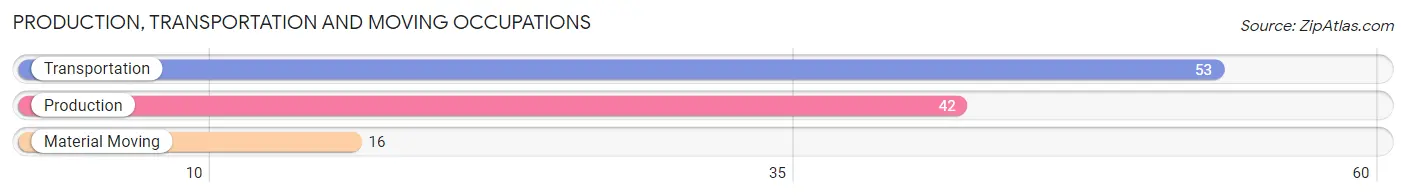
Production, Transportation and Moving Occupations
The most common Production, Transportation and Moving occupations in Ralls are Transportation (53 | 6.3%), Production (42 | 5.0%), and Material Moving (16 | 1.9%).
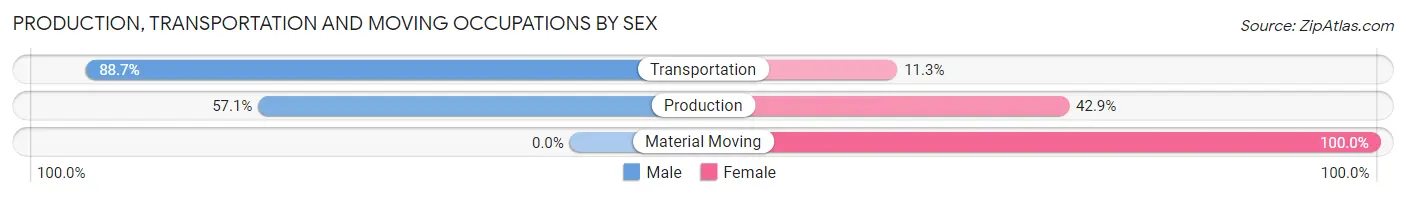
Production, Transportation and Moving Occupations by Sex
| Occupation | Male | Female |
| Production | 24 (57.1%) | 18 (42.9%) |
| Transportation | 47 (88.7%) | 6 (11.3%) |
| Material Moving | 0 (0.0%) | 16 (100.0%) |
| Total (Category) | 71 (64.0%) | 40 (36.0%) |
| Total (Overall) | 454 (53.7%) | 391 (46.3%) |
Employment Industries by Sex in Ralls
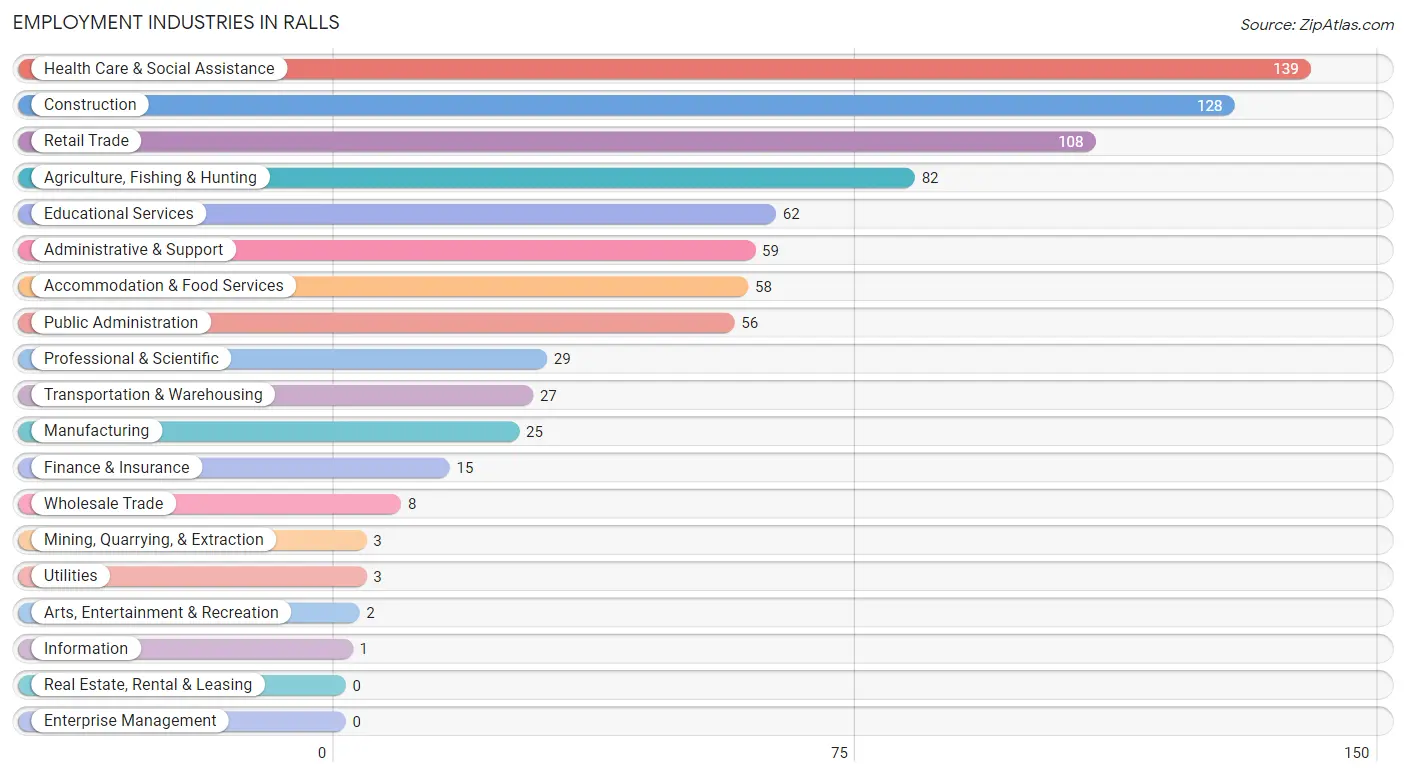
Employment Industries in Ralls
The major employment industries in Ralls include Health Care & Social Assistance (139 | 16.5%), Construction (128 | 15.1%), Retail Trade (108 | 12.8%), Agriculture, Fishing & Hunting (82 | 9.7%), and Educational Services (62 | 7.3%).
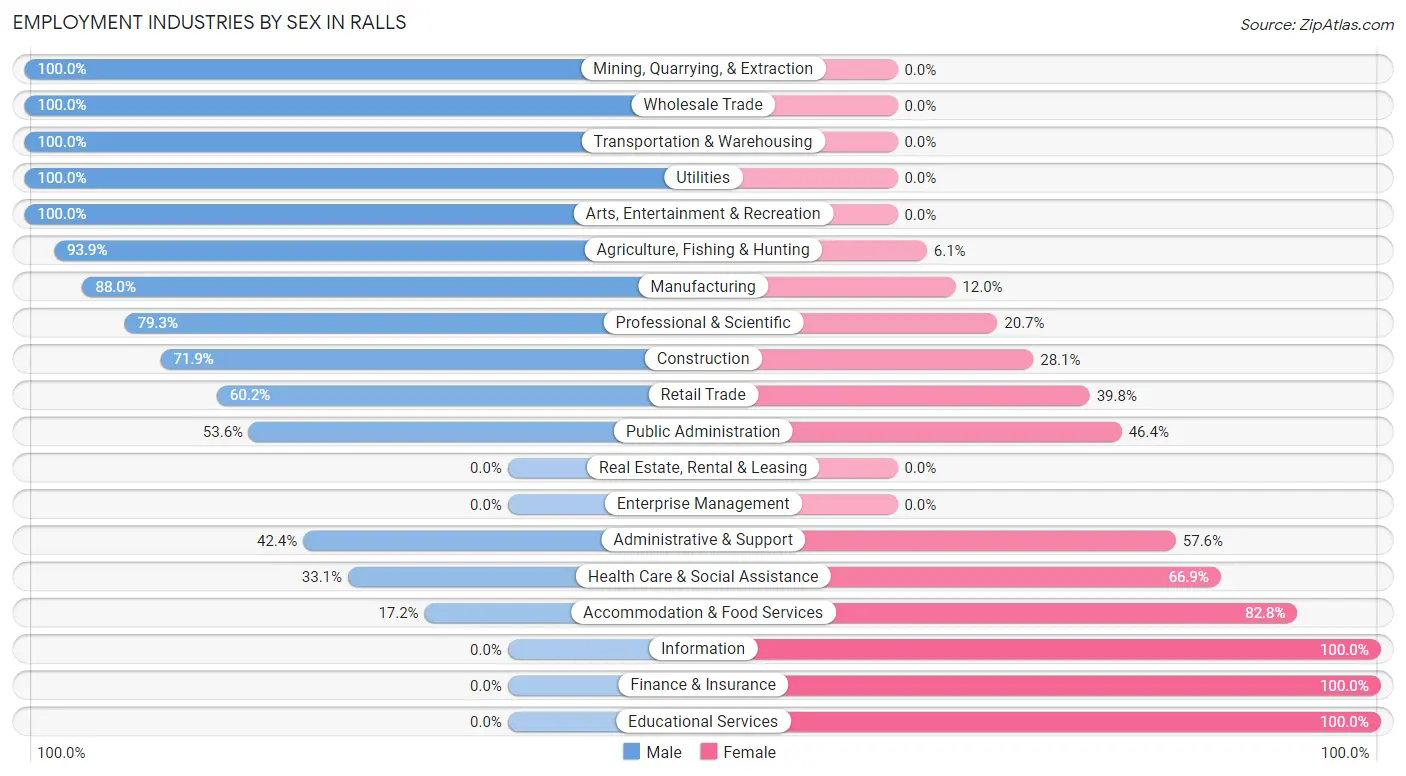
Employment Industries by Sex in Ralls
The Ralls industries that see more men than women are Mining, Quarrying, & Extraction (100.0%), Wholesale Trade (100.0%), and Transportation & Warehousing (100.0%), whereas the industries that tend to have a higher number of women are Information (100.0%), Finance & Insurance (100.0%), and Educational Services (100.0%).
| Industry | Male | Female |
| Agriculture, Fishing & Hunting | 77 (93.9%) | 5 (6.1%) |
| Mining, Quarrying, & Extraction | 3 (100.0%) | 0 (0.0%) |
| Construction | 92 (71.9%) | 36 (28.1%) |
| Manufacturing | 22 (88.0%) | 3 (12.0%) |
| Wholesale Trade | 8 (100.0%) | 0 (0.0%) |
| Retail Trade | 65 (60.2%) | 43 (39.8%) |
| Transportation & Warehousing | 27 (100.0%) | 0 (0.0%) |
| Utilities | 3 (100.0%) | 0 (0.0%) |
| Information | 0 (0.0%) | 1 (100.0%) |
| Finance & Insurance | 0 (0.0%) | 15 (100.0%) |
| Real Estate, Rental & Leasing | 0 (0.0%) | 0 (0.0%) |
| Professional & Scientific | 23 (79.3%) | 6 (20.7%) |
| Enterprise Management | 0 (0.0%) | 0 (0.0%) |
| Administrative & Support | 25 (42.4%) | 34 (57.6%) |
| Educational Services | 0 (0.0%) | 62 (100.0%) |
| Health Care & Social Assistance | 46 (33.1%) | 93 (66.9%) |
| Arts, Entertainment & Recreation | 2 (100.0%) | 0 (0.0%) |
| Accommodation & Food Services | 10 (17.2%) | 48 (82.8%) |
| Public Administration | 30 (53.6%) | 26 (46.4%) |
| Total | 454 (53.7%) | 391 (46.3%) |
Education in Ralls
School Enrollment in Ralls
The most common levels of schooling among the 409 students in Ralls are middle school (140 | 34.2%), high school (101 | 24.7%), and elementary school (78 | 19.1%).
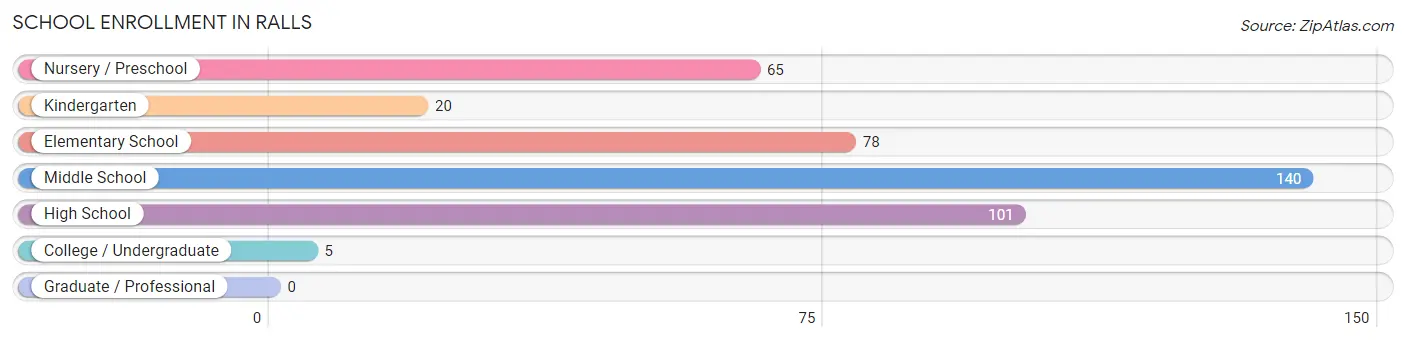
| School Level | # Students | % Students |
| Nursery / Preschool | 65 | 15.9% |
| Kindergarten | 20 | 4.9% |
| Elementary School | 78 | 19.1% |
| Middle School | 140 | 34.2% |
| High School | 101 | 24.7% |
| College / Undergraduate | 5 | 1.2% |
| Graduate / Professional | 0 | 0.0% |
| Total | 409 | 100.0% |
School Enrollment by Age by Funding Source in Ralls
Out of a total of 409 students who are enrolled in schools in Ralls, 12 (2.9%) attend a private institution, while the remaining 397 (97.1%) are enrolled in public schools. The age group of 10 to 14 year olds has the highest likelihood of being enrolled in private schools, with 12 (8.1% in the age bracket) enrolled. Conversely, the age group of 3 to 4 year olds has the lowest likelihood of being enrolled in a private school, with 59 (100.0% in the age bracket) attending a public institution.
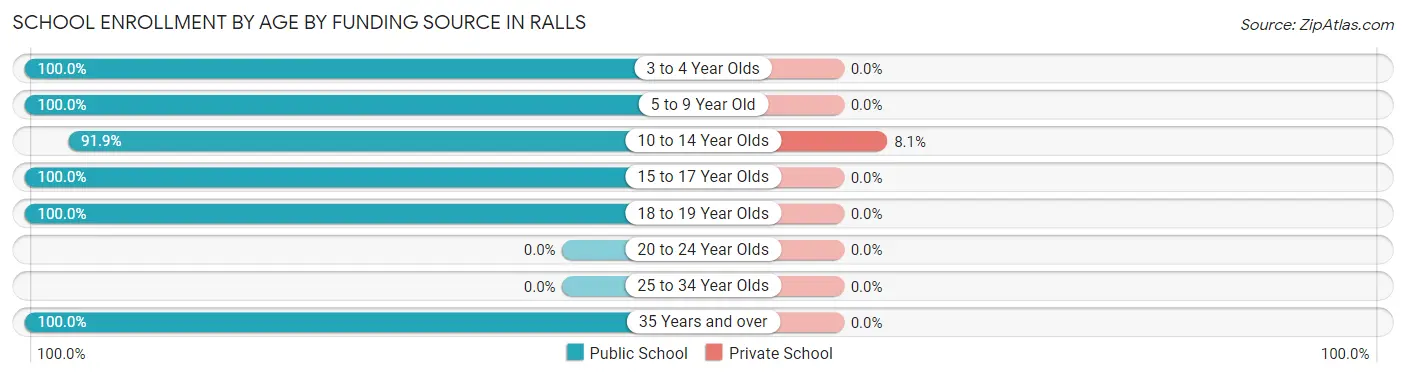
| Age Bracket | Public School | Private School |
| 3 to 4 Year Olds | 59 (100.0%) | 0 (0.0%) |
| 5 to 9 Year Old | 102 (100.0%) | 0 (0.0%) |
| 10 to 14 Year Olds | 136 (91.9%) | 12 (8.1%) |
| 15 to 17 Year Olds | 85 (100.0%) | 0 (0.0%) |
| 18 to 19 Year Olds | 10 (100.0%) | 0 (0.0%) |
| 20 to 24 Year Olds | 0 (0.0%) | 0 (0.0%) |
| 25 to 34 Year Olds | 0 (0.0%) | 0 (0.0%) |
| 35 Years and over | 5 (100.0%) | 0 (0.0%) |
| Total | 397 (97.1%) | 12 (2.9%) |
Educational Attainment by Field of Study in Ralls
Education (44 | 42.3%), arts & humanities (22 | 21.1%), business (20 | 19.2%), bio, nature & agricultural (7 | 6.7%), and science & technology (5 | 4.8%) are the most common fields of study among 104 individuals in Ralls who have obtained a bachelor's degree or higher.
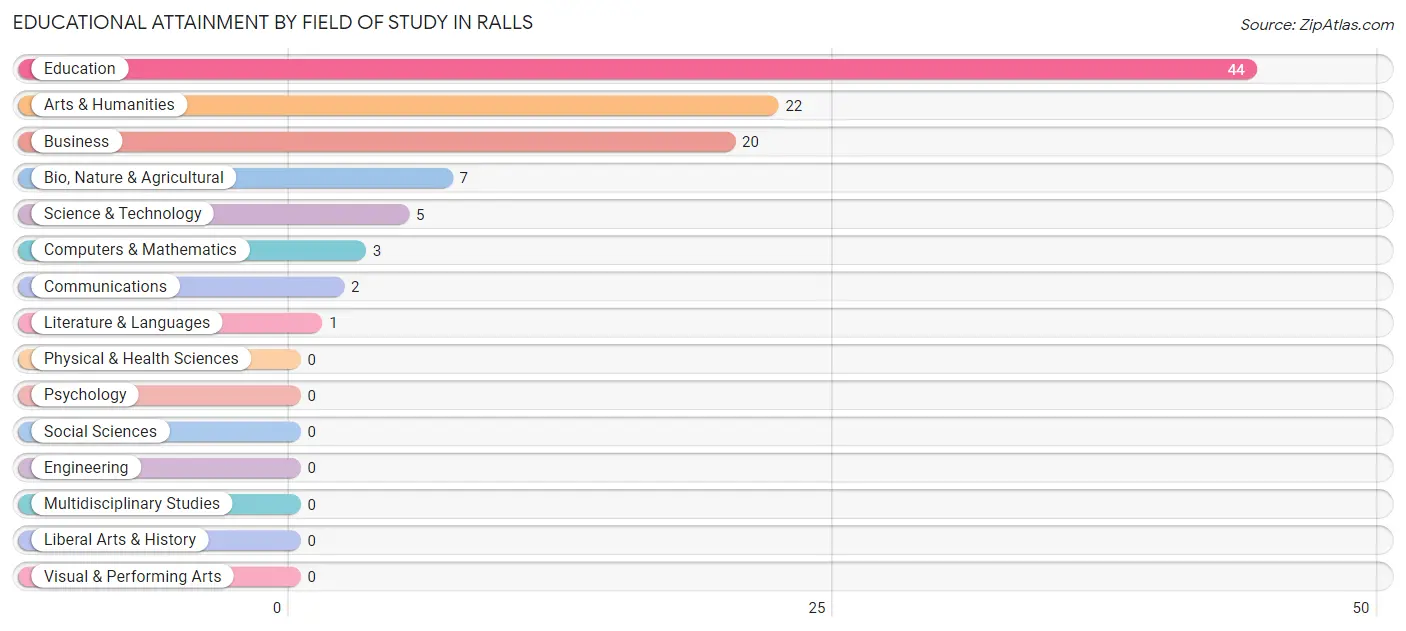
| Field of Study | # Graduates | % Graduates |
| Computers & Mathematics | 3 | 2.9% |
| Bio, Nature & Agricultural | 7 | 6.7% |
| Physical & Health Sciences | 0 | 0.0% |
| Psychology | 0 | 0.0% |
| Social Sciences | 0 | 0.0% |
| Engineering | 0 | 0.0% |
| Multidisciplinary Studies | 0 | 0.0% |
| Science & Technology | 5 | 4.8% |
| Business | 20 | 19.2% |
| Education | 44 | 42.3% |
| Literature & Languages | 1 | 1.0% |
| Liberal Arts & History | 0 | 0.0% |
| Visual & Performing Arts | 0 | 0.0% |
| Communications | 2 | 1.9% |
| Arts & Humanities | 22 | 21.1% |
| Total | 104 | 100.0% |
Transportation & Commute in Ralls
Vehicle Availability by Sex in Ralls
The most prevalent vehicle ownership categories in Ralls are males with 2 vehicles (169, accounting for 37.2%) and females with 2 vehicles (145, making up 45.1%).
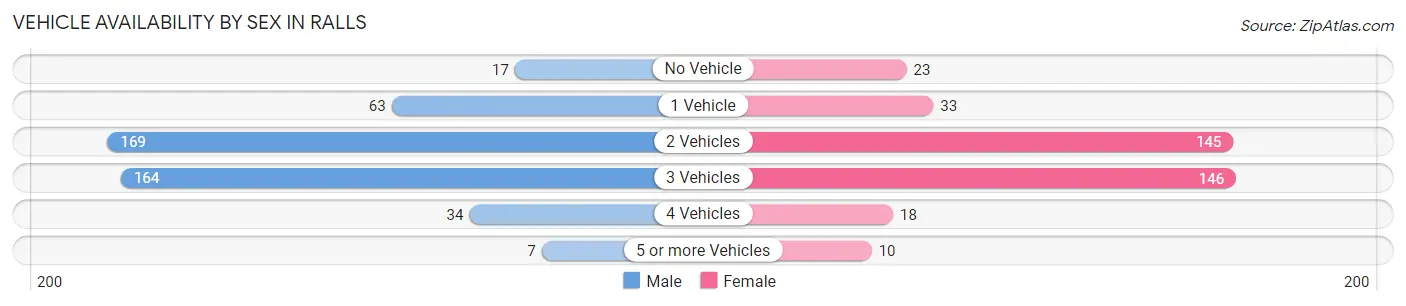
| Vehicles Available | Male | Female |
| No Vehicle | 17 (3.7%) | 23 (6.1%) |
| 1 Vehicle | 63 (13.9%) | 33 (8.8%) |
| 2 Vehicles | 169 (37.2%) | 145 (38.7%) |
| 3 Vehicles | 164 (36.1%) | 146 (38.9%) |
| 4 Vehicles | 34 (7.5%) | 18 (4.8%) |
| 5 or more Vehicles | 7 (1.5%) | 10 (2.7%) |
| Total | 454 (100.0%) | 375 (100.0%) |
Commute Time in Ralls
The most frequently occuring commute durations in Ralls are 35 to 39 minutes (180 commuters, 22.6%), 30 to 34 minutes (115 commuters, 14.4%), and 45 to 59 minutes (90 commuters, 11.3%).
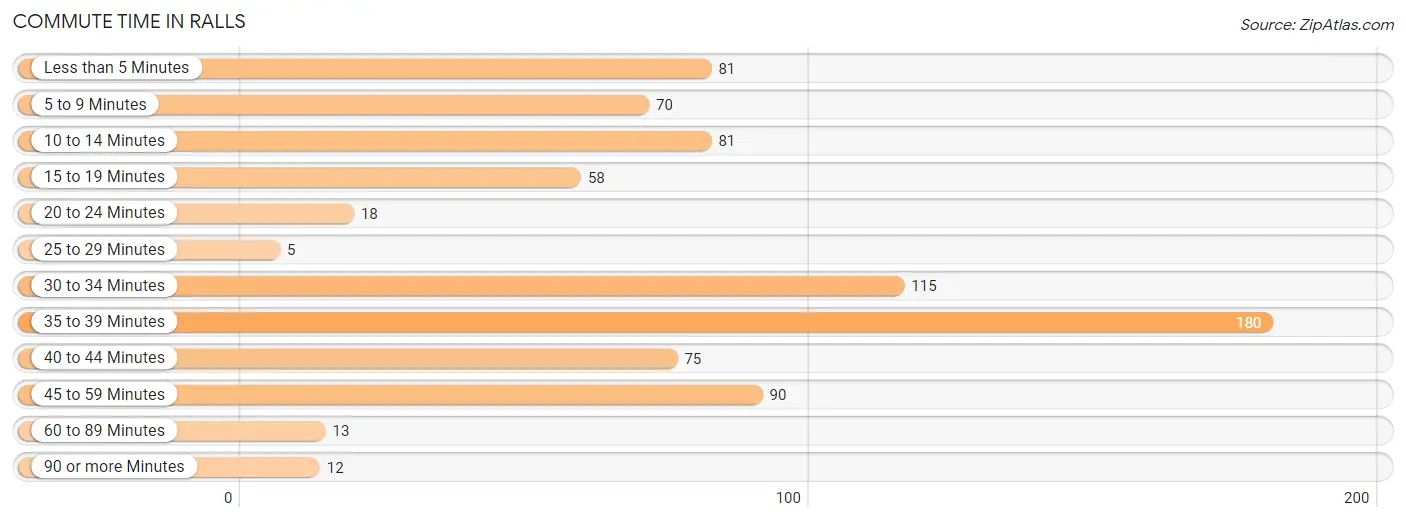
| Commute Time | # Commuters | % Commuters |
| Less than 5 Minutes | 81 | 10.2% |
| 5 to 9 Minutes | 70 | 8.8% |
| 10 to 14 Minutes | 81 | 10.2% |
| 15 to 19 Minutes | 58 | 7.3% |
| 20 to 24 Minutes | 18 | 2.3% |
| 25 to 29 Minutes | 5 | 0.6% |
| 30 to 34 Minutes | 115 | 14.4% |
| 35 to 39 Minutes | 180 | 22.6% |
| 40 to 44 Minutes | 75 | 9.4% |
| 45 to 59 Minutes | 90 | 11.3% |
| 60 to 89 Minutes | 13 | 1.6% |
| 90 or more Minutes | 12 | 1.5% |
Commute Time by Sex in Ralls
The most common commute times in Ralls are 35 to 39 minutes (96 commuters, 21.1%) for males and 35 to 39 minutes (84 commuters, 24.4%) for females.
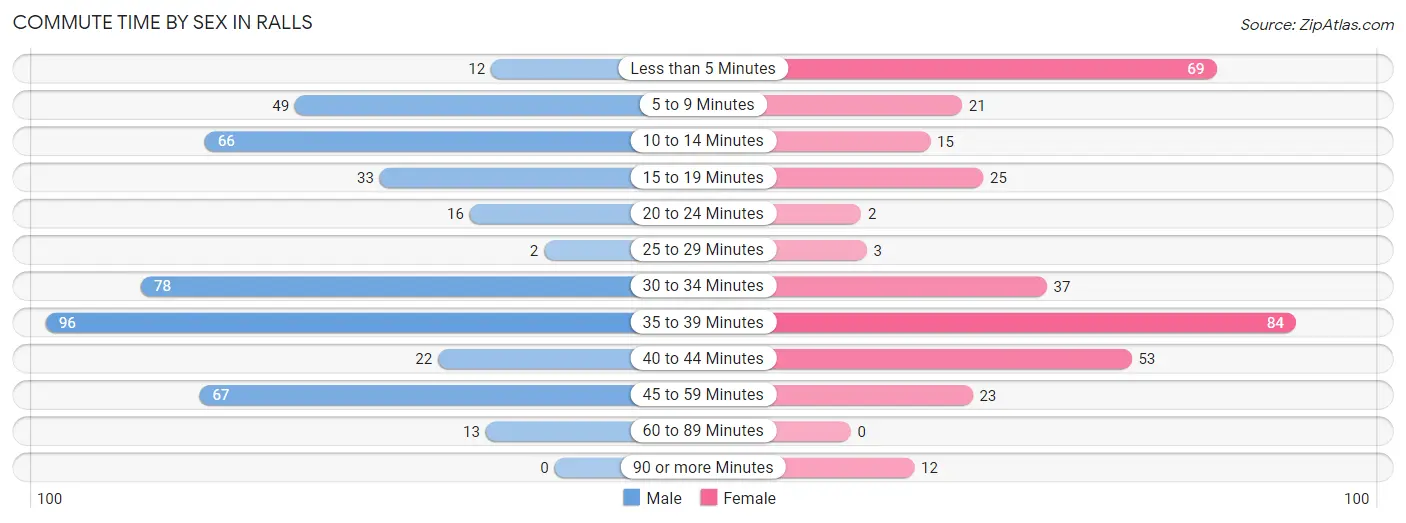
| Commute Time | Male | Female |
| Less than 5 Minutes | 12 (2.6%) | 69 (20.1%) |
| 5 to 9 Minutes | 49 (10.8%) | 21 (6.1%) |
| 10 to 14 Minutes | 66 (14.5%) | 15 (4.4%) |
| 15 to 19 Minutes | 33 (7.3%) | 25 (7.3%) |
| 20 to 24 Minutes | 16 (3.5%) | 2 (0.6%) |
| 25 to 29 Minutes | 2 (0.4%) | 3 (0.9%) |
| 30 to 34 Minutes | 78 (17.2%) | 37 (10.8%) |
| 35 to 39 Minutes | 96 (21.1%) | 84 (24.4%) |
| 40 to 44 Minutes | 22 (4.9%) | 53 (15.4%) |
| 45 to 59 Minutes | 67 (14.8%) | 23 (6.7%) |
| 60 to 89 Minutes | 13 (2.9%) | 0 (0.0%) |
| 90 or more Minutes | 0 (0.0%) | 12 (3.5%) |
Time of Departure to Work by Sex in Ralls
The most frequent times of departure to work in Ralls are 7:30 AM to 7:59 AM (111, 24.4%) for males and 7:00 AM to 7:29 AM (139, 40.4%) for females.
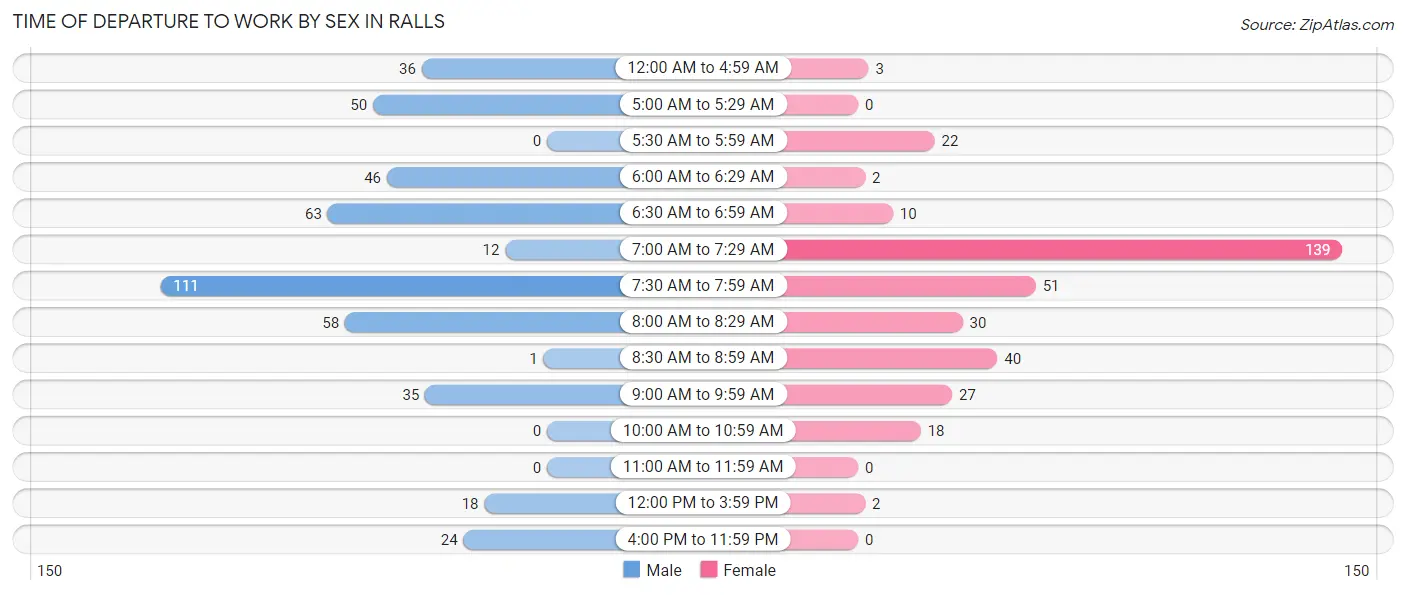
| Time of Departure | Male | Female |
| 12:00 AM to 4:59 AM | 36 (7.9%) | 3 (0.9%) |
| 5:00 AM to 5:29 AM | 50 (11.0%) | 0 (0.0%) |
| 5:30 AM to 5:59 AM | 0 (0.0%) | 22 (6.4%) |
| 6:00 AM to 6:29 AM | 46 (10.1%) | 2 (0.6%) |
| 6:30 AM to 6:59 AM | 63 (13.9%) | 10 (2.9%) |
| 7:00 AM to 7:29 AM | 12 (2.6%) | 139 (40.4%) |
| 7:30 AM to 7:59 AM | 111 (24.4%) | 51 (14.8%) |
| 8:00 AM to 8:29 AM | 58 (12.8%) | 30 (8.7%) |
| 8:30 AM to 8:59 AM | 1 (0.2%) | 40 (11.6%) |
| 9:00 AM to 9:59 AM | 35 (7.7%) | 27 (7.9%) |
| 10:00 AM to 10:59 AM | 0 (0.0%) | 18 (5.2%) |
| 11:00 AM to 11:59 AM | 0 (0.0%) | 0 (0.0%) |
| 12:00 PM to 3:59 PM | 18 (4.0%) | 2 (0.6%) |
| 4:00 PM to 11:59 PM | 24 (5.3%) | 0 (0.0%) |
| Total | 454 (100.0%) | 344 (100.0%) |
Housing Occupancy in Ralls
Occupancy by Ownership in Ralls
Of the total 677 dwellings in Ralls, owner-occupied units account for 459 (67.8%), while renter-occupied units make up 218 (32.2%).
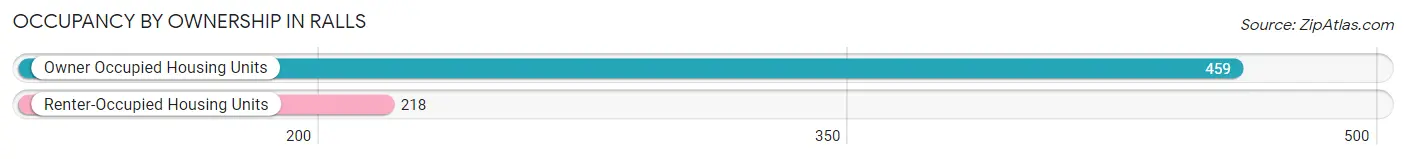
| Occupancy | # Housing Units | % Housing Units |
| Owner Occupied Housing Units | 459 | 67.8% |
| Renter-Occupied Housing Units | 218 | 32.2% |
| Total Occupied Housing Units | 677 | 100.0% |
Occupancy by Household Size in Ralls
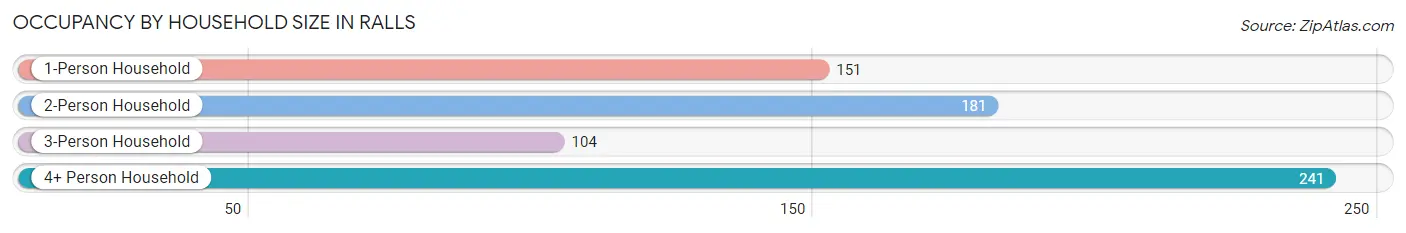
| Household Size | # Housing Units | % Housing Units |
| 1-Person Household | 151 | 22.3% |
| 2-Person Household | 181 | 26.7% |
| 3-Person Household | 104 | 15.4% |
| 4+ Person Household | 241 | 35.6% |
| Total Housing Units | 677 | 100.0% |
Occupancy by Ownership by Household Size in Ralls
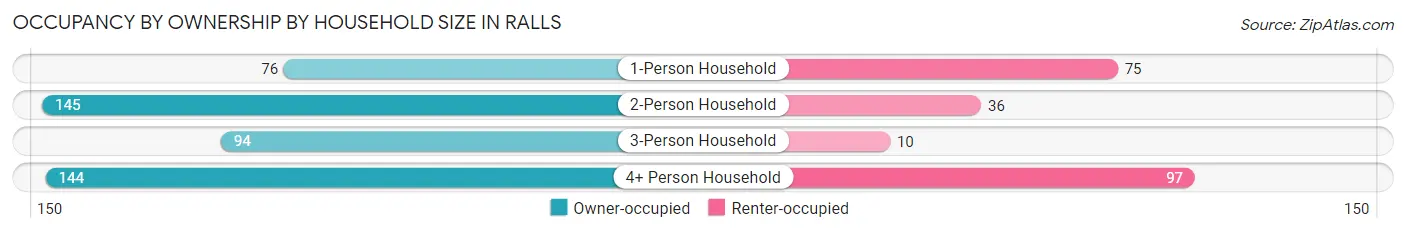
| Household Size | Owner-occupied | Renter-occupied |
| 1-Person Household | 76 (50.3%) | 75 (49.7%) |
| 2-Person Household | 145 (80.1%) | 36 (19.9%) |
| 3-Person Household | 94 (90.4%) | 10 (9.6%) |
| 4+ Person Household | 144 (59.8%) | 97 (40.3%) |
| Total Housing Units | 459 (67.8%) | 218 (32.2%) |
Occupancy by Educational Attainment in Ralls
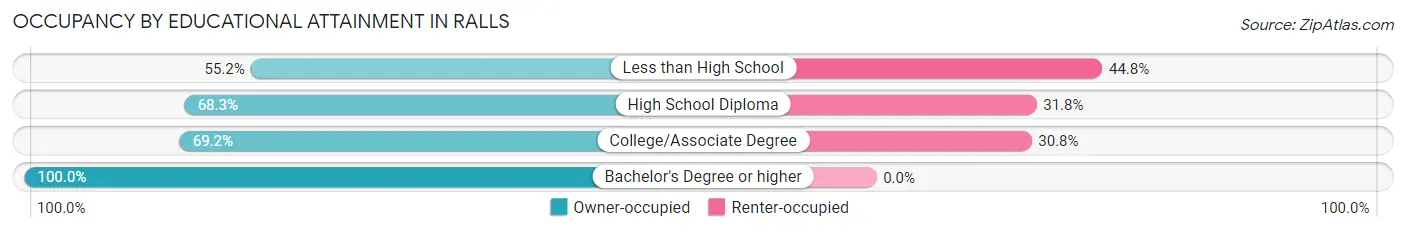
| Household Size | Owner-occupied | Renter-occupied |
| Less than High School | 106 (55.2%) | 86 (44.8%) |
| High School Diploma | 129 (68.2%) | 60 (31.8%) |
| College/Associate Degree | 162 (69.2%) | 72 (30.8%) |
| Bachelor's Degree or higher | 62 (100.0%) | 0 (0.0%) |
Occupancy by Age of Householder in Ralls
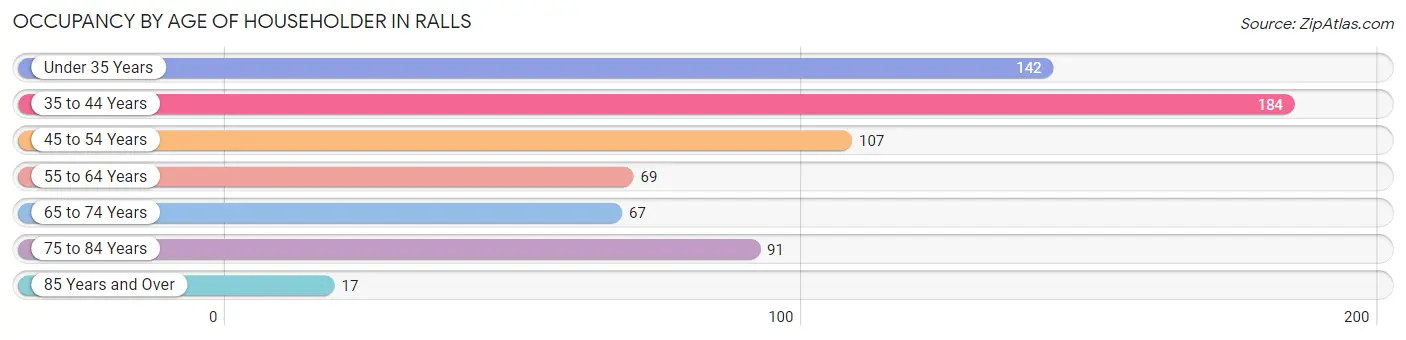
| Age Bracket | # Households | % Households |
| Under 35 Years | 142 | 21.0% |
| 35 to 44 Years | 184 | 27.2% |
| 45 to 54 Years | 107 | 15.8% |
| 55 to 64 Years | 69 | 10.2% |
| 65 to 74 Years | 67 | 9.9% |
| 75 to 84 Years | 91 | 13.4% |
| 85 Years and Over | 17 | 2.5% |
| Total | 677 | 100.0% |
Housing Finances in Ralls
Median Income by Occupancy in Ralls
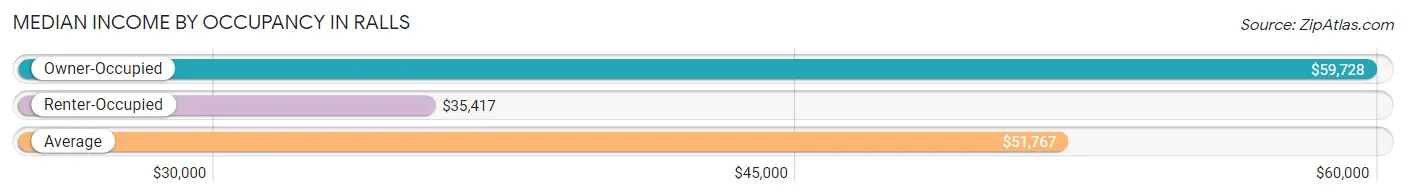
| Occupancy Type | # Households | Median Income |
| Owner-Occupied | 459 (67.8%) | $59,728 |
| Renter-Occupied | 218 (32.2%) | $35,417 |
| Average | 677 (100.0%) | $51,767 |
Occupancy by Householder Income Bracket in Ralls
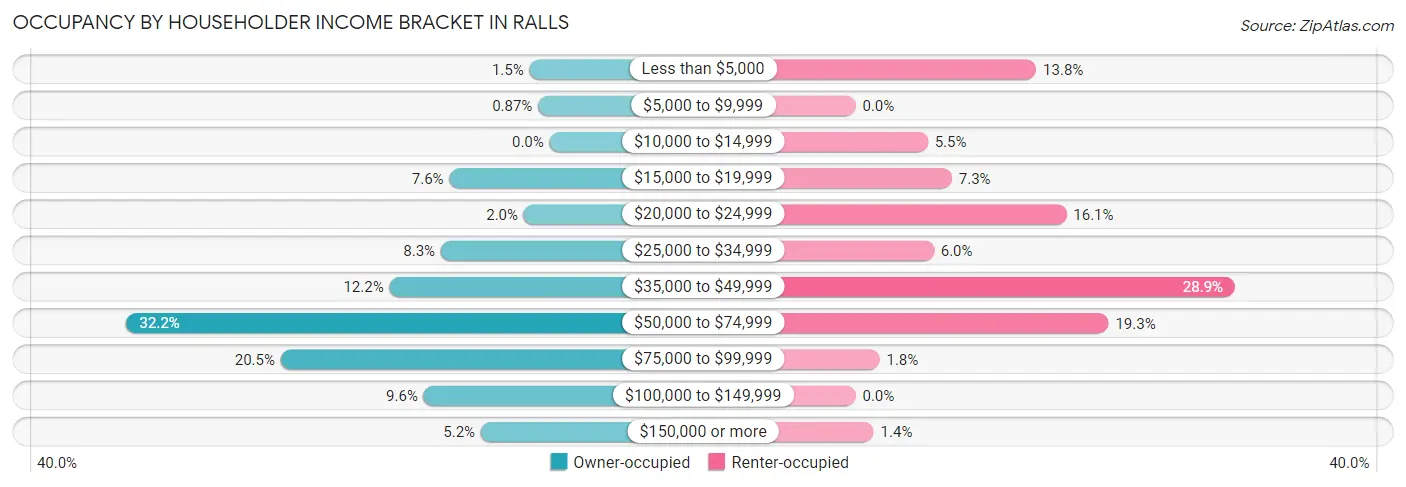
| Income Bracket | Owner-occupied | Renter-occupied |
| Less than $5,000 | 7 (1.5%) | 30 (13.8%) |
| $5,000 to $9,999 | 4 (0.9%) | 0 (0.0%) |
| $10,000 to $14,999 | 0 (0.0%) | 12 (5.5%) |
| $15,000 to $19,999 | 35 (7.6%) | 16 (7.3%) |
| $20,000 to $24,999 | 9 (2.0%) | 35 (16.1%) |
| $25,000 to $34,999 | 38 (8.3%) | 13 (6.0%) |
| $35,000 to $49,999 | 56 (12.2%) | 63 (28.9%) |
| $50,000 to $74,999 | 148 (32.2%) | 42 (19.3%) |
| $75,000 to $99,999 | 94 (20.5%) | 4 (1.8%) |
| $100,000 to $149,999 | 44 (9.6%) | 0 (0.0%) |
| $150,000 or more | 24 (5.2%) | 3 (1.4%) |
| Total | 459 (100.0%) | 218 (100.0%) |
Monthly Housing Cost Tiers in Ralls
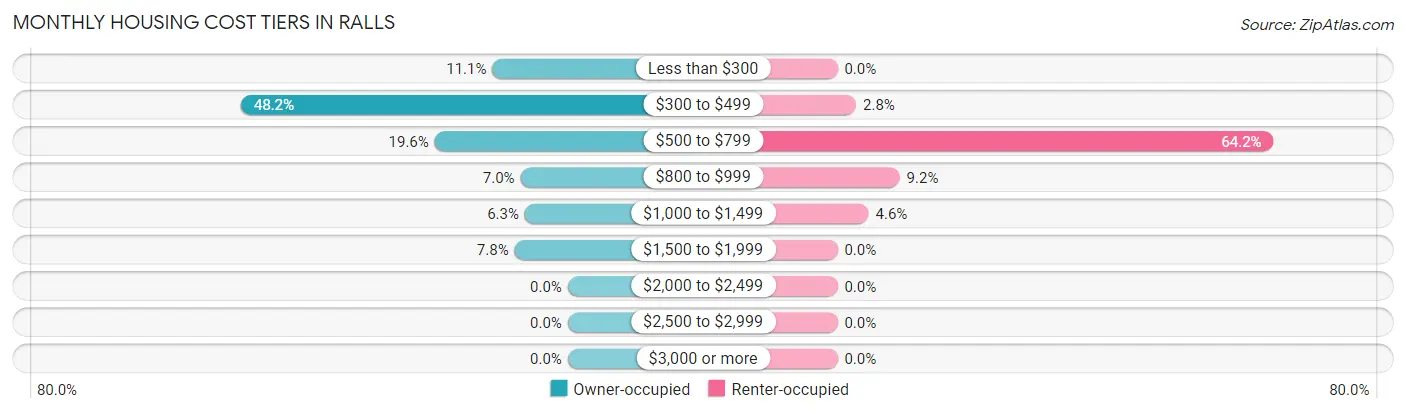
| Monthly Cost | Owner-occupied | Renter-occupied |
| Less than $300 | 51 (11.1%) | 0 (0.0%) |
| $300 to $499 | 221 (48.1%) | 6 (2.8%) |
| $500 to $799 | 90 (19.6%) | 140 (64.2%) |
| $800 to $999 | 32 (7.0%) | 20 (9.2%) |
| $1,000 to $1,499 | 29 (6.3%) | 10 (4.6%) |
| $1,500 to $1,999 | 36 (7.8%) | 0 (0.0%) |
| $2,000 to $2,499 | 0 (0.0%) | 0 (0.0%) |
| $2,500 to $2,999 | 0 (0.0%) | 0 (0.0%) |
| $3,000 or more | 0 (0.0%) | 0 (0.0%) |
| Total | 459 (100.0%) | 218 (100.0%) |
Physical Housing Characteristics in Ralls
Housing Structures in Ralls
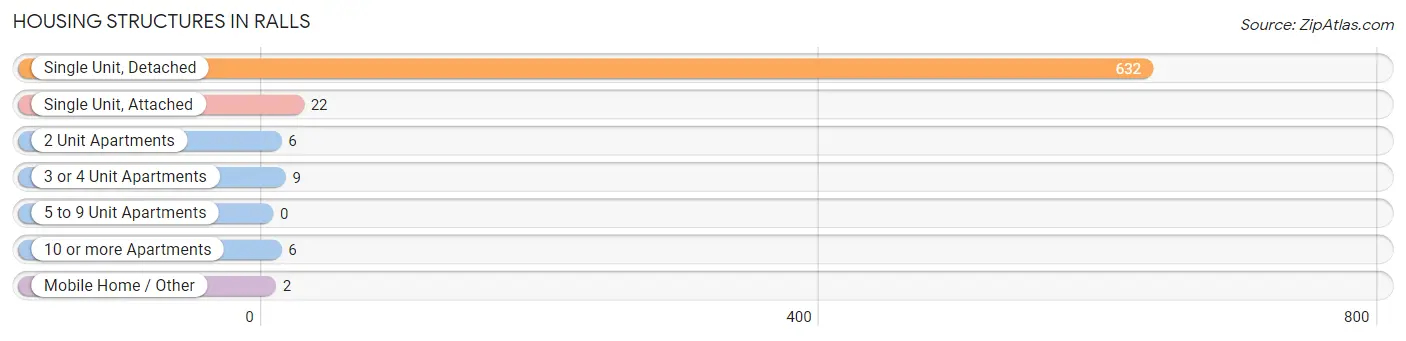
| Structure Type | # Housing Units | % Housing Units |
| Single Unit, Detached | 632 | 93.3% |
| Single Unit, Attached | 22 | 3.3% |
| 2 Unit Apartments | 6 | 0.9% |
| 3 or 4 Unit Apartments | 9 | 1.3% |
| 5 to 9 Unit Apartments | 0 | 0.0% |
| 10 or more Apartments | 6 | 0.9% |
| Mobile Home / Other | 2 | 0.3% |
| Total | 677 | 100.0% |
Housing Structures by Occupancy in Ralls
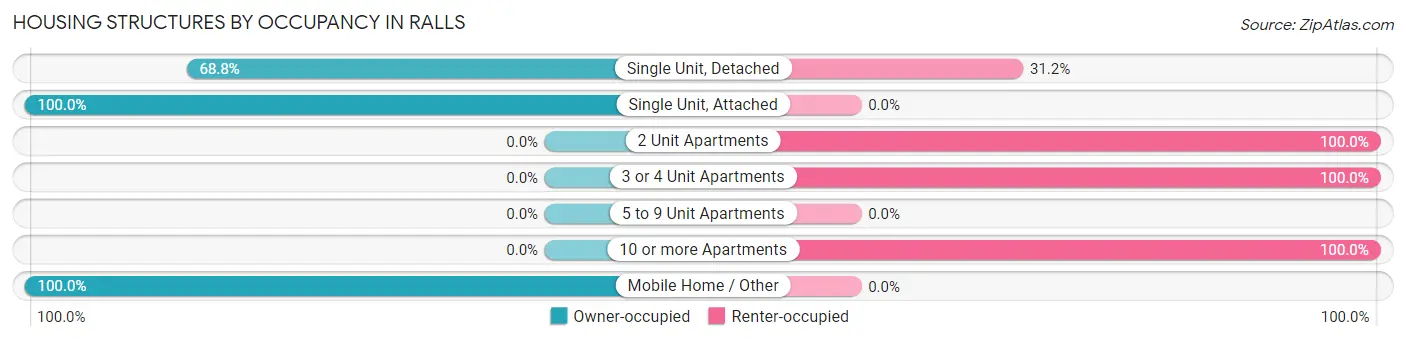
| Structure Type | Owner-occupied | Renter-occupied |
| Single Unit, Detached | 435 (68.8%) | 197 (31.2%) |
| Single Unit, Attached | 22 (100.0%) | 0 (0.0%) |
| 2 Unit Apartments | 0 (0.0%) | 6 (100.0%) |
| 3 or 4 Unit Apartments | 0 (0.0%) | 9 (100.0%) |
| 5 to 9 Unit Apartments | 0 (0.0%) | 0 (0.0%) |
| 10 or more Apartments | 0 (0.0%) | 6 (100.0%) |
| Mobile Home / Other | 2 (100.0%) | 0 (0.0%) |
| Total | 459 (67.8%) | 218 (32.2%) |
Housing Structures by Number of Rooms in Ralls
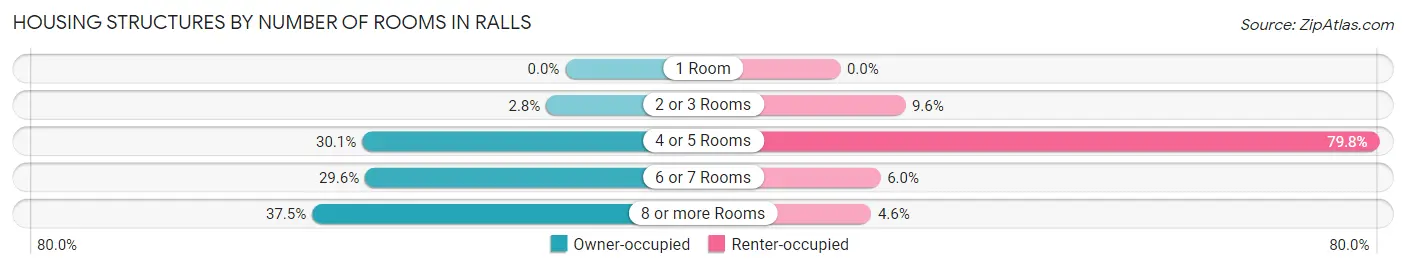
| Number of Rooms | Owner-occupied | Renter-occupied |
| 1 Room | 0 (0.0%) | 0 (0.0%) |
| 2 or 3 Rooms | 13 (2.8%) | 21 (9.6%) |
| 4 or 5 Rooms | 138 (30.1%) | 174 (79.8%) |
| 6 or 7 Rooms | 136 (29.6%) | 13 (6.0%) |
| 8 or more Rooms | 172 (37.5%) | 10 (4.6%) |
| Total | 459 (100.0%) | 218 (100.0%) |
Housing Structure by Heating Type in Ralls
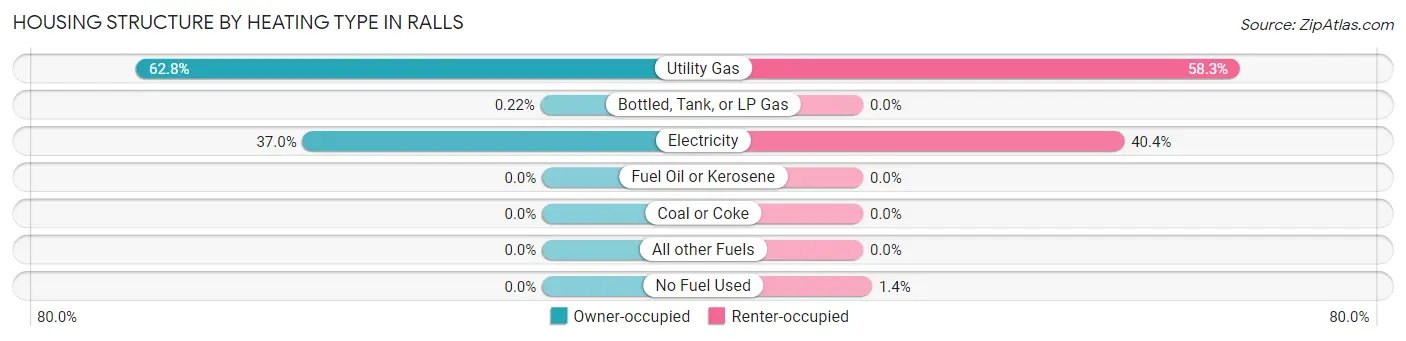
| Heating Type | Owner-occupied | Renter-occupied |
| Utility Gas | 288 (62.7%) | 127 (58.3%) |
| Bottled, Tank, or LP Gas | 1 (0.2%) | 0 (0.0%) |
| Electricity | 170 (37.0%) | 88 (40.4%) |
| Fuel Oil or Kerosene | 0 (0.0%) | 0 (0.0%) |
| Coal or Coke | 0 (0.0%) | 0 (0.0%) |
| All other Fuels | 0 (0.0%) | 0 (0.0%) |
| No Fuel Used | 0 (0.0%) | 3 (1.4%) |
| Total | 459 (100.0%) | 218 (100.0%) |
Household Vehicle Usage in Ralls
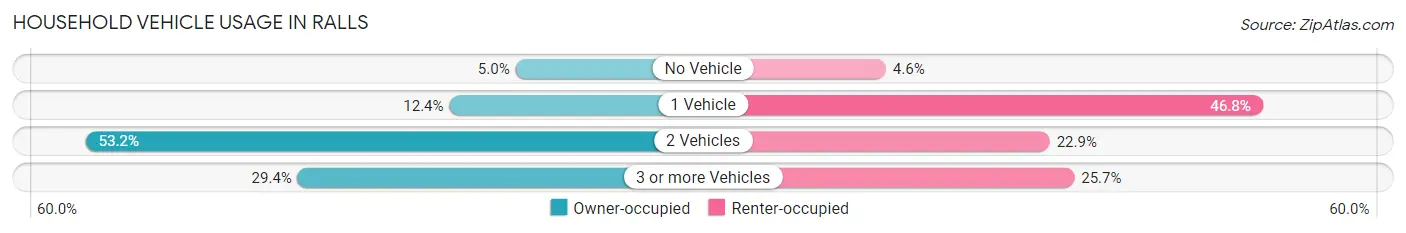
| Vehicles per Household | Owner-occupied | Renter-occupied |
| No Vehicle | 23 (5.0%) | 10 (4.6%) |
| 1 Vehicle | 57 (12.4%) | 102 (46.8%) |
| 2 Vehicles | 244 (53.2%) | 50 (22.9%) |
| 3 or more Vehicles | 135 (29.4%) | 56 (25.7%) |
| Total | 459 (100.0%) | 218 (100.0%) |
Real Estate & Mortgages in Ralls
Real Estate and Mortgage Overview in Ralls
| Characteristic | Without Mortgage | With Mortgage |
| Housing Units | 359 | 100 |
| Median Property Value | $57,500 | $70,000 |
| Median Household Income | $56,172 | $11 |
| Monthly Housing Costs | $431 | $0 |
| Real Estate Taxes | $1,233 | $0 |
Property Value by Mortgage Status in Ralls
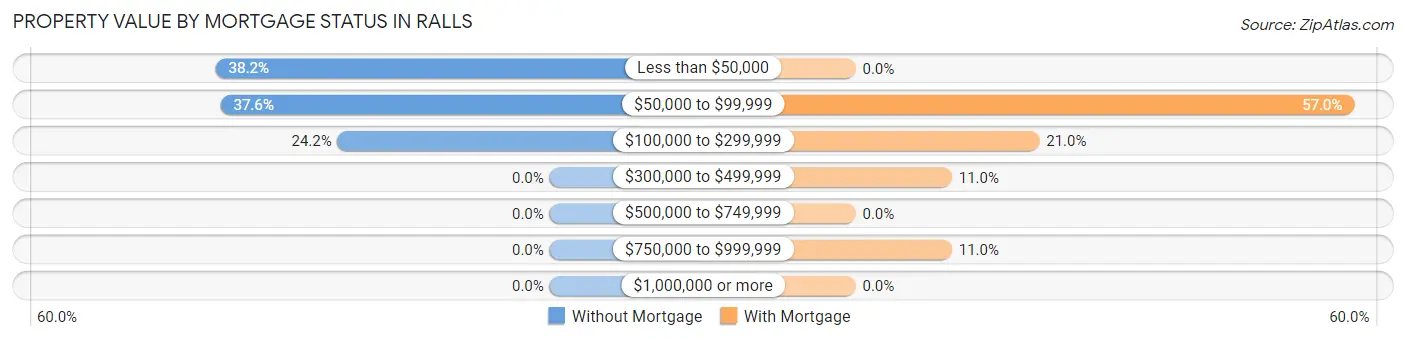
| Property Value | Without Mortgage | With Mortgage |
| Less than $50,000 | 137 (38.2%) | 0 (0.0%) |
| $50,000 to $99,999 | 135 (37.6%) | 57 (57.0%) |
| $100,000 to $299,999 | 87 (24.2%) | 21 (21.0%) |
| $300,000 to $499,999 | 0 (0.0%) | 11 (11.0%) |
| $500,000 to $749,999 | 0 (0.0%) | 0 (0.0%) |
| $750,000 to $999,999 | 0 (0.0%) | 11 (11.0%) |
| $1,000,000 or more | 0 (0.0%) | 0 (0.0%) |
| Total | 359 (100.0%) | 100 (100.0%) |
Household Income by Mortgage Status in Ralls
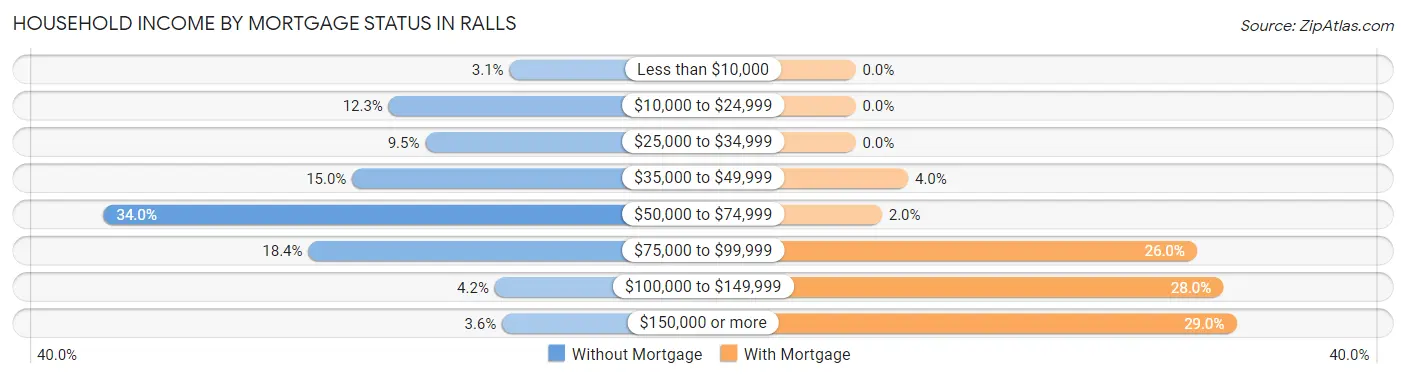
| Household Income | Without Mortgage | With Mortgage |
| Less than $10,000 | 11 (3.1%) | 0 (0.0%) |
| $10,000 to $24,999 | 44 (12.3%) | 0 (0.0%) |
| $25,000 to $34,999 | 34 (9.5%) | 0 (0.0%) |
| $35,000 to $49,999 | 54 (15.0%) | 4 (4.0%) |
| $50,000 to $74,999 | 122 (34.0%) | 2 (2.0%) |
| $75,000 to $99,999 | 66 (18.4%) | 26 (26.0%) |
| $100,000 to $149,999 | 15 (4.2%) | 28 (28.0%) |
| $150,000 or more | 13 (3.6%) | 29 (29.0%) |
| Total | 359 (100.0%) | 100 (100.0%) |
Property Value to Household Income Ratio in Ralls
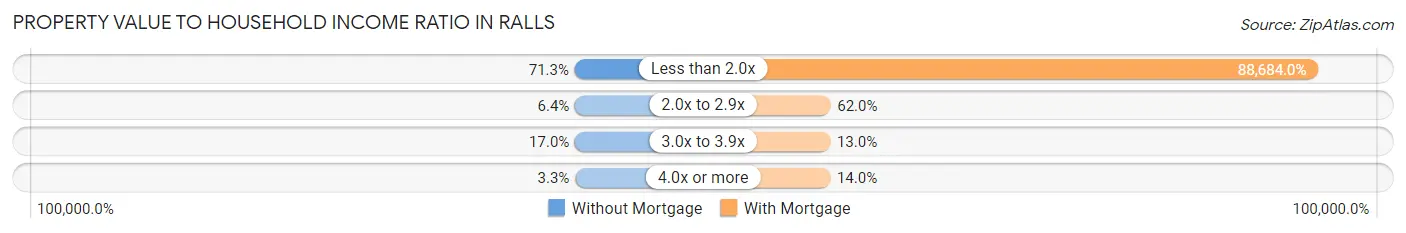
| Value-to-Income Ratio | Without Mortgage | With Mortgage |
| Less than 2.0x | 256 (71.3%) | 88,684 (88,684.0%) |
| 2.0x to 2.9x | 23 (6.4%) | 62 (62.0%) |
| 3.0x to 3.9x | 61 (17.0%) | 13 (13.0%) |
| 4.0x or more | 12 (3.3%) | 14 (14.0%) |
| Total | 359 (100.0%) | 100 (100.0%) |
Real Estate Taxes by Mortgage Status in Ralls
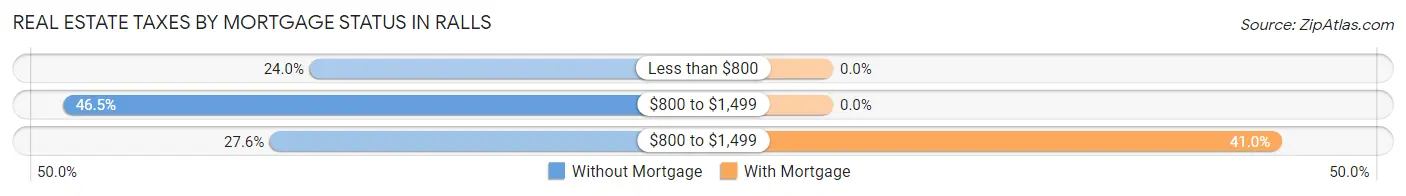
| Property Taxes | Without Mortgage | With Mortgage |
| Less than $800 | 86 (24.0%) | 0 (0.0%) |
| $800 to $1,499 | 167 (46.5%) | 0 (0.0%) |
| $800 to $1,499 | 99 (27.6%) | 41 (41.0%) |
| Total | 359 (100.0%) | 100 (100.0%) |
Health & Disability in Ralls
Health Insurance Coverage by Age in Ralls
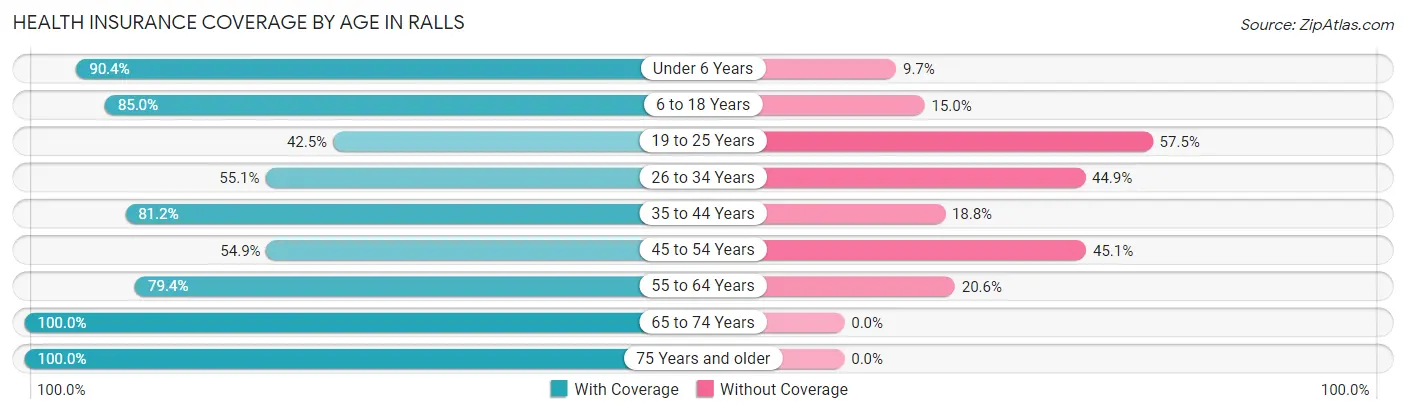
| Age Bracket | With Coverage | Without Coverage |
| Under 6 Years | 103 (90.3%) | 11 (9.7%) |
| 6 to 18 Years | 284 (85.0%) | 50 (15.0%) |
| 19 to 25 Years | 51 (42.5%) | 69 (57.5%) |
| 26 to 34 Years | 81 (55.1%) | 66 (44.9%) |
| 35 to 44 Years | 251 (81.2%) | 58 (18.8%) |
| 45 to 54 Years | 95 (54.9%) | 78 (45.1%) |
| 55 to 64 Years | 104 (79.4%) | 27 (20.6%) |
| 65 to 74 Years | 111 (100.0%) | 0 (0.0%) |
| 75 Years and older | 160 (100.0%) | 0 (0.0%) |
| Total | 1,240 (77.5%) | 359 (22.5%) |
Health Insurance Coverage by Citizenship Status in Ralls
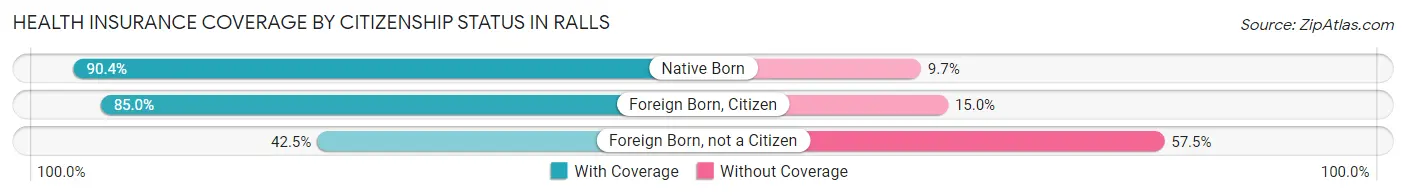
| Citizenship Status | With Coverage | Without Coverage |
| Native Born | 103 (90.3%) | 11 (9.7%) |
| Foreign Born, Citizen | 284 (85.0%) | 50 (15.0%) |
| Foreign Born, not a Citizen | 51 (42.5%) | 69 (57.5%) |
Health Insurance Coverage by Household Income in Ralls
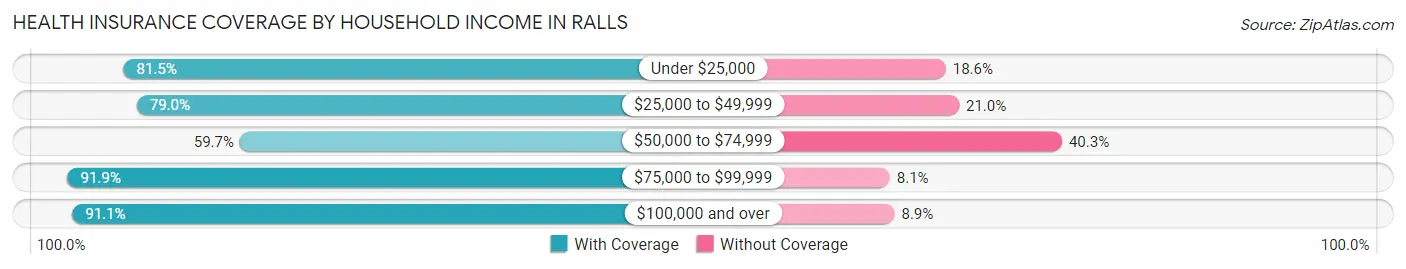
| Household Income | With Coverage | Without Coverage |
| Under $25,000 | 259 (81.5%) | 59 (18.5%) |
| $25,000 to $49,999 | 214 (79.0%) | 57 (21.0%) |
| $50,000 to $74,999 | 296 (59.7%) | 200 (40.3%) |
| $75,000 to $99,999 | 308 (91.9%) | 27 (8.1%) |
| $100,000 and over | 163 (91.1%) | 16 (8.9%) |
Public vs Private Health Insurance Coverage by Age in Ralls
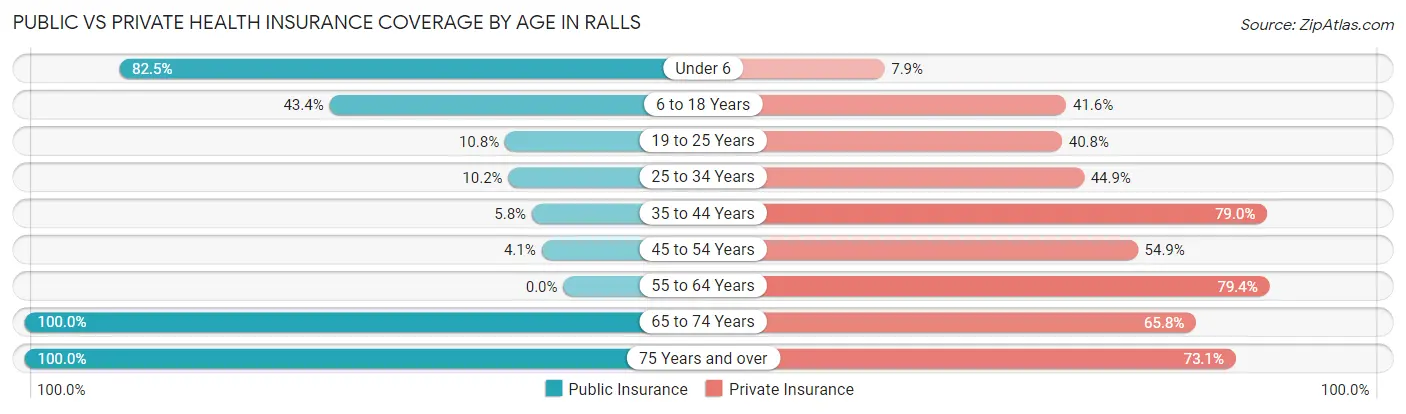
| Age Bracket | Public Insurance | Private Insurance |
| Under 6 | 94 (82.5%) | 9 (7.9%) |
| 6 to 18 Years | 145 (43.4%) | 139 (41.6%) |
| 19 to 25 Years | 13 (10.8%) | 49 (40.8%) |
| 25 to 34 Years | 15 (10.2%) | 66 (44.9%) |
| 35 to 44 Years | 18 (5.8%) | 244 (79.0%) |
| 45 to 54 Years | 7 (4.1%) | 95 (54.9%) |
| 55 to 64 Years | 0 (0.0%) | 104 (79.4%) |
| 65 to 74 Years | 111 (100.0%) | 73 (65.8%) |
| 75 Years and over | 160 (100.0%) | 117 (73.1%) |
| Total | 563 (35.2%) | 896 (56.0%) |
Disability Status by Sex by Age in Ralls
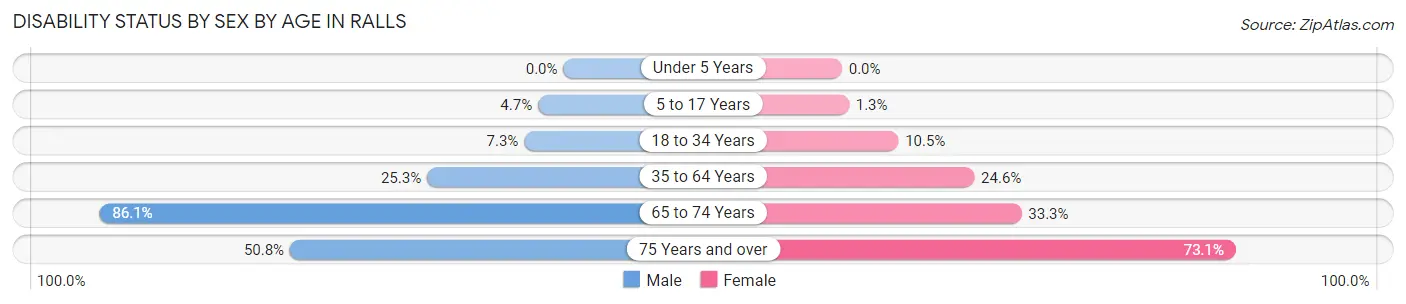
| Age Bracket | Male | Female |
| Under 5 Years | 0 (0.0%) | 0 (0.0%) |
| 5 to 17 Years | 9 (4.7%) | 2 (1.3%) |
| 18 to 34 Years | 8 (7.3%) | 18 (10.5%) |
| 35 to 64 Years | 82 (25.3%) | 71 (24.6%) |
| 65 to 74 Years | 31 (86.1%) | 25 (33.3%) |
| 75 Years and over | 34 (50.7%) | 68 (73.1%) |
Disability Class by Sex by Age in Ralls
Disability Class: Hearing Difficulty
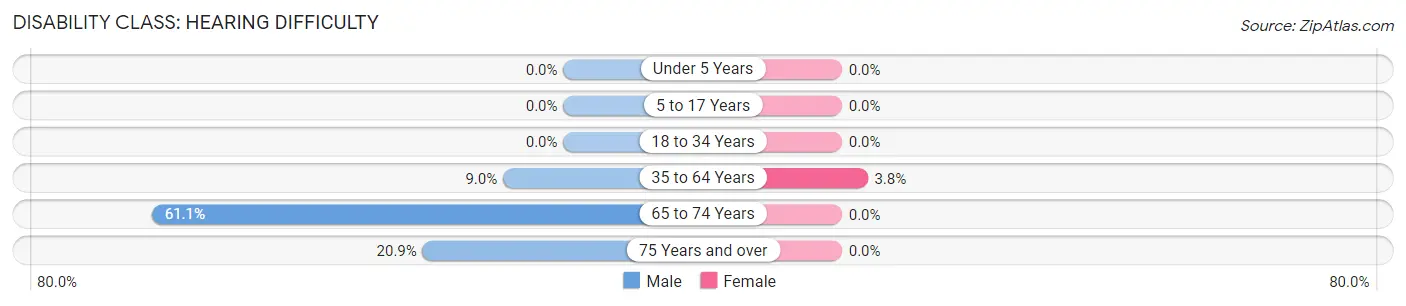
| Age Bracket | Male | Female |
| Under 5 Years | 0 (0.0%) | 0 (0.0%) |
| 5 to 17 Years | 0 (0.0%) | 0 (0.0%) |
| 18 to 34 Years | 0 (0.0%) | 0 (0.0%) |
| 35 to 64 Years | 29 (8.9%) | 11 (3.8%) |
| 65 to 74 Years | 22 (61.1%) | 0 (0.0%) |
| 75 Years and over | 14 (20.9%) | 0 (0.0%) |
Disability Class: Vision Difficulty
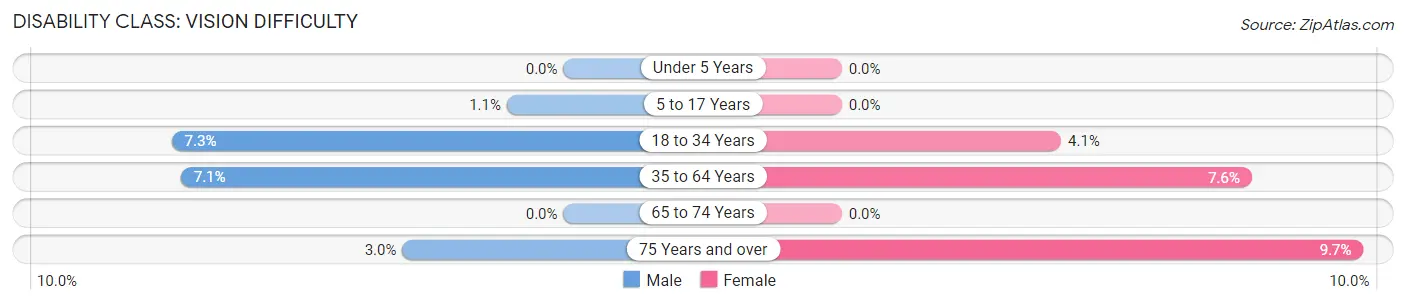
| Age Bracket | Male | Female |
| Under 5 Years | 0 (0.0%) | 0 (0.0%) |
| 5 to 17 Years | 2 (1.1%) | 0 (0.0%) |
| 18 to 34 Years | 8 (7.3%) | 7 (4.1%) |
| 35 to 64 Years | 23 (7.1%) | 22 (7.6%) |
| 65 to 74 Years | 0 (0.0%) | 0 (0.0%) |
| 75 Years and over | 2 (3.0%) | 9 (9.7%) |
Disability Class: Cognitive Difficulty
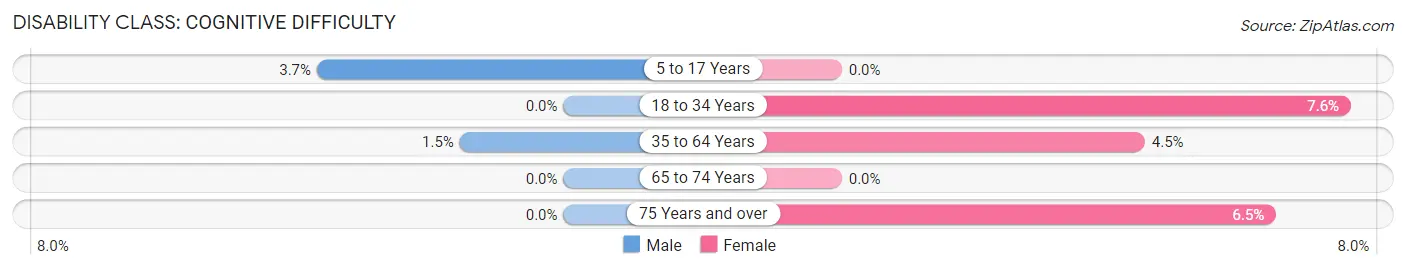
| Age Bracket | Male | Female |
| 5 to 17 Years | 7 (3.7%) | 0 (0.0%) |
| 18 to 34 Years | 0 (0.0%) | 13 (7.6%) |
| 35 to 64 Years | 5 (1.5%) | 13 (4.5%) |
| 65 to 74 Years | 0 (0.0%) | 0 (0.0%) |
| 75 Years and over | 0 (0.0%) | 6 (6.5%) |
Disability Class: Ambulatory Difficulty
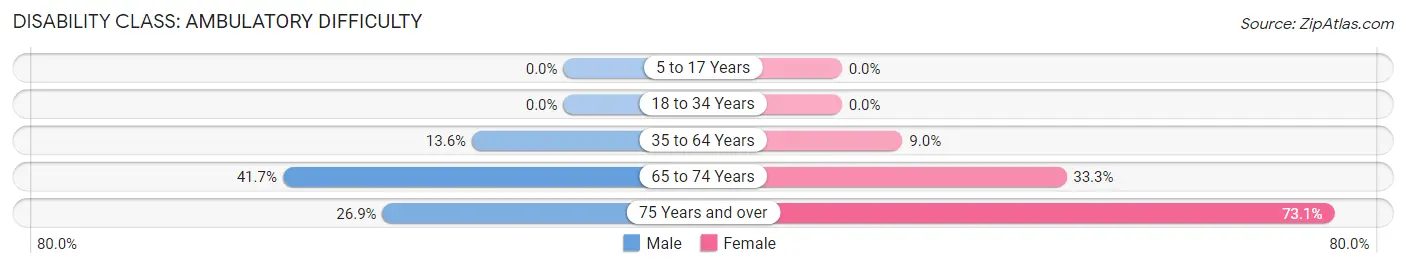
| Age Bracket | Male | Female |
| 5 to 17 Years | 0 (0.0%) | 0 (0.0%) |
| 18 to 34 Years | 0 (0.0%) | 0 (0.0%) |
| 35 to 64 Years | 44 (13.6%) | 26 (9.0%) |
| 65 to 74 Years | 15 (41.7%) | 25 (33.3%) |
| 75 Years and over | 18 (26.9%) | 68 (73.1%) |
Disability Class: Self-Care Difficulty
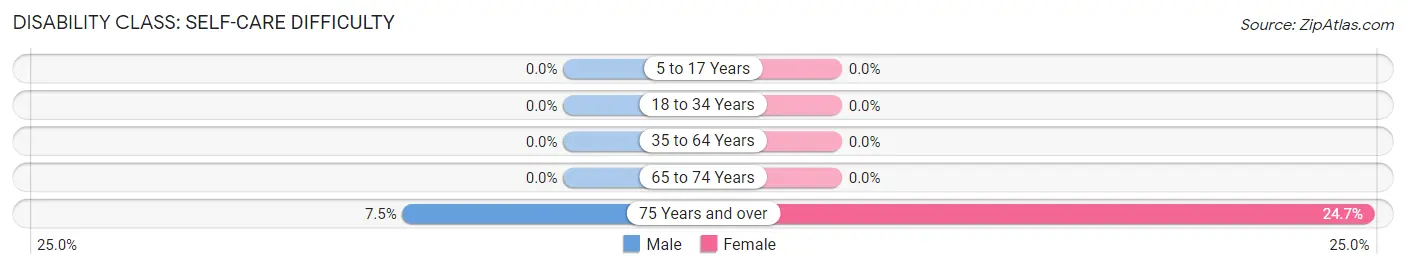
| Age Bracket | Male | Female |
| 5 to 17 Years | 0 (0.0%) | 0 (0.0%) |
| 18 to 34 Years | 0 (0.0%) | 0 (0.0%) |
| 35 to 64 Years | 0 (0.0%) | 0 (0.0%) |
| 65 to 74 Years | 0 (0.0%) | 0 (0.0%) |
| 75 Years and over | 5 (7.5%) | 23 (24.7%) |
Technology Access in Ralls
Computing Device Access in Ralls
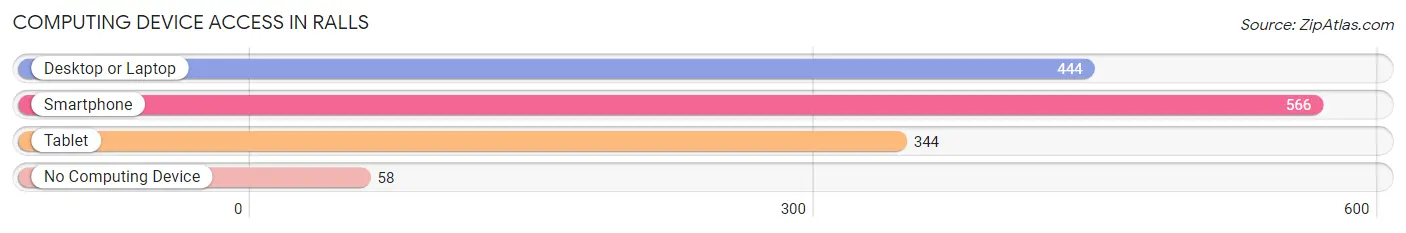
| Device Type | # Households | % Households |
| Desktop or Laptop | 444 | 65.6% |
| Smartphone | 566 | 83.6% |
| Tablet | 344 | 50.8% |
| No Computing Device | 58 | 8.6% |
| Total | 677 | 100.0% |
Internet Access in Ralls
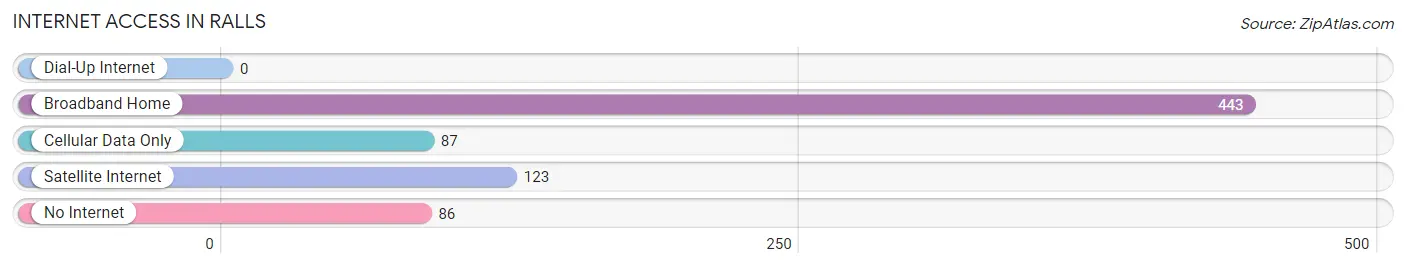
| Internet Type | # Households | % Households |
| Dial-Up Internet | 0 | 0.0% |
| Broadband Home | 443 | 65.4% |
| Cellular Data Only | 87 | 12.9% |
| Satellite Internet | 123 | 18.2% |
| No Internet | 86 | 12.7% |
| Total | 677 | 100.0% |
Ralls Summary
Ralls, Texas is a small town located in Crosby County, Texas. It is situated about 25 miles east of Lubbock and is part of the Lubbock Metropolitan Statistical Area. The population of Ralls was 1,845 at the 2010 census.
History
Ralls was founded in 1891 by the Santa Fe Railroad. The town was named after the Ralls family, who were early settlers in the area. The first post office was established in 1892.
Ralls was a farming and ranching community for many years. In the early 1900s, the town had a cotton gin, a bank, a hotel, a blacksmith shop, and several stores. The town also had a school, which was established in 1902.
In the 1950s, the town began to experience a population decline as people moved away to larger cities. The population of Ralls dropped from 1,845 in 1950 to 1,541 in 2000.
Geography
Ralls is located at 33°45'25" North, 101°37'45" West (33.756944, -101.629167). The town is situated in the High Plains region of Texas, about 25 miles east of Lubbock.
The terrain around Ralls is mostly flat, with some rolling hills. The town is located in the Llano Estacado, a large area of flat land that stretches from the Texas Panhandle to the New Mexico border.
The climate in Ralls is semi-arid, with hot summers and mild winters. The average annual temperature is 64°F (18°C). The average annual precipitation is 17.5 inches (44.5 cm).
Economy
The economy of Ralls is largely based on agriculture. The town is home to several farms and ranches, which produce cotton, wheat, corn, and other crops.
The town also has several businesses, including a grocery store, a hardware store, a restaurant, and a gas station.
Demographics
As of the 2010 census, the population of Ralls was 1,845. The racial makeup of the town was 79.2% White, 0.2% African American, 0.2% Native American, 0.2% Asian, 0.1% Pacific Islander, 18.7% from other races, and 1.2% from two or more races. Hispanic or Latino of any race were 33.2% of the population.
The median household income in Ralls was $31,250, and the median family income was $35,417. The per capita income was $14,945. About 18.2% of families and 22.2% of the population were below the poverty line, including 28.3% of those under age 18 and 16.7% of those age 65 or over.
Common Questions
What is Per Capita Income in Ralls?
Per Capita income in Ralls is $23,271.
What is the Median Family Income in Ralls?
Median Family Income in Ralls is $65,273.
What is the Median Household income in Ralls?
Median Household Income in Ralls is $51,767.
What is Income or Wage Gap in Ralls?
Income or Wage Gap in Ralls is 46.0%.
Women in Ralls earn 54.0 cents for every dollar earned by a man.
What is Inequality or Gini Index in Ralls?
Inequality or Gini Index in Ralls is 0.37.
What is the Total Population of Ralls?
Total Population of Ralls is 1,634.
What is the Total Male Population of Ralls?
Total Male Population of Ralls is 791.
What is the Total Female Population of Ralls?
Total Female Population of Ralls is 843.
What is the Ratio of Males per 100 Females in Ralls?
There are 93.83 Males per 100 Females in Ralls.
What is the Ratio of Females per 100 Males in Ralls?
There are 106.57 Females per 100 Males in Ralls.
What is the Median Population Age in Ralls?
Median Population Age in Ralls is 40.9 Years.
What is the Average Family Size in Ralls
Average Family Size in Ralls is 2.8 People.
What is the Average Household Size in Ralls
Average Household Size in Ralls is 2.4 People.
How Large is the Labor Force in Ralls?
There are 892 People in the Labor Forcein in Ralls.
What is the Percentage of People in the Labor Force in Ralls?
70.0% of People are in the Labor Force in Ralls.
What is the Unemployment Rate in Ralls?
Unemployment Rate in Ralls is 5.3%.